Article

Energy Production Through Anaerobic Digestion of Typical Biodegradable Residues: LCA Comparison to Composting and Incineration in a Small and Larger Country


1
LCA/EPD Services Group, Holcim Innovation Center, 95 Rue du Montmurier, 38290 Saint-Quentin-Fallavier, France
2
Sinochem Environment Science & Technology Engineering Co., Ltd., Shenyang 110032, China
3
State Key Laboratory of Regional Environment and Sustainability, Research Center for Eco-Environmental Sciences, Chinese Academy of Sciences, Beijing 100085, China
4
Department of Civil Engineering, University of Patras, 26504 Patras, Greece
*
Author to whom correspondence should be addressed.
These authors contributed equally to this work.
Resources 2026, 15(6), 78; https://doi.org/10.3390/resources15060078
Submission received: 7 April 2026 / Revised: 14 May 2026 / Accepted: 27 May 2026 / Published: 12 June 2026

Highlights

What are the main findings of your research?
  • The current research provides an extended LCA study for alternative ways of managing sheep and goat manure and food waste (FW).
  • Anaerobic digestion (AD) of sheep and goat manure averts almost 0.016 Pt while composting averts 0.0057 Pt, with 1 Pt corresponding to the burden caused by the average European per year.
What are the key implications or practical applications of these findings?
  • AD presents a more positive impact compared to composting and incineration.
  • The application of sustainable technologies mitigates the environmental impacts.

Abstract

The main sources of biodegradable waste come from agriculture and municipal waste, with animal manure and food waste (FW) being the most representative respectively. Most of this waste remains still unexploited, while there is skepticism regarding the environmental footprint of various methods of their utilization. This work provides a reliable comparative environmental evaluation using life cycle assessment (LCA). In the present work, LCA applied to compare two alternative scenarios regarding the management of (a) sheep and goat manure and (b) FW. Alternative scenarios for sheep and goat manure include composting for fertilizer and energy production via anaerobic digestion (AD), while FW scenarios include incineration and energy production through AD. In both case studies, the AD scenario generates environmental benefits (expressed as negative damage) across all three damage categories namely resource scarcity, human health and ecosystem quality. Regarding sheep and goat manure, the most significant effect of AD is on human health (−0.016 Pt) while in the scenarios of FW the superior performance of AD is particularly evident in the ecosystem quality (−0.21 Pt). Both case studies reached the same conclusion pointing out that the use of sustainable technologies for managing agricultural and municipal waste mitigates the environmental impacts.

1. Introduction

Nowadays, intensive livestock farming has been increasingly developed in order to satisfy the overwhelming demand for meat and dairy products [1]. According to the Food and Agriculture Organization of the United Nations, in 2017 the worldwide livestock population was approximately 22.8 billion chickens, 967 million pigs, 1 billion goats, 1.2 billion sheep, 1.5 billion cattle and 201 million buffaloes [2]. Annually, farms inevitably contribute to a significant amount of manure [1]. Thus, the livestock sector has an essential influence on air quality, global climate, soil quality, biodiversity and water quality by altering the biogeochemical cycles of nitrogen, phosphorus and carbon, giving rise to environmental concerns [2].
In Greece, animals produce a substantial amount of waste due to the high animal breeding activity [3], which approximately amounts to 26 Mt/y [4]. The country’s livestock system includes sheep, goats, cows and calves, swine, and pullets breeding. Poultry farming, sheep, and goats breeding account for the largest percentage of livestock industry that were raised from 2000 until 2018. Nevertheless, sheep and goat breeding are extensive and thus the produced manure is spread all over the grazing land [3], accounting for 16,120,718 t/y [4].
The exploitation of manure currently performed by the farm owners, is primarily used for sale as fertilizer or simply applying it to agricultural and/or arable land. Meanwhile, in a few rural areas, animal manure is still combusted for heat generation. Both practices cause serious environmental deterioration. Therefore, immediate implementation of environmentally friendly waste management practices is considered highly important [4,5].
Another category of waste that is accumulated in massive amounts is the municipal solid waste (MSW). With global population growth and accelerated urbanization, the generation of MSW in countries worldwide continues to increase [6]. According to the World Bank’s statistical report [7,8], the global MSW production reached 2.01 billion tons in 2018. If no action is taken, it is predicted to increase by 70% to 3.4 billion tons by 2050. As one of the populous countries, China ranks among the top nations in annual solid waste generation, with organic solid waste accounting for over 60% of the total [9]. Improper disposal of organic waste not only occupies land resources but also causes environmental pollution and resource depletion, severely hindering urban socio-economic sustainability [10].
The current shortage of fossil fuels and growing concerns about global warming have driven significant advancements in renewable biofuel applications worldwide. First-generation biofuels (e.g., biodiesel, bioethanol, and biogas derived from food crops) have been criticized for threatening biodiversity and competing with food industries [11]. To address these limitations, second-generation biofuels utilize abundant non-food biomass as feedstock. Among various types of MSW, food waste (FW) has attracted people’s attention due to its stable large-scale production throughout the year [12]. However, the composition of FW is complex, with high levels of moisture and organic matter. It is worth exploring how to improve the degree of resource utilization of FW in an appropriate way.
In the last few decades, the recycling of agricultural and food residues for producing biogas and biofertilizers is a research topic that has gained researchers’ interests. Biogas technology is based on the anaerobic digestion (AD) of biomass [13]. AD is a common treatment of animal manures and food waste that allows: (a) bio-energy generation, (b) production of nutrient rich soil amendment and (c) reduced emissions of GHG and odor control [2]. As sheep and goats produce significant amount of manure in Greece, the use of sheep and goat manure as feedstock for energy production through AD can be considered as a useful alternative to its conventional disposal in the fields. It is worth noting that sheep and goats, despite living in sheltered locations, discard their residues in other areas and therefore the collection of manure is difficult. Given the high biodegradability and moisture content of FW, AD has emerged as the predominant technology for its valorization [14]. Conventional solid waste treatment methods are being gradually phased out due to issues of secondary pollution and low resource recovery rates. However, currently, it still accounts for a certain proportion of solid waste treatment, with incineration being the most prominent. According to the China Statistical Yearbook 2023, the MSW collection volume reached 244.447 million tons in 2022, with 195.021 million tons (79%) treated through incineration. Notably, FW constitutes over 50% of MSW in China, and co-incineration of FW with other municipal waste remains the primary treatment approach adopted by waste-to-energy plants nationwide.
Life cycle assessment (LCA) is a systematic method for evaluating inputs, outputs, and potential environmental impacts across a product’s life cycle [15]. Widely used to assess the environmental footprint of products, processes, or technologies, LCA serves as the standard approach for determining ecological sustainability [16,17]. Recently, the concerns over environmental pollution, energy scarcity, and material shortages have accelerated the development of life-cycle-oriented environmental analysis methods.
Previous LCA studies have evaluated several organic-waste treatment routes, including composting, AD, incineration, and emerging composting systems. For example, Arshad et al. [18] assessed black soldier fly larvae-based composting of kitchen waste using LCA and machine learning, highlighting the influence of process parameters and feedstock characteristics on composting performance. Other studies have examined FW AD and incineration in China, where the high moisture content and organic fraction of FW strongly influence treatment performance [7,19].
Therefore, in the present work, LCA applied to compare alternative management scenarios for two biodegradable waste streams: sheep and goat manure and FW. Concerning sheep and goat manure, composting for fertilizer use was compared with energy production through AD. For FW, incineration/co-incineration with MSW was compared with energy production through AD. The novelty of this study is not a direct quantitative comparison between countries, but an assessment of whether AD remains environmentally competitive when benchmarked against locally relevant conventional management alternatives for two representative biodegradable residues. The case studies are independent, and their absolute impact values are interpreted within each case only. Establishing robust and generalized environmental conclusions regarding the exploitation of agricultural residues is particularly important, despite differences in methodological approaches, operational conditions, and geographical contexts.

2. LCA Methodology

The environmental analysis of the management alternatives of sheep and goat manure and FW was carried out by using LCA methodology. LCA is used as a tool for the assessment of the environmental impacts and the requirements for energy throughout its life cycle, right from the extraction of raw material to the final product [13]. It is the most developed approach for environmental comparison of alternative technologies following ISO standards [20]. The process of LCA comprises 4 stages: (a) goal and scope, (b) life cycle inventory (LCI), (c) impact and improvement assessment, and (d) interpretation [21].
The two case studies were modeled independently and should not be interpreted as a direct quantitative comparison between Greece and China. They differ in geographical context, software tools, background data, system boundaries, and normalization references. Therefore, comparisons are made only within each case study, while cross-case interpretation is restricted to qualitative synthesis of common trends and drivers.

2.1. Case Study 1: Composting Versus AD of Sheep and Goat Manure

2.1.1. Goal and Scope Definition

The main objective of this study is the holistic environmental assessment of sheep and goat manure management under two scenarios: the composting of sheep and goat manure to be used as fertilizer and its use for energy production through AD. The aforementioned scenarios consider the whole system required to manage sheep and goat manure from its production until its end-use.
The functional unit (FU) is used as a basis for comparison and then all inputs and outputs in the inventory phase are referred to it [22]. The FU used in this study was 1000 kg fresh matter of sheep and goat manure.

2.1.2. Methodology

The data that was used for the LCA analysis was derived from the Ecoinvent 3.8 database [23] and from the literature. The LCA was performed using SimaPro software. This software is used for data aggregation, LCI, impact assessment and sensitivity analysis of the results. It enables the manipulation and examination of inventory data in accordance with the LCA ISO Standards [20,21].
The Monte Carlo Method (available by SimaPro) was carried out for sensitivity analysis by using the standard deviation provided by literature data. In cases where there was no standard deviation, a 10% error was taken into account. The results extracted from this analysis were incorporated in the impact assessment step in the form of standard deviation of damage category results.
At the stage of the LCI, emphasis is placed on collecting and quantifying data related to the relevant inputs and outputs of the production system [22]. The process of forming an LCI requires extreme attention and precisely defined goals. All elemental flows should be thoroughly defined from the production stage to final consumption, with special attention to biomass conversion chains [24].
In the third phase of LCA, assessment of potential environmental impacts is carried out, using the data from the inventory phase [22]. ReCiPe2016 Hierarchist impact assessment methodology was used in the current study [25]. This method takes into account three areas of protection: human health, quality of ecosystem and resource scarcity. The endpoint characterization factors are directly linked to these areas of protection and were derived from midpoint characterization factors using a fixed conversion factor from midpoint to endpoint for each impact category. Eighteen midpoint impact categories are included. Disability adjusted life years (DALYs) are a metric related to human health representing the years that are lost from a person’s life due to early death or disability caused by a disease or accident. The local species loss integrated over time (species year) is the unit for ecosystem quality while the dollar ($) is the unit for resource scarcity. The latter represents all the extra costs needed in case of fossil and mineral extraction. By converting the units to Pt, which represents the average environmental burden caused by a European citizen per year, the three aforementioned endpoint damage categories are further aggregated.

2.1.3. Sheep and Goat Manure Composting

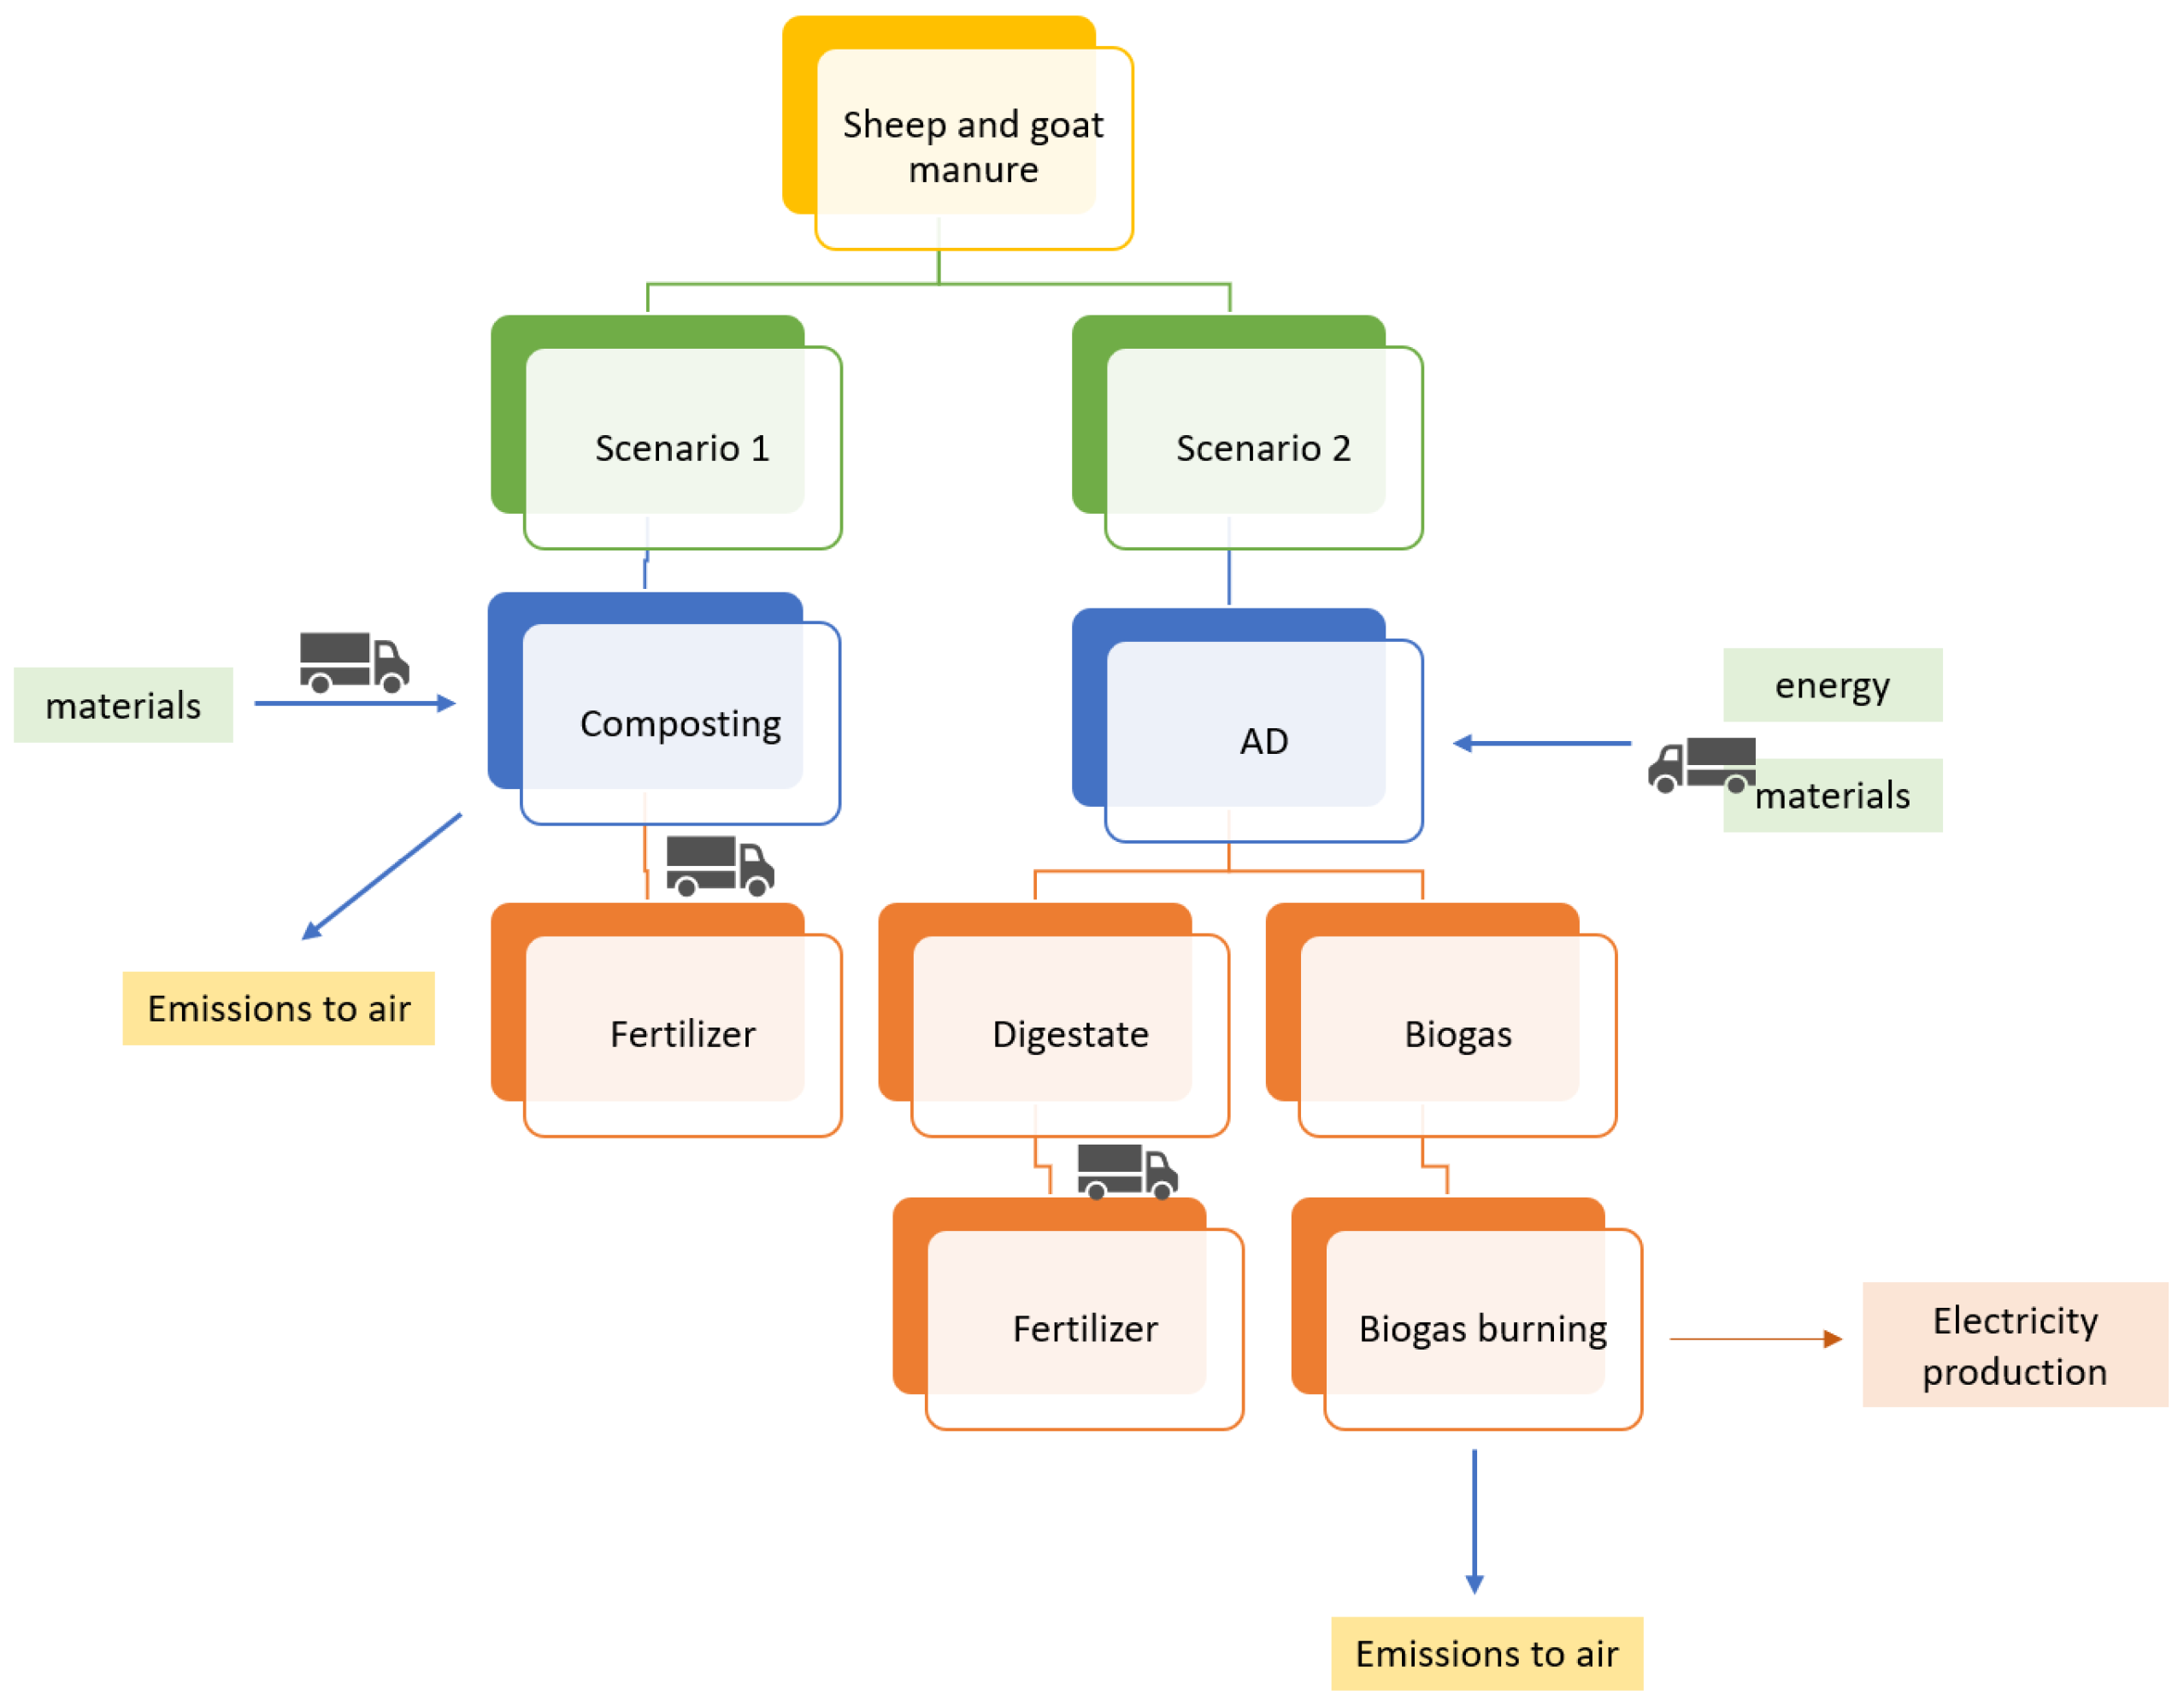
As mentioned previously, the main use of manure by farm owners is focused on selling it as fertilizer or simply spreading it onto agricultural and/or arable land. Regarding the products of the process, they are mainly the resulting gas emissions (Figure 1). The content of manure in nitrogen, phosphorus and potassium (Table 1) was considered to replace chemical fertilizers, displacing their production and consequently having a beneficial effect on the overall process’ footprint. The sensitivity of LCA outcomes to fertilizer substitution coefficients is primarily attributable to their direct influence on avoided mineral fertilizer production burdens, which are often among the dominant contributors to energy consumption and greenhouse gas emissions within agricultural systems. Higher substitution coefficients imply greater displacement of synthetic fertilizers, leading to larger avoided environmental burdens. Small variations in nutrient replacement efficiency can shift a system from being environmentally beneficial to environmentally burdensome.

2.1.4. AD of Sheep and Goat Manure

The AD unit processes include (a) the transport of sheep and goat manure, (b) the burning in a boiler of the produced biogas for producing heat, (c) the transport of the final effluent to be used as fertilizer, and (d) the heat and energy production (Figure 1). The plant’s construction materials are excluded. It is a choice that researchers often select in LCA methodology [33], as it is assumed that construction burdens of the equipment are negligible compared to the operational burdens, due to the extended equipment lifespan. The underlying assumption is that the environmental burdens associated with the production, transport, and assembly of plant construction materials are relatively minor when distributed over the full operational lifetime of the facility. Consequently, these burdens are often considered negligible in comparison to those arising from the operational phase, which typically dominates the overall environmental impact due to continuous energy consumption, emissions, and material flows. This approach is therefore used to simplify the system without significantly affecting the robustness of the results, especially when the infrastructure has a long service life and high process throughput.
The final effluent contains nutrients that can be used as fertilizers through their application to the soil [34]. Literature data were used concerning the nutrients (namely nitrogen, phosphorus, potassium) contained in the final effluent (Table 1). These nutrients were considered to replace chemical fertilizer—as in the case of composting—and thus have a positive impact on the entire process’ footprint.
The values of the coefficients used for the reactors’ heat transfer as well as their mixing intensity were theoretical and obtained from literature. Similarly, literature data were used for the calculation of energy consumption during the operation reactor, considering the heat resistance of a stainless-steel reactor with 10 cm of insulation and thermal transmittance equal to 0.35 W/m2 K [31]. The stirring intensity of 0.005 kW/m3 was applied [30] and a mean temperature difference of 12 °C was considered for the analysis. The produced methane of sheep and goat manure AD in continuous system was calculated by the work of [1]. The thermodynamic data from the reaction of hydrogen and methane with oxygen, 142 MJ/kg of H2 and 55.5 MJ/kg of CH4 were used to calculate the energy content of biogas. An electrical energy conversion efficiency of 37% was used for the calculations, while the thermal energy produced was not taken into account as a product, apart from covering the thermal needs of the AD process. Data from literature were used to calculate the emissions to air that occur during biogas burning (Table 1).

2.1.5. Transport

The fuel consumption was estimated based on the weight of a product/waste and distance in tkm, with the use of SimaPro 9 and ecoinvent 3.5 database. The model assumed a vehicle > 32-ton, EURO 6 in a Greek region. Data regarding the installation of AD unit at Achaia Prefecture, Western Greece, were used, in order to include the environmental burdens that occur at transportation (Table 1).

2.2. Case Study 2: Incineration Versus AD of FW

2.2.1. Goal and Scope Definition

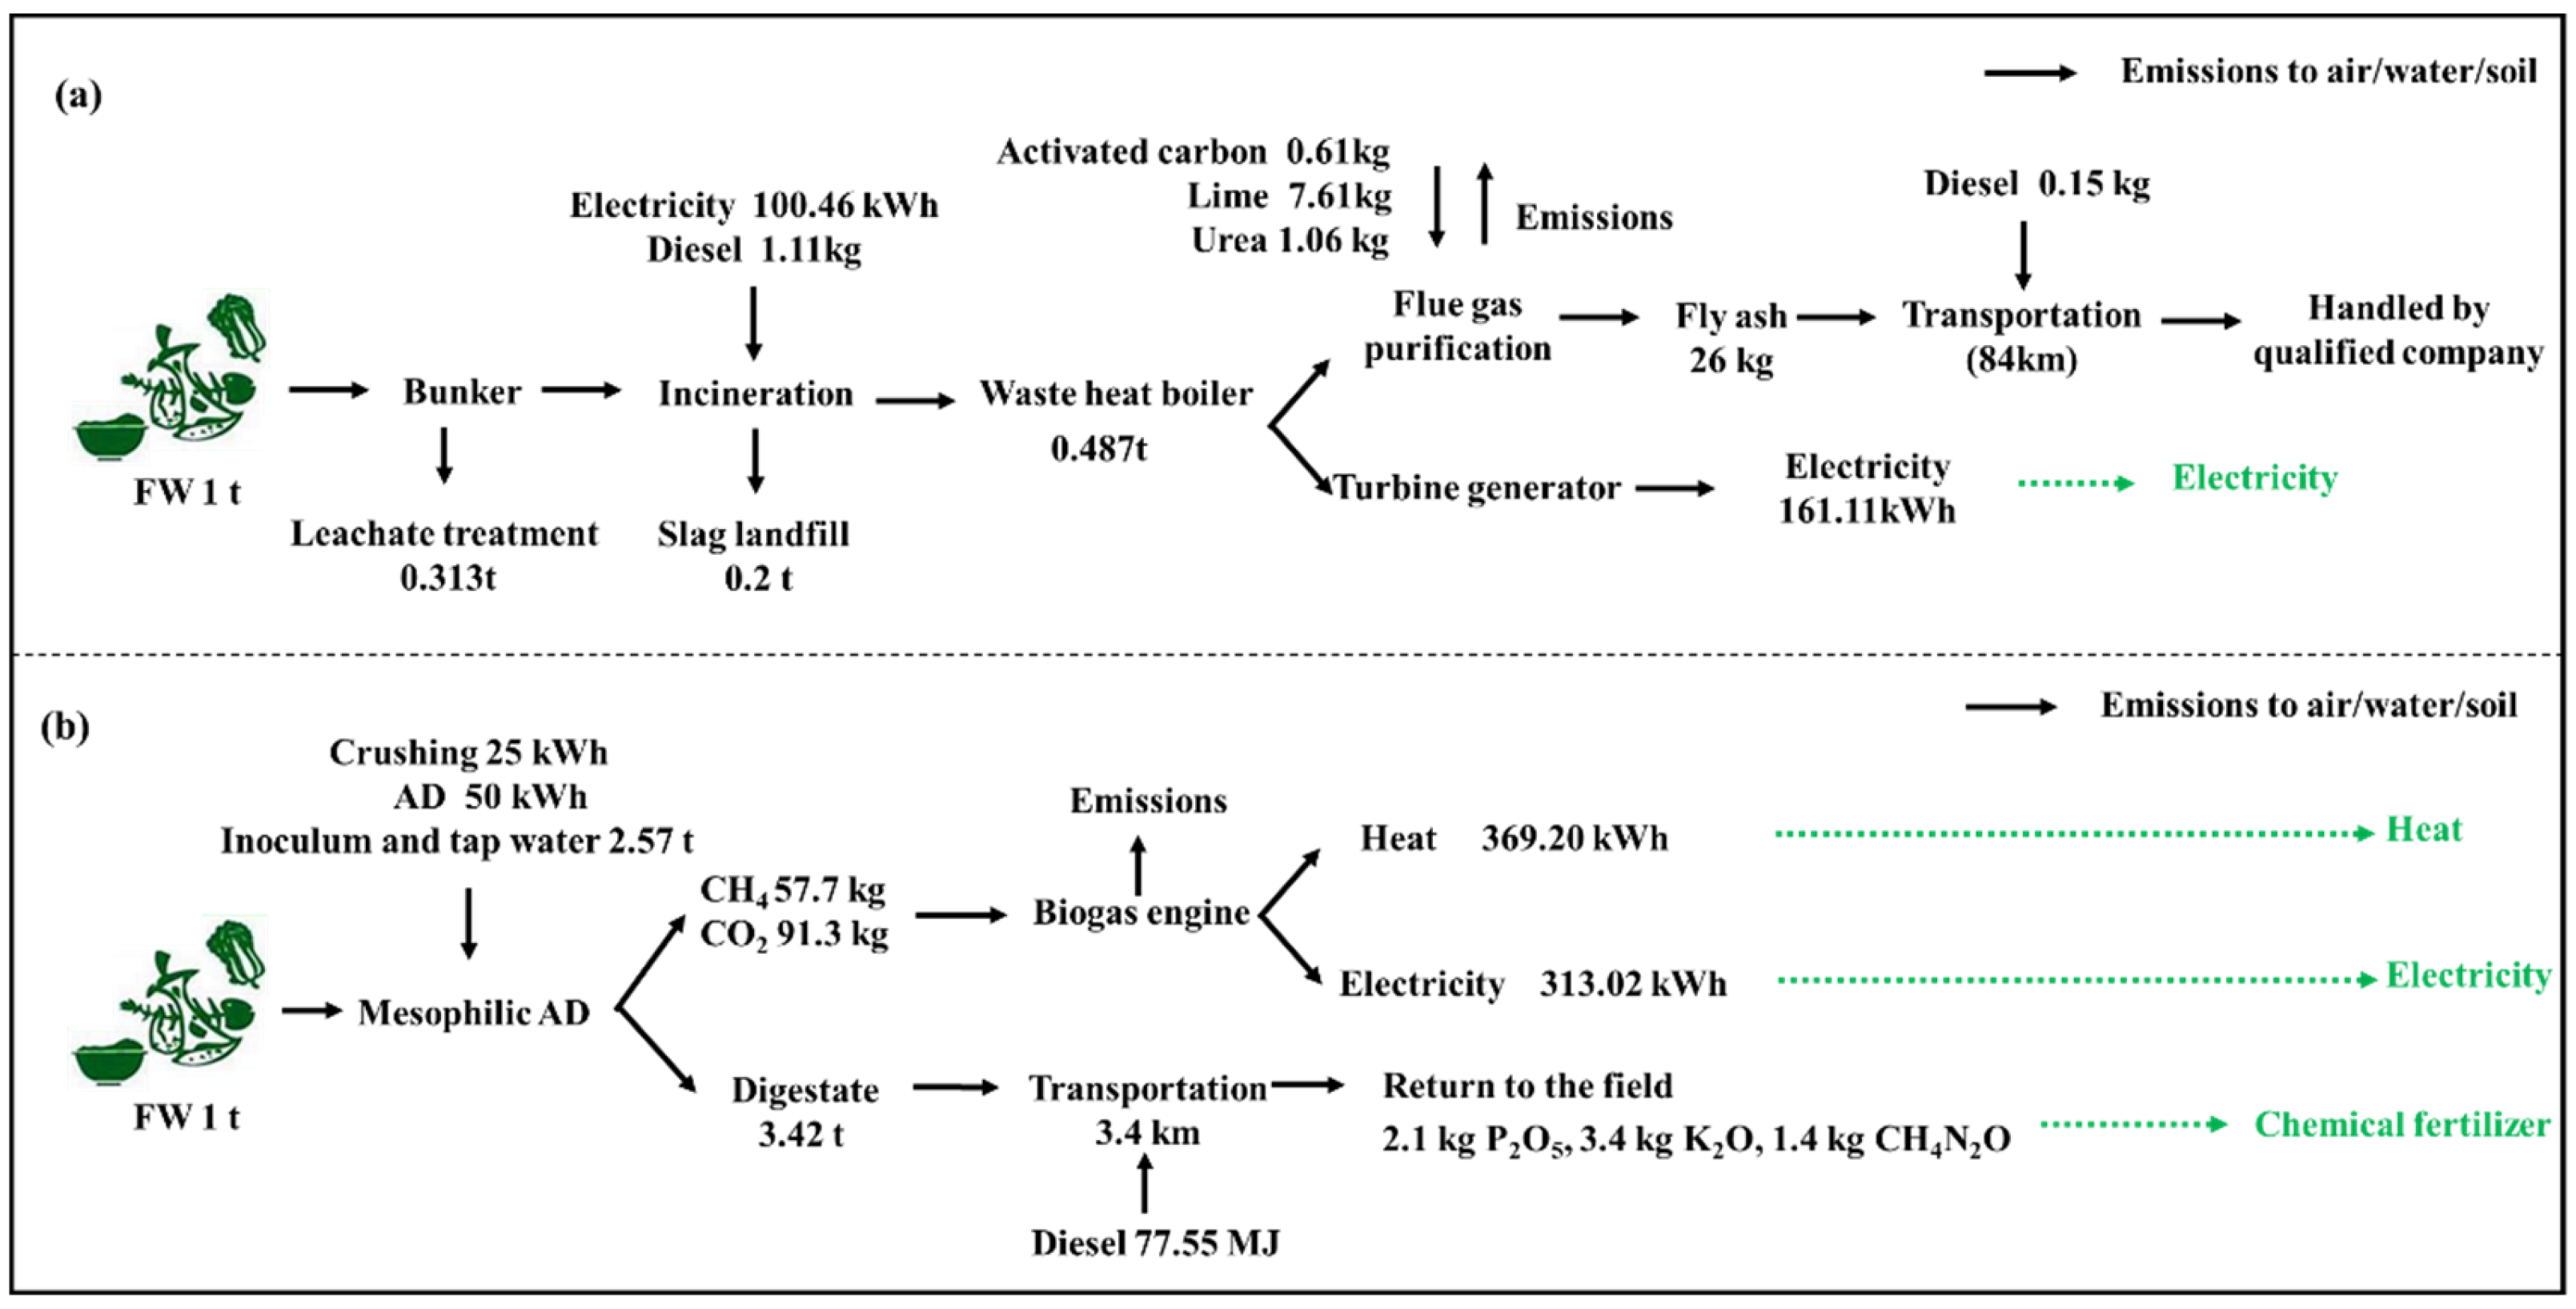
This LCA study evaluates and contrasts the environmental implications of two distinct FW management approaches, incineration and AD, to provide a basis for decision-making. The target audience includes industrial stakeholders, governmental and regulatory bodies. The geographical scope is Beijing Municipality, China, with the FU set as the treatment of 1000 kg of FW generated within this region. The system boundaries include all activities from FW collection to final residue disposal. A schematic diagram of the system boundaries is shown in Figure 2.
Composting was not included as a third scenario in Case study 2 because this case was designed to compare AD with the locally relevant conventional energy-recovery pathway for urban FW in Beijing, namely incineration/co-incineration with MSW. Composting is a recognized FW treatment option in China; however, centralized urban FW composting is often constrained by insufficient source separation, impurities in the feedstock, odor control, compost-quality requirements, and limited market demand for compost products. Therefore, the exclusion of composting should be understood as a scope definition for this Beijing case study rather than as a statement that composting is not technically feasible in China.

2.2.2. Methodology

In this study, the LCA model was developed and analyzed using GaBi 7.3 software. Primary data sources included actual plant operations and experimental datasets [35], supplemented by other validated sources such as government reports and literature where necessary. Background data, such as parameters for diesel production, transportation, and electricity generation, were obtained from the Ecoinvent 3.7 database. Uncertainty and sensitivity analyses, critical for ensuring the reliability of LCA outcomes, were conducted following the same methodology as in our previous work [36].
The ReCiPe2016 Hierarchist impact assessment methodology was employed, which provides a globally consistent and scientifically quantifiable framework for evaluating environmental impacts [25]. The methodology features a dual-level analytical framework comprising midpoint and endpoint impact categories, encompassing three critical dimensions: human health, ecosystem quality, and resource scarcity. Fixed conversion factors further allow aggregation of midpoint results into endpoint categories. In this work, we evaluated the performance of two scenarios across 18 midpoint environmental impact categories. Subsequently, normalization and weighting factors aligned with China’s national context were applied to convert these results into the three damage assessment categories. Detailed numerical values and the rationale for factor selection are documented in our prior study [36].

2.2.3. Life Cycle Inventory Analysis

This investigation utilized FW samples collected in Beijing, China, characterized by a typical moisture content range of 75–90%. The specific moisture content adopted in this study was 78.3% [37], and the reported calorific value was taken as an as-received lower heating value (LHV; net calorific value) of 2500 kJ/kg [38,39]. The analyzed parameters of FW included volatile solids (VSs) at 25.1 ± 0.1%, total solids (TSs) at 27.3 ± 0.2%, and a pH value of 4.7 ± 0.1.
In the current analysis, carbon dioxide emissions derived from FW treatment through both AD and incineration were classified as biogenic in origin [40]. The environmental impacts associated with infrastructure construction processes, such as facility establishment and equipment installation, were excluded from the system boundaries, as in Case study 1.

2.2.4. Incineration of FW

FW is characterized by high moisture content and non-combustible fractions. Typically, FW is discarded into the MSW and co-incinerated for heat and energy recovery, rather than being directly incinerated as a standalone feedstock. Therefore, it is assumed that when feedstock is diverted from MSW to FW, material input and pollutant emissions remain unchanged.
The life cycle inventory is based on operational data from an MSW incineration plant in Beijing, with a design capacity of 1800 tons per day and an annual processing volume of 657,000 tons. The facility operates continuously year-round, generating 292 million kWh of electricity annually, of which 226 million kWh is fed into the power grid. Auxiliary systems consume 732 tons of diesel annually, and residue outputs include 99,184.56 tons of slag and 9922.44 tons of fly ash. To comply with emission standards, the flue gas purification system utilizes 400 tons of activated carbon, 5000 tons of hydrated lime, and 700 tons of urea annually.
FW is collected by the garbage transfer station and transported directly to the incineration plant. Therefore, the processes of FW collection and transportation are not included in the boundary of this system. After entering the incineration plant, FW is stored in the leachate collection bunker for 3–5 days. The generated leachate is first treated on-site and then further treated at the industrial park sewage treatment plant. The remaining solid fraction is fed into the incinerator, generating slag and flue gas. The slag is sent to the sanitary landfill within the park for disposal, while the flue gas undergoes purification to meet emission standards before atmospheric release. Fly ash produced during flue gas purification—containing heavy metal ions and toxic organic compounds—is classified as hazardous waste and handled by licensed disposal companies. The heat generated from incineration is harnessed through a waste heat boiler and subsequently directed to a steam turbine generator unit for electricity production.
This study maintains consistency with the incineration plant’s operational parameters for electricity, diesel, activated carbon, hydrated lime, and urea consumption. The production yields of slag and fly ash are determined based on the research on FW incineration for power generation by Yu et al. [41]. Specifically, the slag yield was quantified at 0.2 tons per ton of incinerated FW, with a corresponding fly ash yield of 26 kg. During FW storage processes, 313 L of leachate are generated per ton of FW [42], equivalent to 313 kg of leachate production when calculated using water density assumptions.
Given the facility’s annual electricity generation of 292 million kWh and the MSW’s calorific value of 6897 kJ/kg, the electrical conversion efficiency is calculated to be 23.2%. The electricity generation potential of FW was calculated based on its as-received LHV, which accounts for the high moisture content and lower proportion of combustible components compared with mixed MSW. The LHV of FW in Beijing was 2500 kJ/kg [38,39]. Based on an electricity conversion rate of 23.2%, the electricity generated per ton of FW is 161.11 kWh. Energy consumption and emission data for sewage treatment and landfilling are derived from industrial operational data, while fly ash treatment parameters are obtained from literature sources [43].
No nutrient-recovery credit was assigned to incineration residues. Slag was modeled as being sent to landfill, and fly ash was modeled as hazardous waste handled by licensed disposal companies; therefore, the study does not assume that incineration ash from FW/MSW combustion is suitable for land spreading.

2.2.5. AD of FW

FW undergoes mechanical pretreatment involving crushing and mixing prior to AD, with electricity consumption for these processes obtained from Kua et al. [44]. The pretreated substrate is diluted with 2.57 tons of water per ton of FW to maintain a hydraulic retention time (HRT) of 25 days, based on experimental data. The diluted slurry undergoes mesophilic AD (37 °C) in continuously stirred tank reactors (CSTRs), requiring energy input that was calculated using water’s specific heat capacity (4.2 kJ/kg·°C) and the corresponding total volume to elevate the temperature from ambient conditions (25 °C) to operational levels.
Biogas production and digestate yield are derived from prior experimental data [35]. For AD scenarios, the biogas is modeled for combined heat and power generation at typical conversion efficiencies of 39% (electricity) and 46% (heat), consistent with literature values [45,46]. The LCI of emissions from combined heat and power (CHP) follows previous research [47,48].
The digestate produced by AD contains abundant nutrients such as nitrogen (N), phosphorus (P), potassium (K), etc., which can replace chemical fertilizers and be used for the surrounding grasslands of nearby parks, with a transportation distance of 3.4 km. In addition, an average diesel consumption of 22.7 MJ per ton of digestate during transportation was adopted [45,49].
The content of N in FW comes from our previous experimental data, while the content of P and K is based on the research data of Tampio et al. [50], as the characteristics of FW used in these two studies are similar. The substitution ratios of N, P, and K were assumed to be 40%, 100%, and 100%, respectively, consistent with relevant studies [45,46,51]. The digestate’s N, P, and K content (as CH4N2O, P2O5, and K2O) serves as a potential replacement for conventional urea, phosphorus, and potassium fertilizers, supplying essential nutrients for biological growth.
The fertilizer substitution credit was interpreted as the potential replacement of mineral fertilizers under controlled digestate application, not as complete plant uptake of all nutrients contained in the digestate. The digestate was assumed to be applied to nearby grasslands according to agronomic nutrient demand and standard field-management practice. Emission factors for biofertilizer field application were derived from existing scientific literature and IPCC guidelines [40,48,52]. The model therefore represents an annual-average LCA approximation; short-term temporal dynamics such as rainfall-driven leaching, seasonal plant uptake variability, or site-specific nutrient accumulation were not dynamically simulated and are acknowledged as a limitation.

3. Results and Discussion

To avoid over-comparison between independent models, the following sections interpret the two case studies separately. Absolute impact values are compared only within the same case study. The final synthesis focuses on whether similar environmental patterns emerge for AD when it is benchmarked against the locally relevant conventional treatment option.

3.1. Case Study 1: Composting Versus AD of Sheep and Goat Manure

3.1.1. Proposed Process Input Data

Table 2 presents the data for the Scenario I per FU (sheep and goat manure composting).
Table 3 presents the data for the Scenario II per FU (AD of sheep and goat manure).
The Ecoinvent database was used to convert input data into environmental emissions. Supplementary Materials File S1 presents the calculated LCI.

3.1.2. Characterization

Through the ReCiPe2016, at the characterization step, the LCI results are aggregated in midpoint impact categories. As mentioned in the previous section, the standard deviation of the results was obtained through the Monte Carlo uncertainty analysis. The results in each midpoint category for Scenario I and Scenario II are presented in Table 4.

3.1.3. Damage Assessment

The midpoint categories are further aggregated into three endpoint damage categories in the damage assessment step. The results of this aggregation are presented in Table 4.

3.1.4. Normalization

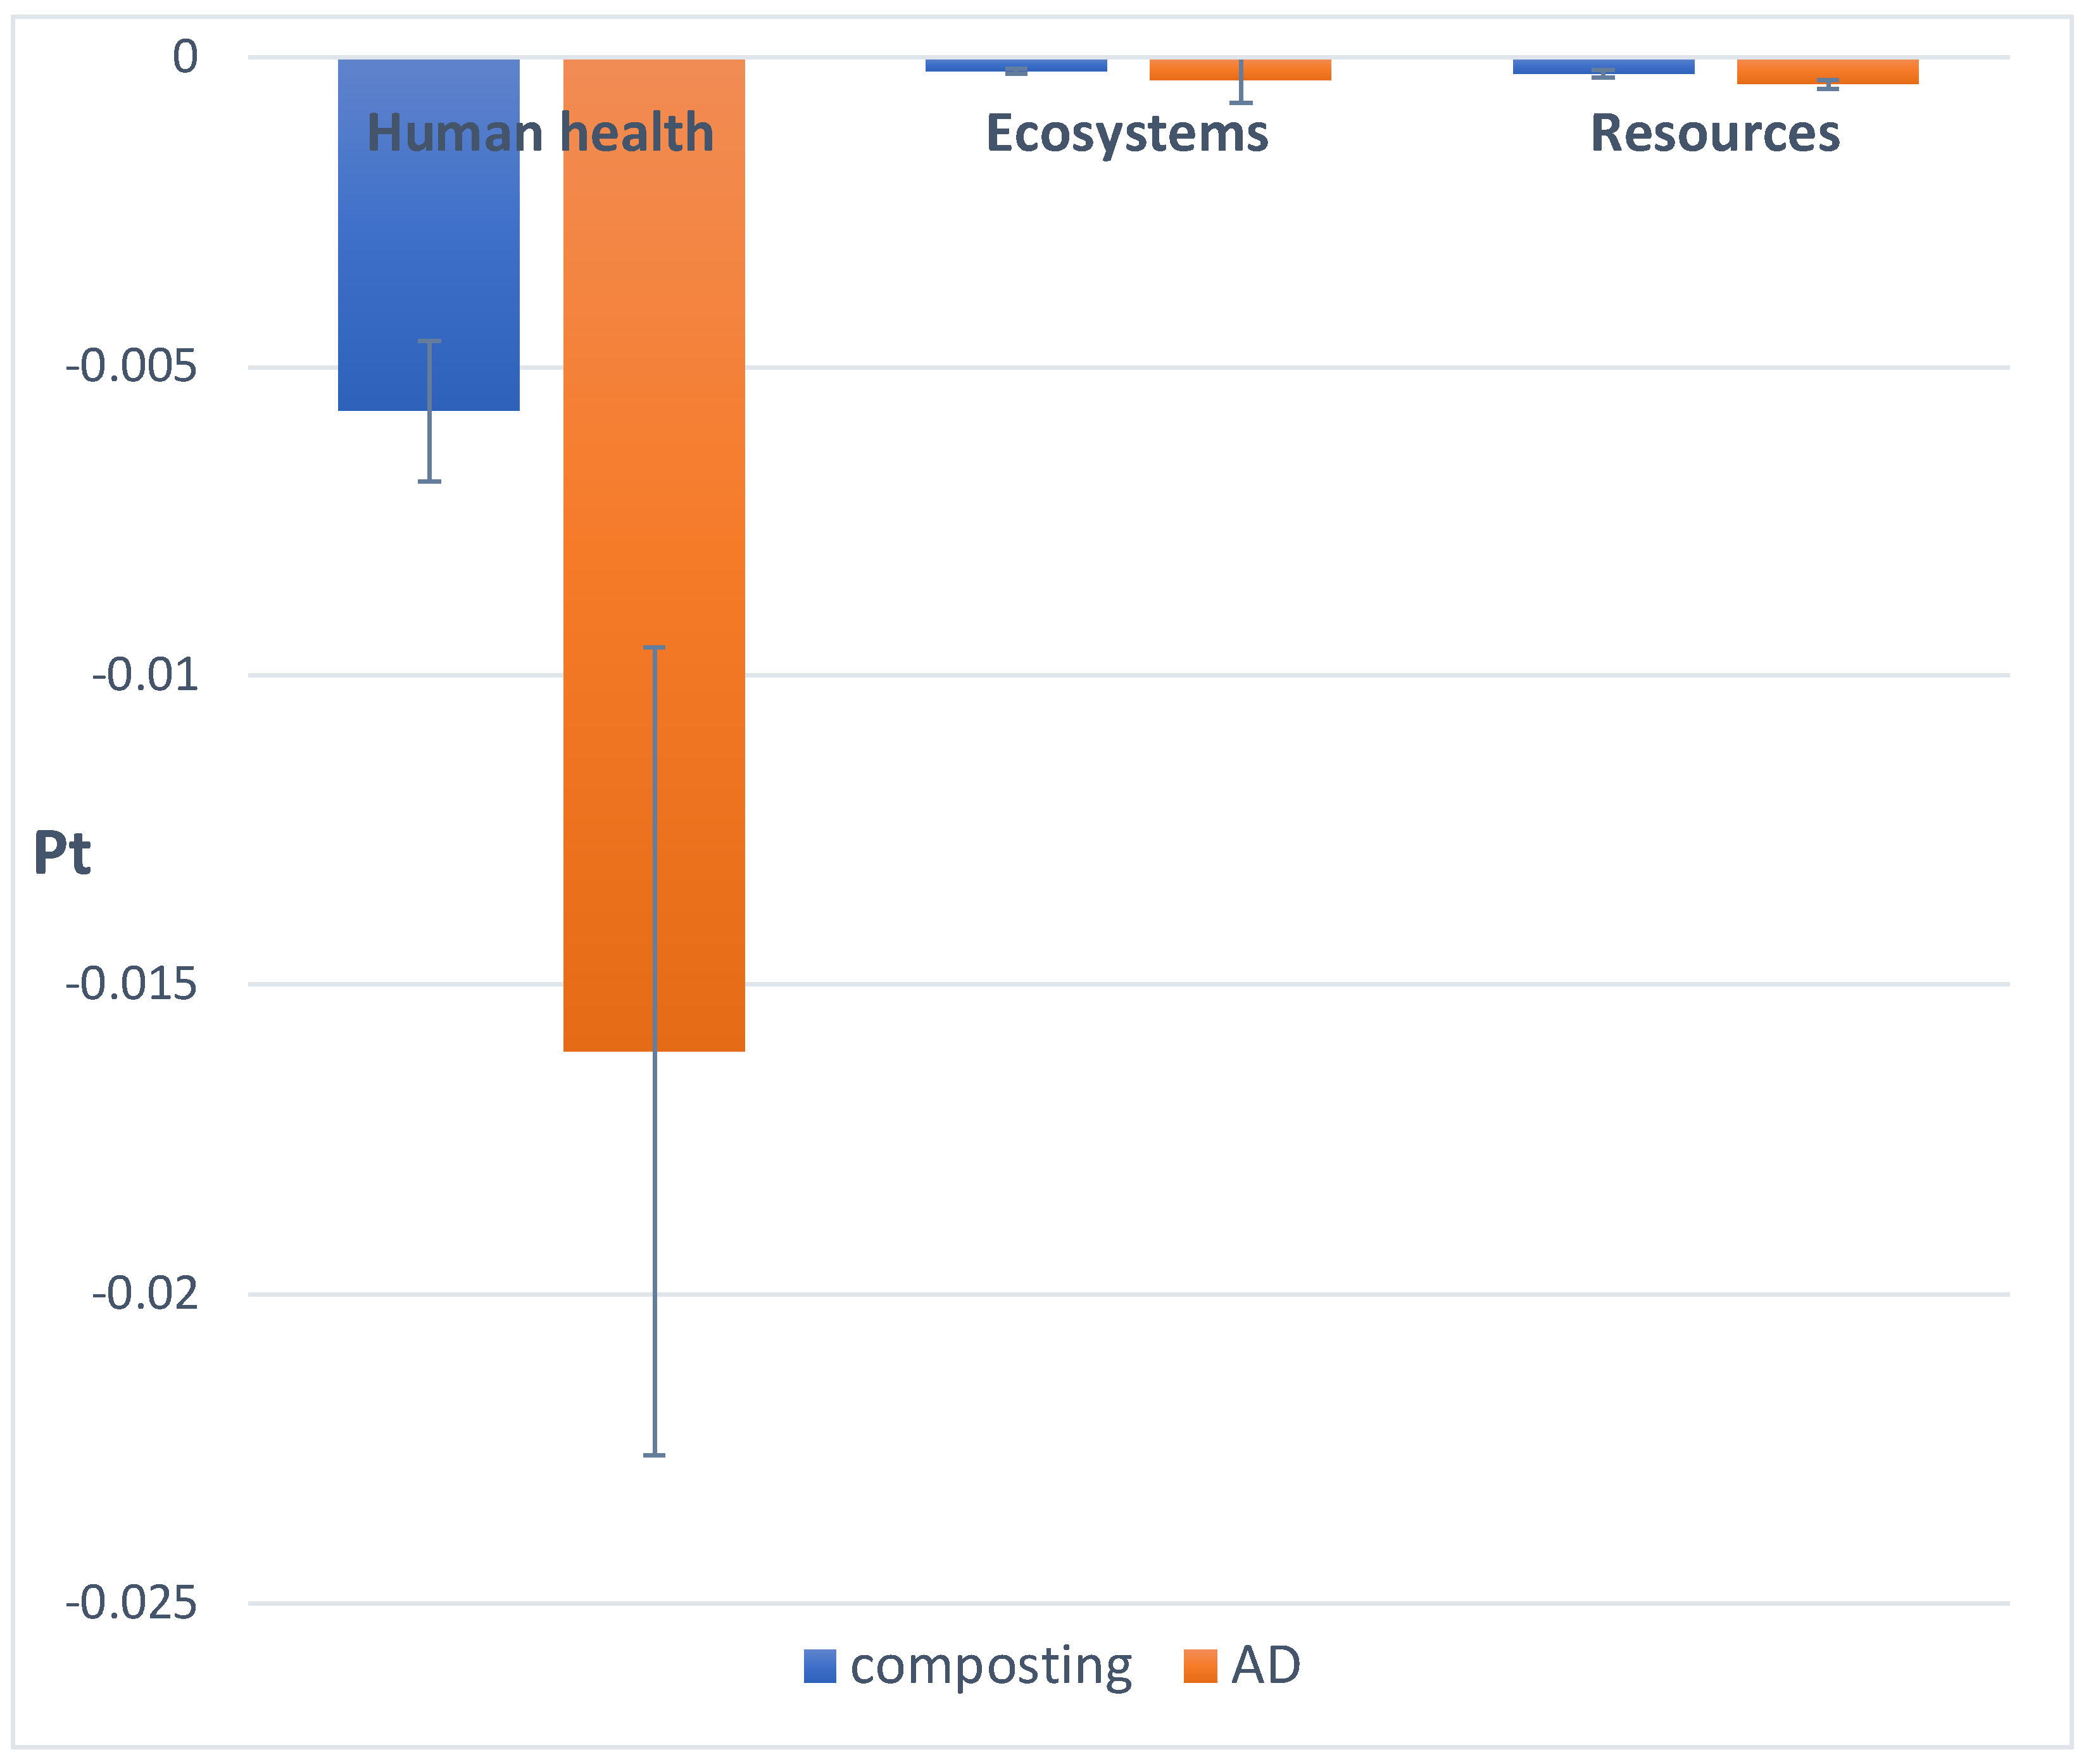
In the normalization step, all scores displayed in the damage assessment are normalized using the impact of an average European per year. The normalized results for sheep and goat manure composting in comparison with the AD of sheep and goat manure are depicted in Figure 3. Both scenarios demonstrate negative damage categories that imply positive environmental impact, with the negative AD values being higher, especially on human health.

3.1.5. Interpretation

In this study, with the use of the LCA model and the data, it was demonstrated that composting and AD of sheep and goat manure have a positive effect in the examined midpoint and endpoint level categories. Consequently, both processes exhibit negative damage that imply positive environmental impact in the three damage categories namely resource scarcity, human health and ecosystem quality. This positive effect becomes evident after the normalization step with AD presenting a more significant effect on human health.
During the summer period, the atmospheric air at areas with animal manure storage tanks or lagoons presents higher concentrations of methane and air pollutants such as hydrogen sulfide, ammonia, and particulate matter [53]. Disposing untreated manure has a serious environmental impact as it contaminates the soil, causes eutrophication and GHG emissions. Additionally, such action fails to take advantage of the untreated manure’s nutrients [1]. Manure contains a wide range of valuable and recyclable ingredients like organic material, fiber and nutrients. It is very common for farmers to use livestock manures as organic fertilizer or soil additive to enhance the chemical and physical properties of the soil for the growth of crops and pastures. In some countries, animal and chicken manure have been processed into feed components for animals. Moreover, because of its high organic matter content, it can be efficiently converted into energy through the production of biogas [26]. Few livestock manure management and valorization technologies such as AD and composting are well established technologies that show encouraging results in improving environmental and economical sustainability [54].
Although sheep represent the biggest share of the whole livestock population in the world, it is surprising that sheep and goat manure are rarely referred to as an additive in AD, despite its recently demonstrated capability for high methane yield [1]. It should be mentioned that sheep and goats are among the groups of animals that, despite living in sheltered locations, they discard their waste in other areas, making collection difficult.
The correct choice of manure management technology can affect the problem of disposal and at the same time environmental pollution. Prapaspongsa et al. [55], elaborated an LCA study during which a comparison of twelve integrated technological changes at the stages of treatment, storage and land application was conducted, and incorporated new impact categories in pig manure management. The most important impact categories that are determined from pig manure management include global warming, aquatic eutrophication, respiratory inorganics, and terrestrial eutrophication. In the first categories, the AD scenario with natural crust storage achieves the biggest reduction due to its high efficiency in energy and nutrient recovery with limited emissions of GHG and nitrate. In the last two categories. In the last categories, the incineration and thermal gasification scenarios as well as the no treatment scenario where the deep injection method is applied yield the lowest impact due to the least ammonia emissions.
Cherubini et al. [56] assessed the impact on the environment of swine production in Brazil with the use of LCA, through the comparison of four manure management systems: (a) liquid manure storage in slurry tanks, (b) biodigester with flare, (c) biodigester for energy recovery and (d) composting. The results of the comparison suggested that the biodigester for energy recovery performed in the best way across almost all the environmental impacts, primarily due to the capture of biogas and the energy savings potential.
Aguirre-Villegas and Larson [57] and Font-Palma [58] reported that untreated stored liquid manure could result in higher GHG emissions than alternative options of manure treatment. During the process of manure treatment, the facilities are able to substantially reduce emissions, particularly through AD [57]. Esteves et al. [59] elaborated a review detecting and comparing critical points of LCA related to the production of biogas from manure worldwide. However, differences in regional variables which include factors such as climate, availability of raw materials and transportation distance, make the comparison of the case studies challenging.
Ramírez–Islas et al. [60] evaluated the possible environmental impacts of energy production from treating pig manure through AD at medium-scale based on the LCA of a farm located in Puebla, Mexico. The potential environmental impacts on energy production and the products were defined. The results proved that there were substantial environmental benefits in the fields of climate change, photochemical oxidation, and depletion of fossil fuels. The manure treatment that used a combination of AD and composting had the best environmental performance, as it lowered emissions by 130 kg CO2eq and avoided the consumption of 729 MJ per ton of treated manure, compared with the conventional management system.
Unfortunately, as Alnhoud et al. [26] stated about Jordan, there are also few guidelines in Greece about manure management. In addition, there is limited awareness among farmers regarding the rules and regulations on animal manure management and the effects of manures on public health as well as the environment.

3.2. Case Study 2: Incineration Versus AD of FW

3.2.1. LCI

The LCI data for the FW incineration scenario are summarized in Table 5, with extended details provided in Table S1 (Supplementary Materials File S2).
The life cycle inventory data for the FW AD scenario are summarized in Table 6, with extended details provided in Table S2 (Supplementary Materials File S2).

3.2.2. Characterization

During the characterization phase, midpoint impact categories were established through the aggregation of LCI results following the ReCiPe2016 methodology. Table 7 summarizes the midpoint characterization results for both FW incineration and AD scenarios. Positive values represent environmental burdens, whereas negative values indicate environmental benefits. The analysis reveals that both scenarios demonstrate predominantly negative values across most impact categories, indicating their capacity to reduce environmental burdens within the selected system boundaries. Notably, the FW incineration scenario shows positive values in five environmental categories, including human toxicity-cancer (HTC), marine eutrophication (MEU), photochemical ozone formation-ecosystem (POFE), photochemical ozone formation-human health (POFH), and terrestrial ecotoxicity (TE), indicating that it imposes certain environmental burdens. The FW AD scenario shows positive values in three environmental categories, including water consumption (WC), marine eutrophication (MEU), and stratospheric ozone depletion (SOD).
Both scenarios exhibit environmental burdens in the MEU category. For the incineration scenario, this burden arises primarily from the substantial consumption of chemical reagents during flue gas purification and the emission of nitrogen oxides (NOx), which are recognized contributors to eutrophication. The AD scenario contributes to MEU through the elevated N and P content in the digestate, as these elements serve as key inorganic nutrients driving algal proliferation and marine ecosystem degradation.
This result should not be interpreted as full nutrient uptake by plants. It indicates that, despite fertilizer substitution credits, losses from digestate application remain relevant to eutrophication-related categories when nutrient release and receiving environments are considered.
The incineration scenario demonstrates additional burdens in the HTC due to residual low-concentration heavy metals (e.g., Pb, Cd, Hg) and dioxins in purified flue gas [61]. Despite their trace concentration, their high toxicological potency significantly outweighs that of other pollutants. The environmental burden caused by POFE and POFH is due to the production of NOx during the fly ash solidification and FW incineration processes. The AD scenario incurs environmental burdens in the water consumption category due to the essential water demand for maintaining constant HRT and diluting elevated salt concentrations in biofertilizers.

3.2.3. Damage Assessment

The damage assessment phase converts midpoint impacts into three endpoint categories (human health, ecosystems, and resources), with results presented in Table 8.

3.2.4. Midpoint Impact Interpretation

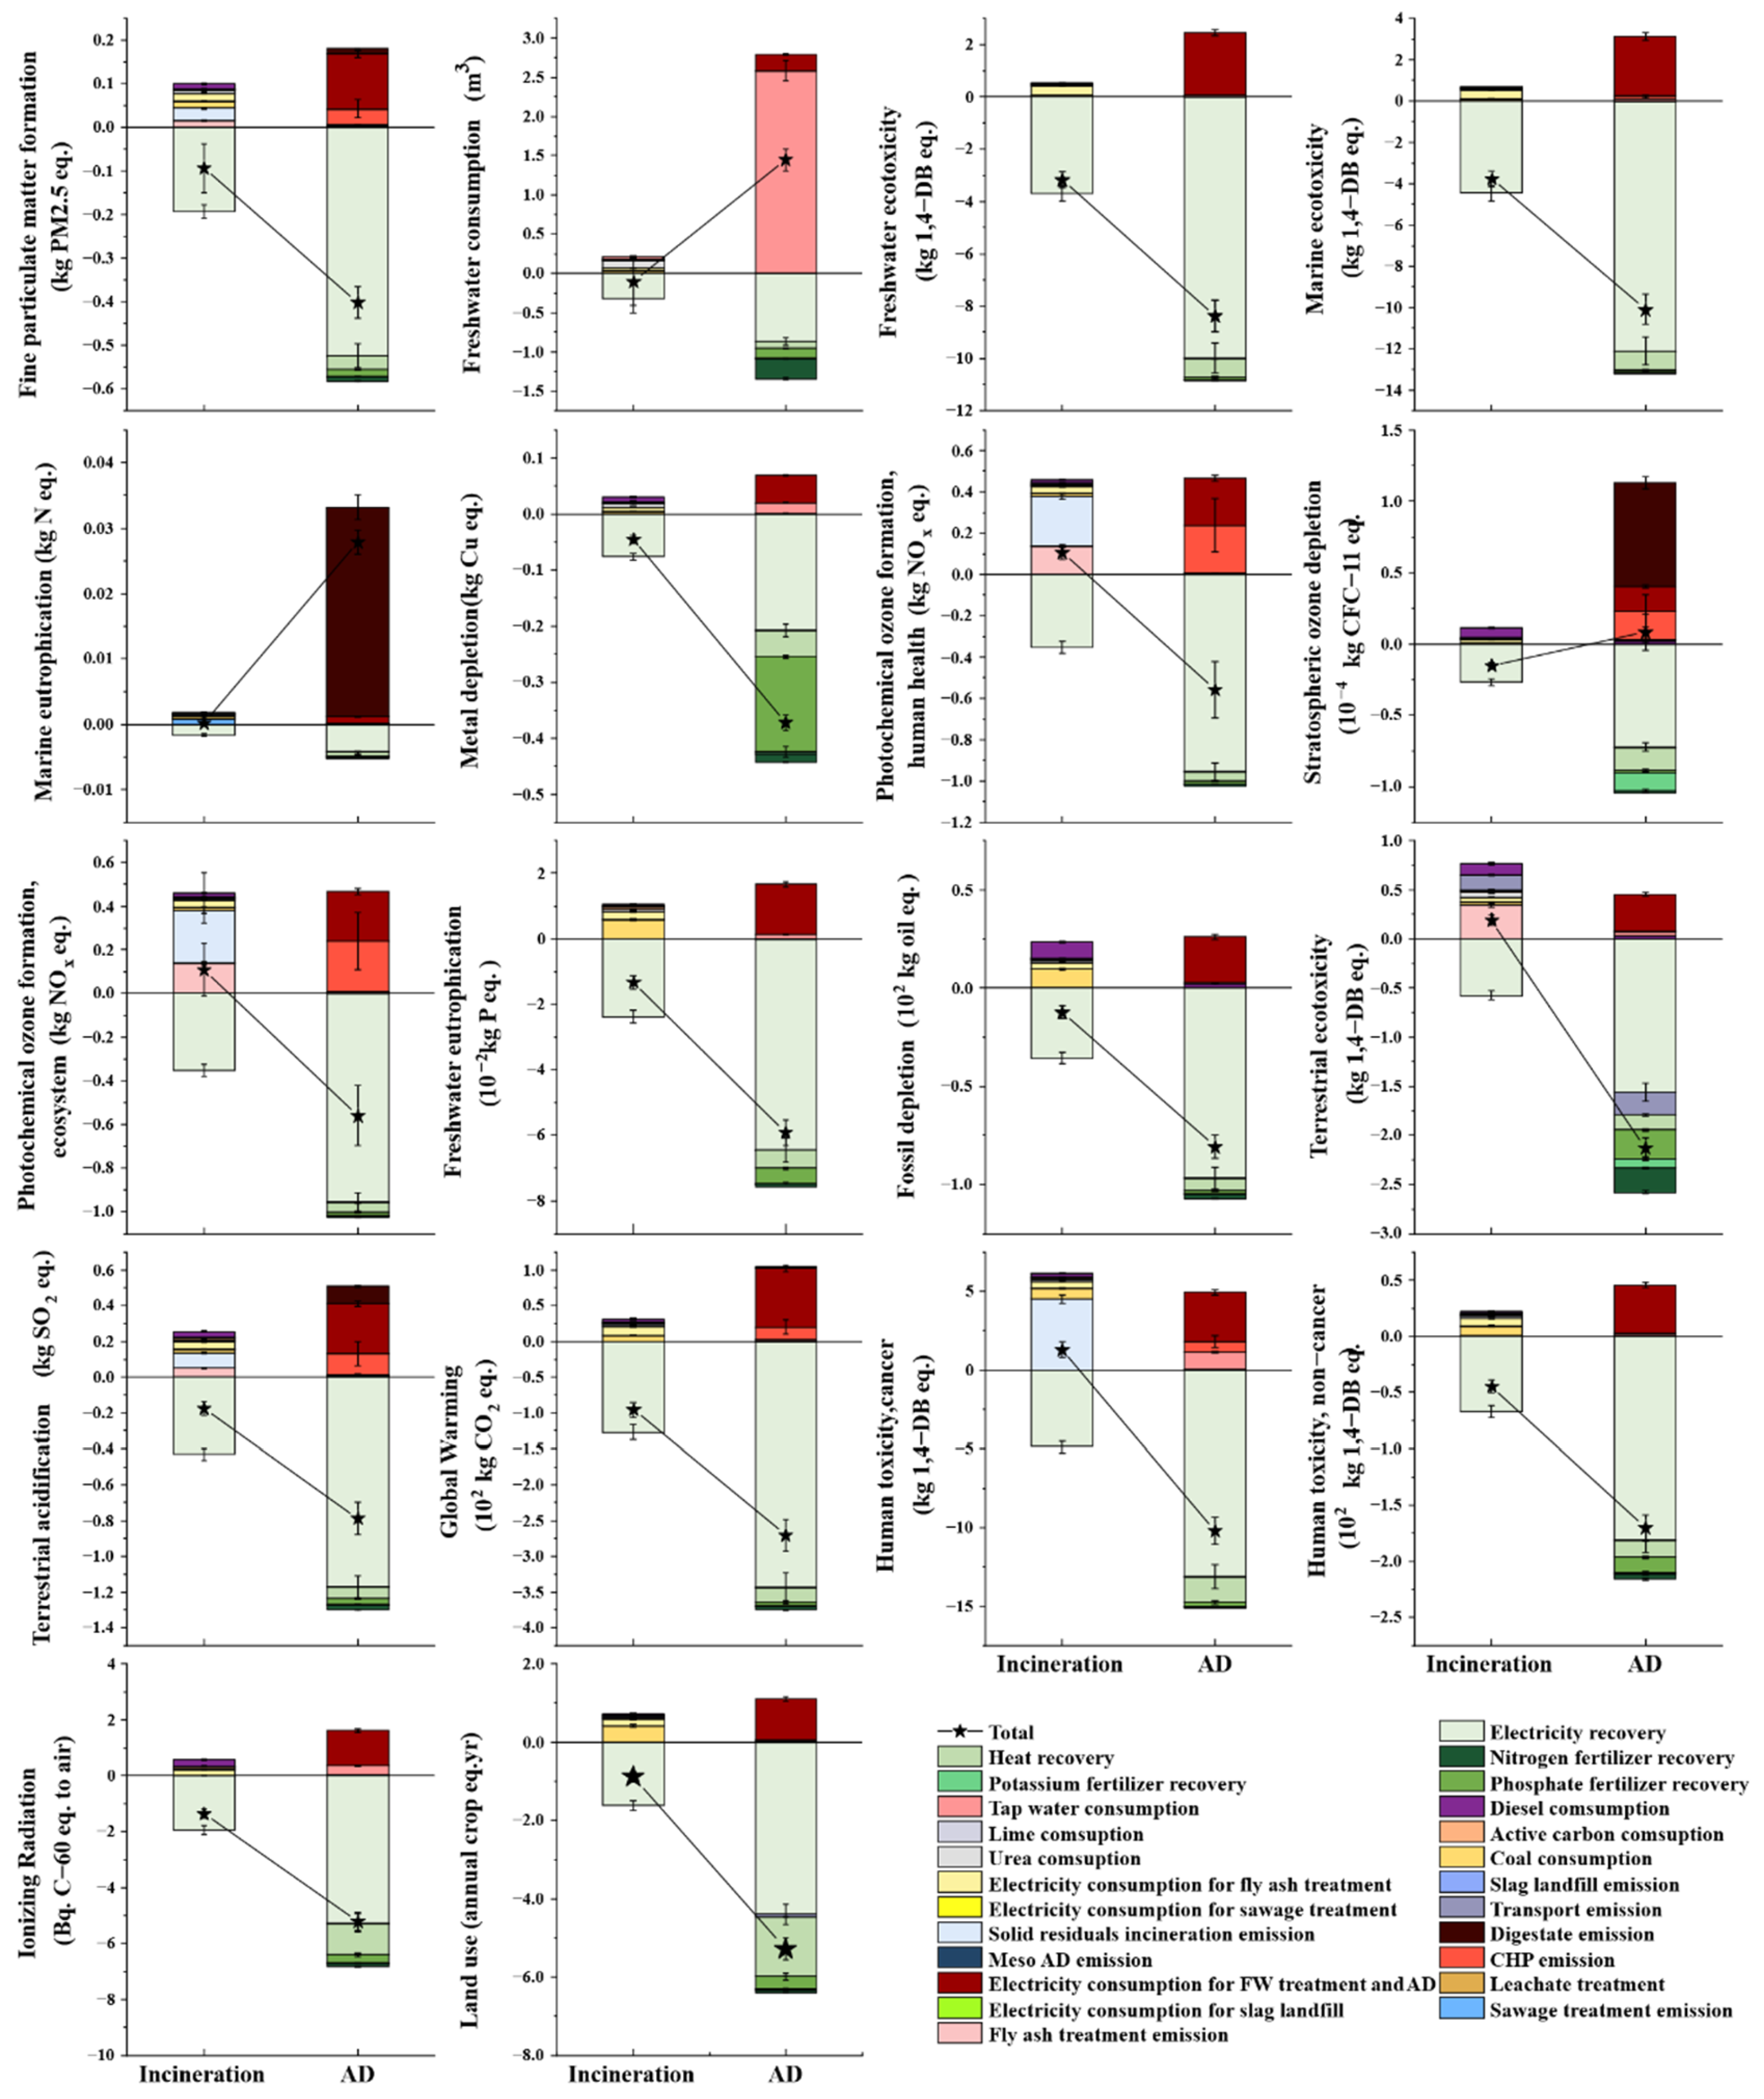
The environmental impacts generated during different treatment processes under incineration and AD scenarios are shown in Figure 4. The AD scenario exhibits superior environmental benefits in the global warming (GW) category compared to the incineration scenario, which may explain its current predominance as the mainstream technology for FW treatment [19]. In the incineration scenario, the environmental burden of the GW category mainly comes from the “Coal consumption” and the “Electricity consumption for fly ash treatment”, which together generate 65% of the GW burden. In the AD scenario, the environmental burden of the GW category is predominantly driven by the processes of “Electricity consumption for FW treatment and AD” and “CHP emissions”, which together generate 95% of the GW burden. “Electricity recovery” serves as the primary source of environmental benefits in both scenarios, contributing 100% of the GW benefits in the incineration scenario and 91% of the GW benefits in the AD scenario through avoiding fossil fuel-based electricity generation.
In the incineration scenario, “Coal consumption” and “Electricity consumption for fly ash treatment” are also identified as dominant contributors to environmental burdens across multiple categories, including fossil resource scarcity (FRS), freshwater ecotoxicity (FEC), freshwater eutrophication (FEU), and human toxicity non-cancer (HTNC) categories. Similarly, in the AD scenario, “Electricity consumption for FW treatment and AD”, and “CHP emissions” emerge as key burden sources, influencing all impact categories except WC, MEU, and SOD. Recovered electricity compensates for consumption impacts, yielding system-wide environmental benefits. In the AD scenario, “Digestate emissions” dominate the MEU and SOD categories, accounting for 96% and 64% of the environmental burden, respectively. However, the use of “Nitrogen fertilizer recovery”, “Phosphate fertilizer recovery”, and “Potassium fertilizer recovery” as alternatives to chemical fertilizers in digestates benefits all environmental impact categories.
The negative contributions of nutrient recovery should be interpreted as potentially avoided burdens from mineral fertilizer substitution under controlled digestate management. They do not imply that all nutrients in digestate are fully recovered by plants or that leaching and runoff are absent. This distinction is important because digestate emissions remain the dominant contributor to MEU and SOD in the AD scenario.
The negative values observed in the incineration scenario are mainly attributable to avoided fossil-based electricity generation through electricity recovery. In the AD scenario, the negative values in 15 of the 18 midpoint categories result from the combined credits for electricity recovery, heat recovery, and potential N, P, and K fertilizer substitution, which offset part of the burdens associated with electricity consumption, water dilution, CHP emissions, and digestate application. Within Case study 2, the AD scenario therefore shows stronger environmental benefits than the selected incineration baseline.

3.2.5. Endpoint Impact Interpretation

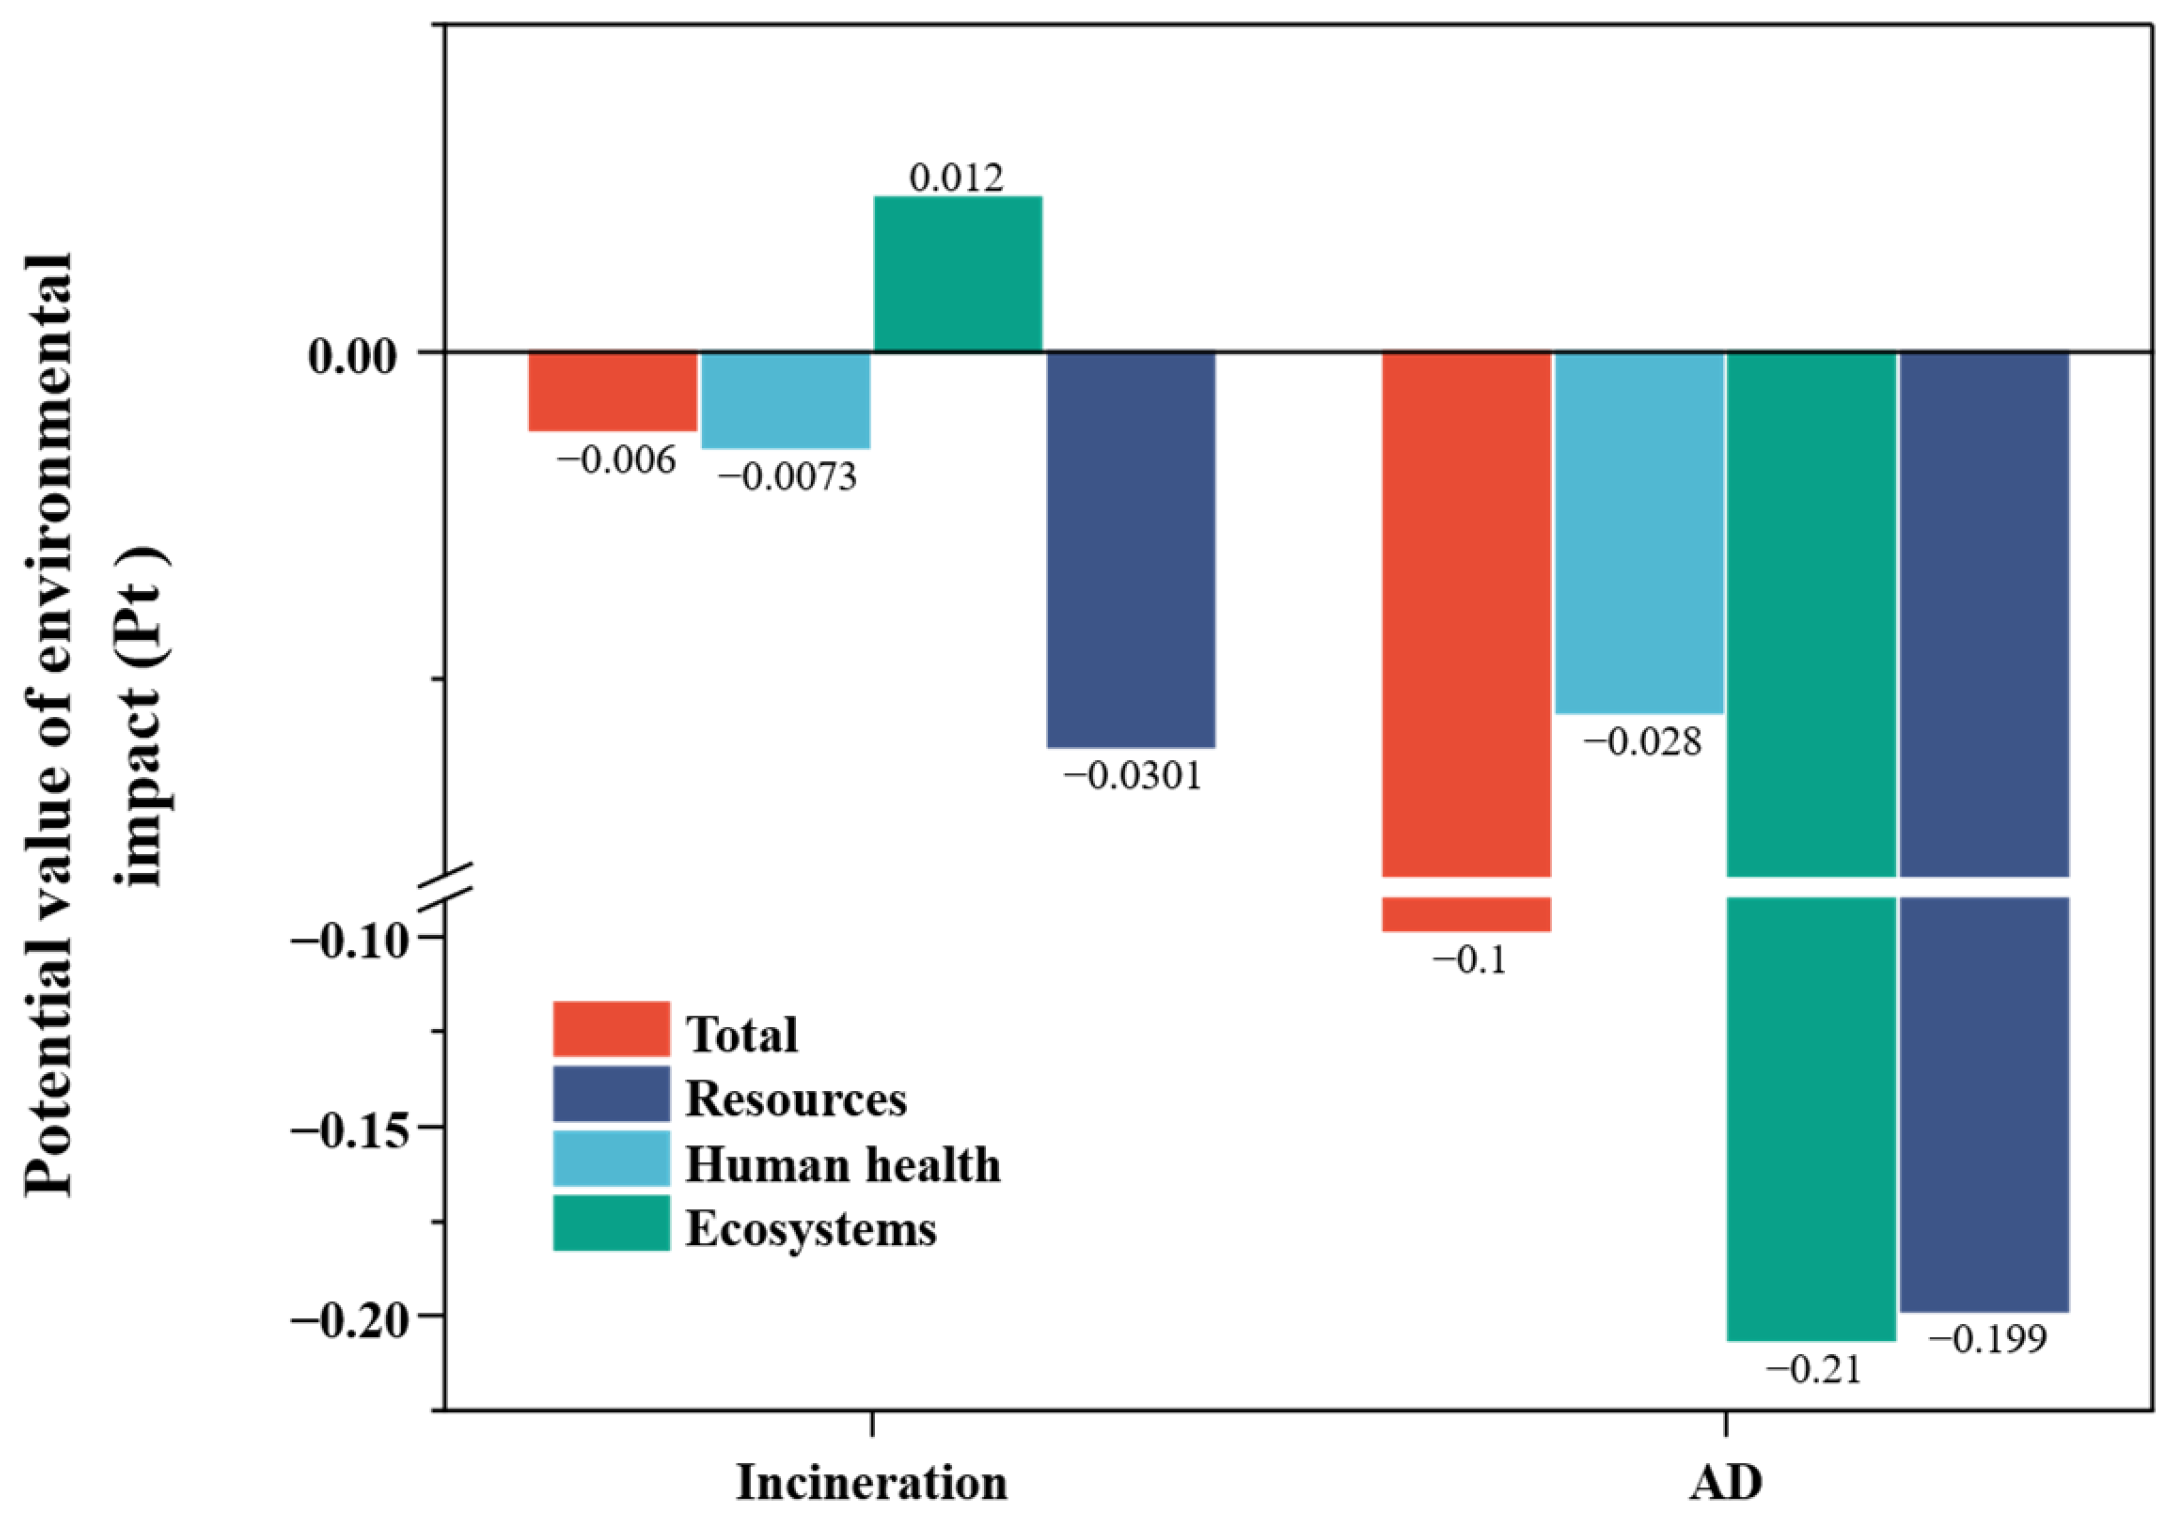
In the normalization step, normalization factors and weight factors are adopted based on China’s national conditions. Detailed numerical values and the rationale for factor selection are documented in our prior study [36]. The normalized results of the FW incineration and AD scenarios are presented in Figure 5.
As illustrated, the normalized results for both FW scenarios exhibit negative total values, indicating that both scenarios yield certain environmental benefits within Case study 2. Moreover, the FW AD scenario (−0.1 Pt) generates greater environmental benefits than the FW incineration scenario (−5.95 × 10⁻³ Pt) under the selected Chinese normalization and weighting framework.
Ecosystem impacts diverge significantly between the two FW treatment scenarios, with incineration generating a 0.012 Pt burden versus AD’s substantial benefit (−0.21 Pt). These endpoint values are interpreted only within the FW case study because the normalization and weighting factors are specific to China’s national context and are not directly comparable with the European-normalized results used for Case study 1.

3.2.6. Uncertainty Analysis and Sensitivity Analysis

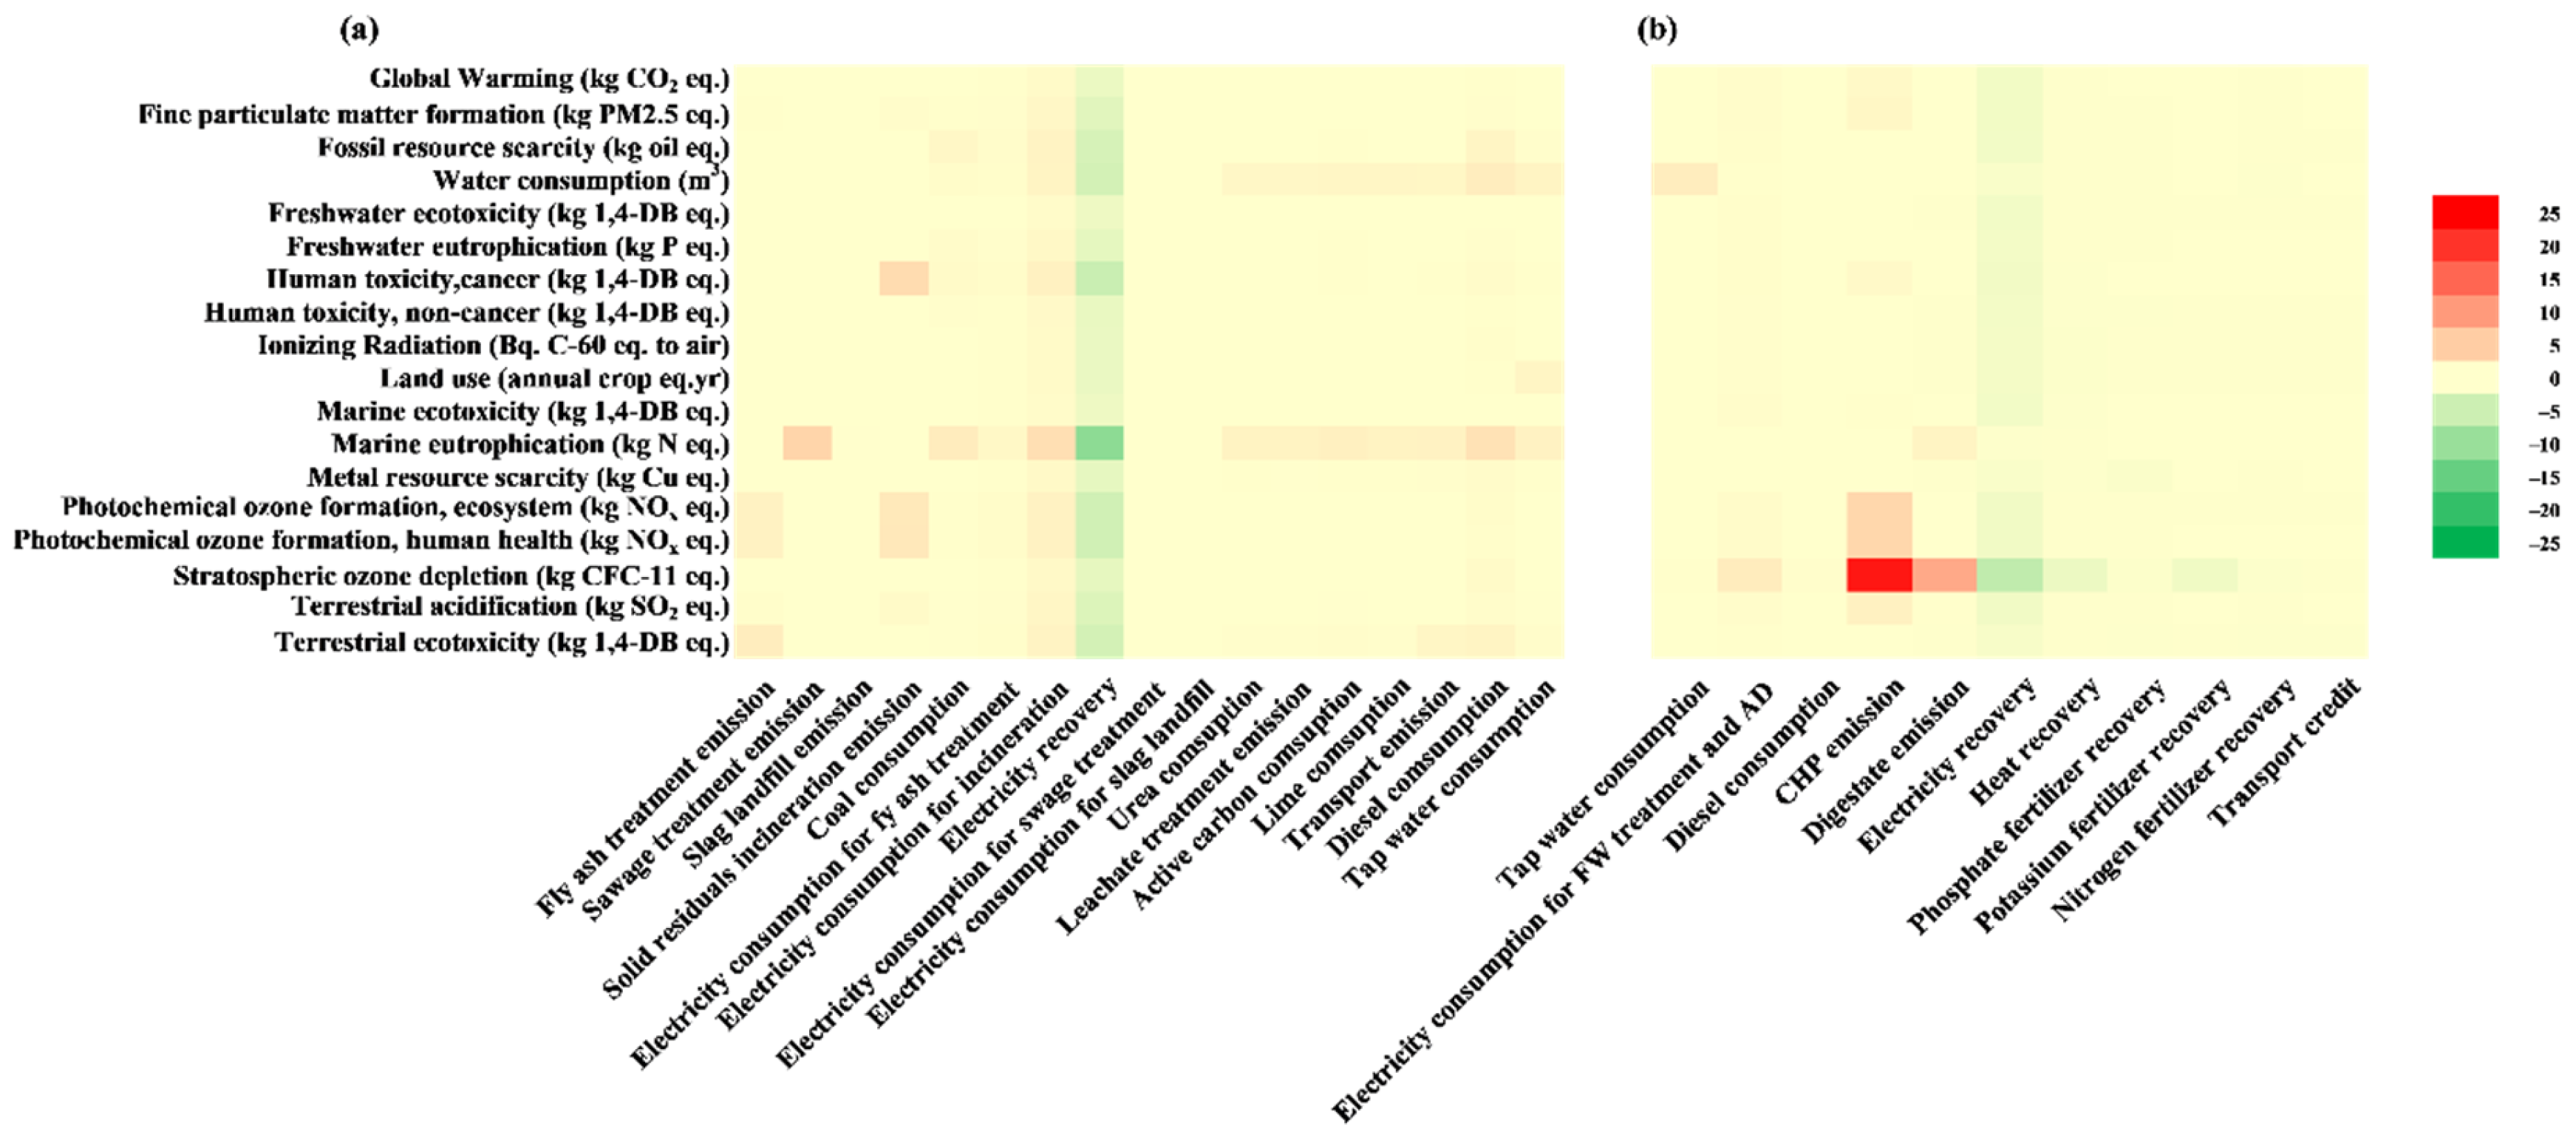
A comprehensive uncertainty analysis was conducted for all input parameters, and the results are represented by error bars in Figure 4. The analysis showed minor deviations (<10%), confirming the reliability of the LCA results. The relative importance of key parameters across scenarios is assessed and presented in Figure 6 through sensitivity analysis, for FW incineration (a), and FW AD scenario (b). Negative values indicate a decrease in process variables after parameter perturbations, while positive values indicate the opposite.
Among the inventory input parameters, including “CHP emissions”, “Digestate emissions”, “Solid residuals incineration emission”, “Electricity consumption for incineration”, and “Sewage treatment emissions” all exhibited positive sensitivity values, indicating their significant influence on environmental burdens. Specifically, “Solid residuals incineration emission” in the incineration scenario and “CHP emissions” in the AD scenario were identified as the most sensitive parameters.
Conversely, output parameters including recovered electricity, heat, and potassium fertilizer showed negative sensitivity, indicating a reduction in environmental burdens as their outputs increased. “Electricity recovery” emerged as the most sensitive parameter in both scenarios, aligning with the trends observed in Figure 4. Therefore, optimizing flue gas purification efficiency in both incineration and CHP processes, combined with improving energy conversion efficiency at power plants, would significantly reduce environmental impacts across multiple impact categories.

4. Conclusions

In the present work, LCA was used to evaluate two independent case studies: (a) sheep and goat manure management in Greece, comparing composting with AD, and (b) FW management in Beijing, China, comparing incineration/co-incineration with AD. The common aspect of these case studies was the assessment of AD technology for mitigating the environmental impacts in a small (i.e., Greece) and a large (i.e., China) country. AD is a common treatment of animal manures and FW due to their high biodegradability. Both countries exhibit intense agricultural activity with high amounts of agricultural and animal waste. Even today, the usual agricultural waste management practices in these countries are the burning of most of the agricultural residues in the field or their uncontrollably disposal into the environment or in landfills. The main conclusions of the case studies are presented below:
  • Case Study 1
Even though both categories present positive effects (expressed as negative damage) in the three damage categories namely resource scarcity, human health and ecosystem quality, AD negative damage values are higher compared to composting with the most significant effect occurring on human health (AD averts almost 0.016 Pt, while composting averts 0.0057 Pt).
  • Case Study 2
Within Case study 2, the incineration scenario demonstrates environmental benefits in 13 of 18 midpoint impact categories, whereas the AD scenario shows environmental benefits in 15 categories. Regarding endpoint damage categories, the incineration scenario achieves environmental benefits in resource scarcity and human health but imposes an ecosystem burden (+0.012 Pt). In contrast, the AD scenario generates environmental benefits across all three damage categories, with superior performance particularly evident in the ecosystem (−0.21 Pt). These results indicate that AD performs better than the selected incineration baseline for FW under the assumptions of the Beijing case study.
Overall, the within-case results indicate that AD performed favorably relative to the selected local conventional treatment option in both case studies, indicating once again the importance of using sustainable technologies to manage agricultural residues and thus mitigating the environmental impacts. This conclusion should not be interpreted as a direct numerical comparison between the Greek and Chinese systems, because the models differ in datasets, system boundaries, software tools, and normalization references. Rather, the combined findings suggest that AD can be environmentally competitive across different biodegradable residues and regional waste-management contexts when energy recovery is efficient and digestate management is properly controlled.

Supplementary Materials

The following supporting information can be downloaded at: https://www.mdpi.com/article/10.3390/resources15060078/s1, File S1: Calculated LCI by using the Ecoinvent database to convert input data into environmental emissions; File S2: Table S1: Life cycle inventory of food waste incineration scenario; Table S2: Life cycle inventory of food waste AD scenario.

Author Contributions

V.P.A.: writing—original draft, software, investigation, data curation. S.W.: writing—original draft, software, investigation, data curation. W.W.: writing—review and editing, supervision, methodology, conceptualization. V.G.P.: writing—review and editing, supervision, methodology, conceptualization. All authors have read and agreed to the published version of the manuscript.

Funding

This research received no external funding.

Data Availability Statement

The authors declare that the data supporting the findings of this study are available within the paper and its Supplementary Information Files.

Conflicts of Interest

Author Vasiliki P. Aravani was employed by the company LCA/EPD Services Group. Author Shiya Wang was employed by the company Sinochem Environment Science & Technology Engineering Co., Ltd. The remaining authors declare that the research was conducted in the absence of any commercial or financial relationships that could be construed as a potential conflict of interest.

References

  1. Li, Y.; Achinas, S.; Zhao, J.; Geurkink, B.; Krooneman, J.; Euverink, G.J.W. Co-digestion of cow and sheep manure: Performance evaluation and relative microbial activity. Renew. Energy 2020, 153, 553–563. [Google Scholar] [CrossRef]
  2. Imeni, S.M.; Pelaz, L.; Corchado-Lopo, C.; Busquets, A.M.; Ponsá, S.; Colón, J. Techno-economic assessment of anaerobic co-digestion of livestock manure and cheese whey (Cow, Goat & Sheep) at small to medium dairy farms. Bioresour. Technol. 2019, 291, 121872. [Google Scholar]
  3. Vlyssides, A.; Mai, S.; Barampouti, E.M. Energy generation potential in Greece from agricultural residues and livestock manure by anaerobic digestion technology. Waste Biomass Valorization 2015, 6, 747–757. [Google Scholar] [CrossRef]
  4. Aravani, V.P.; Sun, H.; Yang, Z.; Liu, G.; Wang, W.; Anagnostopoulos, G.; Syriopoulos, G.; Charisiou, N.D.; Goula, M.A.; Kornaros, M.; et al. Agricultural and livestock sector’s residues in Greece & China: Comparative qualitative and quantitative characterization for assessing their potential for biogas production. Renew. Sustain. Energy Rev. 2022, 154, 111821. [Google Scholar]
  5. Skoulou, V.; Zabaniotou, A. Investigation of agricultural and animal wastes in Greece and their allocation to potential application for energy production. Renew. Sustain. Energy Rev. 2007, 11, 1698–1719. [Google Scholar] [CrossRef]
  6. Zhong, Y.; Yang, W.; Zhuo, Q.; Cao, Z.; Chen, Q.; Xiao, L. Research Progress on Heavy Metal Passivators and Passivation Mechanisms of Organic Solid Waste Compost: A Review. Fermentation 2024, 10, 88–101. [Google Scholar] [CrossRef]
  7. Ding, Y.; Zhao, J.; Liu, J.-W.; Zhou, J.; Cheng, L.; Zhao, J.; Shao, Z.; Iris, Ç.; Pan, B.; Li, X.; et al. A review of China’s municipal solid waste (MSW) and comparison with international regions: Management and technologies in treatment and resource utilization. J. Clean. Prod. 2021, 293, 126144. [Google Scholar] [CrossRef]
  8. Kaza, S.; Yao, L.; Bhada-Tata, P.; Woerden, F. What a Waste 2.0: A Global Snapshot of Solid Waste Management to 2050; The World Bank: Washington, DC, USA, 2018; pp. 1–16. [Google Scholar]
  9. Xue, X. Regulation of Heat and Mass Transfer During the Organic Solid Waste Pyrolysis Process. Ph.D. Thesis, Taiyuan University of Technology, Taiyuan, China, 2022. [Google Scholar]
  10. Liu, G. Study on Typical Organic Solid Waste Synergistic Pyrolysis Simulation and Evaluation of Resource and Environmental Effects. Master’s Thesis, Huazhong University of Science & Technology, Wuhan, China, 2022. [Google Scholar]
  11. Yang, J.; Chen, B. Global warming impact assessment of a crop residue gasification project—A dynamic LCA perspective. Appl. Energy 2014, 122, 269–279. [Google Scholar] [CrossRef]
  12. Tong, H.; Shen, Y.; Zhang, J.; Wang, C.-H.; Ge, T.S.; Tong, Y.W. A comparative life cycle assessment on four waste-to-energy scenarios for food waste generated in eateries. Appl. Energy 2018, 225, 1143–1157. [Google Scholar]
  13. Samer, M.; Hijazi, O.; Abdelsalam, E.M.; El-Hussein, A.; Attia, Y.A.; Yacoub, I.H.; Bernhardt, H. Life cycle assessment of using laser treatment and nanomaterials to produce biogas through anaerobic digestion of slurry. Environ. Dev. Sustain. 2021, 23, 14683–14696. [Google Scholar] [CrossRef]
  14. Yang, D.; Hua, Y.; Wu, B.; Dai, X. Consideration on development of organic solid waste resource treatment and disposal technology under the background of double carbon. Environ. Eng. 2022, 40, 1–8. [Google Scholar]
  15. Tukker, A. Life cycle assessment as a tool in environmental impact assessment. Environ. Impact Assess. Rev. 2000, 20, 435–456. [Google Scholar] [CrossRef]
  16. Mayer, F.; Bhandari, R.; Gäth, S. Critical review on life cycle assessment of conventional and innovative waste-to-energy technologies. Sci. Total Environ. 2019, 672, 708–721. [Google Scholar]
  17. Zhang, Q.; Wang, S.; Sun, H.; Arhin, S.G.; Yang, Z.; Liu, G.; Tong, Y.W.; Tian, H.; Wang, W. Anaerobic digestion pyrolysis integrated system for food waste treatment achieving both environmental and economic benefits. Energy 2024, 288, 129856. [Google Scholar]
  18. Arshad, M.Y.; Saeed, S.; Raza, A.; Ahmad, A.S.; Urbanowska, A.; Jackowski, M.; Niedzwiecki, L. Integrating Life Cycle Assessment and Machine Learning to Enhance Black Soldier Fly Larvae-Based Composting of Kitchen Waste. Sustainability 2023, 15, 12475. [Google Scholar] [CrossRef]
  19. Jin, C.; Sun, S.; Yang, D.; Sheng, W.; Ma, Y.; He, W.; Li, G. Anaerobic digestion: An alternative resource treatment option for food waste in China. Sci. Total Environ. 2021, 779, 146397. [Google Scholar] [PubMed]
  20. ISO 14044:2006; Environmental Management—Life Cycle Assessment—Requirements and Guidelines. International Organization for Standardization: Geneva, Switzerland, 2006.
  21. Adams, P.W.R.; McManus, M.C. Small-scale biomass gasification CHP utilisation in industry: Energy and environmental evaluation. Sustain. Energy Technol. Assess. 2014, 6, 129–140. [Google Scholar]
  22. Batuecas, E.; Tommasi, T.; Battista, F.; Negro, V.; Sonetti, G.; Viotti, P.; Fino, D.; Mancini, G. Life Cycle Assessment of waste disposal from olive oil production: Anaerobic digestion and conventional disposal on soil. J. Environ. Manag. 2019, 237, 94–102. [Google Scholar] [CrossRef]
  23. Wernet, G.; Bauer, C.; Steubing, B.; Reinhard, J.; Moreno-Ruiz, E.; Weidema, B. The ecoinvent database version 3 (part I): Overview and methodology. Int. J. Life Cycle Assess. 2016, 21, 1218–1230. [Google Scholar] [CrossRef]
  24. Tziolas, E.; Bournaris, T. Economic and Environmental Assessment of Agro-Energy Districts in Northern Greece: A Life Cycle Assessment Approach. BioEnergy Res. 2019, 12, 1145–1162. [Google Scholar]
  25. Huijbregts, M.A.J.; Steinmann, Z.J.N.; Elshout, P.M.F.; Stam, G.; Verones, F.; Vieira, M.; Zijp, M.; Hollander, A.; van Zelm, R. ReCiPe2016: A harmonised life cycle impact assessment method at midpoint and endpoint level. Int. J. Life Cycle Assess. 2017, 22, 138–147. [Google Scholar] [CrossRef]
  26. Alnhoud, O.T.; Al-Harahsheh, A.M.; Al-Harahsheh, M.S.; Irshaid, F.I. Animal solid waste as a potential renewable biomass energy source: A case study of Jordan. Biomass Convers. Biorefinery 2021, 13, 6807–6816. [Google Scholar] [CrossRef]
  27. Chávez-Fuentes, J.J.; Capobianco, A.; Barbušová, J.; Hutňan, M. Manure from our agricultural animals: A quantitative and qualitative analysis focused on biogas production. Waste Biomass Valorization 2017, 8, 1749–1757. [Google Scholar] [CrossRef]
  28. Li, D.; Yuan, J.; Ding, J.; Wang, H.; Shen, Y.; Li, G. Effects of carbon/nitrogen ratio and aeration rate on the sheep manure composting process and associated gaseous emissions. J. Environ. Manag. 2022, 323, 116093. [Google Scholar] [CrossRef] [PubMed]
  29. Paolini, V.; Petracchini, F.; Segreto, M.; Tomassetti, L.; Naja, N.; Cecinato, A. Environmental impact of biogas: A short review of current knowledge. J. Environ. Sci. Health Part A 2018, 53, 899–906. [Google Scholar] [CrossRef] [PubMed]
  30. Lübken, M.; Wichern, M.; Schlattmann, M.; Gronauer, A.; Horn, H. Modelling the energy balance of an anaerobic digester fed with cattle manure and renewable energy crops. Water Res. 2007, 41, 4085–4096. [Google Scholar] [CrossRef] [PubMed]
  31. Teleszewski, T.J.; Żukowski, M. Analysis of heat loss of a biogas anaerobic digester in weather conditions in Poland. J. Ecol. Eng. 2018, 19, 242–250. [Google Scholar] [CrossRef]
  32. Boldrin, A.; Andersen, J.K.; Møller, J.; Christensen, T.H.; Favoino, E. Composting and compost utilization: Accounting of greenhouse gases and global warming contributions. Waste Manag. Res. 2009, 27, 800–812. [Google Scholar]
  33. Curran, M.A. Life Cycle Assessment Handbook: A Guide for Environmentally Sustainable Products; John Wiley & Sons: Hoboken, NJ, USA, 2012. [Google Scholar]
  34. Tsigkou, K.; Tsafrakidou, P.; Kopsahelis, A.; Zagklis, D.; Zafiri, C.; Kornaros, M. Used disposable nappies and expired food products valorisation through one- & two-stage anaerobic co-digestion. Renew. Energy 2020, 147, 610–619. [Google Scholar] [CrossRef]
  35. Yang, Z.; Liu, Y.; Zhang, J.; Mao, K.; Kurbonova, M.; Liu, G.; Zhang, R.; Wang, W. Improvement of biofuel recovery from food waste by integration of anaerobic digestion, digestate pyrolysis and syngas biomethanation under mesophilic and thermophilic conditions. J. Clean. Prod. 2020, 256, 120594. [Google Scholar] [CrossRef]
  36. Aravani, V.P.; Wang, S.; Wang, W.; Papadakis, V.G. LCA analysis on the management of typical lignocellulosic agricultural wastes: Case studies and comparison in Greece and China. Biomass Bioenergy 2024, 190, 107386. [Google Scholar] [CrossRef]
  37. Ding, X.; Jiang, Z.; Wang, Y.; Han, S.; Zhang, H. Exploration and Analysis of Major Domestic Kitchen Waste Treatment Technology Models. Technol. Innov. Appl. 2020, 6–11. [Google Scholar]
  38. Wang, D.; Gong, A.; Zhang, Z.; Mao, Y.; Zhou, L. Treatment Status and Developmental Trend of Food Residue in Beijing. Environ. Sanit. Eng. 2010, 18, 24–26. [Google Scholar]
  39. Yu, M. Enhanced Ethanol-Type Fermentation of Food Waste Anaerobic Digestion System: Performance and Regulation Mechanism. Ph.D. Thesis, University of Science and Technology Beijing, Beijing, China, 2019. [Google Scholar]
  40. De Klein, C.; Novoa, R.S.A.; Ogle, S.; Smith, K.; Rochette, P.; Wirth, T.C.; Mcconkey, B.G.; Mosier, A.; Rypdal, K. N2O Emissions from Managed Soils, and CO2 Emissions from Lime and Urea Application. In 2006 IPCC Guidelines for National Greenhouse Gas Inventories; IPCC: Geneva, Switzerland, 2006. [Google Scholar]
  41. Yu, Q.; Li, H. Life cycle environmental performance of two restaurant food waste management strategies at Shenzhen, China. J. Mater. Cycles Waste Manag. 2021, 23, 826–839. [Google Scholar] [CrossRef]
  42. Lee, S.-H.; Choi, K.-I.; Osako, M.; Dong, J.-I. Evaluation of environmental burdens caused by changes of food waste management systems in Seoul, Korea. Sci. Total Environ. 2007, 387, 42–53. [Google Scholar] [CrossRef]
  43. Zhao, X.; Lian, L.; Zhang, G.; Zhu, Y.; Gu, J. Research on the technology of the first domestic cement kiln collaborative disposal fly ash demonstration line. China Cem. 2015, 69–72. [Google Scholar]
  44. Kua, H.W.; He, X.; Tian, H.; Goel, A.; Xu, T.; Liu, W.; Yao, D.; Ramachandran, S.; Liu, X.; Tong, Y.W.; et al. Life cycle climate change mitigation through next-generation urban waste recovery systems in high-density Asian cities: A Singapore Case Study. Resour. Conserv. Recycl. 2022, 181, 106265. [Google Scholar]
  45. Khoshnevisan, B.; Tsapekos, P.; Alvarado-Morales, M.; Rafiee, S.; Tabatabaei, M.; Angelidaki, I. Life cycle assessment of different strategies for energy and nutrient recovery from source sorted organic fraction of household waste. J. Clean. Prod. 2018, 180, 360–374. [Google Scholar] [CrossRef]
  46. Zhang, J.; Tian, H.; Wang, X.; Tong, Y.W. Effects of activated carbon on mesophilic and thermophilic anaerobic digestion of food waste: Process performance and life cycle assessment. Chem. Eng. J. 2020, 399, 125757. [Google Scholar] [CrossRef]
  47. Nielsen, M.; Nielsen, O.-K.; Thomsen, M. Emissions from Decentralised CHP Plants 2007—Energinet.dk Environmental Project No. 07/1882; National Environmental Research Institute: Roskilde, Denmark, 2010. [Google Scholar]
  48. Tian, H.; Wang, X.; Lim, E.Y.; Lee, J.T.E.; Ee, A.W.L.; Zhang, J.; Tong, Y.W. Life cycle assessment of food waste to energy and resources: Centralized and decentralized anaerobic digestion with different downstream biogas utilization. Renew. Sustain. Energy Rev. 2021, 150, 111489. [Google Scholar] [CrossRef]
  49. Bernstad, A.; la Cour Jansen, J. A life cycle approach to the management of household food waste—A Swedish full-scale case study. Waste Manag. 2011, 31, 1879–1896. [Google Scholar] [CrossRef]
  50. Tampio, E.; Marttinen, S.; Rintala, J. Liquid fertilizer products from anaerobic digestion of food waste: Mass, nutrient and energy balance of four digestate liquid treatment systems. J. Clean. Prod. 2016, 125, 22–32. [Google Scholar] [CrossRef]
  51. Hong, J.; Shaked, S.; Rosenbaum, R.K.; Jolliet, O. Analytical uncertainty propagation in life cycle inventory and impact assessment: Application to an automobile front panel. Int. J. Life Cycle Assess. 2010, 15, 499–510. [Google Scholar] [CrossRef]
  52. Hansen, T.L.; Bhander, G.S.; Christensen, T.H.; Bruun, S.; Jensen, L.S. Life cycle modelling of environmental impacts of application of processed organic municipal solid waste on agricultural land (Easewaste). Waste Manag. Res. 2006, 24, 153–166. [Google Scholar] [CrossRef] [PubMed]
  53. Kaur, H.; Kommalapati, R.R. Biochemical Methane Potential and Kinetic Parameters of Goat Manure at Various Inoculum to Substrate Ratios. Sustainability 2021, 13, 12806. [Google Scholar] [CrossRef]
  54. Awasthi, S.K.; Kumar, M.; Sarsaiya, S.; Ahluwalia, V.; Chen, H.; Kaur, G.; Sirohi, R.; Sindhu, R.; Binod, P.; Pandey, A. Multi-Criteria Research Lines on Livestock Manure Biorefinery Development towards a Circular Economy: From the Perspective of a Life Cycle Assessment and Business Models Strategies. J. Clean. Prod. 2022, 341, 130862. [Google Scholar] [CrossRef]
  55. Prapaspongsa, T.; Christensen, P.; Schmidt, J.H.; Thrane, M. LCA of Comprehensive Pig Manure Management Incorporating Integrated Technology Systems. J. Clean. Prod. 2010, 18, 1413–1422. [Google Scholar] [CrossRef]
  56. Cherubini, E.; Zanghelini, G.M.; Alvarenga, R.A.F.; Franco, D.; Soares, S.R. Life Cycle Assessment of Swine Production in Brazil: A Comparison of Four Manure Management Systems. J. Clean. Prod. 2015, 87, 68–77. [Google Scholar] [CrossRef]
  57. Aguirre-Villegas, H.A.; Larson, R.A. Evaluating Greenhouse Gas Emissions from Dairy Manure Management Practices Using Survey Data and Lifecycle Tools. J. Clean. Prod. 2017, 143, 169–179. [Google Scholar] [CrossRef]
  58. Font-Palma, C. Methods for the Treatment of Cattle Manure—A Review. C 2019, 5, 27. [Google Scholar] [CrossRef]
  59. Esteves, E.M.M.; Herrera, A.M.N.; Esteves, V.P.P.; Morgado, C.d.R.V. Life Cycle Assessment of Manure Biogas Production: A Review. J. Clean. Prod. 2019, 219, 411–423. [Google Scholar] [CrossRef]
  60. Ramírez-Islas, M.E.; Güereca, L.P.; Sosa-Rodriguez, F.S.; Cobos-Peralta, M.A. Environmental Assessment of Energy Production from Anaerobic Digestion of Pig Manure at Medium-Scale Using Life Cycle Assessment. Waste Manag. 2020, 102, 85–96. [Google Scholar] [CrossRef]
  61. Li, J.; Zheng, H.; Li, J.; Ye, M.; Yang, Y. Research on environmental impact of municipal domestic waste incineration process based on life cycle assessment. Environ. Pollut. Control 2022, 44, 1209–1215. [Google Scholar]
Figure 1. Flowchart diagram of management scenarios for sheep and goat manure: (a) composting and (b) AD.
Resources 15 00078 g001
Figure 2. System boundaries. Scenario (a): Incineration of FW. Scenario (b): AD of FW.
Resources 15 00078 g002
Figure 3. Normalized damage categories per FU.
Resources 15 00078 g003
Figure 4. The environmental impacts of the incineration scenario and AD scenario of FW.
Resources 15 00078 g004
Figure 5. Normalized damage categories per FU.
Resources 15 00078 g005
Figure 6. Sensitivity analysis of key operational parameters on environmental impacts. (a) FW incineration scenario, (b) FW AD scenario.
Resources 15 00078 g006
Table 1. Data used for the analysis collected from literature.
ParameterValueReference
Characteristics of sheep and goat manure
N [kg]5.86[26,27]
P [kg]3[27]
K [kg]7[27]
TS [kg]183.30[4]
VS [kg]159.47[4]
Moisture [kg]816.70[4]
C [kg]58.20[26]
H [kg]8.61[26]
O [kg]58.44[26]
S [kg]0.18[26]
Ash [kg]53.71[26]
Elemental balances during composting
CH4-C (carbon balance %)0.05[28]
NH3-N (nitrogen balance %)4.63[28]
AD of sheep and goat manure
CH4 [kg]24.15[1]
N in digestate [kg]5.86[26,27]
P in digestate [kg]3[27]
K in digestate [kg]7[27]
Other
CO emissions from biogas burning [kg/MJ]2.83 × 10−4[29]
SO2 emissions from biogas burning [kg/MJ]0.25 × 10−4[29]
NOx emissions from biogas burning [kg/MJ]3.71 × 10−4[29]
NMVOC emissions from biogas burning [kg/MJ]0.16 × 10−4[29]
CH2O (Formaldehyde) emissions from biogas burning [kg/MJ]0.11 × 10−4[29]
Stirring power [kW/m3]5 × 10−3[30]
Heat transfer coefficient [W/m2/K]0.35[31]
Distance of AD from manure and fields [km]15Minimum distance in Achaia Prefecture
Substitution coefficient for N fertilizer0.40[32]
Substitution coefficient for P fertilizer0.95[32]
Substitution coefficient for K fertilizer1[32]
Table 2. Input data for the Scenario I per FU (sheep and goat manure composting) [4,26,27].
ParameterSheep and Goat Manure CompostingSD
Emissions to air [kg]
CH40.0020.0002
NH30.0020.0002
Transport
Total (tkm)303
Avoided products [kg]
Fertilizer N equivalent2.3440.234
Fertilizer P2O5 equivalent6.5260.653
Fertilizer K2O equivalent8.4360.844
Table 3. Input data for the Scenario II per FU (AD of sheep and goat manure).
ParameterAD of Sheep and Goat ManureSD
Transport
Total [tkm]303
Biogas burning [MJ]
Total Energy 1340.240 134.024
Electric Energy 495.88949.589
Emissions to Air [kg]
CO0.3680.037
SO20.0320.003
NOX0.4820.048
NMVOCs0.0210.002
CH2O (Formaldehyde)0.0150.001
Avoided products
Electricity [MJ]484.28948.429
Fertilizer N equivalent [kg]2.3450.235
Fertilizer P2O5 equivalent [kg]6.5260.653
Fertilizer K2O equivalent [kg]8.4360.844
Table 4. Characterization and damage assessment results of the sheep and goat manure under different scenarios (FU: 1 t).
Impact CategoryUnitCompostingAD
Characterization Midpoint
Global warmingkg CO2 eq−6.24 × 101−1.64 × 10²
Stratospheric ozone depletionkg CFC11 eq−1.40 × 10⁻⁴−1.80 × 10⁻⁴
Ionizing radiationkBq Co−60 eq−3.58 × 100−5.95 × 100
Ozone formation, human healthkg NOx eq−1.14 × 10−12.35 × 10−1 *
Fine particulate matter formationkg PM2.5 eq−1.13 × 10⁻¹−2.49 × 10⁻¹
Ozone formation, terrestrial ecosystemskg NOx eq−1.16 × 10−11.37 × 100 *
Terrestrial acidificationkg SO2 eq−4.37 × 10⁻¹−1.47 × 10⁻¹ *
Freshwater eutrophicationkg P eq−1.28 × 10⁻²−2.39 × 10⁻¹
Marine eutrophicationkg N eq−2.97 × 10⁻³−1.67 × 10⁻²
Terrestrial ecotoxicitykg 1,4—DCB−1.25 × 10²−2.51 × 10²
Freshwater ecotoxicitykg 1,4—DCB−3.60 × 10⁻¹−5.97 × 100
Marine ecotoxicitykg 1,4—DCB−5.39 × 10⁻¹−8.33 × 100
Human carcinogenic toxicitykg 1,4—DCB−4.90 × 10⁻¹−1.08 × 101
Human non-carcinogenic toxicitykg 1,4—DCB−2.15 × 101−2.53 × 10²
Land usem2a crop eq−2.34 × 100−2.55 × 100
Mineral resource scarcitykg Cu eq−9.18 × 10⁻¹−9.20 × 10⁻¹
Fossil resource scarcitykg oil eq−2.10 × 101−5.42 × 101
Water consumptionm3−1.20 × 100−1.74 × 100
Conversion to Endpoint units
Global warming, human healthDALY−5.80 × 10⁻⁵−1.50 × 10⁻⁴
Global warming, terrestrial ecosystemsspecies.yr−1.70 × 10⁻⁷−4.60 × 10⁻⁷
Global warming, freshwater ecosystemsspecies.yr−4.80 × 10⁻¹²−1.30 × 10⁻¹¹
Stratospheric ozone depletionDALY−7.20 × 10⁻⁸−9.40 × 10⁻⁸
Ionizing radiationDALY−3.00 × 10⁻⁸−5.00 × 10⁻⁸
Ozone formation, human healthDALY−1.00 × 10−75.66 × 10−9
Fine particulate matter formationDALY−7.10 × 10⁻⁵−1.40 × 10⁻⁴
Ozone formation, terrestrial ecosystemsspecies.yr−1.50 × 10−81.03 × 10−7
Terrestrial acidificationspecies.yr−9.30 × 10−88.90 × 10−9
Freshwater eutrophicationspecies.yr−8.60 × 10⁻⁹−1.60 × 10⁻⁷
Marine eutrophicationspecies.yr−5.10 × 10⁻¹²−2.80 × 10⁻¹¹
Terrestrial ecotoxicityspecies.yr−1.40 × 10⁻⁹−2.90 × 10⁻⁹
Freshwater ecotoxicityspecies.yr−2.50 × 10⁻¹⁰−4.10 × 10⁻⁹
Marine ecotoxicityspecies.yr−5.70 × 10⁻¹¹−8.80 × 10⁻¹⁰
Human carcinogenic toxicityDALY−1.60 × 10⁻⁶−3.60 × 10⁻⁵
Human non-carcinogenic toxicityDALY−4.90 × 10⁻⁶−5.80 × 10⁻⁵
Land usespecies.yr−2.10 × 10⁻⁸−2.30 × 10⁻⁸
Mineral resource scarcityUSD2013−2.12 × 10⁻¹−2.13 × 10⁻¹
Fossil resource scarcityUSD2013−7.32 × 100−1.18 × 101
Water consumption, human healthDALY−1.80 × 10⁻⁶−2.30 × 10⁻⁶
Water consumption, terrestrial ecosystemspecies.yr−1.10 × 10⁻⁸−1.50 × 10⁻⁸
Water consumption, aquatic ecosystemsspecies.yr−4.90 × 10⁻¹³−8.20 × 10⁻¹³
Damage assessment
Human healthDALY−1.40 × 10⁻⁴−3.90 × 10⁻⁴
Ecosystemsspecies.yr−3.20 × 10⁻⁷−5.60 × 10⁻⁷
ResourcesUSD2013−7.54 × 100−1.20 × 101
* The values in bold represent the cases where the AD had higher midpoint impact compared to composting.
Table 5. LCI of FW incineration scenario. Values were presented as per FU.
ParameterUnitPractical/Calculated ValueDescription/Reference
Input
FWt1FU
Dieselkg1.11Enterprise Data
ElectricitykWh100.46Enterprise Data
Activated carbonkg0.61Enterprise Data
Hydrated limekg7.61Enterprise Data
Ureakg1.06Enterprise Data
Output
Electricity kWh161.11Calculated
Leachatekg313[42]
Slagt0.2[41]
Fly ashkg26[41]
Table 6. LCI of FW AD scenario. Values were presented as per FU.
ParameterUnitPractical/Calculated ValueDescription/Reference
InputFWt1FU
FW pretreatment ElectricitykWh25[44]
AD ElectricitykWh50Calculated
Inoculum and tap water t2.57Experimental data
Biofertilizer transportkm3.4Google map
Diesel MJ77.55[45,49]
OutputElectricitykWh313.02Calculated
HeatkWh369.20Calculated
Digestatet3.42Experimental data
Table 7. Midpoint impact assessment results of different scenarios (FU: 1 t).
Impact CategoryUnitIncinerationAD
Global warmingkg CO2 eq.−9.54 × 101 a−2.71 × 10²
Stratospheric ozone depletionkg CFC-11 eq.−1.52 × 10−58.35 × 10−6
Ionizing radiation Bq. C-60 eq. to air−1.35 × 100 a−5.21 × 100
Photochemical ozone formation, human healthkg Nox eq.1.10 × 10−1 a−5.60 × 10⁻¹
Fine particulate matter formation kg PM2.5 eq.−9.00 × 10⁻² a−4.00 × 10⁻¹
Photochemical ozone formation, ecosystemkg Nox eq.1.10 × 10−1 a−5.60 × 10⁻¹
Terrestrial acidification kg SO2 eq.−1.70 × 10⁻¹ a−7.90 × 10⁻¹
Freshwater eutrophication kg P eq.−1.32 × 10⁻² a−5.91 × 10⁻²
Marine eutrophication kg N eq.1.98 × 10−42.97 × 10⁻²
Terrestrial ecotoxicity kg 1,4—DB eq.1.90 × 101 a−2.13 × 10²
Freshwater ecotoxicitykg 1,4—DB eq.−3.16 × 100 a−8.38 × 100
Marine ecotoxicity kg 1,4—DB eq.−3.77 × 100 a−1.01 × 101
Human carcinogenic toxicitykg 1,4—DB eq.1.30 × 100 a−1.02 × 101
Human non-carcinogenic toxicitykg 1,4—DB eq.−4.45 × 101 a−1.70 × 10²
Land useannual crop eq. yr−8.86 × 10⁻¹ a−5.29 × 100
Mineral resource scarcitykg Cu eq.−5.00 × 10⁻² a−3.70 × 10⁻¹
Fossil resource scarcitykg oil eq.−1.23 × 101 a−8.08 × 101
Water consumptionm3−1.10 × 10−11.45 × 100
a: Categories where FW incineration scenarios underperform relative to AD.
Table 8. Endpoint impact assessment results of different scenarios (FU: 1 t).
Impact CategoryUnitIncinerationAD
Global warming, human healthDALY−8.85 × 10⁻⁵−2.51 × 10⁻⁴
Global warming, terrestrial ecosystemsspecies.yr−2.67 × 10⁻⁷−7.59 × 10⁻⁷
Global warming, freshwater ecosystemsspecies.yr−7.30 × 10⁻¹²−2.07 × 10⁻¹¹
Stratospheric ozone depletion, human healthDALY−8.07 × 10−94.43 × 10−9
Ionizing radiation, human healthDALY−1.15 × 10⁻⁸−4.43 × 10⁻⁸
Photochemical ozone formation, human healthDALY1.00 × 10−7−5.10 × 10⁻⁷
Fine particulate matter formation, human healthDALY−5.66 × 10⁻⁵−2.52 × 10⁻⁴
Photochemical ozone formation, terrestrial ecosystemsspecies.yr1.42 × 10−8−7.22 × 10⁻⁸
Terrestrial acidification species.yr−3.60 × 10⁻⁸−1.67 × 10⁻⁷
Freshwater eutrophication species.yr−8.06 × 10⁻⁹−3.61 × 10⁻⁸
Marine eutrophication species.yr3.37 × 10−134.74 × 10⁻¹¹
Terrestrial ecotoxicity species.yr1.02 × 10−6−1.15 × 10⁻⁵
Freshwater ecotoxicityspecies.yr−2.20 × 10⁻⁹−5.82 × 10⁻⁹
Marine ecotoxicity species.yr−3.96 × 10⁻¹⁰−1.06 × 10⁻⁹
Human carcinogenic toxicity DALY4.32 × 10−6−3.39 × 10⁻⁵
Human non-carcinogenic toxicityDALY−2.96 × 10⁻⁷−1.13 × 10⁻⁶
Land usespecies.yr−7.87 × 10⁻⁹−4.70 × 10⁻⁸
Mineral resource scarcityMJ−1.16 × 10⁻²−8.55 × 10⁻²
Fossil resource scarcityMJ−5.62 × 100−3.69 × 101
Water consumption—human healthDALY−2.44 × 10−73.22 × 10−3
Water consumption—terrestrial ecosystemsspecies.yr−1.49 × 10−91.96 × 10−8
Water consumption—aquatic ecosystemsspecies.yr−6.64 × 10−148.76 × 10⁻¹³
Damage assessment
Human healthDALY−1.41 × 10⁻⁴−5.35 × 10⁻⁴
Ecosystemsspecies.yr7.15 × 10−7−1.25 × 10⁻⁵
ResourcesMJ−7.44 × 101−4.90 × 10²
Disclaimer/Publisher’s Note: The statements, opinions and data contained in all publications are solely those of the individual author(s) and contributor(s) and not of MDPI and/or the editor(s). MDPI and/or the editor(s) disclaim responsibility for any injury to people or property resulting from any ideas, methods, instructions or products referred to in the content.