Article

Comparing Microclimate Conditions Induced by Semi-Transparent and Conventional Agrivoltaic Systems and Their Effects on Arugula Response (Eruca vesicaria) in Southern Italy

by
Hiba Chebli
1,2,*,
Giovanna Dragonetti
2 and
Abdelouahid Fouial
2
1
Department of Agriculture, Food, Natural Resources, and Engineering, University of Foggia, Via Napoli, 25, 71122 Foggia, Italy
2
The Mediterranean Agronomic Institute of Bari (CIHEAM Bari), Via Ceglie 9, 70010 Valenzano, Italy
*
Author to whom correspondence should be addressed.
Resources 2026, 15(2), 33; https://doi.org/10.3390/resources15020033
Submission received: 17 December 2025 / Revised: 13 February 2026 / Accepted: 14 February 2026 / Published: 23 February 2026

Abstract

Agrivoltaic Systems (AV) constitute a viable alternative to mitigate land-use competition by enabling the simultaneous production of agricultural crops and solar photovoltaic energy. However, the heterogeneous shading and microclimatic modifications induced by AV systems can alter solar radiation, crop physiological performance, and, consequently, its biomass. This study evaluated the effects of two static ground-mounted AV systems—semi-transparent (ST) and conventional opaque (CON) panels—on the growth, physiology, soil water variations, and yield of Arugula (Eruca vesicaria) cultivated in southern Italy from August to October 2022; compared with an open-field control (REF). Daily soil temperature and water content were monitored, alongside leaf-level gas exchange measurements at three vegetative stages. Global solar radiation was reduced by 70% under ST and 80% under CON, reducing Photosynthetically Active Radiation (PAR), transpiration, and net photosynthesis, while leaf water use efficiency remained comparable to REF. Sequential harvests showed that although yields were consistently highest in REF, ST 50% and CON 50% exhibited partial recovery in fresh and dry biomass by the third cutting, reflecting the mitigating effect of seasonal temperature declines on shading. Notably, soil water uniformity improved under AV systems, reaching 90% under ST and 94% under CON compared with 85% in REF, due to reduced evaporative losses and enhanced lateral soil water redistribution. Overall, while AV-induced shading limits radiation and yield in short-cycle leafy arugula, microclimate modulation under AV systems can enhance soil water distribution and partially buffer growth under less favorable seasonal conditions. These findings highlight the trade-offs between crop productivity and resource-use efficiency in AV systems and emphasize the importance of tailoring their design to crop type and local climatic conditions, providing valuable guidance for future experimental research and for policymakers aiming to support sustainable agrivoltaic deployment.

1. Introduction

Water, food, and energy are the three fundamental resources for human survival. Beyond mere subsistence, however, sustained prosperity, economic development, and increased life expectancy depend on the reliable availability of these resources in both adequate quantity and quality. Against the backdrop of a global population projected to reach 9.2 billion by 2050 [1], the total demand for agricultural commodities is expected to rise accordingly, making the development of renewable resources more critical than ever.
From this perspective, energy constitutes a prerequisite for societal development [2]. Consequently, addressing climate change and the sustainability challenges of energy production, the transition to renewable energy (RE) is crucial worldwide. Nevertheless, since land is an invaluable resource for agricultural economies [3,4], the rapid expansion of RE infrastructure creates land-use conflicts between power generation and food production [3]. In southern Italy, particularly in the Puglia region, the competition between agriculture and RE production for land use has arisen in recent years [4]. Using agricultural land for solar photovoltaic (PV) projects is challenging for the public and politicians because they focus on preserving agriculture and agricultural land [5]. In this regard, Agrivoltaics (AV), the co-development of land for agricultural production and energy generation, can be considered a solution to the problem of competition in land use [6].
AV systems provide green, sustainable electricity for agriculture. Early experimental applications of AV date back to the early 1980s, while the large-scale deployment began more recently in Europe after 2011 [7]. These systems have proven to be technically feasible. Several studies have reported agronomic and environmental benefits associated with AV systems. These include improved irrigation water-use efficiency due to reduced soil evaporation and crop transpiration [8], mitigation of heat and light stress through partial shading [9], and protection of crops against extreme weather conditions.
Despite these advantages, AV systems still face important agronomic challenges. Crop performance under AV is strongly influenced by changes in microclimate induced by AV arrays. Reduced and spatially heterogeneous solar radiation beneath AV systems can alter air temperature, humidity, wind speed, soil temperature, and moisture [10]. These microclimate modifications are among the primary drivers of crop response in AV systems and can have either positive or negative impacts, depending on crop physiology, shading intensity, panel configuration, and local climatic conditions. Additionally, plant responses are affected by light spectral composition, which can influence photosynthesis and crop quality in leafy vegetables grown under modified light environments [11]. Even though several experimental studies illustrate both advantages and limitations of AV systems, further investigation is still required to fully understand crop responses under different AV configurations. Currently, Hassanpour Adeh et al. [12] studied the microclimatology and soil moisture impacts of a six-acre AV solar farm and found considerable differences in mean air temperature, relative humidity, wind speed, wind direction, and soil moisture compared with open-field areas, with water use efficiency under panels increasing up to 328% [12]. Similarly, Barron-Gafford et al. [13] observed that soil moisture levels under the AV system (elevated ground-mounted PV) remained above the driest points detected in the control plot following daily irrigation events after 2 days of irrigation, concluding that irrigation in AV systems may be reduced. While Ureña-Sánchez et al. [14] reported reductions in tomato fruit size and color even under relatively low shading levels.
Conversely, monitoring crops cultivated under PV panels has revealed that they may be as productive as those grown on plots without any cover, depending on the amount of shadow generated by the installation pattern and management practices. They may even be more effective in some cases [9]. Accordingly, research has focused mainly on crops such as tomato, lettuce, pepper, cucumber, and berries [15]. For example, Tani et al. [16] reported that moderate shading (50%) under roof-mounted PV modules did not reduce lettuce yield and could enhance plant growth during spring and summer. Similarly, Marrou et al. [17] observed that lettuce yield grown under stilts was largely unaffected under shading conditions, concluding that this crop can adapt to shading created by the AV panels. In contrast, studies on tomatoes have shown more variable responses. Ezzaeri et al. [18] observed no significant effects of low shading on tomato growth and yield. Another study examined the impact of semi-transparent and conventional solar panels on tomato production, showing that water productivity decreased with increasing shading levels, particularly at 50% and 80% shading, produced by both systems. However, tomato yield was significantly higher under the semi-transparent panels [19].
Considering the aforementioned crops, but grown under a scenario as PV greenhouses with 32% and 100% PV cover ratios (semi-transparent and non-transparent PV modules), an increase in the antioxidant activity of fresh produce, including total anthocyanins, citric acid, and fumaric acid, was observed. Moreover, it has been reported that shading pepper plants by up to 20% under PV panels does not significantly affect the growth, yield, or quality of this crop. Furthermore, Zisis et al. [20] were the first to demonstrate that semi-transparent PV modules could enhance pepper yield by as much as 22%. In the same context, Cossu et al. [10] demonstrated that yield loss became significant beyond 50% AV coverage. In addition, to create a controlled scenario in the field and monitor shading effects over time, static, fixed-tilt agrivoltaic (AV) panels were employed. Static panels provide a consistent and reproducible shading pattern, enabling precise assessment of microclimatic variables such as photosynthetically active radiation (PAR), temperature, humidity, and soil moisture. Experimental research has shown that static AV arrays induce predictable modifications—including reduced PAR, lower soil temperatures, increased relative humidity, and altered wind speed—that influence crop performance [21]. While dynamic tracking systems can optimize solar energy capture and generate variable shading patterns, they introduce additional variability that makes it difficult to isolate the effects of panel shading on crop response. Nevertheless, AV systems are not universally suitable for all crops, as variability in shading intensity and duration can negatively affect crop quality and production [22]. Reduced incident solar radiation may limit photosynthetic activity and morphological development, thereby constraining agricultural productivity [23,24].
In this context, the experiment conducted at the CIHEAM Bari Experimental Field in Italy also aimed to investigate how static AV-induced microclimates affect the phenology, physiology, and yield of crops such as arugula, providing insights into practical applications of AV systems under controlled yet realistic field conditions.
Previous research has mainly focused on greenhouse AV, underscoring the need for studies in open-field settings. Arugula was selected to assess how AV systems influence crop growth and yield and to explore the responses of cruciferous vegetables for which less information is available. Moreover, Arugula was chosen as the experimental crop due to the limited scientific research examining the impacts of AV on agro-physiological parameters and crop yields. It also has a short growing season, and plants prefer cooler, slightly moist conditions, while heat can induce a strong, bitter flavor in the leaves. Despite limited studies on arugula under AV systems, restricted to greenhouses, its cultivation is widespread in the Mediterranean region, particularly in Italy and southern Europe. In contrast, this study examined the effects of AV on this crop in an open field and under varying microclimate conditions.
Based on these considerations, the main objective of this study is to assess the effects of two different AV systems on microclimate properties, as well as the physiological and productive responses of Arugula (Eruca vesicaria). Specifically, the study compared two types of solar panels, conventional opaque panels (CON) and semi-transparent panels (ST), the latter allowing greater transmittance of solar radiation to crops, with both panel types evaluated under two shading intensities, approximately 50% and 80% beneath the panels. The specific objectives include assessing soil water patterns under the AV systems and examining how variations in shading intensity influenced Arugula growth and yield.

2. Materials and Methods

2.1. Case Study

This study was conducted at the CIHEAM-Bari experimental field, located in the Apulia region of southern Italy. The field is situated at an elevation of 68 m, at 41°03′13.9″ N latitude and 16°52′37.1″ E longitude. The study area is characterized by hot, dry summers and mild, wet winters, with pronounced seasonal temperature variability. In 2022, the average annual temperature was approximately 17.0 °C, with summer monthly means above 25 °C and winter averages generally above 8 °C, reflecting the moderating influence of the Adriatic Sea. Summer was predominantly hot and dry, with July and August frequently exceeding daily maximum temperatures of 30 °C, while precipitation was limited. In contrast, autumn and winter accounted for most of the rainfall, with peaks in late autumn, resulting in an annual total of approximately 570–600 mm, concentrated in the cooler months [25].
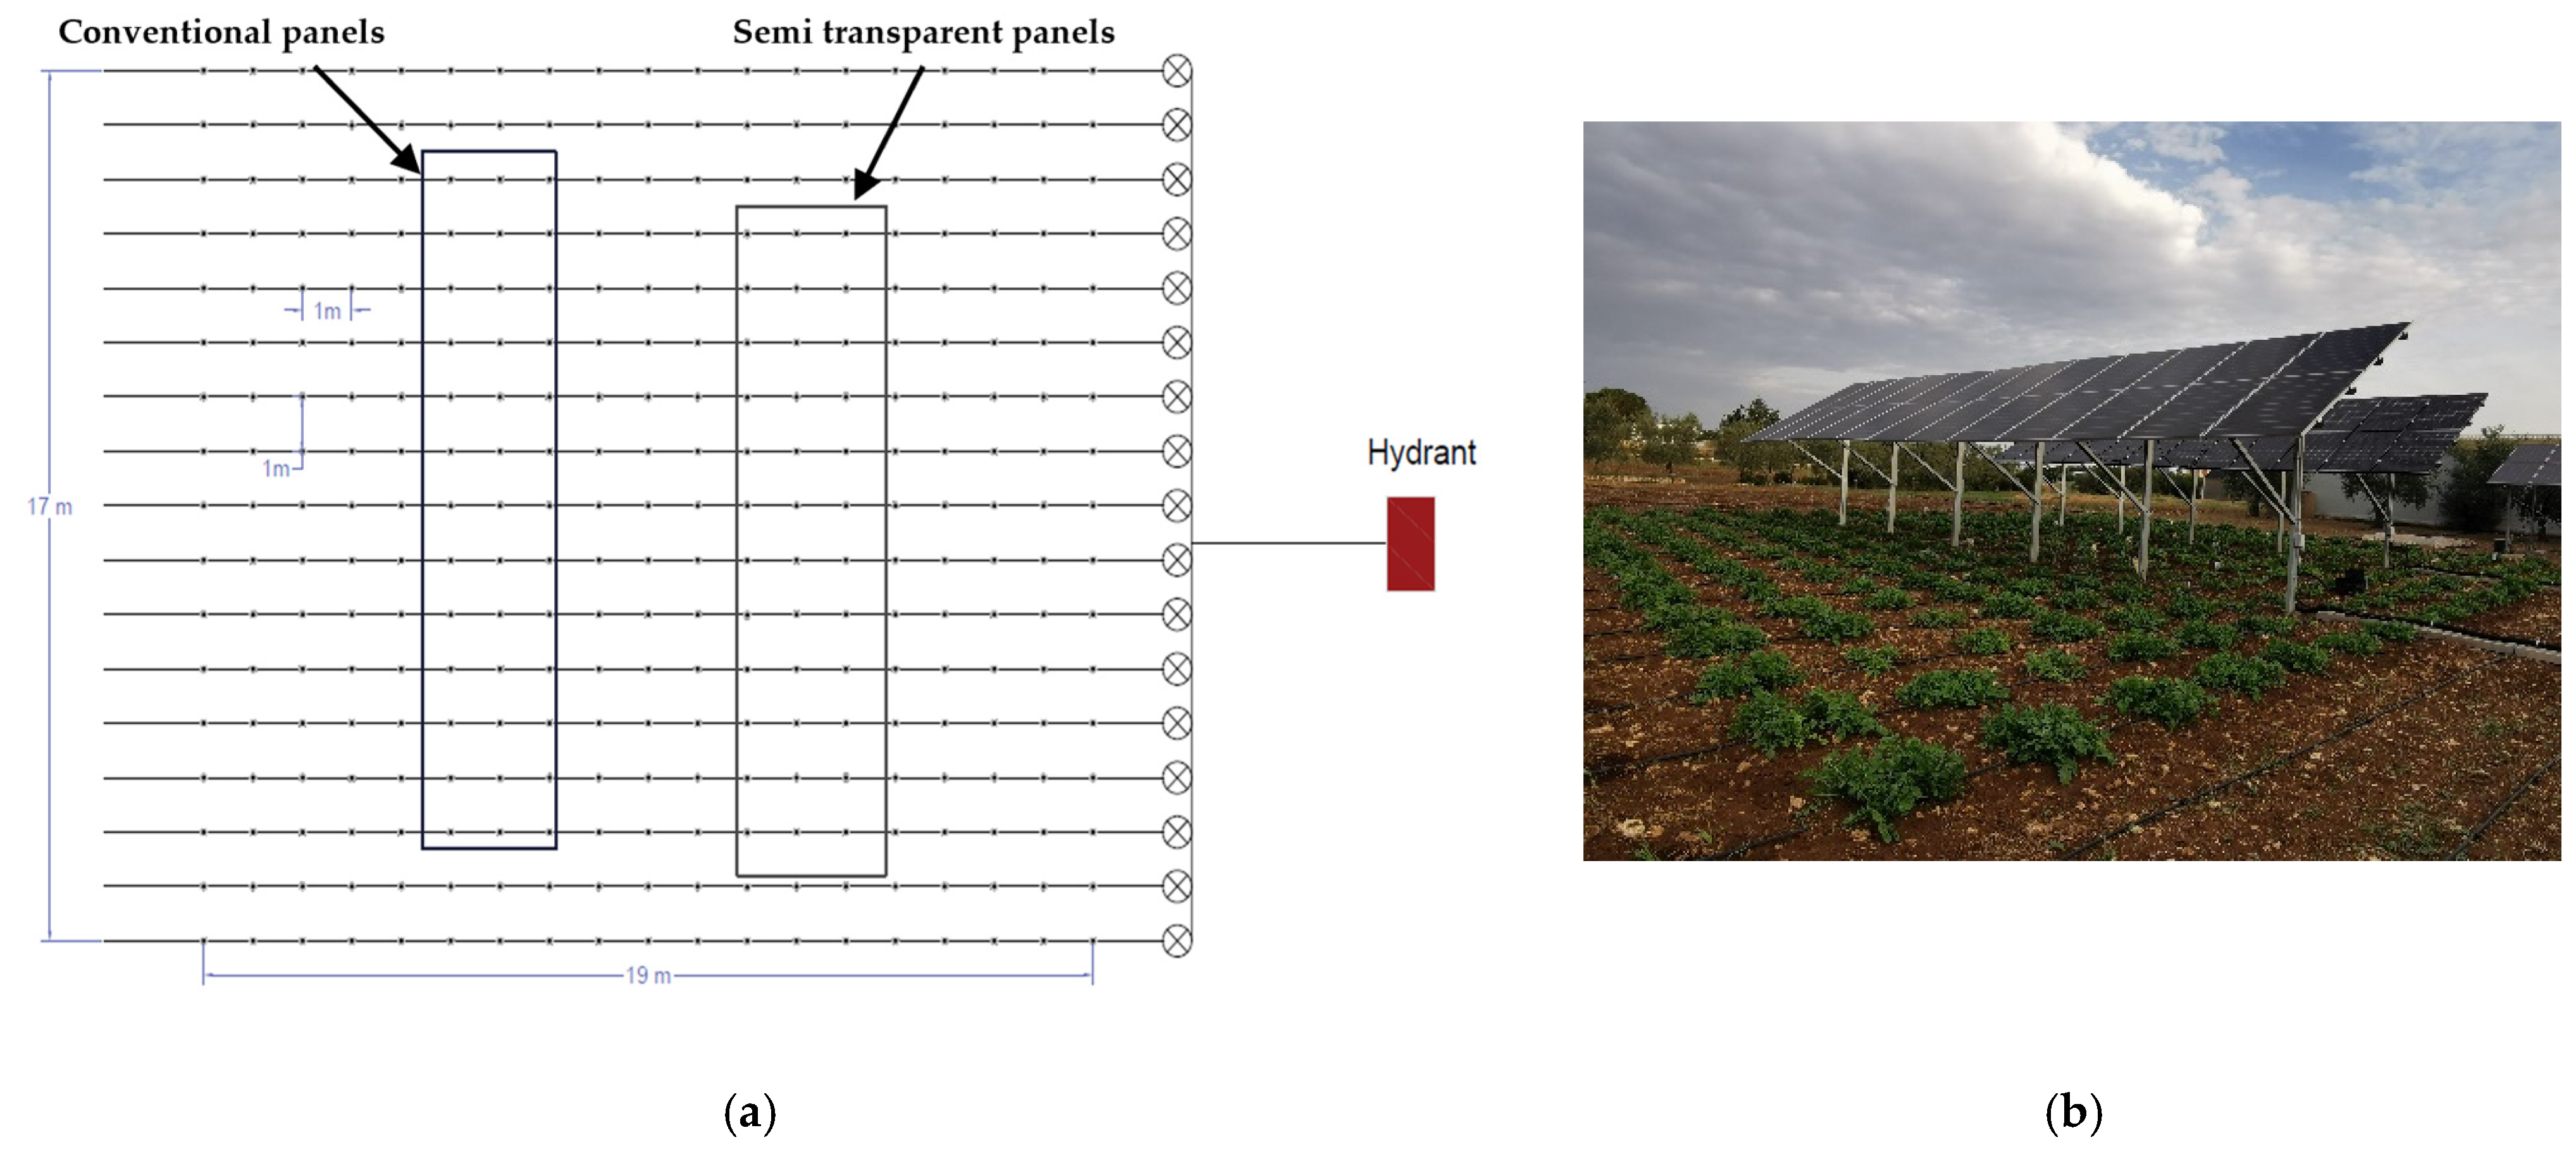
The field has a total area of 323 m2 (19 m × 17 m) and is equipped with a drip irrigation system, fed by a hydrant (Figure 1a). The latter encompasses drippers with a nominal discharge of 4 L/h and a spacing of 1 m × 1 m.
The solar panels were designed to meet the requirements of the existing pumping station, which comprises two pumps optimized for operation at a pressure head of 40 m and a total discharge of 25 L/s (combined). Each pump has a power rating of approximately 11 kW and is connected to an underground storage reservoir that supplies water to eight hydrants.
The experiment was conducted from 3 August to 19 October 2022. On 27 July 2022, the Arugula (Eruca vesicaria) seedlings were transplanted in the field. Four plants were planted per dripper at 20 cm spacing. (Figure 1b).
The soil in the experimental field is classified as silt loam (sand 17.5%, clay 19.99%, silt 62.51%), according to the USDA texture classification [26]. Additionally, the soil contains a bedrock layer at approximately 70 cm depth.
The solar PV panels were mounted on the ground at a height of 2 m and tilted at a 45-degree angle. Each array (for the CON and ST) comprises 24 solar panels. Regarding the size of a single solar panel, the semi-transparent panels measure 1722 mm in length, 1134 mm in width, and 30 mm in thickness, whereas the conventional opaque panels measure 1646 mm × 1140 mm × 35 mm. A complete overview of the characteristics of both panel types is provided in Table 1.
By examining Table 1, it is evident that semi-transparent panels (M310 RA) have lower nominal power and voltages than conventional opaque panels (M390 WG), while maximum current is similar and short-circuit current slightly higher, reflecting comparable electrical performance. The semi-transparent design allows greater transmission of solar radiation to crops, reducing shading effects, whereas opaque panels prioritize electrical output at the expense of light availability for underlying vegetation [27].

2.2. Data Collection

2.2.1. Treatment Definition

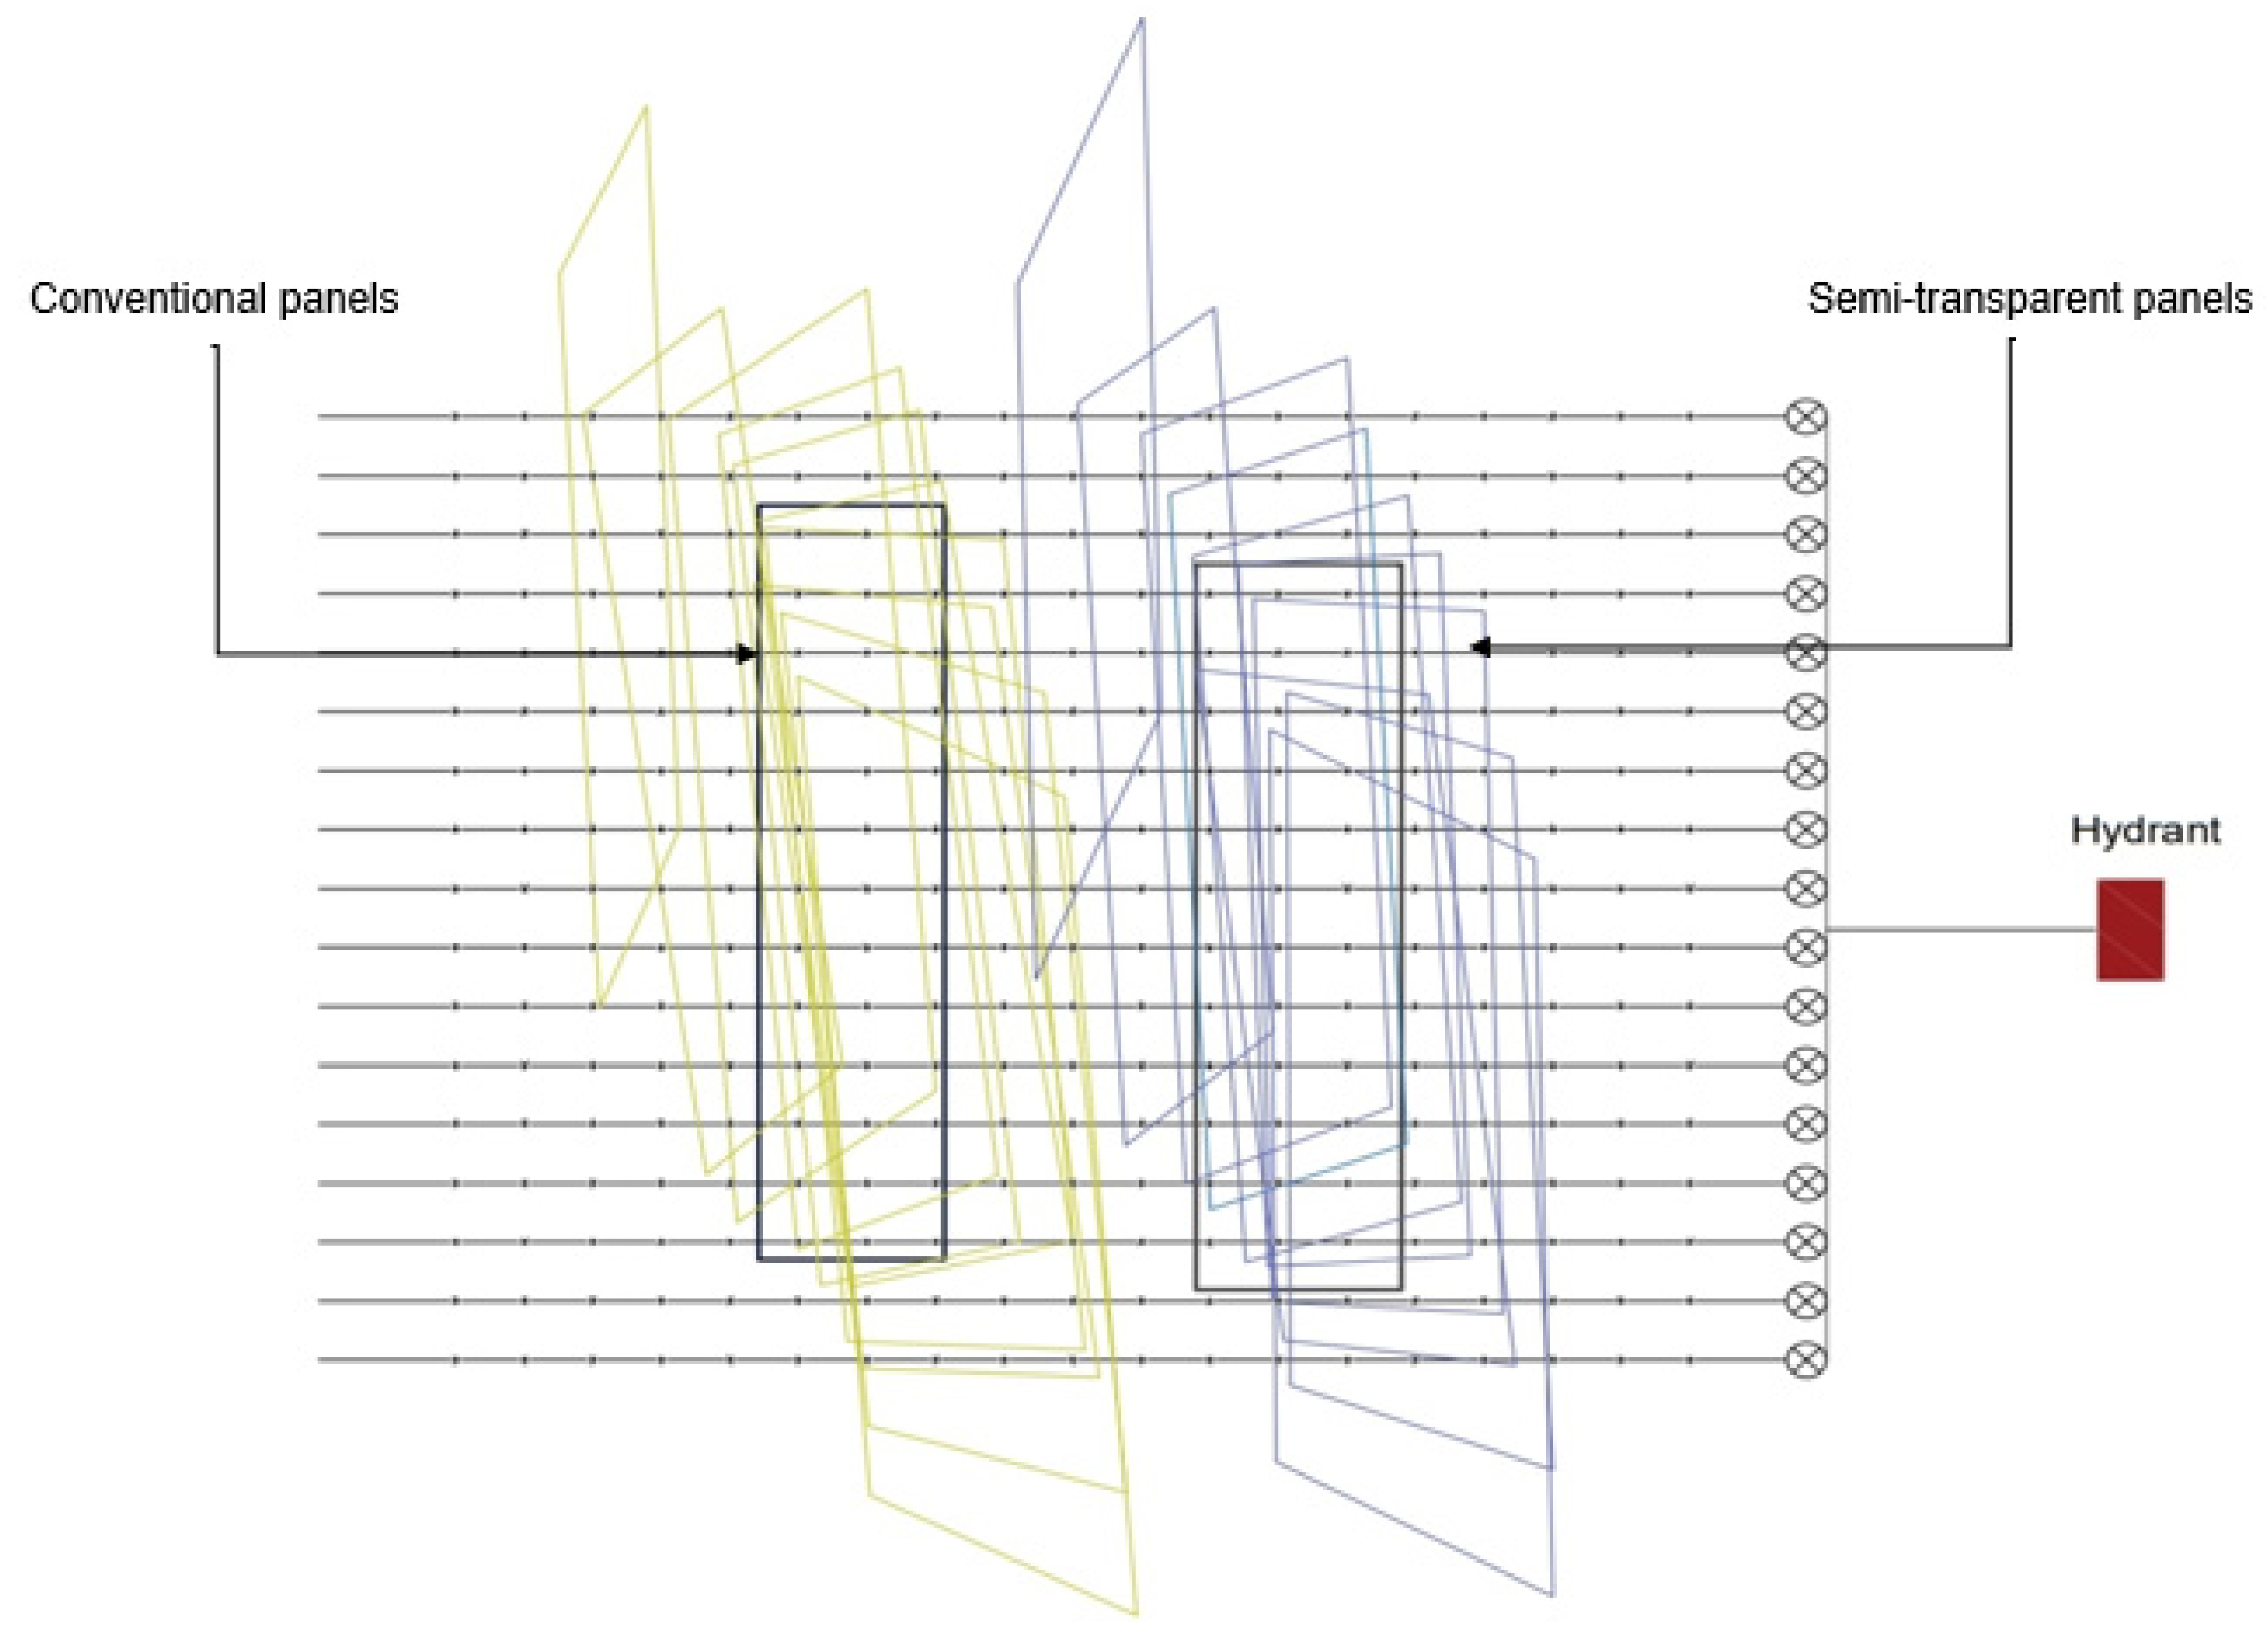
Prior to establishing the experimental crop beneath the agrivoltaic (AV) system installed in June 2022, the spatial and temporal distribution of shading from the PV arrays was monitored to characterize light availability beneath the panels. Shading dynamics were visually tracked under clear sky conditions from 6:00 to 19:00. As a result, a shading map was produced, representing the movement of the shade under the arrays throughout the day (Figure 2). Based on this observation, four sub-treatments were defined according to the shading duration (in percentage) during the day: ST 50%, ST 80%, CON 50%, and CON 80%, corresponding to approximately 50% and 80% of daily shading time under semi-transparent (ST) and conventional (CON) panels, respectively. An open-field control (REF) without panel coverage was also used as a comparison. The resulting shading map was then used to identify sites for monitoring the soil, physiological, and biometric parameters of Arugula throughout the experiment.

2.2.2. Irrigation Uniformity Test

To ensure that observed differences in Arugula growth and yield were attributable to the agrivoltaic treatments rather than uneven water distribution from the drip irrigation system, an irrigation uniformity test was conducted before the start of the experiment.
The flow measurements for the calculation of the uniformity coefficient were carried out on four laterals, uniformly distributed along the manifold [28].
The drippers in the measuring system were selected according to the same distance criteria for each selected lateral.
To calculate the uniformity coefficient (UC), the following were defined:
-
The average of the 16 flow measurements obtained: q
-
The average of the four lowest flow values: qinf
The uniformity coefficient UC is given by the relation [28]:
U C = q i n f q × 100
To determine the flow rate for the selected drippers, a timer was set for 2 min to collect water from each dripper.
In addition, because uniformity in drip irrigation does not immediately translate to uniform soil water distribution at the plant level, the same methodology was applied to assess soil water uniformity. Since the irrigation system supplied water consistently within each treatment, the uniformity coefficient was determined only across the three experimental transects (REF, ST, and CON), rather than by shading intensity (50% and 80%). The coefficient was calculated using the same equation as for the irrigation system, substituting measured soil water content values for flow rates, thereby demonstrating that soil water distribution is primarily governed by soil properties.

2.2.3. Soil Water Content and Soil Temperature Measures

During the arugula growth period, consistent watering was required to support optimal development. Therefore, soil water conditions throughout the root zone were regularly monitored to schedule irrigation effectively. The soil water content was kept between field capacity (FC) and permanent wilting point (PWP), i.e., between 33% and 13%. Since the maximum depletion fraction for the Arugula was 30% [29], the irrigation was planned when the soil moisture near the roots was below 25%.
Measurements of soil water content were conducted daily in the morning (7:00–8:00) from the top 15 cm of the soil, using the Time Domain Reflectometer (TDR) probes, based on the assumption that the majority of water uptake by arugula occurs within this shallow soil layer. A total of 21 TDR probes were placed in the 0–15 cm soil compartment, representing the main portion of the root zone. The TDR techniques provide reliable, non-destructive estimates of volumetric soil water content based on soil dielectric properties [30].
Soil temperature, considered a representative variable of microclimatic variation due to its direct influence on plant development and nutrient and water uptake, was simultaneously measured at the same 21 sites using PT100 thermometers (XS Instruments, Giorgio Bormac Srl, Carpi, Italy) inserted below the wet bulb. Together, soil moisture and temperature were recorded daily in the morning throughout the experiment.

2.2.4. Physiological Parameters

A direct way to determine the net rate of photosynthetic carbon assimilation is by measuring gas exchange. The main benefits of gas exchange measurements are direct, non-destructive, and instantaneous results [31].
Leaf gas exchange was measured here, along with the net photosynthetic rate (An), stomatal conductance (gs), and transpiration rate (Tr), using a portable photosynthetic system (LI-6400; Li-COR Inc., Lincoln, NE, USA). The LI-6400XT analyzer console and the sensor head are the two primary components of these portable systems. The first element provides configuration of measurement settings and data logging, while the second includes a leaf chamber that controls all microclimate factors (temperature, relative humidity, CO2 partial pressure, and irradiance).
Three measurements with the LI-6400 were taken on 31 August, 14 September, and 4 October 2022, corresponding to three distinct vegetative stages of arugula. For each measurement date, five representative sites per treatment were selected to capture the variability within each treatment. On the first measurement date (mid-vegetative stage), leaves were well-developed, the canopy was expanding, and plants were approaching harvest maturity, with no visible initiation of flowering. On the second date (late vegetative stage), the canopy was nearly fully developed, with some older leaves beginning to senesce; if left unharvested, bolting may begin under warm conditions. On the final date (flowering/bolting stage), plants were transitioning to reproductive growth, with reduced leaf production and formation of flower structures. The three measurements were conducted on clear, sunny days at approximately 11 a.m., when plant physiological activity is typically near optimal. Selected leaves were fully expanded, sun-exposed, and free from disease or yellowing. For each treatment, five plants were randomly selected at each measurement date.

2.2.5. Yield

During the experiment, three cuttings were conducted: the first on 1 September, the second on 21 September, and the third on 19 October across the five treatments (REF and both CON and ST at 50% and 80% shading). For each harvest, six replicate samples per treatment were collected, weighed for fresh biomass, and subsequently dried in an oven at 70 °C to determine dry yield. Measuring dry yield provides a standardized basis for comparison by removing the contribution of leaf water content at the time of harvest.

2.3. Statistical Analysis

To evaluate the effect of shading, data were analyzed using analysis of variance (ANOVA) or a linear mixed-effect model. When significant effects were detected, mean comparisons among treatments were performed using the Tukey HSD (Honestly Significant Difference) test at p ≤ 0.05.

3. Results and Discussion

3.1. Soil, Leaf-Level Gas Exchange and Biometric Yield Assessment

Soil and plant parameters collected during arugula cultivation between August and October 2022 were analyzed to evaluate their responses to two controlled microclimate conditions: 50% and 80% shading, generated by the CON and ST AV systems.
Given the similar trends in soil water content across the two shading intensities (50% and 80%) for both AV systems, physiological measurements were conducted for the semi-transparent (ST) and conventional opaque (CON) panels without differentiating by shading intensity. This approach was based on the assumption that crop physiological responses largely reflected the observed water flux patterns and that plants had adapted to the shading regime, exhibiting comparable mechanisms under both levels of shading. In contrast, yield—serving as an integrative indicator of the overall efficiency of microclimate modification by the AV systems—was evaluated across both shading intensities to capture potential differences in crop performance resulting from variations in light interception.
The main findings are presented below.

3.1.1. Variation of the Temperature Below and Above AV

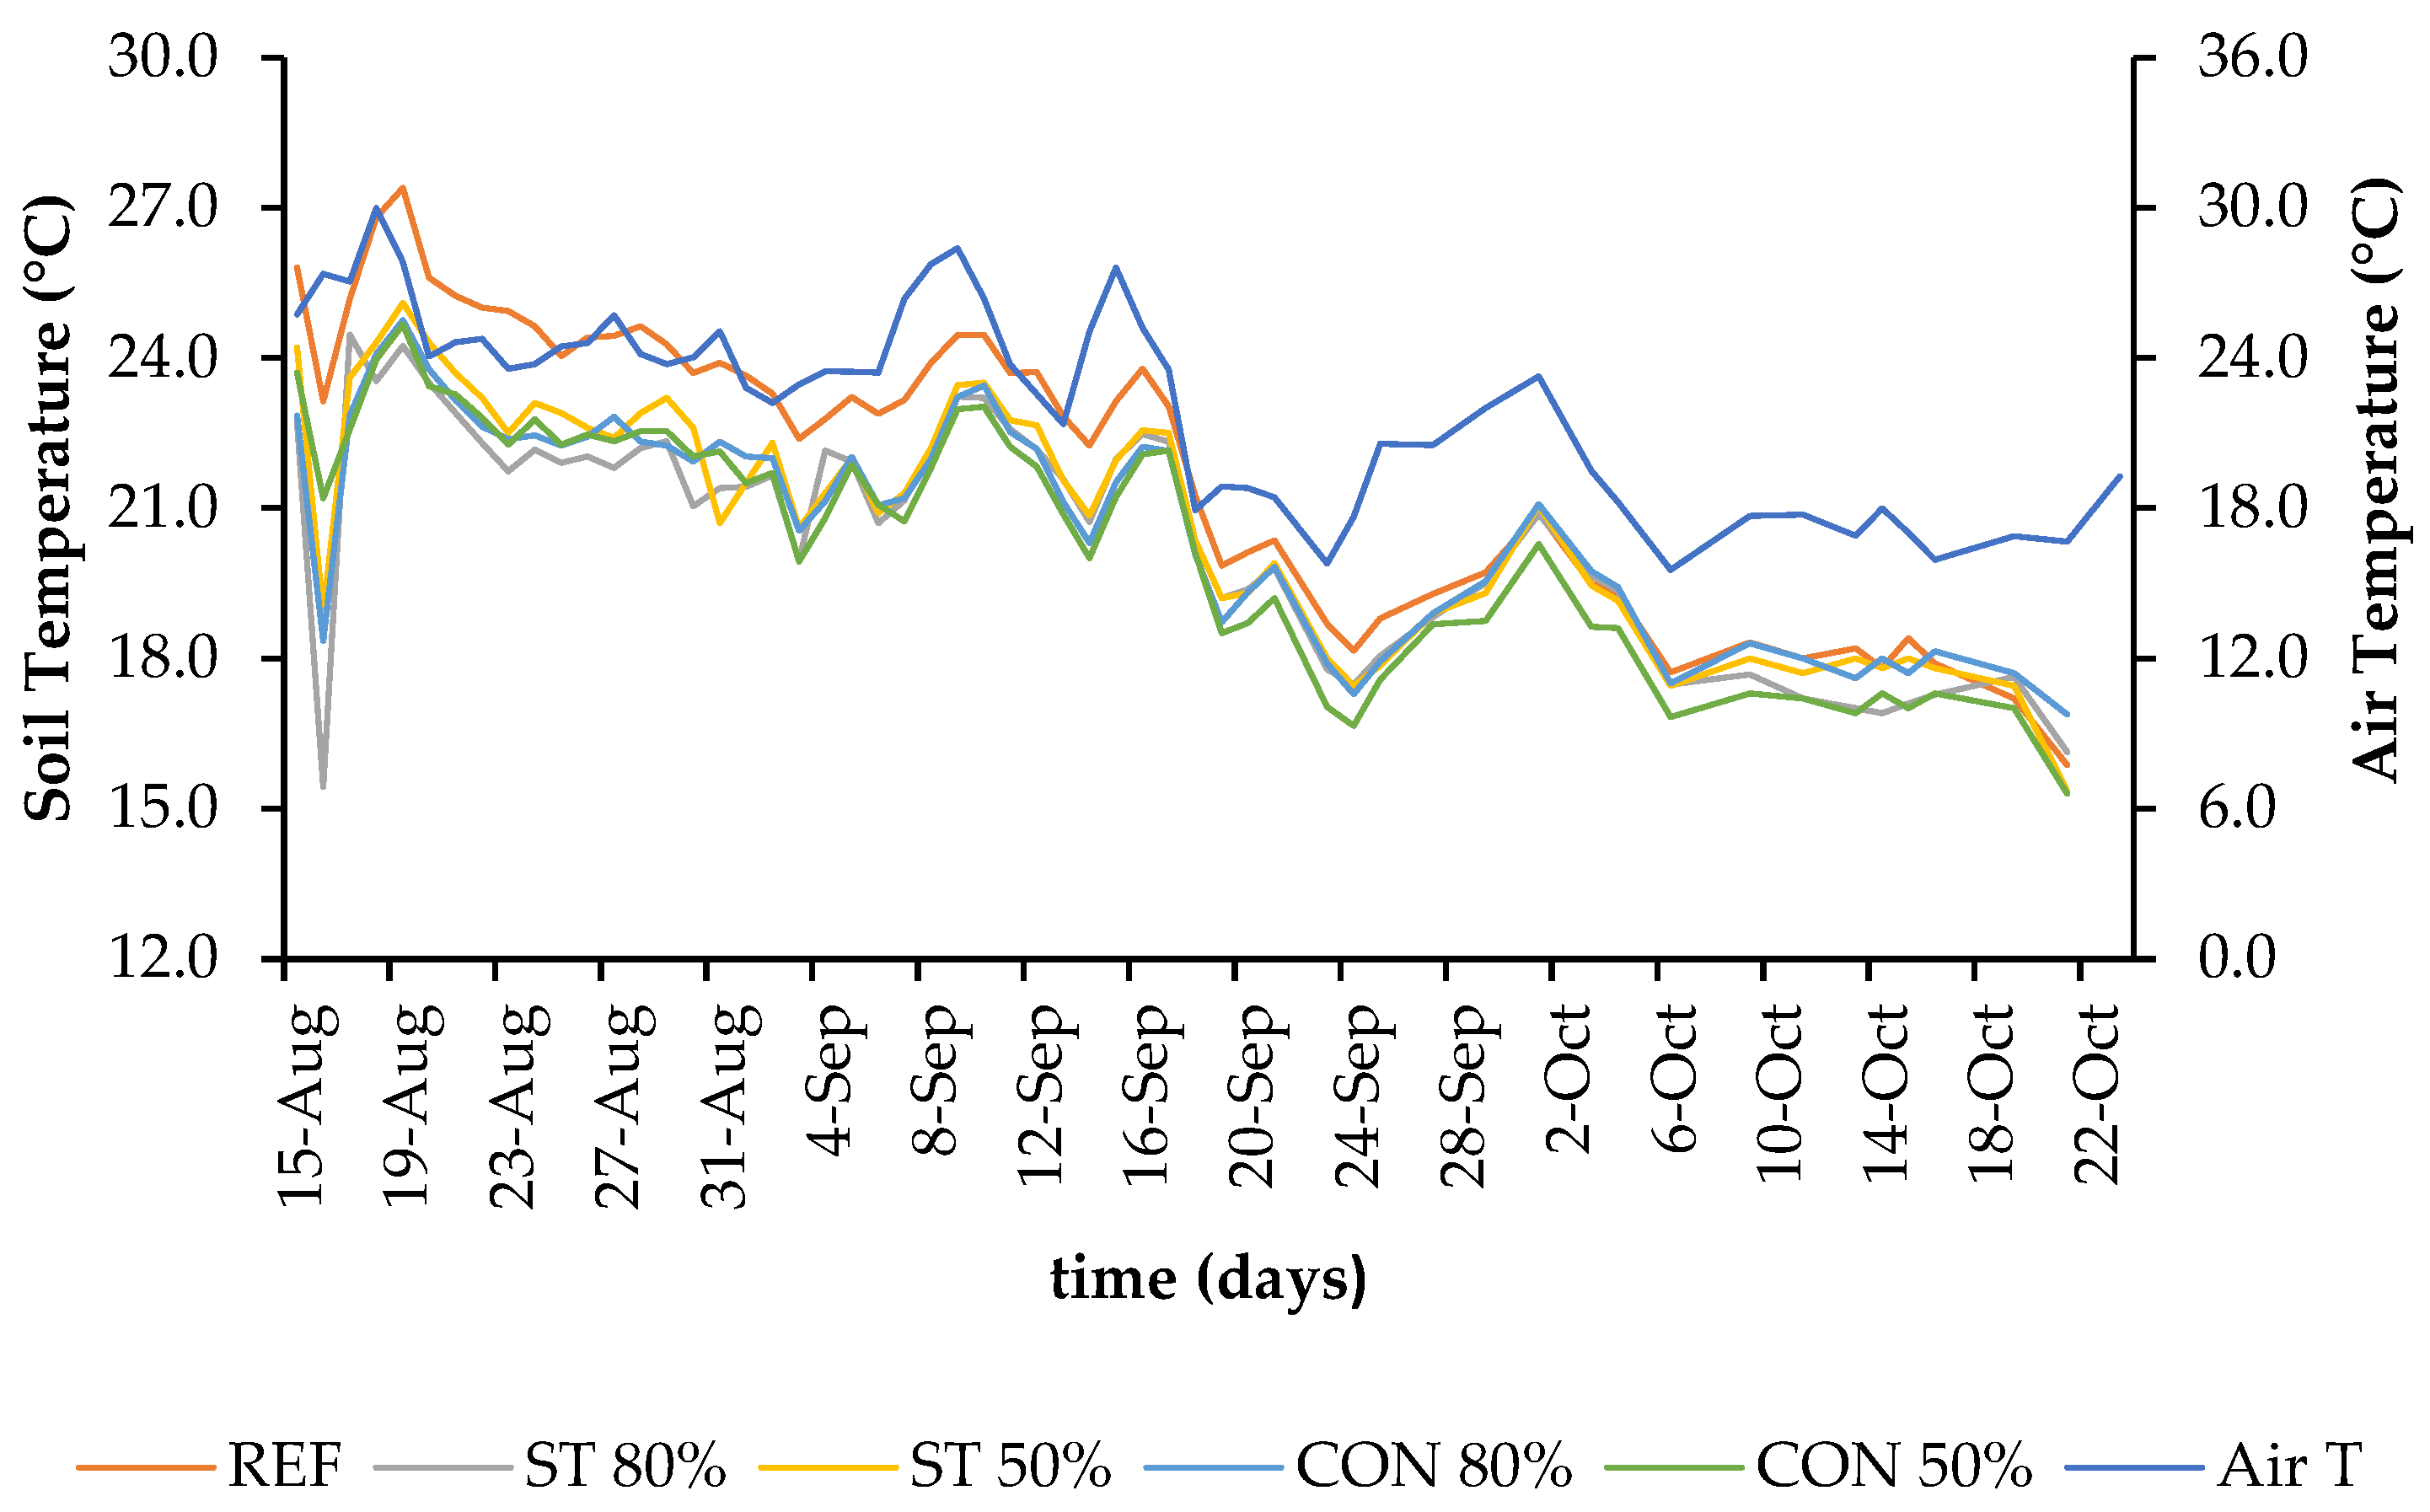
Figure 3 represents the seasonal trends of the air and the soil temperature values during the growing season of the Arugula (2 August–19 October 2022).
The variation in soil temperature during the growing season differs from that of air temperature. In fact, this experiment crossed two seasons, summer and autumn. Generally, the soil temperature decreases when the air temperature decreases, and vice versa. However, in the open field, it does not have the same trend, particularly during the summer. This could be explained by the fact that during the hot and dry seasons, the net solar radiation contributes to increasing the soil temperature, and because of the ability of soil to absorb heat, that temperature could sometimes be higher than the air temperature near the land surface [32,33].
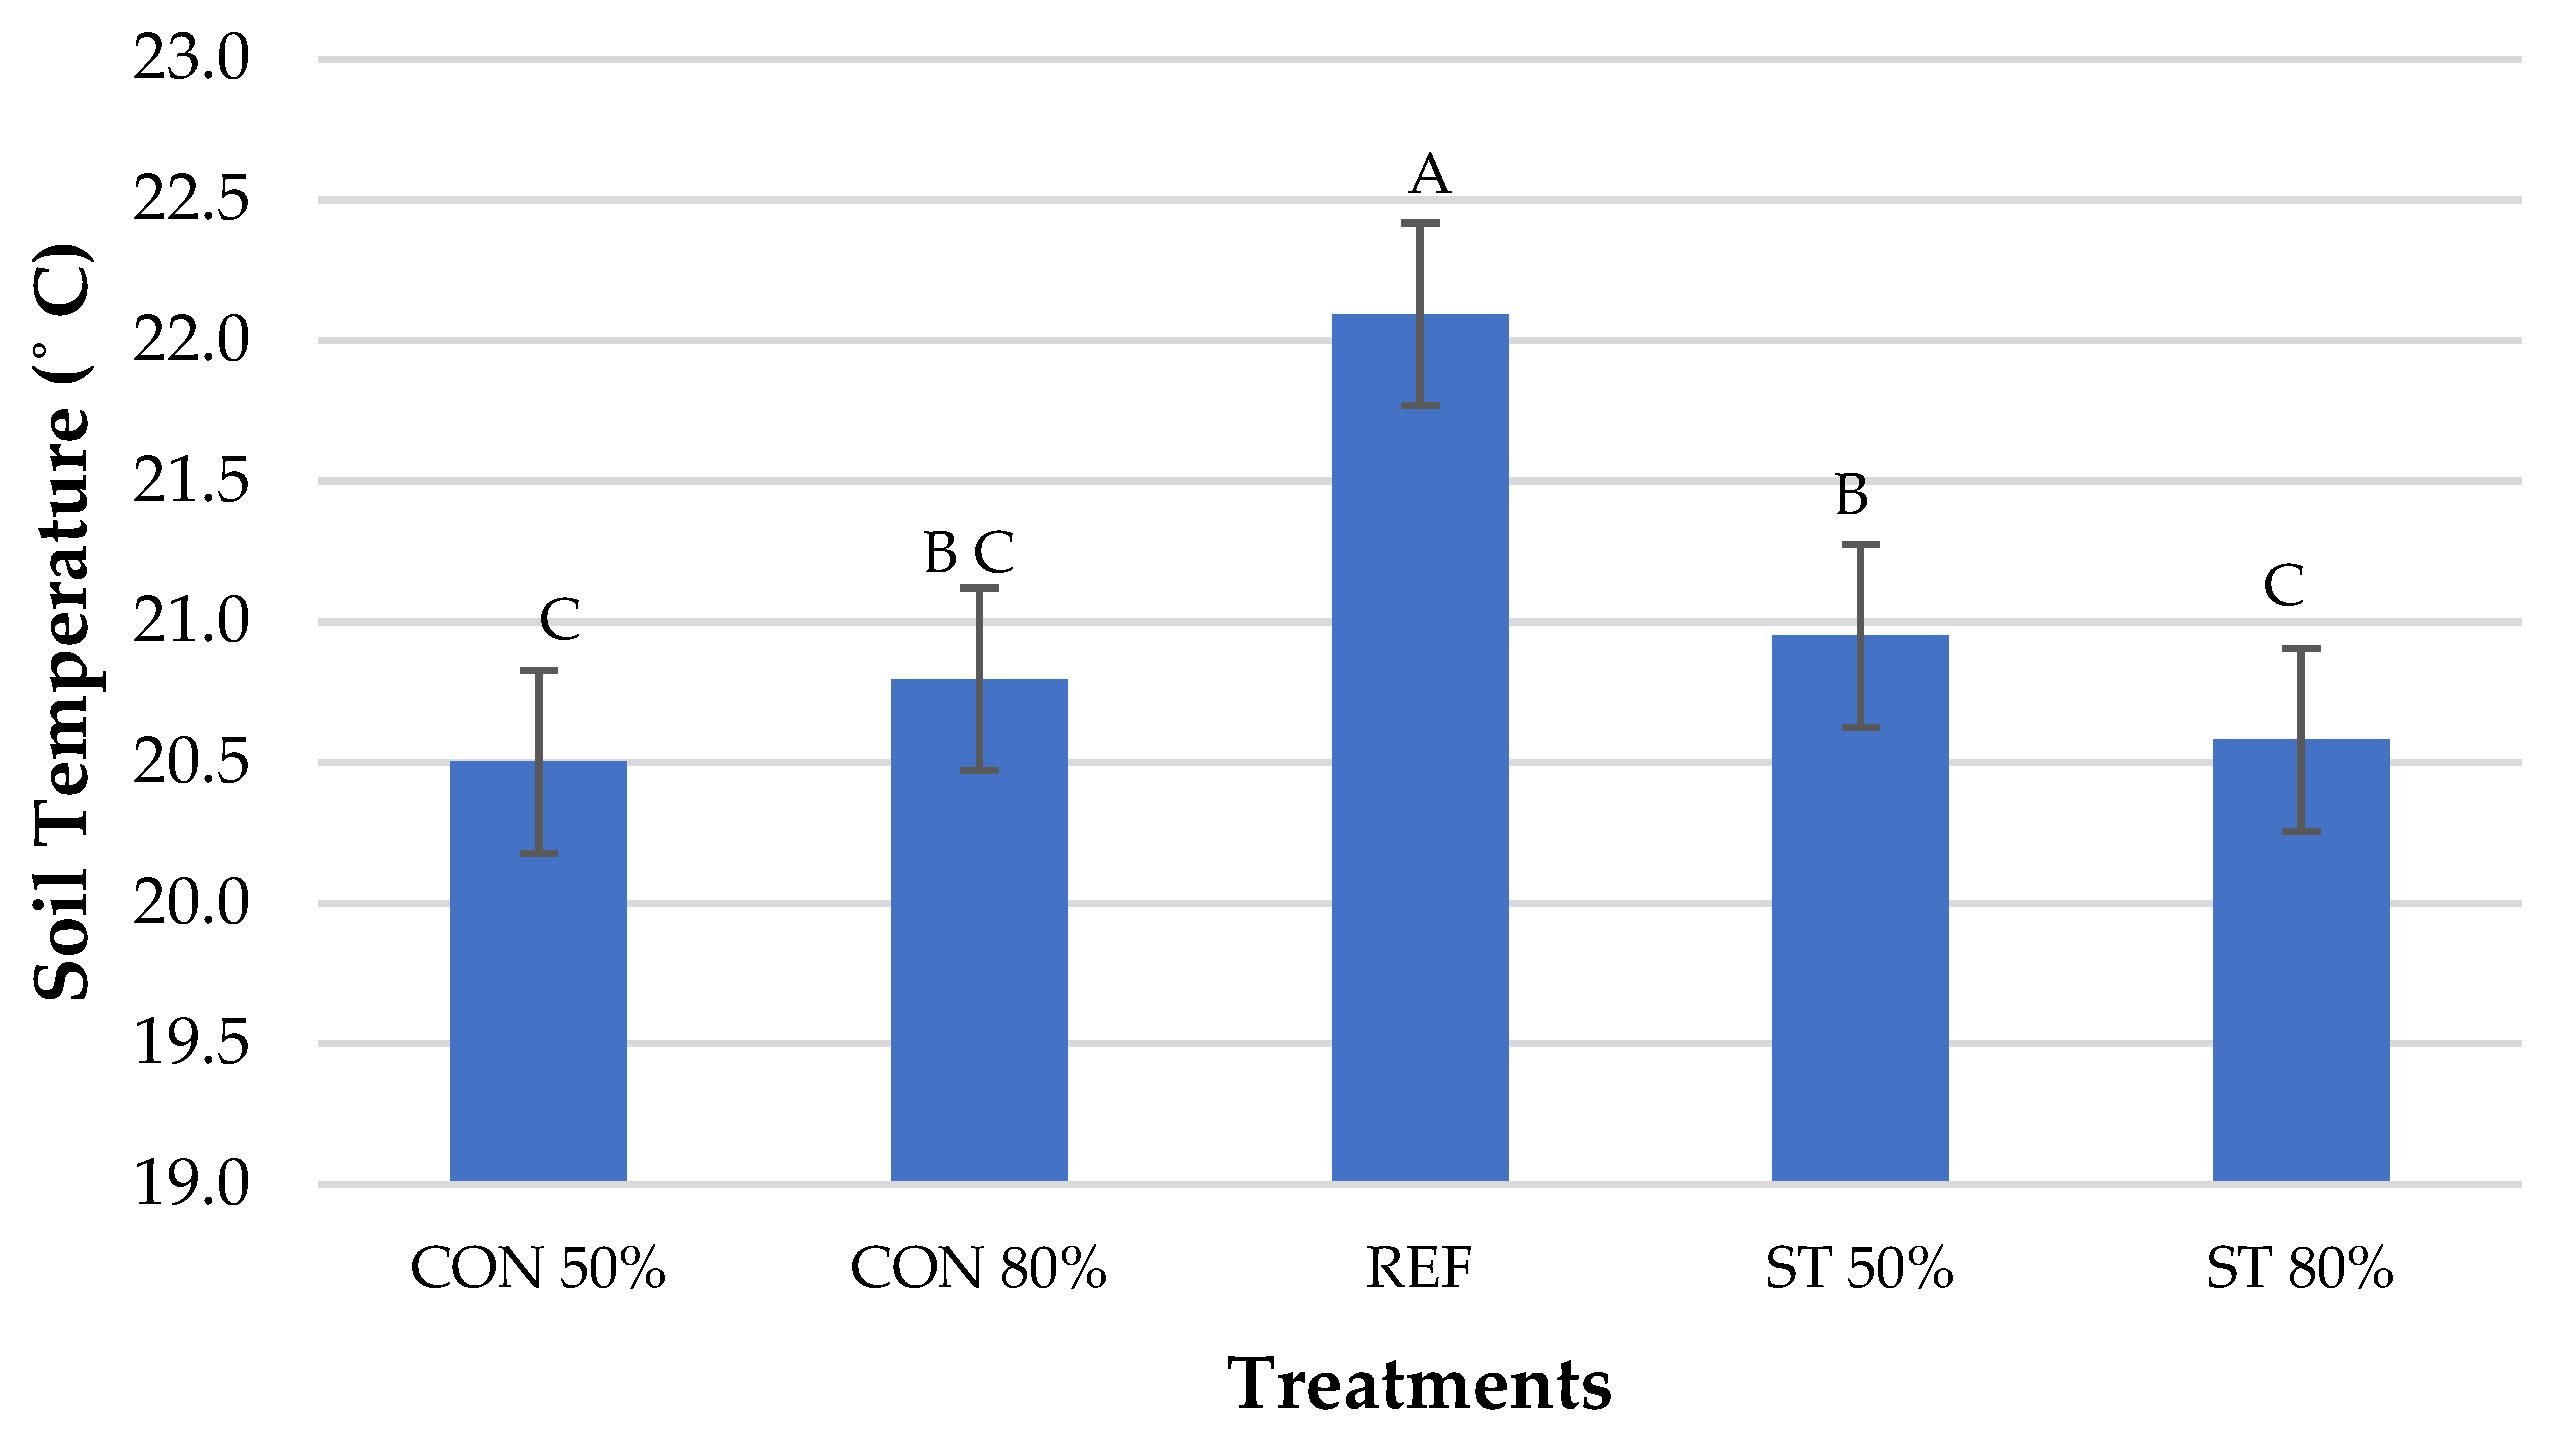
Across all treatments, soil temperature ranged between 17 and 25 °C, overlapping with the optimal temperature range for arugula growth (18–24 °C) [34]. During August and September, soil temperature in the REF was significantly higher than under all agrivoltaic treatments, with an average reduction of approximately 1.8 °C beneath the photovoltaic panels (p < 0.0001). These findings are in accordance with those of Marrou et al. [9], Armstrong et al. [35] and Weselek et al. [36]. Although night temperatures could be higher, the decreased temperature under the solar panels was a direct result of shadowing [37].
Furthermore, Tukey-adjusted pairwise comparisons indicated that soil temperature in the REF differed significantly from all treatments (Figure 4). Among shaded treatments, ST 50% exhibited higher soil temperatures than ST 80% and CON 50%, while CON 80% showed intermediate values and did not differ significantly from either group.

3.1.2. The Analysis of the Soil Water Content Trend

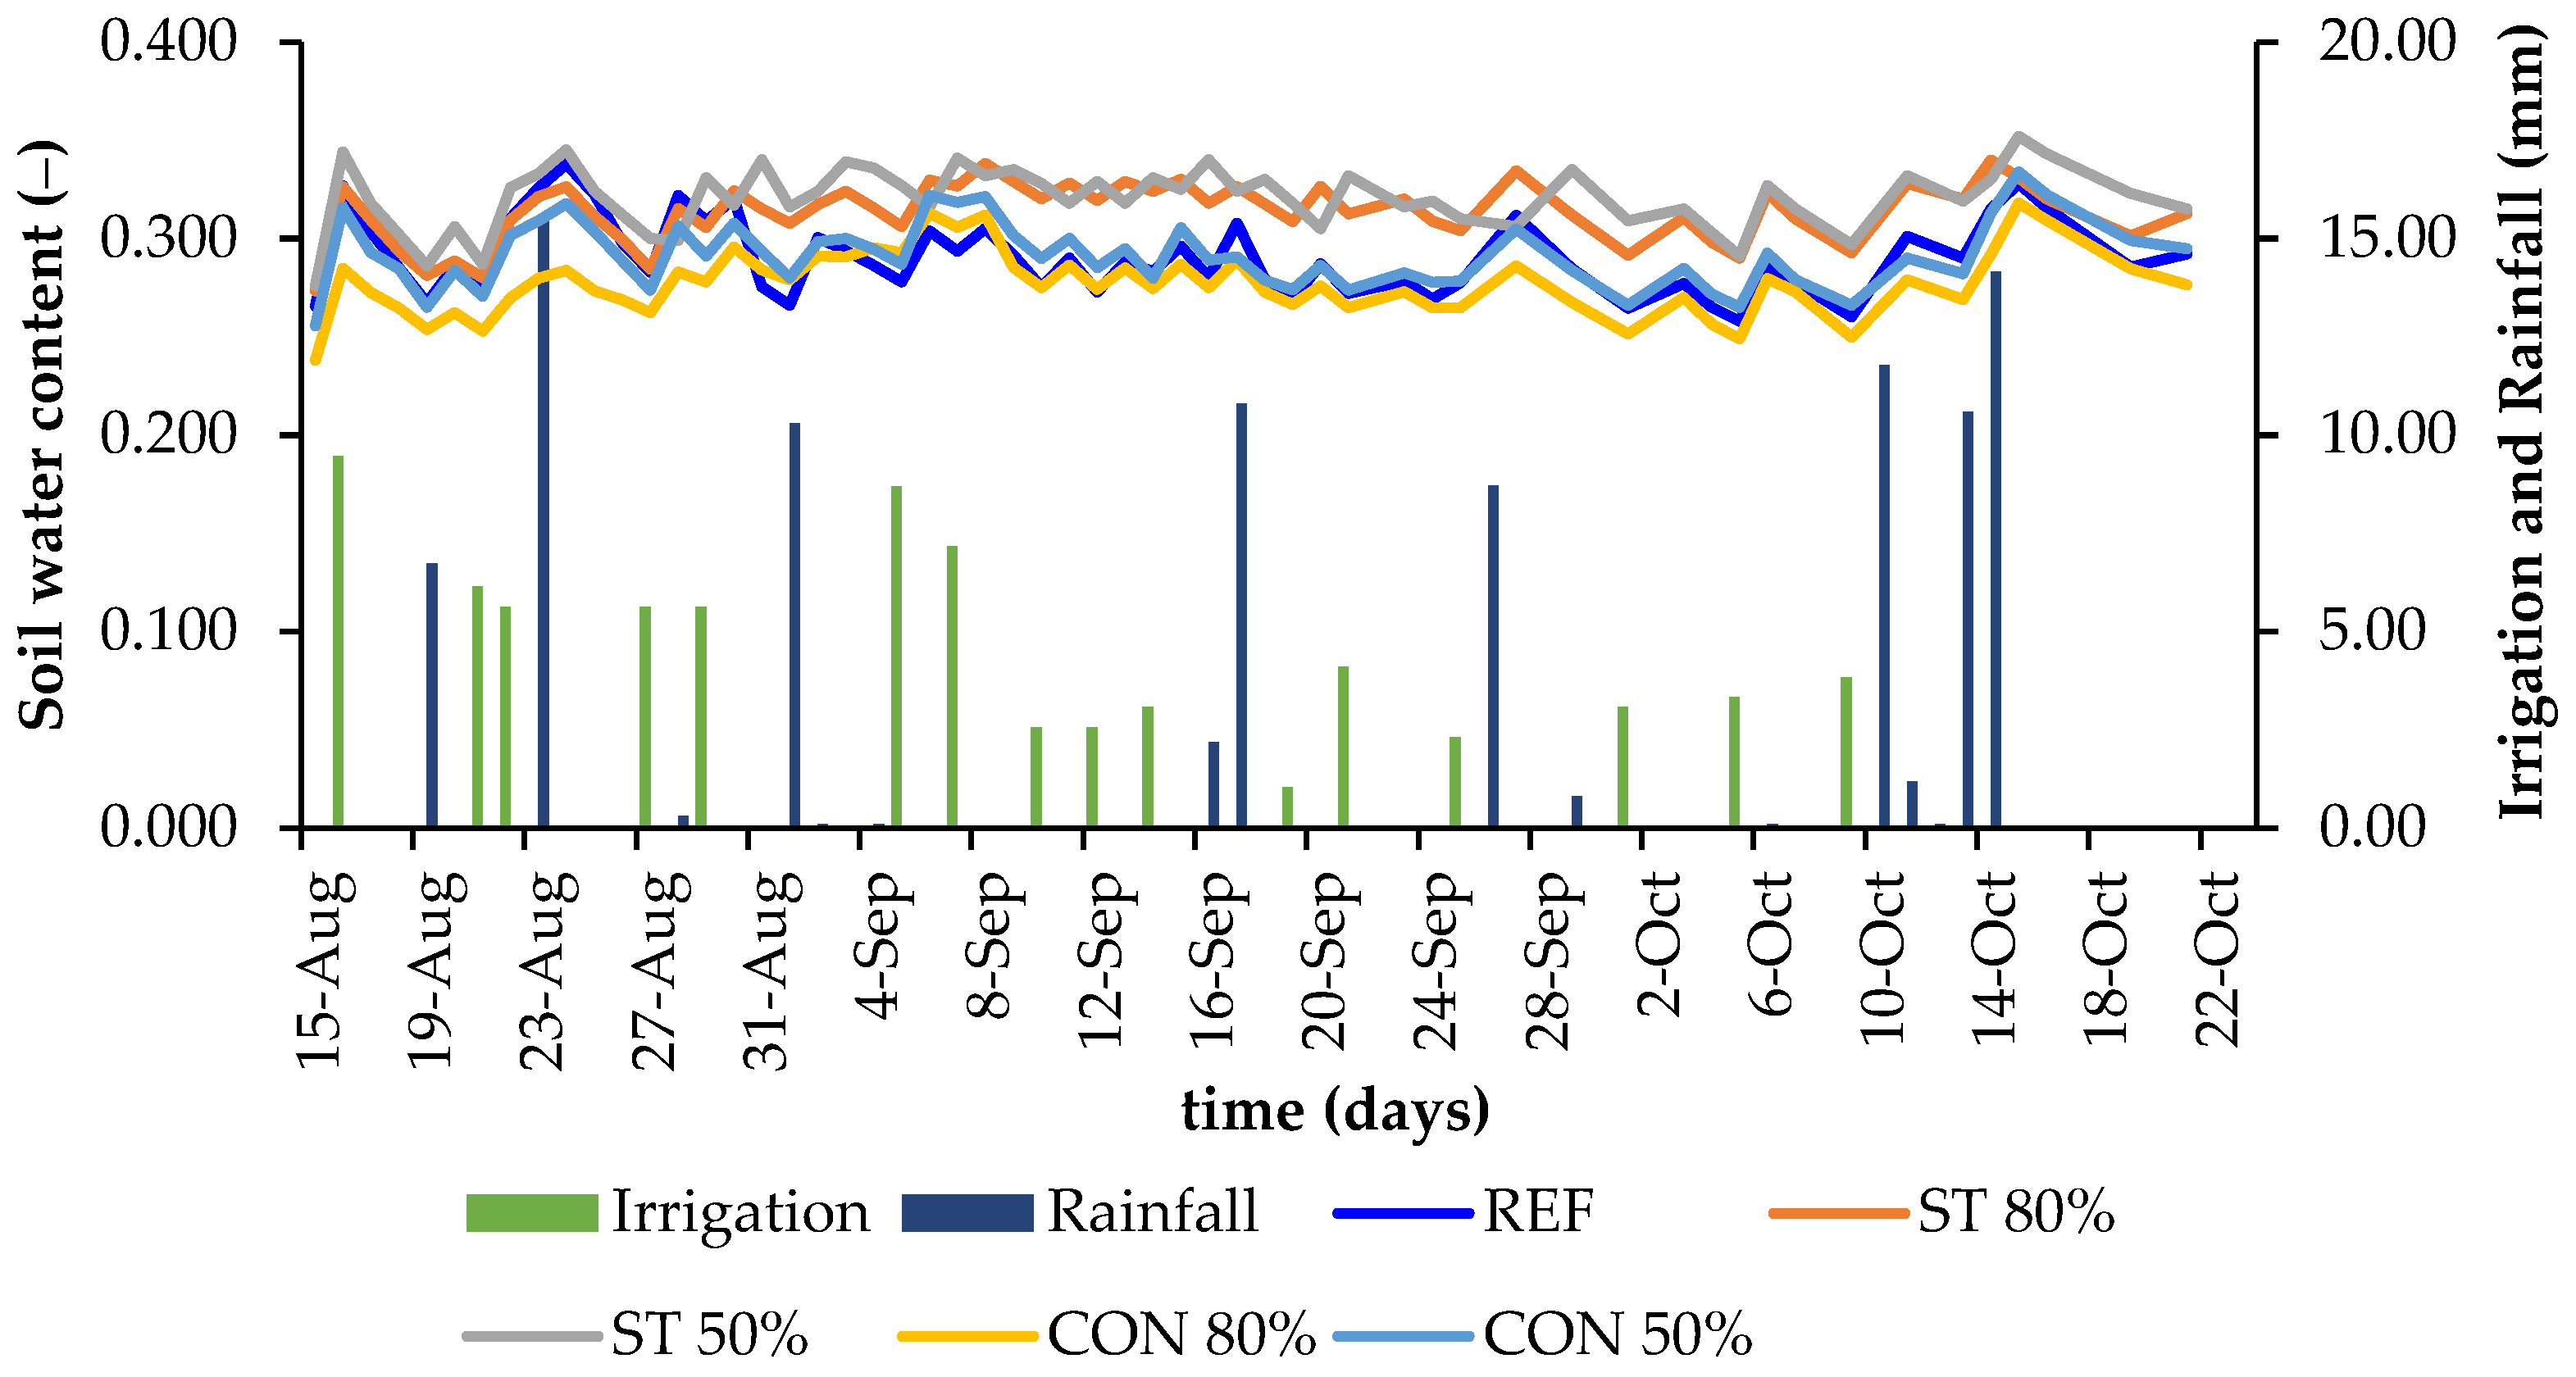
The graph illustrated in Figure 5 shows the temporal trend of soil water content throughout the experimental period. The lines indicate the variation in soil water content during the growing season, while irrigation and rainfall events are represented by green and blue bars, respectively.
At the beginning of the experiment, soil water content trends differed among treatments, likely due to spatial heterogeneity of the soil. The experimental field is characterized by high percentages of stones (approximately 25% of the rocks on the ground) and by the presence of a shallow bedrock layer at a depth of roughly 70 cm, which may influence the behavior of water fluxes along the soil profile by reducing the volume of fine soil available for water storage, altering pore connectivity, and modifying infiltration and water fluxes along the profile [38,39].
The soil water content values ranged between the FC (33%) and the PWP (13%), with observed peaks attributable to irrigation and rainfall events occurring immediately after each application. In all cases, soil water content exceeds 25%. The temporal trends indicate that soil moisture under the panels increased, particularly beneath the semi-transparent (ST) panels at both 50% and 80% shading, suggesting that plants grown under these panels received additional water. In contrast, soil moisture under conventional opaque panels at 80% shading (CON 80%) was closer to the open-field (REF) scenario, reflecting differences in water redistribution patterns influenced by soil properties. These observations suggest that plants beneath AV systems benefited not only directly from precipitation but also indirectly from water runoff from the panels and lateral movement through the inter-row soil.
Mixed-effects model analysis revealed a highly significant effect of treatment on soil water content (p < 0.0001). The higher soil water content observed under the AV systems can be attributed to reduced evaporative losses due to shading and to the redistribution of rainfall beneath the panels. Rainwater concentration near panel edges and openings leads to localized increases in infiltration, followed by lateral redistribution of water from wetter to drier soil zones after rainfall events [40]. Hassanpour Adeh et al. [12] observed that the AV system significantly affected soil moisture, with water-use efficiency under panels rising by 328%. In the same context, Barron-Gafford et al. [13] reported that soil water content below the elevated ground-mounted PV stayed above the driest points of the control plot after 2 days of irrigation, indicating that irrigation requirements may be reduced under AV systems.

3.1.3. Irrigation and Soil Water Uniformity

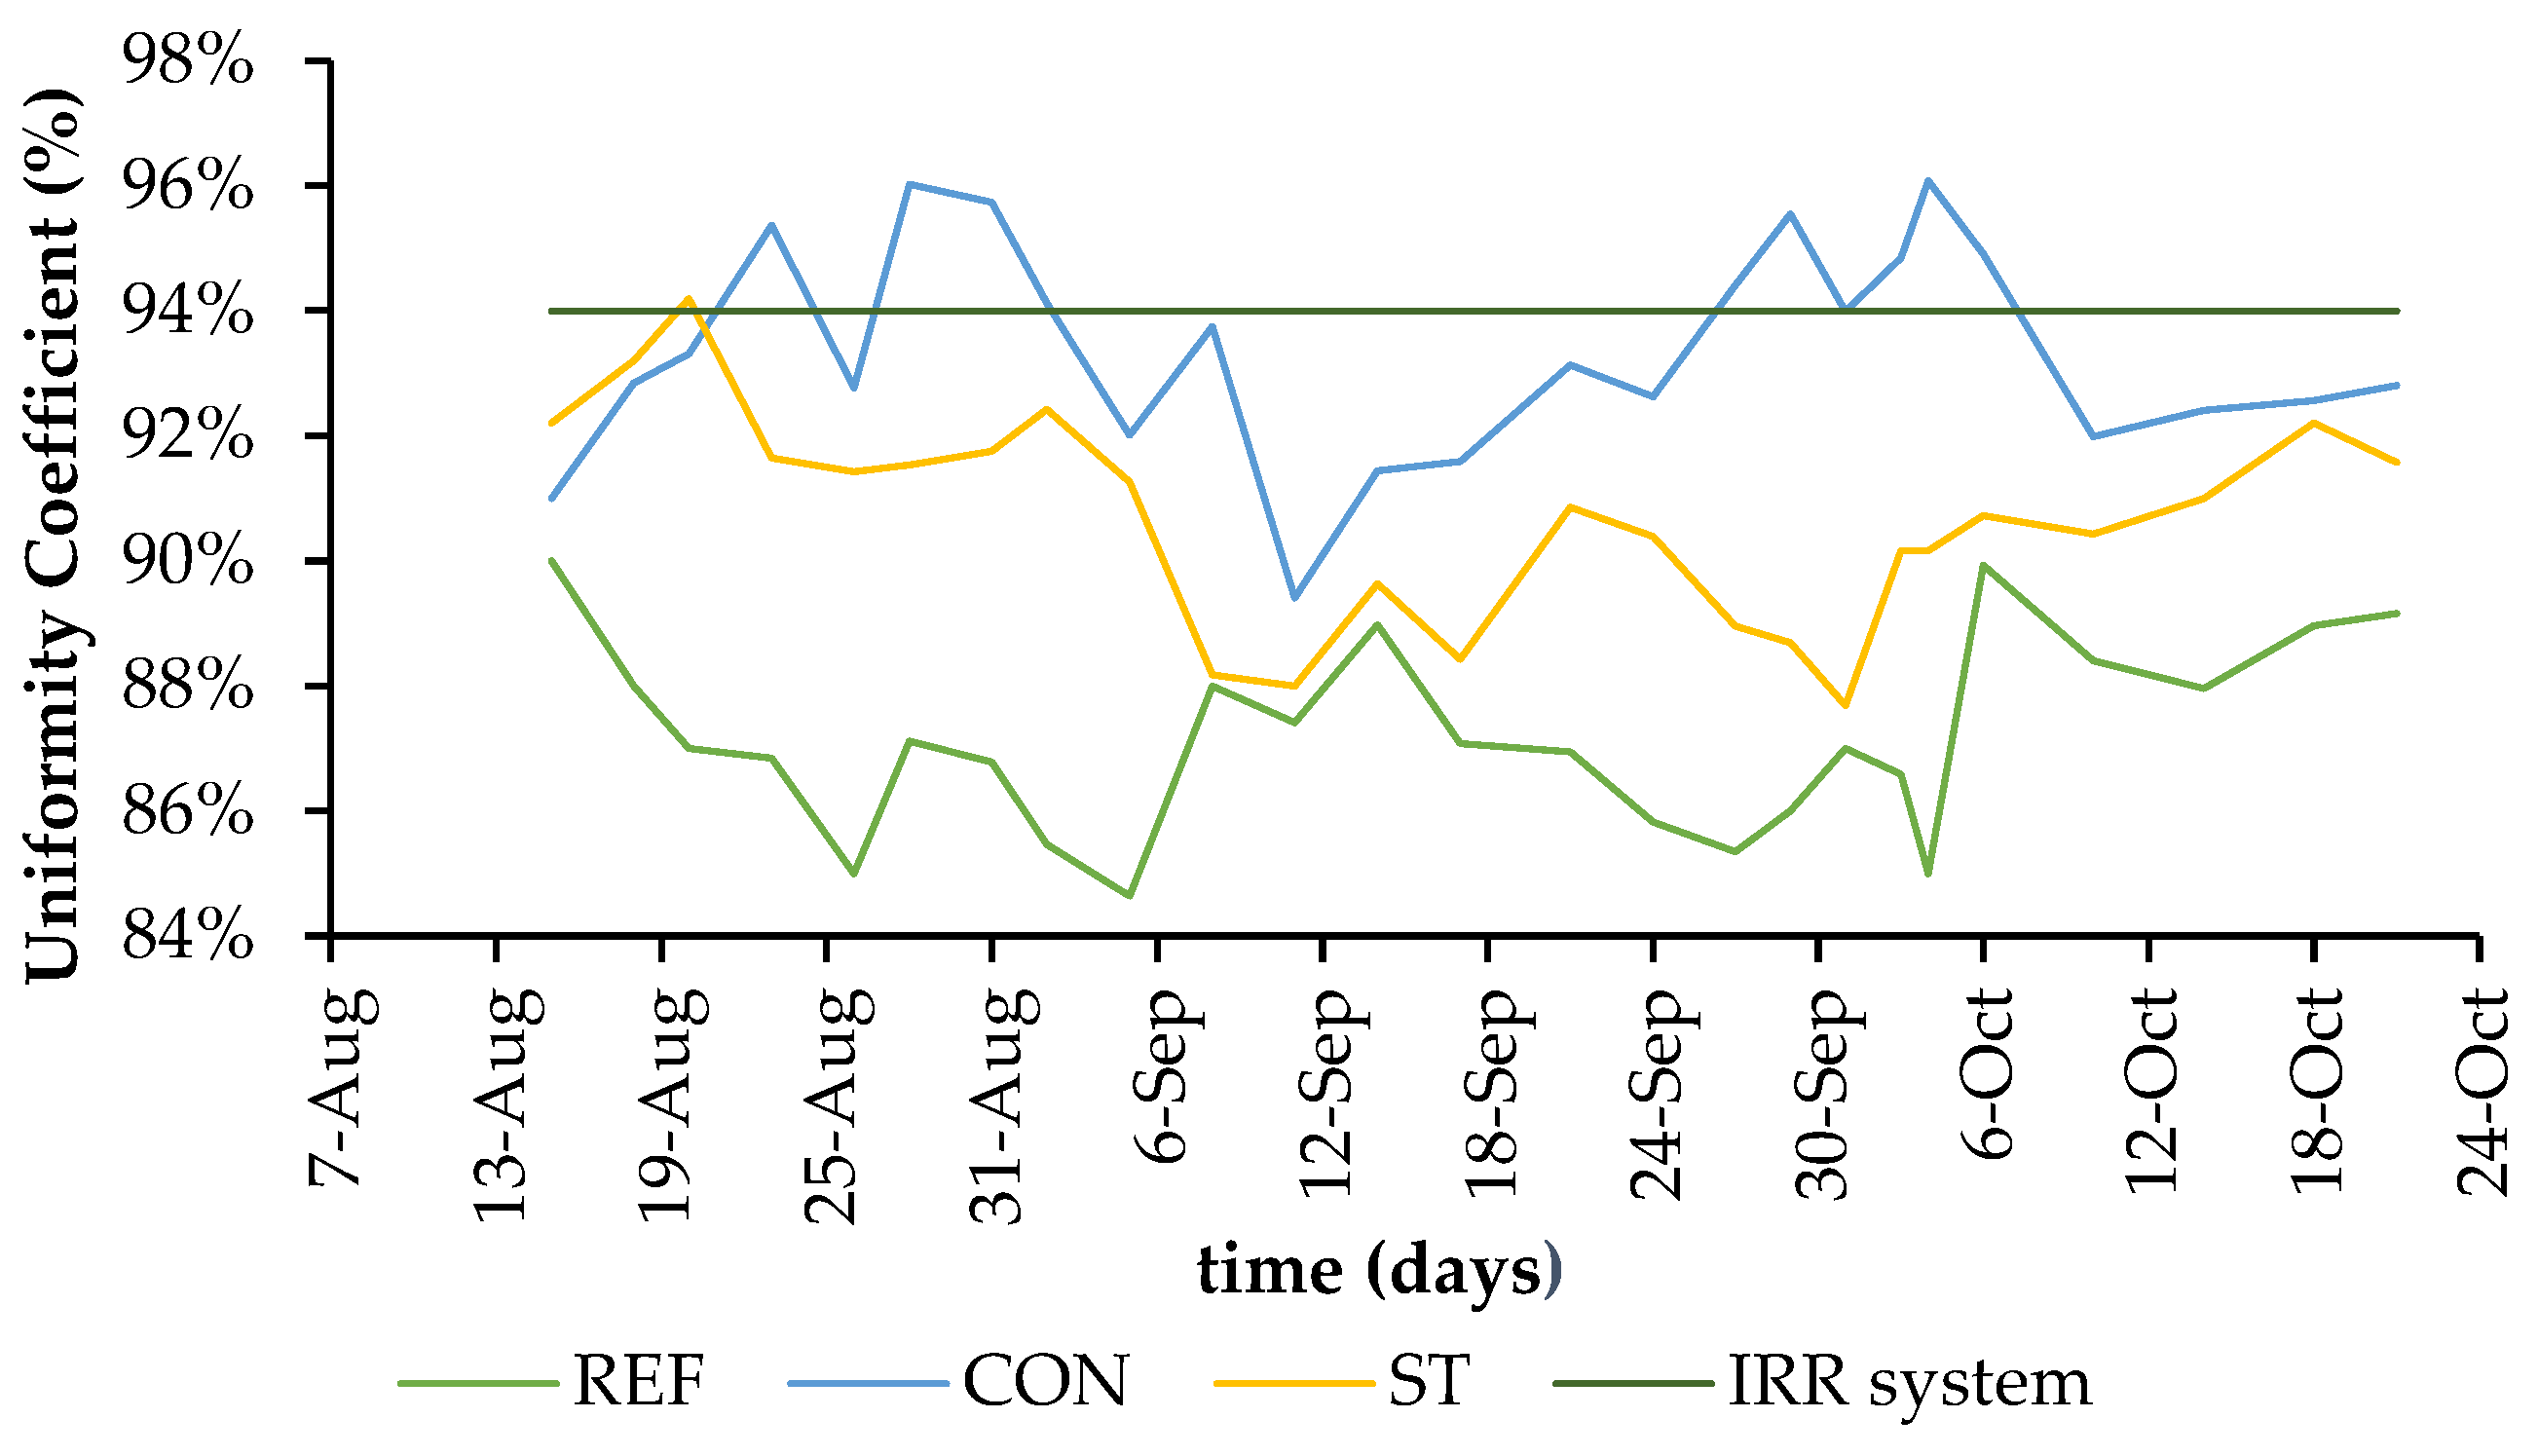
Figure 6 shows the variation of the soil water distribution uniformity and the uniformity of the irrigation system (IRR system) during the experiment.
The uniformity of the irrigation system was measured at the beginning of the experiment and found to be 94%, indicating excellent hydraulic performance [41]. Because irrigation system characteristics remained the same throughout the experiment, irrigation uniformity was assumed to be constant over time, depending solely on the system’s hydraulic properties. On the contrary, the coefficient representing soil water uniformity exhibited spatial and temporal variability, reflecting the complex interactions between water and soil properties.
The presence of AV systems can influence water distribution in the soil. The results of this experiment show that the soil water uniformity distribution is lower in the open field (REF) than under AV systems. It is 85%, 90%, and 94% on average in REF, under ST, and in CON, respectively. It increases by 5% and 9% under the semi-transparent and conventional panels, respectively. In fact, in the open field, water is lost vertically by evaporation, which does not occur immediately under the panels. Instead, lateral water movement in the soil is more pronounced beneath the panels, resulting in improved water distribution throughout the soil. Thus, by covering the soil with solar panels, the vertical losses due to evaporation under AV systems decreased, thereby improving lateral water movement in the soil and, consequently, increasing the uniformity of soil water distribution.

3.1.4. Incoming Radiation and Photosynthetic Active Radiation (PAR)

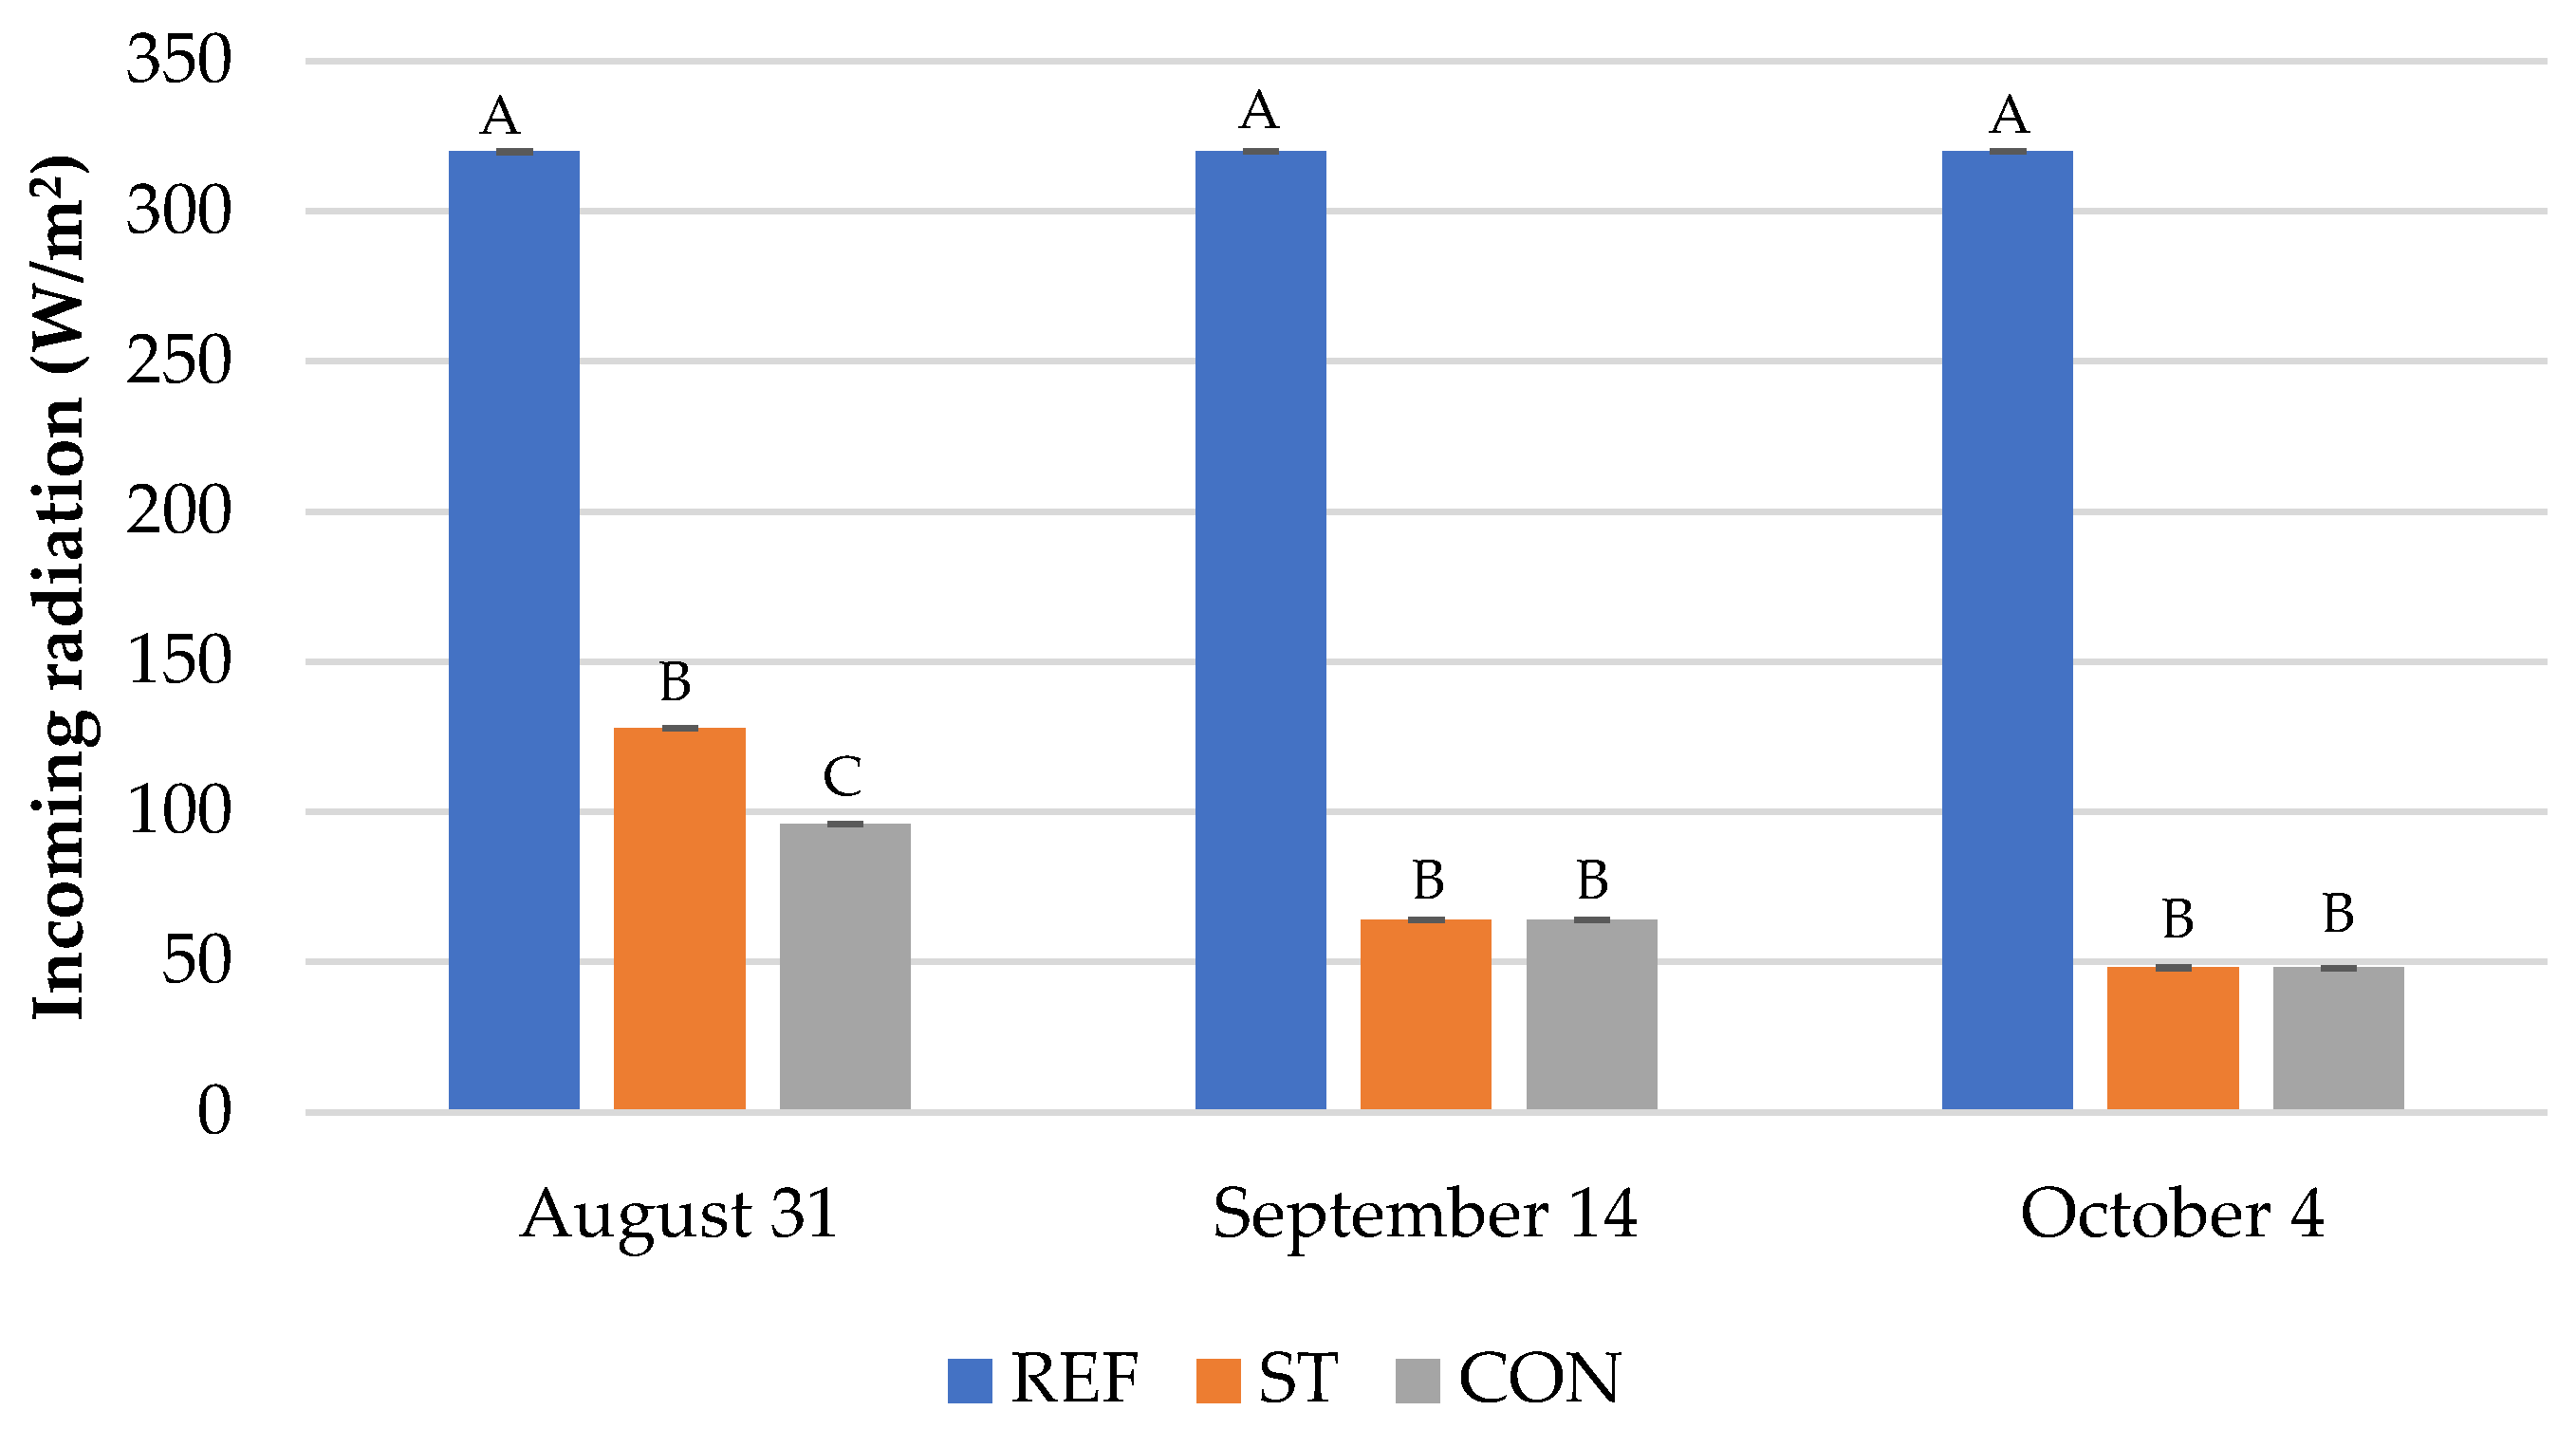
Incoming solar radiation and PAR were strongly affected by the presence of AV panels throughout the growing season. Incoming radiation measured under the panels was significantly lower than in the open field (REF) on all three measurement dates (Figure 7). Compared with REF, solar radiation was reduced by approximately 70% under ST and by 80% under CON.
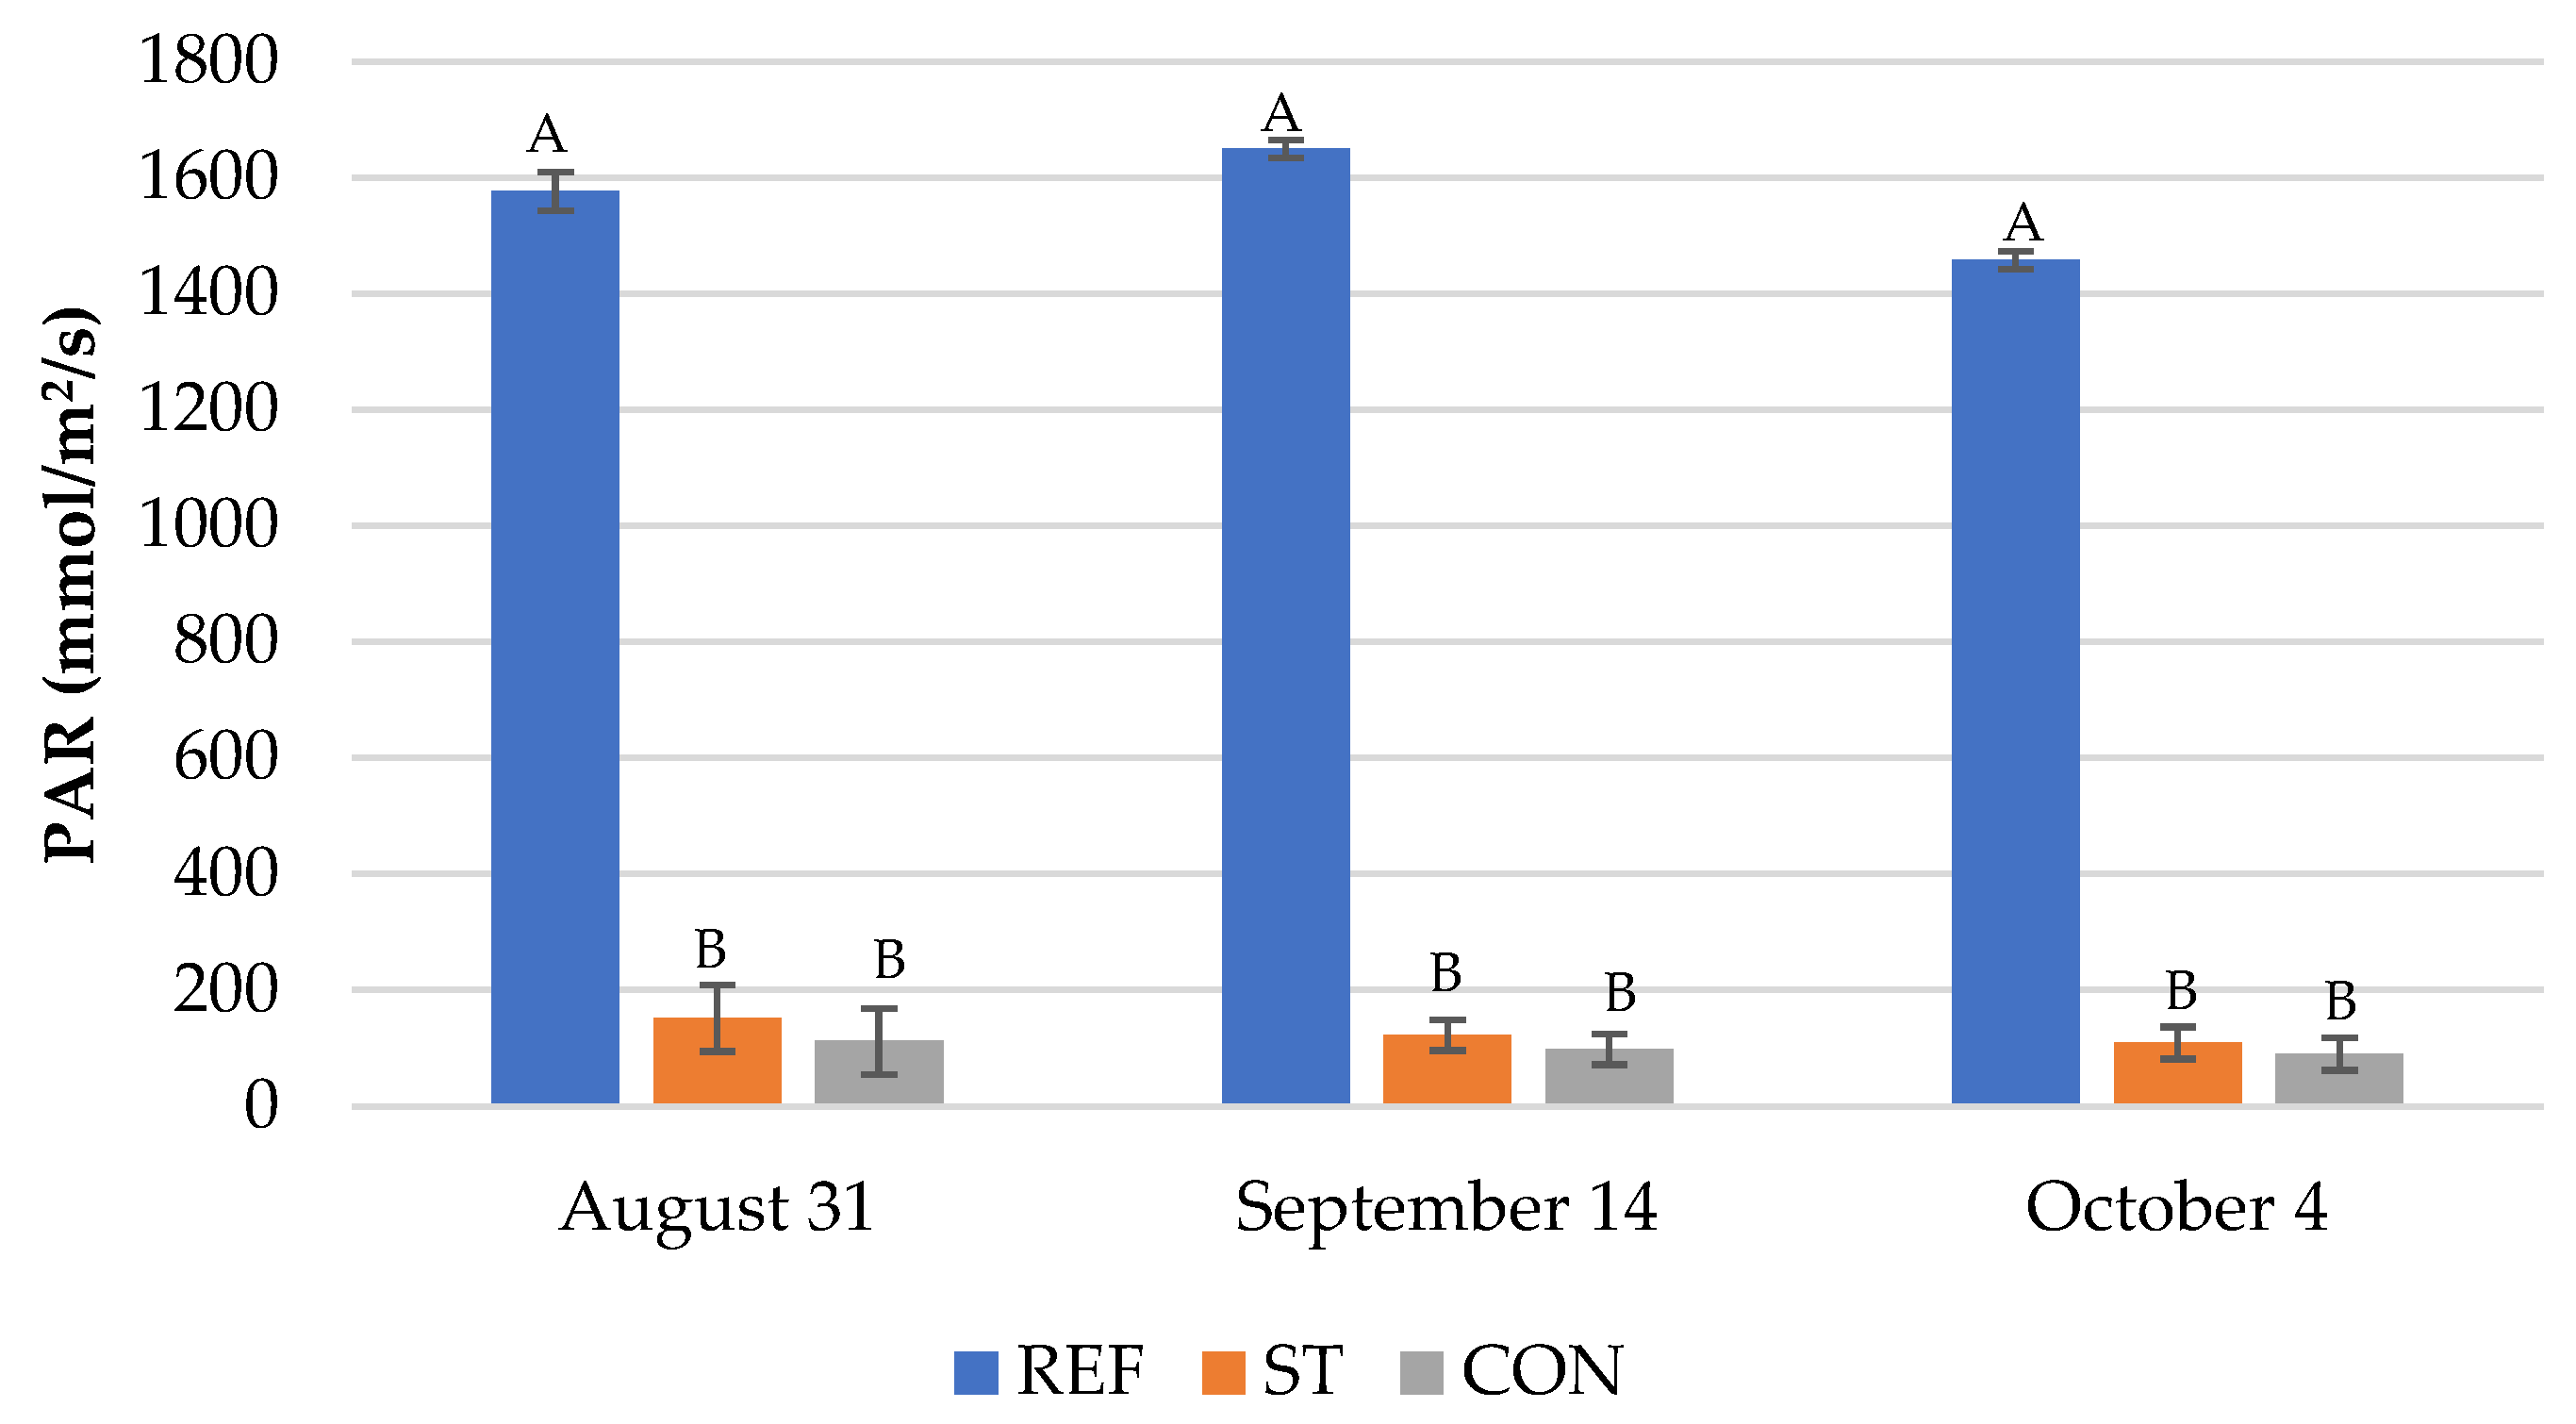
A similar pattern was observed for PAR (Figure 8). PAR values under both ST and CON treatments were lower than those measured in REF across all sampling dates. The PAR decrease is within the range of existing modelling and field studies, where radiation reductions varied from 12% to more than 60%, depending on the AV system configuration [12,42]. In the same context, Weselek et al. [36] reported a 30% reduction in PAR under the AV system during a celeriac cultivation study in Germany. Overall, differences between ST and CON were not statistically significant, indicating that panel transparency did not substantially modify the amount of PAR reaching the crop under the tested configuration. This indicates that, under the tested configuration, the design feature intended to increase light interception by semi-transparent modules did not produce the expected improvement in PAR at the crop level.

3.1.5. Leaf Gas Exchange Responses

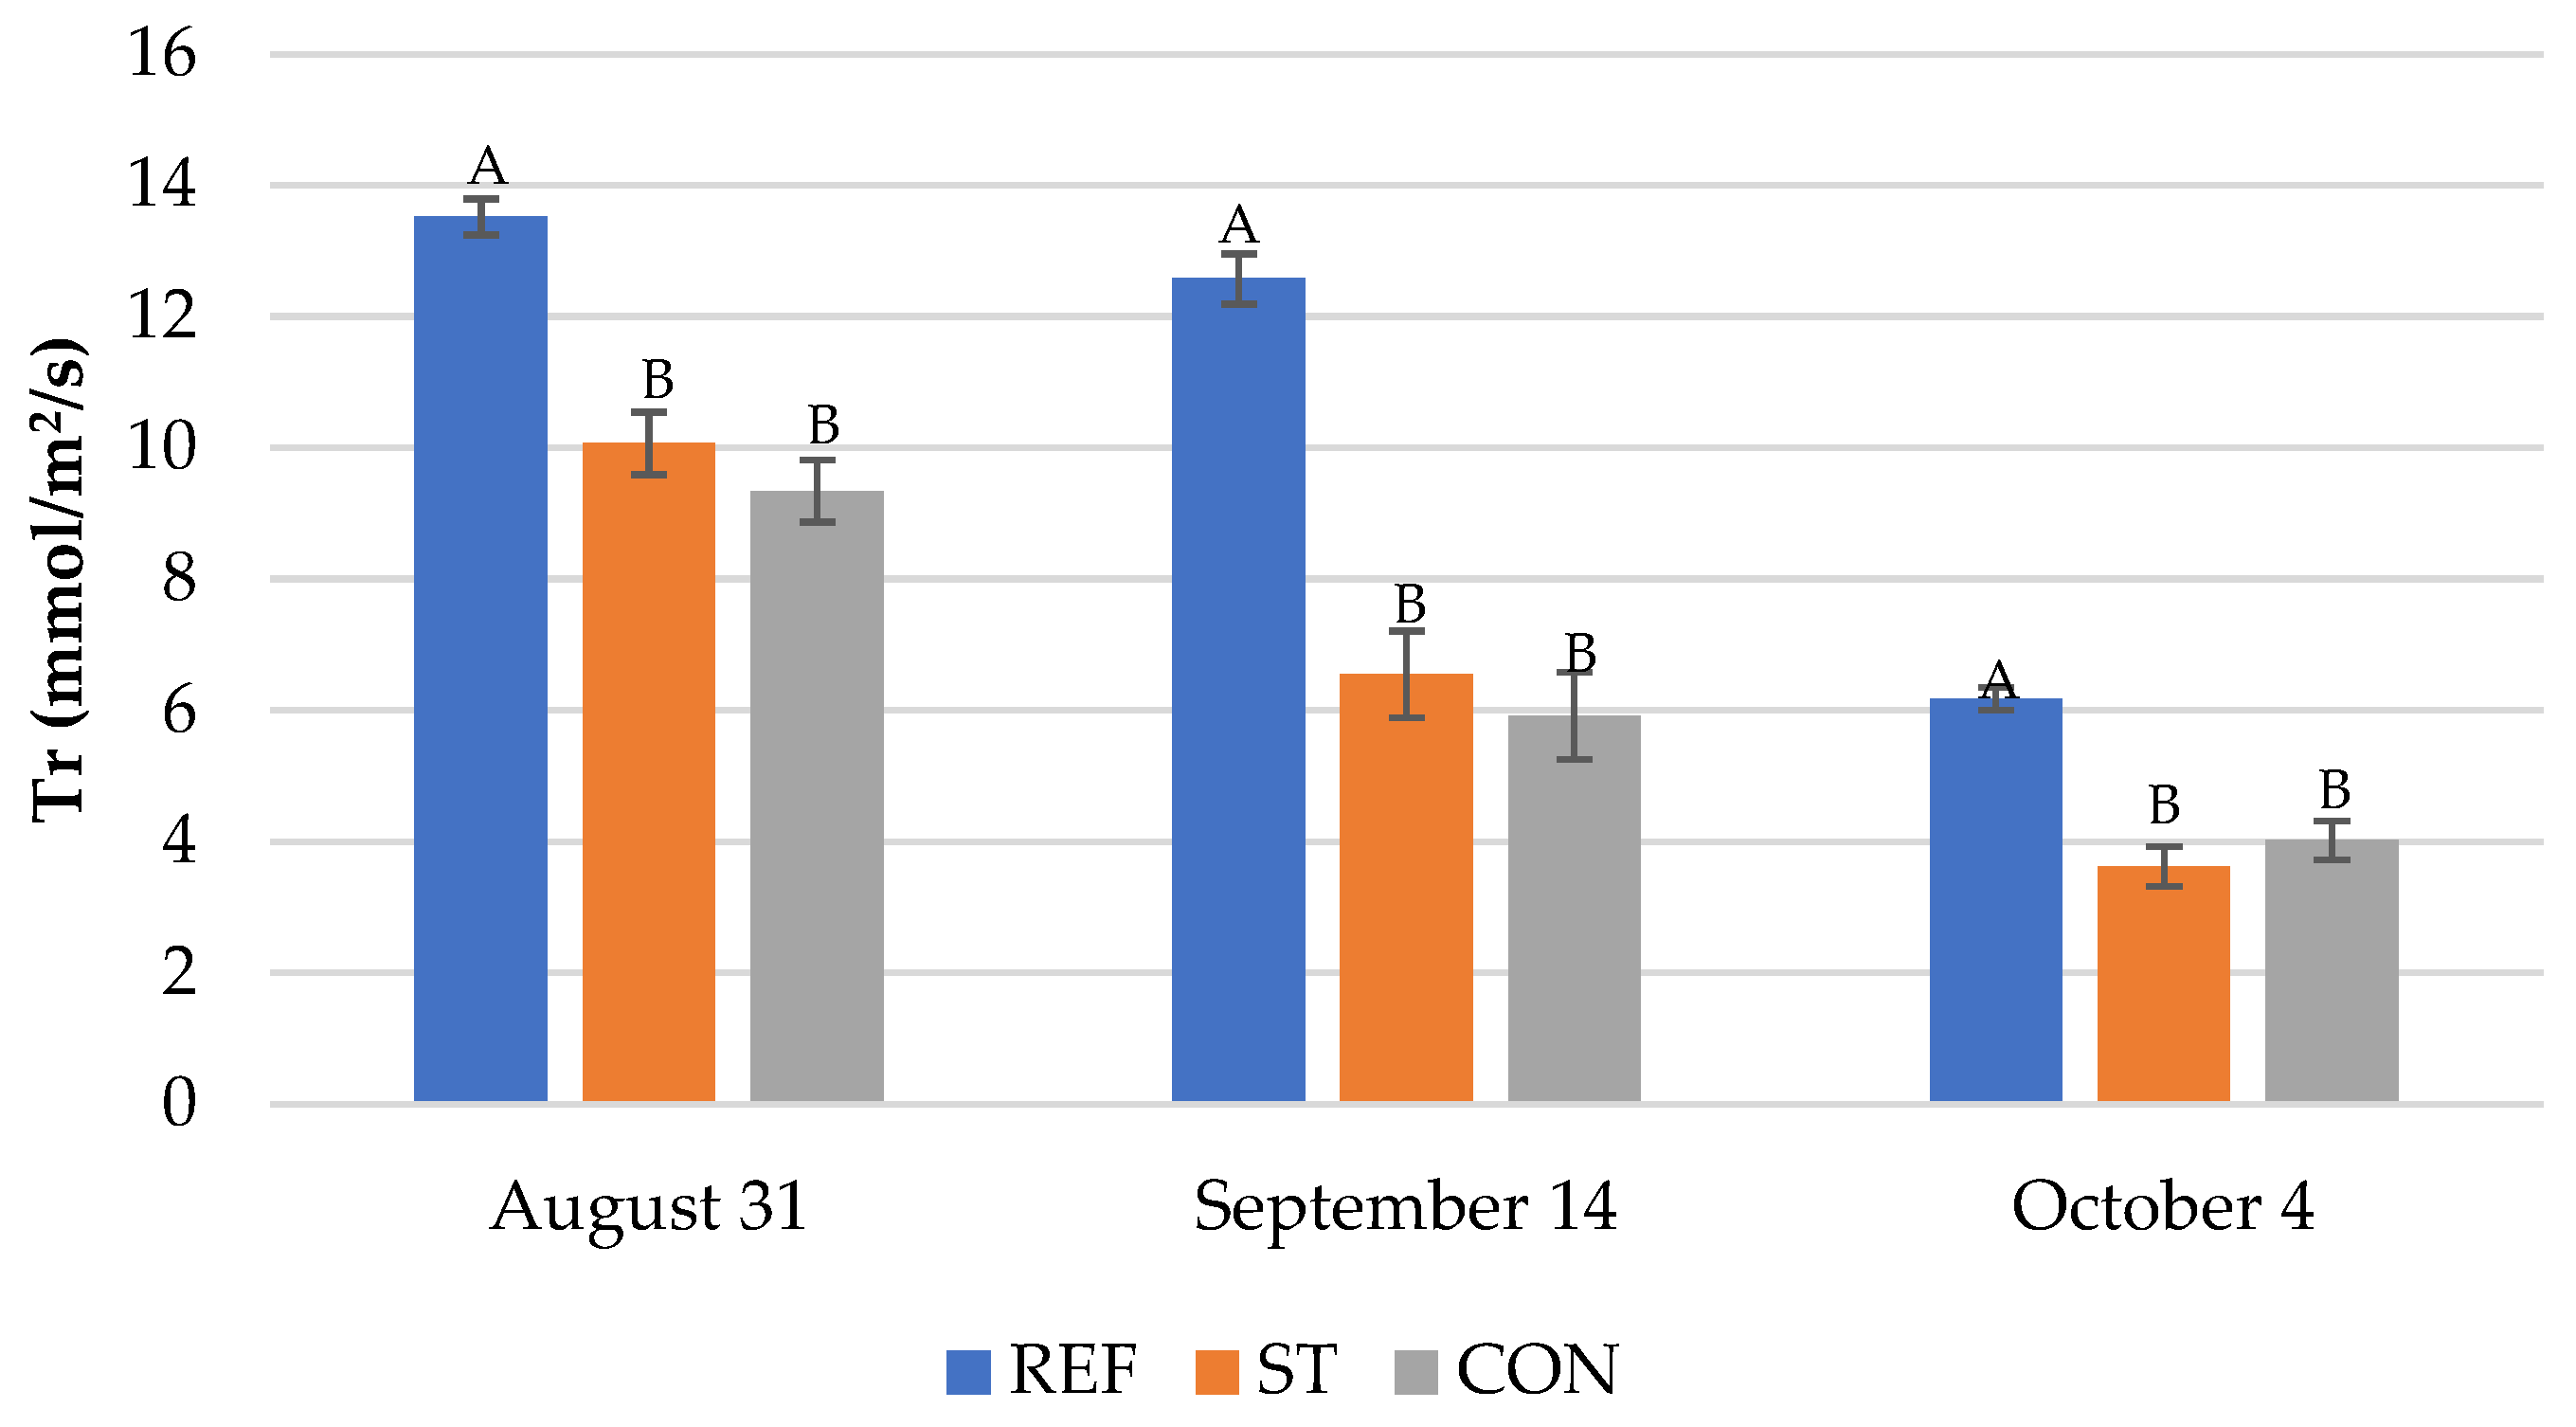
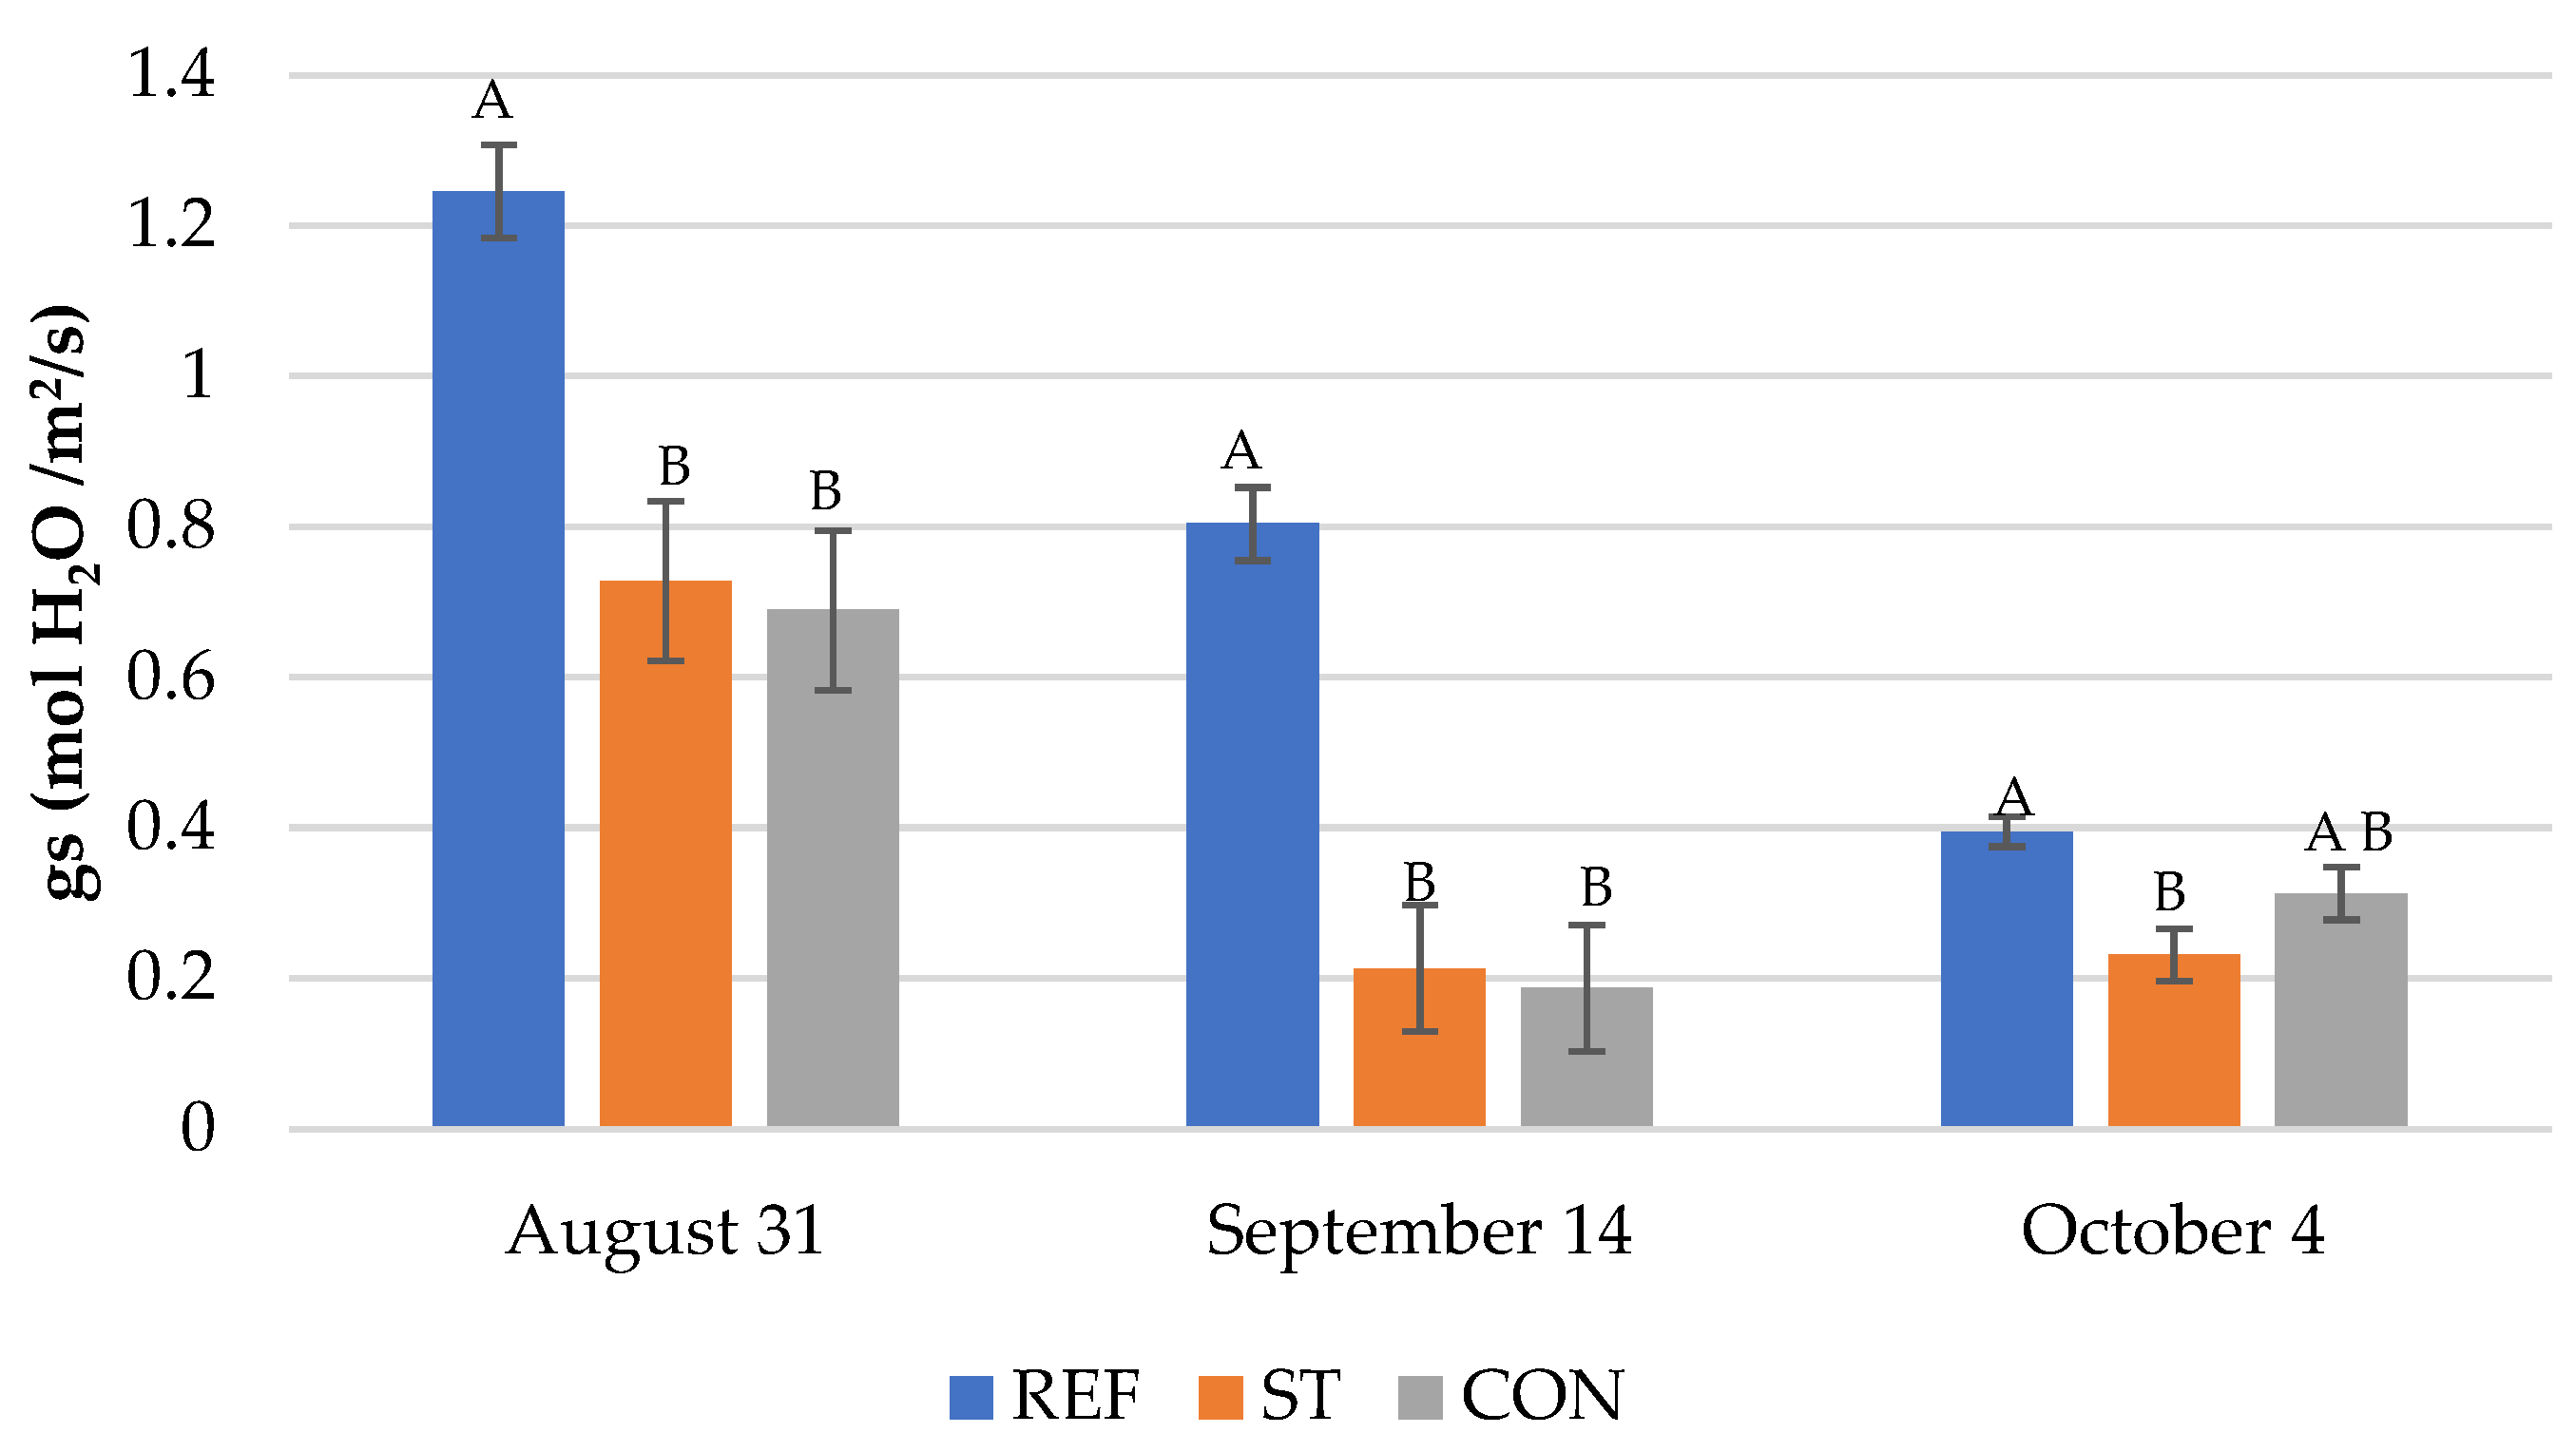
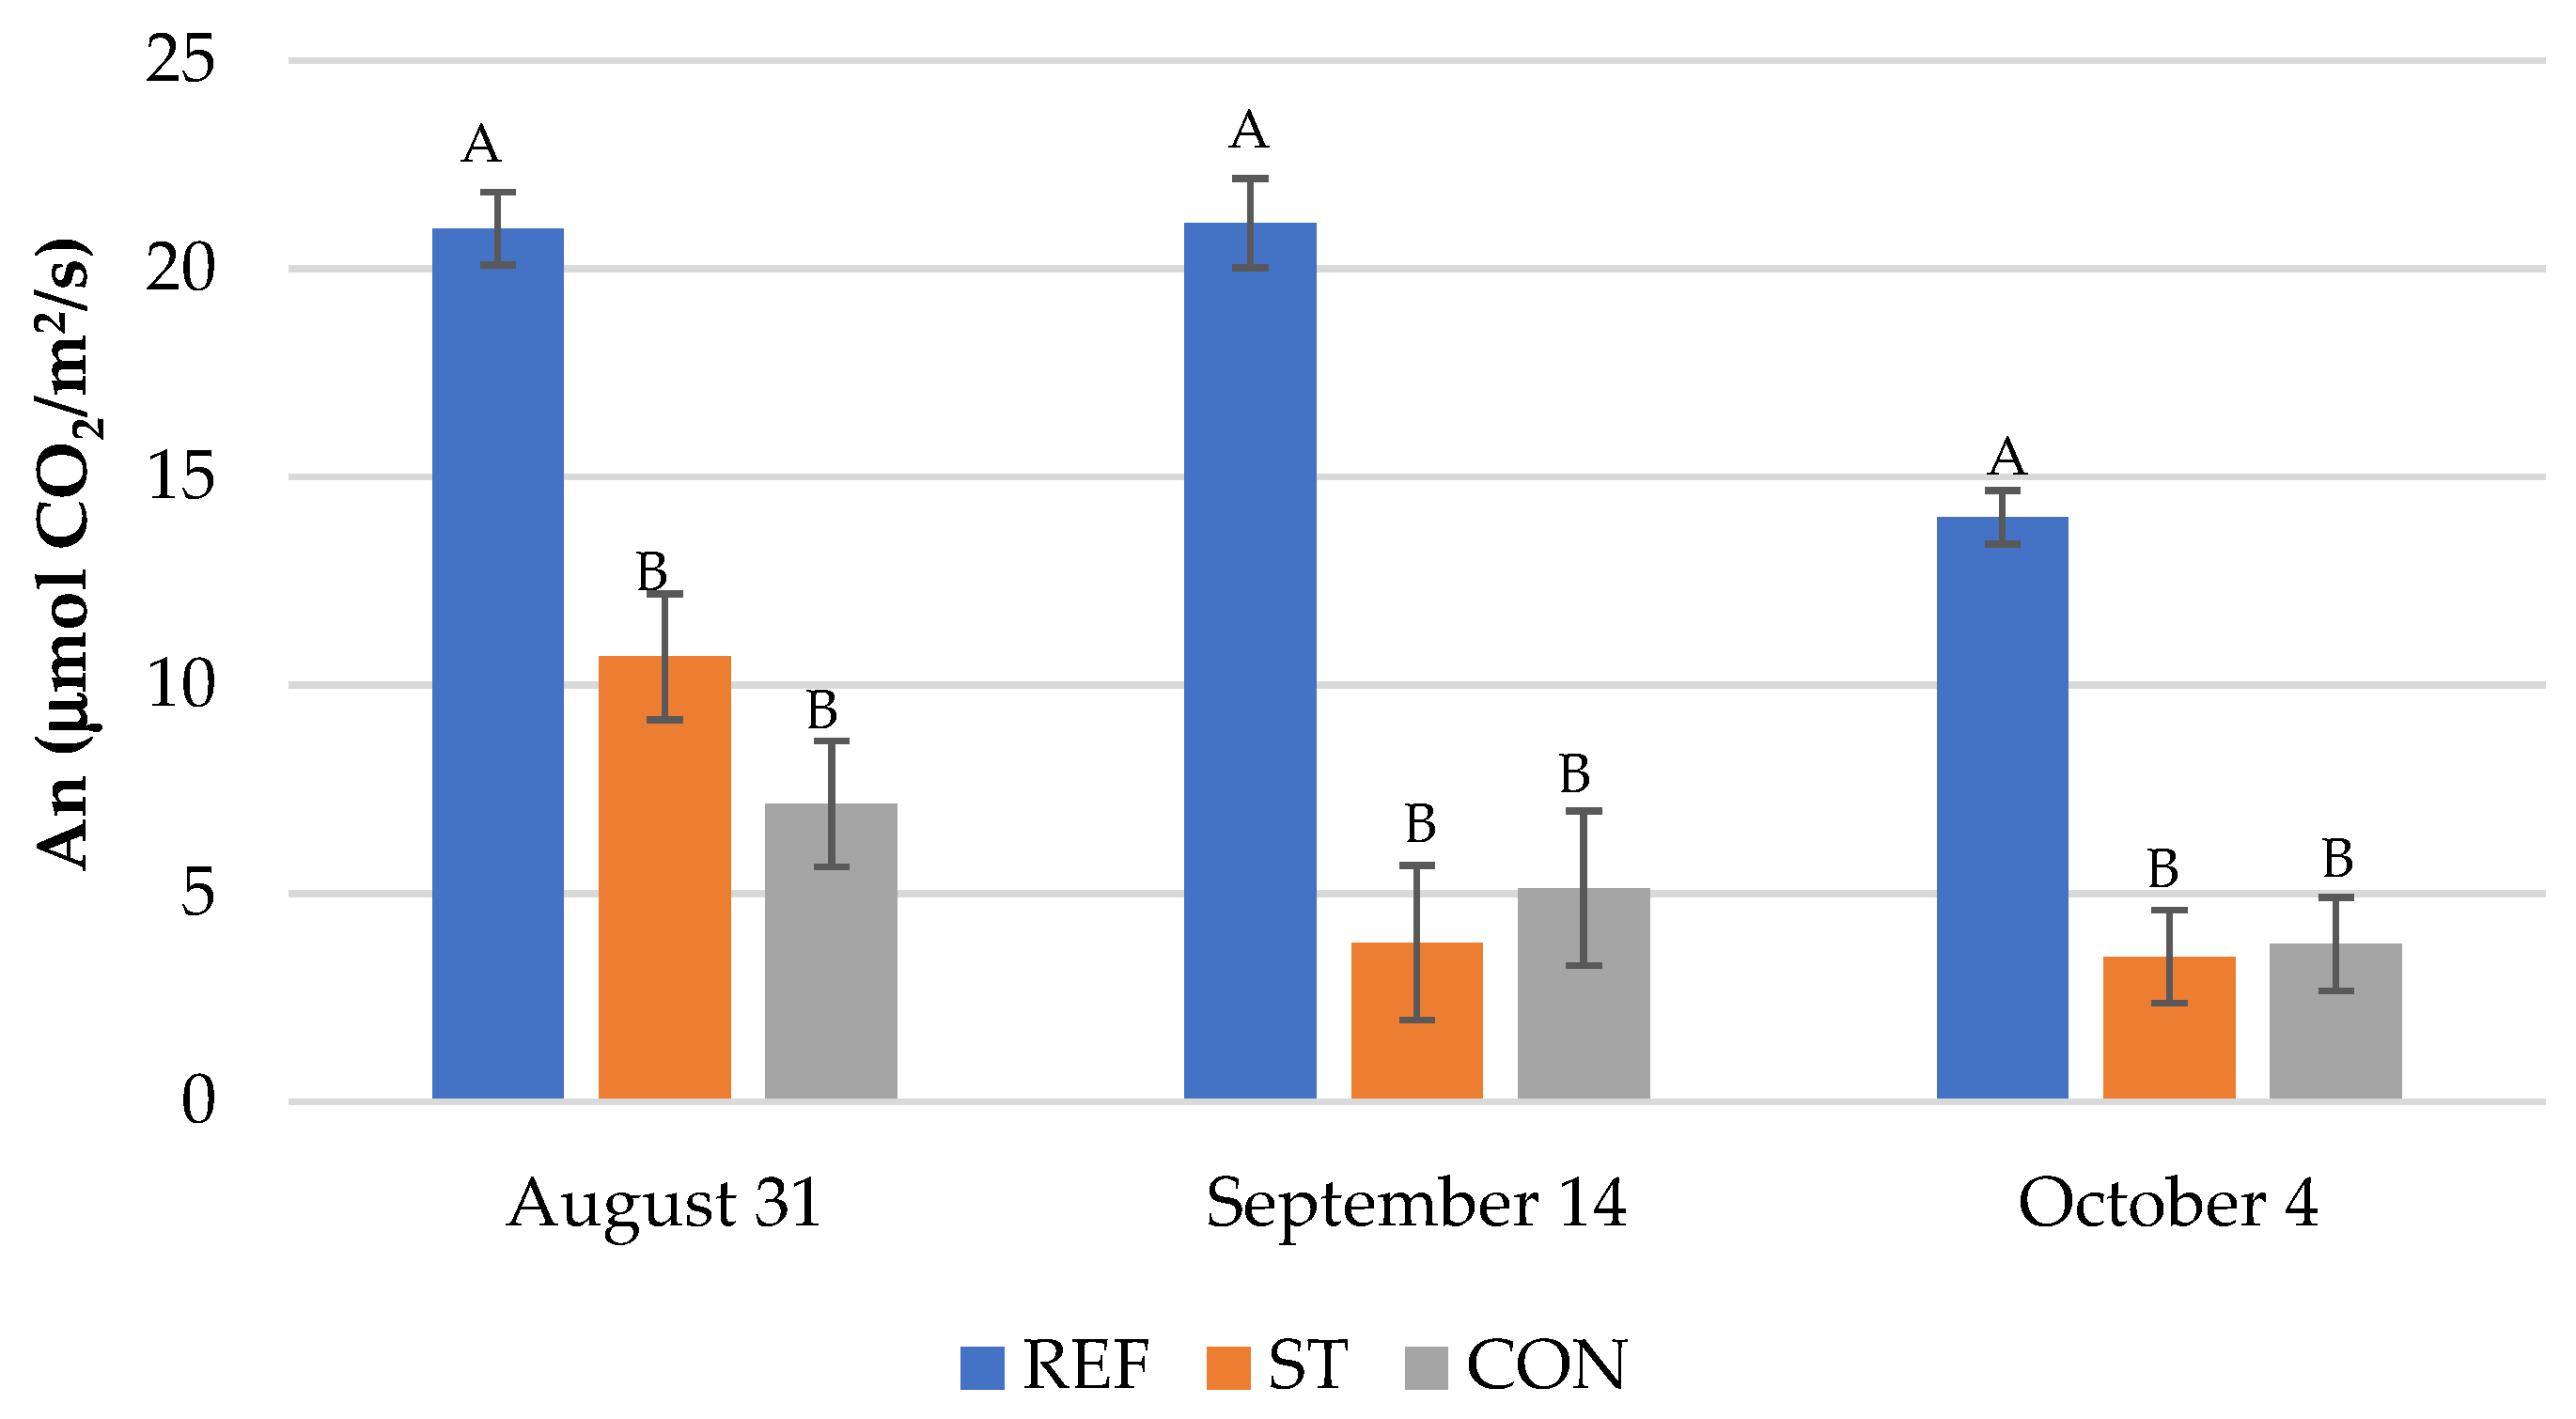
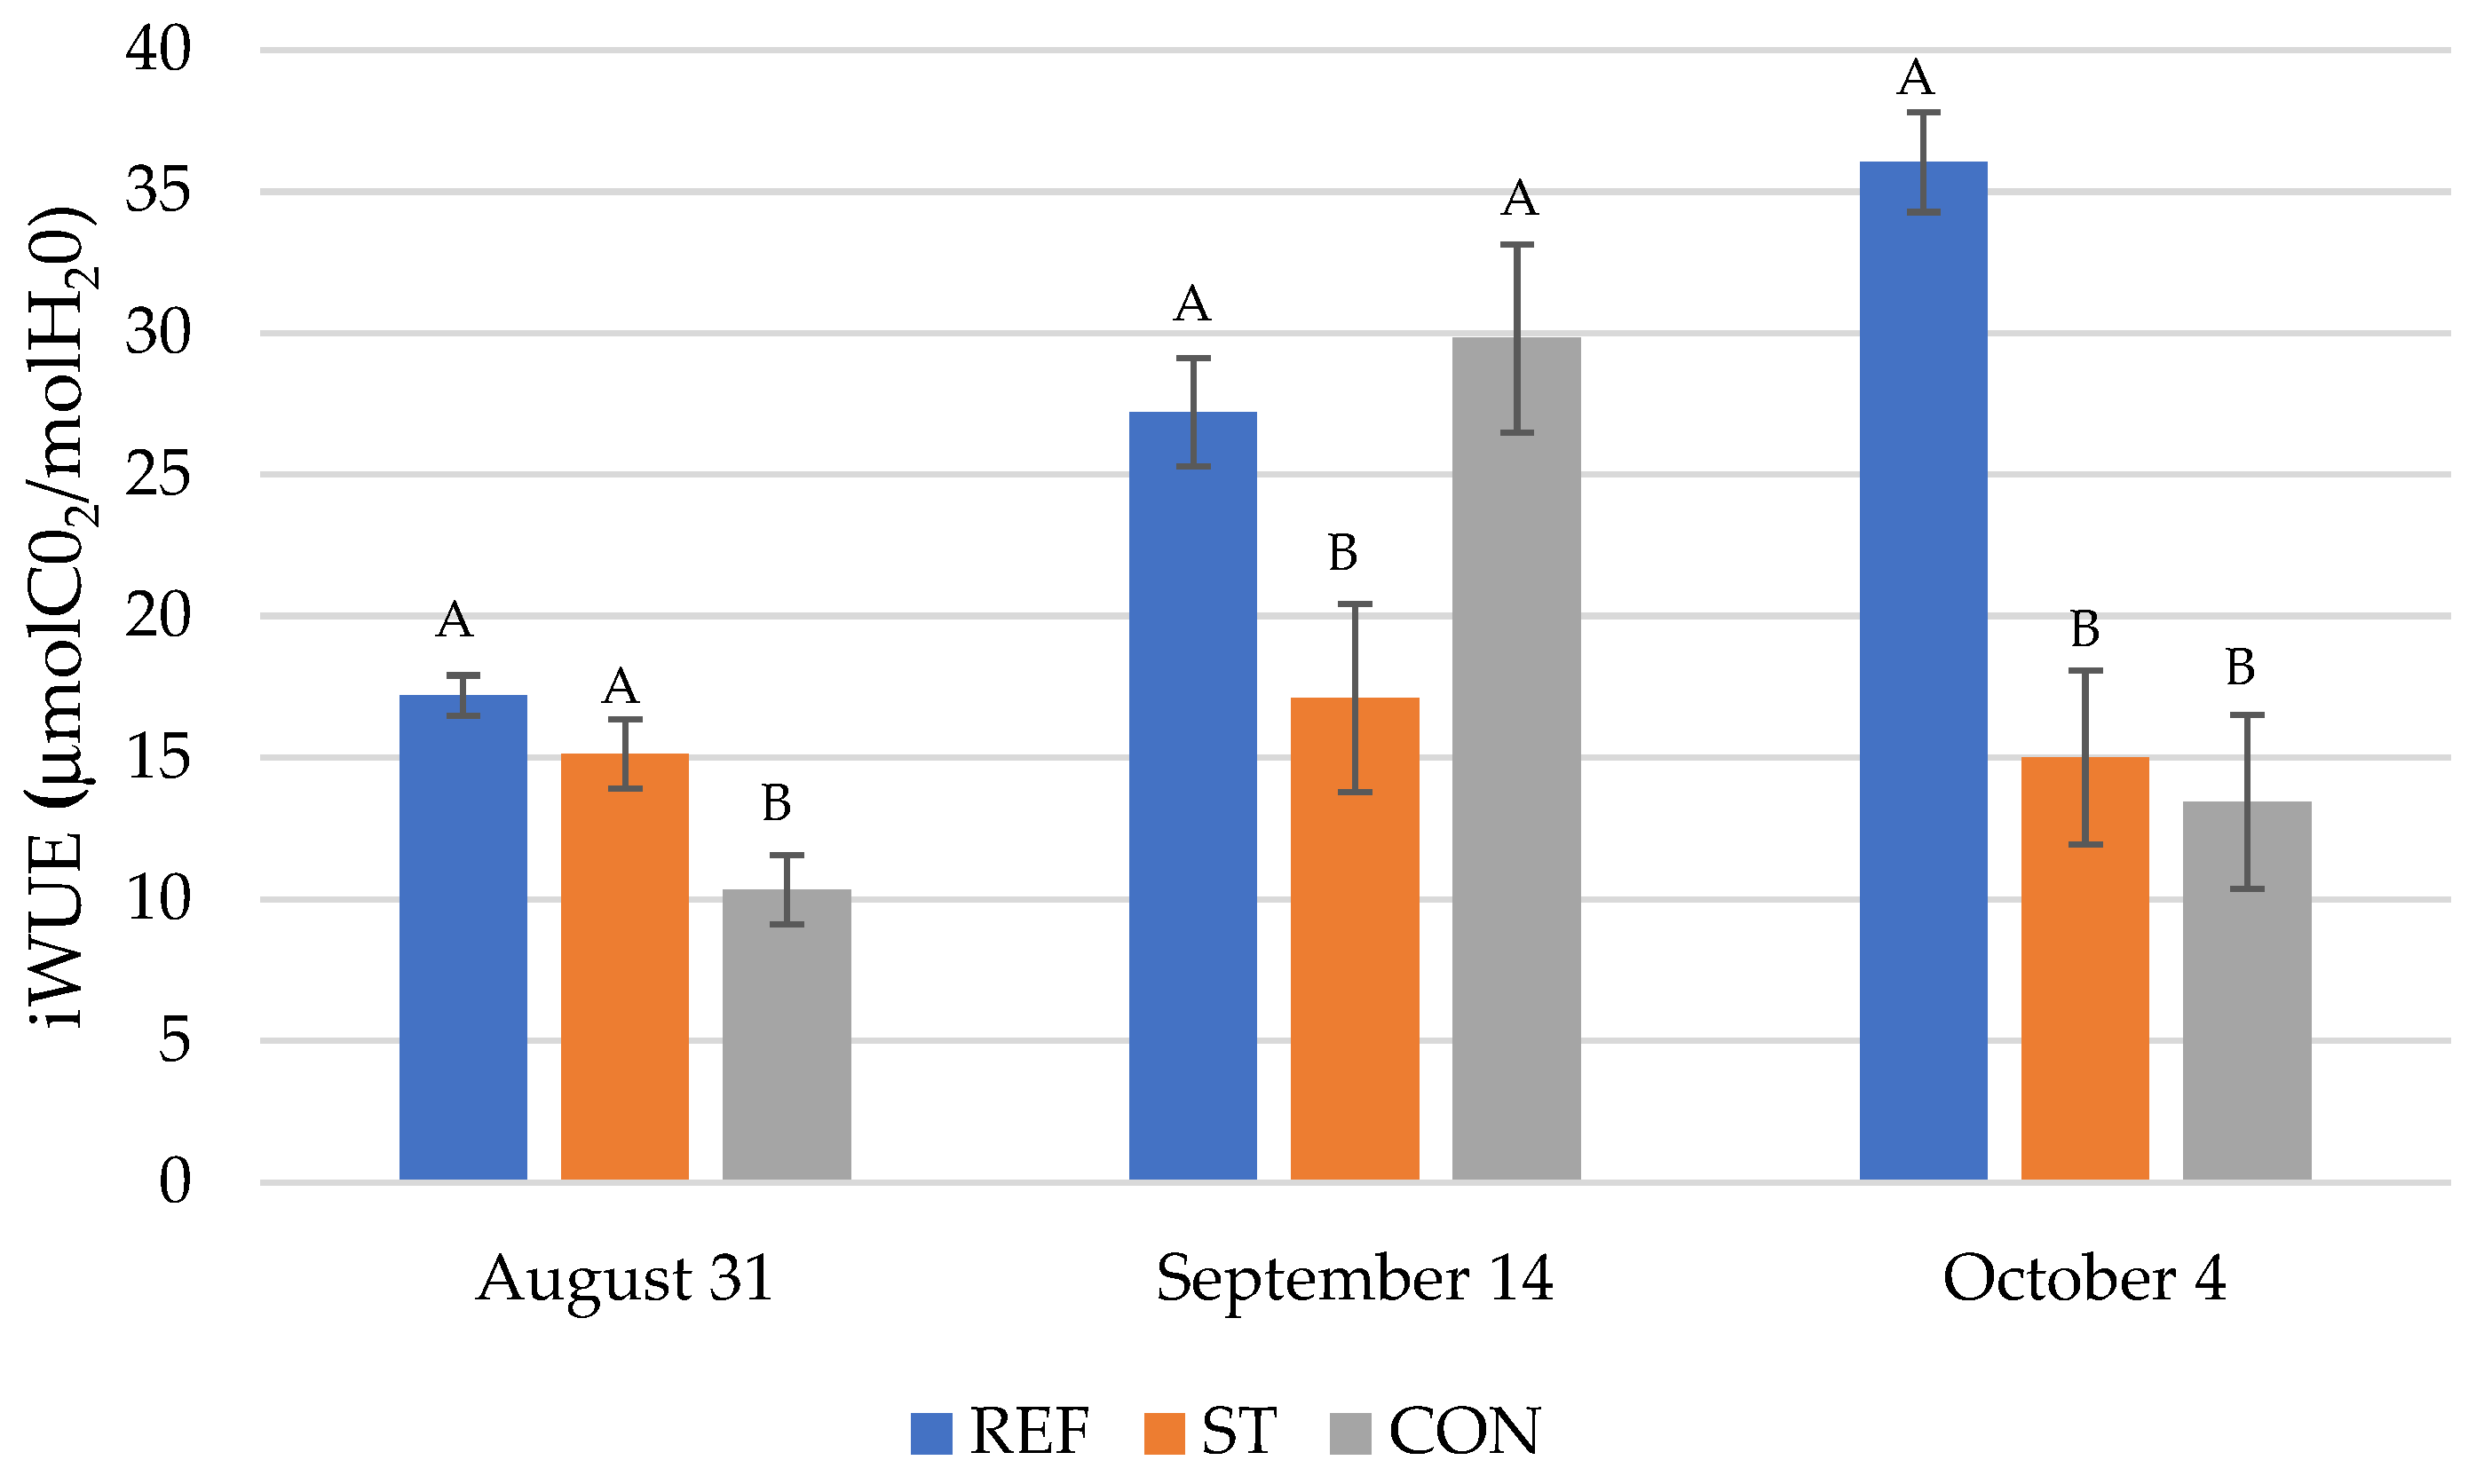
The physiological parameters were also measured by the LI-COR at three distinct vegetative stages, and the results are presented in Figure 9, Figure 10, Figure 11 and Figure 12. Across all measurement dates, transpiration rate, stomatal conductance, net photosynthesis, and intrinsic water use efficiency (iWUE) were higher in REF than under both AV systems. In contrast, no significant differences were observed between ST and CON for these parameters, indicating comparable physiological responses under both panel types. These results are consistent with the marked reductions in incoming radiation and PAR under the AV systems. The lower values of these parameters under the panels reflect reduced light availability at the canopy level. Light intensity is a primary driver of photosynthetic electron transport, stomatal opening, and enzymatic activity associated with carbon assimilation. As a result, shading induced by the AV limits photosynthetic capacity and gas exchange by restricting the amount of solar energy intercepted by the crop canopy [43].

3.2. Fresh and Dry Yield of Arugula

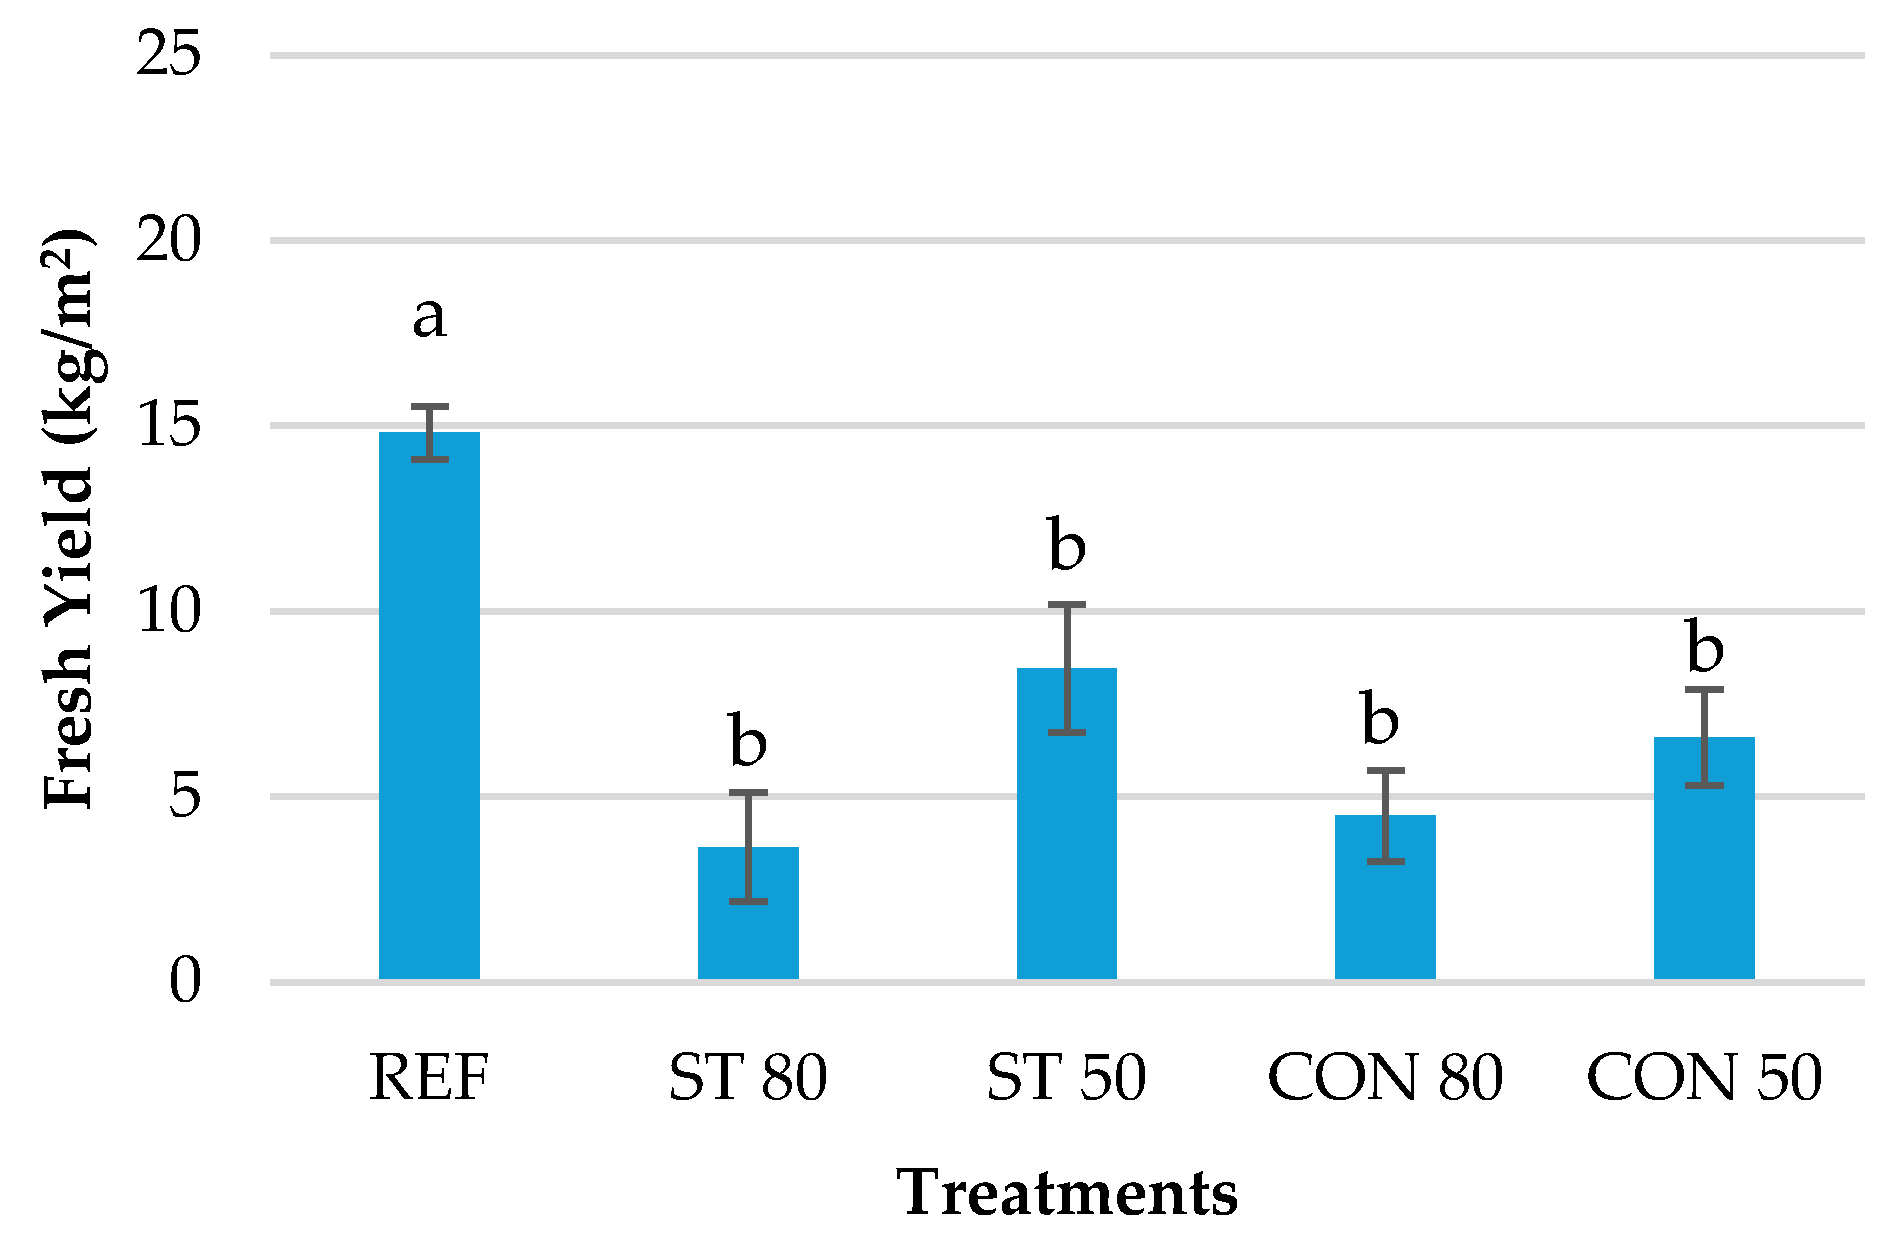
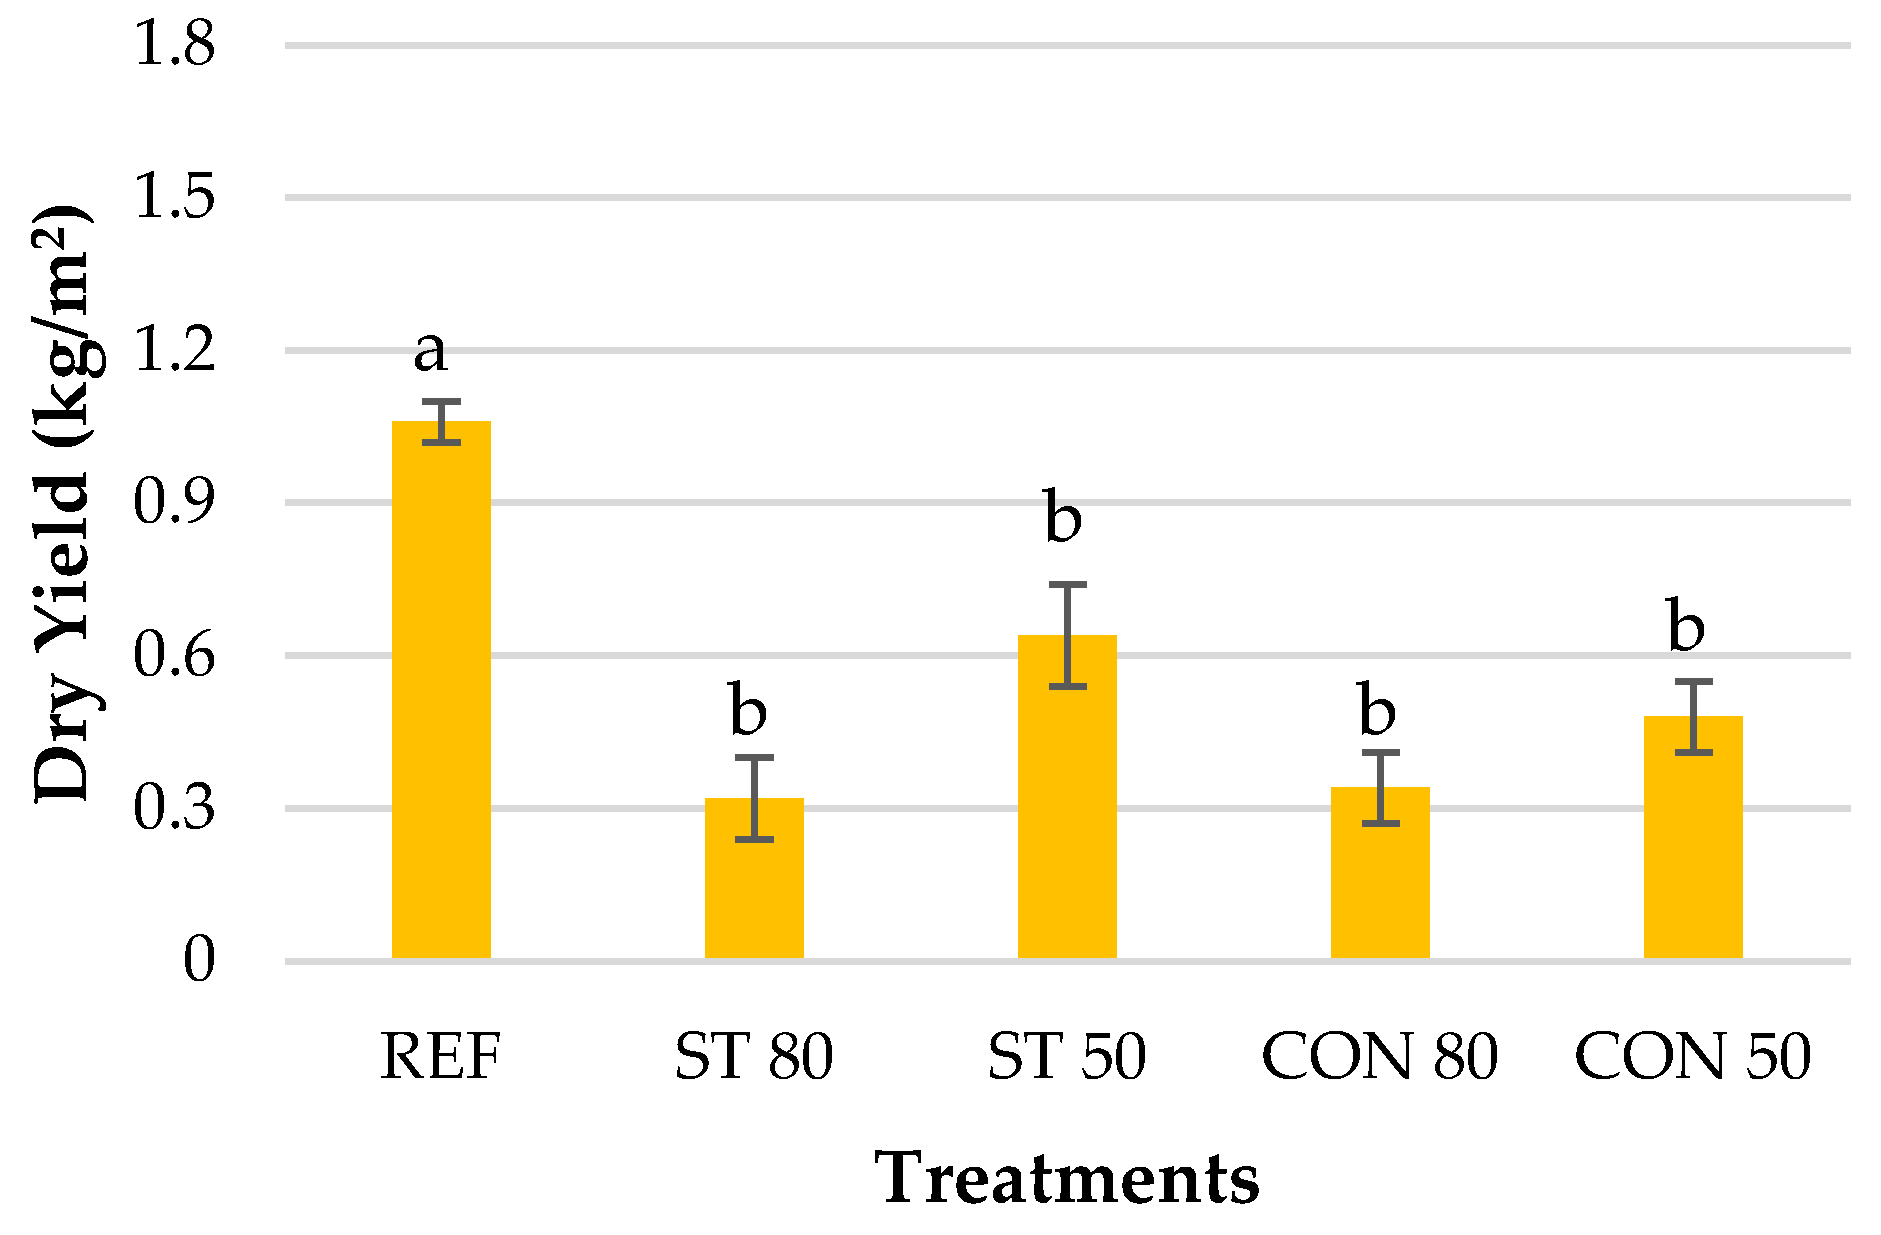
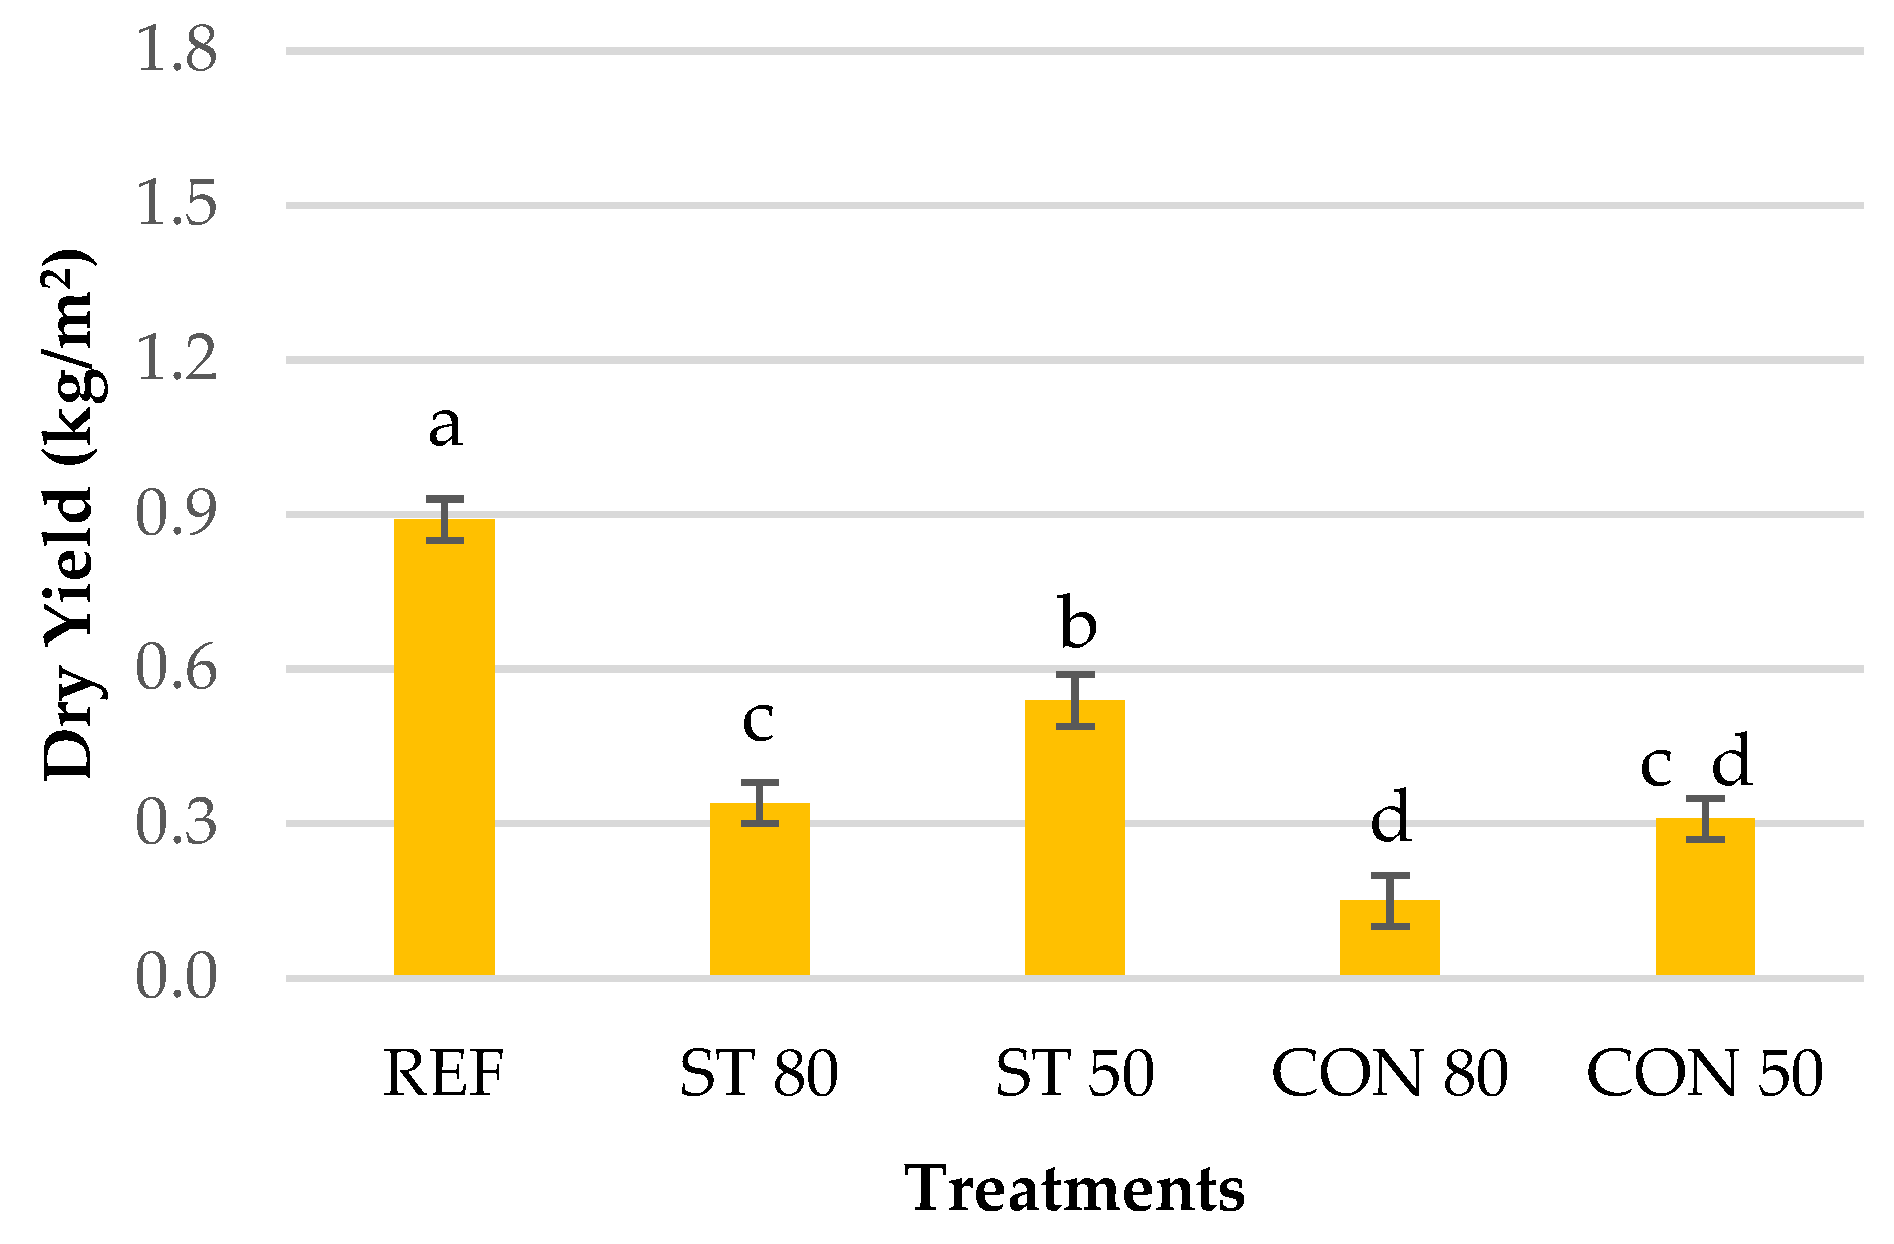
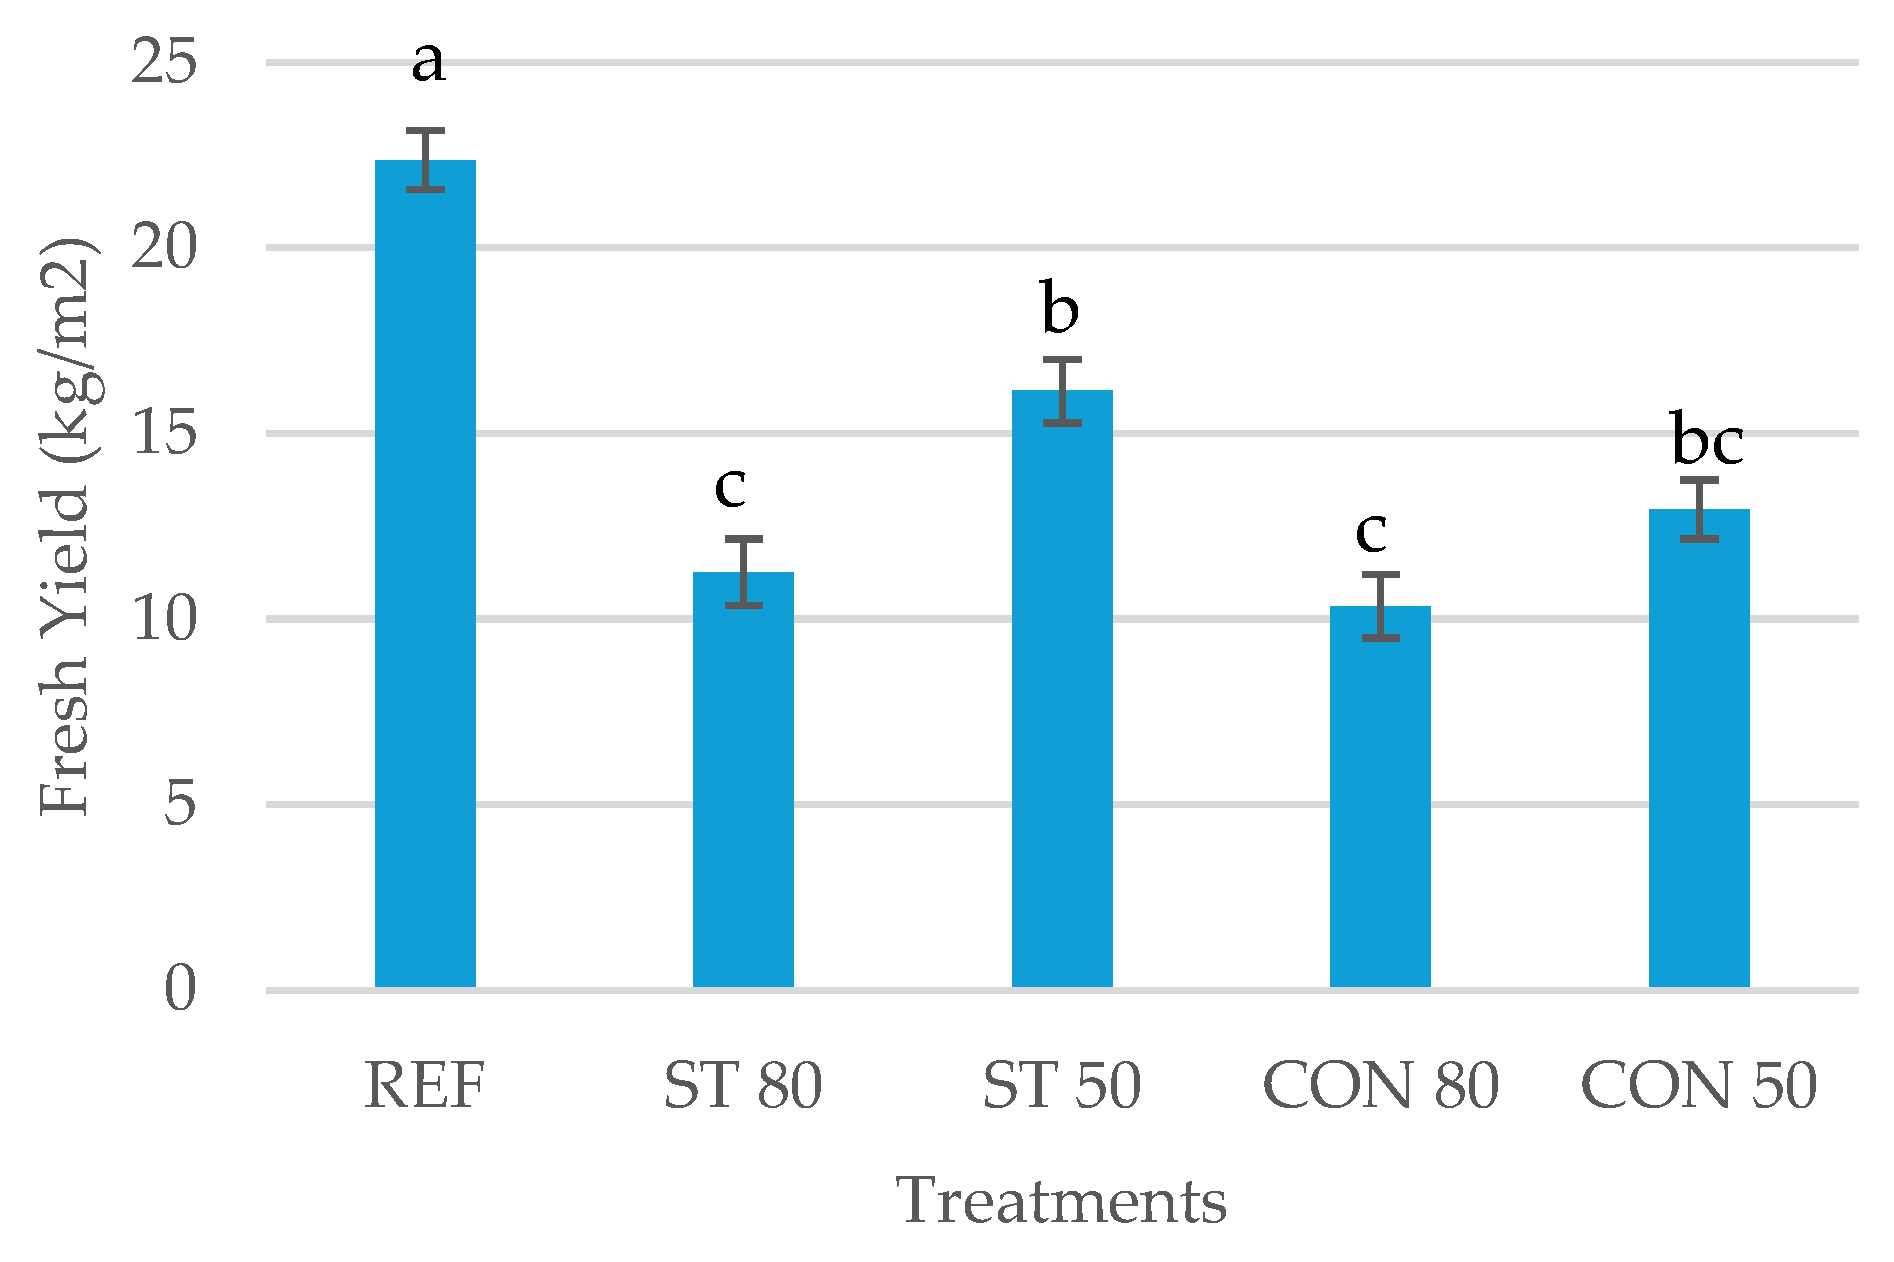
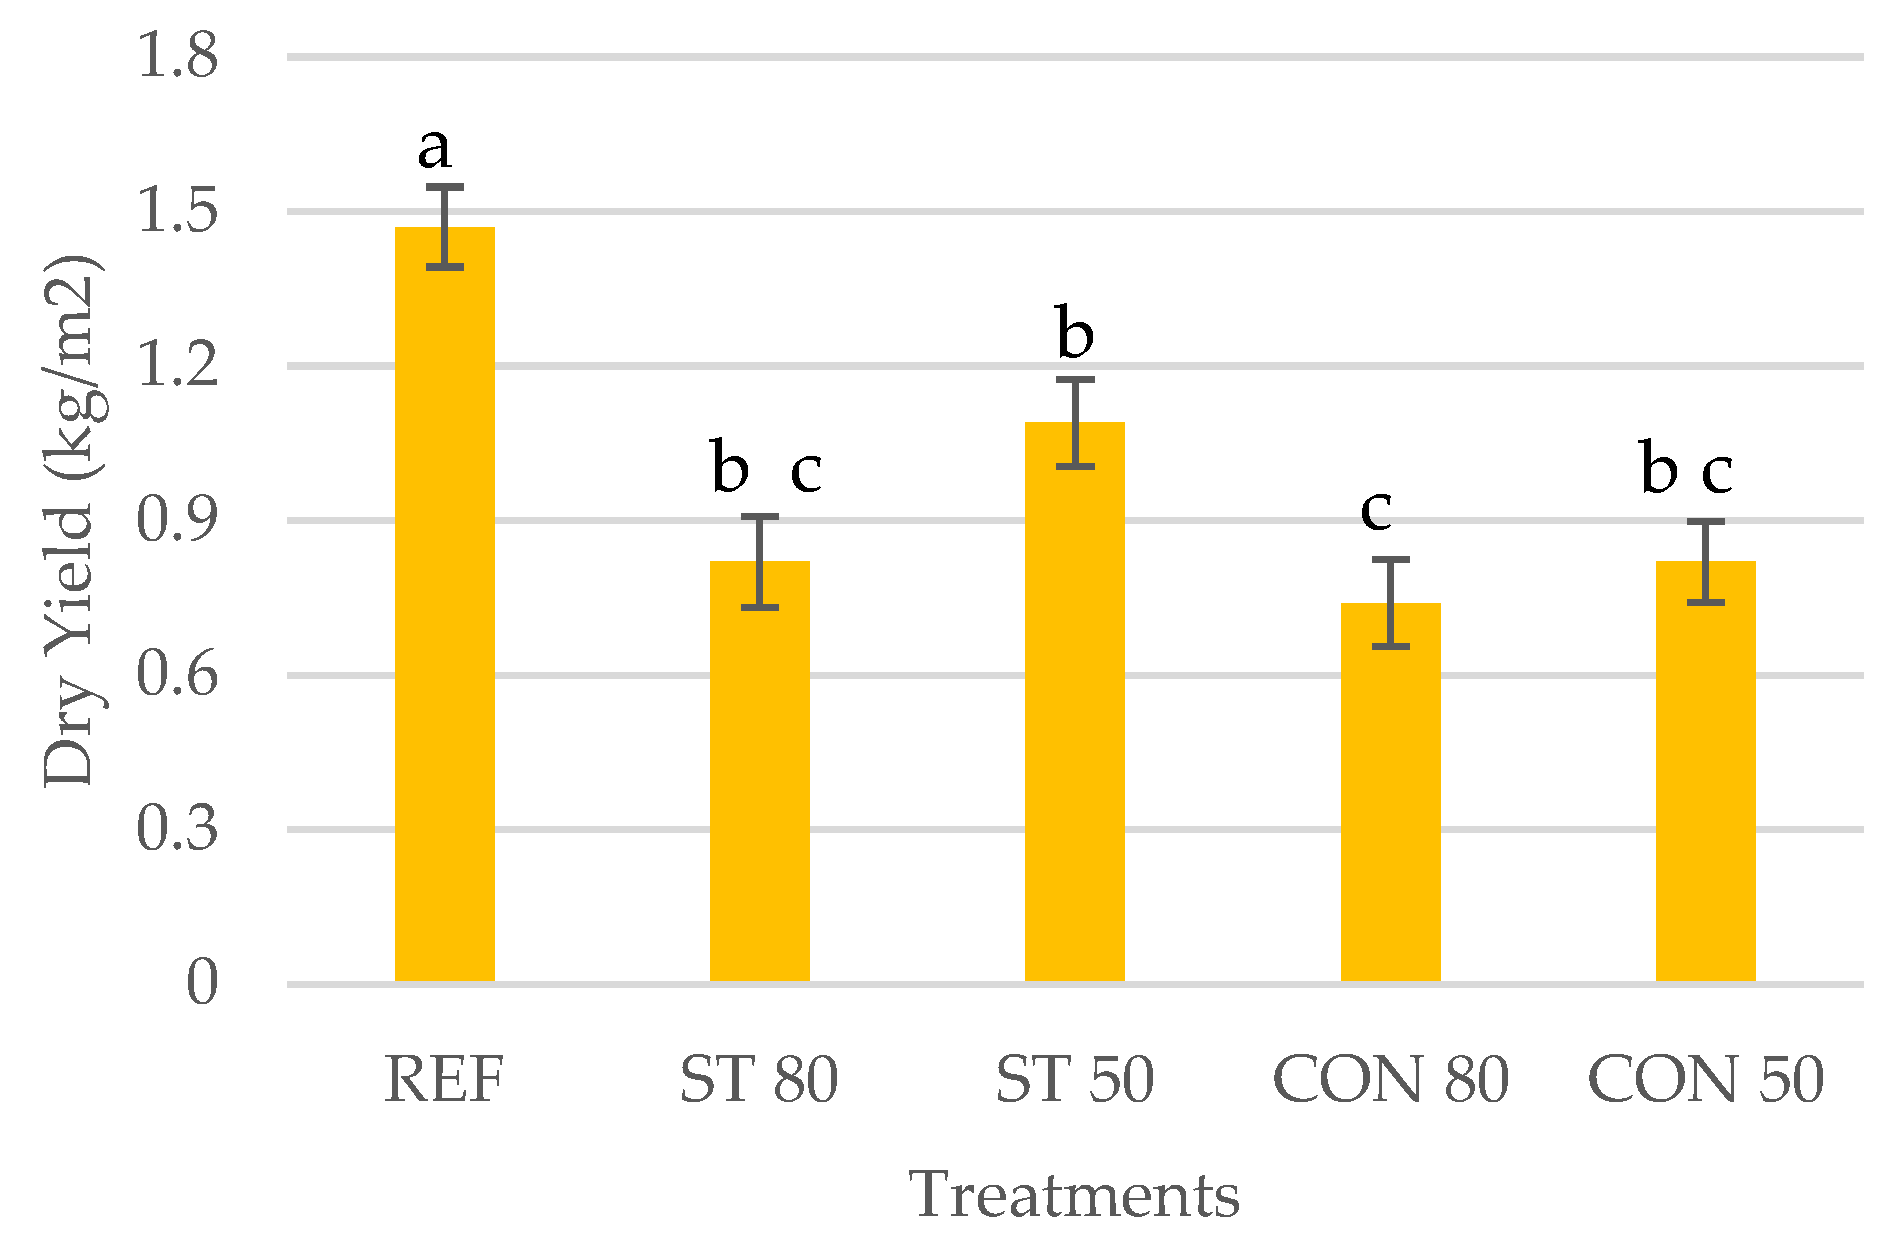
The fresh and dry yields of the Arugula for the five treatments in the three cuts (31 August, 21 September, and 19 October) are shown in Figure 13, Figure 14, Figure 15, Figure 16, Figure 17 and Figure 18. Assessing both fresh and dry biomass provides complementary insights into crop performance: fresh weight reflects the immediate marketable yield and tissue water content, while dry weight represents actual biomass accumulation and carbon assimilation efficiency, independent of water status, allowing for a standardized comparison of growth performance across treatments.
Across all harvests, both fresh and dry yields were generally higher in the REF than under the AV treatments, primarily due to reduced light availability beneath the AV panels. The REF represents optimal radiation conditions for crop growth, as supported by the incoming radiation and PAR measurements shown in Figure 7 and Figure 8. However, the combination of microclimatic conditions under the AV systems—particularly moderated soil and air temperatures during the growing season from August to October—appeared to mitigate the effects of shading; resulting in improved crop performance under AV treatments during the third and final harvest compared with earlier cuts. This suggests that seasonal temperature patterns interacted with AV-induced shading to influence growth dynamics and yield outcomes.
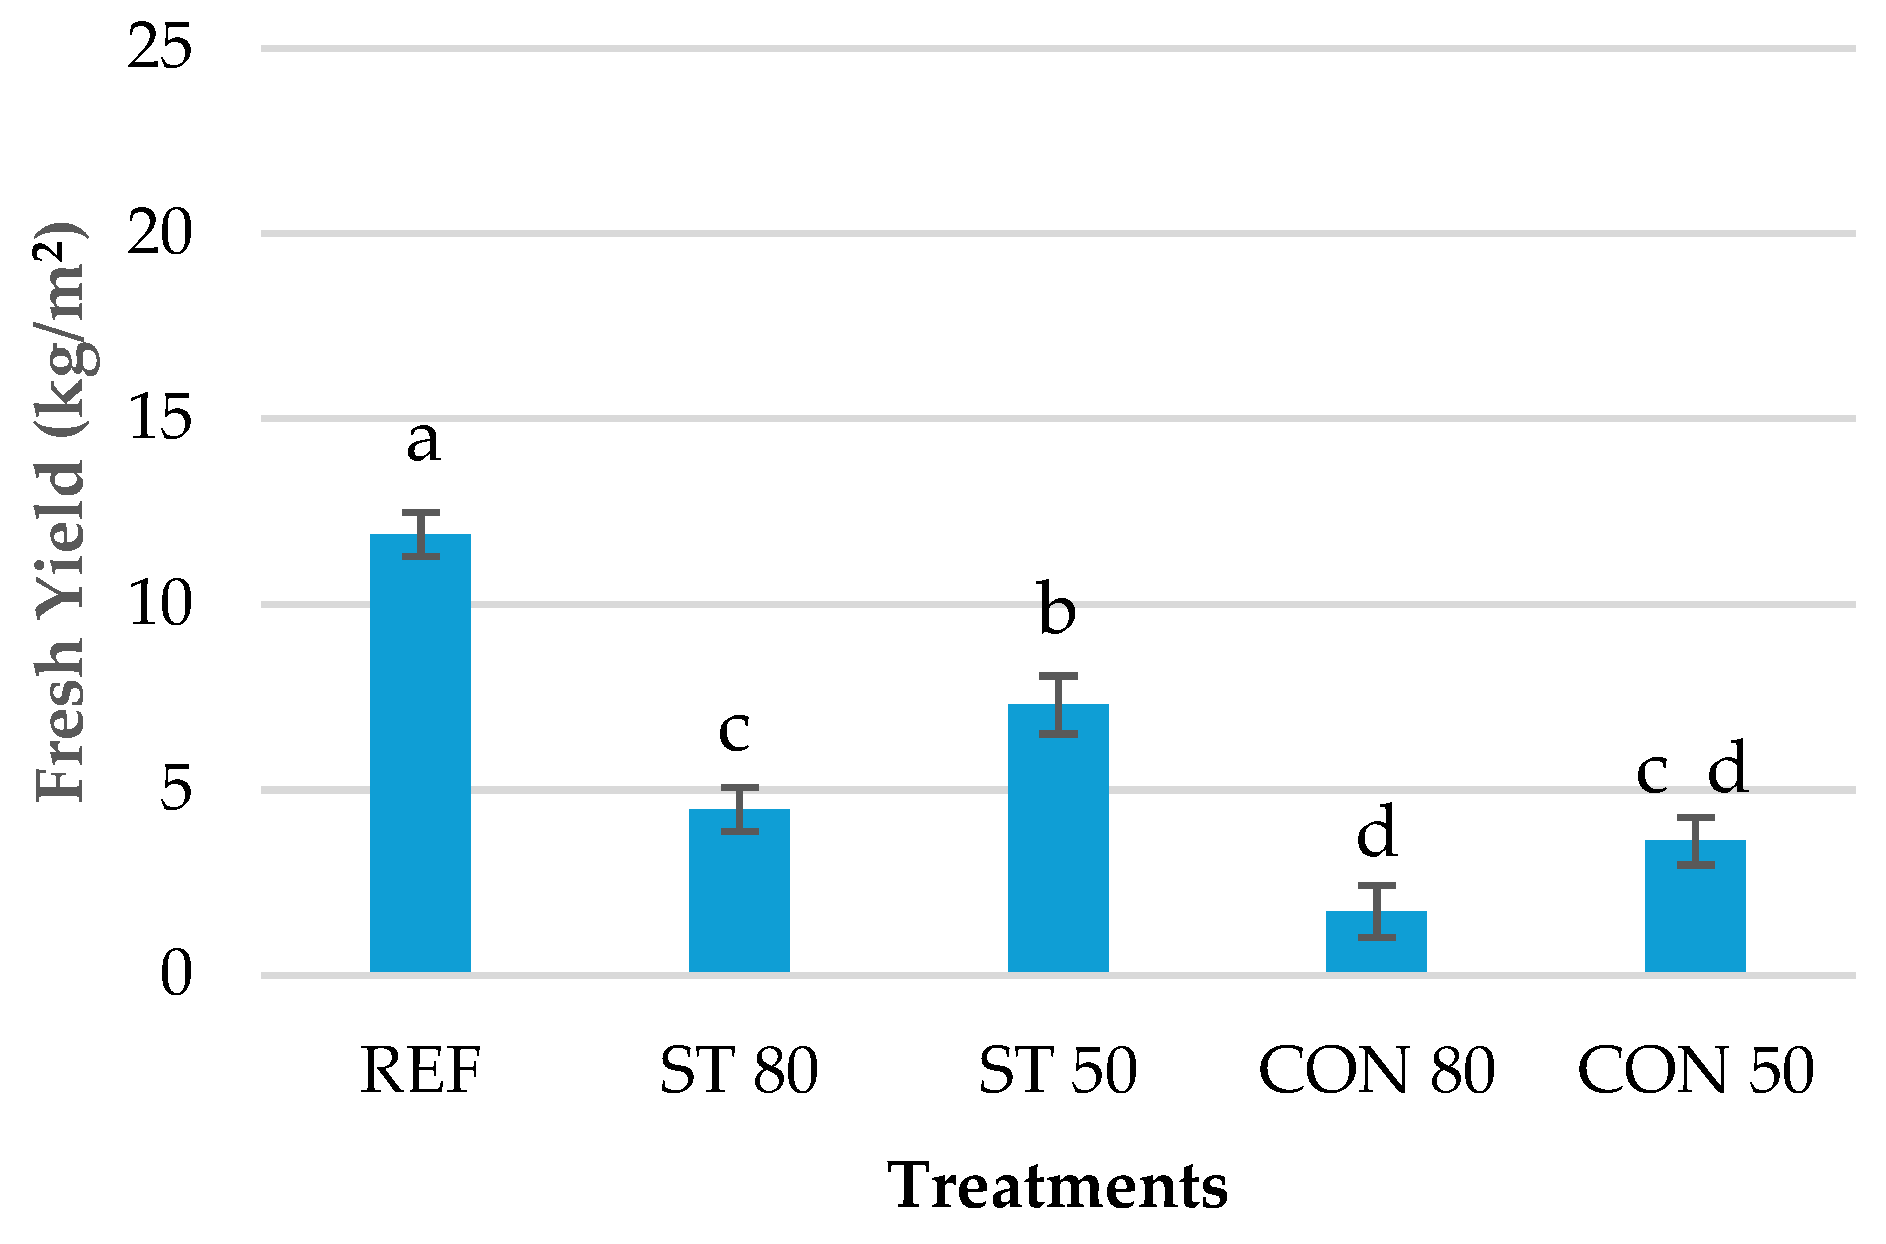
In the first cut, both fresh and dry yields were highest in the REF, significantly exceeding those of all other treatments, as indicated by the different letters (Figure 13 and Figure 14). This confirms that under the prevailing summer conditions, shading imposed by both AV systems limited arugula biomass accumulation.
In the second cut, yield differences among treatments became more pronounced (Figure 15 and Figure 16). REF remained significantly higher than all other treatments for both fresh and dry yield. Among shaded treatments, ST 50% produced significantly higher yields than ST 80%, whereas CON 80% yielded the lowest. CON 50% showed intermediate performance and overlapped statistically with ST 80%.
By the third cut, yield increased relative to the first and second cuts, likely due to the temperature drop in the 20 days preceding the final cut (19 October 2022), which is favorable for the arugula growth. REF continued to achieve the highest fresh and dry yields, although dry yield decreased compared to the first harvest. Among the AV treatments, ST 50% maintained significantly higher yield than ST 80%, CON 50%, and CON 80% during the third cutting. Both ST 50% and CON 50% exhibited partial recovery following the reductions observed in the second cutting, whereas yields under the 80% shading treatments also increased but remained lower than those of the 50% treatments. These differences are primarily attributable to the higher shading intensity in the 80% treatments, which limited canopy development and light interception. Regarding the Arugula crop, there is a lack of literature on the production and growth of Arugula cultivated in open fields under AV systems. However, there are few studies about the impact of these systems, but only on lettuce, which has a similar response to Arugula. For instance, Marrou et al. [17] reported that under spring growing conditions, lettuces may sustain relatively good yields under AV, in the half-density shadow treatment, and, for some varieties, in the full-density treatment. This finding is in line with those of Gimenez et al. [44]. The percentage of ground cover was considered to affect the physical process of interception directly. When plants were grown in the shade, there was no change in the relationship between the percentage of interception and the cover rate. Consequently, a better plant capacity for a higher soil coverage underneath the AVs shade can be directly linked to increased radiation interception efficiency. However, the AV systems can improve the production of shade-tolerant crops. For example, Amaducci et al. [42] published a study on the effects of shading produced by an AV system on corn, demonstrating that over a projection of 39 years, the maize produces 4.7% more under AV than cultivation in the open field. In the same context, Sekiyama and Nagashima. [45] found that it could be possible to grow corn, a typical shade-intolerant crop, even under the shade of AV panels. The biomass of corn grown under 0.71 m-spaced PV module arrays was reduced by 3.1%. Corn grown under 1.67 m-spaced PV module arrays had 4.9% higher biomass than corn without PV modules. Finally, the yield of corn in the low-density configuration was 5.6% higher than in the high-density and no-module control configurations.

4. Conclusions

AV systems represent a promising solution to mitigate competition for land use between agricultural production and energy generation. However, their agronomic performance remains strongly dependent on crop type, local climatic conditions, and system configuration, and therefore requires validation through real field experiments.
This research assessed the effects of a static ground-mounted AV system on the microclimate, soil water content, physiological responses, and yield of Arugula (Eruca vesicaria) cultivated in an open-field environment in southern Italy. Two types of panels were considered in this study: semi-transparent and conventional.
The results of this experiment show that under ST and CON, incoming radiation was reduced by 70% and 80%, respectively, relative to REF, whereas PAR decreased by 60% under ST and 70% under CON relative to REF. The reduction in incoming light affected crop physiological parameters, leading to lower transpiration rates, stomatal conductance, and net photosynthesis under both AV systems.
From an agronomic perspective, arugula yield was significantly higher in the open field, confirming that this crop is sensitive to strong shading, particularly during summer conditions. However, yield differences between treatments narrowed during the autumn cycle, suggesting that microclimate buffering under AV systems can become advantageous under cooler conditions.
In contrast to the yield response, AV systems had a positive effect on soil water dynamics, significantly improving the uniformity of soil water distribution. Compared with the REF, soil water uniformity increased by approximately 5% under ST panels and 9% under CON panels, mainly due to reduced evaporative losses and enhanced lateral redistribution of water beneath the panels.
The absence of significant agronomic differences between the ST and CON panels in this study should be interpreted strictly within the context of the tested panel technology. The semi-transparent modules examined here acted primarily as non-spectrally selective light-attenuating elements. Therefore, the conclusions cannot be generalized to emerging AV technologies that incorporate spectral selectivity, light diffusion, or wavelength shifting properties, which are specifically designed to enhance photosynthetic efficiency under reduced radiation conditions.
To conclude, several limitations of the study should be acknowledged. The experiment was conducted over a single growing season, focused on a short-cycle leaf crop, and relied on static PV structures to better investigate the mechanisms by which the plant adapts to varying environmental conditions, whether driven by natural climate variability or by microclimatic modifications induced by AV systems. Microclimatic conditions are strongly influenced by prevailing weather and can vary over time, introducing variability in the observed responses. Nevertheless, the controlled setup allowed for the isolation of the effects of two AV systems on Arugula growth and yield and enabled an examination of how shading intensity influences crop performance over the short growth cycle. Specifically, shading can limit growth under optimal light conditions by reducing radiation interception but may confer advantages under less favorable conditions, such as cooler temperatures, relative to open-field cultivation. Radiation measurements were taken at discrete time points, which limited the full characterization of daily and seasonal light dynamics under AV-induced shade, although they provided valuable insights into specific vegetative periods. It should be emphasized that the results are specific to static AV panels and may not directly translate to dynamic configurations; however, they can serve as a reference for understanding and managing the microclimatic effects of these systems. In this context, advanced configurations could further optimize microclimatic conditions, light interception, and crop performance, guiding how to regulate these effects effectively.
Despite these limitations, this study provides valuable insights into the interactions between AV-generated microclimates and short-cycle crop responses. The findings can inform future experimental research by identifying key interactions between shading intensity, microclimate, and crop performance and support policymakers by providing evidence-based guidance for optimizing AV system design and crop selection under specific local climatic conditions, thereby promoting sustainable land-use strategies.

Author Contributions

Conceptualization, H.C. and G.D.; methodology, H.C.; software, H.C.; validation, H.C., A.F. and G.D.; formal analysis, H.C. and G.D.; investigation, H.C., G.D., and A.F.; resources, A.F. and G.D.; data curation, H.C. and A.F.; writing—original draft preparation, H.C.; writing—review and editing, G.D. and A.F.; visualization, A.F. and G.D.; supervision, A.F. and G.D. All authors have read and agreed to the published version of the manuscript.

Funding

This research received no external funding.

Data Availability Statement

The data presented in this study are available on request from the authors.

Acknowledgments

The authors gratefully acknowledge SPIS LAB project (2020–2022). We also thank Carlo Ranieri and Domenico Tribuzio for their support with physiological measurements using the LI-COR 6400 and the CIHEAM technical team, led by Giuseppe Cavallo and Giancarlo Mimiola, for their assistance in setting up the experimental trial.

Conflicts of Interest

The authors declare no conflicts of interest.

Abbreviations

AVAgrivoltaic
CONConventional
FCField Capacity
PARPhotosynthetically Active Radiation
PPFDPhotosynthetic Photon Flux Density
PVPhotovoltaic
PWPPermanent Wilting Point
RERenewable Energy
STSemi-transparent
TDRTime Domain Reflectometer
UCUniformity Coefficient

References

  1. United Nations. World Population Prospects 2019: Highlights; United Nations: New York, NY, USA, 2019. [Google Scholar]
  2. Sargentis, G.-F.; Iliopoulou, T.; Dimitriadis, P.; Mamassis, N.; Koutsoyiannis, D. Stratification: An Entropic View of Society’s Structure. World 2021, 2, 153–174. [Google Scholar] [CrossRef]
  3. Calvert, K.; Pearce, J.M.; Mabee, W.E. Toward Renewable Energy Geo-Information Infrastructures: Applications of GIScience and Remote Sensing That Build Institutional Capacity. Renew. Sustain. Energy Rev. 2013, 18, 416–429. [Google Scholar] [CrossRef]
  4. Semeraro, T.; Pomes, A.; Del Giudice, C.; Negro, D.; Aretano, R. Planning Ground Based Utility Scale Solar Energy as Green Infrastructure to Enhance Ecosystem Services. Energy Policy 2018, 117, 218–227. [Google Scholar] [CrossRef]
  5. Viaggio, D.; La Rosa, G.; Wright, C.; Delle Cave, G. Italy: Agriculture and Solar PV: A Delicate Balance. Available online: https://www.eversheds-sutherland.com/en/global/insights/italy-agriculture-and-solar-pv-a-delicate-balance (accessed on 11 June 2025).
  6. Dinesh, H.; Pearce, J.M. The Potential of Agrivoltaic Systems. Renew. Sustain. Energy Rev. 2016, 54, 299–308. [Google Scholar] [CrossRef]
  7. Svanera, L.; Ghidesi, G.; Knoche, R. Agrovoltaico: 10 Years Design and Operation Experience. In Proceedings of the AIP Conference Procedings; AIP Publishing LLC.: Melville, NY, USA, 2021; Volume 2361, p. 090002. [Google Scholar]
  8. Barron-Gafford, G.A.; Minor, R.L.; Allen, N.A.; Cronin, A.D.; Brooks, A.E.; Pavao-Zuckerman, M.A. The Photovoltaic Heat Island Effect: Larger Solar Power Plants Increase Local Temperatures. Sci. Rep. 2016, 6, 35070. [Google Scholar] [CrossRef] [PubMed]
  9. Marrou, H.; Dufour, L.; Wery, J. How Does a Shelter of Solar Panels Influence Water Flows in a Soil-Crop System? Eur. J. Agron. 2013, 50, 38–51. [Google Scholar] [CrossRef]
  10. Cossu, M.; Yano, A.; Solinas, S.; Deligios, P.A.; Teresa, M.; Cossu, A.; Ledda, L. Agricultural Sustainability Estimation of the European Photovoltaic Greenhouses. Eur. J. Agron. 2020, 118, 126074. [Google Scholar] [CrossRef]
  11. Disciglio, G.; Stasi, A.; Tarantino, A.; Frabboni, L. Microclimate Modification, Evapotranspiration, Growth and Essential Oil Yield of Six Medicinal Plants Cultivated beneath a Dynamic Agrivoltaic System in Southern Italy. Plants 2025, 14, 2428. [Google Scholar] [CrossRef]
  12. Hassanpour Adeh, E.; Selker, J.S.; Higgins, C.W. Remarkable Agrivoltaic Influence on Soil Moisture, Micrometeorology and Water-Use Efficiency. PLoS ONE 2018, 13, e0203256. [Google Scholar] [CrossRef]
  13. Barron-gafford, G.A.; Pavao-zuckerman, M.A.; Minor, R.L.; Sutter, L.F.; Barnett-moreno, I.; Blackett, D.T.; Thompson, M.; Dimond, K.; Gerlak, A.K.; Nabhan, G.P.; et al. Agrivoltaics Provide Mutual Benefits across the Food–Energy–Water Nexus in Drylands. Nat. Sustain. 2019, 2, 848–855. [Google Scholar] [CrossRef]
  14. Ureña-Sánchez, R.; Callejón-Ferre, Á.J.; Pérez-Alonso, J.; Carreño-Ortega, Á. Greenhouse Tomato Production with Electricity Generation by Roof-Mounted Flexible Solar Panels. Sci. Agric. 2012, 69, 233–239. [Google Scholar] [CrossRef]
  15. Touil, S.; Richa, A.; Fizir, M.; Bingwa, B. Shading Effect of Photovoltaic Panels on Horticulture Crops Production: A Mini Review. Rev. Environ. Sci. Biotechnol. 2021, 20, 281–296. [Google Scholar] [CrossRef]
  16. Tani, A.; Shiina, S.; Nakashima, K.; Hayashi, M. Improvement in Lettuce Growth by Light Diffusion under Solar Panels. J. Agric. Meteorol. 2014, 70, 139–149. [Google Scholar] [CrossRef]
  17. Marrou, H.; Wery, J.; Dufour, L.; Dupraz, C. Productivity and Radiation Use Efficiency of Lettuces Grown in the Partial Shade of Photovoltaic Panels. Eur. J. Agron. 2013, 44, 54–66. [Google Scholar] [CrossRef]
  18. Ezzaeri, K.; Fatnassi, H.; Bouharroud, R.; Gourdo, L.; Bazgaou, A.; Wifaya, A.; Demrati, H.; Bekkaoui, A.; Aharoune, A.; Poncet, C.; et al. The Effect of Photovoltaic Panels on the Microclimate and on the Tomato Production under Photovoltaic Canarian Greenhouses. Sol. Energy 2018, 173, 1126–1134. [Google Scholar] [CrossRef]
  19. Mohammedi, S.; Dragonetti, G.; Admane, N.; Fouial, A. The Impact of Agrivoltaic Systems on Tomato Crop: A Case Study in Southern Italy. Processes 2023, 11, 3370. [Google Scholar] [CrossRef]
  20. Zisis, C.; Pechlivani, E.M.; Tsimikli, S.; Mekeridis, E.; Laskarakis, A.; Logothetidis, S. Organic Photovoltaics on Greenhouse Rooftops: Effects on Plant Growth. Mater. Today Proc. 2019, 19, 65–72. [Google Scholar] [CrossRef]
  21. Zhang, W.; Hendriks, P.W.; Uchanski, M.; Page, S.; Renwick, A.; Maxwell, T.; Kaiser, C.; Dong, J.; De Koning, W. Climatic and design tipping points in agrivoltaic crop production systems. A meta-analysis. Agron. Sustain. Dev. 2025, 45, 69. [Google Scholar] [CrossRef]
  22. Loik, M.E.; Carter, S.A.; Alers, G.; Wade, C.E.; Shugar, D.; Corrado, C.; Jokerst, D.; Kitayama, C. Wavelength-Selective Solar Photovoltaic Systems: Powering Greenhouses for Plant Growth at the Food-Energy-Water Nexus. Earth’s Futur. 2017, 5, 1044–1053. [Google Scholar] [CrossRef]
  23. Cockshull, K.E.; Graves, C.J.; Cave, C.R.J. The Influence of Shading on Yield of Glasshouse Tomatoes. J. Hortic. Sci. 1992, 67, 11–24. [Google Scholar] [CrossRef]
  24. Emmott, C.J.M.; Röhr, J.A.; Campoy-Quiles, M.; Kirchartz, T.; Urbina, A.; Ekins-Daukes, N.J.; Nelson, J. Organic Photovoltaic Greenhouses: A Unique Application for Semitransparent PV? Energy Environ. Sci. 2015, 8, 1317–1328. [Google Scholar] [CrossRef]
  25. Weather Climate, and Weather History and Archives for Bari—Monthly and Annual Average Temperatures 2022. Available online: https://www.weatherandclimate.info/history/16271 (accessed on 29 January 2026).
  26. Brady, N.C. The Nature and Properties of Soil, 9th ed.; Macmillan Publishing Company: New York, NY, USA, 1984. [Google Scholar]
  27. Uchanski, M.; Hickey, T.; Bousselot, J.; Barth, K.L. Characterization of agrivoltaic crop environment conditions using opaque and thin-film semi-transparent modules. Energies 2023, 16, 3012. [Google Scholar] [CrossRef]
  28. Penadille, Y. Testing of Irrigation Equipment. PMH Rev. Hortic. 1998, 389, 58–64. [Google Scholar]
  29. Allen, R.G.; Pereira, L.S.; Raes, D.; Smith, M. Crop Evapotranspiration-Guidelines for Compution Crop Water Requirements-FAO Irrigation and Drainage Paper No. 56; Food and Agriculture Organization of the United Nations (FAO): Rome, Italy, 1998. [Google Scholar]
  30. Dwevedi, A.; Kumar, P.; Kumar, P.; Kumar, Y.; Sharma, Y.K.; Kayastha, A.M. 15—Soil Sensors: Detailed Insight into Research Updates, Significance, and Future Prospects. In New Pesticides and Soil Sensor; Grumezescu, A.M., Ed.; Academic Press: Cambridge, MA, USA, 2017; pp. 561–594. ISBN 9780128042991. [Google Scholar]
  31. Long, S.P.; Hällgren, J. Measurement of CO2 Assimilation by Plants in the Field and the Laboratory. In Photosynthesis and Production in a Changing Environment; Hall, D.O., Scurlock, J.M.O., Bolhàr-Nordenkampf, H.R., Leegood, R.C., Long, S., Eds.; Elsevier: Amsterdam, The Netherlands, 1993. [Google Scholar]
  32. García-García, A.; Cuesta-Valero, F.J.; Miralles, D.G.; Mahecha, M.D.; Quaas, J.; Reichstein, M.; Zscheischler, J.; Peng, J. Soil Heat Extremes Can Outpace Air Temperature Extremes. Nat. Clim. Change 2023, 13, 1237–1241. [Google Scholar] [CrossRef]
  33. Geiger, R.; Aron, R.; Todhunter, P. The Climaye near the Ground; Rowman and Littlefield Publishers: Lanham, MD, USA, 2003. [Google Scholar]
  34. Harty, M. Optimal Temperatures for Growing Arugula. Available online: https://shuncy.com/article/arugula-growing-temperature (accessed on 10 July 2025).
  35. Armstrong, A.; Ostle, N.J.; Whitaker, J. Solar Park Microclimate and Vegetation Management Effects on Grassland Carbon Cycling. Environ. Res. Lett. 2016, 11, 074016. [Google Scholar] [CrossRef]
  36. Weselek, A.; Bauerle, A.; Zikeli, S.; Lewandowski, I.; Högy, P. Effects on Crop Development, Yields and Chemical Composition of Celeriac (Apium graveolens L. Var. Rapaceum) Cultivated underneath an Agrivoltaic System. Agronomy 2021, 11, 733. [Google Scholar] [CrossRef]
  37. Tanner, K.E.; Moore-O’Leary, K.A.; Parker, I.M.; Pavlik, B.M.; Hernandez, R.R. Simulated Solar Panels Create Altered Microhabitats in Desert Landforms. Ecosphere 2020, 11, e03089. [Google Scholar] [CrossRef]
  38. Yan, M.A.; Youqi, W.; Chengfeng, M.A.; Cheng, Y.; Yiru, B.A.I. Effects of Gravel on the Water Absorption Characteristics and Hydraulic Parameters of Stony Soil. J. Arid Land 2024, 16, 895–909. [Google Scholar] [CrossRef]
  39. Hlaváčiková, H.; Novák, V.; Kostka, Z.; Danko, M.; Hlavčo, J. The Influence of Stony Soil Properties on Water Dynamics Modeled by the HYDRUS Model. J. Hydrol. Hydromech. 2018, 66, 181–188. [Google Scholar] [CrossRef]
  40. Campbell, G.S. Infiltration Redistribution. In Developments in Soil Science; Elsevier: Amsterdam, The Netherlands, 1985; pp. 73–97. ISBN 9780444425577. [Google Scholar]
  41. Mangrio, A.G.; Asif, M.; Ahmed, E.; Sabir, M.W.; Khan, T.; Jahangir, I. Hydraulic Performance Evaluation of Pressure Compensating (PC) Emitters and Micro-Tubing for Drip Irrigation System. Sci. Technol. Dev. 2013, 32, 290–298. [Google Scholar]
  42. Amaducci, S.; Yin, X.; Colauzzi, M. Agrivoltaic Systems to Optimise Land Use for Electric Energy Production. Appl. Energy 2018, 220, 545–561. [Google Scholar] [CrossRef]
  43. Dong, T.; Li, J.; Zhang, Y.; Korpelainen, H.; Niinemets, Ü.; Li, C. Partial Shading of Lateral Branches Affects Growth, and Foliage Nitrogen- and Water-Use Efficiencies in the Conifer Cunninghamia Lanceolata Growing in a Warm Monsoon Climate. Tree Physiol. 2015, 35, 632–643. [Google Scholar] [CrossRef] [PubMed]
  44. Gimenez, C.; Otto, R.F.; Castilla, N. Productivity of Leaf and Root Vegetable Crops under Direct Cover. Sci. Hortic. 2002, 94, 1–11. [Google Scholar] [CrossRef]
  45. Sekiyama, T.; Nagashima, A. Solar Sharing for Both Food and Clean Energy Production: Performance of Agrivoltaic Systems for Corn, a Typical Shade-Intolerant Crop. Environments 2019, 6, 65. [Google Scholar] [CrossRef]
Figure 1. (a) Layout of the experimental field illustrating the hydrant location, distribution manifold, and lateral drip lines. (b) On-site experimental area.
Resources 15 00033 g001
Figure 2. Daily shade dynamics under the agrivoltaic system, where yellow and blue rectangular arrays indicate the shadow displacement from conventional and semi-transparent panels, respectively.
Resources 15 00033 g002
Figure 3. Trend of air and soil temperature values observed during the experiment.
Resources 15 00033 g003
Figure 4. Least-squares means of average soil temperature over the entire arugula growing season under the different treatments. Different letters indicate significant differences among treatments based on Turkey-adjusted comparisons (α = 0.05).
Resources 15 00033 g004
Figure 5. Variation of soil water contents, irrigation, and rainfall events along the irrigation season.
Resources 15 00033 g005
Figure 6. Variation of the irrigation soil water uniformity coefficient under the AV systems and REF.
Resources 15 00033 g006
Figure 7. Incoming radiation measured by LI-COR under the AV systems and REF. Different letters indicate significant differences among treatments within the same measurement date based on Tukey adjusted pairwise comparison (α = 0.05).
Resources 15 00033 g007
Figure 8. Photosynthetic Active Radiation (PAR) measured by LI-COR under the AV systems and REF. Different letters indicate significant differences among treatments within the same measurement date based on Tukey adjusted pairwise comparison (α = 0.05).
Resources 15 00033 g008
Figure 9. Transpiration (Tr) measured by LI-COR under the AV systems and REF. Different letters indicate significant differences among treatments within the same measurement date based on Tukey adjusted pairwise comparison (α = 0.05).
Resources 15 00033 g009
Figure 10. Stomatal Conductance (gs) measured by LI-COR under the AV and REF. Different letters indicate significant differences among treatments within the same measurement date based on Tukey adjusted pairwise comparison (α = 0.05).
Resources 15 00033 g010
Figure 11. Photosynthesis (An) measured by LI-COR under the AV and REF. Different letters indicate significant differences among treatments within the same measurement date based on Tukey adjusted pairwise comparison (α = 0.05).
Resources 15 00033 g011
Figure 12. Intrinsic Water Use Efficiency (iWUE) under the AV and REF. Different letters indicate significant differences among treatments within the same measurement date based on Tukey adjusted pairwise comparison (α = 0.05).
Resources 15 00033 g012
Figure 13. Fresh yield of the Arugula in the 1st cut. Different letters indicate significant differences among treatments within the same measurement date based on Tukey adjusted pairwise comparison (α = 0.05).
Resources 15 00033 g013
Figure 14. Dry yield of the Arugula in the 1st cut. Different letters indicate significant differences among treatments within the same measurement date based on Tukey adjusted pairwise comparison (α = 0.05).
Resources 15 00033 g014
Figure 15. Fresh yield of the Arugula in the 2nd cut. Different letters indicate significant differences among treatments within the same measurement date based on Tukey adjusted pairwise comparison (α = 0.05).
Resources 15 00033 g015
Figure 16. Dry yield of the Arugula in the 2nd cut. Different letters indicate significant differences among treatments within the same measurement date based on Tukey adjusted pairwise comparison (α = 0.05).
Resources 15 00033 g016
Figure 17. Fresh yield of the Arugula in the 3rd cut. Different letters indicate significant differences among treatments within the same measurement date based on Tukey adjusted pairwise comparison (α = 0.05).
Resources 15 00033 g017
Figure 18. Dry yield of the Arugula in the 3rd cut. Different letters indicate significant differences among treatments within the same measurement date based on Tukey adjusted pairwise comparison (α = 0.05).
Resources 15 00033 g018
Table 1. Characteristics of AV panels.
Semi-Transparent Panels
(Viessmann Vitovolt 300 M310 RA)
Conventional Panels
(Viessmann Vitovolt 300 M390 WG)
Nominal Power Output (PMPP)310 Wp390 Wp
Maximum Power Voltage (VMPP)32.9 V40.8 V
Maximum Power Current (IMPP)9.52 A9.56 A
Open Circuit Voltage (Voc)40.3 V49.3 V ± 3%
Short Circuit Current (Isc)10.12 A10.03 A ± 3%
Maximum System VoltageDC 1500 VDC 1500 V
Power Tolerance±5%±3%
Power Sorting0~+5 W0~+5 W
Fuse rating20 A20 A
PV Module classificationClass IIClass II
Disclaimer/Publisher’s Note: The statements, opinions and data contained in all publications are solely those of the individual author(s) and contributor(s) and not of MDPI and/or the editor(s). MDPI and/or the editor(s) disclaim responsibility for any injury to people or property resulting from any ideas, methods, instructions or products referred to in the content.