


Abstract
Sandy soil conditions and climate risk frequently lead to agricultural production failures in these areas, justifying studies to identify management practices that make the soil more resilient to abiotic stresses. The objective of the study was to evaluate the temporal dynamics of microbial activity and soil fertility attributes under an integrated crop–livestock system subjected to the addition of organic compost and influenced by seasonal climatic variations. Soil sampling was conducted at four sampling periods over three years in an experimental area used for pasture and grain cultivation. Nine attributes related to microbial activity and nine related to soil fertility were assessed. Microbial activity was significantly impacted by the temporal factor. Integrated systems resulted in increased microbial biomass nitrogen and glycosidase activity compared to fallow. Multivariate analysis showed that the season factor accounted for 95% of the accuracy in predicting the observed results, with the microbial component driving the majority of this temporal effect. Under the conditions observed, the compost appears to stabilize soil microbial activity in systems containing U. ruziziensis; however, the results do not support claims of a universal effect on soil quality improvement, nor do they allow for a causal link to be established between this stability and water availability.
1. Introduction
Crop–livestock integration systems (CLI) have emerged in tropical agriculture as a primary strategy to mitigate soil degradation, notably by increasing soil organic matter input [1]. Maintaining soil vegetative cover represents one of the main conservation management practices to protect the soil surface, stimulate the rhizosphere, and enhance nutrient cycling. Cover crop systems generally increase microbial abundance and activity compared to fallow, though these effects strongly depend on the plant species used, climate, soil conditions, and residue management [2,3]. In tropical environments, species of the genus Urochloa are highly relevant in cover crop and integrated systems due to their high biomass production, deep root development, and capacity to modify the edaphic environment. Studies evaluating U. brizantha and U. ruziziensis demonstrate that these species can alter microbial biomass, basal respiration, metabolic quotient, and enzymatic activities; however, these effects are attribute-specific and context-dependent [4,5]. This variability underscores the importance of evaluating not only the mean level of each indicator but also the temporal stability of its response.
Biological attributes such as soil microbial biomass (SMB), basal respiration (SBR), and enzymatic activity (e.g., β-glucosidase, phosphatase, and arylsulfatase) respond rapidly and sensitively to management changes, functioning as early bioindicators of ecosystem degradation or recovery [6]. A major challenge in interpreting these indicators in tropical and subtropical environments is strong seasonal climate fluctuation. Variations in rainfall and soil temperature directly alter soil water availability, thereby influencing the maintenance of microbial activity [7]. A recent review highlighted that drought could reduce microbial biomass and respiration, with organic carbon availability and adequate pH range regulating system resilience over time [8]. Consequently, single-point evaluations may lead to premature conclusions dictated by prevailing weather conditions, making long-term time-series monitoring indispensable.
To enhance the temporal stability of these biological attributes, soil conditioners such as organic compost represent a promising alternative. Continuous organic matter application supplies readily assimilable carbon and slow-release nutrients, stimulating microbial proliferation and amplifying the activity of enzymes involved in carbon, phosphorus, and sulfur cycles [9]. Nevertheless, the temporal dynamics of these soil conditioners and their effects on soil fertility and microbiological attributes require continuous monitoring to fully elucidate their long-term impacts.
Based on the above, we hypothesize that the application of organic compost in crop–livestock integration systems attenuates the negative impacts of soil water deficit periods, promoting progressive improvements in soil fertility and microbial activity over time. Furthermore, we hypothesize that this stabilizing effect of the compost depends on the specific Urochloa species evaluated. Therefore, the objective of this study was to evaluate the two-year temporal dynamics of microbial activity and soil fertility attributes under a crop–livestock integration system (utilizing two grass species) subjected to organic compost application under the influence of seasonal climatic variation.
2. Materials and Methods
2.1. Study Area and Experimental Design
The study was conducted at the Vô Altino Experimental Farm, located in Caiuá, São Paulo State, Brazil (21°49′54″ S, 51°59′54″ W; altitude 330 m). The local topography is characterized by a gently undulating relief. The average annual precipitation is 1154 mm, and the mean annual temperature is 22.8 °C. The soil at the site is classified as an Oxisol, with a sandy texture comprising 820 g kg−1 sand, 110 g kg−1 clay, and 70 g kg−1 silt. The experimental area (40 ha), arranged in three randomized blocks. The site hosts an ongoing long-term experiment established in 2016, comparing crop–livestock integration (CLI) systems and soybean monoculture. Crop management consists of soybean cultivation during the summer season, followed by grass pastures with livestock grazing during the autumn–winter period.
Five cropping systems were investigated during the 2022/2023 and 2023/2024 agricultural years: Soybean—Urochloa ruziziensis + Compost; Soybean—Urochloa ruziziensis; Soybean—Urochloa brizantha + Compost; Soybean—Urochloa brizantha; Soybean—Fallow (Monoculture). In 2022 and 2023, half of the experimental plots received an application of 2.0 Mg ha−1 (dry weight basis) of organic compost, forming split-plots. The rate of organic compost applied for soil conditioning was based on findings from three-year field experiments, in which it demonstrated satisfactory performance in increasing both microbial activity and soybean yield [10]. The compost was produced at an on-site facility using cattle manure. Processing lasted 90 days, with weekly mechanical turning and periodic irrigation. During the thermophilic phase, internal temperatures exceeded 65 °C for several consecutive days. The final compost characterization yielded the following chemical composition (%): organic matter = 30.8; N = 1.7; P2O5 = 3.2; K2O = 2.3; and a cation exchange capacity (CEC) of 556.0 mmol_c kg−1. The application rate was established strictly as a soil conditioner without the objective of meeting crop nutritional requirements.
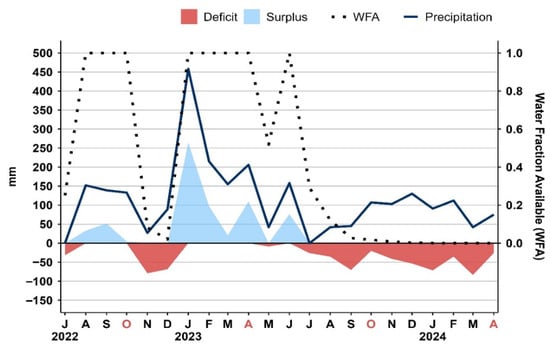
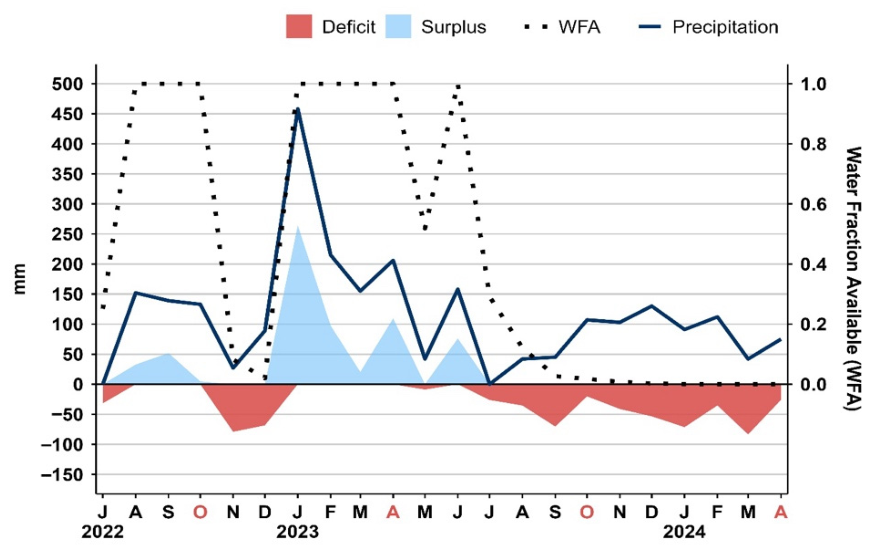
Soybeans were sown in November and harvested in March across both evaluated crop cycles. Fertilization and phytosanitary management followed regional technical recommendations. Following soybean harvest, the corresponding grass species were sown in each treatment, followed by the introduction of cattle for rotational grazing. A stocking rate of three animal units (~220 kg) per hectare was applied from April to September, using a rotation schedule to maintain the pasture at a height of 0.30 m. Monthly rainfall data recorded during the trial are shown in Figure 1.
Figure 1.
Recordedrainfall and water balance parameters during the experiment in Caiuá, São Paulo State, Brazil. (Months highlighted in red represent the periods during which soil samples were collected.)
Soil Sampling, Microbial Activity, and Soil Fertility Analysis
Soil samples were collected prior to planting and immediately after soybean harvest. Composite samples (consisting of sub-samples collected within and outside the compost application split-plots) were gathered at a depth of 0–0.10 m for biological and chemical analyses. The biological indicators were determined as follows: Soil Microbial Biomass Carbon (MBC) [11]; Soil Microbial Biomass Nitrogen (MBN) [12]; Fluorescein Diacetate Hydrolysis (FDA) [13]; Dehydrogenase Enzyme Activity (DHA): evaluated according to [14]; Acid Phosphatase (PHOS), β-Glucosidase (GLYCO), and Arylsulfatase (ARYL) [15]; Basal Respiration (BR) [16]; Metabolic Quotient (qCO2): calculated as the ratio between soil basal respiration and microbial biomass carbon (BR/MBC). Soil fertility attributes, pH, H+Al, soil organic material (SOM), cationic exchange capacity (CEC), P, K, Ca, Mg and Sum of Bases (SB) were evaluated using the same composite samples [17].
2.2. Conceptual Framework for Temporal Stability Indices
2.2.1. Soil Water Availability Factor (WFA)
The Soil Water Availability Factor (WFA) was calculated monthly throughout the study as the ratio between the actual available water depth in the soil profile and the maximum soil water storage capacity [18].
2.2.2. Water Stress Index (WSI)
The Water Stress Index (WSI) describes the environmental moisture conditions at each sampling time and is defined as: WSI = 1 − WFA.
WSI values close to zero indicate high soil water availability, whereas values near one represent severe water restriction (Table 1).
Table 1.
Calculation and interpretation of WSI for each season.
2.3. Development and Methodological Basis of the Stability Indices
The Temporal Multivariate Instability Index (TMI), Temporal Water Sensitivity Index (TWSI), and Integrated Stability Gain (ISG) were developed specifically for the present study and should not be interpreted as previously established soil-quality indices. Their formulation was based on established statistical concepts, including multivariate dispersion around a centroid, regression-based sensitivity to an environmental gradient, relative-response ratios, and multiplicative aggregation of dimensionless indicators. TMI is conceptually related to centroid-based measures of multivariate dispersion [19] whereas ISG follows general principles used in the construction and aggregation of composite indicators [20].
2.4. Temporal Multivariate Instability Index (TMI)
For each treatment g and sampling period s, a vector z (g,s) was constructed using the standardized means of p attributes within the evaluated domain. The temporal center for each treatment, z (g), was calculated as the mean vector across all S sampling periods. The TMI represents the root-mean-square distance of each temporal profile relative to its treatment centroid:
Because the calculation is based on z-score standardized attributes, variables originally expressed in different units contribute on a comparable scale. The squared TMI can alternatively be written as
demonstrating that TMI corresponds to the square root of the summed temporal variances of the standardized attributes. Therefore, TMI quantifies the magnitude of multivariate temporal dispersion, irrespective of the direction of change. Lower TMI values indicate lower temporal instability.
2.5. Temporal Water Sensitivity Index (TWSI)
The TWSI was developed to incorporate hydrological conditions into the temporal instability analysis. For each standardized attribute j, a linear regression of treatment means across the four periods was fitted against WFA, yielding the slope β(g,j). Slopes near zero indicate weak association with soil water availability, whereas higher absolute values reflect higher sensitivity to moisture variation:
where βg is the vector containing the WFA-response slopes of the p standardized attributes. Thus, TWSI is the root-mean-square magnitude of the standardized sensitivity coefficients. The slopes are squared before aggregation so that positive and negative responses do not cancel each other, because TWSI is intended to quantify the magnitude of sensitivity to the observed WFA gradient rather than its direction. Lower TWSI values therefore indicate lower overall sensitivity.
2.6. Integrated Stability Gain (ISG)
To assess the effect of organic compost (with vs. without) within the same cover crop species, TMI and TWSI were expressed as relative ratios:
A ratio < 1 indicates lower instability or sensitivity in the compost-amended treatment; a ratio equal to 1 denotes equivalence; and a ratio >1 reflects higher instability or sensitivity associated with compost application. The Integrated Stability Gain (ISG) was calculated using the geometric mean to combine both dimensions symmetrically:
The geometric mean was selected because rTMI and rTWSI are positive, dimensionless ratios expressed on a relative multiplicative scale. Geometric aggregation treats proportional changes symmetrically and is equivalent to averaging the two components on the logarithmic scale. It also reduces the degree of compensation between dimensions compared with a simple additive combination; thus, a strong improvement in one stability component does not automatically offset deterioration in the other.
Equal weights were assigned to rTMI and rTWSI because no independent biological or empirical information was available to justify prioritizing multivariate temporal dispersion over sensitivity to WFA, or vice versa. Equal weighting was therefore adopted as a neutral modelling assumption rather than as an empirically estimated property.
To assess whether the ISG conclusions depended on the equal-weight assumption, a weighting sensitivity analysis was performed using the generalized expression
where w ranged from 0 to 1 and represents the relative weight assigned to TMI, while 1-w represents the weight assigned to TWSI. The original ISG corresponds to w = 0.5.
ISG(w) = 100[1 − rTMIw rTWSI1−w],
Temporal sensitivity of ISG was evaluated using a Leave-One-Epoch (LOE) procedure. Each of the four sampling periods was removed sequentially, and variable standardization, TMI, TWSI, rTMI, rTWSI, and ISG were recalculated using the remaining three periods. Thus, four LOE scenarios were evaluated for each grass species in addition to the complete four-period analysis. Block-level sensitivity was evaluated by paired bootstrap resampling. Blocks were treated as the resampling units, and the same resampled block indices were applied simultaneously to the compost-amended and non-amended treatments of each grass species across all sampling periods, preserving the paired and longitudinal structure. Because only three blocks were available, all 33 = 27 ordered samples of three blocks drawn with replacement were exhaustively enumerated. All standardization and stability-index calculations were repeated independently for each resampled dataset. The proportion of positive ISG values was calculated as the number of resamples with ISG > 0 divided by 27. Empirical 2.5th and 97.5th percentiles of the 27 ISG values were used as descriptive uncertainty ranges.
To include the Fallow treatment consistently within the framework, its absolute TMI and TWSI indices were computed using the joint standardization applied across all five treatments, allowing descriptive comparisons of temporal fluctuation and water sensitivity without treating Fallow as a paired compost comparison.
2.7. Statistical Analysis
Analysis of variance (ANOVA) was structured as a randomized complete block design with repeated measurements over time, with Block as the blocking factor, Treatment as the between-plot factor, and Sampling Period as the within-plot factor. With three blocks, five treatments, and four sampling periods, Treatment was tested against the Block × Treatment experimental error, with 4 and 8 degrees of freedom (df), respectively. Sampling Period and the Treatment × Sampling Period interaction were evaluated within the repeated-measures component, with nominal 3 and 30 df for Sampling Period and 12 and 30 df for the interaction, respectively.
To account for potential violations of sphericity, p-values for effects involving Sampling Period were corrected using the Greenhouse–Geisser method. Partial eta-squared (η_p2) effect sizes were calculated alongside F-tests. When main effects were significant, mean comparisons were performed using Tukey’s Honest Significant Difference (HSD) test (p < 0.05) applied to the temporal plot means, retaining the plot as the true experimental unit.
Because the four Urochloa treatments constituted a balanced 2 × 2 factorial combination of Species (U. ruziziensis vs. U. brizantha) and Compost (with vs. without compost), the Treatment effect was additionally decomposed using planned orthogonal contrasts. The four contrasts represented Species, Compost, Species × Compost, and the mean of the four Urochloa treatments versus Fallow. The Treatment × Sampling Period interaction was decomposed analogously to evaluate Species × Sampling Period, Compost × Sampling Period, and Species × Compost × Sampling Period responses. Fallow was therefore retained as an external control rather than being artificially assigned a Species or Compost level.
Linear Discriminant Analysis (LDA) was adjusted to identify linear combinations of standardized variables that maximized the ratio of between-class variability to within-class variability. Multivariate dispersion was displayed in an LD1 vs. LD2 plot. Bivariate 90% confidence ellipses were constructed based on the score covariance matrix.
Two supervised classification tasks (Treatment classification and Sampling Period classification) were conducted using Multinomial Logistic Regression and Random Forest. Logistic regression was preceded by feature standardization. Random Forest models utilized 500 decision trees, standard feature selection criteria (√(features)), and a fixed random seed. Validation was conducted using Leave-One-Parcel-Out (LOPO) cross-validation (15 folds), ensuring that all four temporal observations from a single plot were placed exclusively in the test set during each iteration to eliminate data leakage. Model performance was evaluated using Accuracy, Balanced Accuracy, and Macro F1-score.
To evaluate the robustness of the proposed indices, paired resampling of the blocks was performed. Since there are only three blocks, the 33 = 27 possible ordered sequences for sampling three blocks with replacement were enumerated, thereby avoiding reliance on an arbitrary number of simulations. Because only four sampling periods were available, TMI, TWSI, and ISG were treated as descriptive stability metrics rather than inferential test statistics. TMI therefore describes temporal dispersion only within the four observed sampling periods. This limitation is particularly relevant for TWSI because each attribute-specific slope is estimated from only four WFA–sampling-period combinations. Furthermore, because one WFA value corresponds to each sampling period, WFA and sampling period are completely confounded in the present dataset. Consequently, TWSI quantifies association with the observed WFA gradient but cannot be interpreted as an independent causal effect of soil water availability. Robustness was therefore evaluated through leave-one-epoch analysis, paired block resampling, and sensitivity of ISG to alternative relative weights assigned to TMI and TWSI.
For Sampling Period classification via logistic regression, statistical significance was verified using a permutation test (200 permutations). Sampling period labels were randomized within each plot, preserving the repeated-measures structure.
Statistical analyses and machine learning workflows were performed in Python (v3.10+) using NumPy (v2.3.5), pandas (v2.2.3), SciPy (v1.17.0), scikit-learn (v1.8.0), statsmodels (v0.14.6), and Matplotlib (v3.10.8).
3. Results
The analysis of the nine microbial activity variables and nine soil fertility attributes using F-tests for the effects of treatment, sampling period, and their interaction showed a stronger significant model effect on microbial activity variables, with six significant interactions detected (Table 2). Sampling Period remained the predominant source of variation. Significant main effects of Treatment were detected for MBN, ARYL, GLYCO, and K. No significant Treatment × Sampling Period interaction was detected for the soil fertility attributes.
Table 2.
Analysis of variance and p-values obtained for microbial activity and soil fertility variables regarding treatment and seasons.
Tukey comparisons showed lower MBN in Fallow than in all four Urochloa treatments; lower GLYCO in Fallow than in Ruziziensis, Brizantha+comp, and Brizantha; lower ARYL in Fallow than in both Brizantha treatments; and lower K in Fallow than in Brizantha.
Planned contrast analysis further separated the effects underlying the five-level Treatment factor. No consistent main effect of Urochloa species was detected. Compost had a significant main effect on phosphatase activity, whereas a Species × Compost effect was detected for β-glucosidase. Temporal responses were more pronounced: significant Compost × Sampling Period effects occurred for MBN, FDA, and PHOS, while Species × Compost × Sampling Period interactions were detected for DHA and K. These results indicate that the compost response was predominantly attribute- and time-dependent rather than a uniform main effect across soil properties.
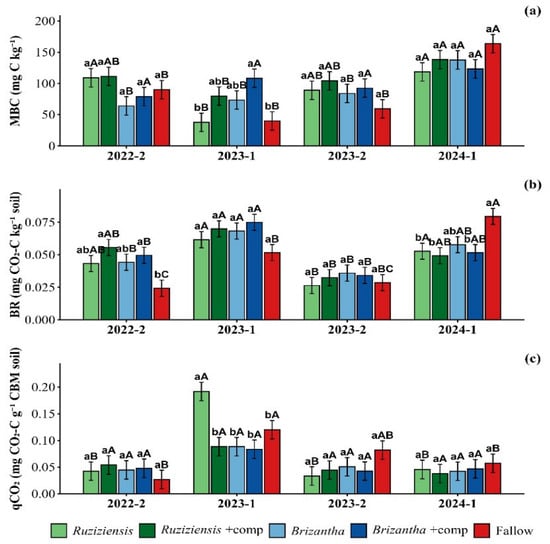
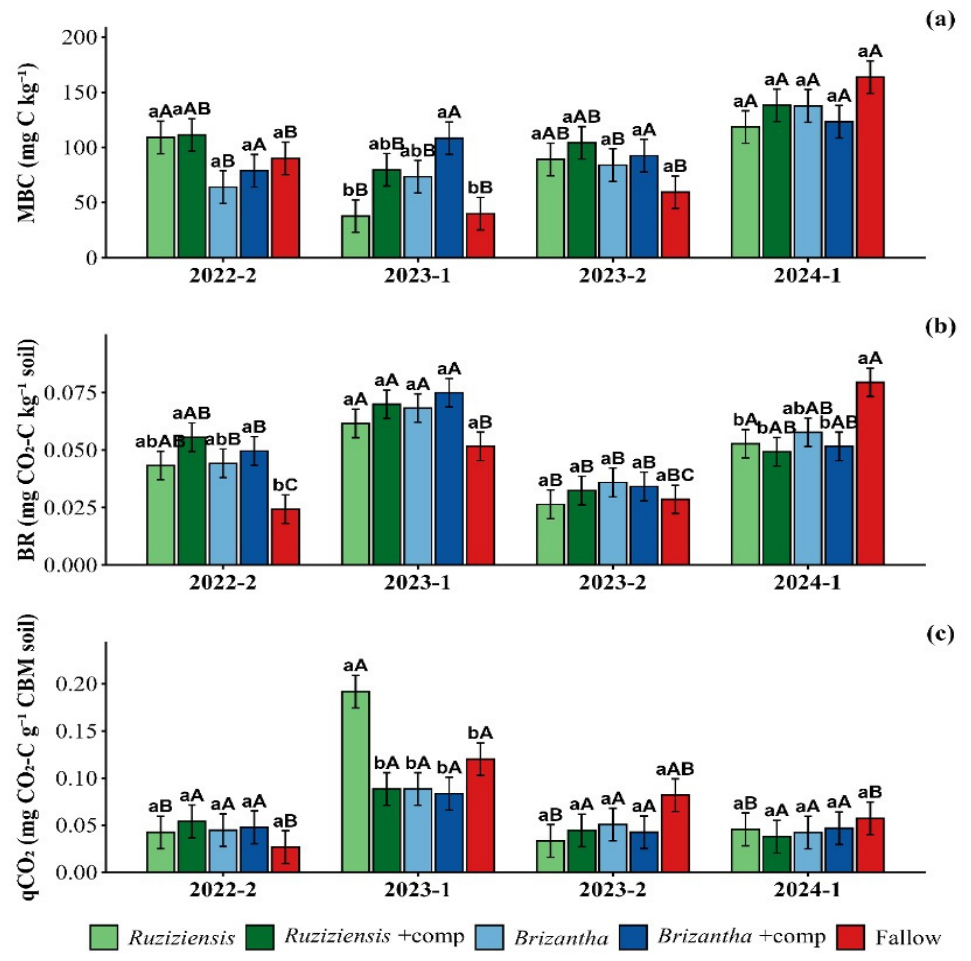
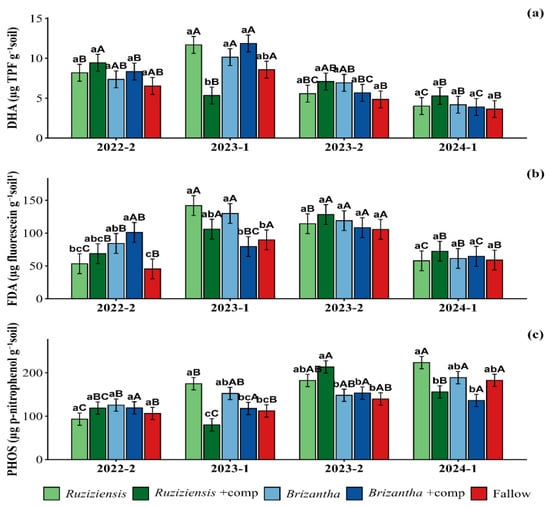
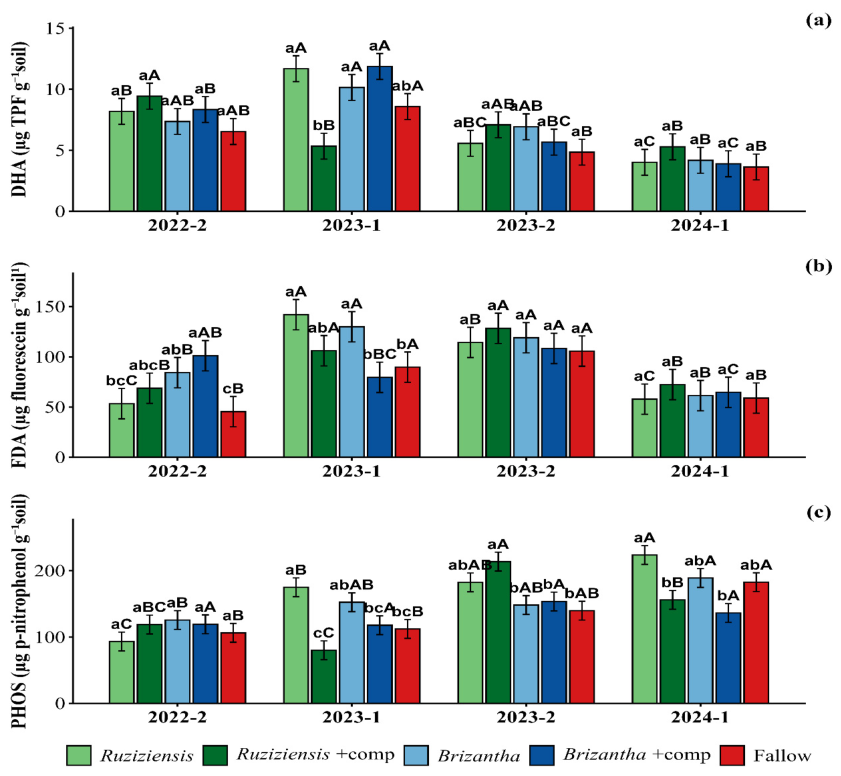
Regarding microbial biomass, the most relevant response was the increase observed in the treatments with U. brizantha without compost and in the fallow treatment during the final season (Figure 2). Enzymatic activity showed a decreasing trend in dehydrogenase activity over the evaluated periods (Figure 3a), a pattern also observed for FDA hydrolysis, although the integrated crop–livestock treatments significantly increased this indicator in the penultimate evaluation (Figure 3b). Conversely, phosphatase activity increased overall when compared with the beginning of the study (Figure 3c). Soil basal respiration was strongly affected by seasons, with general increases in 2023-1 and 2024-1; the fallow treatment showed the strongest temporal response among the evaluated treatments (Figure 3a). For the metabolic quotient, U. ruziziensis without compost and fallow showed higher values in the second evaluation period, 2023-1, compared with the other sampling periods (Figure 3b).
Figure 2.
Soil microbial biomass and activity attributes as influenced by cover crop treatments and seasons. (a): Microbial Biomass Carbon (MBC); (b): basal soil respiration (BR) and (c): metabolic quotient (qCO2). Bars represent means, and error bars indicate the standard error of the mean (±SE). Different lowercase letters indicate significant differences among treatments within each sampling season, whereas different uppercase letters compare sampling seasons within each treatment according to Tukey’s test (p ≤ 0.05).
Figure 3.
Soil enzymatic activities as influenced by cover crop treatments and seasons. (a): Dehydrogenase (DHA), (b): fluorescein diacetate hydrolysis (FDA), and (c): acid phosphatase (PHOS). Bars represent means, and error bars indicate the standard error of the mean (±SE). Different lowercase letters indicate significant differences among treatments within each sampling season, whereas different uppercase letters compare sampling seasons within each treatment according to Tukey’s test (p ≤ 0.05).
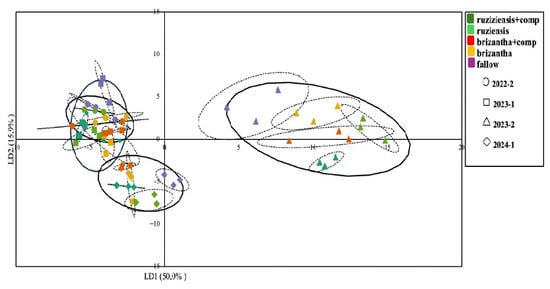
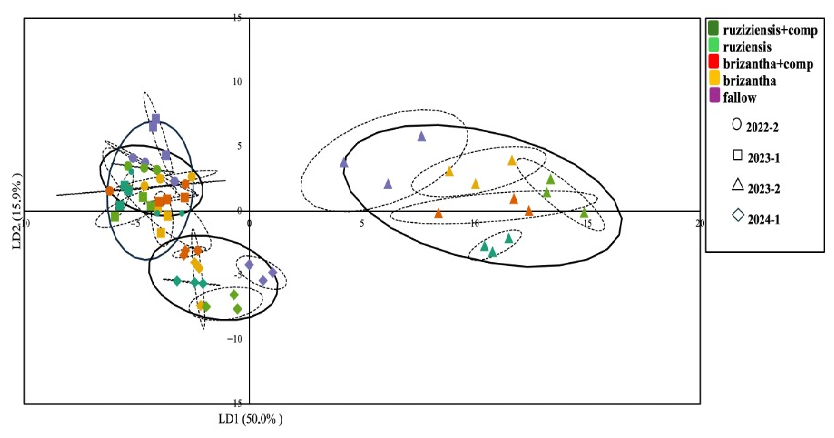
The discriminant analysis explained 66.0% of the discrimination among treatment × seasons combinations, with 50.0% attributed to LD1 (Figure 4). A strong temporal differentiation was observed: groups from the 2023-2 sampling period showed predominantly positive LD1 scores, whereas groups from 2024-1 were mainly concentrated at negative LD2 values.
Figure 4.
Linear discriminant analysis using the 18 variables analyzed for each treatment at different sampling times. Treatments (dotted line); sampling times (solid line).
Based on supervised classification algorithms and LOPO validation, all three models performed poorly in classifying treatments; logistic regression, for instance, achieved 23.3% accuracy with low significance (Table 3). Therefore, the data do not support using this model to predict treatments. Regarding the classification of sampling periods (seasons), both Random Forest and logistic regression achieved 95.0% accuracy, and the permutation test for logistic regression confirmed the significance of the temporal structure (p = 0.005; 200 permutations). Thus, the combined set of indicators contained sufficient information to identify the sampling period with near-perfect accuracy, even when the plot being evaluated was not included in the model’s training set.
Table 3.
Predictive performance using Leave-One-Parcel-Out (LOPO) validation.
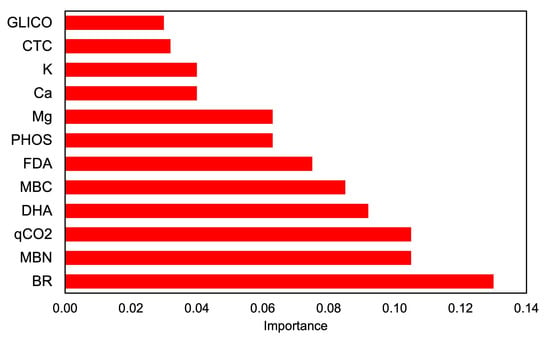
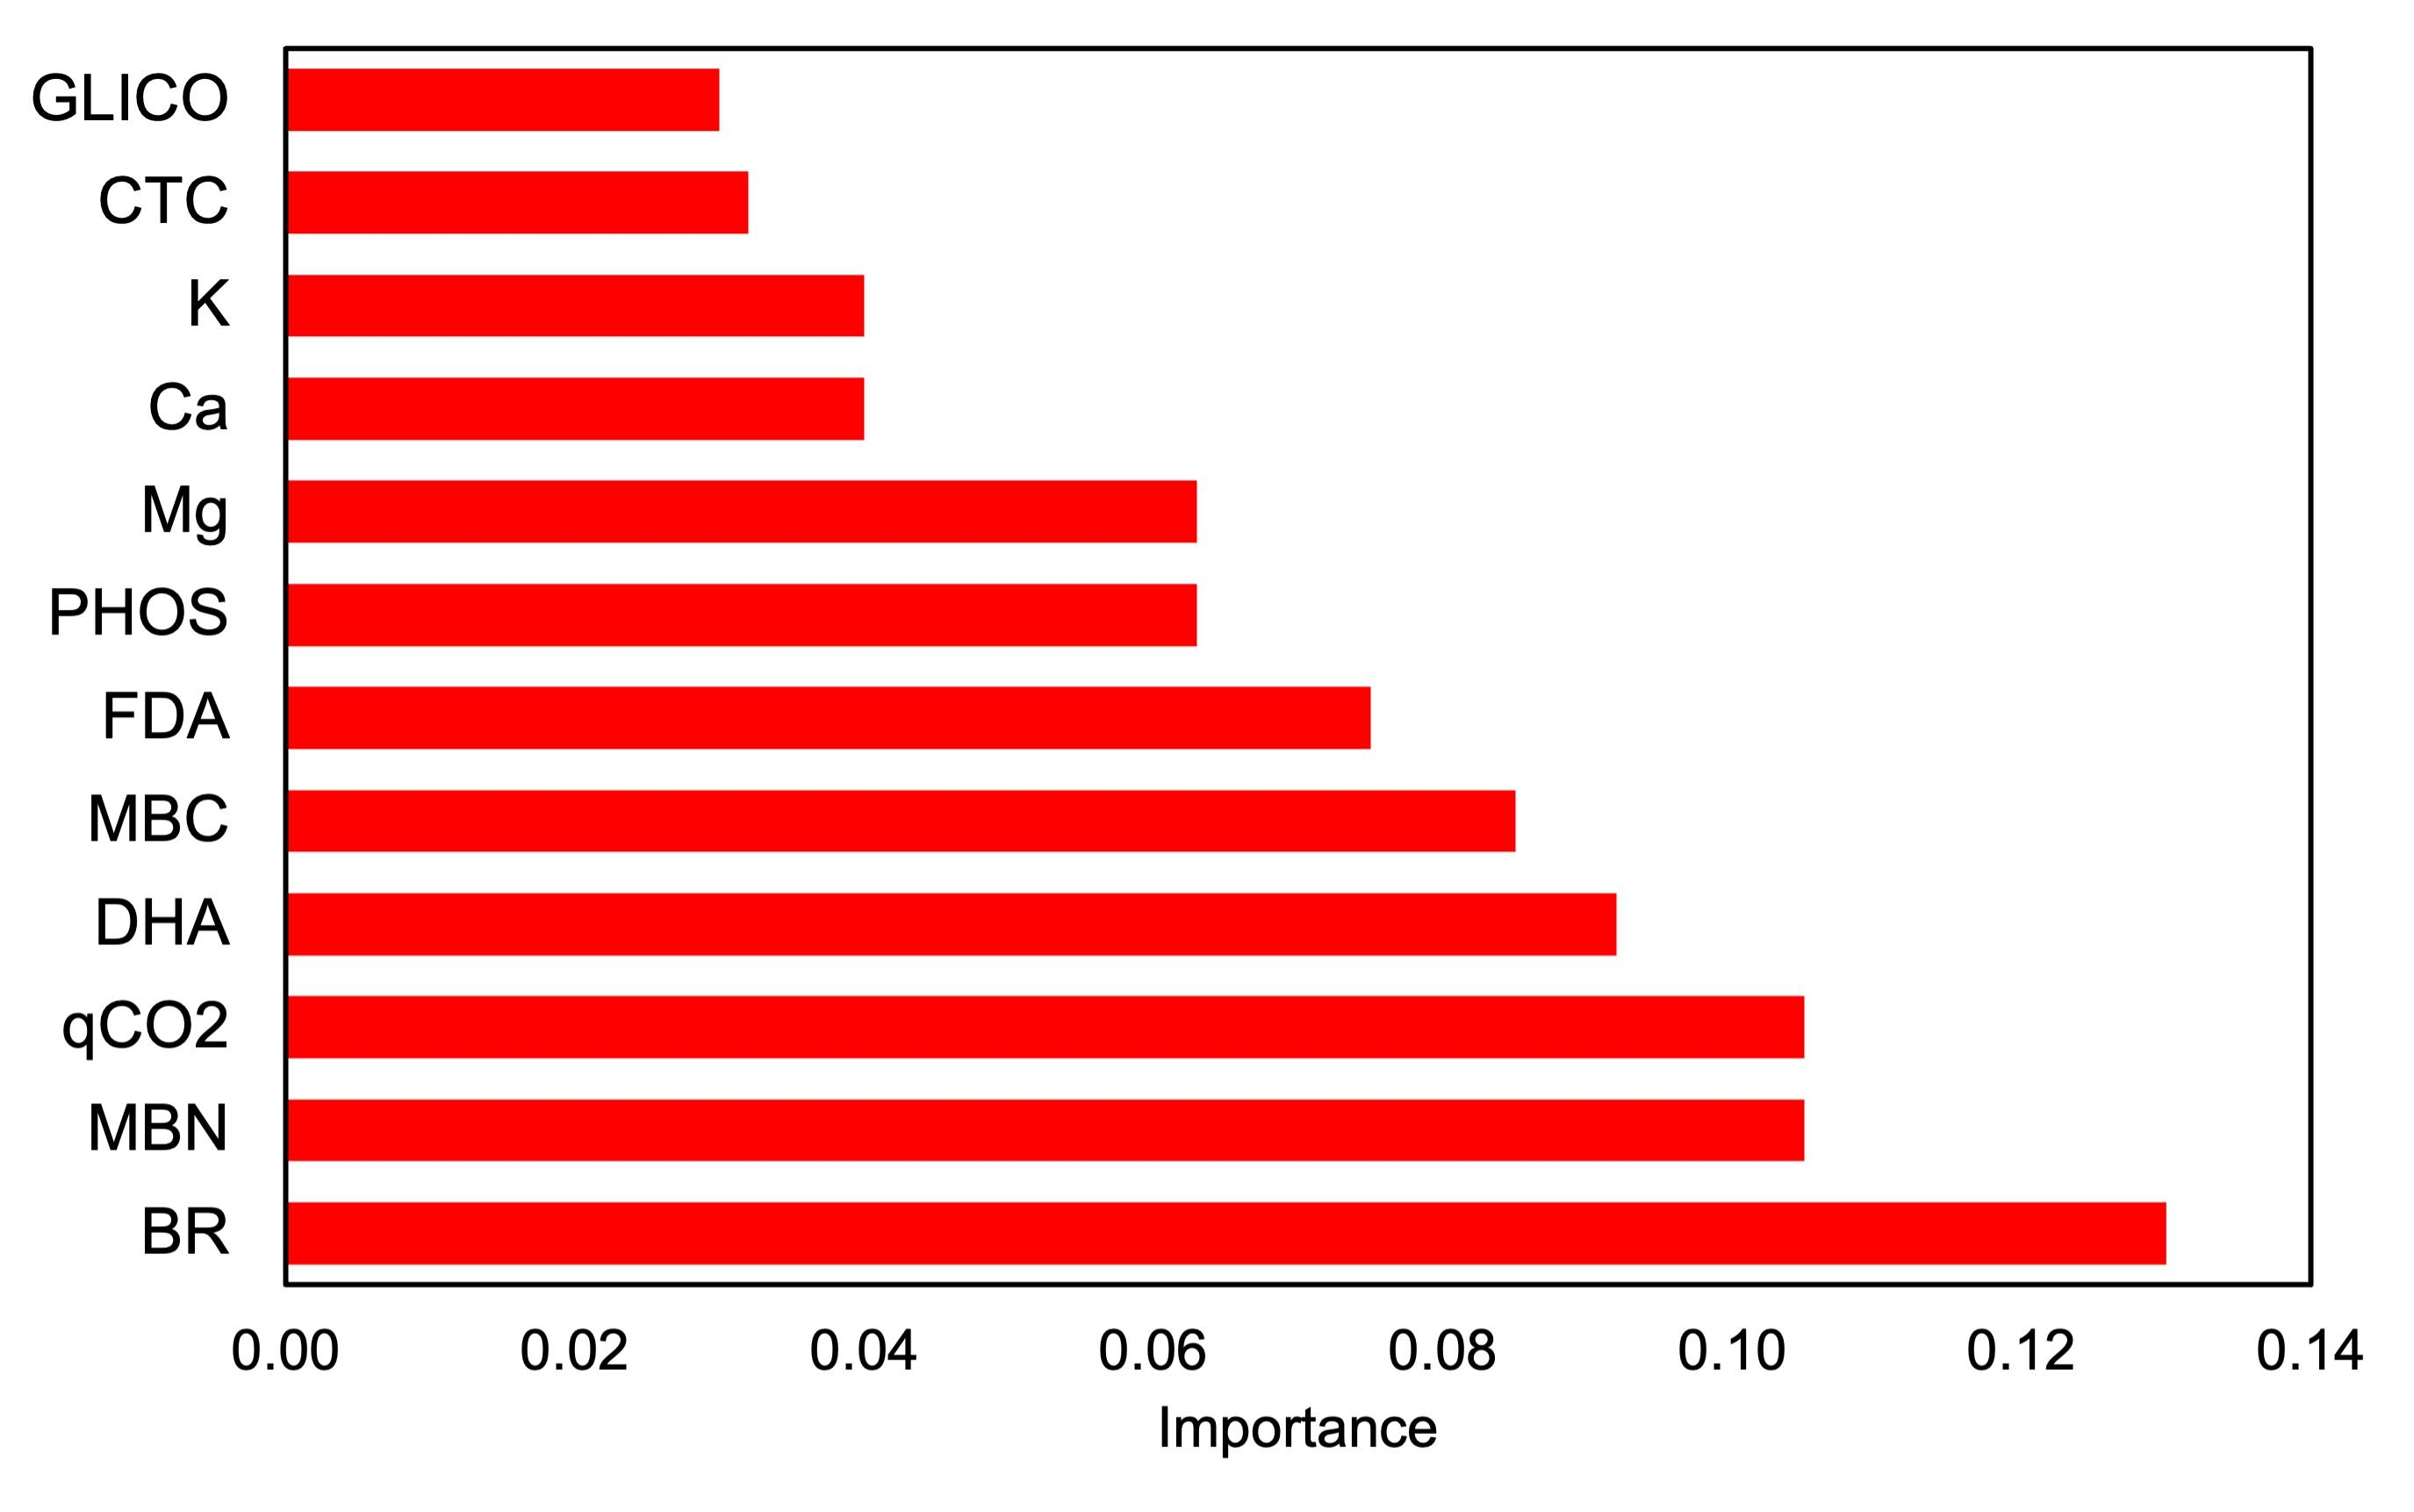
The attributes SBR, MBN, qCO2, MBC, DHA, and FDA ranked among the most important predictors in the Random Forest model (Figure 5). The predominance of microbial activity attributes is consistent with their rapid response to changes in environmental conditions and substrate availability, with soil basal respiration standing out as the most sensitive indicator of temporal and climatic variation. When only the eight microbial indicators were used, logistic regression maintained 95.0% accuracy. In contrast, when only chemical attributes were included, accuracy decreased to approximately 52%. These results indicate that the observed seasonal variation was primarily explained by microbial dynamics rather than by changes in soil chemical fertility alone.
Figure 5.
Variables of greatest importance identified by Random Forest for discriminating between sampling times.
The analysis of the Integrated Stability Gain (ISG) associated with compost application in the two grass species indicated an improvement in the microbial component, with a 21.1% increase when compost was applied to U. ruziziensis, whereas the response was smaller for U. brizantha (Table 4). In contrast, the effect on the chemical component was negative. Leave-one-epoch analysis revealed contrasting robustness between the two grass species (Table 5). For U. ruziziensis, microbiological ISG remained positive regardless of the sampling period removed, ranging from +4.7% to +33.7%, compared with +21.1% when all four periods were included. Therefore, although its magnitude varied, the direction of the compost-associated stability response was not determined by a single sampling period. In contrast, U. brizantha showed greater temporal sensitivity: ISG was +18.1% and +18.7% after removal of 2022-2 and 2023-2, respectively, but changed sign when 2023-1 (−3.1%) or 2024-1 (−11.3%) was removed.
Table 4.
Evaluation of water instability indices and stability gain (ISG) for the different components analyzed in two grass species and compost.
Table 5.
Leave-one-epoch sensitivity analysis of rTMI, rTWSI, and ISG for the two grass species.
Sensitivity analysis of the weighting scheme showed that the microbiological ISG for U. ruziziensis remained positive across the entire weighting range, varying only from approximately +19.7% to +22.4%, compared with +21.1% under equal weighting. In contrast, the ISG for U. brizantha ranged from approximately +0.5% to +13.2%, with +7.0% under equal weighting, indicating greater sensitivity of its magnitude to the weighting assumption.
Paired block resampling yielded positive microbiological ISG in 85.2% (23/27) of the resamples for U. ruziziensis and 88.9% (24/27) for U. brizantha. The corresponding empirical 2.5–97.5th percentile ranges were −7.1 to +27.7% and −2.2 to +14.0%, respectively, indicating appreciable block-level uncertainty for both species.
4. Discussion
The study was conducted under contrasting soil water availability conditions, with high water availability in 2022-2 and 2023-1 followed by severe water restriction in 2023-2 and 2024-1. The water stress index increased markedly over this period, indicating that the final evaluations were carried out under strong water limitation. Overall, the results show that temporal dynamics were more important than the annual application of organic compost as a soil conditioner in explaining changes in soil microbial attributes. This interpretation is supported by the predominance of sampling-period effects and sampling period × treatment interactions for most microbial variables, whereas the multivariate analysis showed a clear separation among periods but not between plots with and without compost. These findings confirm that, in tropical agricultural systems, soil microbial activity responds rapidly to climatic changes such as soil moisture and temperature, whereas structural changes resulting from organic matter application may require a longer period to become evident [6,7,9,21].
Soil microbial biomass remained relatively stable throughout the study, with increases observed in some treatments at the final sampling period. This pattern may indicate that the microbial community was able to adapt under stress conditions by maintaining preserved cells, including dormant forms. Previous studies have shown that, under stress, only a small fraction of microbial biomass may remain active, whereas part of the biomass persists in a dormant state or as necromass [22]. This condition is consistent with the reduction in dehydrogenase activity, which reflects the current metabolic status of microorganisms. Thus, the divergence between these indicators suggests that treatments and sampling periods affected different functional components of the microbial community rather than microbial activity as a whole.
Acid phosphatase activity increased over the experimental period, in contrast to dehydrogenase activity and FDA hydrolysis. This response may indicate either increased microbial and plant demand for phosphorus or the occurrence of environmental stress. Under conditions of low soil moisture, nutrient diffusion decreases, stimulating microorganisms and roots to exude phosphatases to mobilize organic P [23,24]. Arylsulfatase showed neither a significant Sampling Period effect nor a Treatment × Sampling Period interaction, suggesting comparatively low temporal variation. However, a significant main effect of Treatment was detected, with higher ARYL activity in both Brizantha treatments than in Fallow. This pattern indicates that ARYL differed among management systems in its overall level while maintaining a comparatively stable temporal response. This result is consistent with previous studies that have used arylsulfatase as an indicator of soil quality because of its cumulative behavior and relative resistance to climatic variation [25].
Soil basal respiration increased after the summer period, particularly in the final evaluation, when the fallow treatment showed the highest value for this indicator, suggesting a greater potential for soil carbon loss. Changes in the metabolic quotient were also observed, reinforcing the occurrence of disturbance and indicating lower microbial metabolic efficiency [26].
Discriminant analysis showed greater separation among treatments during periods of higher soil water deficit. This suggests that cropping systems and organic matter inputs may exert stronger effects under more severe abiotic stress conditions. In the final sampling period, which was characterized by the greatest water deficit, microbial biomass and phosphatase activity were the variables most strongly correlated with treatment discrimination.
The high accuracy achieved by the classification models using sampling period as the response variable, reaching 95% for both Random Forest and Logistic Regression, indicates that the measured attributes captured a consistent temporal signature, mainly associated with microbial activity. When only chemical attributes were used, accuracy decreased to approximately 52%. This finding reinforces that biological indicators were more responsive to the environmental conditions of the experiment than chemical attributes. It is also consistent with evidence showing that drought substantially affects soil microbial activity. A review on this topic reported that drought reduces microbial biomass and microbial activity by average values close to 20%, depending on soil type and plant management [27]. However, most studies have reported short-term responses and limited variation in plant management. Therefore, the greater variability in microbial activities observed in the present study is consistent with its temporal approach and with the marked climatic variability occurring in more fragile soils, such as sandy soils. In agricultural soils, insufficient water availability generally induces stronger changes in respiration and enzymatic activities than conditions of adequate water supply, although the magnitude of the response depends on management history and soil recovery capacity [28].
At the application rate evaluated in this study, the organic compost may have acted as a soil conditioner, enhancing the stability of microbial attributes throughout the assessment period; however, this effect appeared to depend on the grass species used. The integrated gain in microbiological stability was 21.1% for U. ruziziensis and only 7.0% for U. brizantha. Paired block resampling showed positive microbiological ISG in 85.2% of the resamples for U. ruziziensis and 88.9% for U. brizantha, although the empirical uncertainty ranges included zero for both species. The LOE analysis, however, revealed a clearer difference in temporal robustness: ISG remained positive after omission of any individual sampling period for U. ruziziensis, whereas it changed sign for U. brizantha when 2023-1 or 2024-1 was omitted. Therefore, the evidence for U. ruziziensis was more consistent with respect to temporal composition, while uncertainty related to the small number of experimental blocks remained substantial for both species.
The proposed TMI, TWSI, and ISG should be interpreted as study-specific descriptive metrics rather than externally validated indices or formal inferential statistics. Their main limitation is the availability of only four sampling periods; thus, TMI reflects temporal dispersion within the observed experimental window, while TWSI is based on only four WFA–period combinations. Because WFA and sampling period are completely confounded, TWSI should be interpreted as sensitivity to the observed WFA gradient rather than as an independent causal effect of water availability. Internal sensitivity analyses showed contrasting robustness between species. For U. ruziziensis, microbiological ISG remained positive after removal of any individual sampling period and across all relative weightings of TMI and TWSI. In contrast, ISG for U. brizantha changed sign in the leave-one-epoch analysis and was more sensitive to the weighting scheme. Therefore, the evidence of a stabilizing effect was more consistent for U. ruziziensis. Additional sampling periods and independent measurements of water availability are needed for external validation and long-term interpretation of these metrics.
Organic compost had a distinct effect on the attributes analyzed, with the improvement in MBN during the final evaluations being the most evident response. This result indicates that compost promoted localized changes in microbial functions but did not modify the overall set of attributes sufficiently to generate a stronger signature independent of seasonal variation. The lack of stabilization in soil fertility does not imply the absence of an agronomic effect; rather, it may reflect nutrient extraction from the soil by crops as well as nutrient replenishment within the management system. Among soil fertility attributes, K also showed a significant Treatment effect, although Tukey’s test identified a significant difference only between Brizantha and Fallow. The relatively limited number of significant Treatment effects suggests that two annual applications of 2.0 Mg ha−1 were not sufficient to consistently alter the overall microbial and soil fertility profile, although specific responses were detected for some microbial attributes and for soil K. However, this result does not imply that compost was ineffective. The short-term effectiveness of organic matter incorporation depends on the amount applied and on the composition of the material. The compost used in this study contained 30.8% organic matter, 1.7% nitrogen, and 3.2% P2O5, but the application rate was relatively low compared with studies using intensive manure or compost applications.
Long-term studies have shown that continuous compost application can increase available organic carbon, microbial biomass, soil aggregation, and structural stability, but these effects are more evident when inputs are repeated over several years [29]. Conversely, short-term experiments indicate that changes in microbial biomass and enzymatic activity may be modest even when compost increases total soil carbon [30]. Thus, the absence of a strong overall response in the present study may reflect the relatively short period since compost application began, combined with the occurrence of extreme water conditions.
From an agronomic perspective, the most relevant finding is that the potential contribution of compost appears to be less associated with a general increase in the analyzed attributes and more related to the modulation of microbiological stability, which was more evident in one of the evaluated grass species. This interpretation avoids attributing to compost a broad effect that is not supported by the data. Species-dependent responses are plausible because Urochloa spp. differ in root architecture, residue quantity and quality, and rhizospheric interactions; previous studies have also reported species-specific responses among grasses and soil indicators [4,5].
Finally, the study’s initial hypothesis was partially supported, as the application of organic compost acted as a soil conditioner, increasing the stability of microbial activity more consistently in the U. ruziziensis in CLI. Based on these findings, further studies using higher compost application rates and assessing chemical composition and microbial community structure are needed to confirm the effects observed in this study.
5. Conclusions
Microbial activity was considerably affected by temporal variation, which remained the predominant source of variability. Significant Treatment effects were detected for microbial biomass nitrogen, arylsulfatase, β-glucosidase activity, and soil K, although these responses were attribute-specific rather than indicative of a general improvement in soil quality. The multivariate analysis showed that the sampling period factor achieved 93% accuracy in predicting the observed results, with the microbial component accounting for most of this temporal effect. Under the conditions observed in this study, compost may act as a stabilizer of soil microbial activity in systems containing U. ruziziensis; however, the results do not support a universal effect on improved soil quality, nor do they allow this stability to be causally attributed to water availability.
Author Contributions
Conceptualization, M.F.S.M. and F.F.A.; methodology, F.F.A.; software, A.B.; validation, P.S.S., M.C.Z. and A.B.; formal analysis, E.M.R.; investigation, M.F.S.M. and F.F.A.; resources, F.F.A.; data curation, M.C.Z.; writing—original draft preparation, E.M.R.; writing—review and editing, F.F.A.; visualization, A.B.; supervision, M.C.Z.; project administration, F.F.A. All authors have read and agreed to the published version of the manuscript.
Funding
Fundação de amparo a pesquisa do Estado de São paulo: 2021/10823-0; National Council for Scientific and Technological Development: 306558/2025-8.
Data Availability Statement
The datasets presented in this article are not readily available because the data are part of an ongoing study. Requests to access the datasets should be directed to Fabio F. Araujo—fabio@unoeste.br.
Acknowledgments
The authors have reviewed and edited the output and take full responsibility for the content of this publication.
Conflicts of Interest
The authors declare no conflicts of interest.
References
- Grahmann, K.; Rubio Dellepiane, V.; Terra, J.A.; Quincke, J.A. Long-Term Observations in Contrasting Crop-Pasture Rotations over Half a Century: Statistical Analysis of Chemical Soil Properties and Implications for Soil Sampling Frequency. Agric. Ecosyst. Environ. 2020, 287, 106710. [Google Scholar] [CrossRef] [Scilit]
- Kim, N.; Zabaloy, M.C.; Guan, K.; Villamil, M.B. Do Cover Crops Benefit Soil Microbiome? A Meta-Analysis of Current Research. Soil Biol. Biochem. 2020, 142, 107701. [Google Scholar] [CrossRef] [Scilit]
- Muhammad, I.; Wang, J.; Sainju, U.M.; Zhang, S.; Zhao, F.; Khan, A. Cover Cropping Enhances Soil Microbial Biomass and Affects Microbial Community Structure: A Meta-Analysis. Geoderma 2021, 381, 114696. [Google Scholar] [CrossRef] [Scilit]
- Brandan, C.P.; Chavarría, D.; Huidobro, J.; Meriles, J.M.; Brandan, C.P.; Vargas Gil, S. Influence of a Tropical Grass (Brachiaria Brizantha Cv. Mulato) as Cover Crop on Soil Biochemical Properties in a Degraded Agricultural Soil. Eur. J. Soil Biol. 2017, 83, 84–90. [Google Scholar] [CrossRef] [Scilit]
- de Lima, S.F.; Secco, V.A.; Simon, C.A.; Silva, A.M.M.; Vendruscolo, E.P.; Andrade, M.G.d.O.; Contardi, L.M.; de Lima, A.P.L.; Cordeiro, M.A.S.; Abreu, M.S. Microbiological Attributes and Performance of the Bacterial Community in Brazilian Cerrado Soil with Different Cover Crops. Sustainability 2021, 13, 8318. [Google Scholar] [CrossRef] [Scilit]
- Bünemann, E.K.; Bongiorno, G.; Bai, Z.; Creamer, R.E.; De Deyn, G.; de Goede, R.; Fleskens, L.; Geissen, V.; Kuyper, T.W.; Mäder, P.; et al. Soil Quality—A Critical Review. Soil Biol. Biochem. 2018, 120, 105–125. [Google Scholar] [CrossRef] [Scilit]
- Miljaković, D.; Marinković, J.; Vasiljević, M.; Đorđević, V.; Bakogianni, M.A.; Nikoloudakis, N.; Manikas, I. Soil Microbiome Responses to Sustainable Agricultural Practices. Agriculture 2026, 16, 1957. [Google Scholar] [CrossRef] [Scilit]
- Amarasinghe, A.; Chen, C.; Van Zwieten, L.; Rashti, M.R. The Role of Edaphic Variables and Management Practices in Regulating Soil Microbial Resilience to Drought—A Meta-Analysis. Sci. Total Environ. 2024, 912, 169544. [Google Scholar] [CrossRef] [Scilit]
- Jin, B.-J.; Bi, Q.-F.; Li, K.-J.; Yu, Q.-G.; Ni, L.; Lin, X.-Y.; Zhu, Y.-G. Long-Term Combined Application of Chemical Fertilizers and Organic Manure Shapes the Gut Microbial Diversity and Functional Community Structures of Earthworms. Appl. Soil Ecol. 2022, 170, 104250. [Google Scholar] [CrossRef] [Scilit]
- Martins, M.F.S.; Salvador, G.L.O.; Zerbinati, M.C.; Araujo, F.F. Atributos Químicos e Biológicos do Solo Após Aplicação de Composto Orgânico no Sistema Integração Lavoura—Pecuária; Boletim de Pesquisa PPGA-04; Unoeste: Presidente Prudente, Brazil, 2023; pp. 79–83. [Google Scholar]
- Vance, E.D.; Brookes, P.C.; Jenkinson, D.S. An Extraction Method for Measuring Soil Microbial Biomass C. Soil Biol. Biochem. 1987, 19, 703–707. [Google Scholar] [CrossRef] [Scilit]
- Brookes, P.C.; Landman, A.; Pruden, G.; Jenkinson, D.S. Chloroform Fumigation and the Release of Soil Nitrogen: A Rapid Direct Extraction Method to Measure Microbial Biomass Nitrogen in Soil. Soil Biol. Biochem. 1985, 17, 837–842. [Google Scholar] [CrossRef] [Scilit]
- Schnürer, J.; Rosswall, T. Fluorescein diacetate hydrolysis as a measure of total microbial activity in soil and litter. Appl. Environ. Microbiol. 1982, 43, 1256–1261. [Google Scholar] [CrossRef] [Scilit]
- Casida, L.E.; Klein, D.A.; Santoro, T. Soil dehydrogenase activity. Soil Sci. 1964, 98, 371–376. [Google Scholar] [CrossRef] [Scilit]
- Tabatabai, M.A. Soil Enzymes. In Methods of Soil Analysis; John Wiley & Sons, Ltd.: Hoboken, NJ, USA, 1994; pp. 775–833. ISBN 978-0-89118-865-0. [Google Scholar]
- Jenkinson, D.S.; Powlson, D.S. The Effects of Biocidal Treatments on Metabolism in Soil—I. Fumigation with Chloroform. Soil Biol. Biochem. 1976, 8, 167–177. [Google Scholar] [CrossRef] [Scilit]
- Malavolta, E.; Vitti, G.C.; Oliveira, S.A. de Avaliação do Estado Nutricional das Plantas: Princípios e Aplicações, 2nd ed.; POTAFOS: Piracicaba, Brazil, 1997; p. 319p. [Google Scholar]
- Carlesso, R.; Santos, R.F. Disponibilidade de água às plantas de milho em solos de diferentes texturas. Rev. Bras. Ciênc. Solo 1999, 23, 17–25. [Google Scholar] [CrossRef] [Scilit]
- Lal, R. Soil Health and Carbon Management. Food Energy Secur. 2016, 5, 212–222. [Google Scholar] [CrossRef] [Scilit]
- Anderson, M.J. Distance-Based Tests for Homogeneity of Multivariate Dispersions. Biometrics 2006, 62, 245–253. [Google Scholar] [CrossRef] [Scilit]
- OECD; European Union; EC-JRC. Handbook on Constructing Composite Indicators: Methodology and User Guide; OECD Publishing: Paris, France, 2008. [Google Scholar] [CrossRef] [Scilit]
- Blagodatskaya, E.; Kuzyakov, Y. Active Microorganisms in Soil: Critical Review of Estimation Criteria and Approaches. Soil Biol. Biochem. 2013, 67, 192–211. [Google Scholar] [CrossRef] [Scilit]
- Song, F.B.; Han, X.; Zhu, X.; Herbert, S.J. Response to water stress of soil enzymes and root exudates from drought and non-drought tolerant corn hybrids at different growth stages. Can. J. Soil Sci. 2012, 92, 501–507. [Google Scholar] [CrossRef] [Scilit]
- Grierson, P.F.; Adams, M.A. Plant species affect acid phosphatase, ergosterol and microbial P in a Jarrah (Eucalyptus marginata Donn ex Sm.) forest in south-western Australia. Soil Biol. Biochem. 2000, 32, 1817–1827. [Google Scholar] [CrossRef] [Scilit]
- Carvalho Mendes, I.; Martinhão Gomes Sousa, D.; Dario Dantas, O.; Alves Castro Lopes, A.; Bueno Reis Junior, F.; Ines Oliveira, M.; Montandon Chaer, G. Soil Quality and Grain Yield: A Win–Win Combination in Clayey Tropical Oxisols. Geoderma 2021, 388, 114880. [Google Scholar] [CrossRef] [Scilit]
- Wardle, D.A.; Ghani, A. A critique of the microbial metabolic quotient (qCO2) as a bioindicator of disturbance and ecosystem development. Soil Biol. Biochem. 1995, 27, 1601–1610. [Google Scholar] [CrossRef] [Scilit]
- Qu, Q.; Wang, Z.; Gan, Q.; Liu, R.; Xu, H. Impact of Drought on Soil Microbial Biomass and Extracellular Enzyme Activity. Front Plant Sci. 2023, 14, 1221288. [Google Scholar] [CrossRef] [Scilit]
- Schnecker, J.; Meeden, D.B.; Calderon, F.; Cavigelli, M.; Lehman, R.M.; Tiemann, L.K.; Grandy, A.S. Microbial Activity Responses to Water Stress in Agricultural Soils from Simple and Complex Crop Rotations. Soil Discuss. 2021, 7, 547–561. [Google Scholar] [CrossRef] [Scilit]
- Wang, D.; Lin, J.Y.; Sayre, J.M.; Schmidt, R.; Fonte, S.J.; Rodrigues, J.L.M.; Scow, K.M. Compost Amendment Maintains Soil Structure and Carbon Storage by Increasing Available Carbon and Microbial Biomass in Agricultural Soil—A Six-Year Field Study. Geoderma 2022, 427, 116117. [Google Scholar] [CrossRef] [Scilit]
- Guasconi, D.; Cousins, S.A.O.; Manzoni, S.; Roth, N.; Hugelius, G. Experimental Drought and Soil Amendments Affect Grassland Above- and Belowground Vegetation but Not Soil Carbon Stocks. Soil Discuss. 2025, 11, 233–246. [Google Scholar] [CrossRef] [Scilit]

Disclaimer/Publisher’s Note: The statements, opinions and data contained in all publications are solely those of the individual author(s) and contributor(s) and not of MDPI and/or the editor(s). MDPI and/or the editor(s) disclaim responsibility for any injury to people or property resulting from any ideas, methods, instructions or products referred to in the content. |
© 2026 by the authors. Licensee MDPI, Basel, Switzerland. This article is an open access article distributed under the terms and conditions of the Creative Commons Attribution (CC BY) license.