


Highlights
Please indicate how your work links to systems science via your contributions to systems practice, theory, and/or methodology.
- •
- Integrates multidimensional public AI orientations in a mixed-indicator finite-mixture framework, identifying recurring configurations rather than reducing attitudes to a single positive–negative continuum.
- •
- Connects person-centered measurement with systems-level questions of digital inclusion, public communication, and AI-enabled social futures.
What are the main findings and/or the implications of the main findings?
- •
- Within this online quota sample, three model-estimated profiles emerged—highly engaged enthusiasts (9.4%), mainstream optimists (61.1%), and cautious ambivalents (29.5%)—with marked differences in prior generative AI use and perceived diffusion.
- •
- Within the sample, cautious ambivalents placed greater adjusted emphasis on a safe society and trustworthy government; these profile shares and contrasts are sample-specific rather than national prevalence estimates.
Abstract
Public responses to artificial intelligence (AI) may combine capability, critical awareness, expected benefits, global outlook, and affect in configurations that are not captured by a single optimism–resistance continuum. We analyzed an unweighted, non-probability online quota sample of 2000 South Korean adults aged 18–69 collected in August 2025; the sample is not nationally representative. A mixed-indicator finite-mixture model combined three continuous indicators with categorical measures of global outlook and affective balance. The retained three-profile solution yielded model-estimated sample shares of 9.4% highly engaged enthusiasts, 61.1% mainstream optimists, and 29.5% cautious ambivalents. Prior-year generative AI use, treated as antecedent behavioral experience, was 88.1%, 74.8%, and 56.0%, respectively, and concurrent perceptions of AI presence and diffusion differed across profiles (all pooled Wald p < 0.001). Cautious ambivalents placed greater adjusted emphasis on a safe society and trustworthy government, whereas work–life balance was no longer significant after false discovery rate adjustment. Sensitivity analyses excluding the two-item critical-awareness indicator and restricting affect to its two common categories preserved the broad profile ordering (ARI = 0.942 and 0.915). Bootstrap stability was weaker for the smallest highly engaged profile, with 25 of 100 resamples yielding ARI < 0.50. The findings support sample-level heterogeneity in AI orientations while underscoring limits from non-probability sampling, brief measurement, classification instability, and cross-sectional self-report data.
1. Introduction
Artificial intelligence (AI) is increasingly encountered in search, recommender systems, education, translation, workplace software, public services, and generative AI interfaces. Public reactions to this diffusion are not uniformly favorable or unfavorable. The 2026 AI Index, for example, reported that majorities in many countries saw benefits in AI while substantial shares also expressed nervousness about its development [1]. Social media analysis of post-ChatGPT (GPT-5.6 Sol) discourse similarly documents simultaneous excitement and concern about employment, misinformation, and broader social consequences [2]. Such coexistence is theoretically important. People may use AI for convenience or productivity, recognize its potential social value, and nevertheless remain alert to inaccuracies, bias, privacy risks, or loss of control.
Much research has examined average relationships among AI knowledge, perceived usefulness, trust, emotion, and adoption. Variable-centered analyses are indispensable for estimating net associations, but they can obscure configurations that coexist within individuals. A respondent may be confident using AI but critically aware of unreliable outputs; hopeful about social benefits yet emotionally mixed; or skeptical about diffusion while continuing to use generative AI. Treating these combinations as positions on a single optimism–resistance continuum risks collapsing substantively different orientations.
A person-centered approach addresses this problem by identifying recurrent configurations rather than assuming that one average structure describes all respondents. Prior work has used latent profiles to study heterogeneous patterns of internet use and human perceptions of conversational AI [3,4]. Research on general AI attitudes also demonstrates that positive and negative evaluations are partly separable [5,6]. Together, these literatures suggest that the social impact of computing is better understood when capability, critical awareness, expected value, global outlook, and affect are analyzed jointly.
South Korea provides an informative setting for this analysis. An OECD review describes Korea as a leader in strategic public sector data use and government-data maturity, reflecting an institutional environment in which digital systems are deeply embedded [7]. At the same time, advanced infrastructure does not predetermine how citizens interpret AI in everyday life. The present survey captures public orientations during a period of rapid visibility of generative AI and active discussion of AI-enabled social futures. The case is used for analytical leverage, not to claim that one national sample represents all digital societies.
Comparative AI governance research further shows that public orientations are embedded in wider institutional systems. The AI Governance International Evaluation Index (AGILE Index) 2025 evaluates 40 countries through four pillars—AI development level, AI governance environment, AI governance instruments, and AI governance effectiveness—and incorporates public attitudes and expectations in its evidence base [8]. South Korea is placed in the top tier of the 2025 assessment. Country-level governance benchmarks and individual-level survey profiles address different levels of analysis, but considering them together helps situate citizen capability, critical awareness, affect, and desired social futures within the broader governance environment that shapes public perceptions of AI.
This study makes four contributions. First, it explores the empirical distinction between perceived capability/engagement and a focused two-item indicator of critical AI awareness rather than combining all seven items into a single undifferentiated literacy score; the awareness measure is not treated as a comprehensive validated latent construct. Second, it preserves the measurement level of global outlook and ranked emotional responses through a mixed-indicator finite-mixture model. Third, it compares profile membership with prior generative AI use as antecedent behavioral experience and with concurrent perceptions of AI diffusion using posterior class draws, thereby carrying classification uncertainty into external-association tests. Fourth, it analyzes ranked future priorities with a score that differentiates first, second, and third choices. These decisions align measurement, modeling, and inference while keeping causal and population claims outside the design’s scope.
RQ1. What orientation profiles emerge within this online quota sample from perceived AI capability and engagement, a focused two-item critical-awareness index, expected societal benefits, global hope–concern, and affective balance?
RQ2. How do the profiles differ in prior-year generative AI use and in perceived AI presence, personal consequences, and societal diffusion?
RQ3. How do the profiles differ in their ranked priorities for desirable AI-enabled societal futures?
The remainder of the paper develops the theoretical rationale, describes the survey and mixed-indicator model, reports profile and external-correlate results, and concludes with implications and limitations.
2. Theoretical Framework
2.1. Layered Public Evaluations of AI
Public evaluations of AI combine judgments about performance, utility, social fit, and institutional consequences. Algorithm-aversion studies show that people may withdraw from computational advice after observing errors, especially when judgment and accountability are salient [9]. Algorithm-appreciation research, by contrast, shows that people can prefer algorithmic to human judgment when they perceive computational advice as efficient or objective [10]. Perceptions of automated decision-making also vary with application and institutional context [11], while a recent meta-analysis shows that perceived capability and personalization jointly shape AI aversion or appreciation [12]. These results are not contradictory. Reliance depends on what the system is expected to do, the costs of error, and how responsibility is understood.
Generative AI adds an affective layer to these judgments because it is interactive, open-ended, and increasingly present in ordinary communication. User motivations can increase both trust and perceived creepiness [13], while attachment-related dispositions shape trust in AI beyond purely cognitive assessments [14]. The General Attitudes toward Artificial Intelligence Scale likewise separates positive from negative orientations rather than treating them as exact opposites [5,6]. A person may therefore express curiosity, expectation, and anxiety in the same evaluative episode.
Expected societal benefits provide another layer. Respondents can judge whether AI may contribute to health, safety, welfare, education, culture, work–life balance, climate response, civic participation, or trustworthy public services. These expectations extend beyond personal usefulness: they link computing to desired social outcomes. A profile model is valuable precisely because it can show whether benefit expectations align with capability, critical awareness, and affect—or diverge from them.
2.2. Capability, Engagement, and Critical AI Awareness
AI literacy is often defined as a multidimensional set of competencies that includes understanding what AI can do, interacting with it effectively, evaluating outputs, and recognizing ethical implications [15,16,17]. These dimensions should not be treated as interchangeable automatically. Confidence using AI for work or study reflects perceived capability; actively seeking information reflects engagement; recognizing that outputs may be inaccurate or biased reflects critical awareness.
The distinction matters for the societal impact of computing. Greater capability may promote use, but critical awareness can support calibrated rather than blind reliance. Overreliance studies show that users may follow AI advice even when contextual information would justify disagreement [18]. Conceptually, a capable user can remain alert to bias and privacy, while a less experienced user can still understand that AI requires caution. Separating these domains avoids defining literacy solely as enthusiasm or frequency of use.
In this study, capability/engagement and critical awareness are modeled separately because they are conceptually distinguishable, but the empirical evidence for the latter is deliberately treated as limited. The awareness index contains only two items, has narrower content, and shows modest reliability relative to the five-item capability/engagement scale. Accordingly, it is used as a focused exploratory indicator of error/bias awareness and privacy/copyright consideration, not as evidence that a comprehensive critical AI awareness construct has been established or discriminately validated. The profile solution evaluates its role directly in a sensitivity model that omits the indicator.
2.3. Global Outlook and Affective Balance
A global hope–concern item provides an overall evaluation of AI diffusion, but it does not capture the composition of respondents’ emotional reactions. Ranked emotions add this information. Positive-only selections indicate a consistently favorable top-three affective set; mixed selections indicate that at least one positive and one negative emotion are simultaneously salient; negative-only selections indicate a consistently adverse set; and an “other” category preserves responses not represented by the predefined valence coding. This operationalization aligns with evidence that positive and negative affect can co-occur rather than function as strict opposites [19].
This categorical treatment also addresses a measurement problem in the earlier analysis: positive and negative counts derived from three ranked selections are mechanically complementary for most respondents. Entering both counts as separate continuous indicators would therefore duplicate the same three choices and create near-deterministic dependence. The single affective-balance category preserves the composition of the ranked responses without treating the absence of a negative selection as a precisely scaled quantity. It codes response composition, not a claim that four ontologically discrete emotional states exist.
Ambivalence is not assumed to be indecision or measurement error. Research on technological paradoxes shows that the same technology can elicit simultaneous favorable and unfavorable reactions, and mixed-emotion research demonstrates that positive and negative affect can coexist [19,20]. Medical AI research similarly finds that people may recognize efficiency while resisting systems perceived as insufficiently attentive to uniqueness or explanation [21,22]. In the present study, however, “mixed affect” is only an operational label for co-selecting positive and negative emotions among the top three ranked responses; it is not a validated ambivalence scale. The size and characteristics of this category are therefore empirical and should be interpreted within that measurement constraint.
2.4. Person-Centered Models and External Correlates
Finite-mixture models estimate whether a set of latent subpopulations with distinct response patterns better represents the observed distribution [23,24,25]. In this survey, the indicators are mixed: three are approximately continuous composites, whereas global outlook and affective balance are categorical. A mixed-indicator model allows each type to retain its measurement structure rather than forcing ordinal and nominal variables into a Gaussian profile analysis.
Profile labels are interpretive summaries, not observed identities or permanent psychological types. Their value depends on external differentiation. Generative AI use is a behavioral correlate, whereas perceived daily presence, personal-life consequences, and societal diffusion capture how respondents locate AI in their immediate and anticipated environments. These variables were not used to create the profiles and therefore provide a clearer external test than comparing groups on their defining indicators.
Ranked desired futures provide a second external domain. Respondents selected the three kinds of society they most wanted AI to help create. A Borda-style score assigns three points to a first choice, two to a second, and one to a third, preserving priority information while remaining transparent. The analysis asks whether profiles differ strongly in those priorities or whether public groups converge on common values despite different relationships with AI.
3. Methods
3.1. Data Source and Sample
The present study is a secondary analysis of the first quantitative survey in a broader 2025 South Korean public AI perception project commissioned by the National Information Society Agency (NIA) and administered online by a professional survey firm. Fieldwork for the analyzed survey was conducted from 5 August to 10 August 2025. The questionnaire designated quotas for region, gender, and age and screened adults aged 18–69. The analytic file contained 2000 respondents and 75 variables. The broader NIA project subsequently conducted a focus group interview study and a separate online survey with different participants; neither follow-up study is analyzed here [26].
Source project documentation specifies online panel recruitment and quota balancing by region, age, and gender. However, the available materials do not identify the vendor-specific panel sampling frame, the number invited, response or completion rates, formal pretesting procedures, or controls for multiple participation. The analytic file included no survey weights. Accordingly, this analysis is an unweighted South Korean online quota sample, and inferential results pertain to the observed sample rather than design-based population estimates. The questionnaire’s opening screen explained the policy research purpose and confidentiality protections under the Korean Statistics Act and Personal Information Protection Act. The analytic file supplied for secondary analysis was de-identified.
Data checks found 2000 unique respondent identifiers, no duplicate rows, and no missing values on the variables used in the profile and external correlate analyses. Because the focal variables were complete, we did not perform item-level or case-level imputation. The Statements and Declarations section states the legal basis for ethics review and additional consent for this secondary analysis.
3.2. Measures
Perceived AI capability and engagement were the mean of five items rated from 1 to 5: prior self-reported knowledge of AI, interest in AI, perceived understanding of how AI works, active consumption of AI-related information during the preceding month, and confidence using AI for work or study. The scale demonstrated satisfactory internal consistency (Cronbach’s α = 0.844; McDonald’s ω = 0.846). The first eigenvalue was 3.10, and single-factor loadings ranged from 0.672 to 0.771.
Critical AI awareness was the mean of two five-point items: awareness that AI outputs can be inaccurate or biased and consideration of privacy and copyright when using AI. The items correlated at r = 0.454; the Spearman–Brown reliability coefficient was 0.624. Because two items cannot cover the full construct and reliability was modest, this variable is treated as a focused index rather than a comprehensive latent scale.
Expected societal benefits was the mean of 10 five-point items asking how helpful AI would be in creating desirable futures in health, safety, welfare, social connection, education, culture, work–life balance, climate response, civic participation, and trustworthy public services. The scale demonstrated high internal consistency (α = 0.887; ω = 0.887). The first eigenvalue was 4.97, with single-factor loadings from 0.619 to 0.693.
Global outlook toward the spread of AI was measured on a five-point scale ranging from very concerned (1) to very hopeful (5). All five categories were entered into the mixture model. For presentation, categories 1–2 are summarized as concerned, category 3 as neutral, and categories 4–5 as hopeful.
Affective balance was derived from respondents’ top three ranked emotions toward AI. Positive emotions were joy, expectation, trustworthiness, familiarity, curiosity, and surprise; negative emotions were anxiety, anger, exclusion, and fatigue. Respondents were coded positive-only when all three recognized emotions were positive, mixed when at least one positive and one negative emotion were selected, negative-only when all three were negative, and other when an “other” response was included. The questionnaire rotated the response options. Because negative-only and other responses were rare in the observed sample, we interpret class-conditional probabilities involving these categories descriptively and with particular caution.
External correlates included prior-year use of a generative AI service (yes/no), treated as antecedent behavioral experience because it temporally precedes the current cross-sectional attitudes, and three concurrent five-point perceptions assessing the extent to which AI development was felt in daily life, AI capability was expected to change the respondent’s personal life, and AI use was expected to diffuse throughout society. These variables were not used to construct the profiles and are not interpreted as consequences caused by profile membership.
Respondents also ranked the three societal futures they most wanted AI to help create from 10 predefined substantive options—health, safety, care and welfare, socially connected, equal educational opportunity, culturally rich, work–life balance, sustainable climate and environment, participatory, and trustworthy government—plus an “other” option. For each predefined substantive option, a rank-weighted score ranged from 0 to 3: three points for first rank, two for second, one for third, and zero if unselected. Option-specific analyses focused on the 10 predefined substantive categories; the online supplement reports top-three and first-choice indicators.
Demographic descriptors were gender, age group, region, education, and current occupation. Region, gender, and age were quota variables; occupation was not. The 75-variable analytic file did not contain a personal- or household-income measure. Occupation is therefore reported post hoc as a limited socioeconomic descriptor in online Supplementary Table S4 rather than treated as a complete measure of socioeconomic status.
3.3. Analytic Strategy
The profile model combined three standardized continuous indicators—capability/engagement, critical awareness, and expected societal benefits—with two categorical indicators—a five-category global outlook and a four-category affective balance. For respondent i, the model represents the joint response density as a weighted sum across K latent classes. Continuous indicators follow class-specific multivariate-normal means, and categorical indicators follow class-specific multinomial probabilities conditional on class. The retained covariance specification estimated a full covariance matrix for the continuous indicators and constrained that matrix to be equal across classes.
Solutions with one through five classes were compared using log-likelihood, Akaike information criterion (AIC), Bayesian information criterion (BIC), integrated completed likelihood (ICL), normalized entropy, average maximum posterior probability (AvePP), and smallest modal class. ICL adds a classification-uncertainty penalty to BIC and is useful when the goal is a parsimonious, well-separated classification [27]. Selection considered statistical fit, classification quality, class size, stability, and interpretability rather than relying on one index alone [28]. We used 60 K-means starts for each solution with two or more classes. We re-estimated the final three-class model with 80 starts and retained the highest-likelihood solution.
The expectation–maximization algorithm ran up to 1000 iterations, used a relative tolerance of 10−9 for the final model, and applied covariance regularization of 0.005. Four covariance specifications—equal diagonal, class-varying diagonal, equal full, and class-varying full—were evaluated in sensitivity analysis, each with 60 starts. In response to reviewer concern about the regularization choice, we additionally re-estimated the retained three-class equal-full model with 20 K-means starts at regularization values of 0.001, 0.0025, 0.010, and 0.020, bracketing the retained value of 0.005. We assigned profile names after estimation based on the full pattern of means and category probabilities.
We evaluated external correlates with pseudo-class multiple imputation rather than treating modal class assignments as known. For each of 1000 draws, respondents were assigned to a class from their posterior probability vector; class-specific means and sampling variances were then combined using Rubin’s rules [29,30,31]. Omnibus two-degree-of-freedom Wald tests assessed profile differences. We used pairwise contrasts with Holm adjustment within the four central external correlates. For the 10 future-priority scores, we applied Benjamini–Hochberg false discovery rate adjustment to the omnibus tests [32]. These comparisons are associational and do not establish temporal or causal effects of profile membership.
We evaluated stability in 100 nonparametric bootstrap resamples. We fit each resample from four starts, matched to the retained solution by class means, and compared it with the reference modal classification using the adjusted Rand index (ARI). Because the smallest profile was under 10%, we interpreted the bootstrap analysis as diagnostic rather than proof of invariant population types.
Three additional sensitivity analyses assessed the reviewer-identified measurement and specification concerns. First, we re-estimated the retained three-class model after removing the two-item critical-awareness indicator. Second, we re-estimated the three-class model with class-varying full covariance matrices to examine whether the profile ordering and substantive features persisted under the lower-BIC alternative. Third, because negative-only (1.8%) and other (1.0%) affect categories were sparse and conceptually distinct, a common-category sensitivity model excluded those 55 respondents rather than merging the categories; we then re-estimated the model among the 1945 respondents classified as positive-only or mixed affect. For each check, we assessed profile correspondence with the retained solution using estimated class shares, indicator patterns, and the adjusted Rand index for modal classifications.
We conducted analyses in Python 3.13.5 using pandas 2.2.3, NumPy 2.3.5, SciPy 1.17.0, and scikit-learn 1.8.0. Reporting follows the Consensus-Based Checklist for Reporting of Survey Studies (CROSS) [33].
4. Results
4.1. Sample and Measurement Characteristics
Table 1 summarizes the sample and focal variables. The gender distribution was close to balanced, and all adult age groups from 18 to 69 were represented. Bachelor’s degree holders constituted 63.9% of the sample. A total of 70.6% reported prior-year generative AI use. Affective responses were not simply polarized: a total of 53.7% selected only positive emotions, 43.6% selected both positive and negative emotions, 1.8% selected only negative emotions, and 1.0% selected an “other” response. The last two categories were therefore sparse, so their class-conditional probabilities should not be interpreted as precise estimates of subgroup characteristics.
Table 1.
Sample characteristics and descriptive statistics.
The measurement diagnostics supported treating capability/engagement and critical awareness separately. The five capability/engagement items formed a coherent scale, whereas the two critical-awareness items showed a moderate interitem correlation and modest reliability. Expected societal benefits demonstrated a clear dominant factor and high internal consistency. Supplementary Table S1 provides item definitions, loadings, and reliability statistics.
4.2. Model Selection
Table 2 reports the one- through five-class solutions for the equal full-covariance specification. AIC and BIC continued to improve as classes were added, but ICL reached its minimum for the three-class solution. The four- and five-class solutions produced very small modal classes of 3.0% and 0.9%, respectively, and did not improve classification sufficiently to justify the added complexity. The three-class solution had a normalized entropy of 0.848, an overall AvePP of 0.928, and the smallest modal class of 9.4%.
Table 2.
Mixed-indicator model selection.
Covariance sensitivity results also favored the equal full-covariance model for classification. Although the class-varying full-covariance model had a lower BIC, the equal full-covariance model had the lowest ICL, higher entropy, and higher AvePP. We therefore retained it as the more stable and parsimonious profile representation (Supplementary Table S2). Importantly, a reviewer-requested refit of the class-varying full-covariance specification preserved the same substantive ordering: the high-engagement/high-benefit profile remained distinct, the mainstream optimistic profile remained intermediate, and the cautious/mixed affect profile remained lowest in capability and benefit expectations. Estimated shares shifted from 9.4%/61.1%/29.5% to approximately 11.0%/56.5%/32.5%, and modal classifications showed substantial agreement with the retained model (ARI = 0.846; Supplementary Table S6).
4.3. The Three Public-Orientation Profiles
Table 3 and Figure 1 summarize the profiles. Estimated mixing proportions, rather than deterministic modal assignments, are reported. Class labels are interpretive shorthand for joint response patterns, not observed identities or fixed psychological types. In particular, the label “cautious ambivalents” denotes the combination of mixed affect, neutral-to-concerned global outlook, and comparatively lower capability and benefit expectations; it does not imply categorical rejection of AI or below-midpoint scores on every continuous dimension.
Table 3.
Characteristics of the retained three-profile solution.
Figure 1.
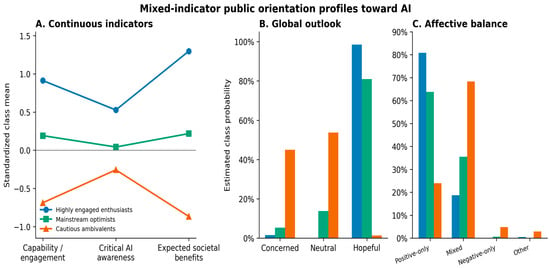
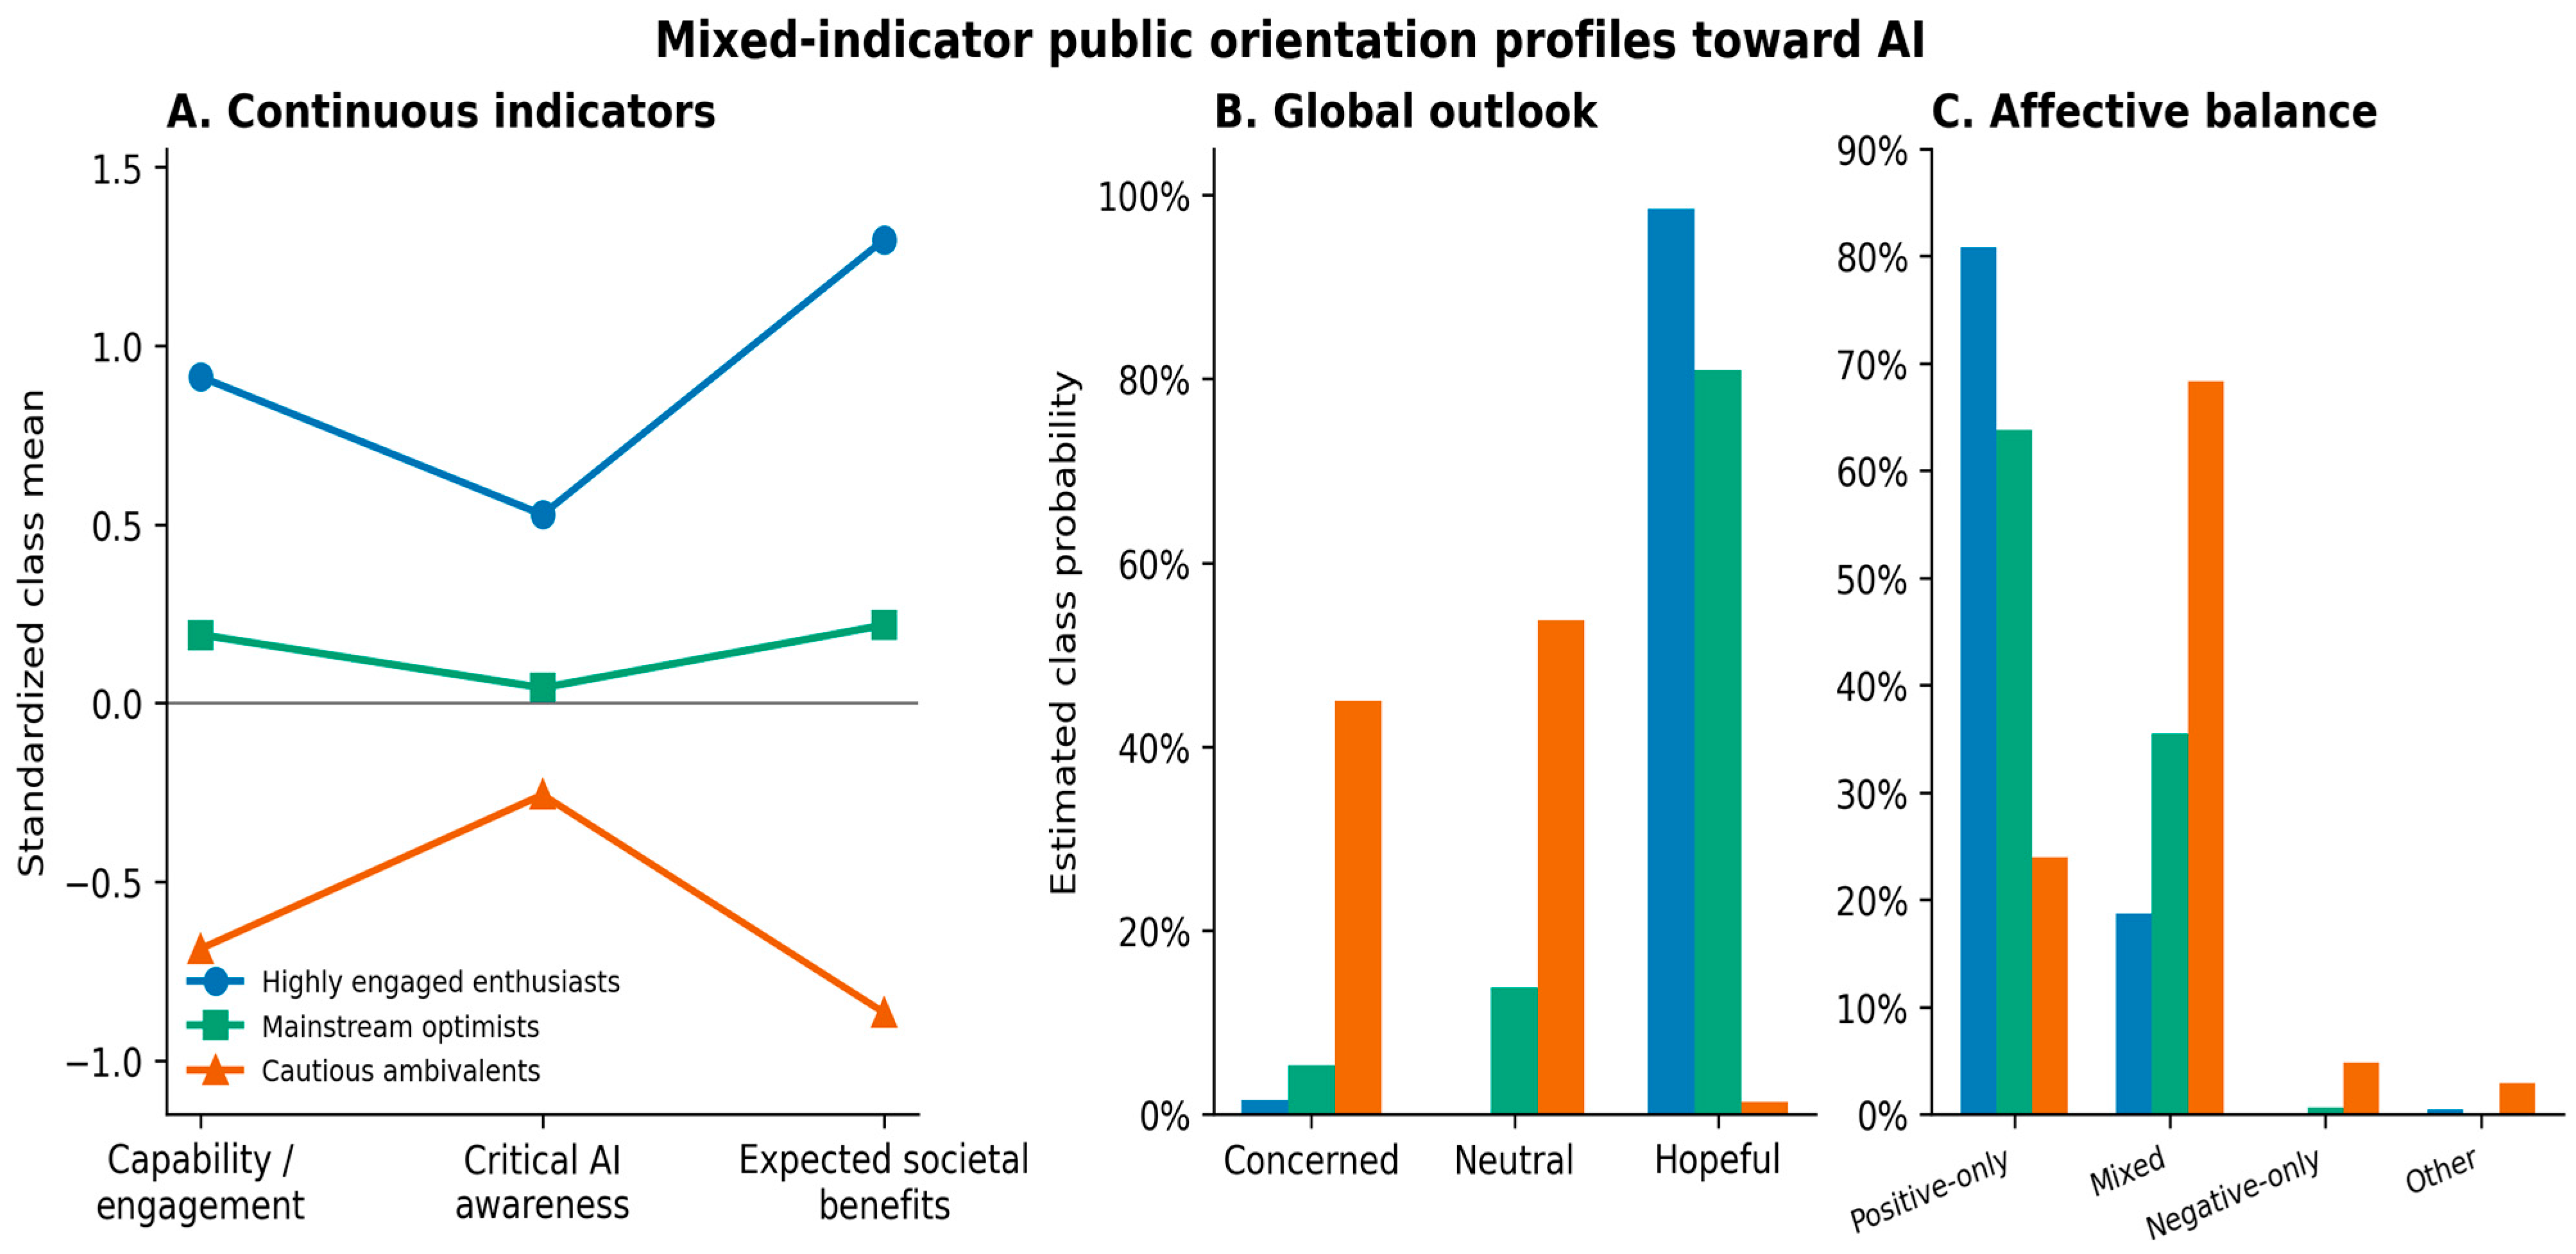
Mixed-indicator public-orientation profiles toward AI. Note: (A) shows standardized continuous-indicator means. (B,C) show estimated class-conditional probabilities. The global outlook was modeled with five categories and collapsed into concerned, neutral, and hopeful for display. Model-estimated sample shares were 9.4%, 61.1%, and 29.5%; they should not be interpreted as national population proportions.
Highly engaged enthusiasts had a model-estimated sample share of 9.4%. Their capability/engagement mean was 4.00, critical awareness was 4.12, and expected benefits were 4.56. The model estimated 98.4% as hopeful and 80.8% as positive-only in affect. This profile was distinctive not only for its enthusiasm but also for its unusually high perceived capability and social benefit expectations within the observed sample.
Mainstream optimists had the largest model-estimated sample share (61.1%). Their continuous means were moderately above the sample average; a total of 80.9% were estimated as hopeful, and 63.8% were positive-only in affect. However, 35.5% were affectively mixed, showing that a broadly optimistic orientation did not require exclusively positive emotions.
Cautious ambivalents had a model-estimated sample share of 29.5%. They had the lowest capability/engagement and benefit expectations, while critical awareness remained comparatively high at 3.56 and expected benefits remained above the scale midpoint at 3.31. Their global outlook was divided between concern (45.0%) and neutrality (53.7%), with little estimated hope (1.3%). Mixed affect was dominant at 68.3%. The label therefore summarizes relative caution and affective mixing within this sample, not categorical rejection or uniformly negative evaluation of AI.
4.4. Generative AI Use and Perceived Diffusion
Table 4 and Figure 2 report uncertainty-adjusted external correlates. All four omnibus profile differences were statistically significant (pooled Wald p < 0.001), and all pairwise contrasts remained significant after Holm adjustment. These differences are associational; prior-year generative AI use temporally precedes the current attitude measures rather than resulting from them.
Table 4.
Uncertainty-Adjusted External Correlates by Profile.
Figure 2.
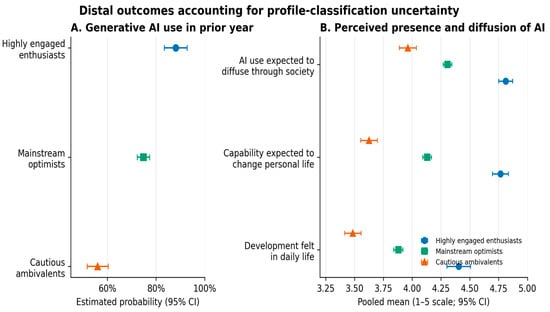
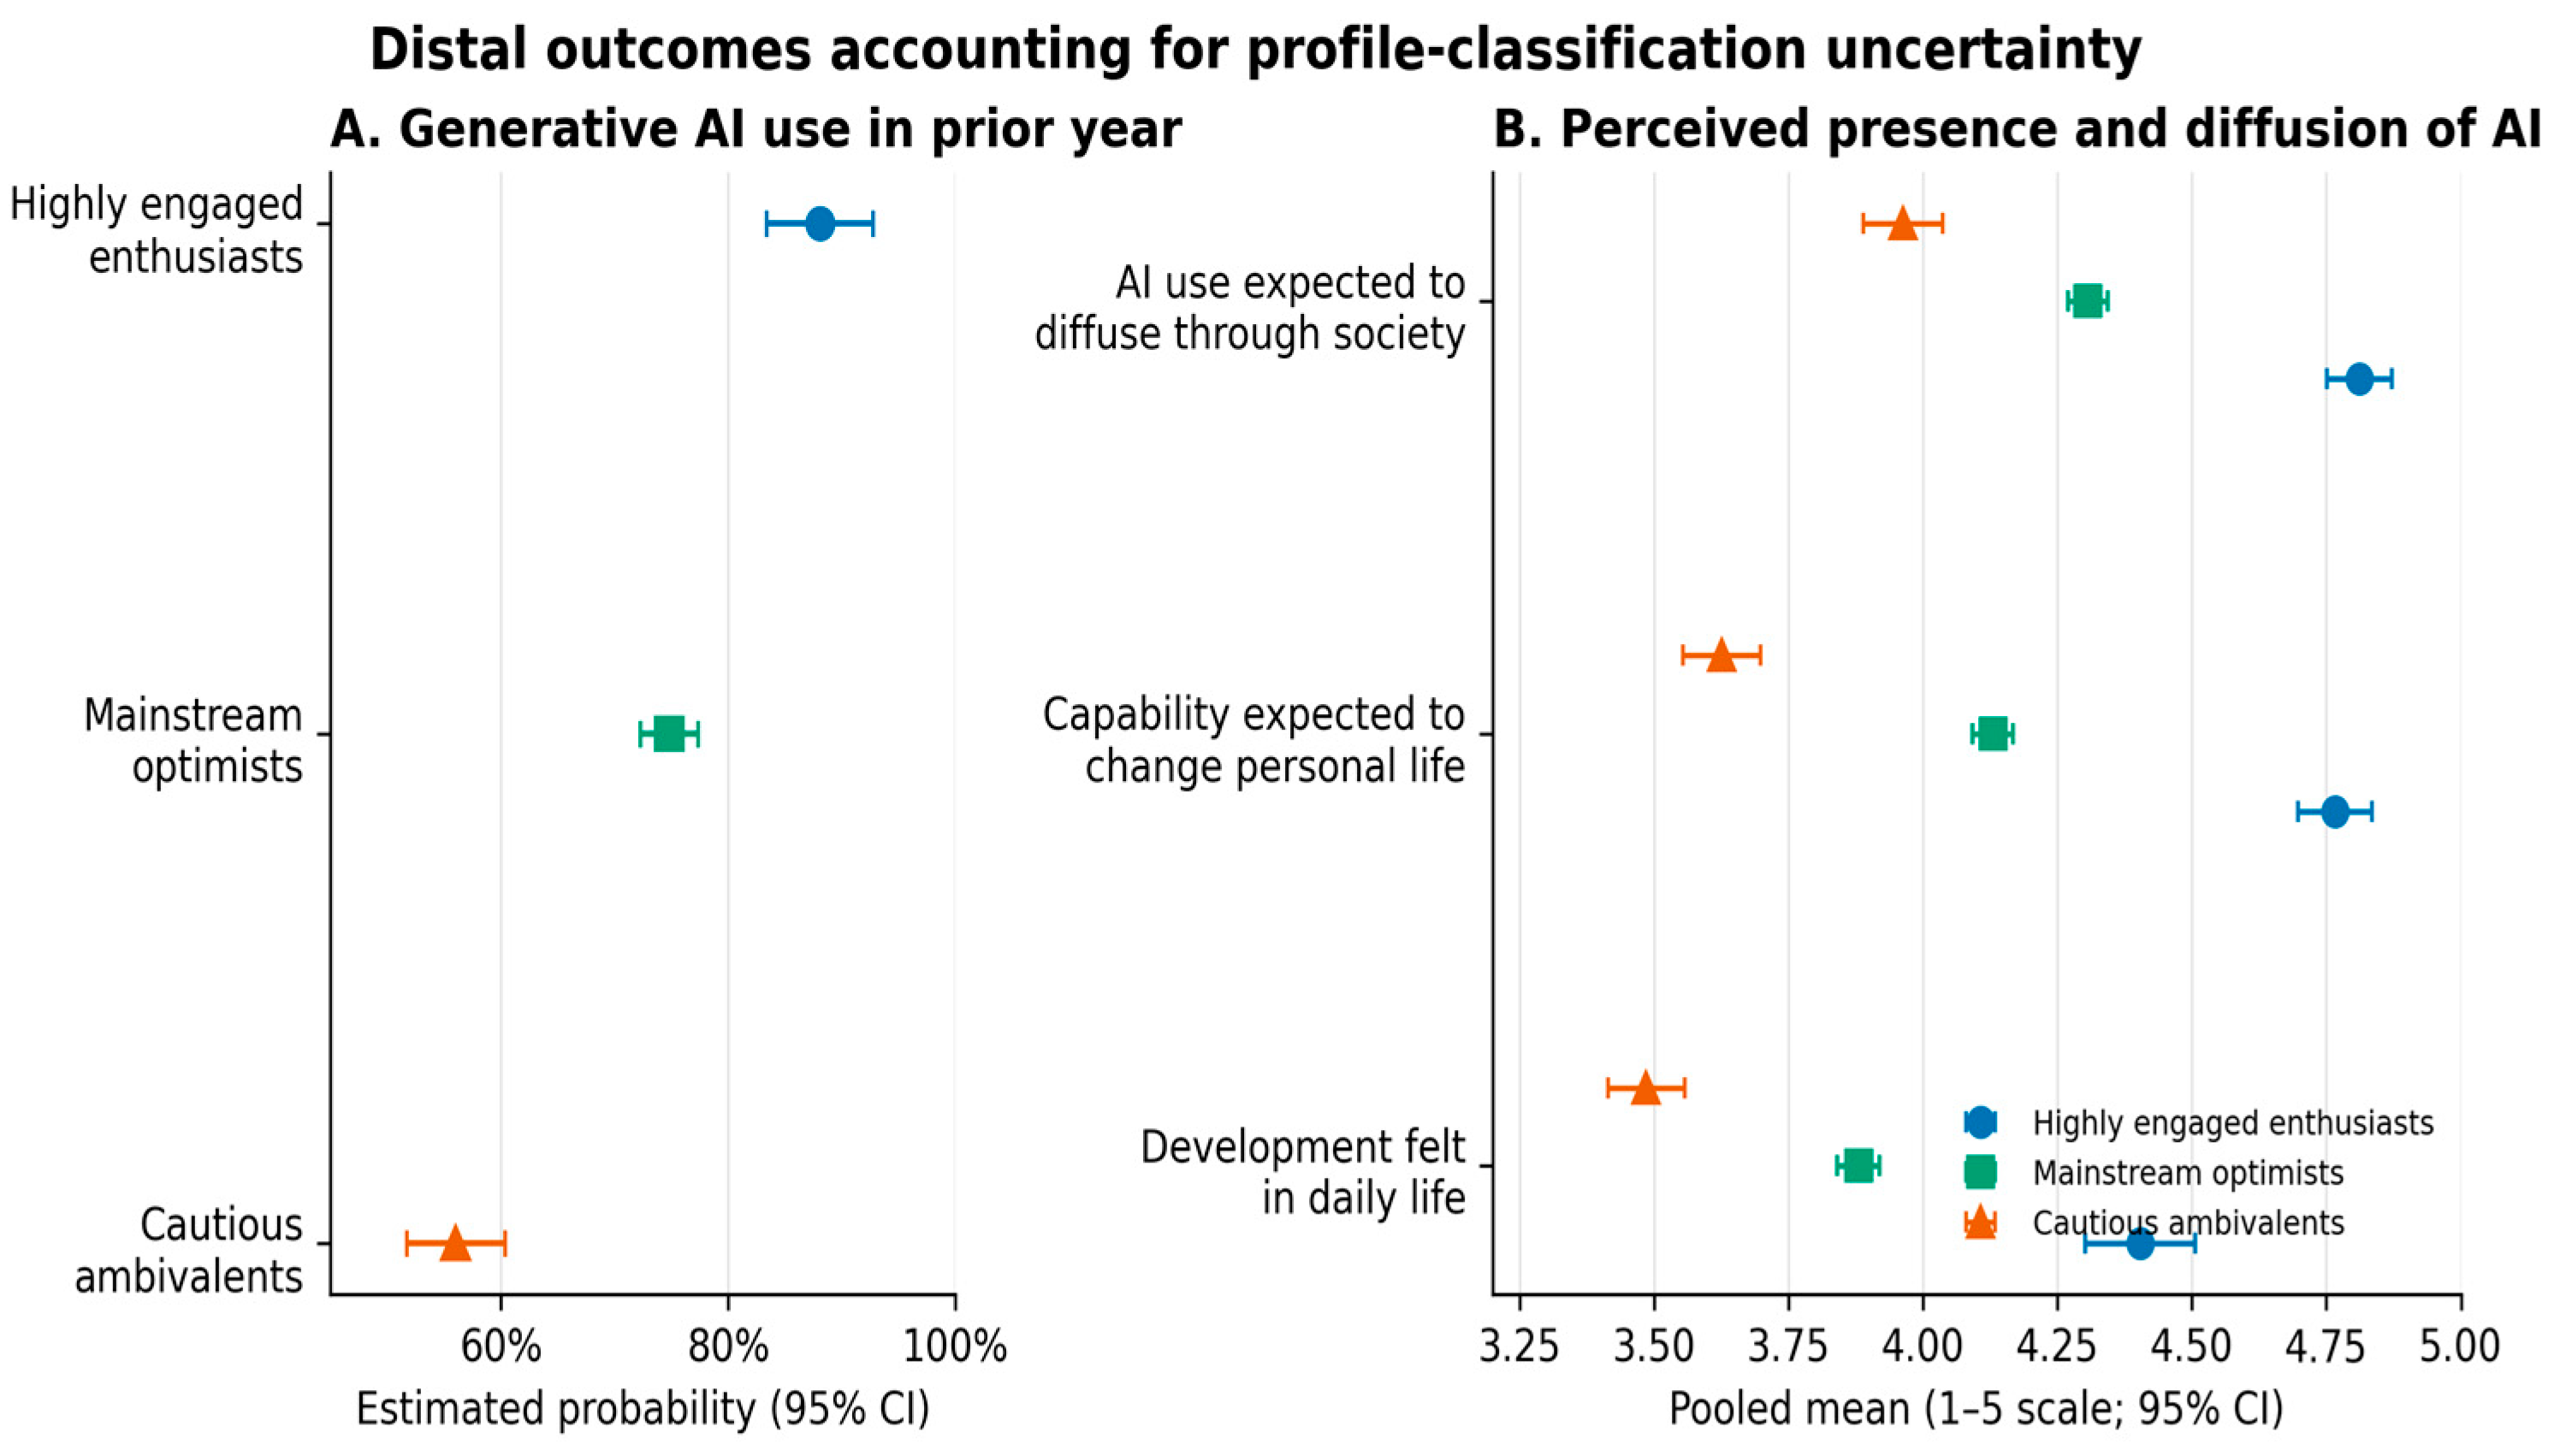
Generative AI use and perceived diffusion by profile. Note: Point estimates and 95% confidence intervals are pooled across 1000 posterior class draws. Prior-year generative AI use is plotted as a probability; perception items use five-point response scales.
Prior-year generative AI use, interpreted as antecedent behavioral experience, was estimated at 88.1% among highly engaged enthusiasts, 74.8% among mainstream optimists, and 56.0% among cautious ambivalents. Concurrent daily AI presence followed the same ordering, with pooled means of 4.40, 3.88, and 3.49. Highly engaged enthusiasts also reported the strongest concurrent expectation that AI would change their personal life (4.77) and diffuse throughout society (4.81). The cautious profile remained above the midpoint on both perception measures, indicating lower but not absent expectations of diffusion. These patterns differentiate the profiles but do not establish that the profiles caused prior use or concurrent perceptions.
4.5. Ranked AI-Enabled Future Priorities
Table 5 presents Borda scores that retain rank information. Across the sample, a safe society received the highest mean score (1.05), followed by work–life balance (0.91), a healthy society (0.73), and trustworthy government (0.65). After the Benjamini–Hochberg correction, profile differences remained significant for a safe society and trustworthy government. Work–life balance did not meet the prespecified 0.05 false discovery rate threshold (q = 0.053) and is therefore not interpreted as evidence of a profile difference.
Table 5.
Rank-weighted desired AI-enabled futures by profile.
Cautious ambivalents weighted a safe society (1.19) and trustworthy government (0.72) more heavily than highly engaged enthusiasts (0.92 and 0.46, respectively). For most other futures, adjusted differences were not significant. Supplementary Table S3 reports Borda, top-three, and first-choice results, and Supplementary Figure S1 visualizes the full rank-weighted pattern. The substantive ordering was broadly consistent for safety and trustworthy government across the three operationalizations, although statistical significance varied by metric: the safe-society contrast survived correction for Borda (q = 0.040) and top-three selection (q = 0.007) but not first choice. In contrast, trustworthy government survived correction for Borda (q = 0.040) and first choice (q = 0.027) but not top-three selection (q = 0.072). For work–life balance, none of the three adjusted tests met the 0.05 threshold (Borda q = 0.053; top three q = 0.072; first choice q = 0.114), so numerical differences are not treated as a substantive profile finding.
4.6. Robustness and Stability
The covariance sensitivity analysis showed that the retained equal full-covariance model had the lowest ICL (24,174.08) and the highest AvePP (0.928) among the four specifications. The regularization check also supported the retained structure: across values from 0.001 to 0.020, estimated profile shares changed by less than one percentage point, AvePP remained about 0.928, and modal classifications closely matched the 0.005 solution (ARI = 0.986–1.000). The class-varying full-covariance refit likewise preserved the substantive ordering of the three profiles, although the estimated shares shifted to approximately 11.0%, 56.5%, and 32.5% (modal ARI = 0.846). The measurement sensitivity check excluding critical awareness produced estimated shares of 9.4%, 60.5%, and 30.1%, with AvePP = 0.929 and modal ARI = 0.942 relative to the retained solution. Capability/engagement and expected-benefit means remained ordered in the same direction across the three profiles, and the outlook and affect patterns were substantively preserved. The sparse-category check excluded the 36 negative-only and 19 other-category respondents rather than merging conceptually distinct responses. Among the remaining 1945 respondents, a two-category affect model (positive-only vs. mixed) yielded estimated shares of 9.9%, 60.2%, and 29.9%, AvePP = 0.934, and ARI = 0.915 relative to the retained classifications for the same cases. Thus, neither the two-item critical-awareness index nor the sparse affect categories appeared to drive the broad three-profile structure (Supplementary Table S6). In 100 bootstrap resamples, however, the median ARI was 0.922, and the 10th–90th percentile range was 0.311–0.967; a total of 73 resamples exceeded 0.80, whereas 25 fell below 0.50. Lower-agreement resamples most often reorganized the small highly engaged profile. The combined evidence therefore supports heterogeneity and the broad three-profile ordering while indicating that the smallest profile is less stable and should not be treated as a fixed population segment.
Posterior-weighted demographic and occupation descriptions are reported in Supplementary Table S4. Highly engaged enthusiasts were more often men and more often had bachelor’s or graduate education; cautious ambivalents were more often women and more often had a high school or associate-level education. Age differences were comparatively modest. Current occupation also differed descriptively: office/management/sales occupations accounted for 48.9%, 46.2%, and 39.3% of the highly engaged, mainstream, and cautious profiles, respectively, whereas homemakers accounted for 9.3%, 10.8%, and 13.3% and unemployed respondents for 8.6%, 8.7%, and 13.3%. Occupation was not a quota variable or mixture-model covariate, and the dataset contained no income measure; these patterns are therefore limited SES-related descriptions rather than adjusted explanations of profile membership or population estimates.
5. Discussion
5.1. Heterogeneity Without Simple Polarization
Within this specific online quota sample, the three-profile solution offers a more differentiated account of AI orientations than a single favorable–unfavorable continuum. The largest model-estimated share was broadly optimistic, while an estimated 29.5% of the sample mass fell in a cautious, affectively mixed profile. The small highly engaged group combined exceptional capability, benefit expectation, hope, and positive affect. These patterns describe heterogeneity within the observed sample; they should not be read as national prevalence estimates or evidence of population polarization.
The largest profile was mainstream rather than extreme. Its members expected benefits and were mostly hopeful, but approximately one-third had mixed emotional responses. This is important for social science research on computing because average adoption statistics can hide the difference between strong enthusiasm and moderate openness. The finding also cautions against describing the sample as polarized: negative-only affect was rare, while mixed affect was common.
5.2. Capability Is Not the Same as Critical Awareness
Separating capability/engagement from the focused critical-awareness index changes how we describe profile differences. Capability varied substantially across profiles, whereas the two-item awareness index remained above the midpoint in all three. This pattern is suggestive rather than a claim of discriminant validity for a comprehensive critical-awareness construct; the reviewer-requested omission analysis showed that the broad profile ordering was preserved without the index (ARI = 0.942).
The pattern is compatible with multidimensional conceptions of AI literacy, in which practical confidence and critical evaluation are conceptually separable. Still, the present two-item index is too brief to establish the full measurement structure empirically. Digital inclusion initiatives may need both practical capability and critical evaluation. Yet, stronger conclusions require validated multi-item subscales that separately measure factual knowledge, practical skill, error/bias evaluation, ethics, and data awareness.
5.3. Prior Generative AI Use and Anticipated Diffusion
Prior-year generative AI use differed sharply across profiles: approximately 88% of highly engaged enthusiasts, 75% of mainstream optimists, and 56% of cautious ambivalents reported using it during the preceding year. Because this behavior predates the current attitude measurement, we interpret it as antecedent experience or a behavioral correlate, not as a consequence of the profiles. The same cross-sectional ordering appeared for perceived daily presence, anticipated personal-life change, and expected societal diffusion. Together, these variables differentiate the profiles externally, but they do not constitute independent or causal validation.
At the same time, cautious ambivalents did not avoid use. More than half had used a generative AI service. Adoption should therefore not be interpreted as unqualified approval, and caution should not be treated as nonuse. The cross-sectional design cannot determine whether use produces optimism, optimistic orientations promote use, or both reflect education, occupation, exposure, and opportunity. Longitudinal and experimental studies are needed to examine transitions among orientations.
5.4. Desired AI-Enabled Futures
Ranked future priorities showed both difference and convergence. A safe society received the highest mean score overall, followed by work–life balance, health, and trustworthy government. Cautious ambivalents placed greater weight on safety and trustworthy government, and those profile differences remained significant after false discovery rate adjustment. The work–life balance Borda contrast did not meet the adjusted 0.05 threshold (q = 0.053) and is not interpreted as a statistically supported group difference. These priorities complement individual-level perspectives on comparative AI governance frameworks such as the AGILE Index, which evaluates national governance environments, instruments, and effectiveness; the present survey does not directly measure those country-level capacities, but it shows how safety and trustworthy government expectations vary across profiles within this sample [8].
Most other future priorities did not differ after correction. This broad overlap is substantively meaningful. Citizens with different levels of capability, optimism, and AI use still shared many social priorities. A profile-based analysis should therefore not be used to invent wholly separate policy agendas for each group. It is better read as indicating different emphases within a common public value space.
5.5. Implications for Digital Inclusion and Public Communication
The results support differentiated, but not manipulative, approaches to public communication. Highly engaged enthusiasts may require opportunities for critical reflection and responsible use, rather than mere innovation messages. Mainstream optimists may benefit from practical guidance that connects benefits with limits and verification practices. Cautious ambivalents may be more responsive to clear evidence of safety, accountability, and institutional trustworthiness than to generic claims that adoption is inevitable. Because bootstrap instability was concentrated in the smallest highly engaged profile, treat implications specific to that group as hypothesis-generating rather than stable, segment-specific prescriptions.
These implications concern communication design and digital inclusion rather than causal persuasion. The survey did not expose respondents to alternative messages or governance interventions. Consequently, the profiles should not be treated as a targeting tool that predicts how individuals will respond. Their value lies in challenging one-size-fits-all assumptions and identifying dimensions for future experiments: transparent explanations, error disclosure, privacy controls, human review, and demonstrations of public value.
5.6. Limitations and Future Research
Several limitations define the scope of the findings. First, the online quota design did not provide a documented probability sampling frame, response rate, or survey weights. Model-estimated profile shares and all descriptive percentages therefore characterize this observed online sample and should not be interpreted as design-based national prevalence. Second, the measures are self-reported and cross-sectional, so we cannot establish temporal ordering or causal effects; we treat prior-year generative AI use as antecedent experience rather than an outcome. Third, we used region, gender, and age for quotas, but did not incorporate socioeconomic status into the mixture model. Current occupation was available and is described post hoc by profile, whereas income was not present in the 75-variable analytic file. Occupation alone is not a complete SES measure, and unmeasured income, job conditions, digital access, or related socioeconomic factors may partly account for profile composition and external associations.
Fourth, we obtained all profile indicators, prior-use information, concurrent perception measures, and future-priority rankings from the same self-report questionnaire. Shared response tendencies—such as acquiescence, scale-use style, or a general optimistic/pessimistic orientation—could therefore influence both profile assignment and apparent associations with external correlates [34]. Different response formats and excluding external correlates from profile estimation reduce direct item overlap but do not eliminate common-method bias. Because the study has no marker variable, multi-source measure, or repeated measurement specifically designed to estimate method variance, the magnitude of this bias cannot be quantified here; external differentiation should therefore not be treated as independent validation. Fifth, the critical-awareness index contained only two items and demonstrated modest reliability. A reviewer-requested model omitting this indicator nevertheless preserved the three-profile ordering and produced high agreement with the retained modal classification (ARI = 0.942), reducing—but not eliminating—the concern that the solution is driven by weak measurement of critical awareness. Sixth, we derived affective balance from ranked emotion categories rather than an established ambivalence scale or emotion-intensity ratings. Negative-only responses (1.8%) and responses including “other” (1.0%) were sparse, so class-conditional estimates for those categories may be unstable. A sensitivity model excluding these 55 sparse-category cases, rather than merging conceptually distinct responses, retained a closely similar profile structure among the remaining respondents (ARI = 0.915); nevertheless, the rare categories themselves should not be interpreted in detail.
Seventh, the mixture model assumes conditional multinomial responses and a common continuous covariance matrix across classes. Covariance specification tests, the 0.001–0.020 regularization grid, and the class-varying full-covariance refit preserved the broad profile ordering. However, alternative models and measurement choices could still produce different shares or boundaries. Eighth, bootstrap results were encouraging but not uniform. The median ARI was 0.922 and 73 of 100 resamples exceeded 0.80, yet 25 fell below 0.50, usually because the small highly engaged class was reorganized. This instability primarily limits confidence in the exact boundary and interpretation of the smallest profile rather than negating the overall evidence that the sample is heterogeneous. Accordingly, interpret profile-specific implications for the highly engaged group more cautiously than conclusions about broader heterogeneity. Ninth, the survey did not include a dedicated multi-item measure of trust, legitimacy, or acceptance of public sector AI. Preferred futures indicate value priorities, not current institutional legitimacy.
Future research should replicate the measurement structure in probability-based or appropriately weighted samples, incorporate richer socioeconomic measures such as income, occupation, and digital access, and use longitudinal or multi-source designs that can separate prior behavior, current attitudes, response styles, and subsequent outcomes. Better measurement should distinguish factual knowledge, practical skill, critical evaluation, ethics, trust, and affective ambivalence with validated multi-item scales. Experiments and panel studies can then test whether transparency, error disclosure, provenance, human review, or participatory design have heterogeneous causal effects across more stable orientation patterns.
6. Conclusions
AI orientations within this South Korean online quota sample were neither uniform nor well represented by a single optimism–resistance score. A mixed-indicator analysis identified highly engaged enthusiasts, mainstream optimists, and cautious ambivalents as sample-specific latent configurations; their estimated shares should not be generalized as national population proportions. The profiles differed in antecedent prior-year generative AI use and in concurrent expectations about how AI would affect daily life, personal circumstances, and society. They also differed in the weight placed on safety and trustworthy government, while work–life balance did not remain significant after false discovery rate adjustment. Sensitivity analyses excluding critical awareness, altering the covariance specification, and restricting affect to the two common categories preserved the broad profile ordering, strengthening the evidence for heterogeneity within the sample. At the same time, bootstrap instability was concentrated in the smallest highly engaged profile, and common-method, SES, and cross-sectional limitations constrain interpretation of all external associations. The central implication is methodological: capability/engagement, a focused critical-awareness measure, expected benefits, global outlook, and affect should not automatically be collapsed into a single attitude, but person-centered results require transparent treatment of measurement quality, classification uncertainty, model alternatives, sampling limits, and potential method variance.
Supplementary Materials
The following supporting information can be downloaded at: https://www.mdpi.com/article/10.3390/systems14091122/s1, Table S1: Survey Measures and Measurement Diagnostics; Table S2: Covariance-Structure Sensitivity for the Three-Class Model; Table S3: Complete Ranked-Future Results; Figure S1: Rank-Weighted Desired AI-Enabled Futures; Table S4: Posterior-Weighted Demographic Composition by Profile; Table S5: Bootstrap Stability Summary; Table S6: Reviewer-Requested Measurement and Coding Sensitivity Checks.
Author Contributions
Conceptualization, S.M. and J.J.; methodology, S.M. and J.J.; formal analysis, S.M.; validation, J.J.; investigation, S.M. and J.J.; writing—original draft preparation, S.M.; writing—review and editing, S.M. and J.J.; supervision, S.M. All authors have read and agreed to the published version of the manuscript.
Funding
The National Information Society Agency (NIA) commissioned the source survey. The present secondary analysis received no specific external funding.
Institutional Review Board Statement
Ethical review was not required because the present study involved only secondary analysis of a pre-existing, fully de-identified dataset. The authors did not collect new data, interact with participants, or use information that could identify individuals. Accordingly, this secondary analysis did not constitute a human subjects research project under Article 2(1) of the Republic of Korea’s Bioethics and Safety Act.
Informed Consent Statement
Additional informed consent for this secondary analysis was not required because the study used only pre-existing, fully de-identified data and did not constitute human subjects research under Article 2(1) of the Republic of Korea’s Bioethics and Safety Act. The original survey information screen described the policy research purpose and statutory confidentiality protections for respondents.
Data Availability Statement
The authors obtained access to a de-identified analytic dataset for this secondary analysis but are not authorized to publicly redistribute the raw survey data without permission from the source institution. The data are therefore subject to source and access restrictions. Summary tables, coding information, and additional non-disclosive analysis details may be made available by the corresponding author upon reasonable request, subject to institutional and contractual conditions.
Acknowledgments
The authors gratefully acknowledge the National Information Society Agency (NIA) as the source institution associated with the 2025 South Korean survey data used for this secondary analysis. The authors used OpenAI’s ChatGPT (GPT-5.6 Sol) during manuscript revision for language editing, manuscript organization, and assistance with drafting and refining analysis scripts. The statistical results reported in the manuscript were generated from the de-identified source data and checked against the questionnaire and source file; the authors independently reviewed cited sources and substantive interpretations. The authors take full responsibility for the submitted work.
Conflicts of Interest
The authors declare no conflicts of interest.
References
- Sajadieh, S.; Fattorini, L.; Perrault, R.; Gil, Y.; Parli, V.; Santarlasci, L.; Pava, J.; Maslej, N.; Altman, R.; Brynjolfsson, E.; et al. Artificial Intelligence Index Report 2026. arXiv 2026, arXiv:2606.15708. [Google Scholar] [CrossRef]
- Qi, W.; Pan, J.; Lyu, H.; Luo, J. Excitements and concerns in the post-ChatGPT era: Deciphering public perception of AI through social media analysis. Telemat. Inform. 2024, 92, 102158. [Google Scholar] [CrossRef] [Scilit]
- Hu, P.; Lu, Y.; Gong, Y. Dual humanness and trust in conversational AI: A person-centered approach. Comput. Hum. Behav. 2021, 119, 106727. [Google Scholar] [CrossRef] [Scilit]
- Kim, D.; Nam, J.K.; Oh, J.; Kang, M.C. A latent profile analysis of the interplay between PC and smartphone in problematic internet use. Comput. Hum. Behav. 2016, 56, 360–368. [Google Scholar] [CrossRef] [Scilit]
- Schepman, A.; Rodway, P. Initial validation of the General Attitudes towards Artificial Intelligence Scale. Comput. Hum. Behav. Rep. 2020, 1, 100014. [Google Scholar] [CrossRef] [Scilit] [PubMed]
- Schepman, A.; Rodway, P. The General Attitudes towards Artificial Intelligence Scale (GAAIS): Confirmatory validation and associations with personality, corporate distrust, and general trust. Int. J. Hum.–Comput. Interact. 2023, 39, 2724–2741. [Google Scholar] [CrossRef] [Scilit]
- OECD. Digital Government Review of Korea: Harnessing Digital and Data to Transform Government; OECD Publishing: Paris, France, 2025. [Google Scholar] [CrossRef] [Scilit]
- Zeng, Y.; Lu, E.; Guo, X.; Huangfu, C.; Xie, J.; Chen, Y.; Wang, Z.; Liang, D.; Cao, G.; Wang, J.; et al. AI Governance InternationaL Evaluation Index (AGILE Index) 2025. arXiv 2025, arXiv:2507.11546. [Google Scholar] [CrossRef] [Scilit]
- Dietvorst, B.J.; Simmons, J.P.; Massey, C. Algorithm aversion: People erroneously avoid algorithms after seeing them err. J. Exp. Psychol. Gen. 2015, 144, 114–126. [Google Scholar] [CrossRef] [Scilit] [PubMed]
- Logg, J.M.; Minson, J.A.; Moore, D.A. Algorithm appreciation: People prefer algorithmic to human judgment. Organ. Behav. Hum. Decis. Process. 2019, 151, 90–103. [Google Scholar] [CrossRef] [Scilit]
- Araujo, T.; Helberger, N.; Kruikemeier, S.; de Vreese, C.H. In AI we trust? Perceptions about automated decision-making by artificial intelligence. AI Soc. 2020, 35, 611–623. [Google Scholar] [CrossRef] [Scilit]
- Qin, X.; Zhou, X.; Chen, C.; Wu, D.; Zhou, H.; Dong, X.; Cao, L.; Lu, J.G. AI aversion or appreciation? A capability–personalization framework and a meta-analytic review. Psychol. Bull. 2025, 151, 580–599. [Google Scholar] [CrossRef] [Scilit] [PubMed]
- Baek, T.H.; Kim, M. Is ChatGPT scary good? How user motivations affect creepiness and trust in generative artificial intelligence. Telemat. Inform. 2023, 83, 102030. [Google Scholar] [CrossRef] [Scilit]
- Gillath, O.; Ai, T.; Branicky, M.S.; Keshmiri, S.; Davison, R.B.; Spaulding, R. Attachment and trust in artificial intelligence. Comput. Hum. Behav. 2021, 115, 106607. [Google Scholar] [CrossRef] [Scilit]
- Long, D.; Magerko, B. What is AI literacy? Competencies and design considerations. In Proceedings of the 2020 CHI Conference on Human Factors in Computing Systems, Honolulu, HI, USA, 25–30 April 2020; pp. 1–16. [Google Scholar] [CrossRef] [Scilit]
- Ng, D.T.K.; Leung, J.K.L.; Chu, S.K.W.; Qiao, M.S. Conceptualizing AI literacy: An exploratory review. Comput. Educ. Artif. Intell. 2021, 2, 100041. [Google Scholar] [CrossRef] [Scilit]
- Pinski, M.; Benlian, A. AI literacy for users—A comprehensive review and future research directions of learning methods, components, and effects. Comput. Hum. Behav. Artif. Hum. 2024, 2, 100062. [Google Scholar] [CrossRef] [Scilit]
- Klingbeil, A.; Grützner, C.; Schreck, P. Trust and reliance on AI: An experimental study on the extent and costs of overreliance on AI. Comput. Hum. Behav. 2024, 160, 108352. [Google Scholar] [CrossRef] [Scilit]
- Larsen, J.T.; McGraw, A.P.; Cacioppo, J.T. Can people feel happy and sad at the same time? J. Personal. Soc. Psychol. 2001, 81, 684–696. [Google Scholar] [CrossRef]
- Mick, D.G.; Fournier, S. Paradoxes of technology: Consumer cognizance, emotions, and coping strategies. J. Consum. Res. 1998, 25, 123–143. [Google Scholar] [CrossRef] [Scilit]
- Cadario, R.; Longoni, C.; Morewedge, C.K. Understanding, explaining, and utilizing medical artificial intelligence. Nat. Hum. Behav. 2021, 5, 1636–1642. [Google Scholar] [CrossRef] [Scilit] [PubMed]
- Longoni, C.; Bonezzi, A.; Morewedge, C.K. Resistance to medical artificial intelligence. J. Consum. Res. 2019, 46, 629–650. [Google Scholar] [CrossRef] [Scilit]
- Collins, L.M.; Lanza, S.T. Latent Class and Latent Transition Analysis: With Applications in the Social, Behavioral, and Health Sciences; Wiley: Hoboken, NJ, USA, 2010. [Google Scholar]
- Fraley, C.; Raftery, A.E. Model-based clustering, discriminant analysis, and density estimation. J. Am. Stat. Assoc. 2002, 97, 611–631. [Google Scholar] [CrossRef] [Scilit]
- McLachlan, G.J.; Peel, D. Finite Mixture Models; Wiley: New York, NY, USA, 2000. [Google Scholar]
- National Information Society Agency (NIA). 2025 Public AI Perception Report: Analysis of Perception Characteristics by AI Understanding and Usage Experience; The AI Report 2025-19; NIA: Daegu, Republic of Korea, 2025. (In Korean) [Google Scholar]
- Biernacki, C.; Celeux, G.; Govaert, G. Assessing a mixture model for clustering with the integrated completed likelihood. IEEE Trans. Pattern Anal. Mach. Intell. 2000, 22, 719–725. [Google Scholar] [CrossRef] [Scilit]
- Nylund, K.L.; Asparouhov, T.; Muthén, B.O. Deciding on the number of classes in latent class analysis and growth mixture modeling: A Monte Carlo simulation study. Struct. Equ. Model. A Multidiscip. J. 2007, 14, 535–569. [Google Scholar] [CrossRef] [Scilit]
- Asparouhov, T.; Muthén, B. Auxiliary variables in mixture modeling: Three-step approaches using Mplus. Struct. Equ. Model. A Multidiscip. J. 2014, 21, 329–341. [Google Scholar] [CrossRef] [Scilit]
- Bray, B.C.; Lanza, S.T.; Tan, X. Eliminating bias in classify-analyze approaches for latent class analysis. Struct. Equ. Model. A Multidiscip. J. 2015, 22, 1–11. [Google Scholar] [CrossRef] [Scilit] [PubMed]
- Rubin, D.B. Multiple Imputation for Nonresponse in Surveys; Wiley: New York, NY, USA, 1987. [Google Scholar]
- Benjamini, Y.; Hochberg, Y. Controlling the false discovery rate: A practical and powerful approach to multiple testing. J. R. Stat. Soc. Ser. B (Methodol.) 1995, 57, 289–300. [Google Scholar] [CrossRef] [Scilit]
- Sharma, A.; Minh Duc, N.T.; Luu Lam Thang, T.; Nam, N.H.; Ng, S.J.; Abbas, K.S.; Huy, N.T.; Marušić, A.; Paul, C.L.; Kwok, J.; et al. A consensus-based checklist for reporting of survey studies (CROSS). J. Gen. Intern. Med. 2021, 36, 3179–3187. [Google Scholar] [CrossRef] [Scilit] [PubMed]
- Podsakoff, P.M.; MacKenzie, S.B.; Lee, J.-Y.; Podsakoff, N.P. Common method biases in behavioral research: A critical review of the literature and recommended remedies. J. Appl. Psychol. 2003, 88, 879–903. [Google Scholar] [CrossRef] [Scilit] [PubMed]

Disclaimer/Publisher’s Note: The statements, opinions and data contained in all publications are solely those of the individual author(s) and contributor(s) and not of MDPI and/or the editor(s). MDPI and/or the editor(s) disclaim responsibility for any injury to people or property resulting from any ideas, methods, instructions or products referred to in the content. |
© 2026 by the authors. Licensee MDPI, Basel, Switzerland. This article is an open access article distributed under the terms and conditions of the Creative Commons Attribution (CC BY) license.