


Abstract
Identifying core features is a crucial step in design patent infringement assessments (DPIAs), as the identification results serve as a vital basis for subsequent qualitative and quantitative assessments. Traditional DPIAs typically rely on the experience and knowledge of experts and the judge’s discretion, resulting in significant uncertainty and subjectivity. This can easily lead to inconsistent judgments in similar cases, hindering technological innovation and potentially triggering social conflicts. To address this, this paper proposes an intelligent identification framework for core features of patents that integrates multi-angle attention recognition and novelty calculation. First, design patents are downloaded, and views are extracted to construct a database. Simultaneously, the Canny operator is used to extract the product’s contour features. Second, a CBAM-ResNet50 model is constructed, trained and optimized using transfer learning to achieve quantitative identification of salient features. Subsequently, the VGG16 model combined with cosine similarity is used to calculate product feature similarity, and the results from both methods are combined to comprehensively determine the core features. Experiments are conducted using a showerhead as an example, with 400 patents randomly selected as the development set. The results show that the proposed CBAM-ResNet50 model significantly outperforms other comparative models in terms of Intersection over Union (IOU) and Dice Similarity Coefficient (DSC), and the VGG16 model combined with the cosine similarity algorithm achieves the highest discriminative power for product front view contour. Combining the two methods yields a validation set of core features, which are then evaluated by an expert panel. The expert endorsement rate (EEP) on the final test set is 86.5% (173/200; the Wilson confidence interval is 81.1% to 90.6%). This research not only provides a quantifiable and interpretable decision-support tool for DPIA but also offers feasible technical support for intelligent intellectual property examination and even product innovation design.
1. Introduction
As market competition intensifies, enterprises increasingly prioritize appearance design to boost product appeal and capture consumer attention, often creating “hit products” [1,2]. However, this strategy also elevates the risk of imitation and intellectual property infringement. In judicial practice, design patent infringement disputes are the most prevalent type of adjudication. In China, for instance, such cases account for over 60% of total intellectual property disputes, with a significant portion hinging on the determination of similarity—specifically, whether “substantial differences” exist between designs1.
Despite its importance, the standard for “substantial difference” has long been criticized for its subjectivity, as it relies heavily on judicial discretion. The lack of objective analytical tools often leads to inconsistent outcomes; statistics show that over 33.2% of design patent cases require re-judgment. Thus, there is an urgent need to transition from qualitative discretion to a quantitative, data-driven auxiliary system. Given the strong relationship between patent and R&D [3], quantitative patent analysis can be an effective means to minimize human bias. Building on this pursuit of objectivity, this study aims to transform the abstract legal concept of “substantial differences” into a specific, measurable task of core feature recognition.
According to the interpretations of the Supreme People’s Court of China, a “core feature” of a design patent is defined by two dimensions: (1) parts easily viewed during normal use that impact the overall visual effect (high attention value) and (2) features distinct from existing designs (novelty)2. Although legal discourse emphasizes the necessity of distinguishing these esthetic features [4,5], existing research rarely addresses how to identify and calculate them quantitatively. As artificial intelligence increasingly assists the legal profession [6], this paper proposes a core feature calculation framework that integrates deep learning and attention mechanisms with novelty evaluation to provide an objective auxiliary tool for DPIA.
The main contributions of this study can be summarized as follows:
- (1)
- Problem-oriented contribution: This work addresses the strong subjectivity inherent in existing DPIA by providing an objective and effective identification tool for both judicial decision-making and enterprise R&D activities. The proposed approach helps reduce the risk of judicial misjudgment while simultaneously supporting appearance design avoidance strategies in product development.
- (2)
- Methodological contribution: Focusing on the identification of core features in design patents, this study conducts a systematic analysis and formal definition of core features based on relevant legal provisions. An attention mechanism and a novelty evaluation strategy are jointly introduced to construct a quantitative core feature computation framework, enabling integrated assessment of saliency and novelty.
- (3)
- Application-oriented contribution: The research targets large-scale design patent data. Unlike conventional image datasets, design patent images emphasize contour information and multi-view representations, requiring feature identification from multiple perspectives. The proposed method is specifically designed to address these characteristics and is well suited for design patent analysis tasks.
The remainder of this paper is organized as follows. In Section 2, the related work is reviewed. In Section 3, the research framework is proposed. In Section 4, the research methods are introduced in detail. In Section 5, the methods are verified by showerhead design patent (SDP) data. In Section 6, the content is discussed by real judicial cases, then the application and limitation are introduced. Finally, Section 7 concludes the paper.
2. Related Works
2.1. Research on Core Feature of Design Patent
Unlike utility patents, design patents are conceived to show the esthetics rather than technical features of designs with combinations, and they always include more than six images from different perspectives. So, the research on core features of design patents has been a challenging task for a long time. Currently, the extant literature on design patents is limited, primarily focusing on legal discussions regarding core features. For example, some studies emphasized the difference between design patents and inventions, which is reflected not only in ornamentally pleasing features but also in distinctive features [7]. In addition, the identification of appearance functionality and esthetic characteristics of intelligent design works has been discussed from a judicial perspective [8]. Furthermore, analyses indicate that the novelty of existing design patents is essential to securing appearance licensing [9]. Moreover, it is widely held that design patents may be considered invalid if they lack novelty [4,5]. Recently, the Japanese Intellectual Property Office has allowed applicants to apply for design protection for works with unique shapes, patterns, or colors—or any combination thereof—that generate distinct visual artistic effects [10]. Obviously, those works mainly focused on the literal discussion of novelty, and rarely on the attention of design, and also do not refer to the quantitative identification.
2.2. Research on the Mechanism of Image Attention
The attention mechanism is a mechanism that imitates the human eye, selectively focusing on part of the given information and ignoring other information. The concept was first proposed for machine-translation tasks, allowing the model to dynamically focus on different parts of the input sentence and assign different weights, rather than relying solely on the last hidden state [11]. Then, an image attention model is proposed to learn and describe image content automatically [12]. Subsequently, the transformer model was proposed by Google, which is entirely based on the attention mechanism rather than RNN or CNN neural network architectures [13]. In addition, a Residual Attention Network was conceived by integrating attention mechanisms into convolutional neural networks [14].
Obviously, with the development of deep learning technology, it has become a common practice to integrate convolutional neural networks with attention mechanisms. This fusion strategy not only improves the sensitivity of the model to the key features of input data but also enhances the learning ability of small sample data and has been widely used in many industries. For instance, CNN was integrated with an attention mechanism, incorporating lateral inhibition and contrast suppression strategies to improve the detection efficiency of X-ray images in security screening [15]. Moreover, these two algorithms were combined to accurately distinguish between blurred and irregular land–sea boundaries [16]. In the same year, a Transformer model based on multi-head attention—which computes feature maps in parallel—alongside a convolutional neural network was employed for plant leaf disease recognition [17]. A semantic segmentation network built upon an existing CNN architecture—enhanced with a dual-attention module—was proposed to achieve high-precision parsing of urban street scene semantics [18]. The lightweight CNN architecture ShuffleNetV2 was integrated into the YOLOv5 framework and incorporated a CBAM, significantly improving the detection capability for casting surface defects [19]. Channel attention and spatial attention mechanisms were combined with CNN algorithms to accomplish land cover feature recognition in satellite remote sensing images [20]. A hybrid CNN-integrated framework including a cross-attention vision Transformer was constructed to accurately identify and highlight subtle differences in signatures [21]. Precise medical image segmentation is achieved by combining a pyramid pooling module with an attention mechanism [22]. In addition, a spatiotemporal convolutional neural network is fused with a Transformer-based multi-head attention mechanism to enhance the accuracy of fall risk prediction in elderly individuals [23].
In summary, current attention mechanism modules integrated with CNN are primarily applied in fields such as industry, agriculture, and healthcare, with relatively little involvement in patent image analysis. Unlike images from those fields, patent appearance images typically consist of geometric shapes and lines and require comparison across multiple perspectives of the same design to identify and evaluate feature differences. Although a cross-attention mechanism combined with CNN-LSTM algorithms was utilized for patent classification [24], the patent is treated as a whole, so the algorithms fail to adequately account for the distinctiveness of different design features within patent images.
2.3. Research on Patent Image Similarity
Image similarity is the key to patent multimodal research, which has received great attention from academics. For example, a traditional geometric feature extraction method was applied to patent retrieval [25]. A patent flowchart recognition approach was proposed to enable structured visualization of flowchart images and support semantic queries [26]. Local features were extracted from patent drawings through superconducting wire curve recognition [27]. Patent textual descriptions, such as reference numbers, were used to identify features in patent drawings, and this method was applied within the USPTO system [28]. An improved cosine similarity measure combined with patent ownership probability is employed to perform patent classification [29]. Contextual local primitives were utilized for binary patent image retrieval [30]. A transfer learning approach utilizing a pre-trained VGG19 model was introduced for digital intellectual property protection [31]. Design feature vectors of patent images using convolutional neural networks was derived for visual material-type prediction and international patent classification section-label predictions [32]. Features were extracted from patent drawings using deep convolutional neural networks, incorporating a region proposal network (RPN) to improve recognition accuracy and reduce feature omission [33]. The YOLOv4 model was employed to crop images and subsequently applied a triplet convolutional neural network for trademark similarity analysis [34]. A multi-fusion deep learning framework capable of learning bimodal features from both text and images was proposed for patent retrieval [35]. Similarly, a patent knowledge graph (PKG)—driven patent similarity computation model that integrates graph similarity (GS) and image similarity (IS) was introduced [36]. A novel multimodal patent similarity evaluation framework that integrates artificial intelligence techniques with conceptual analysis of patent drawings was presented for patent classification [37]. A multimodal feature fusion approach was proposed to extract patent text and image features and was integrated with an attention mechanism for design patent classification [38]. A hierarchical positive contrastive loss combined with the LIC classification method was introduced for patent image retrieval [39]. A structural similarity index (SSIM) was utilized to measure the similarity of U.S. design patent images [40]. Similarly, a density-based patent image feature extraction algorithm was proposed [41].
Although existing studies have made notable progress in patent image feature extraction and similarity analysis, several limitations remain. First, many approaches rely on geometric descriptors or binary image representations, which perform well for specific image types such as flowcharts or structural diagrams but exhibit limited capability in representing complex product appearances, making it difficult to accurately capture fine-grained design differences. Second, despite the substantial performance gains achieved by deep-learning-based methods in recent years, most studies focus on single-view or whole-image feature representations, insufficiently accounting for multi-view shape variations of products and underestimating the critical role of local design elements in similarity assessment. Moreover, although some works enhance retrieval efficiency by integrating textual and visual information within multimodal frameworks [42], their primary emphasis lies in improving overall patent retrieval or classification performance, rather than directly addressing the specific requirements of core feature identification in DPIA.
Based on the above literature review, two key research gaps can be identified. First, there is a lack of systematic and quantitative analytical frameworks specifically designed for design patent infringement decision-making. Second, existing image recognition algorithms—regardless of whether they are based on attention mechanisms or similarity computation—remain difficult to directly adapt to the requirements of design patent analysis, where legally relevant visual features and fine-grained design distinctions must be explicitly captured and interpreted.
Against this background, this study addresses the intelligent decision-making requirements of design patent infringement analysis by proposing a core feature identification approach that simultaneously accounts for visual attention and design novelty, grounded in a systematic definition of core features. Patent contour views are adopted as the primary research object, where contour extraction is used to suppress the influence of color, material, and scale variations, thereby enabling visual representations to focus more explicitly on the underlying shape and structural characteristics that are central to DPIA. To overcome the information insufficiency inherent in single-view analysis for complex product designs, similarity is computed independently across multiple contour views and subsequently fused to achieve a more comprehensive similarity evaluation. At the feature level, deep learning models are employed to extract high-level contour features, which are combined with cosine-similarity-based local feature comparison to enhance sensitivity to fine-grained design differences. This framework provides a more stable and interpretable quantitative basis for subsequent core feature aggregation and infringement decision support.
3. Research Framework
In this paper, the identification framework of DPIA is proposed, which integrates an attention mechanism and patent similarity calculation. As shown in Figure 1, the approach comprises four main stages: Design patent data collection and processing, image model training and attention value calculation, product image feature similarity calculation and product core feature identification.
Figure 1.
Research framework.
The specific implementation contents are introduced as follows:
Step 1: Design patent data collection and processing. To address the innovation requirements of a specific product category, the retrieval scope of relevant design patents is first defined. Design patent data are then collected from patent retrieval platforms. Based on this, multi-view design patent drawings are programmatically extracted using the PyMuPDF library to construct a structured image dataset. Subsequently, the Canny edge detection algorithm is applied to the patent drawings to extract contour information, which serves as a foundational representation for subsequent attention-based feature visualization and similarity computation.
Step 2: Image model training and attention value calculation. A ResNet50 architecture integrated with a CBAM is constructed and fine-tuned using a transfer learning strategy. The dataset extracted in Step 1 is divided into training and validation sets, which are used for parameter optimization and performance monitoring, respectively. During model training, cross-entropy loss is adopted as the objective function, and the Adam optimizer is employed to accelerate convergence. Dynamic learning rate scheduling and weight decay are further introduced to mitigate overfitting. After the model achieves the desired performance, multi-view images of the target product are fed into the trained network to obtain the corresponding design feature weight distributions, from which the salience values of individual design features are calculated.
Step 3: Product image feature similarity calculation. For product feature similarity computation, a vector-space-based approach integrating deep feature extraction and distance measurement is developed. The design features of multi-view contour images of the target product are fed into a pre-trained VGG16 model, and the output of the penultimate fully connected (FC) layer is extracted as the feature vector representation. Subsequently, the cosine similarity metric is introduced. By traversing the database of product design patent (PDP) contour images, the cosine of the angle between the feature vector of the target product and those of the database samples is computed. This value serves as the similarity measure for the corresponding feature, enabling the identification of the most similar sample within the database.
Step 4: Product core feature calculation and identification. The core value is defined as the maximum value of the ratio between the attention value and the maximum similarity value of a given product feature across different views. Based on the feature attention values obtained in Step 2 and the feature similarity values derived in Step 3, the core value of each feature is calculated under multiple views of the target product. Ultimately, the core values of all features are ranked in descending order to present a clear hierarchy of feature importance. This ranking effectively accommodates diverse design scenarios, enabling the final selection of either the solitary highest-value feature or the top-ranking cluster.
Based on the workflow described above, the proposed framework can be characterized as a human–AI collaborative decision-support system. The system accepts various forms of input, including a target design patent in PDF format, multi-view images of a product for which a design patent application is being prepared, and multi-view images of a product under assessment. It also relies on a reference database of existing design patents within the same product category for novelty comparison. The system first extracts the multi-view images and processes their contours, after which two complementary analyses are performed: the attention model evaluates the visual saliency of individual design features, while the similarity module assesses their novelty relative to existing designs. The results of these two analyses are subsequently integrated through core value to generate a ranking index for each predefined product feature, thereby producing a ranked list of candidate core features for user review. The primary intended users include patent examiners, judges, and design professionals. The system is positioned as an auxiliary decision-support tool whose outputs are intended to support, rather than replace, human judgment. Qualified professionals are expected to review and interpret the results in light of the applicable legal requirements and the specific context of each case, and they may adjust or override the system-generated rankings when necessary.
4. Methodology
4.1. PDP’s Image Extraction Based on PyMuPDF Library
Design patents downloaded from the patent office website, such as CNIPA, USPTO, and EPO, etc., are usually stored in PDF format, which not only contains a small amount of text descriptions but also embeds many visual elements such as design drawings and schematic diagrams. In order to analyze the design patent, it is necessary to extract the image content from the PDF document. Compared with other extractors, the PyMuPDF (1.24.10) library has obvious advantages of high speed, high coordinate accuracy and strong editing ability [43], so it is introduced to mine the image. The algorithm presented in Table 1 is based on the PyMuPDF library and is used to extract images from PDPs for the construction of the training dataset.
Table 1.
The pseudo code of multi-view image extraction from design patent PDFs.
The process in Table 1 includes four steps:
Step 1. Opening PDF document: fitz.open() tool in PyMuPDF is used to load the PDF file; then, the document object is obtained, and the number of pages in the document is checked to ensure that the target page exists.
Step 2. Extracting images from pages: The approach traverses all pages, uses theload_page() tool to load the content of the page, and then calls get_images(full = True) to obtain all embedded image information in the page, including the image’s xref identifier, size, color space, etc.
Step 3. Extracting data from image: For each image, the extract_image() tool is utilized to extract the data, including the byte stream and other related information stored in the PDF image through the xref label.
Step 4. Image decoding and saving: The extracted byte data are converted into an array via NumPy, and then OpenCV’s cv2.imdecode() function is used to decode the array into an image matrix, which is saved in PNG format for subsequent operations such as contour extraction and model training.
The algorithm presented in Table 2 is a text-coordinate-based view orientation classification method, which is used to construct the dataset for similarity computation.
Table 2.
The pseudo code of view direction classification based on text coordinates.
The extraction process can be divided into the following four steps:
Step 1. Parse page element coordinates: For each extracted original image, the PyMuPDF get_image_bbox() method is used to obtain the precise bounding box Bi of the image on its original PDF page (i.e., the coordinates of the upper-left and lower-right corners). Simultaneously, the get_text(“dict”) method is used to extract all text blocks on the same page. Each text block contains the text content Tk and its corresponding bounding box Bk.
Step 2. Identify the nearest text block: All text blocks on the current page are traversed, and the vertical distance between each text block bounding box Bk and the image bounding box Bi is calculated. The text block with the minimum vertical distance is selected as the view label associated with the image. This strategy effectively avoids matching errors caused by side-by-side text-image layouts or multi-line annotations.
Step 3. Keyword-based view classification: The text content S is extracted from the nearest text block and matched against a predefined list of view-direction keywords. The keyword list covers six standard view orientations: front view, left view, back view, right view, top view, and bottom view. If a match is found, the image is assigned to the corresponding category; otherwise, it is classified as “Other”.
Step 4. Archive and output: According to the classification result, the image file is moved or copied into a subfolder named after the corresponding view orientation (e.g., Front/, Left/, Top/, etc.). The final output is an image dataset organized by view direction, which can subsequently be used for similarity computation.
4.2. Contour Extraction Algorithm
To enable subsequent feature region visualization and similarity computation, contour extraction is first applied to the design patent images. Commonly used contour extraction algorithms include the Sobel operator, Laplacian operator, Roberts operator, and Canny edge detector [44].
With respect to the Sobel operator, although it is computationally efficient, its reliance on first-order derivatives often leads to fragmented edge extraction results, limiting contour continuity [45]. The Laplacian operator, as a second-order derivative method, enhances fine details but is excessively sensitive to image noise, making it unsuitable for applications requiring high contour integrity [44]. The Roberts operator, constrained by a small local neighborhood, exhibits weak noise robustness and limited capability in capturing continuous contours of complex structures [46]. In contrast, the Canny edge detector effectively suppresses noise through Gaussian filtering, accurately preserves fine details via non-maximum suppression, and maintains contour completeness using dual-threshold detection. As a result, it is widely recognized as one of the most effective edge detection methods [47].
This paper adopts the Canny operator for product appearance contour extraction. The process is divided into the following four steps:
Step 1. Grayscale conversion
The input image is converted into a grayscale representation to produce a black-and-white appearance, thereby simplifying subsequent processing steps. The grayscale transformation is defined as follows:
where R, G, and B denote the pixel values of the red, green, and blue color channels, respectively, and Y represents the resulting grayscale intensity. The weighting coefficients are adopted from the ITU-R BT.601 standard [48], which accounts for the differences in human visual sensitivity to various color components. Regarding the selection of the three coefficients, it is worth noting that the design patent drawings processed in this study involve two cases. When the drawing is originally a black-and-white line drawing or a grayscale image, the three-color channels satisfy . In this case, any linear combination whose coefficients sum to 1 (e.g., the equal-weight average Y = (R + G = B)/3) produces the exact same result as the ITU-R BT.601 standard. Therefore, the choice of weights does not affect the subsequent Canny edge detection. We adopt the ITU-R BT.601 standard for two main reasons: (1) to ensure compatibility with standard image processing workflows, where subsequent methods mostly rely on BT.601 for grayscale conversion, and (2) to follow common practices in computer vision for the sake of consistency.
Step 2. Noise reduction
Gaussian filtering is applied to smooth the image and reduce the influence of noise. The filtering operation is calculated as follows:
where x and y denote the spatial coordinates, σ represents the standard deviation of the Gaussian distribution, and exp(·) denotes the exponential function.
Step 3. Edge detection
The rate and direction of intensity variation in the image are first measured using gradient operators. The horizontal gradient is defined as , and the vertical gradient is defined as . Based on these gradients, the gradient magnitude is calculated as follows:
Meanwhile, the gradient direction is calculated as follows:
Furthermore, non-maximum suppression is introduced to remove pixels that do not belong to edge regions, thereby retaining only thin and precise edge contours. Since computing the gradient direction of all pixels alone is insufficient to fully determine edge information, non-maximum values along the local gradient direction must be suppressed, and only pixels with locally maximal gradient responses are preserved.
Step 4. Double threshold detection and edge connection
To achieve precise edge selection, two thresholds are defined: a high threshold and a low threshold. Pixels are classified based on these thresholds into strong edges, weak edges, and non-edges: strong edges correspond to pixels with values above the high threshold, weak edges correspond to pixels between the low and high thresholds, and non-edges correspond to pixels below the low threshold. Strong edges are then connected to adjacent weak edges, and both are retained to generate the final edge detection result.
Lastly, based on the above description, the detailed procedural steps of the algorithm can be summarized in Table 3.
Table 3.
The pseudo code of the Canny operator contour detection.
The design patent image analysis in this study centers on shape contours, intentionally disregarding non-shape attributes such as color and material. The justifications for this assumption are as follows:
- (1)
- Legal Basis: According to Article 2, Paragraph 4, of the Chinese Patent Law and the guidelines of the Patent Examination Guidelines for Design Patents, a design patent may protect shape, pattern, color, or a combination thereof. However, in the practice of patent grant and infringement assessment, color is typically treated as a supplementary element. It is included in the scope of protection only when its combination with shape and pattern exerts a substantial impact on the overall visual effect of the product. For mechanical products, most design patents protect the shape exclusively, with color being explicitly excluded or treated as a non-limiting feature. Therefore, neglecting color does not affect the identification of the core feature of such patents.
- (2)
- Judicial Practice: In Article 11 of the Interpretation of the Supreme People’s Court on Several Issues Concerning the Application of Law in the Trial of Patent Infringement Dispute Cases, the Court notes, “For the color element in a design patent, consideration should first be given to whether the shape and pattern produce a substantial difference in the overall visual effect; color is considered only when the shape and pattern cannot differentiate the designs.” This indicates that color occupies a secondary or auxiliary position in infringement determination.
- (3)
- Technical Robustness: Color information is highly susceptible to lighting conditions, imaging equipment, surface reflections, and image compression. Introducing color would inject noise, leading to unstable feature extraction. In contrast, contour shapes exhibit scale and rotational invariance, making them more suitable for the automated analysis of large-scale patent images.
Although omitting color is reasonable for the vast majority of design patents that solely protect shape, this assumption does not hold under the following scenarios, where the proposed method should be applied with caution.
- (1)
- Design patents explicitly protecting color: Cases where the patent specification includes a statement such as “color is claimed,” and the color combination has a significant impact on the overall visual effect3.
- (2)
- Product categories with tightly coupled patterns and colors: Products such as textiles, packaging boxes, electronic UI interfaces, and automotive liveries, where color itself constitutes a core creative component of the design.
- (3)
- Jurisdictional differences: For instance, while U.S. design patents primarily use solid lines to represent shapes, broken lines are sometimes used to indicate environmental or contrasting colors4. Similarly, the European Union’s Registered Community Design allows for specific claims regarding color5. In these jurisdictions, the direct applicability of our method needs to be re-evaluated.
This study selects mechanical products as the case study. Their design patents are dominated by structural and shape variations and rarely involve color protection; thus, the aforementioned assumption remains valid in this case.
4.3. Convolutional Neural Network Model with Attention Mechanism
This study proposes a method that performs a binary classification task, where the target product to be evaluated is classified as positive and non-target products as negative. This design stems from legal practice: design patent infringement determination adopts the perspective of the informed consumer, meaning that an ordinary observer first judges whether products belong to the same category before focusing on specific design features. Therefore, training the model to distinguish between target products and non-target products enables it to possess category recognition capabilities similar to those of an ordinary observer.
It should be noted that the raw attention maps generated by this task reflect the discriminative regions that the model focuses on to distinguish between target products and non-target products. These raw attention maps are not directly equivalent to core features in a legal sense. However, the results point to the most salient feature regions in the product during visual recognition; these regions are precisely those most easily noticed by ordinary consumers under normal use. This paper defines these regions as candidate salient regions.
Based on this, this paper combines the raw attention weights with legally significant design features through predefined component feature masks to obtain attention values for design features, thereby quantifying the visual salience of each component from the perspective of an ordinary consumer. Combined with subsequent novelty assessment, the core features that satisfy significance and novelty are finally determined.
4.3.1. Backbone Network: RESNET Model
Traditional CNNs extract features by stacking multiple convolutional and down-sampling layers. However, as network depth increases, gradients can vanish or explode during backpropagation, leading to performance degradation. To address this issue, the ResNet model introduces batch normalization (BN) layers and employs a residual learning strategy [49]. By directly connecting a portion of the input to subsequent layers, the network learns the residual mapping between input and output rather than the full mapping function. This modification reduces the learning difficulty and effectively mitigates the degradation problem commonly observed in deep networks.
Considering that ResNet50 employs bottleneck residual blocks to significantly reduce parameter size and computational cost while preserving strong representational capability, it is adopted as the backbone network in this study. The overall architecture of the model is illustrated in Figure 2.
Figure 2.
ResNet50 model architecture.
In the initial perception stage, a 7 × 7 convolution is applied in conjunction with BN and Rectified Linear Unit (ReLU) activation to capture low-level geometric features and ensure stable signal propagation in deeper layers. This is followed by a max pooling operation, which performs spatial down-sampling while retaining salient features.
In the feature mapping stage, deep representations are learned through four residual groups—Stage 1 to Stage 4. Bottleneck residual blocks are responsible for flexible adjustment of feature map dimensions and down-sampling, whereas identity blocks propagate information through skip connections, allowing the network to focus on residual learning and effectively alleviating the degradation problem inherent in deep networks.
Finally, global average pooling aggregates channel-wise information, a flatten layer converts the multidimensional feature tensor into a one-dimensional or high-dimensional vector, and a FC layer performs feature integration and mapping.
The core building block of ResNet50 is the bottleneck residual block, as illustrated in Figure 3. In fact, there are studies that recognize the contours of images using the ResNet50 model in backbone CNNs. For example, Dai et al. (2021) used it for text label recognition, which is a typical contour image [50]. Also, Heinke et al. (2021) applied it to simulate biological vision in recognizing geometric shapes [51]. Motivated by these studies, we introduce this contour-based learning paradigm into the processing and analysis of patent images.
Figure 3.
Residual module of ResNet50.
The core building block of ResNet50 is the bottleneck residual block, as illustrated in Figure 3. When processing large-scale design patent image datasets, this structure exhibits notable performance advantages. Specifically, a 1 × 1 convolution is first applied to reduce the dimensionality of the input feature map in stride 1, followed by a 3 × 3 convolution for feature extraction in stride 2, and finally another 1 × 1 convolution is used to restore the feature dimension in stride 3. This design preserves the capability to represent complex product details while substantially reducing the number of parameters and the computational cost. Moreover, when the spatial resolution or channel dimensionality of the input and output does not match, the shortcut branch employs a 1 × 1 convolution for down-sampling and alignment, ensuring smooth propagation of residual information. Compared with basic residual structures, the bottleneck design in ResNet50 significantly improves training speed and inference efficiency on large-scale patent image datasets, providing a solid foundation for subsequent extraction of salient features and enabling more efficient identification of visually critical product characteristics.
4.3.2. CBAM Attention Mechanism
In convolutional neural network (CNN) models, hierarchical feature extraction is achieved through successive convolution and pooling operations, capturing both low-level edge information and high-level semantic representations from patent drawings. However, conventional convolution operators rely on fixed-weight summation, which limits their ability to adaptively focus on regions that reflect visually salient features, particularly in the presence of complex products. Given that different design features contribute unevenly to visual saliency across large-scale design patent datasets, the introduction of attention mechanisms is of significant importance. The core principle of attention mechanisms is to enable the network to automatically learn feature importance, enhancing informative components while suppressing irrelevant ones. In the computer vision domain, commonly used attention mechanisms include channel attention, spatial attention, temporal attention, and hybrid attention [52]. In this study, CBAM is adopted, which is a lightweight hybrid attention mechanism composed of channel attention and spatial attention [53]. Channel attention and spatial attention operate along the channel and spatial dimensions of the feature map, respectively, guiding the model to focus on salient features within target regions. The overall architecture of the CBAM attention mechanism is illustrated in Figure 4.
Figure 4.
CBAM architecture.
As illustrated in Figure 4a, the function of the channel attention module is to adaptively assign different weights to each channel of the input characteristic graph so as to enhance the response of the key characteristic channel and suppress the secondary channel. The principle is to perform global average pooling and global max pooling on the input feature map and generate two channel descriptors with the shape . Then they are processed by a multi-layer perceptron (MLP), activated by the sigmoid function, and finally fused to generate the channel attention weight matrix . They are calculated as follows:
where and denote the features obtained via global average pooling and global max pooling, respectively. Both descriptors are fed into a shared two-layer MLP. The first layer performs dimensionality reduction with neurons, where is the reduction ratio, followed by a ReLU activation function, while the second layer restores the feature dimension to the original number of channels. The outputs of the two branches are then summed and passed through a sigmoid activation function to generate the channel attention weight matrix . This process enables the network to learn the relative importance of different channels. Finally, the input feature map is multiplied by the attention weights to obtain the enhanced feature representation .
As illustrated in Figure 4b, the spatial attention module further emphasizes informative spatial locations based on the channel-refined feature map . Specifically, global average pooling and global max pooling are applied to along the channel dimension, generating two two-dimensional feature maps that capture spatial saliency information. These two maps are then concatenated along the channel axis and fed into a standard convolutional layer followed by a sigmoid activation function. Through this process, the spatial attention weight matrix is obtained, which highlights discriminative regions while suppressing less relevant spatial information. It is calculated as follows:
where denotes the feature map refined by the channel attention module. and represent the features obtained by applying global average pooling and global max pooling to , respectively. indicates the concatenation operation along the channel dimension. denotes a convolutional layer with a kernel size of , and denotes the sigmoid activation function. Through this process, the spatial attention weight map is generated, which enhances informative regions while suppressing less relevant spatial areas.
In summary, the CBAM attention mechanism enables the network to adaptively learn both which features are important and where these important features are located by jointly modeling channel attention and spatial attention. In the channel dimension, differentiated weights are assigned to individual feature channels, thereby enhancing the representation of critical semantic information. In the spatial dimension, the model is further guided to focus on locally discriminative regions within the image. In addition, visualization of the learned attention weights provides an intuitive interpretation of the salient features and structural characteristics emphasized during feature extraction, offering interpretable evidence for the identification and analysis of core features in design patents.
4.3.3. RESNET Model Framework and Residual Module Integrated with CBAM
ResNet50 is adopted as the baseline network in this study due to its strong capability in extracting product appearance features while effectively mitigating gradient vanishing and exploding problems. On this basis, the CBAM module is integrated to further enhance feature representation through a dual-attention mechanism. In the channel attention branch, global average pooling and global max pooling are employed to capture channel-wise statistical information, and a multilayer perceptron is used to learn adaptive channel weights, thereby emphasizing informative features. In the spatial attention branch, channel-refined features are compressed and convolved to accurately localize visually salient features in product drawings, enabling the model to focus on discriminative appearance characteristics.
In this study, a CBAM attention mechanism is integrated into the ResNet50 network to enhance product image feature learning. By incorporating attention-weighted feature maps and visualizing the learned attention responses, the model enables an intuitive analysis of the image regions that contribute most to its decision-making process. The overall architecture of the ResNet50 model with the embedded CBAM module is illustrated in Figure 5, while the modified residual block after integrating the CBAM attention mechanism is shown in Figure 6 [54].
Figure 5.
CBAM-ResNet model framework.
Figure 6.
Residual module with CBAM attention mechanism inserted.
4.3.4. Attention Feature Visualization and Value Calculation
To improve the interpretability and intuitiveness of the experimental results, the attention maps produced by the model are visualized. By visualizing these attention maps, salient features within the product images can be explicitly identified, enabling an assessment of whether the model effectively focuses on visually significant design features. The overall visualization procedure can be summarized in the following steps:
Step 1. Preprocessing of input images: Since product images vary in size, they are first resized to 224 × 224 to meet the input requirements of the CBAM-ResNet50 model.
Step 2. Extraction of attention information: The preprocessed images are fed into the trained model to extract attention information. The feature maps output by the CBAM module—already weighted by both channel and spatial attention—are selected. These feature maps are then averaged along the channel dimension to generate the attention weight maps.
Step 3. Resizing and normalization of attention maps: The extracted attention maps are resized to match the dimensions of the contours detected by the Canny operator, normalized to the range [0, 1], and stored as NumPy arrays for subsequent visualization.
Step 4. Visualization on Canny edges: The attention weights are overlaid on the Canny-detected edges, highlighting the salient feature for intuitive visual interpretation of the model’s focus areas.
Considering that the model’s attention to a particular product feature may not be uniformly distributed, this study predefined a set of product features and defined the average attention weight within each predefined feature region as the attention value of that feature. This metric reflects the degree to which the model focuses on a specific product component and provides a quantitative measure of its visual saliency. The computation can be expressed as follows:
where denotes the Hadamard product, representing element-wise multiplication of matrices; denotes the input feature map to the CBAM module; denotes the feature map after applying channel attention weights; denotes the attention weight at spatial location ; denotes a binary indicator function for the target feature region, taking a value of 1 if pixel belongs to the selected feature region, and 0 otherwise; denotes the total number of pixels within the masked region; and denote the height and width of the image, respectively; and denotes a small constant added to prevent division by 0.
It should be noted that represents the pixel-level mask of predefined product components. Components are defined specifically for different products, and domain experts annotate the corresponding pixel regions for each component. Once annotated, these component masks are utilized to calculate the attention values for the model. The attention value for each physical component of a product is defined as the average value of the attention weights within that component’s mask region. The subsequent identification of core features is built precisely upon these component-level attention values and similarity values. In this study, the raw attention maps are not directly used as indicators of feature importance. Instead, the attention weights of the candidate salient feature are constrained and aggregated using predefined semantic component masks, thereby aligning the attention information with legally relevant design features. This process yields a saliency measure for each design feature. The raw attention maps reflect the discriminative regions that are important for the classification task, whereas the component-level attention values obtained after mask-based aggregation quantify the visual saliency of design features from the perspective of an ordinary consumer. In this way, the attention representation is transformed from task-specific discriminative hotspots into legally meaningful design-feature saliency indicators.
Concurrently, the object of protection for a design patent encompasses new designs of a product’s shape, pattern, color, or a combination thereof that create an esthetic feeling and are fit for industrial application; it strictly excludes any purely functional features. According to Article 2, Paragraph 4 of the Chinese Patent Law and the Patent Examination Guidelines for Design Patents, if a specific feature is dictated solely by technical functions and exerts no significant impact on the overall visual effect of the product, it falls outside the scope of protection for design patents and should be disregarded in infringement assessment. In this study, during the annotation of product component masks (Mask), purely functional features are explicitly labeled but are excluded from subsequent core value calculations. Finally, certain product features may possess both functional and decorative attributes (such as the wavy surface of a showerhead handle, which provides both anti-slip functionality and esthetic appeal). For such hybrid features combining functionality and decoration, this study includes them in the analysis, as they exert a material impact on the product’s visual appearance.
4.4. Similarity Algorithm
Common approaches for measuring image similarity include color-histogram-based methods, structural similarity, feature extraction and matching, and deep-learning-based methods. Color-histogram-based methods evaluate similarity by statistically analyzing the color distribution of images. However, in the context of PDPs, color is typically not protected, which limits the applicability of this approach. Structural similarity algorithms (SSIM) assess image similarity across luminance, contrast, and structural dimensions, but in the case of contour images, significant variations in brightness can substantially interfere with matching accuracy. Methods based on feature extraction and matching rely on detecting and matching keypoints; however, for contour images, feature point extraction is often unstable, resulting in large fluctuations in matching performance [55].
The feature representation of PDP contour images primarily relies on the geometric relationships of lines and lacks visual cues such as texture or color. Conventional methods struggle to ensure stable feature extraction for such data. In contrast, deep-learning-based approaches leverage their powerful feature extraction capabilities to capture the morphological characteristics of contour images while also providing scale invariance, effectively addressing the limitations of traditional algorithms in processing design patent data.
In this study, the pretrained VGG16 model is used to extract feature vectors from contour images [56], with the output of the second-to-last FC layer serving as the feature representation, and the architecture is shown in Figure 7. Subsequently, cosine similarity is employed to measure the similarity between feature vectors. The core idea of cosine similarity is to evaluate the cosine of the angle between two vectors under the assumption that the closer the directions of two vectors, the more similar the image content they represent. Assuming there are two vectors and , the cosine similarity is computed as follows:
where denotes the dot product of the two vectors, and and represent the magnitudes of the vectors, respectively. Since the feature vectors are extracted from the penultimate fully connected layer of VGG16, which is followed by a ReLU activation function, all feature values are non-negative. Consequently, the cosine similarity computed from these vectors falls within the range of 0 to 1. A value closer to 1 indicates higher similarity, whereas a value closer to 0 indicates lower similarity.
Figure 7.
VGG16 model architecture.
The procedure described above concerns image-level similarity. To support feature-level similarity evaluation, which is required for the core value calculation in Formula (13), the framework is extended as follows. For a given target patent view and a predefined product feature component , the corresponding binary component is applied to the contour image. The minimum bounding rectangle of the component mask is expanded by 10 pixels in each direction as padding to preserve contextual contour information at the component boundary, and pixels outside the masked region are set to zero. The masked region is then cropped, resized to 224 × 224 pixels using bilinear interpolation, and fed into the pretrained VGG16 model to extract the component feature vector . For each patent image in the database with the same view orientation , the corresponding component mask defined for the same component is used to perform the same cropping and resizing operations, yielding the component feature vector . The cosine similarity between and is then calculated for all , and the maximum value, , is taken as the closest prior art for that component under the given view. This maximum value serves as the denominator for novelty evaluation in Formula (13).
Because the detailed structures of design patents may differ, a given component may be absent or not clearly identifiable in some database patents. If the component is absent, that patent is excluded from the maximum-similarity search for the corresponding feature, and its similarity value is marked as not applicable (N/A) and excluded from subsequent calculations. If the component is present but partially occluded or moderately deformed, the masked region is still extracted and used because the VGG16 model is robust to moderate shape variations.
4.5. Core Feature Identification for Product Appearance
It is well recognized that, although some design patents may include axial views, a product’s design is typically represented across six standard perspectives: front, back, left, right, top, and bottom. In practice, the novelty and attention values of the same feature can vary across different views. For instance, the spray panel of a showerhead may constitute a core feature in the front view but not in the side view, a situation that is also observed in other products. Accordingly, in the context of patent infringement evaluation, the core feature of an allegedly infringing product should be assessed against the patent’s multiple views, i.e., the target feature should be identified with reference to all six views.
Based on the definition of core feature, and by leveraging the attention maps and values obtained in Section 4.3 and Section 4.4 along with the similarity maps and values, a method for identifying the core feature of a product is developed. To this end, a core value calculation algorithm is introduced, with the computation formalized as follows:
where denotes the -th appearance feature of the product , and is the total number of appearance features contained in the product; represents the core value of feature ; denotes the -th view in the product view set , and is the total number of views; denotes the attention value of feature in view ; denotes the set of patent views in the database that share the same perspective as ; denotes an individual view in ; denotes the maximum similarity value between feature in view and all database views with the same perspective, where a higher value indicates lower novelty; and is a very small constant introduced to prevent the denominator from being 0. The pseudo code of core feature identification for product appearance design is shown in Table 4.
Table 4.
The pseudo code for calculating the feature .
It is evident that the is positively correlated with the attention value and inversely correlated with feature similarity. Based on this formulation, judges and engineering professionals can perform an intelligent, quantitative identification of core features for DPIA, rather than relying solely on traditional experience-based methods.
In addition, we calculate the core value of a feature using the ratio between the attention value and the similarity value rather than adopting other potential fusion methods such as weighted summation, multiplication, or fuzzy logic. This choice is based on multiple considerations, including legal reasoning, mathematical discriminability, and methodological objectivity.
- (1)
- Mechanistically, the direct ratio method is designed as a heuristic ranking index that integrates visual attention and similarity-derived novelty, echoing the “cognitive filtering mechanism” informally applied by examiners in DPIA. According to Article 11 of the Judicial Interpretation of the Supreme People’s Court on Several Issues Concerning the Application of Law in the Trial of Patent Infringement Dispute Cases (II), the identification of a core feature must simultaneously reconcile two dimensions: being “easily observed” (visual saliency) and being “distinguishable from prior designs” (uniqueness). Mathematically, the ratio method enforces this dual constraint by scaling the numerator (attention value) with the denominator (similarity value): when a feature exhibits high similarity to existing designs, its core value is suppressed accordingly; conversely, when the similarity is low, the core value is amplified. This effectively prevents the flawed “value compensation” inherent in the weighted summation method, where a “prominent yet conventional” feature could be misclassified as a core feature due to an overwhelmingly high attention weight, thus aligning more closely with judicial adjudication logic.At the same time, it should be emphasized that this index is positioned as a decision-support tool. Its output provides judges or examiners with a quantitative reference for feature prioritization rather than a legally determinative conclusion. Final core-feature recognition and infringement determination remain within the discretionary authority of the judiciary.
- (2)
- From the perspective of mathematical performance and feature discriminability, the “stretching effect” generated by the direct ratio approach amplifies the distinctiveness of core features, preventing the evaluation results from flattening. The ratio method imparts an obvious growth momentum to the core value as the denominator (similarity) decreases. This “saliency-multiplication” logic allows genuinely unique design features to stand out prominently in the final ranking. In empirical patent datasets, similarity values for most features tend to cluster within a middle range. In such intervals, multiplicative or fuzzy logic (e.g., minimum-value selection) functions change too smoothly to widen the value gap between “core feature” and “ordinary features,” failing to capture the dynamic amplification effect of saliency on uniqueness. In contrast, Formula (13) leverages this non-linear fusion to significantly enhance the signal-to-noise ratio of this auxiliary identification tool, making it highly practical and persuasive in complex legal examination scenarios.
- (3)
- As an inherent “geometric natural fusion” mechanism, the ratio method minimizes the subjective bias and poor generalization capabilities typically introduced by manual weight assignments. In the intellectual property domain, there is currently no standardized empirical data to mandate a specific weight ratio (such as 6:4 or 7:3) between “saliency” and “uniqueness.” Artificially designating weights—whether via weighted summation or harmonic averages—introduces subjective bias and limits the model’s generalizability when expanding the application from “bathroom showerhead” to other industrial product categories. The direct ratio method establishes an “implicit equal-weight” yet mutually restrictive relationship, which natively presumes that saliency and uniqueness are interdependent conditions. Because the computing process operates independently of subjective scoring or sample-calibration experiments, it provides a robust, self-adaptive evaluation framework that more scientifically reflects the relative importance of features across multiple product views.
5. Case Study
5.1. Case Overview
Showerheads are a well-known export product in China. According to statistics, over 50% of showerheads globally are manufactured in China, forming a huge industry that attracts numerous enterprises. Meanwhile, showerheads, especially handle-showerheads, are a typical industrial product that contains both technological and appearance design elements. To gain higher market share and reduce manufacturing costs, enterprises often tend to attract user attention through appearance modifications and protect them with design patents. In China alone, there have been 6167 SDPs in the past 15 years. These patents together form a tight patent protection network, increasing the risk of patent infringement for competitors. According to statistics, since 2014, there have been as many as 425 showerhead cases among Chinese DPIA disputes, accounting for 1.6% of the total number of infringements, ranking second in infringement cases among all products, and showing an increasing trend year by year. In fact, showerheads are composed of multiple mechanical and electronic components, belonging to representative products in the traditional electromechanical field. Moreover, SDPs involve a large number of complex, detailed features. In traditional DPIA, relying on manual determination is often time-consuming and prone to deviations, with significant judgment errors. Moreover, using showerheads as a research object can also provide a reference for studies of other similar products, such as toys, furniture, cloth, electrical products, etc. Therefore, this paper selects showerheads as an application example, combining both practical significance and research value.
Therefore, this case demonstrates how existing SDP data can be effectively utilized for model training, enabling subsequent extraction and identification of core features for other showerheads. This approach shortens the evaluation time and improves the accuracy of infringement assessment. Figure 8 illustrates an exemplary SDP to demonstrate its appearance features. The five physical components labeled in Figure 8—namely the spray panel, regulator, outer contour, handle, and thread—correspond precisely to the semantic categories of the mask defined in Section 4.3.4. In this study, the attention values are calculated by averaging the pixel-level attention weights within the mask regions of each component annotated by experts, thereby enabling the analysis of core features to be conducted on semantically comprehensible units.
Figure 8.
Schematic diagram of showerhead appearance features. 1. Showerhead panel; 2. regulator; 3. outer contour; 4. handle; 5. thread.
5.2. Collection and Processing of SDP Data
In this study, SDPs are selected as the database. According to the retrieval query—a combination of keywords and Locarno classification—SDPs are collected from Patsnap6, a well-known patent search engine. The corresponding search strategy for SDPs is listed in Table 5. The initial search yielded 6167 results. After deduplication and screening based on legal status, the PDF files of 3195 patents were downloaded. However, among these patents, some contained the keyword “showerhead” but actually belonged to showerhead accessories or other product types (such as hose, bracket, or overhead showerhead) rather than the handheld showerhead focused on in this study. Through a manual, item-by-item verification of product names and accompanying drawings, 1028 such patents were excluded (classified as non-showerhead samples), ultimately resulting in 2167 valid SDPs.
Table 5.
SDP search formula and results.
SDP mainly consists of three parts: bibliographic information, appearance design images, and a brief description. For SDP, the most important part is the views section of the appearance design. Since design patent files are in PDF format, preprocessing is required to extract the required showerhead appearance views.
In this study, Python (3.12) is adopted as the processing language, and the PyMuPDF library is utilized for PDF parsing to extract multiple views of the showerhead from design patent documents, thereby constructing the image database. As expected, each design patent consistently includes the six standard views (front, back, left, right, top, and bottom). These images provide a sufficient and diverse sample set for subsequent model training.
It should also be pointed out that the cross-view similarity comparison of patent drawings is physically meaningless; therefore, it is necessary to construct an SDP similarity database for subsequent similarity calculations. The first page of a design patent typically contains information such as the patent application number, classification number, and applicant, and may include an isometric view or a specific view of the product, which does not provide a complete set of product views. Starting from the second page, the corresponding view name (such as “front view,” “top view,” “left view,” etc.) is labeled directly below each product view.
In this study, the PyMuPDF library is first utilized to skip the first page of the design patent PDF and extract the images, text blocks, and their coordinate information from the second page onward. Subsequently, the text block closest to the drawing in vertical distance is selected, and its content is matched against predefined view keywords (in both Chinese and English, such as “主视图”/“front”, “左视图”/“left”, “后视图”/“back”, etc.). If a match is successful, the corresponding view label is assigned; if no match is found, the drawing is saved to another folder. This workflow ultimately achieves the classification of patent drawings and the construction of the similarity dataset. Considering that the front, left, and back views of a product are already capable of comprehensively displaying its features, partial results demonstrating these three views are presented in Table 6.
Table 6.
Dataset of three views.
5.3. Contour Extraction
Considering the characteristics of PDP, the scope of protection primarily focuses on design elements such as shape, lines, and contour structures, rather than non-structural attributes such as color or material. In addition, design patent images may be affected by factors such as lighting conditions, imaging devices, and post-processing procedures during data acquisition, which can introduce noise and consequently reduce the accuracy of subsequent similarity computations.
To eliminate the above interference factors, this paper adopts a contour extraction algorithm. The specific steps are as follows: First, the design patent image is converted into a grayscale image to remove the influence of color information; second, the Gaussian filtering algorithm is utilized to smooth the image and reduce noise point interference; finally, the contour extraction algorithm is applied to extract the image contour.
This paper compares four common contour extraction algorithms and statistically analyzes the results in terms of three dimensions: edge continuity, detail preservation, and computational complexity. Edge continuity reflects the algorithm’s ability to preserve the outer contour structure of the product, while detail preservation evaluates the completeness of extracting key design details. Computational complexity measures the time and resource consumption of each algorithm in large-scale image processing. The comparative results are summarized in Table 7.
Table 7.
Contour detection algorithm results.
From the results in Table 7, it can be seen that the Canny operator performs best in edge continuity and detail preservation, being able to better retain the structural features of design patent images; the Sobel operator, although fast in computation, lacks sufficient detail preservation; the Laplacian operator is prone to introducing noise in detail extraction; the Roberts operator, although simple to implement, is too sensitive to image noise, resulting in many edge breaks in detection results, making it unsuitable for product appearance images with complex details. These results validate the selection of the Canny operator for contour extraction in this study, as it provides the most favorable overall performance for design patent images.
It should also be noted that in this study, the Canny edge detector was configured with a low threshold ( = 50) and a high threshold ( = 150), yielding a high-to-low ratio of 3:1. This threshold combination was selected based on the following steps and considerations:
- (1)
- Grid search optimization: One hundred images were randomly selected from the SDP dataset. A grid search was performed with ranging from 30 to 80 (step size 5) and ranging from 100 to 200 (step size 10). Edge continuity and suppression of non-salient features were used as evaluation metrics. The results indicated that the threshold pair (50, 150) preserved major contours such as the showerhead boundary and handle edges while maximally suppressing fine internal textures, aligning well with the study’s focus on shape contours.
- (2)
- Domain expertise: The selected thresholds maintain the recommended high-to-low ratio of 3:1 for Canny, consistent with common practices in computer vision (e.g., OpenCV documentation suggests a 2:1 to 3:1 ratio).
- (3)
- Robustness testing: Thresholds were varied to (45, 135) and (55, 165), representing ±10% relative changes, and contour extraction was repeated on the same 100 images. The resulting pixel-level differences were minimal, and subsequent experimental computations showed negligible variation within acceptable ranges, indicating that the threshold choice exhibits good robustness within this interval.
To provide a more intuitive comparison of the results produced by different algorithms, three representative views of a randomly selected design patent are chosen for contour extraction. The contour detection results obtained using different algorithms are presented in Table 8. Obviously, the Canny operator clearly outperforms the other algorithms in both line detection and noise suppression.
Table 8.
Contour detection results.
5.4. Experimental Environment Configuration and Model Training
To address the limitation of insufficient training data in practical scenarios, this study adopts a transfer learning strategy to enhance model performance [57]. Specifically, a ResNet50 model pretrained on the ImageNet dataset is employed as the backbone network, which is loaded from the official PyTorch model repository [58]. Having learned rich and general-purpose visual representations, the pretrained model is further fine-tuned for the target task, thereby improving generalization capability and accelerating training convergence.
The model performs a binary classification task, namely determining whether an input image belongs to the “showerhead” category or the “non-showerhead” category. The design of this binary classification task is derived from the “ordinary consumer” standard used in DPIA, under which an observer first identifies the product category before paying attention to specific design features. During the classification process, the CBAM attention mechanism automatically localizes the regions that are most discriminative for distinguishing showerheads from non-showerheads (e.g., the spray panel and handle). These regions subsequently serve as salient candidate regions for core feature identification.
Of the 2167 handheld SDPs obtained after filtering, 200 patents were first extracted from the database using a fixed random seed (random.seed(123)) as the final independent test set. This dataset was sealed immediately after extraction and was not touched in any form during the entire experiment; it was used only for the final core feature accuracy evaluation. After removing the above 200 patents, 400 patents were randomly extracted from the remaining 1967 patents using a fixed random seed (random.seed(42)) and defined as the development set, which was specifically used for model selection tasks such as backbone network comparison, network depth analysis, CBAM position selection, the ablation experiment and similarity algorithm evaluation. The remaining 1567 patents were divided into a training set and a validation set at the patent level using the same fixed random seed as the development set, at a ratio of 7:3. For the non-showerhead dataset, the 1028 non-SDPs selected in Section 5.2 were used as negative samples. Considering the difference in dataset size between showerhead and non-showerhead categories, this paper additionally retrieved and downloaded 500 design patents related to bathroom products to achieve a positive-to-negative sample ratio of approximately 1:1. These were then sampled using the same random seed and ratio as the positive sample training set. The final training dataset composition is shown in Table 9. All patent illustrations were extracted, and all images were resized to 224 × 224 pixels. Data augmentation techniques were employed, including random horizontal flipping, rotation, and brightness and contrast adjustments, to expand the training dataset and reduce overfitting.
Table 9.
Dataset composition.
The experiments are conducted using Python 3.12 with PyTorch 2.5.0 and CUDA 12.4. The hardware platform consists of an NVIDIA RTX 4060 GPU, an Intel i7-12700F CPU, and 32 GB of RAM. The parameter settings for all models are configured as follows: the initial learning rate, batch size, and number of training epochs are set to 0.0001, 32, and 30, respectively. The Adam optimizer is employed for model optimization, and a ReduceLROnPlateau learning rate scheduler is used to automatically decrease the learning rate when the validation accuracy shows no improvement for an extended period, with a reduction factor of 0.5 and a patience value of 5. Cross-entropy loss is adopted as the objective function for training.
The training loss and accuracy curves of the CBAM-ResNet50 model over successive epochs are shown in Figure 9 and Figure 10, respectively. As the number of epochs increases, the training loss gradually decreases while the accuracy steadily improves. Moreover, the model also exhibits enhanced performance on the test set, confirming its reliable generalization capability.
Figure 9.
Loss function curve of the CBAM-ResNet50 model training process.
Figure 10.
Accuracy curve of the CBAM-ResNet50 model training process.
5.5. Model Comparison and Ablation Experiments
To verify the effectiveness of the proposed CBAM-ResNet50 model, this paper designs three sets of comparative experiments, analyzing from three perspectives: different backbone networks, backbone network depth, and ablation experiments. All models are trained and tested on the same showerhead database, and the optimizer and learning rate are consistent to ensure the fairness of the comparison.
Considering the large size of the database, the development set is selected as experimental samples. To ensure the reliability and rationality of labeling and evaluation, 20 patent engineers with extensive experience in design patent examination were invited to participate in the experimental process online7. All experts come from Xiamen Zhihui Chengrui Patent Agency, which has been engaged in the application and infringement analysis of design patents for sanitary products since 20148. The information of expert group members is shown in Table 10. Prior to participating in the study, all experts were clearly informed of the research objectives, the nature of the annotation tasks, and the fact that anonymized information regarding their professional backgrounds would be reported in the manuscript. To protect the privacy of the experts, all personally identifiable information was removed from this study. The experts had at least 4 years (most over 8 years) of patent practice experience and had not participated in the study’s project design or model development. They had no employment or financial relationship with the authors, maintaining independent evaluation. Prior to participating in the study, all the experts were informed of the research objectives, the nature of the annotation and evaluation tasks, and the possibility that anonymized professional background information could be reported in academic publications. The relevant supporting materials have been submitted through the submission system.
Table 10.
Summary of expert group member information.
The experts listed in Table 10 were randomly assigned to two groups: an annotation group and a validation group, each comprising 10 experts. The annotation group was responsible exclusively for annotation tasks, whereas the validation group participated only in the final core-feature verification process. The annotation group performed the following tasks.
Task 1: Mask annotation. This task is used to generate pixel-level ground truth masks for computing attention values. Ten experts used the LabelMe tool to annotate five components in 400 SDP. The annotation protocol required boundaries to closely follow the actual component contours. Task 1 was completed before model training.
Task 2: Salient feature annotation. This task is used to validate the attention model’s focus. The same ten experts independently annotated the visually most attractive feature regions in the same images, which could include both predefined components and local features (e.g., specific textures or decorative lines). These annotations were used to check whether the attention model focused on the feature considered salient by humans.
To ensure annotation consistency, 20 patents were randomly selected from the development set, and all experts in the annotation group independently annotated these samples. For Task 1, 100 pixels were randomly sampled from the annotated images of these 20 patents, and the component labels assigned by the annotation-group experts were recorded. The resulting Fleiss’ kappa coefficient was 0.89 (95% CI: 0.85–0.93), indicating a high level of agreement in the product-component mask annotations. For Task 2, the same sample patents were used to calculate a pixel-level Fleiss’ kappa statistic. Each pixel was treated as an independent evaluation item, and experts made a binary decision as to whether the pixel belonged to a salient feature. The results yielded a Fleiss’ kappa value of 0.81 (95% CI: 0.77–0.85), demonstrating substantial agreement in the annotation of salient features. It should be noted that the purpose of Task 2 was to verify whether the candidate salient features identified by the attention maps corresponded to the design features that, in legal practice, are considered to have the greatest impact on the overall visual impression. By measuring the degree of overlap between the candidate salient features generated by the model and the salient features annotated by experts, we demonstrate that the attention maps can effectively localize legally relevant salient features.
To evaluate the localization accuracy of the model’s attention maps, the continuous attention maps generated by the model must first be converted into binary prediction masks. In this study, the Otsu adaptive thresholding algorithm was applied independently to each attention map for binarization. This algorithm automatically determines the optimal threshold by maximizing the inter-class variance between the foreground (salient regions) and the background, without requiring manual threshold selection. Let (P) denote the binarized prediction mask and (G) denote the ground-truth mask annotated by experts (salient feature annotations). This paper adopts commonly used metrics for machine learning tasks, including accuracy, precision, recall, F1 score, IoU and DSC [59]. The calculation formulas are as follows.
The definitions are explained as follows:
- TP (True Positive): (P = 1) and (G = 1), indicating salient-feature pixels correctly identified by the model.
- FP (False Positive): (P = 1) and (G = 0), indicating background pixels incorrectly identified as salient features by the model.
- TN (True Negative): (P = 0) and (G = 0), indicating background pixels correctly identified as non-salient.
- FN (False Negative): (P = 0) and (G = 1), indicating salient-feature pixels missed by the model.
Among these metrics, Precision represents the proportion of pixels predicted as salient features that are actually salient features; Recall represents the proportion of true salient-feature pixels successfully identified by the model; F1-score provides a balanced measure of Precision and Recall; and Accuracy measures the overall correctness of pixel-level classification across the entire image.
It should be noted that, because background pixels in design patent images vastly outnumber salient-feature pixels, Accuracy cannot reliably reflect the localization capability of the model. Therefore, this study primarily relies on IoU and DSC for model comparison.
The IoU measures the degree of overlap between the predicted attention region and the ground-truth annotated region, while the DSC emphasizes the overall similarity between the two regions. Their corresponding formulations are given as follows, and the underlying computation principles are illustrated in Figure 11.
Figure 11.
Explanation of metrics. (a) True positive, false positive, false negative, and true negative; (b) IoU and DSC.
From the relationship between IoU and DSC, it can be derived that
5.5.1. Comparative Experimental Analysis of Backbone Networks
To evaluate the impact of different backbone networks on the model’s performance, several mainstream architectures are compared, including ResNet50, VGG16, InceptionV3, DenseNet121, and MobileNetV2 [60]. The 400 design patent images described in Section 5.5 are fed into each model to generate continuous attention weight maps. Then, the Otsu adaptive thresholding algorithm is applied to binarize each attention map, yielding the binary predicted mask P. These predicted masks are then compared with the ground-truth salient masks G annotated by experts (see Section 5.5). Based on pixel-by-pixel comparisons (TP/FP/TN/FN), precision, recall, IoU, DSC, and accuracy are calculated. To estimate the confidence intervals of the metrics, the bootstrap method (1000 iterations) is employed to resample the 400 design patent images. The precision, recall, IoU, and DSC are computed for each sampling, with the 2.5% and 97.5% percentiles serving as the 95% confidence intervals. The average values of each evaluation metric and their corresponding confidence intervals (in square brackets) are summarized in Table 11.
Table 11.
Different backbone network metric results.
From Table 11, it can be observed that there are significant differences among the models in terms of Precision, Recall, IoU, and DSC/F1. ResNet50 achieves the best performance across all metrics. Its confidence interval width is the narrowest among all models, indicating that its attention regions stably and centrally cover the core feature with minimal background interference, thereby demonstrating high statistical reliability in its performance evaluation. VGG16 ranks second; while the metrics show it is capable of capturing the primary features, its confidence interval width is larger than that of ResNet50, suggesting that it still misidentifies non-feature regions in some samples, leading to slightly higher performance fluctuations. MobileNetV2 demonstrates moderate performance; its confidence interval width is similar to that of VGG16, but its mean values are noticeably lower, indicating a weaker ability to focus attention compared to VGG16. InceptionV3 and DenseNet121 yield lower mean values for IoU and DSC/F1, and both exhibit larger confidence interval widths, suggesting more dispersed attention regions, insufficient focus on salient features, and greater performance fluctuations across different samples.
In summary, ResNet50 achieves the best overall performance in this task, where its high mean values and narrow confidence intervals jointly demonstrate its stable and accurate coverage of the salient feature regions of SDPs. VGG16 ranks second, while MobileNetV2 and InceptionV3 exhibit moderate performance. In contrast, DenseNet121 produces the most dispersed attention regions. To provide a more intuitive comparison of the experimental results, three design patents are randomly selected from the 400 samples for visualization. As the principal view most comprehensively reflects product design characteristics, the main view of each product is selected for illustration. The corresponding results are presented in Table 12.
Table 12.
Comparison of different backbone network results.
The results presented in Table 12 reveal noticeable differences among the models in terms of their attention focus regions. Although VGG16 is able to capture the overall structural features, it shows limitations in representing fine-grained details. Owing to its multi-scale architecture, InceptionV3 demonstrates improved attention to local details in certain images; however, its overall performance remains inferior to that of ResNet50. DenseNet121 is capable of focusing on the main structure of the showerhead, but it is less effective in identifying core features. As a lightweight architecture, MobileNetV2 produces relatively reasonable attention regions; nevertheless, it still lags behind ResNet50 in terms of attention concentration and fine-grained feature recognition.
5.5.2. ResNet Network Depth Impact Comparison
To investigate the impact of network depth on model performance, several ResNet variants with different depths—namely ResNet18, ResNet34, ResNet50, and ResNet152—are selected for comparative experiments [61]. These models differ in their fundamental architectural designs: ResNet50 and ResNet152 adopt bottleneck structures incorporating convolutions for dimensionality reduction and expansion, whereas ResNet18 and ResNet34 employ basic convolutional blocks. Under identical experimental settings, the effects of network depth and structural differences on model capability are systematically compared, and the result is shown in Table 13.
Table 13.
ResNet network depth metric results.
As indicated by the metrics reported in Table 13, increasing the depth of the ResNet architecture does not lead to a monotonic improvement in performance. ResNet50 achieves the best overall results across all evaluation metrics, and its confidence interval width is the narrowest, demonstrating its ability to accurately and comprehensively focus on salient feature regions while effectively suppressing background interference, reflecting highly stable performance evaluation. ResNet18 and ResNet34 exhibit slightly lower performance; their confidence interval widths are larger than that of ResNet50, suggesting that although they can capture the primary features, they remain limited in modeling fine-grained details and boundary information and experience greater performance fluctuations across different samples. Specifically, the slightly wider confidence interval for the Precision of ResNet34 further confirms that its stability is marginally lower than that of ResNet50. In contrast, ResNet152 shows lower values in IoU and DSC metrics, while its confidence interval width is significantly larger than those of the other models. This indicates that excessive network depth weakens the model’s ability to concentrate on core features, leading to dispersed attention regions and unstable performance.
In summary, a moderate network depth enables the model to enhance attention concentration while preserving effective feature extraction capability, and ResNet50 achieves the best overall performance in this task. To further illustrate the impact of different ResNet depths, the front views of the three SDPs selected in Section 5.5.1 are visualized for comparison. This qualitative analysis provides a more intuitive demonstration of the performance differences among ResNet architectures with varying depths. The results are shown in Table 14.
Table 14.
Comparison of different ResNet network depth results.
Evidently, although ResNet18 and ResNet34 offer higher computational efficiency, their relatively shallow architectures lead to extracted features that contain excessive fine-grained and irregular details, which is unfavorable for subsequent core feature identification. In contrast, while ResNet152 possesses stronger semantic abstraction capability due to its greater depth, the excessive down-sampling results in the loss of substantial low-level detail information, thereby degrading its ability to accurately characterize core features. By comparison, ResNet50 achieves a better balance between feature concentration and detail preservation, yielding more reliable performance for core feature analysis.
5.5.3. Ablation Experiments
To verify the effectiveness of the proposed network and the rationality of the CBAM module placement, ablation experiments are conducted. The ResNet50 architecture consists of four convolutional stages. The proposed CBAM-ResNet50-C2 model integrates the CBAM attention mechanism after the Conv2_x stage of ResNet50. To evaluate the impact of different CBAM insertion positions, three comparable variants are further constructed, denoted as CBAM-ResNet50-C1, CBAM-ResNet50-C3, and CBAM-ResNet50-C4. Specifically, CBAM-ResNet50-C1 inserts the CBAM module after the Conv1_x stage, CBAM-ResNet50-C3 integrates CBAM after the Conv3_x stage, and CBAM-ResNet50-C4 places the CBAM module after the Conv4_x stage.
In addition, to evaluate the individual contributions of different attention components, the channel attention module (CAM) and the spatial attention module (SAM) of CBAM are separately integrated into the ResNet50 network for comparison. Furthermore, to demonstrate the advantages of CBAM over other attention mechanisms, the squeeze-and-excitation (SE) module and a self-attention module are also incorporated into the model for comparative analysis. To ensure a fair comparison, all attention mechanisms are inserted at the same position—after the Conv2_x stage of the ResNet50 network. The corresponding network architectures are illustrated in Figure 12, and the experimental results are reported in Table 15.
Figure 12.
Network structure diagrams at different positions and with different attention mechanisms.
Table 15.
Ablation experiment metric results.
Overall, the ablation experiment results in Table 15 indicate that the CBAM-ResNet50-C2 model proposed in this paper achieves the best attention performance in showerhead feature recognition, and the selected attention insertion position (after Conv2_x) is optimal. The IoU and DSC at different insertion positions (CBAM-ResNet50-C1, C3, C4) are significantly lower than at the C2 position in this paper, and their confidence intervals are wider, indicating that inserting attention too early or too late weakens the response to key feature regions. The four convolutional stages of ResNet50 extract features at different levels: Conv1_x has a small receptive field, mainly extracting local low-level features such as edges and textures, and is sensitive to noise, so inserting attention here is prone to dispersion over fine-grained textures. Conv2_x is in the mid-shallow layer, with a moderate receptive field, capable of capturing contour-level shape information such as the circular boundaries of the spray panel and the slender handles while retaining sufficient spatial resolution; inserting CBAM here can synergistically enhance geometric features such as contour orientation and curvature in both channel and spatial dimensions. Conv3_x and Conv4_x have too large receptive fields, lower spatial resolution, and overly abstract features, which easily lose contour details. Therefore, Conv2_x achieves the best balance between contour representation capability and spatial resolution. In addition, the CAM-ResNet50 model introduces channel-wise weighting; however, the lack of spatial selectivity limits the improvement in localization accuracy. Although the SAM-ResNet50 model shows strong feature localization ability, its attention distribution remains too dispersed. The SE-ResNet50 model shows a decrease in IoU and DSC/F1, indicating that channel-only attention has inherent limitations in feature recognition and cannot fully capture spatial details. The Self-attention-ResNet50 model reacts too strongly to non-feature regions, resulting in reduced discrimination capability for significant features.
To evaluate the robustness of the proposed CBAM-ResNet50-C2 model to different product views, we grouped images in the development set according to view direction and calculated the model’s IoU and DSC metrics for the front view, side view, and rear view. The results are shown in Table 16.
Table 16.
Performance scores of the CBAM-ResNet50-C2 model on different views.
As shown in Table 16, the CBAM-ResNet50-C2 model has very similar metrics on the front view, side view, and rear view, with a standard deviation of 0.67% for IoU and 0.54% for DSC. One-way ANOVA results indicate that the IoU differences between different views are not significant (F(2, 1531) = 1.24, p = 0.29 > 0.05). This suggests that the proposed method has good robustness to changes in product viewpoint and can meet the practical needs of multi-view comparison in DPIA. Finally, to evaluate the efficiency of each ablation variant, this paper reports the number of parameters, FLOPs (for input images of 224 × 224), and the average inference time per image (batch size = 1, averaged over 100 runs) under the same hardware environment, as shown in Table 17.
Table 17.
Computational cost and inference time of different ablation variants.
Table 17 compares the number of parameters, FLOPs, and inference time of various ablation variants. From the results in the table, it can be seen that the proposed CBAM-ResNet50-C2 increases only 0.6 M parameters, 0.1 G FLOPs, and 4.7 ms inference time compared to the baseline ResNet50. This computational cost is entirely acceptable in practical deployment, demonstrating a good balance between accuracy and efficiency; for different CBAM insertion positions, their number of parameters and FLOPs are the same as C2, but the inference time varies slightly. This is because the memory access patterns or computational parallelism of the attention module differ slightly on feature maps of different depths, but the overall difference is minor; models using only channel attention or only spatial attention have fewer parameters and FLOPs than the full CBAM, and their inference time is also shorter. However, their accuracy is much lower than the method used in this paper. This indicates that while lightweight designs are more efficient, they come at the cost of accuracy; Self-attention-ResNet50 has parameter counts, FLOPs, and inference time much higher than all other models. This is because the self-attention mechanism requires computing pairwise correlations between all global pixels, and its computational complexity scales with the square of the spatial size of the feature map. While the insertion positions were kept similar to CBAM in designing this control model, the inherent high cost of self-attention makes it difficult to efficiently handle contour-level patent image analysis tasks. In summary, CBAM-ResNet50-C2 achieves the best balance between accuracy and computational efficiency and is the most ideal model configuration for this task.
To provide a more intuitive demonstration, three design patents were randomly selected from the test set to display their visualization results. Table 18 presents the results of the ablation experiments. Due to different insertion positions of the attention modules, the first three models tend to focus on relatively abstract features, with attention predominantly concentrated on image edges or local structures, which is unfavorable for salient feature discrimination. CAM and SAM correspond to the channel attention and spatial attention components of the CBAM mechanism, respectively. The results show that CAM preserves an excessive amount of feature information, which hampers salient feature identification, whereas SAM suffers from insufficient feature completeness. In comparison, the CBAM mechanism adopted in this study effectively compensates for the limitations of both CAM and SAM by jointly modeling channel-wise and spatial attention, thereby achieving superior performance. Other attention mechanisms, such as SE and self-attention, either fail to capture meaningful salient features or attend to non-salient features, resulting in inferior performance compared with the proposed method.
Table 18.
Comparison of ablation experiment results.
5.6. Product Feature Attention Value Calculation
To further evaluate the model’s focus on the core structural regions of SDPs, a quantitative analysis is conducted based on the attention maps extracted from the CBAM module. These attention maps incorporate both channel attention and spatial attention, which enhance feature representation from the perspectives of feature dimensions and spatial locations, respectively. Through their combined effect, the model is able to more accurately concentrate on the key regions of showerhead images.
First, the input feature maps are processed by global average pooling and global max pooling to extract complementary information from different perspectives. The pooled features are then fused through convolution operations and activation functions to generate the final attention weight map. Based on this attention map, normalization is applied, and the attention weights within the showerhead feature regions are averaged to obtain quantitative values for evaluation. Meanwhile, these values are overlaid on the attention maps, resulting in values for different features of the showerhead across multiple views.
Through this approach, complex attention distributions are transformed into intuitive numerical indicators. By processing showerhead images from multiple views, the attention maps generated by the model and their corresponding quantitative values are jointly stored as input data for subsequent core feature identification. Taking a single showerhead as an example, the attention values of its features in the front view, side view, and rear view are reported in Table 19.
Table 19.
Showerhead original image, contour image, and attention image.
5.7. Product Feature Similarity Calculation
To determine the core feature of SDPs, relying solely on convolutional neural networks and attention mechanisms to extract salient features is insufficient. The core feature of a showerhead should exhibit both saliency—i.e., visually distinctive elements that characterize the product design—and novelty, meaning discernible differences compared with existing patented designs. Therefore, after obtaining the saliency results of showerhead features, image similarity computation is further employed to compare different showerhead samples and assess whether the identified features possess novelty relative to prior designs.
Considering that design patents protect contour features rather than color attributes, this study selected the development set for similarity algorithm selection. For each design patent, the corresponding drawings were extracted, and contour extraction was performed. To evaluate the performance of image similarity algorithms on contour-image data, similarity annotations were conducted on the contour images corresponding to the drawings of these 400 design patents. To ensure the objectivity of the similarity annotations, 10 experts from the annotation group in Section 5.5 were invited to conduct manual evaluations. The pair selection procedure was as follows.
Candidate pair generation: From the development set, 200 were randomly selected as anchor products. For each anchor, 10 other patents were randomly sampled from the remaining patents and paired with the anchor based on the same front view (as front views better reflect the overall design features of the showerhead), generating a total of 2000 candidate image pairs. It should be noted that the quantitative similarity comparison in this study was primarily based on front views; multi-view similarity validation was beyond the scope of the current experiments but remains an important direction for future research.
Expert quantitative scoring: The 10 experts from the annotation group were asked to evaluate each candidate pair using a five-point Likert scale, where 1 indicates “completely different” and 5 indicates “highly similar.” The average value across all experts for each pair was taken as the ground-truth similarity label. To assess the consistency of the ratings from 10 experts, the intraclass correlation coefficient (ICC) was calculated by integrating a two-way mixed-effects model, the definition of absolute consistency, and a single measurement mode. The results showed an ICC value of 0.91 (95% CI: 0.88–0.93), indicating that the expert ratings had good inter-rater reliability and validating the reliability of the labeling.
Difficulty stratification and sampling: Based on the expert scores, all candidate pairs were divided into three categories:
- Easy similar pairs: average score ≥ 4.0;
- Easy dissimilar pairs: average score ≤ 2.0;
- Difficult (nearest-neighbor) pairs: average score between 2 and 4.
From each of the easy similar, easy dissimilar, and difficult categories, 200 pairs were randomly selected. Within the difficult category, pairs with an average score ≥ 3.0 were labeled as “similar,” and those with an average score < 3.0 were labeled as “dissimilar.” These difficult pairs were then assigned to the corresponding similarity or dissimilarity set. Ultimately, the final dataset consisted of 296 similar pairs (200 easy similar + 96 difficult similar) and 304 dissimilar pairs (200 easy dissimilar + 104 difficult dissimilar), totaling 600 pairs.
Since contour images in design patents are typically black-and-white, color-histogram-based similarity computation methods are not applicable. Therefore, the dataset was evaluated using similarity computation methods based on pixel structures and feature representations. These methods include the structural similarity index (SSIM), feature-matching-based methods (such as SIFT and ORB), mutual-information-based image registration, and cosine similarity based on deep-learning feature representations (including ResNet50+Cos, InceptionV3+Cos, DenseNet121+Cos, MobileNetV2+Cos, and VGG16+Cos). Each method outputs a corresponding similarity value for evaluation.
Considering that different algorithms produce similarity values with substantially different ranges and distributions, it is not feasible to apply a unified threshold or judge similarity solely based on absolute scores. Therefore, this study adopted ROC curves and the AUC metric [62]. An ROC curve is not derived from a single fixed threshold; instead, it is generated by traversing all possible decision thresholds that distinguish similar from dissimilar samples. The AUC measures the ranking capability of an algorithm in distinguishing similar and dissimilar samples and has been established as a standard evaluation metric in fields such as image retrieval and near-duplicate image detection [63]. By plotting ROC curves and calculating AUC values, the discriminative performance of each algorithm can be systematically evaluated.
The AUC represents the area under the ROC curve and serves as an overall performance indicator, with values ranging from 0 to 1. In the ROC curve, the horizontal axis corresponds to the False Positive Rate (FPR), and the vertical axis corresponds to the True Positive Rate (TPR), which are defined as follows:
Based on the similarity values obtained for the similar and dissimilar sample pairs by each algorithm, the statistical results of the similarity values are summarized in Table 20. Subsequently, the corresponding ROC curves and AUC values are plotted, as illustrated in Figure 13.
Table 20.
Score statistical results of each algorithm.
Figure 13.
ROC curves and AUC indicators for each algorithm.
As shown in Table 20, the cosine-similarity algorithm based on deep learning features consistently outperformed the traditional approaches. In particular, the VGG16+Cos method produced similarity values ranging from 0.6909 to 0.9637 for the similar-pair group (mean = 0.8262), whereas the scores for the dissimilar-pair group ranged from 0.5738 to 0.8787 (mean = 0.6727). Although the two distributions overlap within the interval of 0.6909–0.8787, the degree of overlap is relatively limited. Most similar pairs are concentrated in the higher-score range, whereas most dissimilar pairs are concentrated in the lower-score range. As a result, VGG16+Cos achieved an AUC of 0.9859, demonstrating excellent discriminative capability. ResNet50+Cos (AUC = 0.9635) and InceptionV3+Cos (AUC = 0.9481) also exhibited strong performance, followed by DenseNet121+Cos (AUC = 0.9203) and MobileNetV2+Cos (AUC = 0.9221). These results further confirm the effectiveness of combining deep feature representations with cosine similarity, as this approach is capable of capturing both the global shape characteristics and the subtle visual differences present in contour images.
In contrast, the traditional algorithms exhibited clear limitations. SSIM achieved an AUC of only 0.8016, and similarity values for dissimilar pairs reached as high as 0.8742, indicating a substantial risk of false-positive classifications. ORB (AUC = 0.8485) and mutual information (AUC = 0.9054) showed considerable overlap between the score distributions of similar and dissimilar pairs, thereby limiting their discriminative accuracy. SIFT demonstrated the weakest performance among all evaluated methods (AUC = 0.6598). The score distributions of the similar and dissimilar groups showed only a small gap, with mean scores of 0.4590 and 0.3978, respectively, indicating that the method could not reliably distinguish between similar and dissimilar contour images in this task. Overall, the combination of VGG16 feature representations and cosine similarity provided the best balance between accuracy and robustness for similarity assessment of design patent contour images, outperforming both alternative deep-learning-based approaches and traditional image similarity algorithms.
Considering both AUC values and score distribution characteristics, cosine similarity based on deep learning feature representations demonstrates higher accuracy and robustness in computing similarity of design patent contour images. Among these methods, VGG16 combined with cosine similarity exhibits the best overall performance on the contour dataset. It effectively captures both the global shape features and subtle differences in product contours, making it particularly well-suited for similarity analysis tasks of design patent contour images. To test the robustness of the chosen cutoff value of 3.0, three different cutoff values of 2.5, 3.0, and 3.5 were selected, and the AUC of each algorithm was calculated. The results show that VGG16+Cos maintains the highest performance at all three cutoff values. Obviously, the results are not affected by different cutoff values.
To ensure the robustness of the AUC estimation, this study employs a cluster bootstrap method based on anchor patents for statistical inference [64]. Specifically, resampling is performed with replacement 1000 times, using anchor patents as the basic unit. After each sampling, the AUC values of each similarity algorithm are recalculated, thereby estimating the 95% confidence interval of the AUC. This method effectively controls the impact of sample non-independence on the confidence interval estimation by preserving the clustering structure at the anchor level.
Furthermore, Leave-One-Anchor-Out Cross-Validation (LOAOCV) is used to evaluate the generalization performance of the algorithm [65]. The specific process is as follows: Each time, one anchor point and all its pairs are reserved as the validation set, while the pairs corresponding to the remaining anchor points are used as the reference set. On the reference set, candidate similarity thresholds are iterated through, and the optimal threshold for cosine similarity is determined by maximizing Youden’s Index. This threshold is then applied to the validation set, performing binary classification on each pair of images: a cosine similarity ≥ the threshold is defined as “similar” and otherwise as “dissimilar,” thus obtaining the predicted label. This predicted label is then combined with the expert-annotated ground truth label to calculate the classification accuracy for that round. Simultaneously, the original cosine similarity value and corresponding ground truth label for each pair in the validation set are recorded. To avoid fluctuations in AUC estimation due to a small sample size in a single validation round, this study adopts a Pooled AUC strategy: the original predicted scores from all validation rounds are merged with the corresponding ground truth labels to calculate a single global AUC as the final generalization [66] performance metric. The statistical comparison of similarity algorithms with cluster bootstrap confidence intervals and LOAOCV pooled AUC is shown in Table 21.
Table 21.
Statistical comparison of similarity algorithms with cluster bootstrap confidence intervals and LOAOCV pooled AUC.
As shown in Table 21, VGG16+Cos achieves the best performance on both the cluster bootstrap 95% confidence interval (0.9748–0.9935) and the LOAOCV pooled AUC (0.9841). Notably, all deep learning methods (ResNet50+Cos, InceptionV3+Cos, DenseNet121+Cos, MobileNetV2+Cos) have AUCs exceeding 0.92, significantly outperforming traditional image similarity algorithms (SSIM, SIFT, ORB, mutual information). Under both evaluation strategies, the performance rankings of the algorithms are consistent, and the confidence interval width narrows as the AUC value increases, further validating the robustness and reliability of the results.
To further evaluate the boundary-handling capability of the algorithms in practical applications, this study conducted an in-depth analysis of difficult nearest-neighbor cases with expert scores ranging from 2.5 to 3.5. In particular, we analyzed failure cases in which the deep learning algorithms produced incorrect judgments, including cases that experts considered similar but received relatively low similarity values, and cases that experts considered dissimilar but received excessively high similarity values. Among the difficult pairs, many cases exhibited “similar overall structure but different local features” (difficult dissimilar pairs) or “highly consistent local core features but different contours of secondary components such as handles” (difficult similar pairs). Figure 14 and Figure 15 present representative image pairs. Specifically, Figure 14a,b show difficult cases successfully classified by VGG16+Cos in agreement with expert judgments, while Figure 15c,d illustrate two representative failure cases.
Figure 14.
Similar and dissimilar success cases.
Figure 15.
False positive and negative failure cases.
In Figure 15c, both showerheads adopt a circular spray panel combined with a straight-handle design, resulting in highly similar outer contours. The expert rating was 3.2/5 (moderately high similarity), classifying this pair as a boundary similarity sample. Although the two images appear visually very similar, they were categorized as a “difficult similar” case. According to the expert evaluations, the main points of disagreement were concentrated in the following aspects:
- Proportional relationship between the handle and the circular spray panel: Although the handle shapes and spray panels are visually similar, their proportional relationships differ.
- Distribution of water outlets: Both spray panels employ irregular concentric-circle patterns on the surface, raising ambiguity regarding whether they should be considered visually similar.
- Button features: Both handles contain a circular feature positioned at the center of the top section; however, the relative positioning of the button with respect to the handle and spray panel differs between the two designs.
For traditional image similarity algorithms, small alignment offsets or subtle differences in ring thickness may easily lead to lower similarity judgments. In contrast, the similarity algorithm adopted in this study produced a relatively high similarity value (0.8922), significantly higher than those of other groups. Through hierarchical feature extraction and high-level semantic representation capabilities, the method is able to capture global shape characteristics while simultaneously matching the core semantic feature combinations of design patents.
In Figure 14b, the two SDPs exhibit a high degree of macro-level geometric confusion: both feature an identical circular head and a slightly conical straight handle. Even the neck connecting the handle to the head includes a vertical bar-shaped switch knob of identical size and topological placement. Based on expert evaluation and final categorization, this pair was classified as “difficult dissimilar,” with the main point of contention focused on the arrangement and visual density of the water outlets on the spray panel.
For shower products, the nozzle array on the spray panel often constitutes the product’s distinctive and novel feature. Traditional similarity algorithms tend to assign high similarity values because most components, such as handle and head shapes, appear similar, leading to inaccurate results. By contrast, the similarity algorithm used in this study produced a lower similarity value (0.6351). This is because when product features are projected into a high-dimensional feature space, differences in nozzle array density and spatial configuration shift the orientation of the extracted feature vectors, resulting in a lower calculated similarity value.
These two difficult cases demonstrate that the method aligns with expert judgment, confirming the accuracy and robustness of the algorithm when handling high-ambiguity, borderline patent samples.
To comprehensively and objectively evaluate the boundary-handling capability of the proposed algorithm, focusing solely on successful cases would be insufficient. Therefore, this study further analyzed representative misclassification cases observed during the experiments. Figure 15c,d illustrate two typical categories of failure cases identified in this study.
False Positive Failure Case: From a macroscopic visual perspective, the two showerheads exhibit a very high degree of similarity in their overall outer contour. Both feature an almost identical circular spray-panel outline, a slightly tapered straight handle, and a vertical bar-shaped switch located at the neck connecting the handle and the spray head, with nearly the same aspect ratio and topological position. However, the expert panel classified the two designs as dissimilar, primarily because the geometric texture topology of the nozzle array on the spray panel is fundamentally different. The product on the left adopts a distinctive radial/striped structure, in which the nozzles are arranged along rays extending outward from the center, creating a strong sense of visual divergence. In contrast, the product on the right employs a conventional and highly regular concentric circular nozzle pattern, where the nozzles are distributed in dense, discrete circular rings. Because the outer contour and handle shape are highly similar and occupy the majority of pixels in the contour images, these strong global consistency cues dominate the feature-vector representation during global feature extraction and high-dimensional feature mapping. As a result, the local high-frequency structural differences within the spray panel—namely, the transition from a “radial-line pattern” to a “concentric-dot pattern”—are diluted, leading the algorithm to produce a relatively high similarity value of 0.7950.
False Negative Failure Case: The two showerheads exhibit nearly identical overall outer contours and highly similar core nozzle-array structures; therefore, the expert panel considered them to be similar. The primary differences lie in the neck-region design: the product on the left adopts a conventional vertical bar-shaped switch and includes a circular protrusion at the center of the spray panel, whereas the product on the right introduces a rounded-square button at the neck and incorporates segmented contour lines along the outer ring of the showerhead. From the perspective of the core elements of industrial design, the two patents possess a very high degree of visual identity overlap. Not only do they share the same proportional relationship between the circular showerhead and straight handle, but more importantly, the dense concentric nozzle arrays and geometric arrangement patterns on the spray panel are almost perfectly aligned. However, because the algorithm lacks semantic differentiation between “core esthetic components” and “conventional functional components,” it overemphasized the topological structural changes introduced by the button design, resulting in a relatively low similarity value of 0.7136.
These two types of failure cases indicate that, for similarity retrieval and judgment of design patents, relying solely on global feature extraction is insufficient. Future research must incorporate a component-level matching mechanism grounded in design semantics. By segmenting the core esthetic regions and secondary functional components and assigning differentiated comparison weights, algorithms can better approximate human expert reasoning, which emphasizes substantive novelty while downplaying routine functional modifications.
5.8. Core Calculation and Core Feature Determination
5.8.1. Comparison with Other Models
Finally, to verify the effectiveness of the proposed method, this paper uses 200 SDPs extracted from Section 5.4 as the final independent test set. This dataset was not used for any training, validation, ablation experiments, or model selection decisions; it was only used for the final performance evaluation after the optimal framework was determined. Their patent drawings are fed into the proposed model to obtain attention values for individual features. Subsequently, a similarity algorithm is employed to compute feature-wise similarity values between the contour images of these samples and those in the patent database. Finally, the importance of different features within each sample is calculated according to Formula (13), which serves as the basis for determining the core feature.
To further evaluate the accuracy and rationality of the proposed method, the experts from the validation group listed in Table 10 were invited to participate in the evaluation process. It should be noted that manual evaluation is inherently subjective, and experts may differ in identifying the core feature of a product. To mitigate subjective bias, an expert voting strategy was adopted. In cases of disagreement regarding core feature identification, the decision supported by the majority of experts (i.e., at least 70%) was accepted. Meanwhile, to assess the consistency of the validation group’s judgments, 100 samples were randomly selected from the 200 SDPs to calculate Fleiss’ kappa for the 10 experts’ binary “correct/incorrect” judgments. The result was 0.78 (95% CI: 0.73–0.83), indicating high inter-rater consistency within the validation group and confirming the reliability of the results.
The evaluation procedure was as follows. First, the core values of 200 SDPs were obtained using this method. Simultaneously, the features with the highest among all product features were extracted and considered the most important core features (i.e., the model’s Top-1-ranked core feature), as shown in Table 22. This study adopts Top-1 evaluation as the primary and conservative validation criterion because it represents the single feature with the highest core value calculated by the model. This provides a clear benchmark: if the model cannot correctly identify even its most favored feature, its lower-ranked predictions are unlikely to be reliable. In practice, the possibility of multiple high-ranking core features is retained as an interpretive output but was not independently evaluated as a multi-label task. These results were then submitted to experts for online evaluation; these experts assessed the correctness of the core features obtained using the proposed method (the overall performance metric was defined as the expert endorsement rate). Subsequently, the expert evaluation results were summarized. In cases of differing expert opinions, the majority opinion was taken as the final result.
Table 22.
Sample results of product core feature.
In addition, the EEP of different methods is compared, and the results are illustrated in Figure 16, Figure 17 and Figure 18.
Figure 16.
EEP results of different backbone networks.
Figure 17.
EEP results of ResNet with different network depths.
Figure 18.
EEP results of ablation experiments.
This experiment compares the results obtained using different backbone network architectures described in Section 5.5.1. By combining attention value computation and similarity analysis, the core feature identification results produced by each model are extracted. These results are then validated by patent domain experts, and the corresponding accuracy is calculated. The results show that, under identical experimental conditions, different backbone networks have a substantial impact on performance, with EEP ranging from 70% to 86.5%. Evidently, the proposed model—CBAM-ResNet50—achieves the highest EEP among all compared models.
Subsequently, the EEP of ResNet models with different depths described in Section 5.5.2 is evaluated. The results show that the medium-depth ResNet50 model adopted in this study achieves the highest EEP, whereas the deeper ResNet152 model exhibits a performance decline. This indicates that increasing network depth does not necessarily lead to improved accuracy; excessively deep architectures may cause feature overfitting or attention diffusion, thereby reducing the model’s ability to focus on key feature regions.
Finally, the EEP results of the ablation experiments described in Section 5.5.3 indicate that the CBAM attention mechanism adopted in this study, together with its selected insertion position, achieves higher EEP than other attention mechanisms and alternative insertion configurations. These results validate that the CBAM-ResNet50-C2 module is more effective in focusing on core features compared with other attention mechanisms and that the insertion position is also optimal for enhancing feature identification performance.
In summary, the three experimental results demonstrate that different backbone networks perform differently in core feature recognition, with the ResNet50 backbone network outperforming other comparative models. Furthermore, networks of moderate depth are more conducive to attention focusing. Finally, the introduction of the CBAM module achieves superior performance compared to other attention mechanisms. Overall, models integrating the CBAM-ResNet50 architecture—especially the CBAM-ResNet50-C2 variant—achieved the highest EEP (86.5%, and the Wilson confidence interval is 81.1% to 90.6%), fully validating the effectiveness of the proposed method in product core feature recognition tasks.
Moreover, analysis of 27 failed patent tests was conducted and revealed two reasons for failure:
First, attention positioning errors. The attention map generated by the model might focus on non-core areas of the product, not necessarily the features most influential on visual appeal. For example, some products contain unique decorative lines (such as product logos), and the model over-allocates attention to these lines. Often, these lines have high novelty, leading to lower similarity value and ultimately incorrect calculations.
Second, multiple core features coexisting. This experiment used the feature with the highest core value for verification. However, in some products, the first- and second-ranked features had high core values with similar values. Experts believed both should be considered core features, but the highest value was used as the model output, resulting in an incorrect assessment. This phenomenon reflects the objective reality of multiple core features coexisting in actual products. The proposed method has potential interpretive value for cases involving multiple coexisting core features, but this capability requires multi-label validation in future research.
It should be noted that the method proposed in this paper aims to provide quantitative reference for DPIA, rather than replacing experts in making final decisions. In scenarios where core values are similar, the multiple feature scores output by the model can serve as valuable quantitative signals, prompting judicial personnel or review experts to comprehensively consider the parallel features.
5.8.2. Illustration of the Computational Procedure
To make the computation process more intuitive, a showerhead from Section 5.5 is selected as an example to illustrate the core feature calculation procedure in detail. This showerhead consists of three primary appearance features, namely the spray panel, the outer contour of the showerhead, and the threaded section. The calculation results for each feature are presented in Figure 19, Figure 20 and Figure 21 and Table 23.
Figure 19.
Product front view results.
Figure 20.
Product side view results.
Figure 21.
Product rear view results.
Table 23.
Attention value results for each feature.
The similarity of each feature is computed across different views of the product. Since the threaded section is a functional feature and does not fall within the scope of design patent protection, it is excluded from further consideration. The spray panel is denoted as feature , and the outer contour is denoted as feature . The corresponding computation results are shown in Figure 22 and Figure 23.
Figure 22.
Front view feature similarity results.
Figure 23.
Side view feature similarity results.
Based on the attention results and similarity measurements, the core values of the showerhead can be computed for each view. Since the rear view of this product does not exhibit additional novel features and its primary characteristic is the outer contour, the outer contour in the main view is selected as the representative core feature. According to Equation (13), the core values of each feature are and . The calculation results of the core value for each feature in the side view are and .
According to the computation results, the spray panel feature achieves its maximum core value in the side view , while the outer contour feature attains its maximum value in the side view . These two values are therefore selected as the representative core values for the corresponding feature. Since , it can be concluded that the spray panel constitutes the core feature of this showerhead.
Similarly, take the calculation process of another showerhead as an example. This showerhead mainly consists of four parts: spray panel, button, outer contour, and threaded part. The product views were fed into the trained model, which outputs its views, contour images, and attention images. At the same time, the attention values of each part feature of this showerhead are obtained from the views. The results are shown in Figure 24, Figure 25 and Figure 26, and the attention values for each feature of this product in different views are obtained as shown in Table 24.
Figure 24.
Product front view results.
Figure 25.
Product side view results.
Figure 26.
Product rear view results.
Table 24.
Attention value results for each feature.
Obviously, the attention regions are primarily concentrated on the outer contour, followed by the threaded section, and subsequently on other features such as the spray panel and buttons. Since functional features are not considered within the scope of design patent protection, the threaded section is excluded from further computation. Accordingly, the spray panel is denoted as , the button as , the outer contour as , and the threaded section as .
In addition, comparisons with other patents and design patents is required to satisfy the novelty criterion. The attention maps of the target showerhead features are therefore compared with those in the SDPs database using similarity analysis. Taking the above product as an example, all showerhead views in the database are traversed to identify the most similar instance, and the corresponding similarity value is reported. The results are presented in Figure 27, Figure 28 and Figure 29.
Figure 27.
Front view feature similarity result.
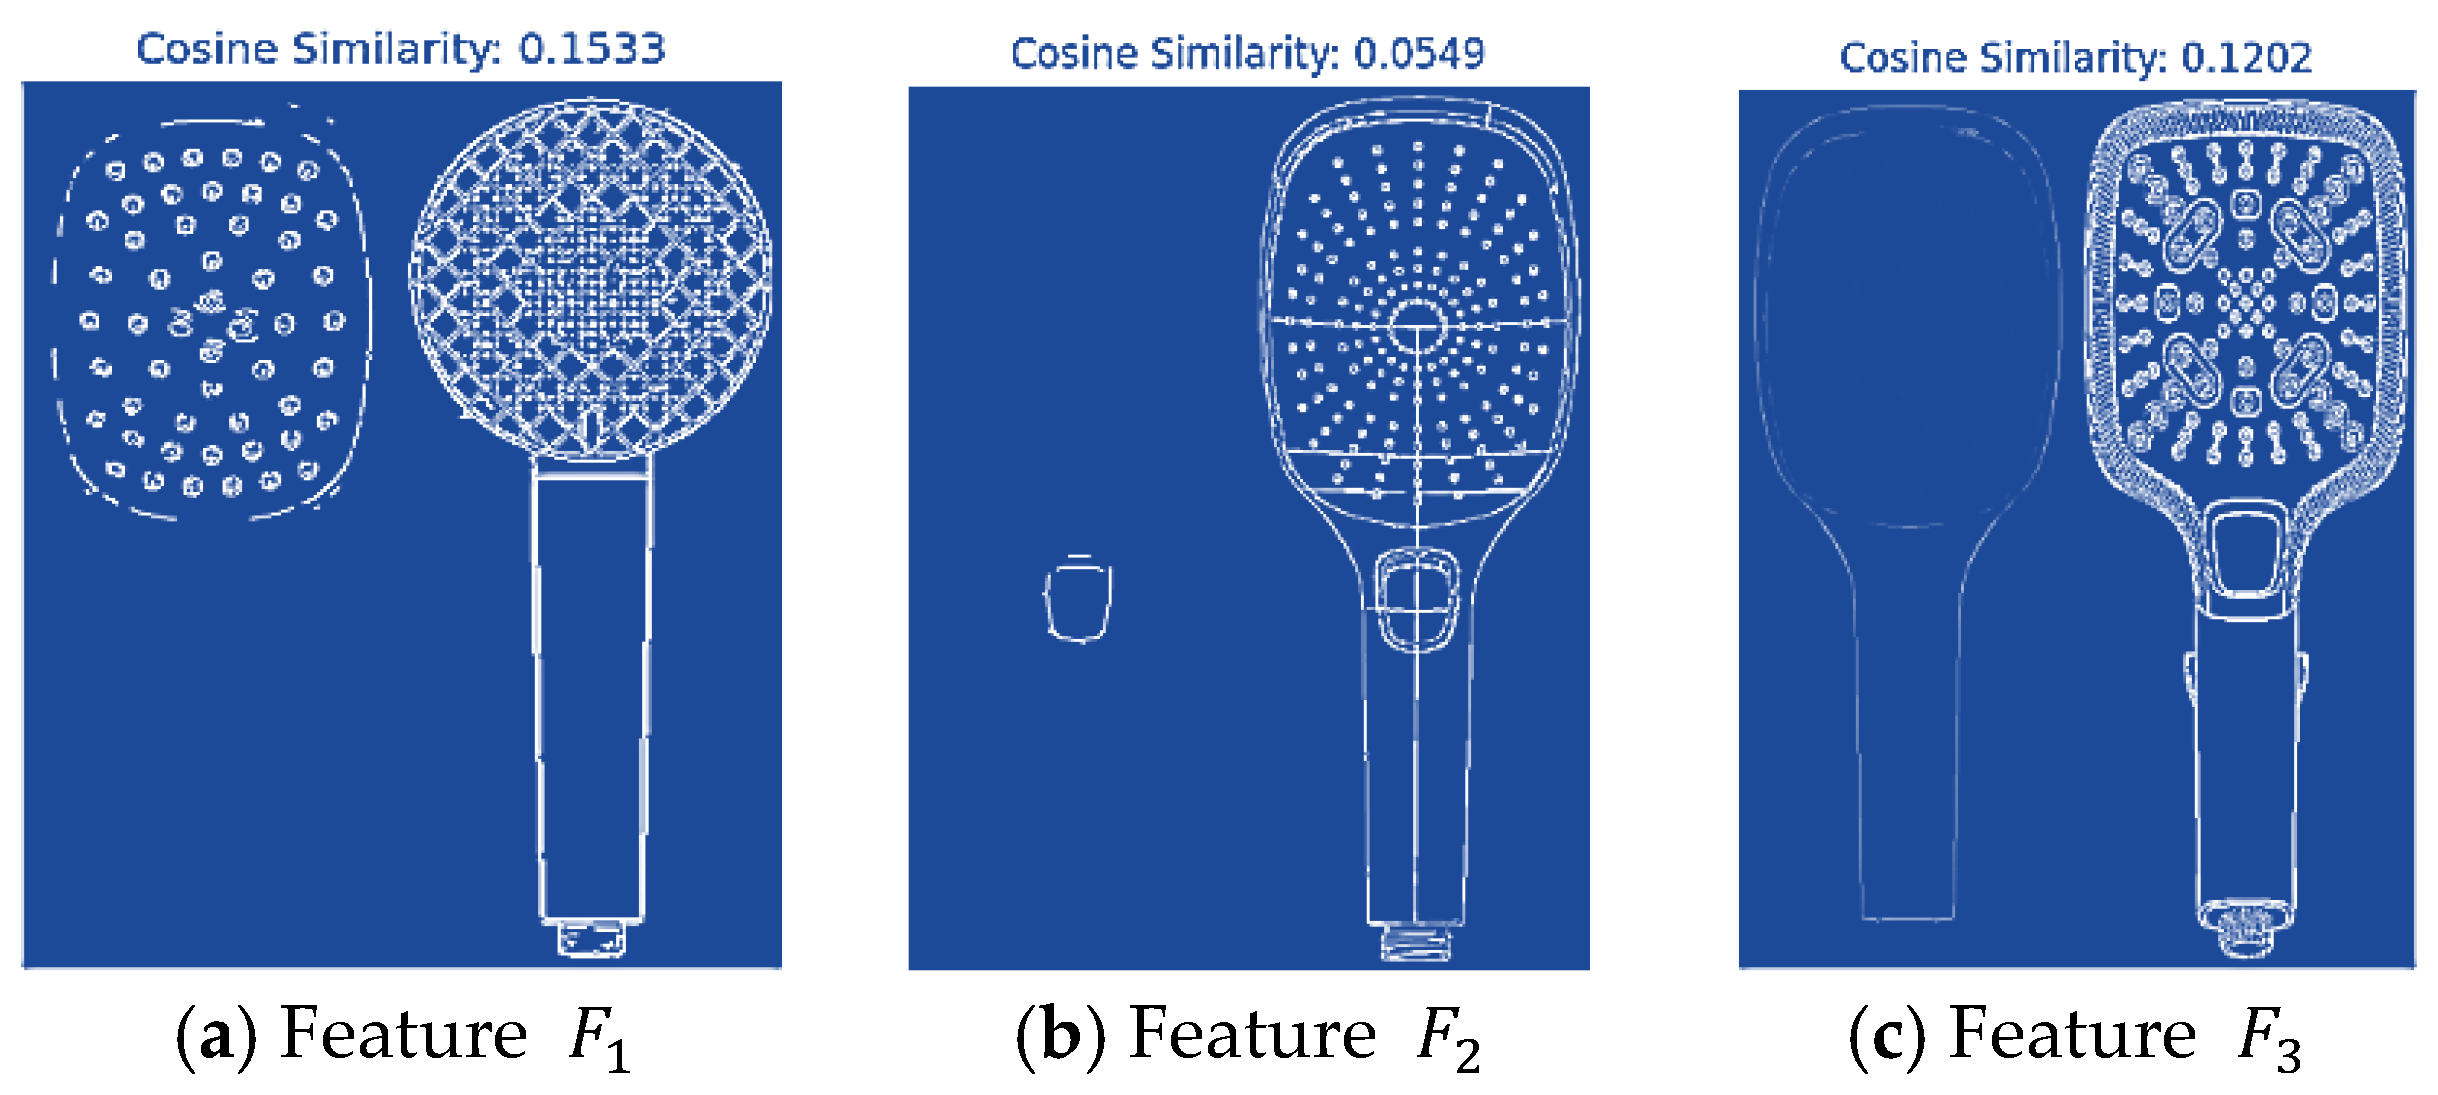
Figure 28.
Left view feature similarity results.
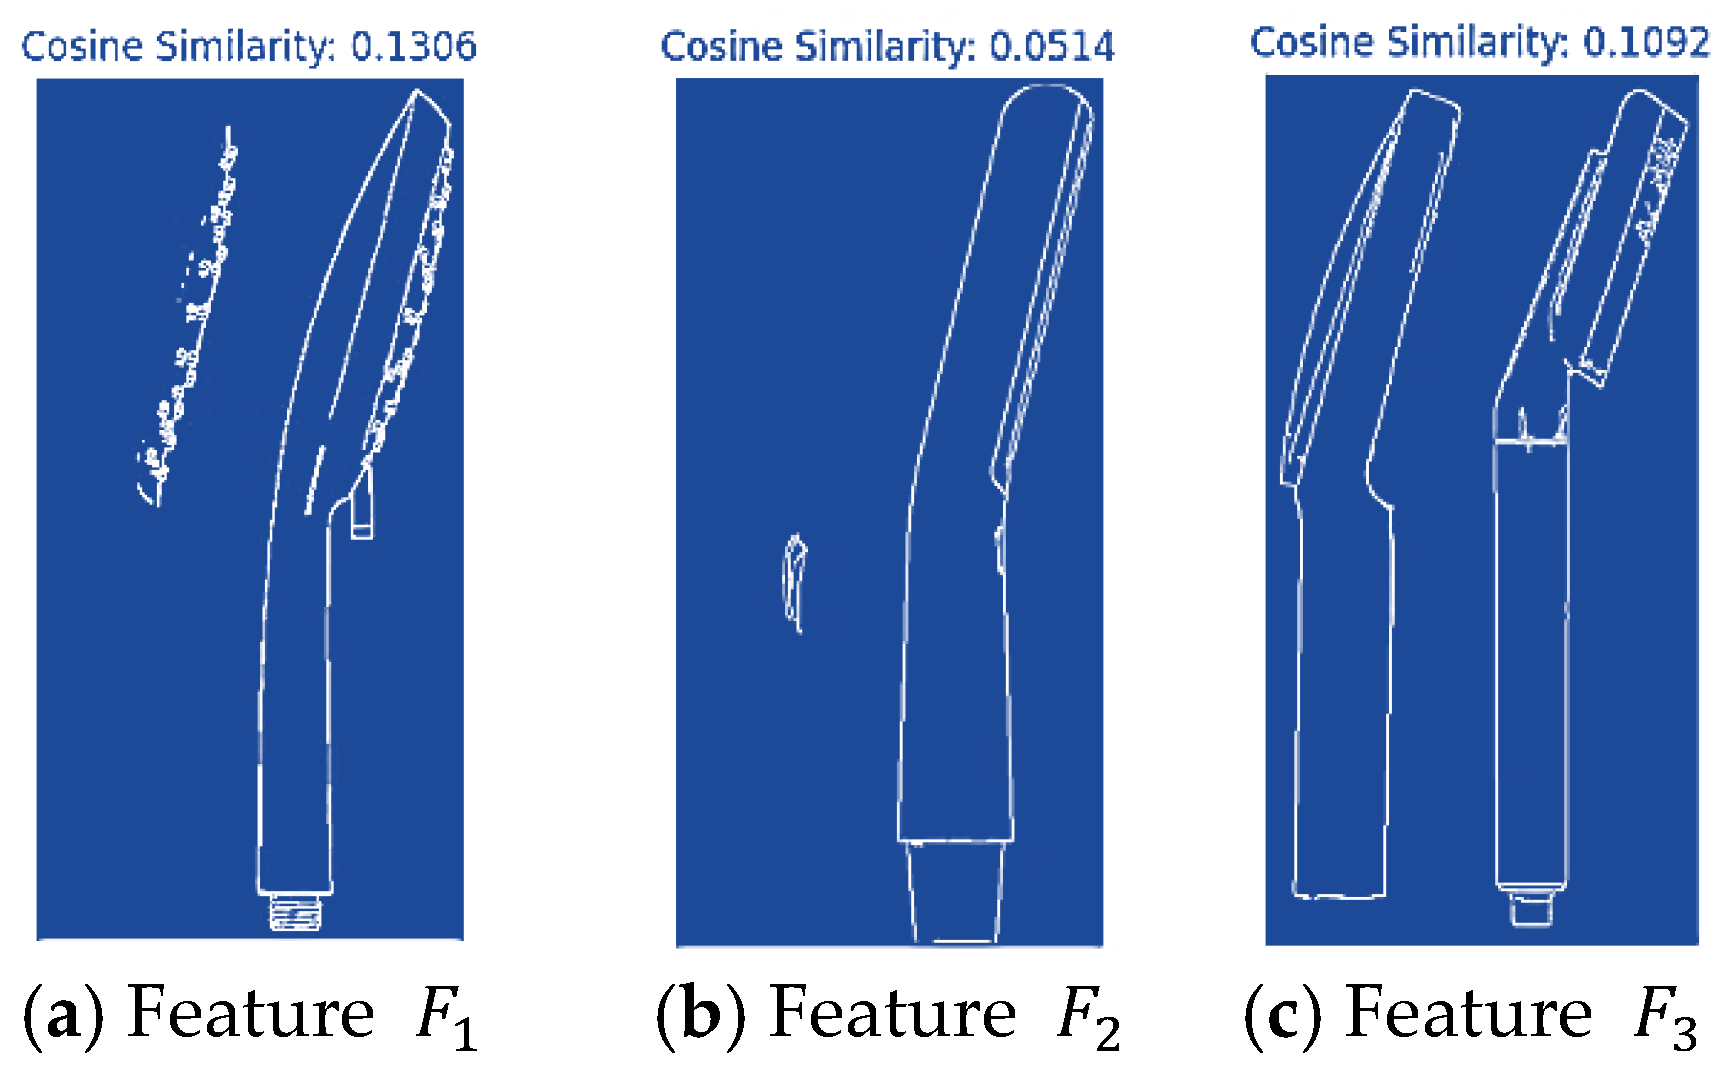
Figure 29.
Rear view feature similarity result.
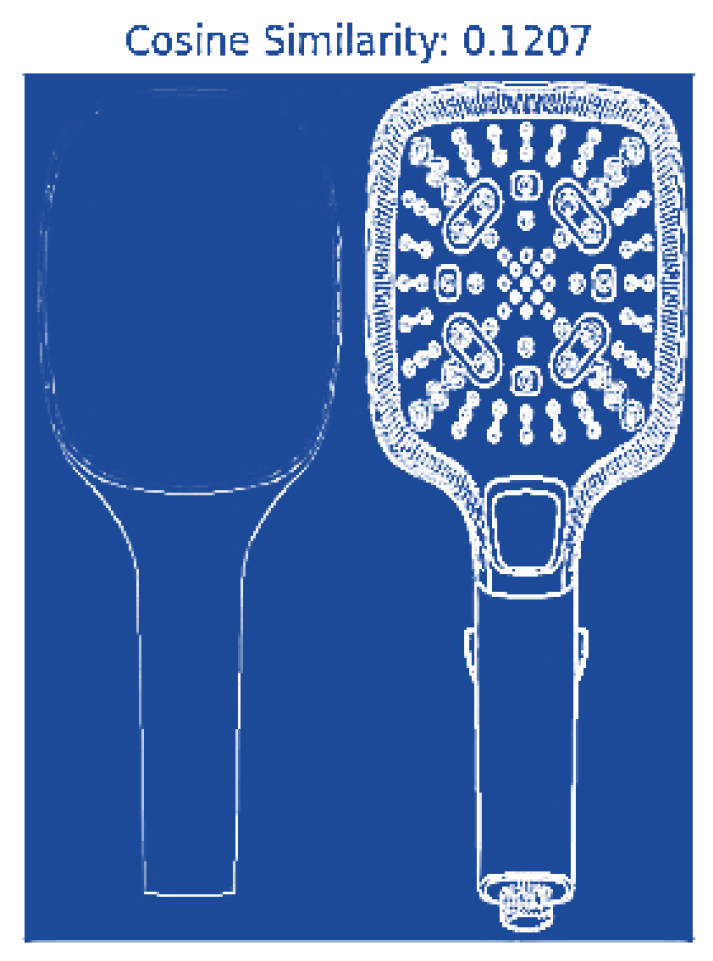
Based on the obtained feature attention values and similarity results, the core values of each product feature under different views are computed according to the defined formulation. For the main view , the core values are , , and . For the side view , the corresponding core values are , , and . In addition, since the rear view contains only the outer contour feature, only the corresponding core value is computed, yielding .
According to the computation results, , , and are selected as the representative core values for the spray panel, button, and outer contour, respectively. Among the three views, the outer contour feature in the side view exhibits the highest core value. Therefore, it can be concluded that the outer contour constitutes the core feature of this product.
6. Discussion
In this section, two representative SDP dispute cases are presented to illustrate the alignment between the outputs of the proposed method and judicial decisions. These cases are intended as practical demonstrations of how the proposed framework can support expert or judicial assessment, rather than as legal validation of the method. Final infringement determinations remain within the exclusive authority of the judiciary.
6.1. Illustrative Case Alignment with Judicial Decisions
6.1.1. Grohe AG vs. Jianlong
The representative case is the DPIA dispute between Grohe AG and China Jianlong Sanitary Ware Co., Ltd. (Case No.: (2015) Min Ti Zi No. 23) (民提字第23号)9. The views of the design patent (Application No. ZL200630113512.5) considered are shown in Figure 30, and the appearance of the accused infringing product is illustrated in Figure 31.
Figure 30.
Patented product view.
Figure 31.
The accused product alleged to infringe on the design patent.
In this case, the Supreme People’s Court of the People’s Republic of China held that the two products differed substantially in their core feature and therefore did not constitute infringement. The Court first identified the spray panel of the showerhead as the primary design feature of the patented design. It then noted that, although the accused product exhibited a high degree of similarity to the patented design in terms of the racetrack-shaped spray panel, there were significant differences in aspects that substantially affected the overall visual effect, including the peripheral design of the showerhead head and the manner in which the spray panel was separated from the surrounding head structure.
Furthermore, the Court specifically addressed the button design, stating that “the designer of the authorized design patent deliberately adopted a racetrack-shaped button at the handle position in order to visually coordinate with the racetrack-shaped spray panel, thereby enhancing the overall esthetic appearance of the product.” Finally, the Court pointed out that additional differences, such as the design of the connection area between the showerhead and the handle, also contributed to distinct overall visual impressions.
Based on these differences, the Court ultimately concluded that the two designs were neither identical nor substantially similar. This conclusion is highly consistent with the findings of our experimental results.
As shown in Figure 32, the model’s attention is primarily concentrated on the spray panel, the push button, and the contour regions around the connection between the shower handle and the head. These regions correspond closely to the features identified by the CCourt as having a significant impact on the overall visual effect. By calculating the core value as the ratio of the attention value to the similarity value (see Table 25), our method takes into account not only the presence of design features but also their significance in influencing the overall visual impression. This approach goes beyond merely considering the existence of design features and is consistent with the Court’s reasoning, which did not determine similarity solely on the basis of the highly similar “racetrack-shaped spray panel” design feature.
Figure 32.
Product stereogram attention area results.
Table 25.
Calculation results of product features.
Furthermore, our results indicate that the spray panel obtained the highest value, making it the most important feature identified by the proposed method. Notably, this was also the first feature examined by the Court in its comparative analysis. The button achieved the second-highest core value, which likewise corresponds to one of the key features specifically emphasized by the Court. These findings suggest a strong alignment between our experimental results and the Court’s interpretation of the core features in its judicial assessment.
As shown in Figure 32, the model’s attention is primarily concentrated on the spray panel, the push button, and the contour regions around the connection between the showerhead handle and the head. These regions correspond closely to the features identified by the Court as having a significant impact on the overall visual effect. In terms of attention weights, the model focuses predominantly on the spray panel and the push-button feature. The quantitative results indicate that the spray panel design is identified as the core feature, which is consistent with the Court’s conclusion that the racetrack-shaped spray panel constitutes a decisive design feature determining the product’s visual style and should be given particular emphasis in similarity assessment.
It should also be noted that the Court recognized the push-button feature as having visual influence in addition to its functional role. Using the proposed method, this feature also receives relatively high attention values in both the front and side views. This further demonstrates that the proposed approach is applicable to judicial decision-making scenarios and can provide accurate, interpretable support for DPIA.
6.1.2. Jomoo vs. Qingbai
The second representative case is the DPIA dispute between Jomoo Co., Ltd., and Qingbai Trade Department, Lin (Case No.: (2025) Chuan Zhi Min Zhong No. 33) (2025川知民终33号)10. The views of the design patent (Application No. ZL201530010726.9) considered are shown in Figure 33, and the appearance of the accused infringing product is illustrated in Figure 34.
Figure 33.
Patented product view.
Figure 34.
The accused product alleged to infringe the design patent.
In this case, the Court ruled that despite general structural similarities between the two products—both featuring a truncated conical spray face, circular water outlet zoning, and a linear handle—there were pronounced differences in the concrete shape and layout of their water outlets. The water outlets of the patent at issue were uniformly circular, whereas the accused product exhibited flame-like tails in the inner ring and multi-directional elliptical arrangements in the outer ring. To an ordinary observer of the showerhead, such variations are substantial enough to generate a noticeable distinction in the overall visual appearance, and thus, the products do not constitute similar designs.
As indicated by the Court’s reasoning, this case identified the layout and shape design of the water outlets on the spray panel as the core features. The Court held that despite similarities in the outer contour, the localized details (the morphology and arrangement of the water outlets) exert a decisive impact on the overall visual effect. This is highly consistent with our experimental results.
As listed in Table 26, the core value score of the spray panel in the design patent is the highest, indicating that it is the core feature to be compared during infringement analysis; this matches the Court’s emphasis on comparing the shower face. Furthermore, as illustrated in Figure 35, the model’s attention is primarily focused on the spray panel region (especially the position of the inner-ring water outlets). This visualization result is completely consistent with the Court’s judgment. In this judgment, the Court ruled that the two designs did not constitute similar designs, precisely because of the significant differences between the outlet shapes of the accused infringing product (flame-shaped, elliptical) and the patent at issue (circular). Specifically, the Court ruled that the two designs were not similar precisely because of the significant differences between the outlet shapes of the accused infringing product (flame-shaped, elliptical) and the patent at issue (circular).
Table 26.
Calculation results of product features.
Figure 35.
Product stereogram attention area results.
In summary, these two cases illustrate how the proposed method applies to design patent infringement disputes. In both instances, the model accurately located the core feature focused on by the courts, thereby demonstrating the practical utility and general applicability of the proposed method.
6.2. Applications and Limitations
6.2.1. Applications
Beyond design patents, the core feature identification method can also be improved to be applied in other forms of intellectual property infringement analysis involving visual data, such as image copyright, trademark rights, and integrated circuit layout design rights. For example, trademark infringement disputes frequently involve cases of similar or imitated trademarks, where effective adjudication likewise requires intelligent identification of core visual features. In this regard, the proposed core-feature-based approach provides a generalizable solution for a wide range of image-based intellectual property protection scenarios, representing another important application of this study.
In addition, with respect to contour extraction and novelty evaluation, the proposed algorithms are also applicable to general 2D image processing tasks, such as product engineering drawings. For instance, existing technical drawings can be processed to extract 2D contour information and further converted into vector representations, which not only facilitates efficient storage but also provides a convenient basis for subsequent processing and analysis.
Regarding the attention-based approach, the proposed method can be extended to machine vision applications, where core object features are identified from a contour-based perspective. This enables faster recognition while simultaneously improving recognition accuracy, thereby demonstrating the broader applicability of the method beyond design patent analysis.
6.2.2. Limitations of the Research
Although this study achieved the identification of core features of PDP, several limitations should be acknowledged. For example, the proposed method is applicable to identifying core features in design patents that only protect the shape and do not simultaneously protect color. The proposed algorithm is easily affected by color factors. At the same time, accuracy still needs further improvement, mainly focusing on similarity, which is easily influenced by noise. Only the front view, which contains relatively rich design features, was used in the similarity experiment; this is a limitation of the present study and should be addressed in future research. In addition, another concern in DPIA is the identification and distinction between functional and non-functional aspects. There is even the question of how to assist in DPIA for utility model and invention patent products. These issues are not addressed in this study, but they are research problems that the team needs to solve in the future and are currently popular directions in DPIA [67,68]. Obviously, these issues are mainly due to the algorithm and the database. In the future, other types of algorithms, such as joint neural network algorithms, large models, and knowledge graph tools, will be considered to carry out the identification of other types of features. At the same time, the design patent database will be further enriched to avoid missing patents and will be updated in real time to ensure the timeliness of the infringement judgment database.
7. Conclusions
To overcome the strong subjectivity and low efficiency of traditional judgments based on manual experience, and to achieve accurate identification of core features, this paper proposes a method that integrates convolutional neural networks with the attention mechanism, combined with similarity algorithms, to identify core features. This method represents researchers’ attempt to use machine vision algorithms to identify the core features of design patents, demonstrating significant innovation. The method is thoroughly explained from both legal and machine learning perspectives, showing clear rationality. Meanwhile, through experimental verification and illustration of specific judicial cases, the algorithm achieves high accuracy and EEP in the calculation of similarity, attention values, and core features, effectively assisting in the identification of core features in existing DPIA cases. The research significance of this method is mainly reflected in two aspects: on one hand, it can provide a quantitative basis for courts to make judgments on PDP infringement, avoiding excessive reliance on subjective experience, which has good practical significance; on the other hand, the method used in this study also provides an auxiliary analytical tool for intelligent judgment research in other patent infringement cases, as well as other types of cases, representing significant theoretical research value. In addition, in today’s era of rapid development of artificial intelligence technology, this study responds to the AI development policies proposed by governments, especially the Chinese government, further enriching AI applications and optimizing AI, particularly machine vision algorithms, and has received attention and funding from relevant departments.
Author Contributions
Conceptualization, S.Z., L.X. and R.X.; methodology, W.L.; software, W.L. and L.X.; validation, W.L.; formal analysis, S.Z. and W.L.; investigation, S.Z. and W.L.; resources, W.L.; data curation, L.X.; writing—original draft preparation, S.Z., W.L. and L.X.; writing—review and editing, W.L. and S.Z.; visualization, W.L. and L.X.; supervision, S.Z., R.X. and W.L.; project administration, S.Z., W.L. and R.X.; funding acquisition, S.Z., W.L. and R.X. All authors have read and agreed to the published version of the manuscript.
Funding
This work was supported by the National Natural Science Foundation of China under grant No. 52275249 and the Social Science Foundation of Fujian Province under grant No. FJ2026B066.
Informed Consent Statement
Informed consent for participation was obtained from all subjects involved in the study.
Data Availability Statement
The dataset has been uploaded to Baidu Cloud (website: https://pan.baidu.com/s/1qdkcBXtmlbpfTTWHEyqAbQ?pwd=c2xy (accessed on 29 July 2026), password: c2xy).
Conflicts of Interest
The authors declare no conflicts of interest.
Notes
| 1 | https://wenshu.court.gov.cn (accessed on 23 March 2026). |
| 2 | http://gongbao.court.gov.cn/Details/4b8770fa8e9ced993f7a4b2edffeb8.html (accessed on 23 March 2026). |
| 3 | https://www.cnipa.gov.cn (accessed on 23 March 2026). |
| 4 | https://www.uspto.gov/patents/basics/apply/design-patent (accessed on 23 March 2026). |
| 5 | https://www.eurojust.europa.eu/ (accessed on 23 March 2026). |
| 6 | www.Patsnap.com (accessed on 23 March 2026). |
| 7 | https://www.wjx.top/vm/PpzuWzq.aspx# (accessed on 23 March 2026). |
| 8 | https://www.qcc.com/ (accessed on 23 March 2026). |
| 9 | http://gongbao.court.gov.cn/Details/4b0b154976855a7e9a18b6a33bf4ec.html (accessed on 23 March 2026). |
| 10 | https://wenshu.court.gov.cn (accessed on 8 June 2026). |
References
- Creusen, M.E.H.; Schoormans, J.P.L. The different roles of product appearance in consumer choice. J. Prod. Innov. Manag. 2005, 22, 63–81. [Google Scholar]
- Hu, H.; Liu, Y.; Lu, W.F.; Guo, X. A quantitative aesthetic measurement method for product appearance design. Adv. Eng. Inform. 2022, 53, 101644. [Google Scholar] [CrossRef] [Scilit]
- Zeng, S.; Wang, T.; Lin, W.; Chen, Z.; Xiao, R. A Patent Mining Approach to Accurately Identifying Innovative Industrial Clusters Based on the Multivariate DBSCAN Algorithm. Systems 2024, 12, 321. [Google Scholar] [CrossRef] [Scilit]
- Bartholomew, M. Nonobvious design. SSRN Electron. J. 2022, 108, 601–649. [Google Scholar]
- Fackrell, S. Uncreative designs. Duke Law J. 2024, 73, 1437. [Google Scholar]
- Villata, S.; Araszkiewicz, M.; Ashley, K.; Bench-Capon, T.; Branting, L.K.; Conrad, J.G.; Wyner, A. Thirty years of artificial intelligence and law: The third decade. Artif. Intell. Law 2022, 30, 561–591. [Google Scholar] [CrossRef] [Scilit]
- Buccafusco, C.; Lemley, M.A. Screening functionality. Va. Law Rev. 2016, 103, 1293–1378. [Google Scholar]
- Buccafusco, C.; Lemley, M.A.; Masur, J.S. Intelligent design. Duke Law J. 2017, 68, 75. [Google Scholar]
- Kielar, S.E. Loosening the grasp of restriction by allowing multiple claims in design patents. Buffalo Law Rev. 2020, 68, 1169–1213. [Google Scholar]
- Merrill, J.D. Leveraging Design Patents and the Japanese Design Act to Expand a Global IP Portfolio; Harter Secrest Emery LLP: Rochester, NY, USA, 2024. [Google Scholar]
- Bahdanau, D.; Cho, K.; Bengio, Y. Neural machine translation by jointly learning to align and translate. arXiv 2014, arXiv:1409.0473. [Google Scholar]
- Xu, K.; Ba, J.; Kiros, R.; Cho, K.; Courville, A.; Salakhudinov, R.; Zemel, R.; Bengio, Y. Show, attend and tell: Neural image caption generation with visual attention. In Proceedings of the 32nd International Conference on Machine Learning, Lille, France, 6–11 July 2015; pp. 2048–2057. [Google Scholar]
- Vaswani, A.; Shazeer, N.; Parmar, N.; Uszkoreit, J.; Jones, L.; Gomez, A.N.; Kaiser, Ł.; Polosukhin, I. Attention is all you need. In Advances in Neural Information Processing Systems 30; Curran Associates, Inc.: Red Hook, NY, USA, 2017. [Google Scholar]
- Wang, F.; Jiang, M.; Qian, C.; Yang, S.; Li, C.; Zhang, H.; Wang, X.; Tang, X. Residual attention network for image classification. In Proceedings of the IEEE Conference on Computer Vision and Pattern Recognition; IEEE: Piscataway, NJ, USA, 2017; pp. 3156–3164. [Google Scholar]
- Zhang, H.; Zhao, Z.; Yang, J. Attention-based prohibited item detection in X-ray images during security checking. IET Image Process. 2024, 18, 1119–1131. [Google Scholar] [CrossRef] [Scilit]
- Ji, X.; Tang, L.; Chen, L.; Hao, L.Y.; Guo, H. Toward efficient and lightweight sea–land segmentation for remote sensing images. Eng. Appl. Artif. Intell. 2024, 135, 108782. [Google Scholar] [CrossRef] [Scilit]
- Ye, Y.; Zhou, H.; Yu, H.; Hu, H.; Zhang, G.; Hu, J.; He, T. Application of Tswin-F network based on multi-scale feature fusion in tomato leaf lesion recognition. Pattern Recognit. 2024, 156, 110775. [Google Scholar] [CrossRef] [Scilit]
- Chen, W.; Miao, Z.; Qu, Y.; Shi, G. HRDLNet: A semantic segmentation network with high-resolution representation for urban street view images. Complex Intell. Syst. 2024, 10, 7825–7844. [Google Scholar] [CrossRef] [Scilit]
- Wu, K.; Sun, S.; Sun, Y.; Wang, C.; Wei, Y. RBS-YOLO: A lightweight YOLOv5-based surface defect detection model for castings. IET Image Process. 2025, 19, e70018. [Google Scholar] [CrossRef] [Scilit]
- Fayaz, M.; Dang, L.M.; Moon, H. DLAN: A dual attention network for effective land cover classification in remote sensing. Knowl.-Based Syst. 2025, 319, 113620. [Google Scholar] [CrossRef] [Scilit]
- Li, W.; Muhammat, M.; Xu, X.; Aysa, A.; Ubul, K. Multi-scale CNN-CrossViT network for offline handwritten signature recognition and verification. Complex Intell. Syst. 2025, 11, 400. [Google Scholar] [CrossRef] [Scilit]
- Shi, Y.; Li, F.; Zhao, S.; Yu, H.; Chen, X.; Liu, Q. IAP-TransUNet: Integration of the attention mechanism and pyramid pooling for medical image segmentation. Front. Neurorobotics 2025, 19, 1706626. [Google Scholar] [CrossRef] [Scilit] [PubMed]
- Zhao, Q.; Wu, R.; Chen, M.; Tsui, K.-L.; Zhao, Y. MIEF-Net: Multimodal image-enhanced fusion network for intelligent fall risk prediction. Neural Netw. 2025, 195, 108260. [Google Scholar] [PubMed]
- Su, J.; Liang, J.; Zhu, J.; Li, Y.J.S. HCAM-CL: A novel method integrating a hierarchical cross-attention mechanism with CNN-LSTM for hierarchical image classification. Symmetry 2024, 16, 1231. [Google Scholar] [CrossRef] [Scilit]
- Bhatti, N.; Hanbury, A. Image search in patents: A review. Int. J. Doc. Anal. Recognit. 2013, 16, 309–329. [Google Scholar]
- Rusiñol, M.; de las Heras, L.P.; Terrades, O.R. Flowchart recognition for non-textual information retrieval in patent search. Inf. Retr. 2014, 17, 545–562. [Google Scholar]
- Chen, J.; Li, M.; Jin, Q.; Bao, S.; Su, Z.; Yu, Y. Lead curve detection in drawings with complex cross-points. Neurocomputing 2015, 168, 35–46. [Google Scholar] [CrossRef] [Scilit]
- Riedl, C.; Zanibbi, R.; Hearst, M.A.; Zhu, S.; Menietti, M.; Crusan, J.; Metelsky, I.; Lakhani, K.R. Detecting figures and part labels in patents. Int. J. Doc. Anal. Recognit. 2016, 19, 155–172. [Google Scholar] [CrossRef] [Scilit]
- Lin, Z.C.; Wu, D.W.; Hong, G.E. Combination of improved cosine similarity and patent attribution probability method. Adv. Eng. Inform. 2016, 30, 26–38. [Google Scholar] [CrossRef] [Scilit]
- Bhatti, N.; Hanbury, A.; Stottinger, J. Contextual local primitives for binary patent image retrieval. Multimed. Tools Appl. 2018, 77, 9111–9151. [Google Scholar]
- Trappey, A.J.C.; Trappey, C.V.; Shih, S. An intelligent content-based image retrieval methodology using transfer learning for digital IP protection. Adv. Eng. Inf. 2021, 48, 101291. [Google Scholar] [CrossRef] [Scilit]
- Jiang, S.; Luo, J.; Ruiz-Pava, G.; Hu, J.; Magee, C.L. Deriving design feature vectors for patent images using convolutional neural networks. J. Mech. Des. 2021, 143, 061405. [Google Scholar] [CrossRef] [Scilit]
- Li, M.; Li, H. Application of deep convolutional neural network under region proposal network in patent graphic recognition and retrieval. IEEE Access 2021, 10, 37829–37838. [Google Scholar]
- Trappey, A.J.C.; Trappey, C.V.; Lin, E. Intelligent trademark recognition and similarity analysis using a two-stage transfer learning approach. Adv. Eng. Inform. 2022, 52, 101567. [Google Scholar] [CrossRef] [Scilit]
- Zhang, L.; Gao, Q.; Liu, M.; Gu, Z.; Lang, B. Measuring similarity of dual-modal academic data based on multi-fusion representation learning. IEEE Access 2024, 12, 97701–97711. [Google Scholar] [CrossRef] [Scilit]
- Jing, L.; Zhou, C.; Feng, D.; Dou, Y.; Fan, X.; Jiang, S. A patent infringement analysis approach based on patent knowledge graph driven fusion of graph and image similarity. IEEE Access 2025, 13, 29944–29968. [Google Scholar] [CrossRef] [Scilit]
- Kim, H.; Gim, G. Enhancing patent document similarity evaluation and classification precision through a multimodal AI approach. Appl. Sci. 2025, 15, 9254. [Google Scholar] [CrossRef] [Scilit]
- Xie, X.; Wu, J.; Xiang, M.; Tang, J.; Sheng, Y. Enhancing the efficiency of patent classification: A multimodal classification approach for design patents. J. King Saud. Univ. Comput. Inf. Sci. 2025, 37, 183. [Google Scholar] [CrossRef] [Scilit]
- Kavimandan, K.; Nalmpantis, A.; Beauxis-Aussalet, E.; Sips, R.-J. Hierarchical multi-positive contrastive learning for patent image retrieval. arXiv 2025, arXiv:2506.13496. [Google Scholar]
- Amoncio, E.; Chan, T.; Storz, C. Using computer vision to measure design similarity: An application to design rights. Res. Policy 2025, 54, 105309. [Google Scholar] [CrossRef] [Scilit]
- Lin, Y.H.; Hung, M.C.; Lee, C.F. Density-refine: Patent image retrieval by density-based region extraction and feature fusion. J. Mech. Des. 2025, 147, 081703. [Google Scholar] [CrossRef] [Scilit]
- Lin, W.; Yu, W.; Xiao, R. Measuring patent similarity based on text mining and image recognition. Systems 2023, 11, 294. [Google Scholar] [CrossRef] [Scilit]
- Adhikari, N.S.; Agarwal, S. A comparative study of PDF parsing tools across diverse document categories. arXiv 2024, arXiv:2410.09871. [Google Scholar]
- Jing, J.; Liu, S.; Wang, G.; Zhang, W.; Sun, C. Recent advances on image edge detection: A comprehensive review. Neurocomputing 2022, 503, 259–271. [Google Scholar] [CrossRef] [Scilit]
- Senel, H.G. Gradient estimation using wide support operators. IEEE Trans. Image Process. 2009, 18, 867–878. [Google Scholar] [CrossRef] [Scilit] [PubMed]
- Muntarina, K.; Mostafiz, R.; Khanom, F.; Shorif, S.B.; Uddin, M.S. MultiResEdge: A deep learning-based edge detection approach. Intell. Syst. Appl. 2023, 20, 200274. [Google Scholar] [CrossRef] [Scilit]
- Xu, Q.; Varadarajan, S.; Chakrabarti, C.; Karam, L.J. A distributed Canny edge detector: Algorithm and FPGA implementation. IEEE Trans. Image Process. 2014, 23, 2944–2960. [Google Scholar] [CrossRef] [Scilit] [PubMed]
- Saravanan, C. Color image to grayscale image conversion. In Proceedings of the Second International Conference on Computer Engineering and Applications, Bali Island, Indonesia, 19–21 March 2010; pp. 196–199. [Google Scholar]
- He, K.; Zhang, X.; Ren, S.; Sun, J. Deep residual learning for image recognition. In Proceedings of the IEEE Conference on Computer Vision and Pattern Recognition, Las Vegas, NV, USA, 27–30 June 2016; pp. 770–778. [Google Scholar]
- Dai, P.; Zhang, S.; Zhang, H.; Cao, X. Progressive contour regression for arbitrary-shape scene text detection. In Proceedings of the IEEE/CVF Conference on Computer Vision and Pattern Recognition; IEEE: Piscataway, NJ, USA, 2021; pp. 7393–7402. [Google Scholar]
- Heinke, D.; Wachman, P.; van Zoest, W.; Leek, E.C. A failure to learn object shape geometry: Implications for convolutional neural networks as plausible models of biological vision. Vis. Res. 2021, 189, 81–92. [Google Scholar] [CrossRef] [Scilit] [PubMed]
- Guo, M.H.; Xu, T.X.; Liu, J.J.; Liu, Z.N.; Jiang, P.T.; Mu, T.J.; Zhang, S.H.; Martin, R.R.; Cheng, M.M.; Hu, S.M. Attention mechanisms in computer vision: A survey. Comput. Vis. Media 2022, 8, 331–368. [Google Scholar] [CrossRef] [Scilit]
- Woo, S.; Park, J.; Lee, J.Y.; Kweon, I.S. CBAM: Convolutional block attention module. In Proceedings of the European Conference on Computer Vision, Munich, Germany, 8–14 September 2018; pp. 3–19. [Google Scholar]
- Cheng, Y.; Guan, R.; Zhou, S.; Zhou, X.; Xue, J.; Zhai, W. Research on tool wear and breakage state recognition based on ResNet-CBAM. Measurement 2025, 242, 116105. [Google Scholar] [CrossRef] [Scilit]
- Ma, J.; Jiang, X.; Fan, A.; Jiang, J.; Yan, J. Image matching from handcrafted to deep features: A survey. Int. J. Comput. Vis. 2021, 129, 23–79. [Google Scholar] [CrossRef] [Scilit]
- Simonyan, K.; Zisserman, A. Very deep convolutional networks for large-scale image recognition. arXiv 2014, arXiv:1409.1556. [Google Scholar]
- Zhuang, F.; Qi, Z.; Duan, K.; Xi, D.; Zhu, Y.; Zhu, H.; Xiong, H.; He, Q. A comprehensive survey on transfer learning. Proc. IEEE 2020, 109, 43–76. [Google Scholar] [CrossRef] [Scilit]
- Deng, J.; Dong, W.; Socher, R.; Li, L.J.; Li, K.; Fei-Fei, L. ImageNet: A large-scale hierarchical image database. In Proceedings of the IEEE Conference on Computer Vision and Pattern Recognition; IEEE: Piscataway, NJ, USA, 2009; pp. 248–255. [Google Scholar]
- Wang, X.; Yue, Q.; Liu, X. SBDNet: A deep learning-based method for the segmentation and quantification of fatigue cracks in steel bridges. Adv. Eng. Inf. 2025, 65, 103186. [Google Scholar] [CrossRef] [Scilit]
- Shiri, F.M.; Perumal, T.; Mustapha, N.; Mohamed, R. A comprehensive overview and comparative analysis on deep learning models: CNN, RNN, LSTM, GRU. arXiv 2025, arXiv:2305.17473. [Google Scholar]
- Bhattacharjee, A.; Murugan, R.; Goel, T.; Mirjalili, S. Pulmonary nodule segmentation framework based on fine-tuned and pretrained deep neural networks using CT images. IEEE Trans. Radiat. Plasma Med. Sci. 2023, 7, 394–409. [Google Scholar] [CrossRef] [Scilit]
- Huang, J.; Ling, C.X. Using AUC and accuracy in evaluating learning algorithms. IEEE Trans. Knowl. Data Eng. 2005, 17, 299–310. [Google Scholar] [CrossRef] [Scilit]
- Jakhar, Y.; Borah, M.D. Effective near-duplicate image detection using perceptual hashing and deep learning. Inf. Process. Manag. 2025, 62, 104086. [Google Scholar] [CrossRef] [Scilit]
- Pang, J.; Ju, W.; Welch, M.; Gauger, P.; Liu, P.; Zhang, Q.; Wang, C. Nonparametric bootstrap methods for interval estimation of the area under the ROC curve with correlated diagnostic test data: Application to whole-virus ELISA testing in swine. Front. Vet. Sci. 2023, 10, 1274786. [Google Scholar] [CrossRef] [Scilit] [PubMed]
- Aljalal, M.; Aldosari, S.A.; Molinas, M.; Alturki, F.A. Selecting EEG channels and features using multi-objective optimization for accurate MCI detection: Validation using leave-one-subject-out strategy. Sci. Rep. 2024, 14, 12483. [Google Scholar] [CrossRef] [Scilit] [PubMed]
- Parker, B.J.; Günter, S.; Bedo, J. Stratification bias in low signal microarray studies. BMC Bioinform. 2007, 8, 326. [Google Scholar] [CrossRef] [Scilit] [PubMed]
- Saidman, P.J. The Demise of the Functionality Doctrine in Design Patent Law. Notre Dame Law Rev. 2017, 92, 1471. [Google Scholar]
- Zhang, C.; Meng, Y. Bridging the divide: Technical research and application on legal judgment prediction. Artif. Intell. Law 2025, 1–32. [Google Scholar] [CrossRef] [Scilit]
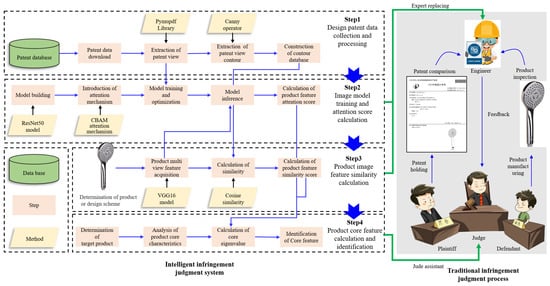
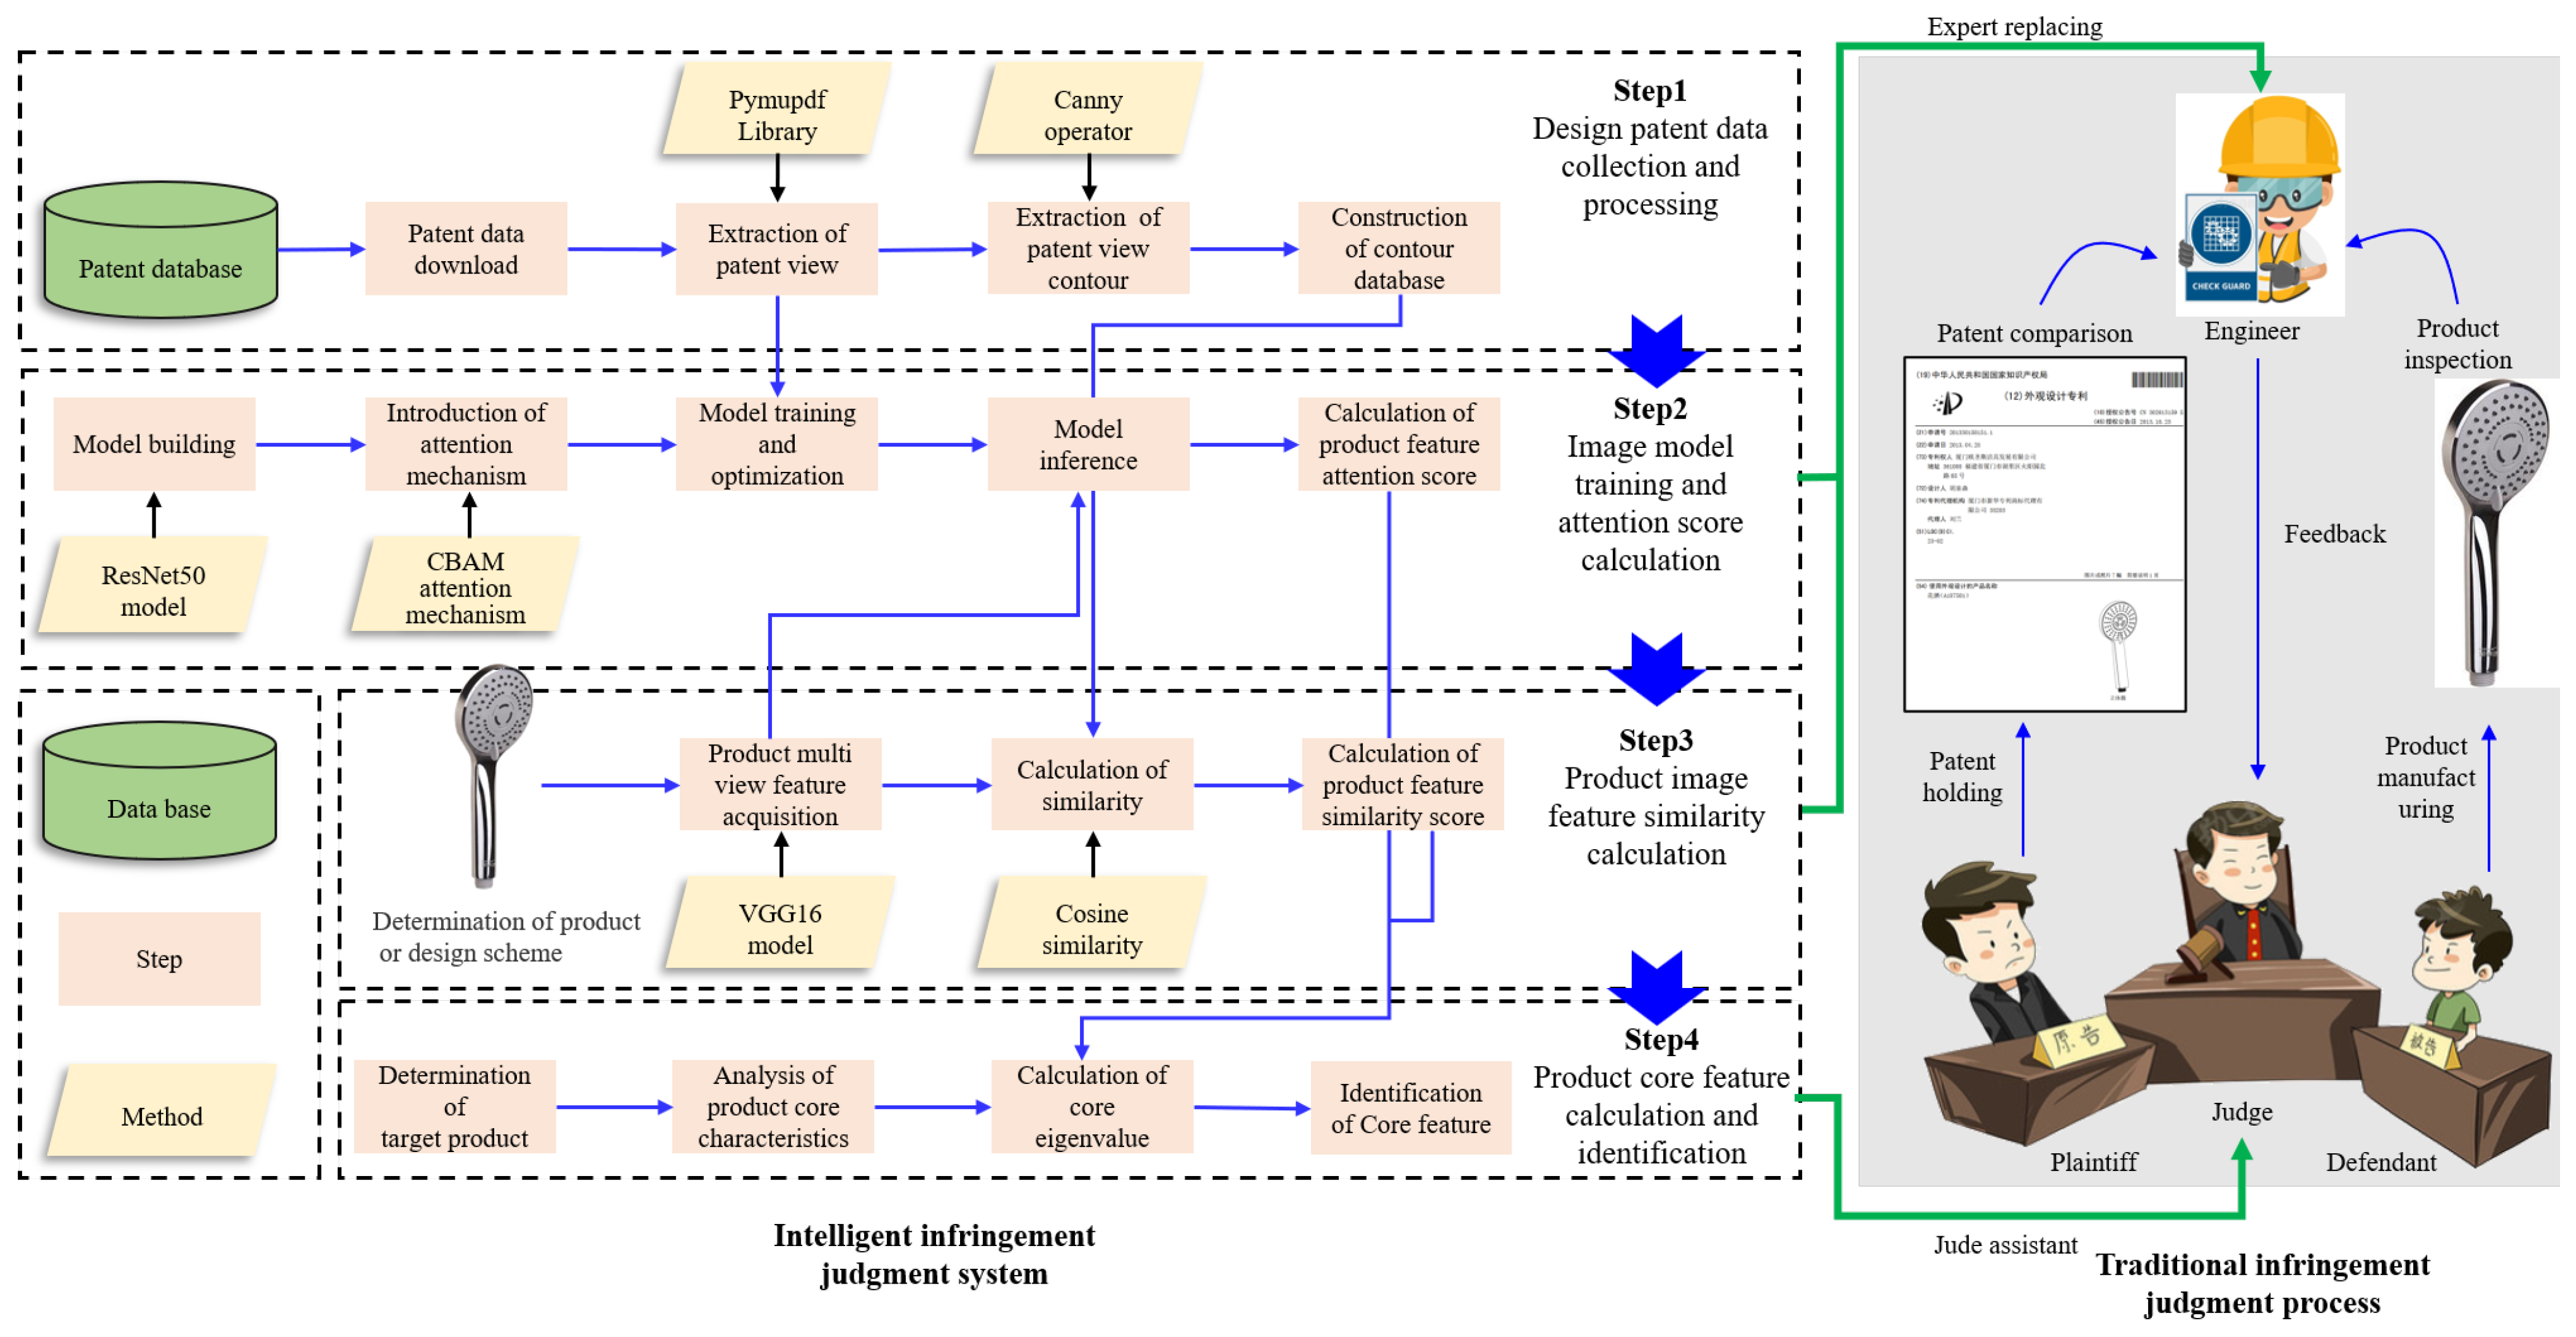
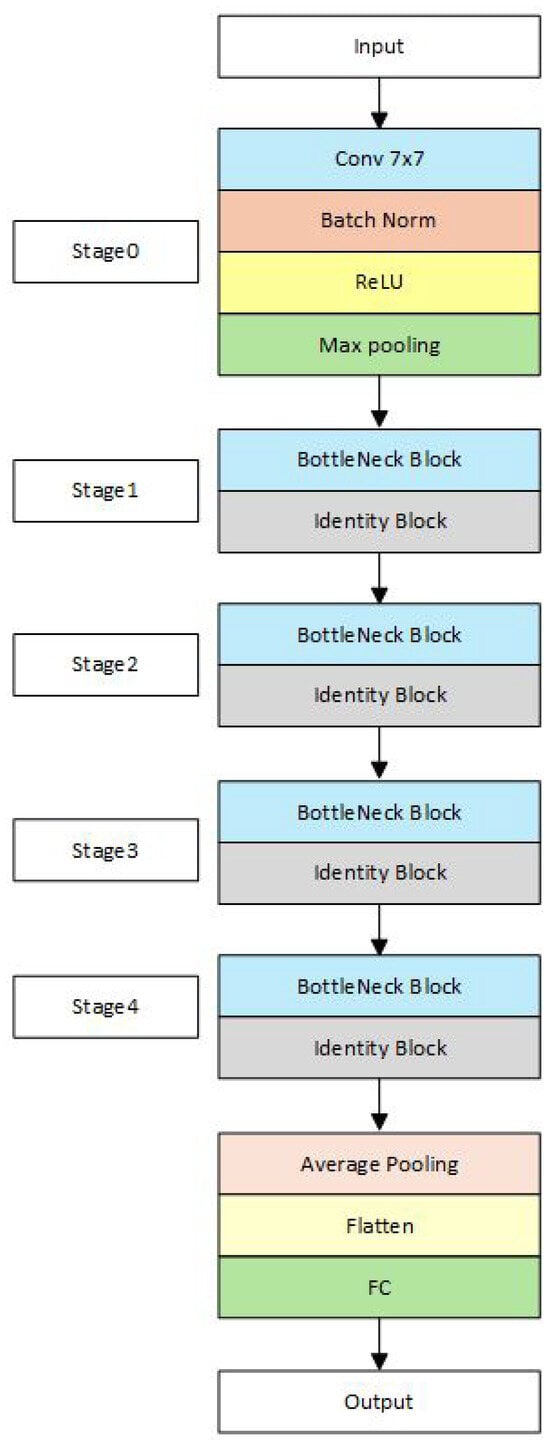
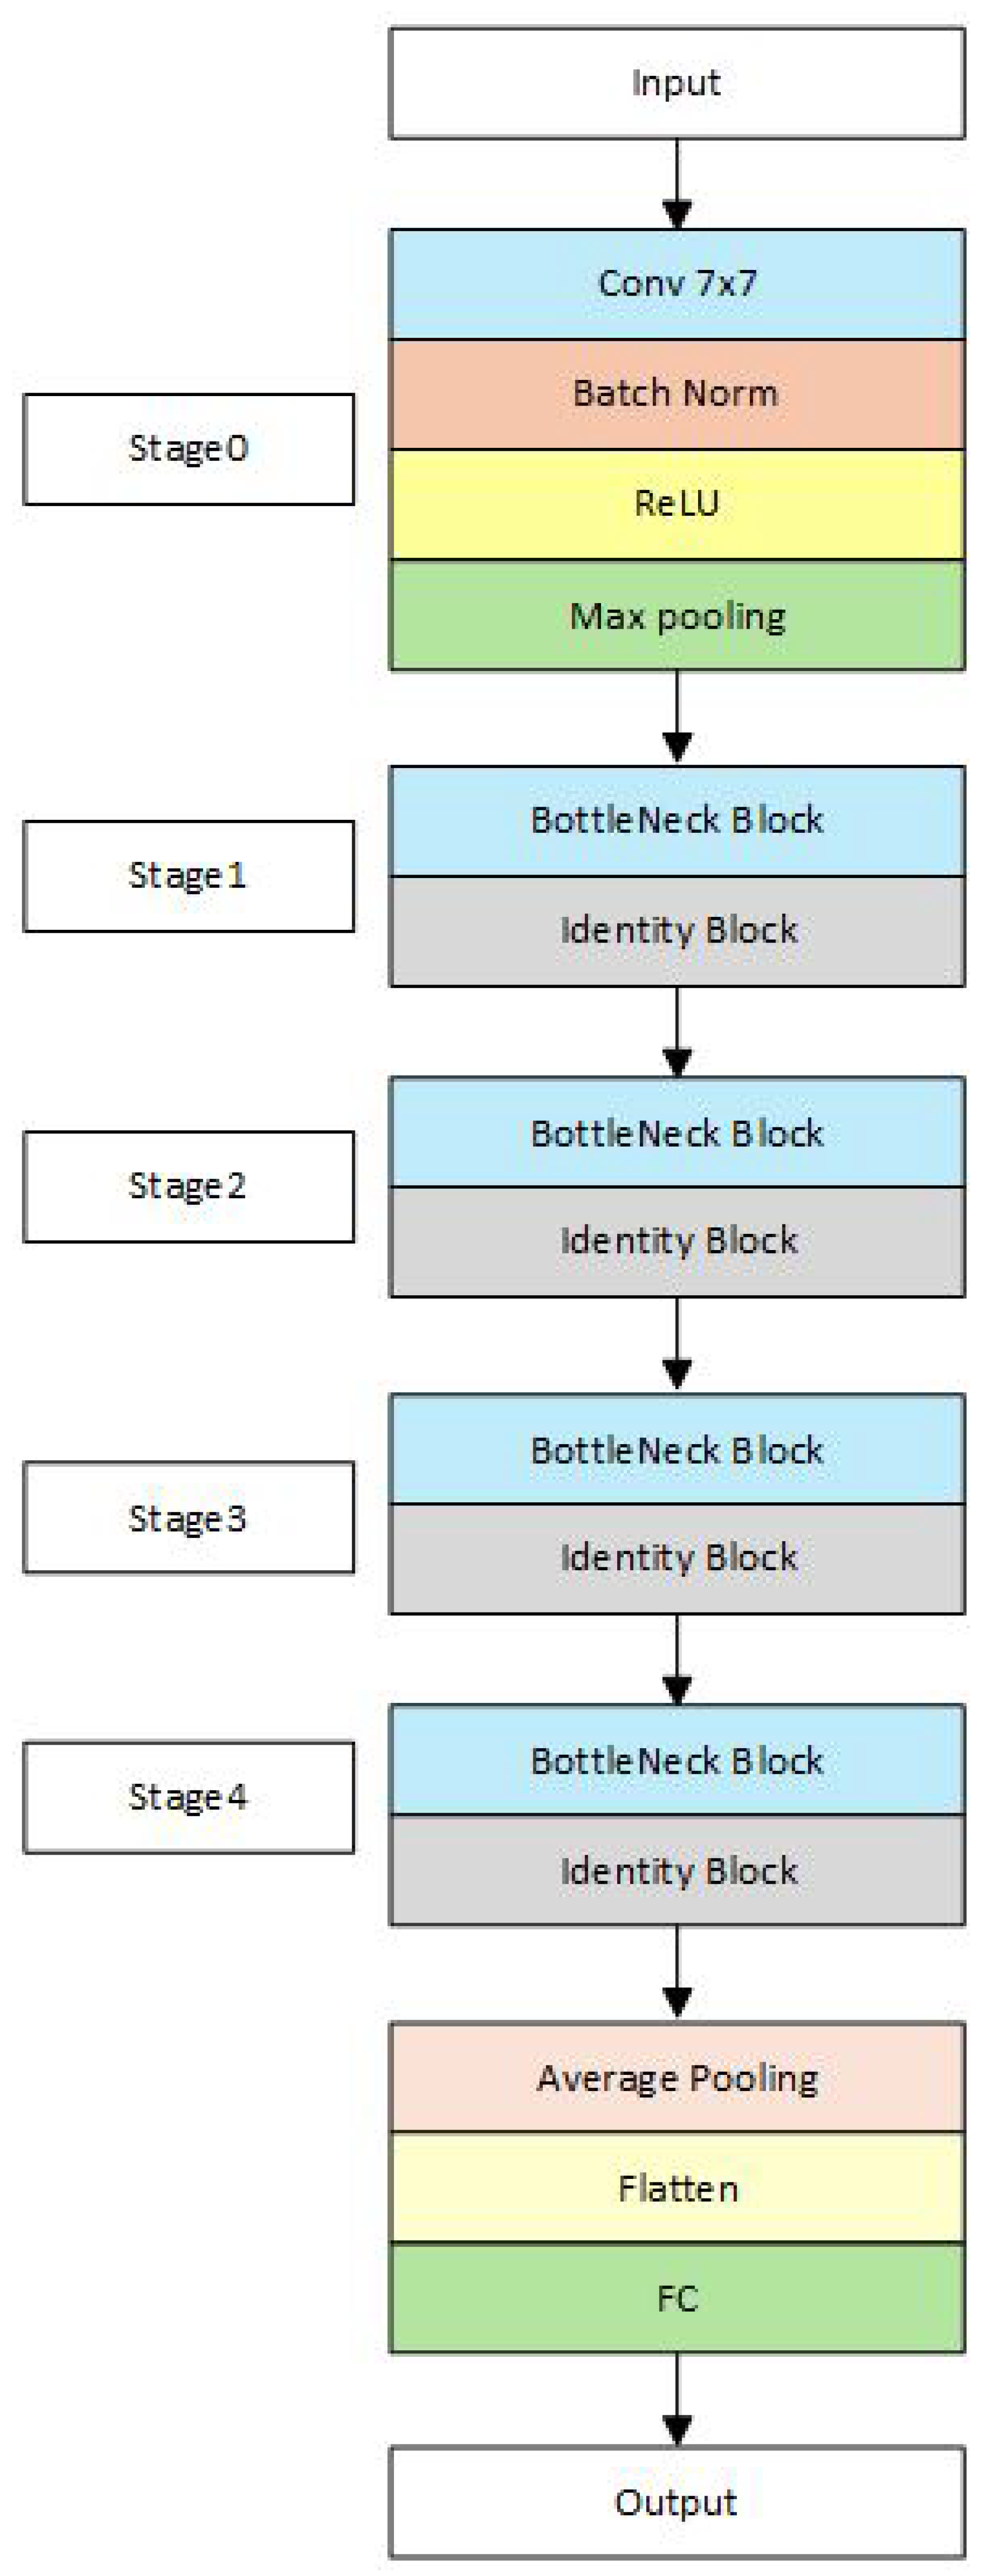
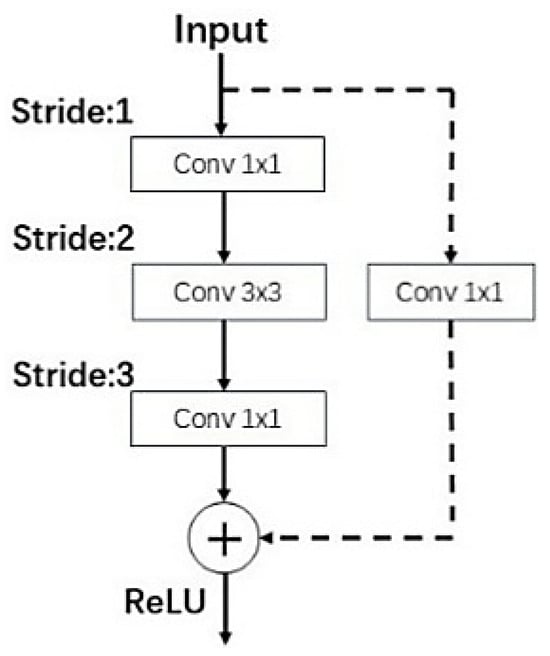
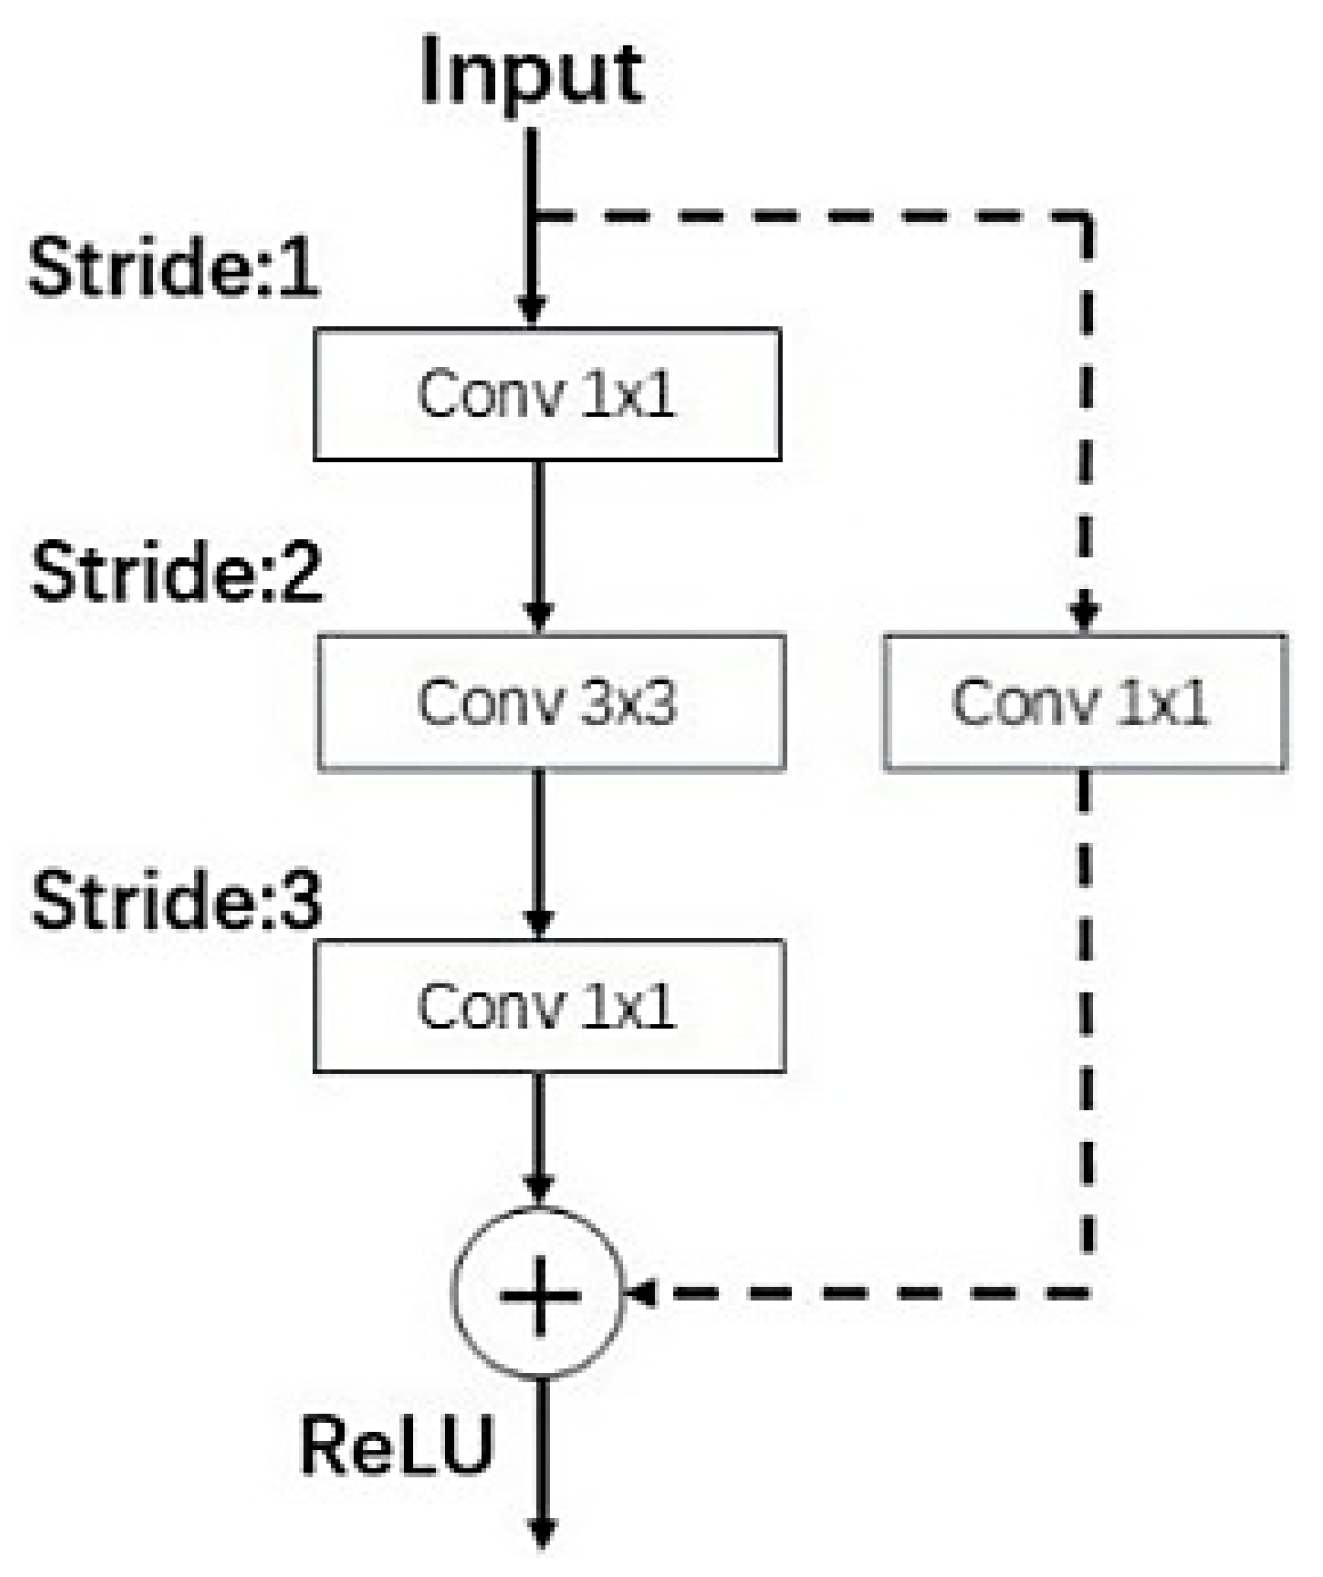
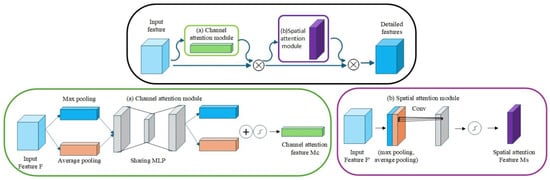
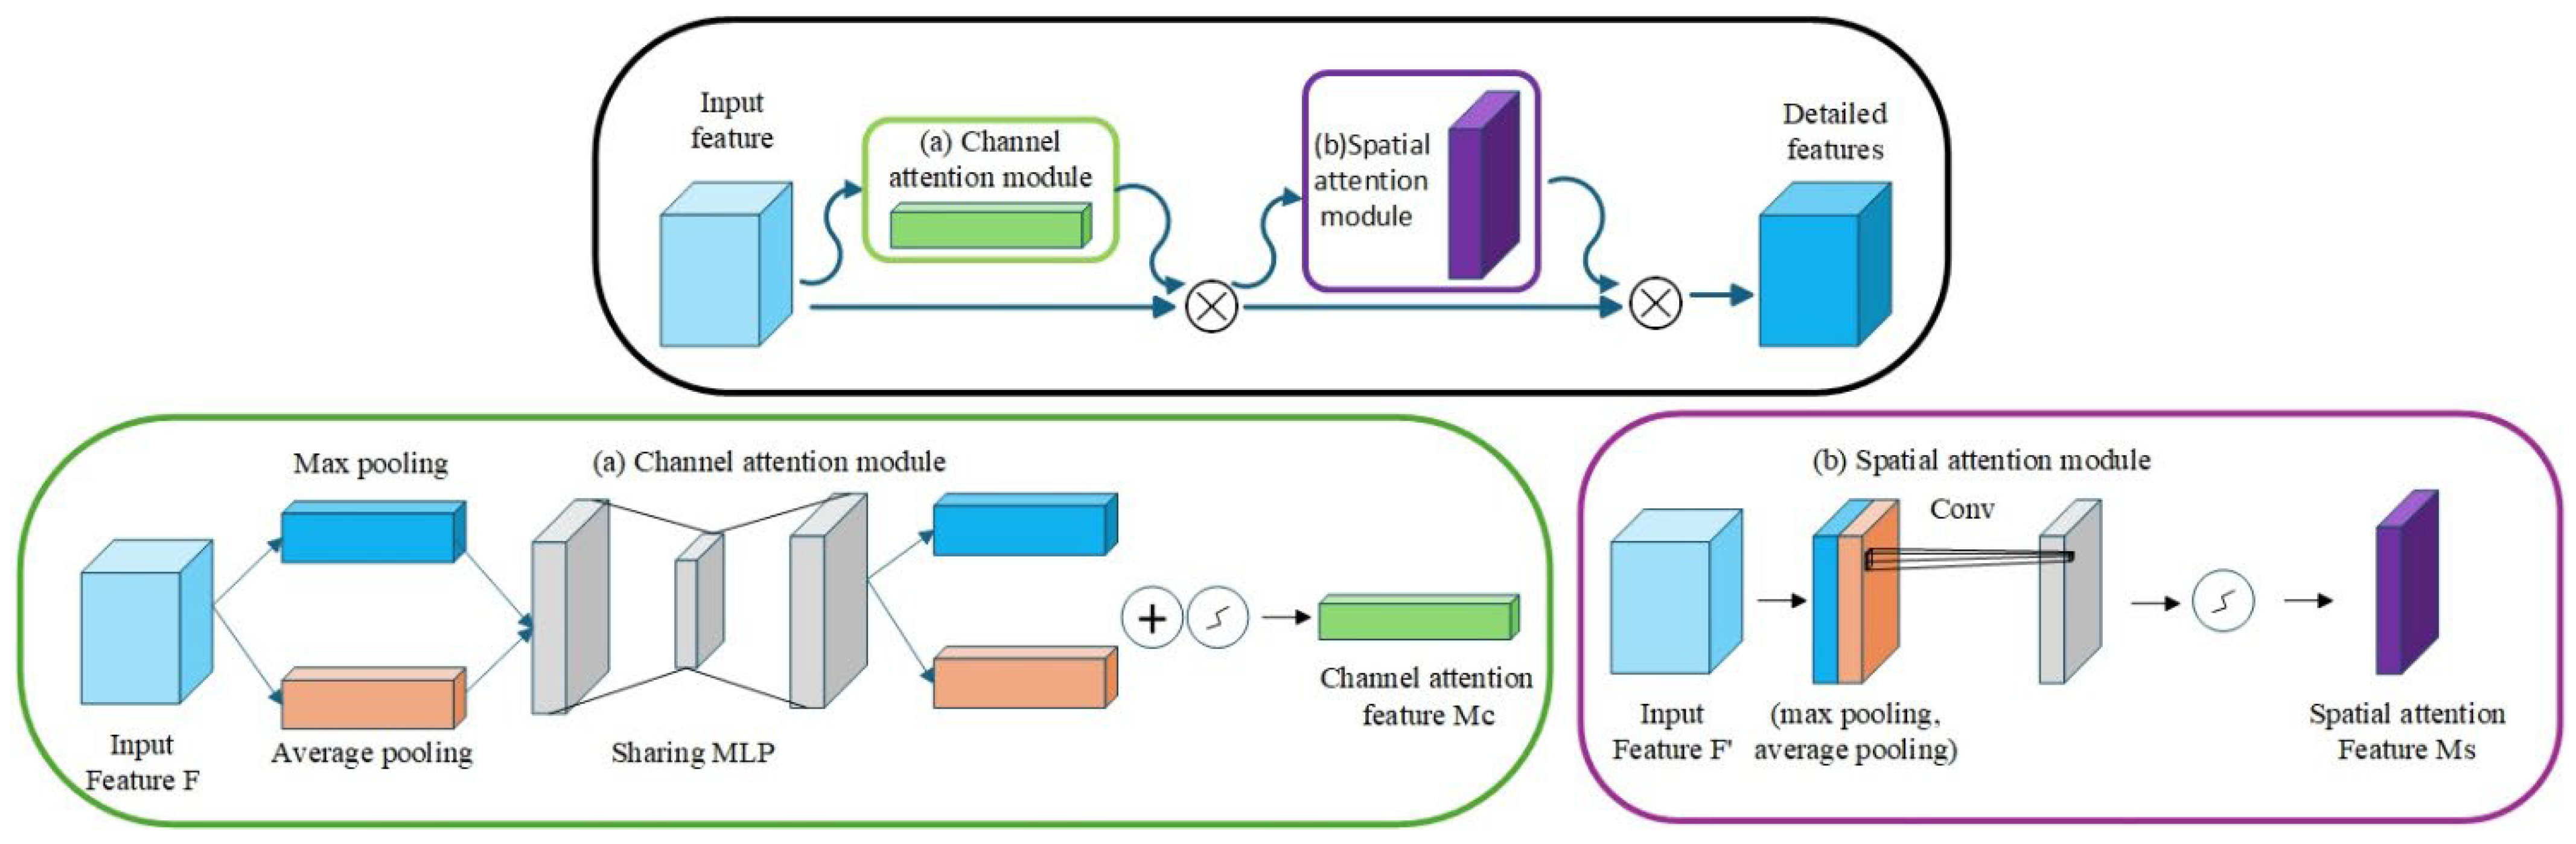
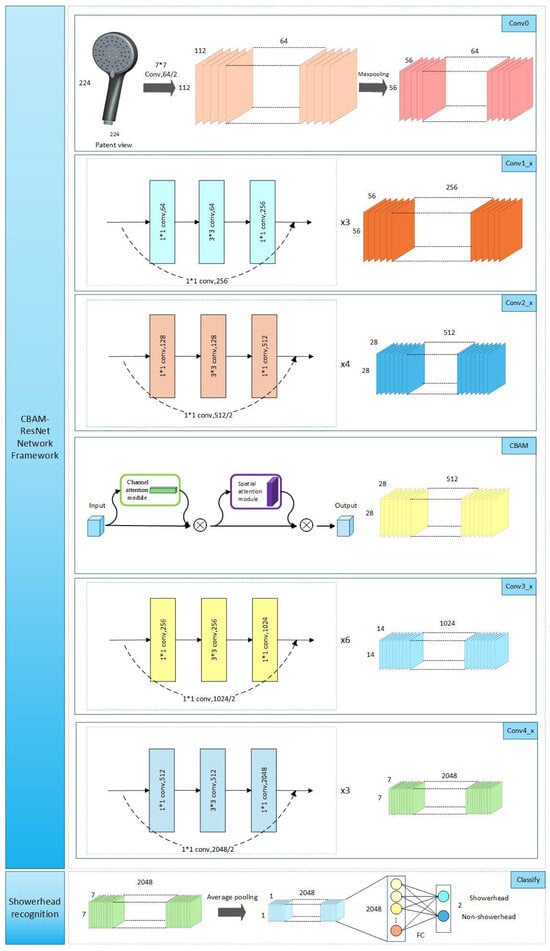
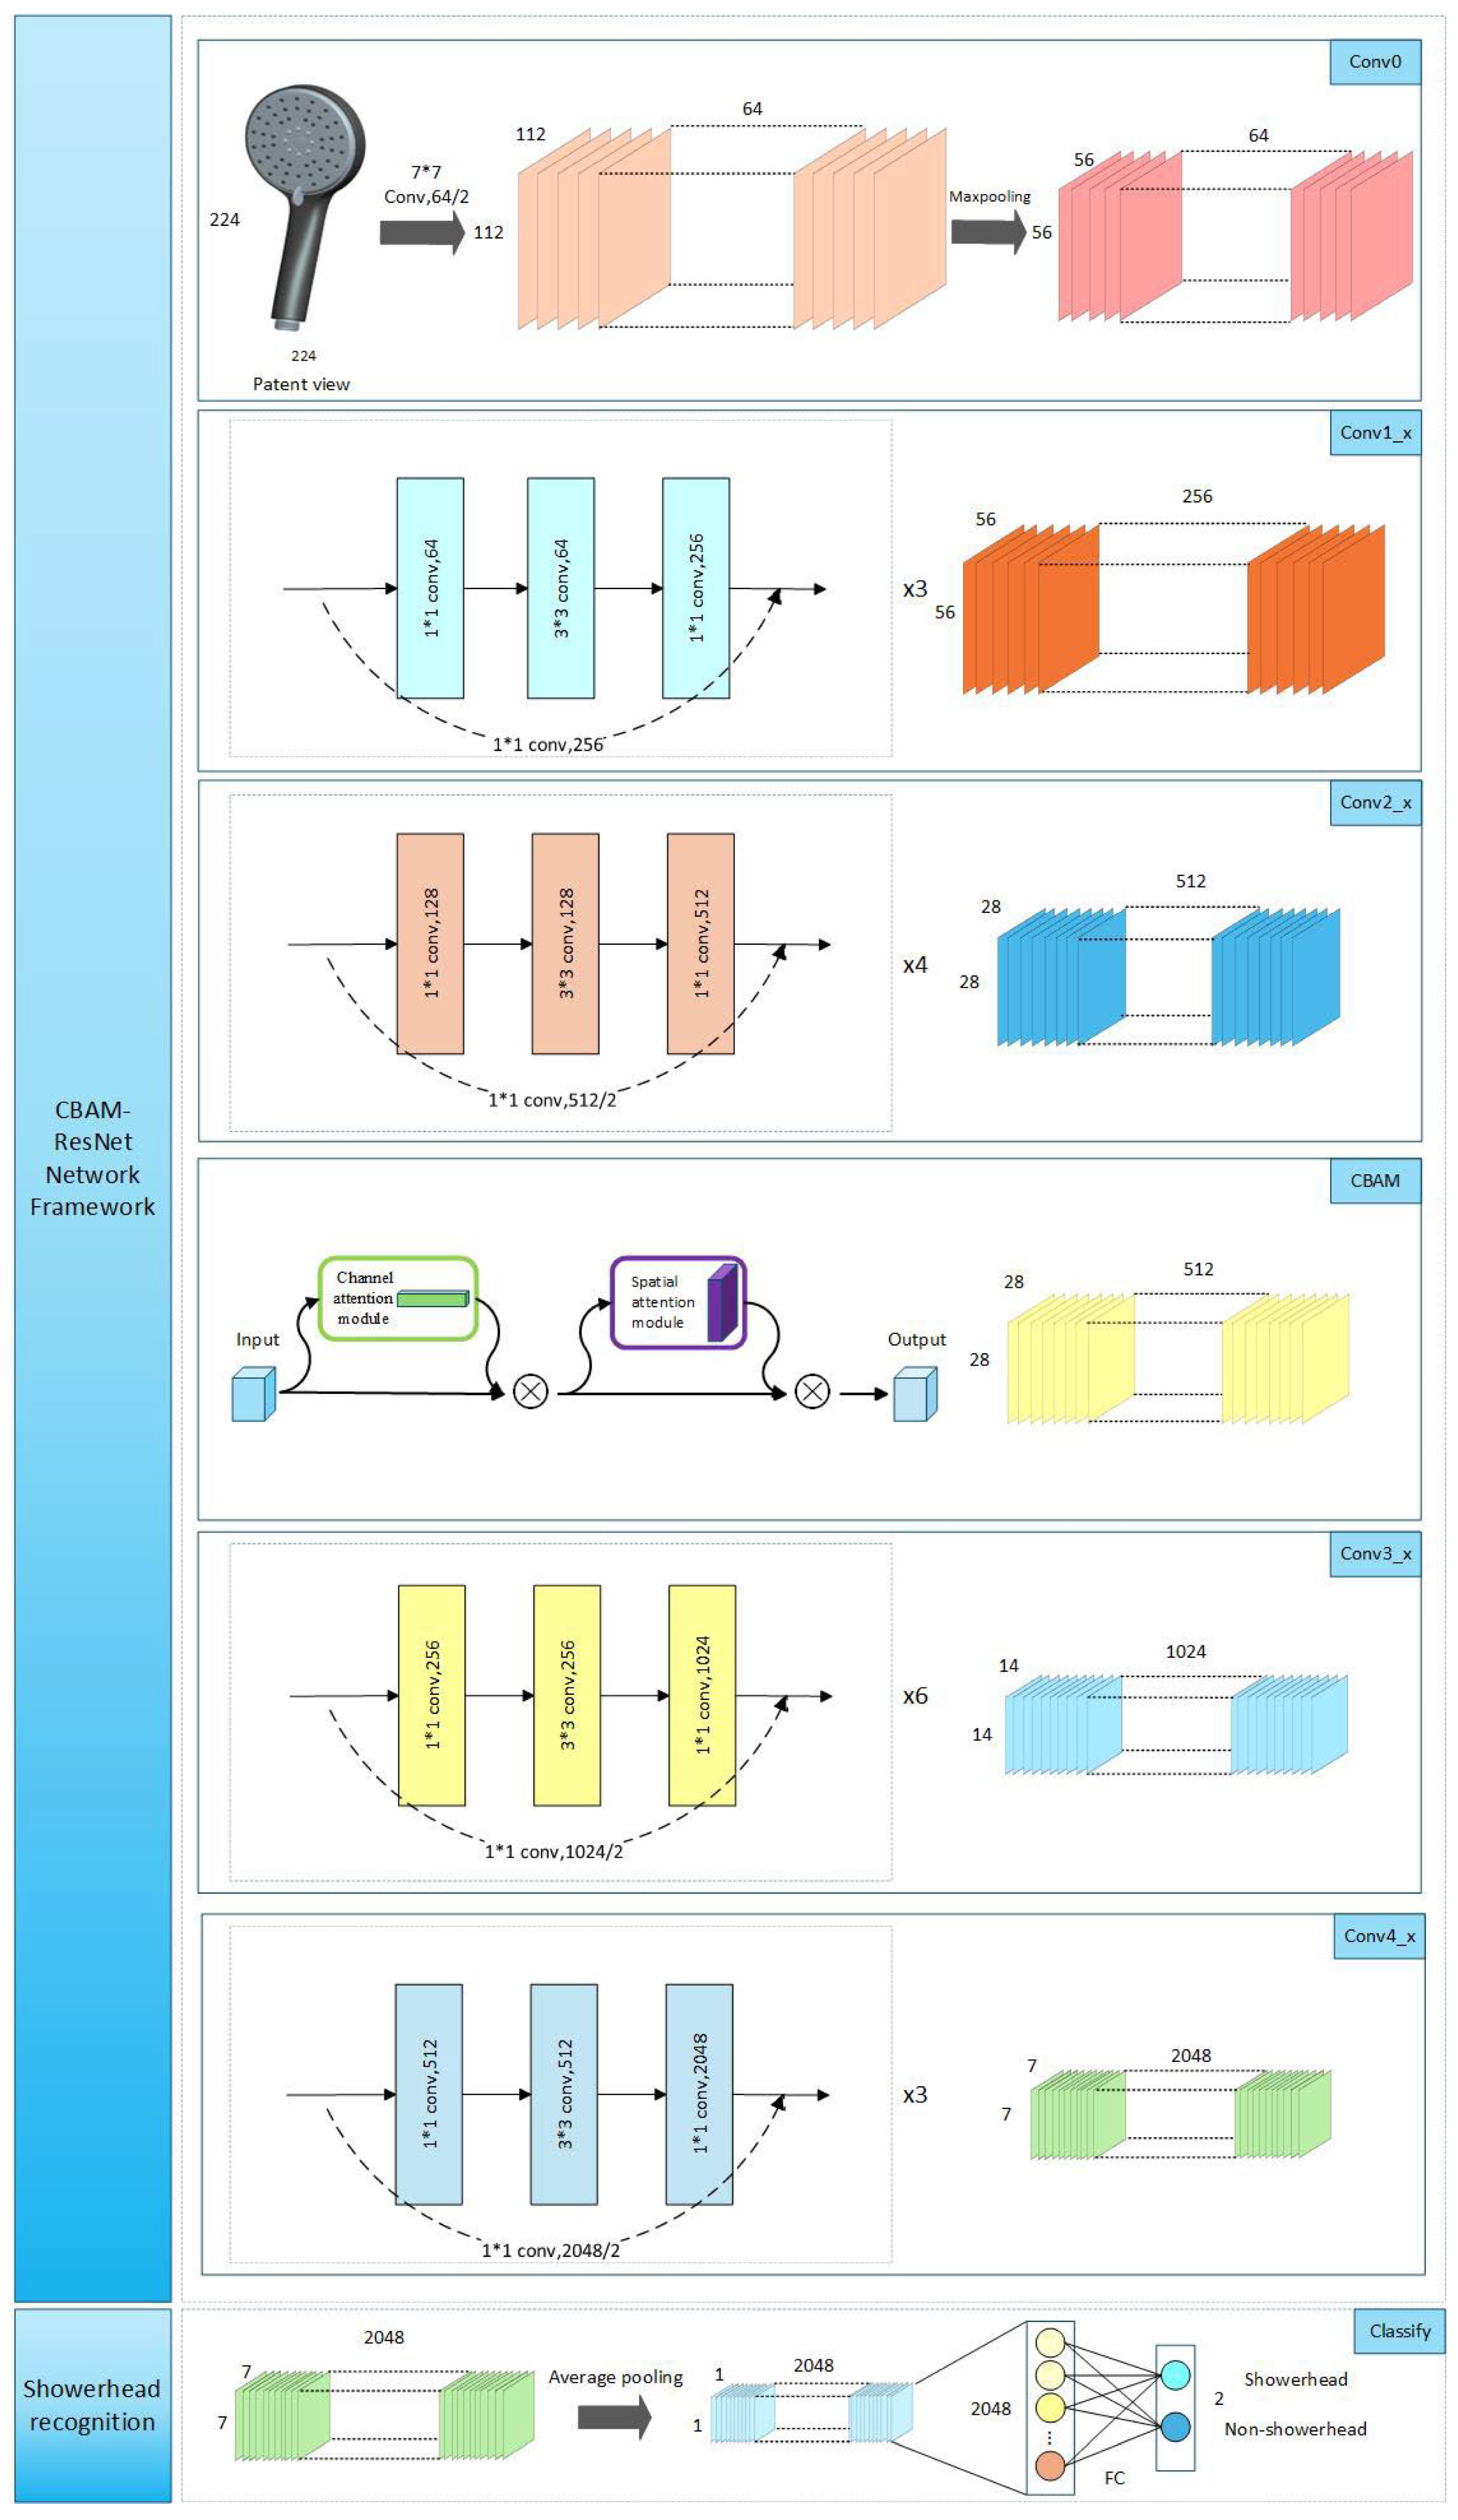
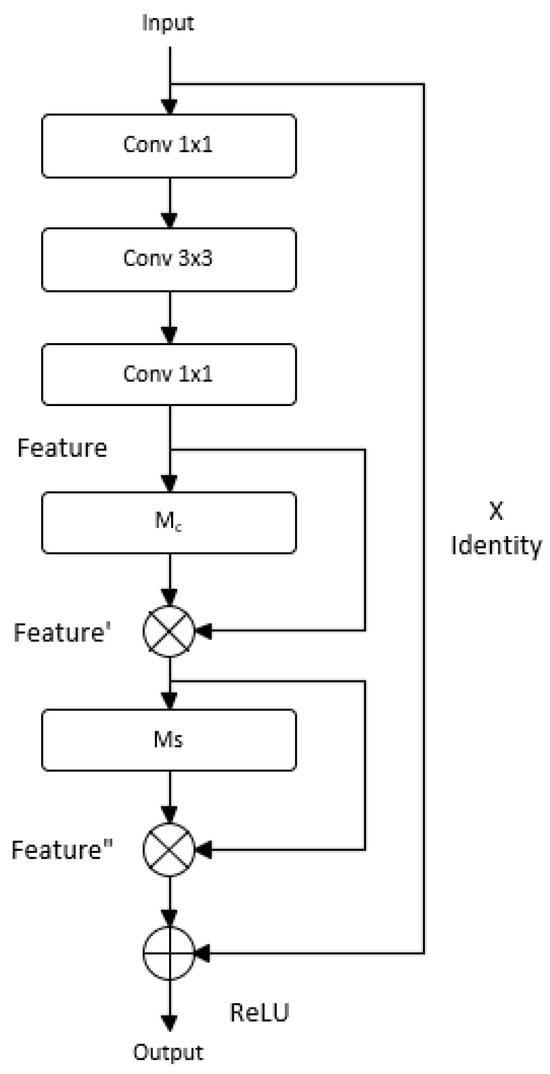
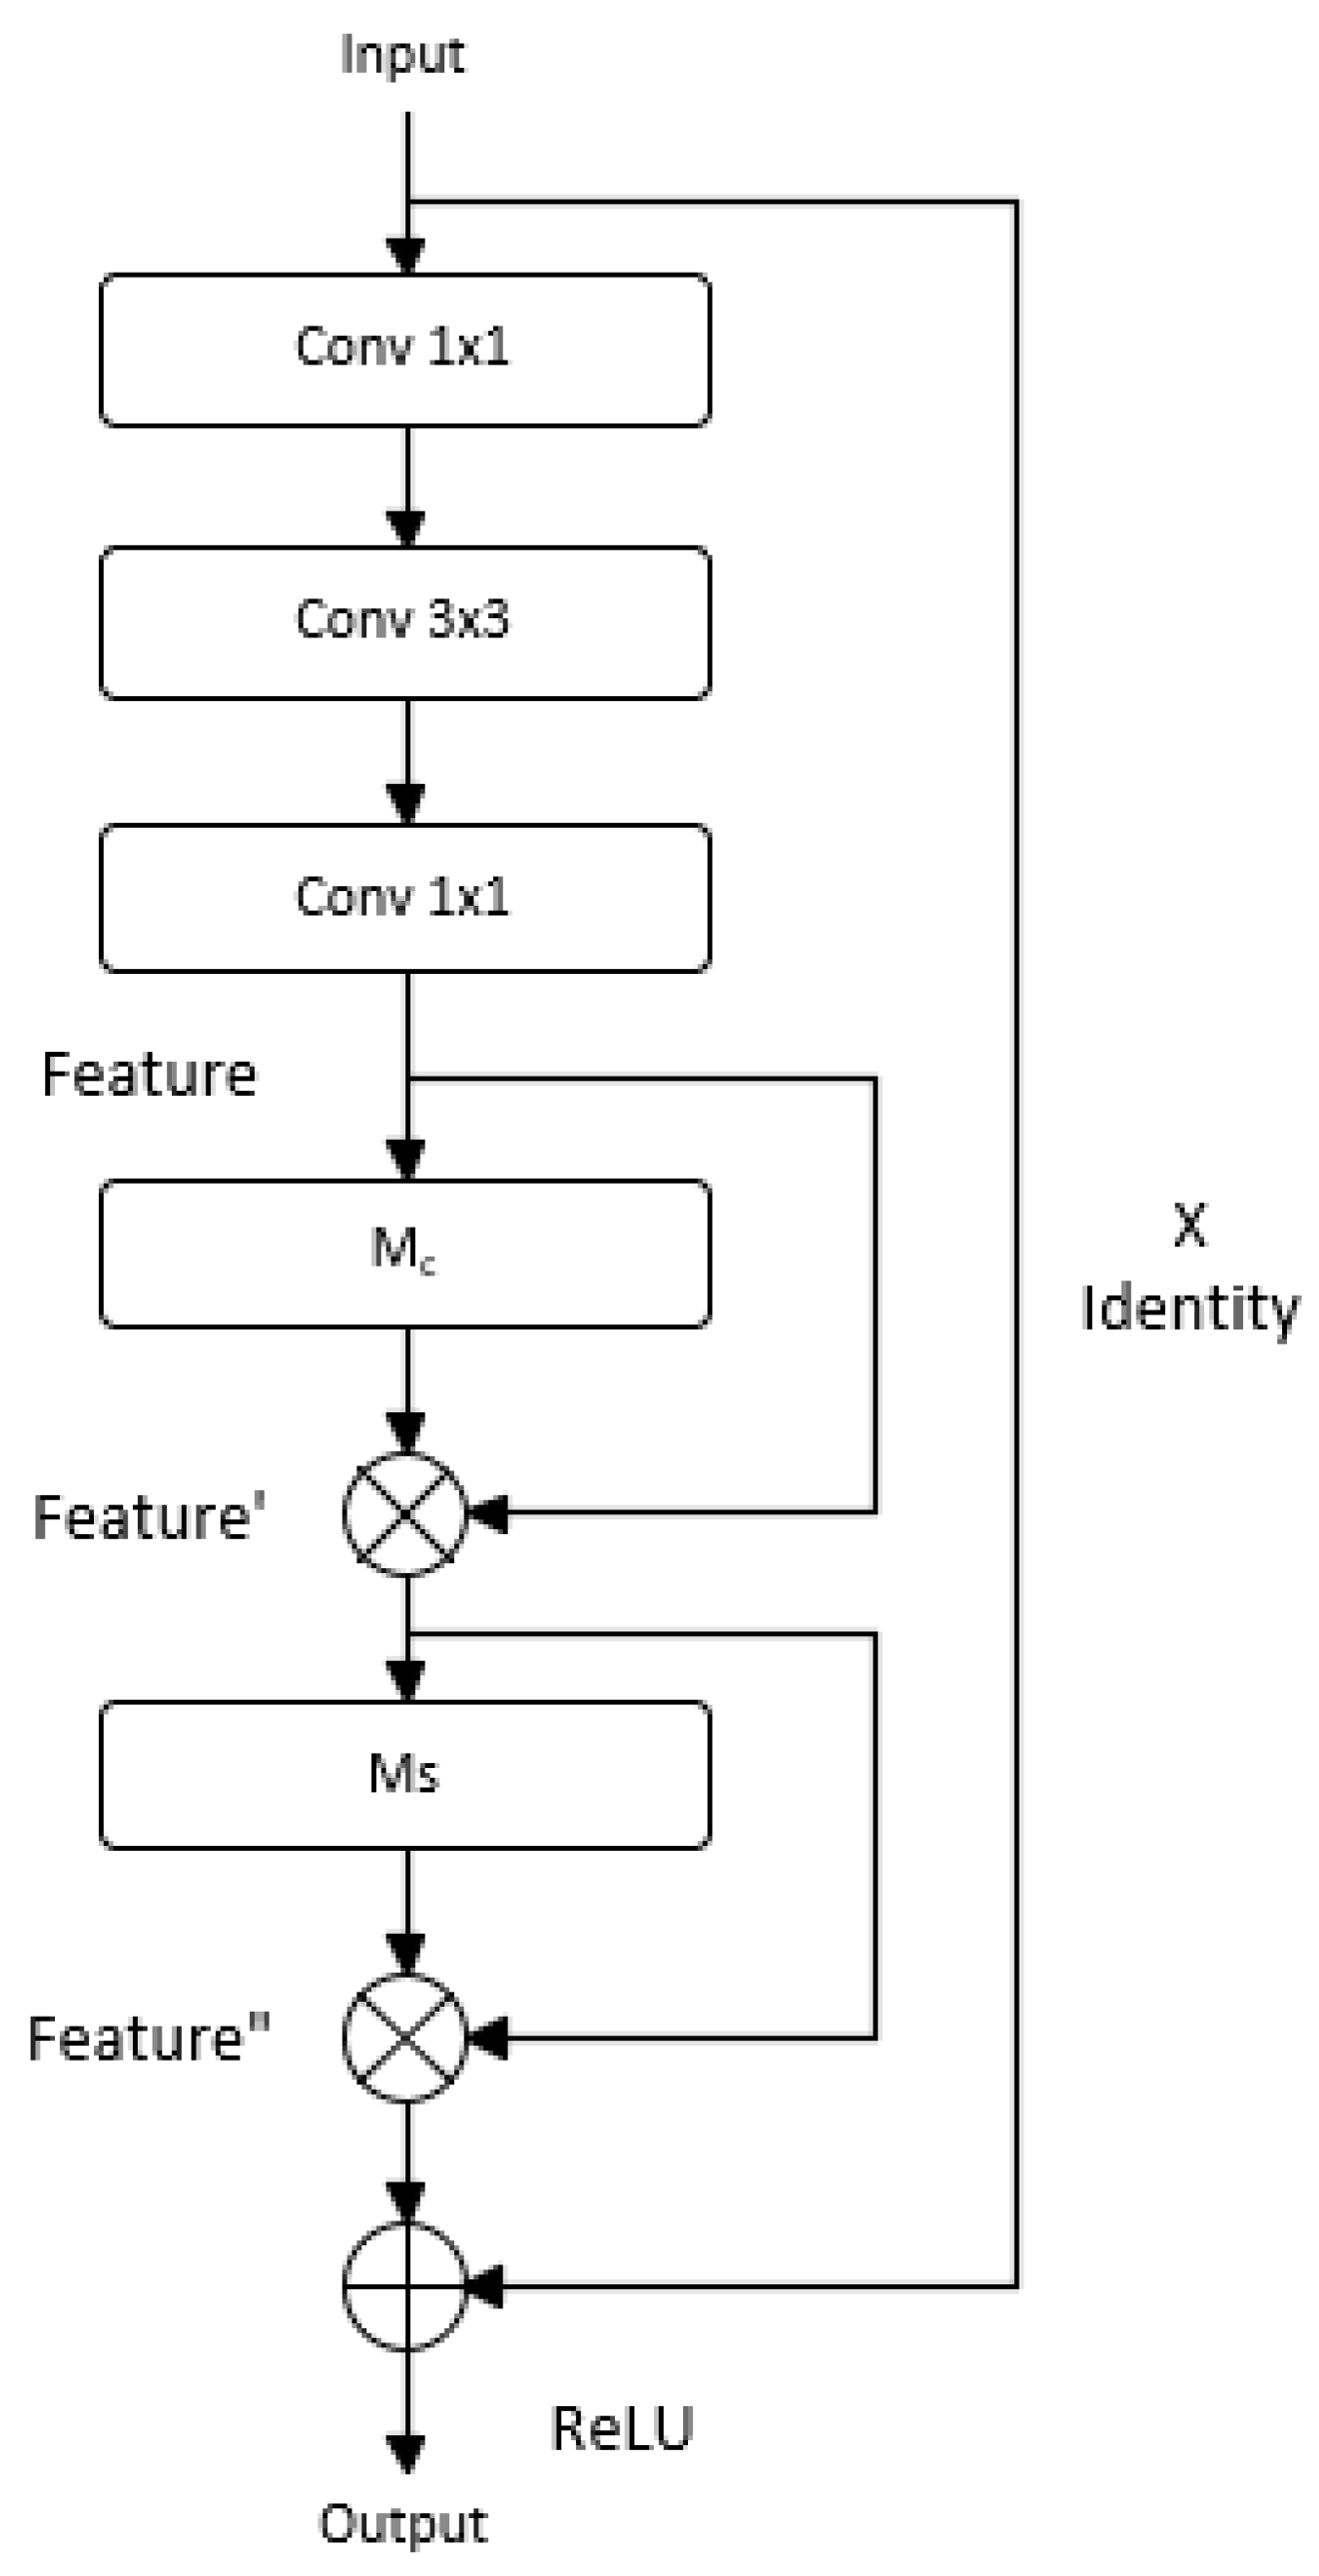
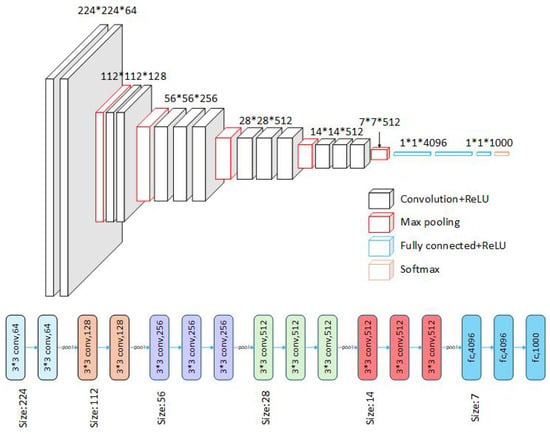
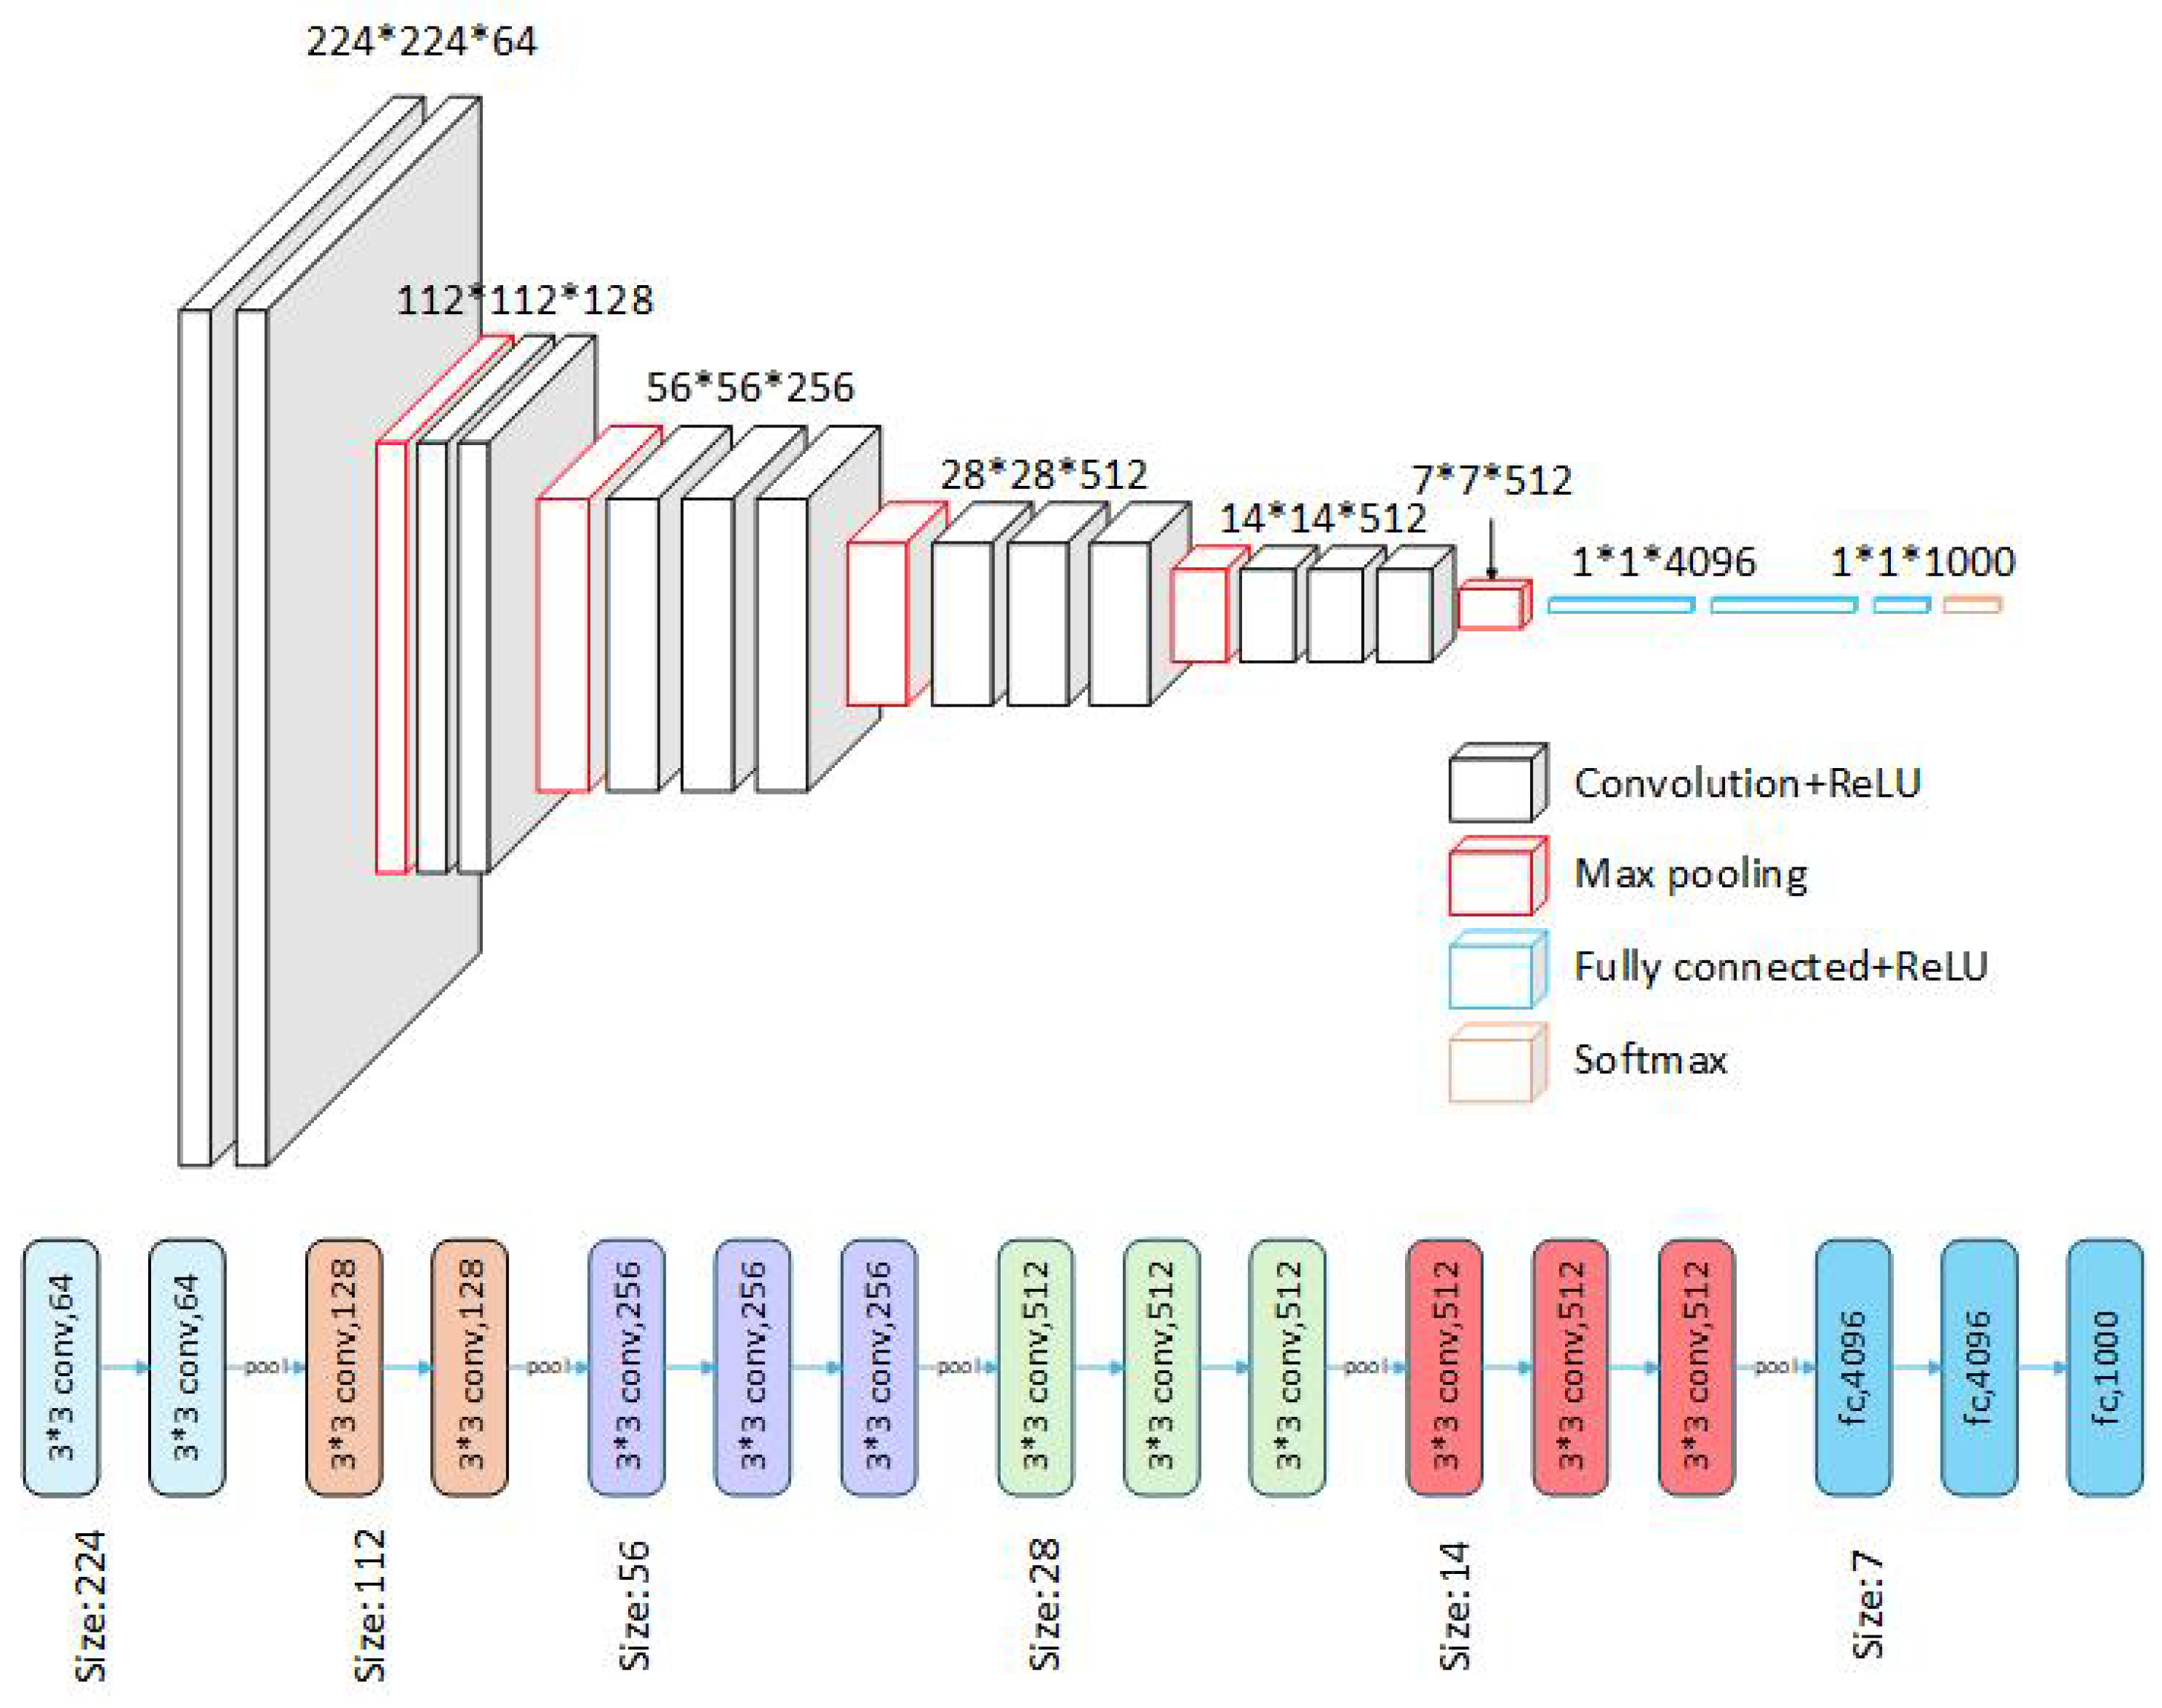
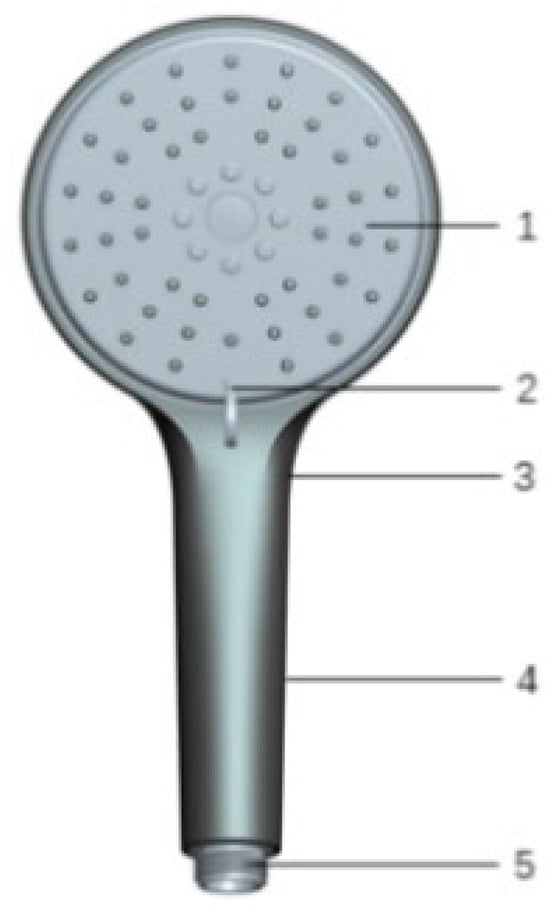
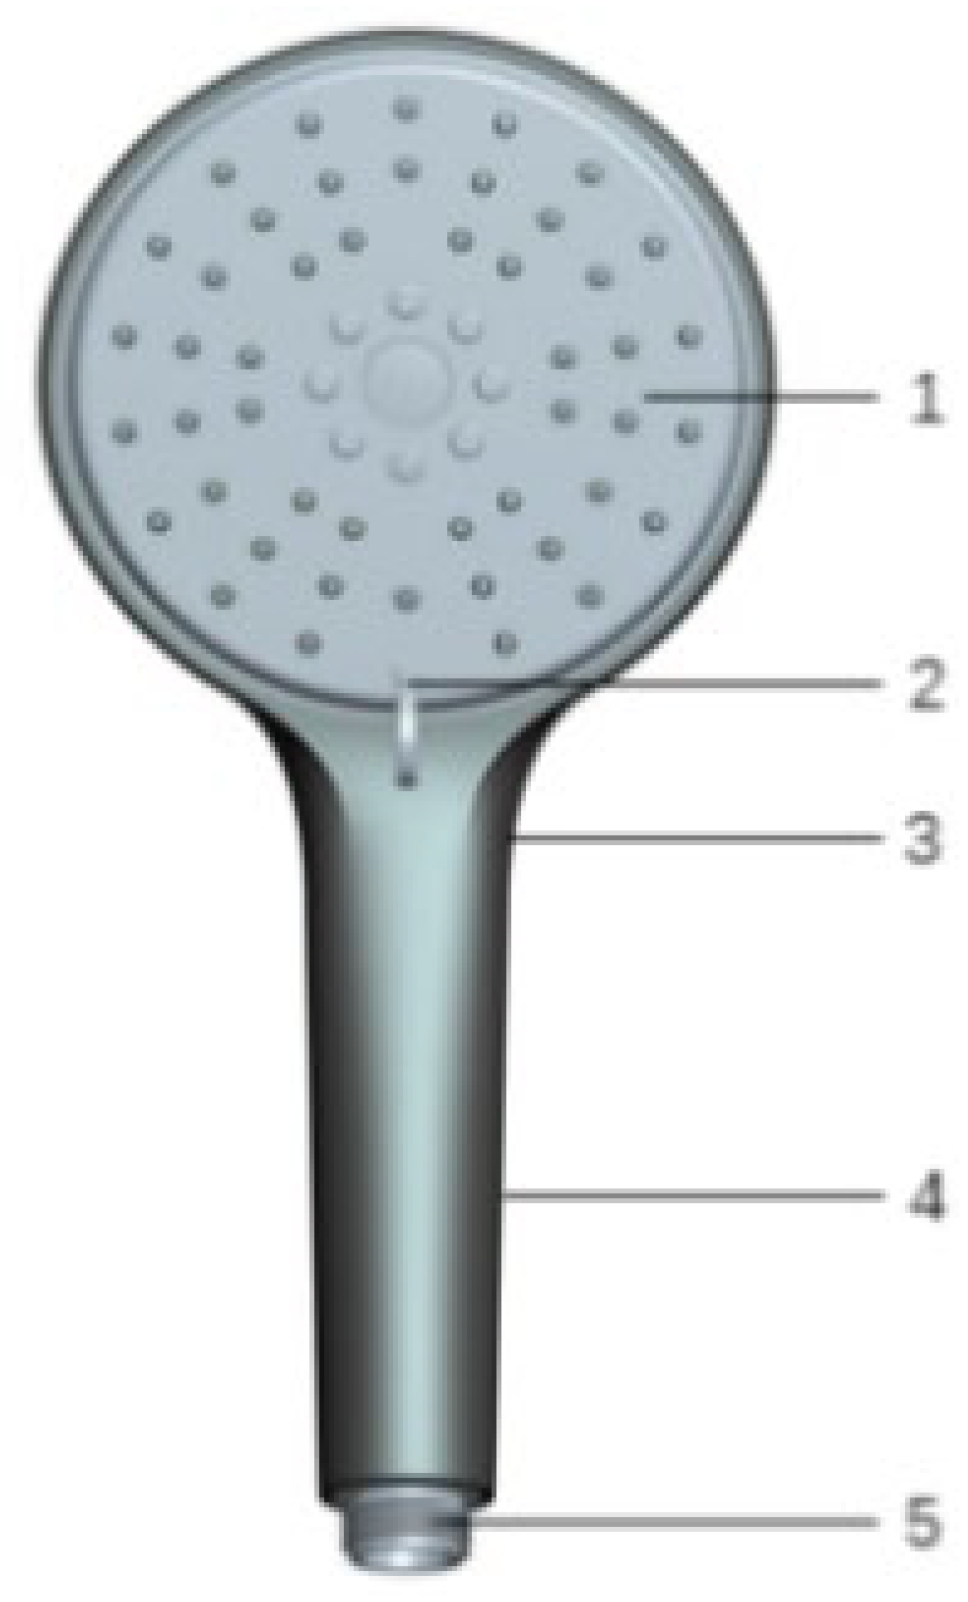
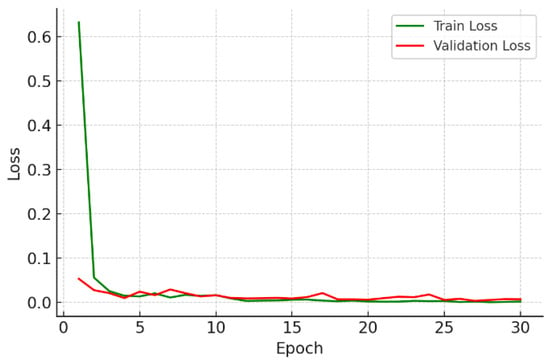
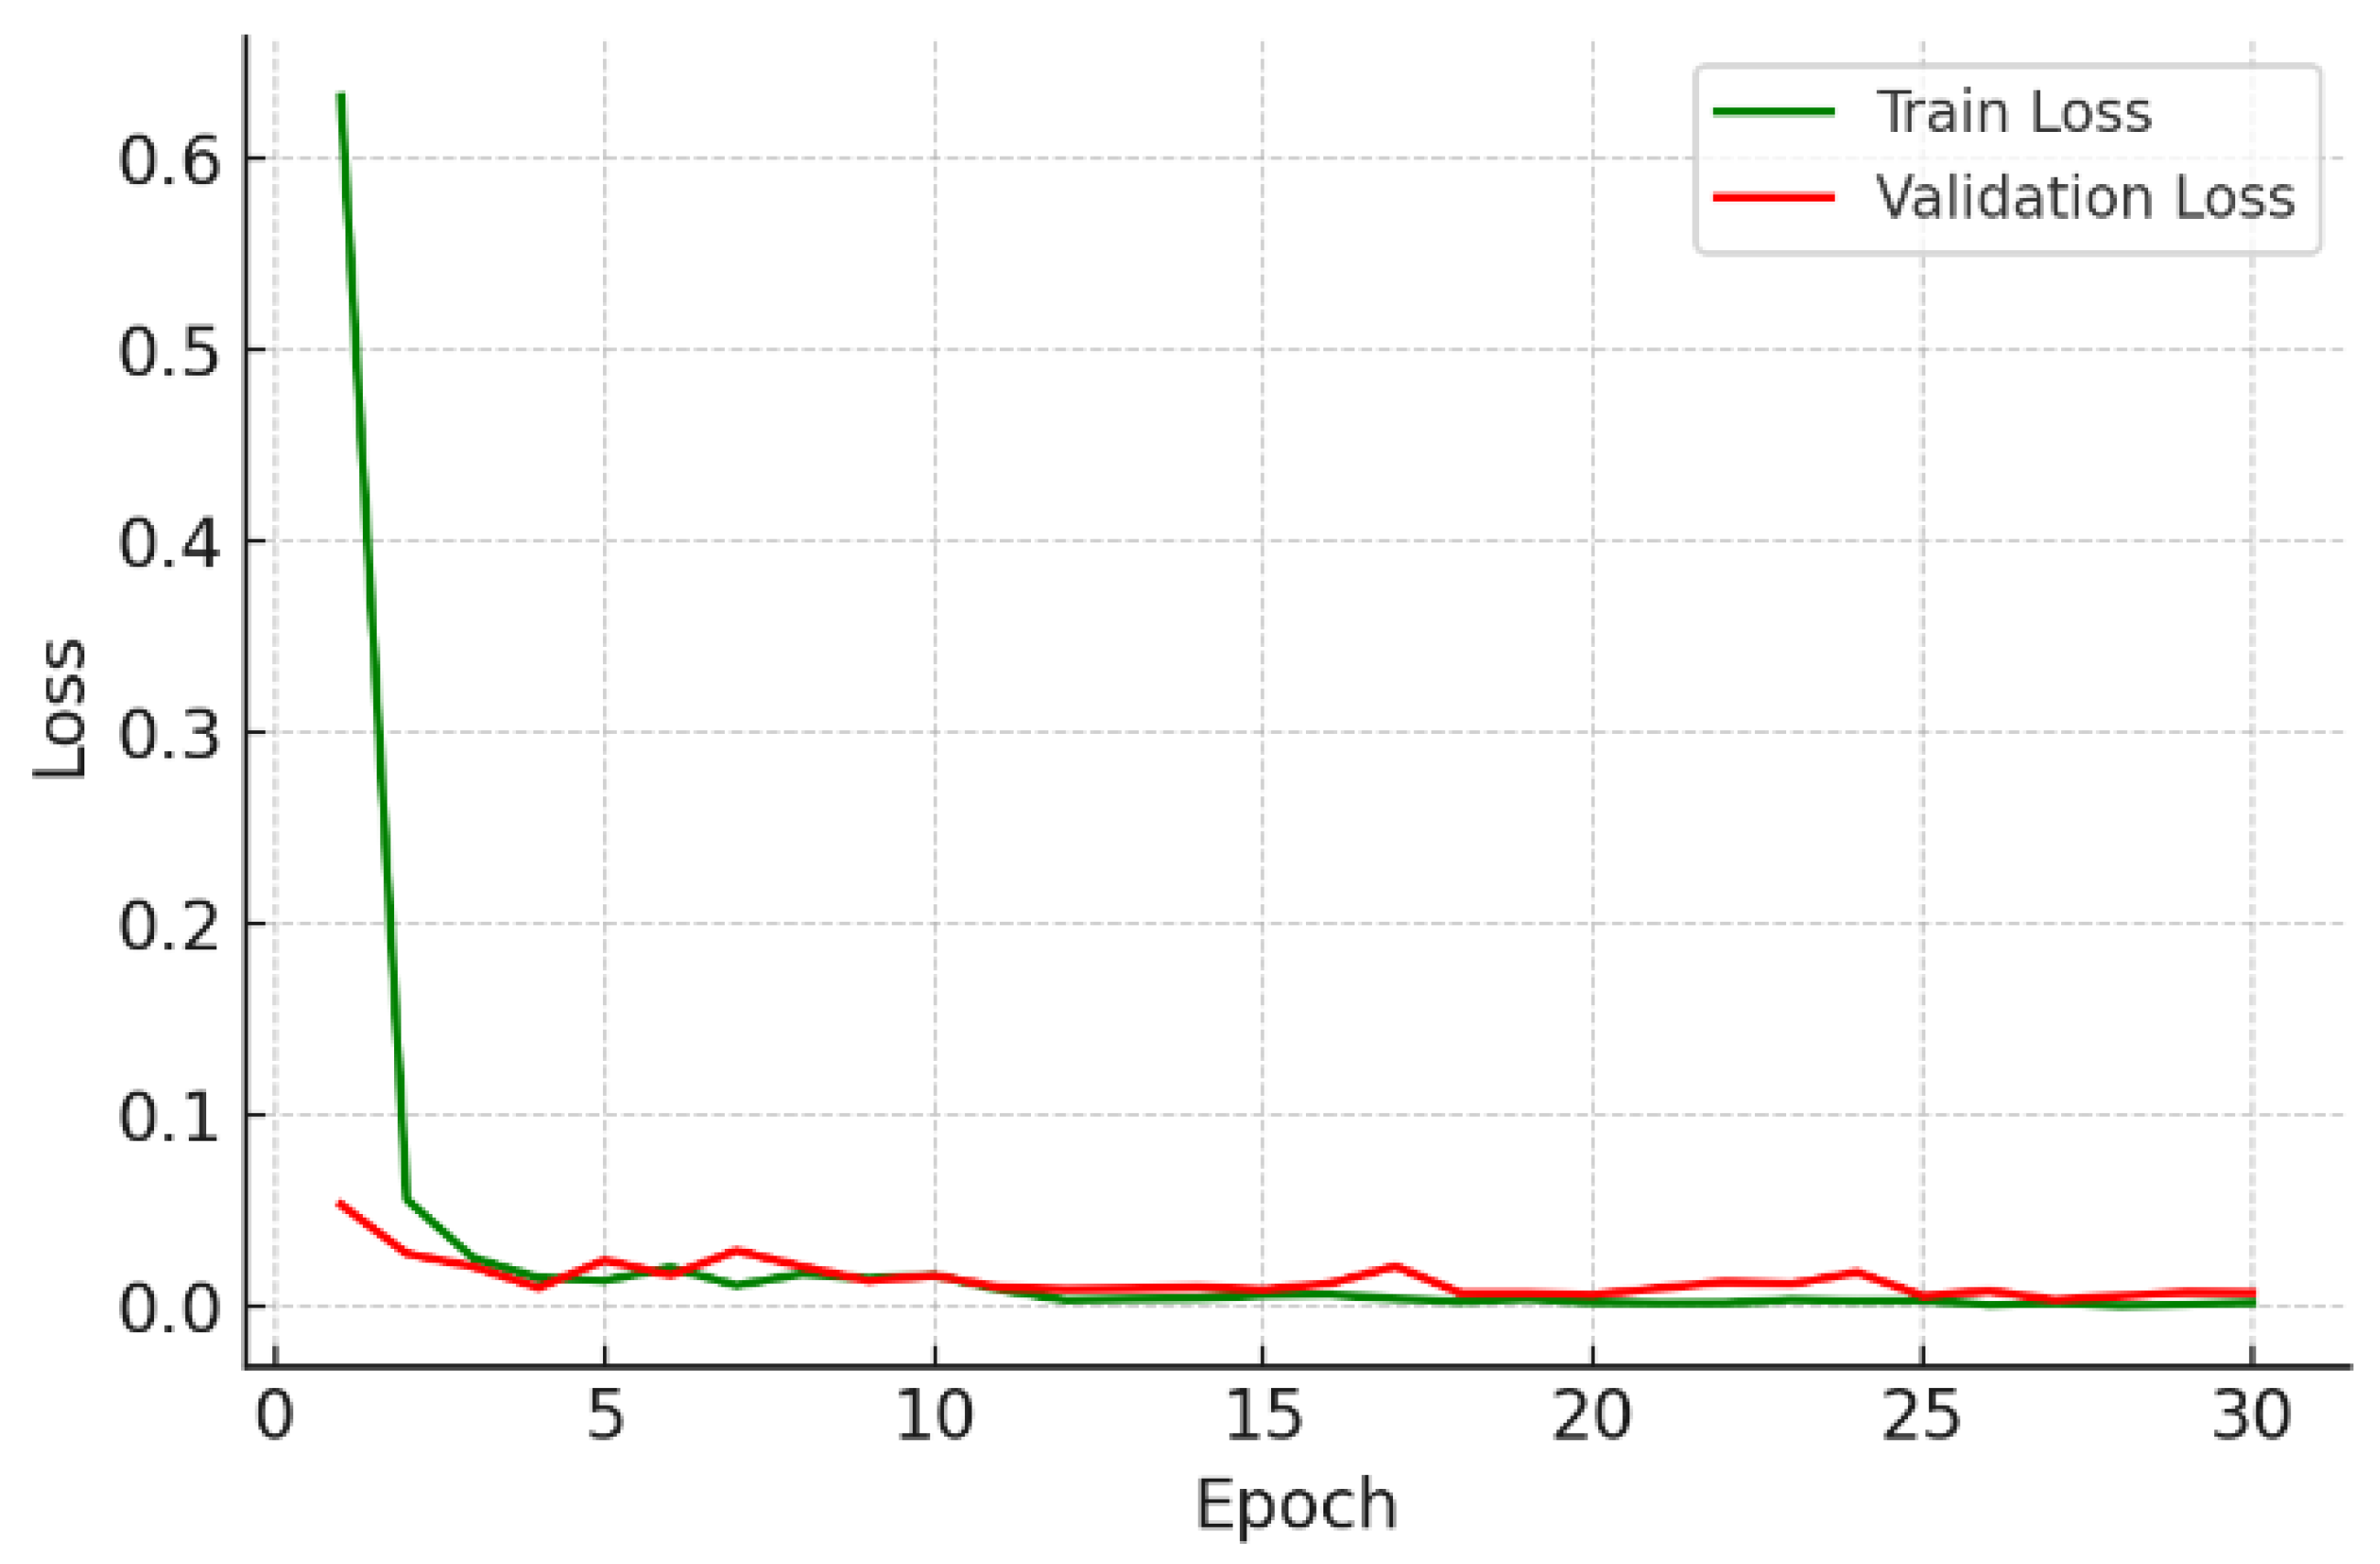
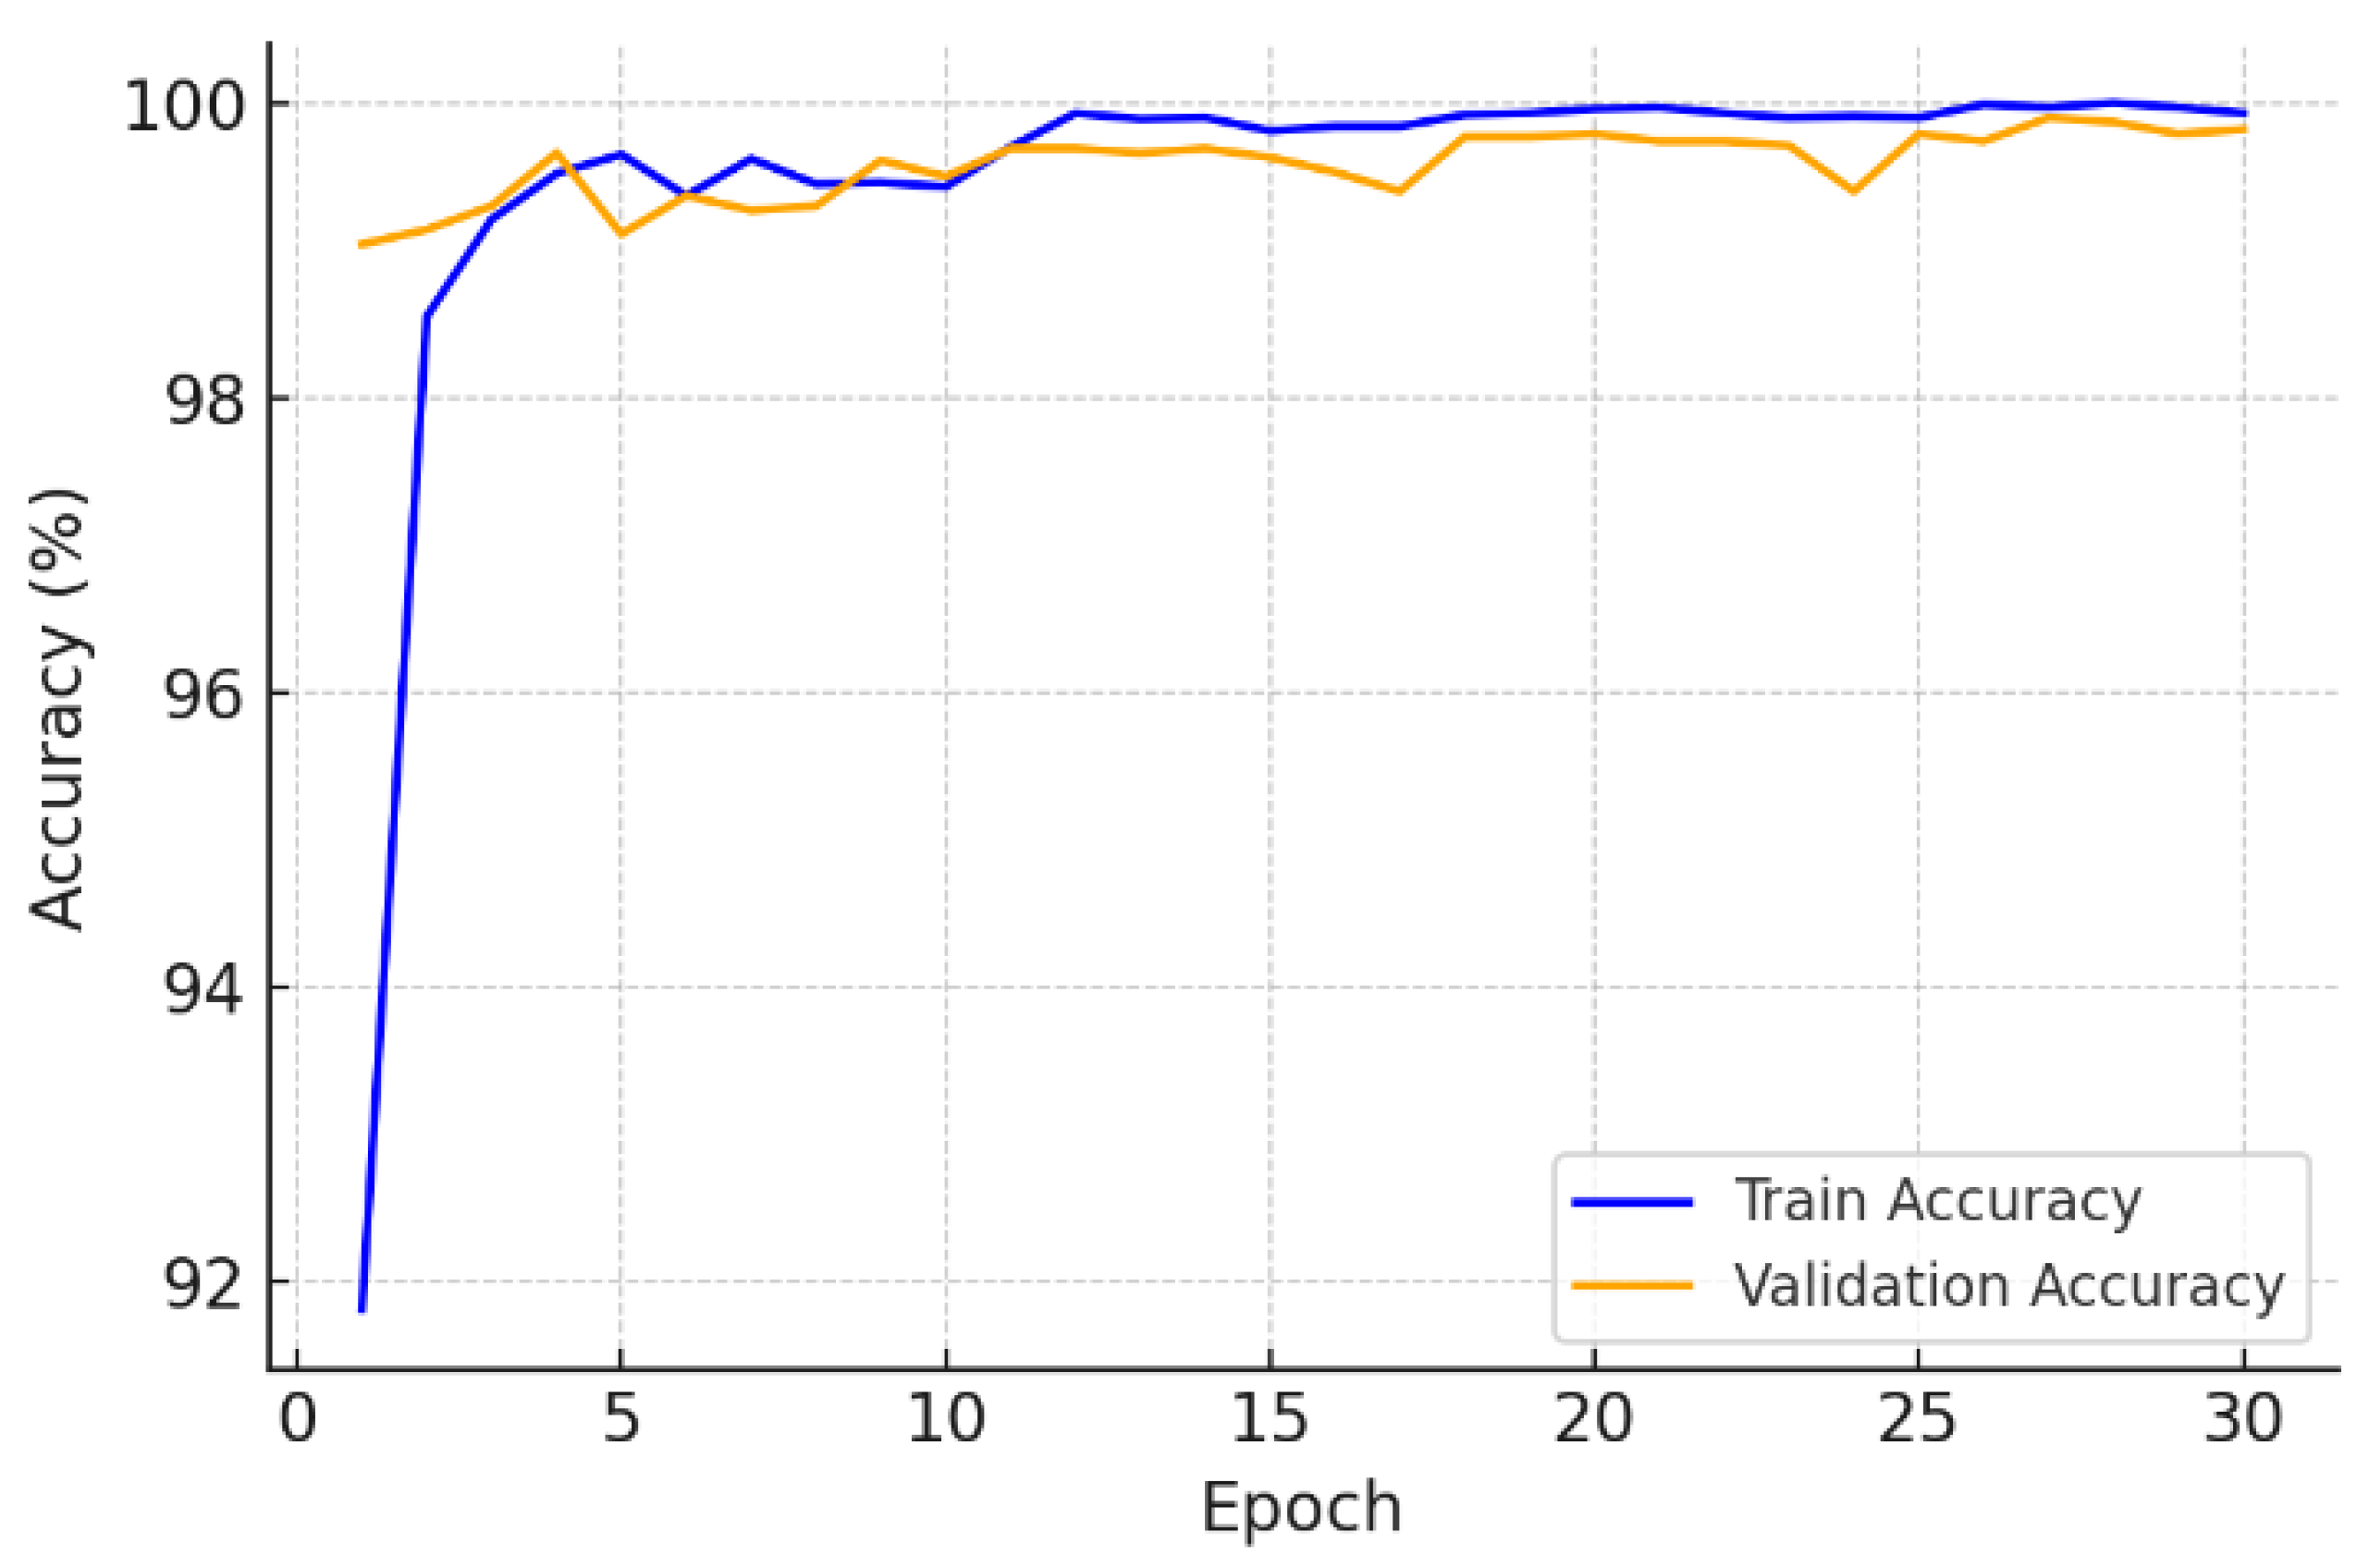
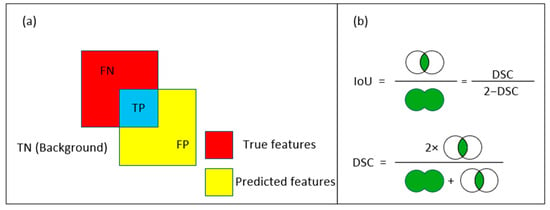
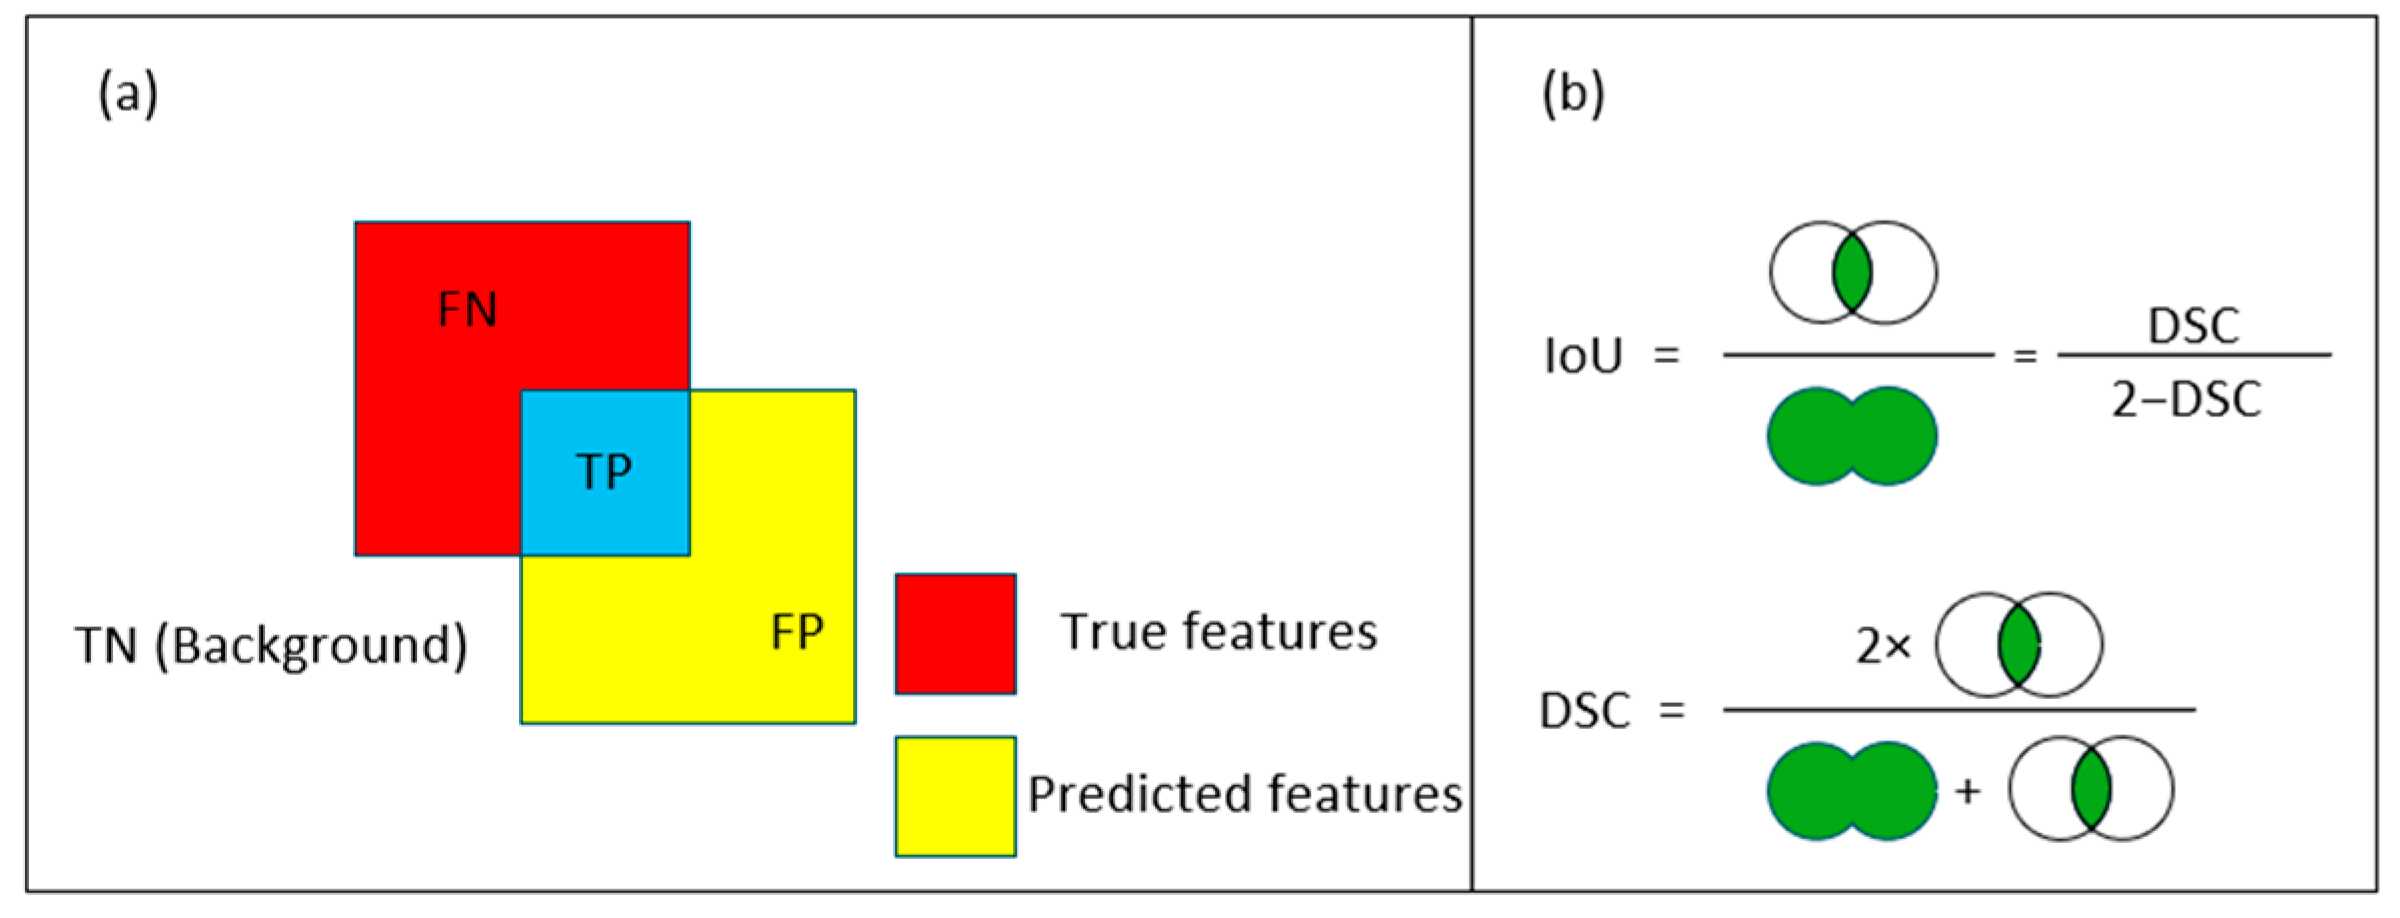
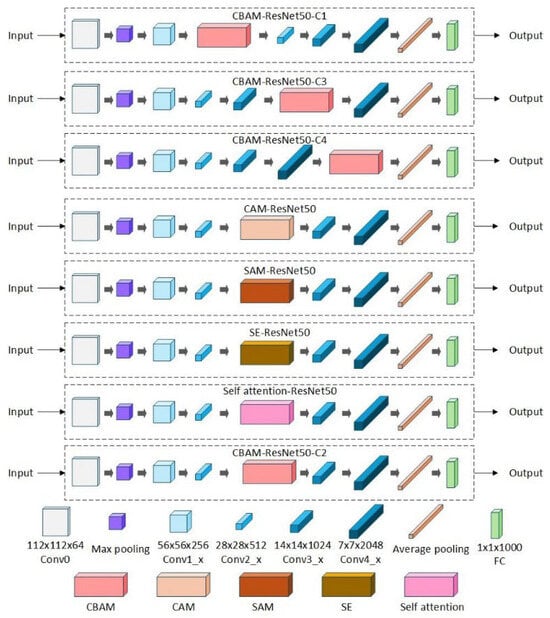
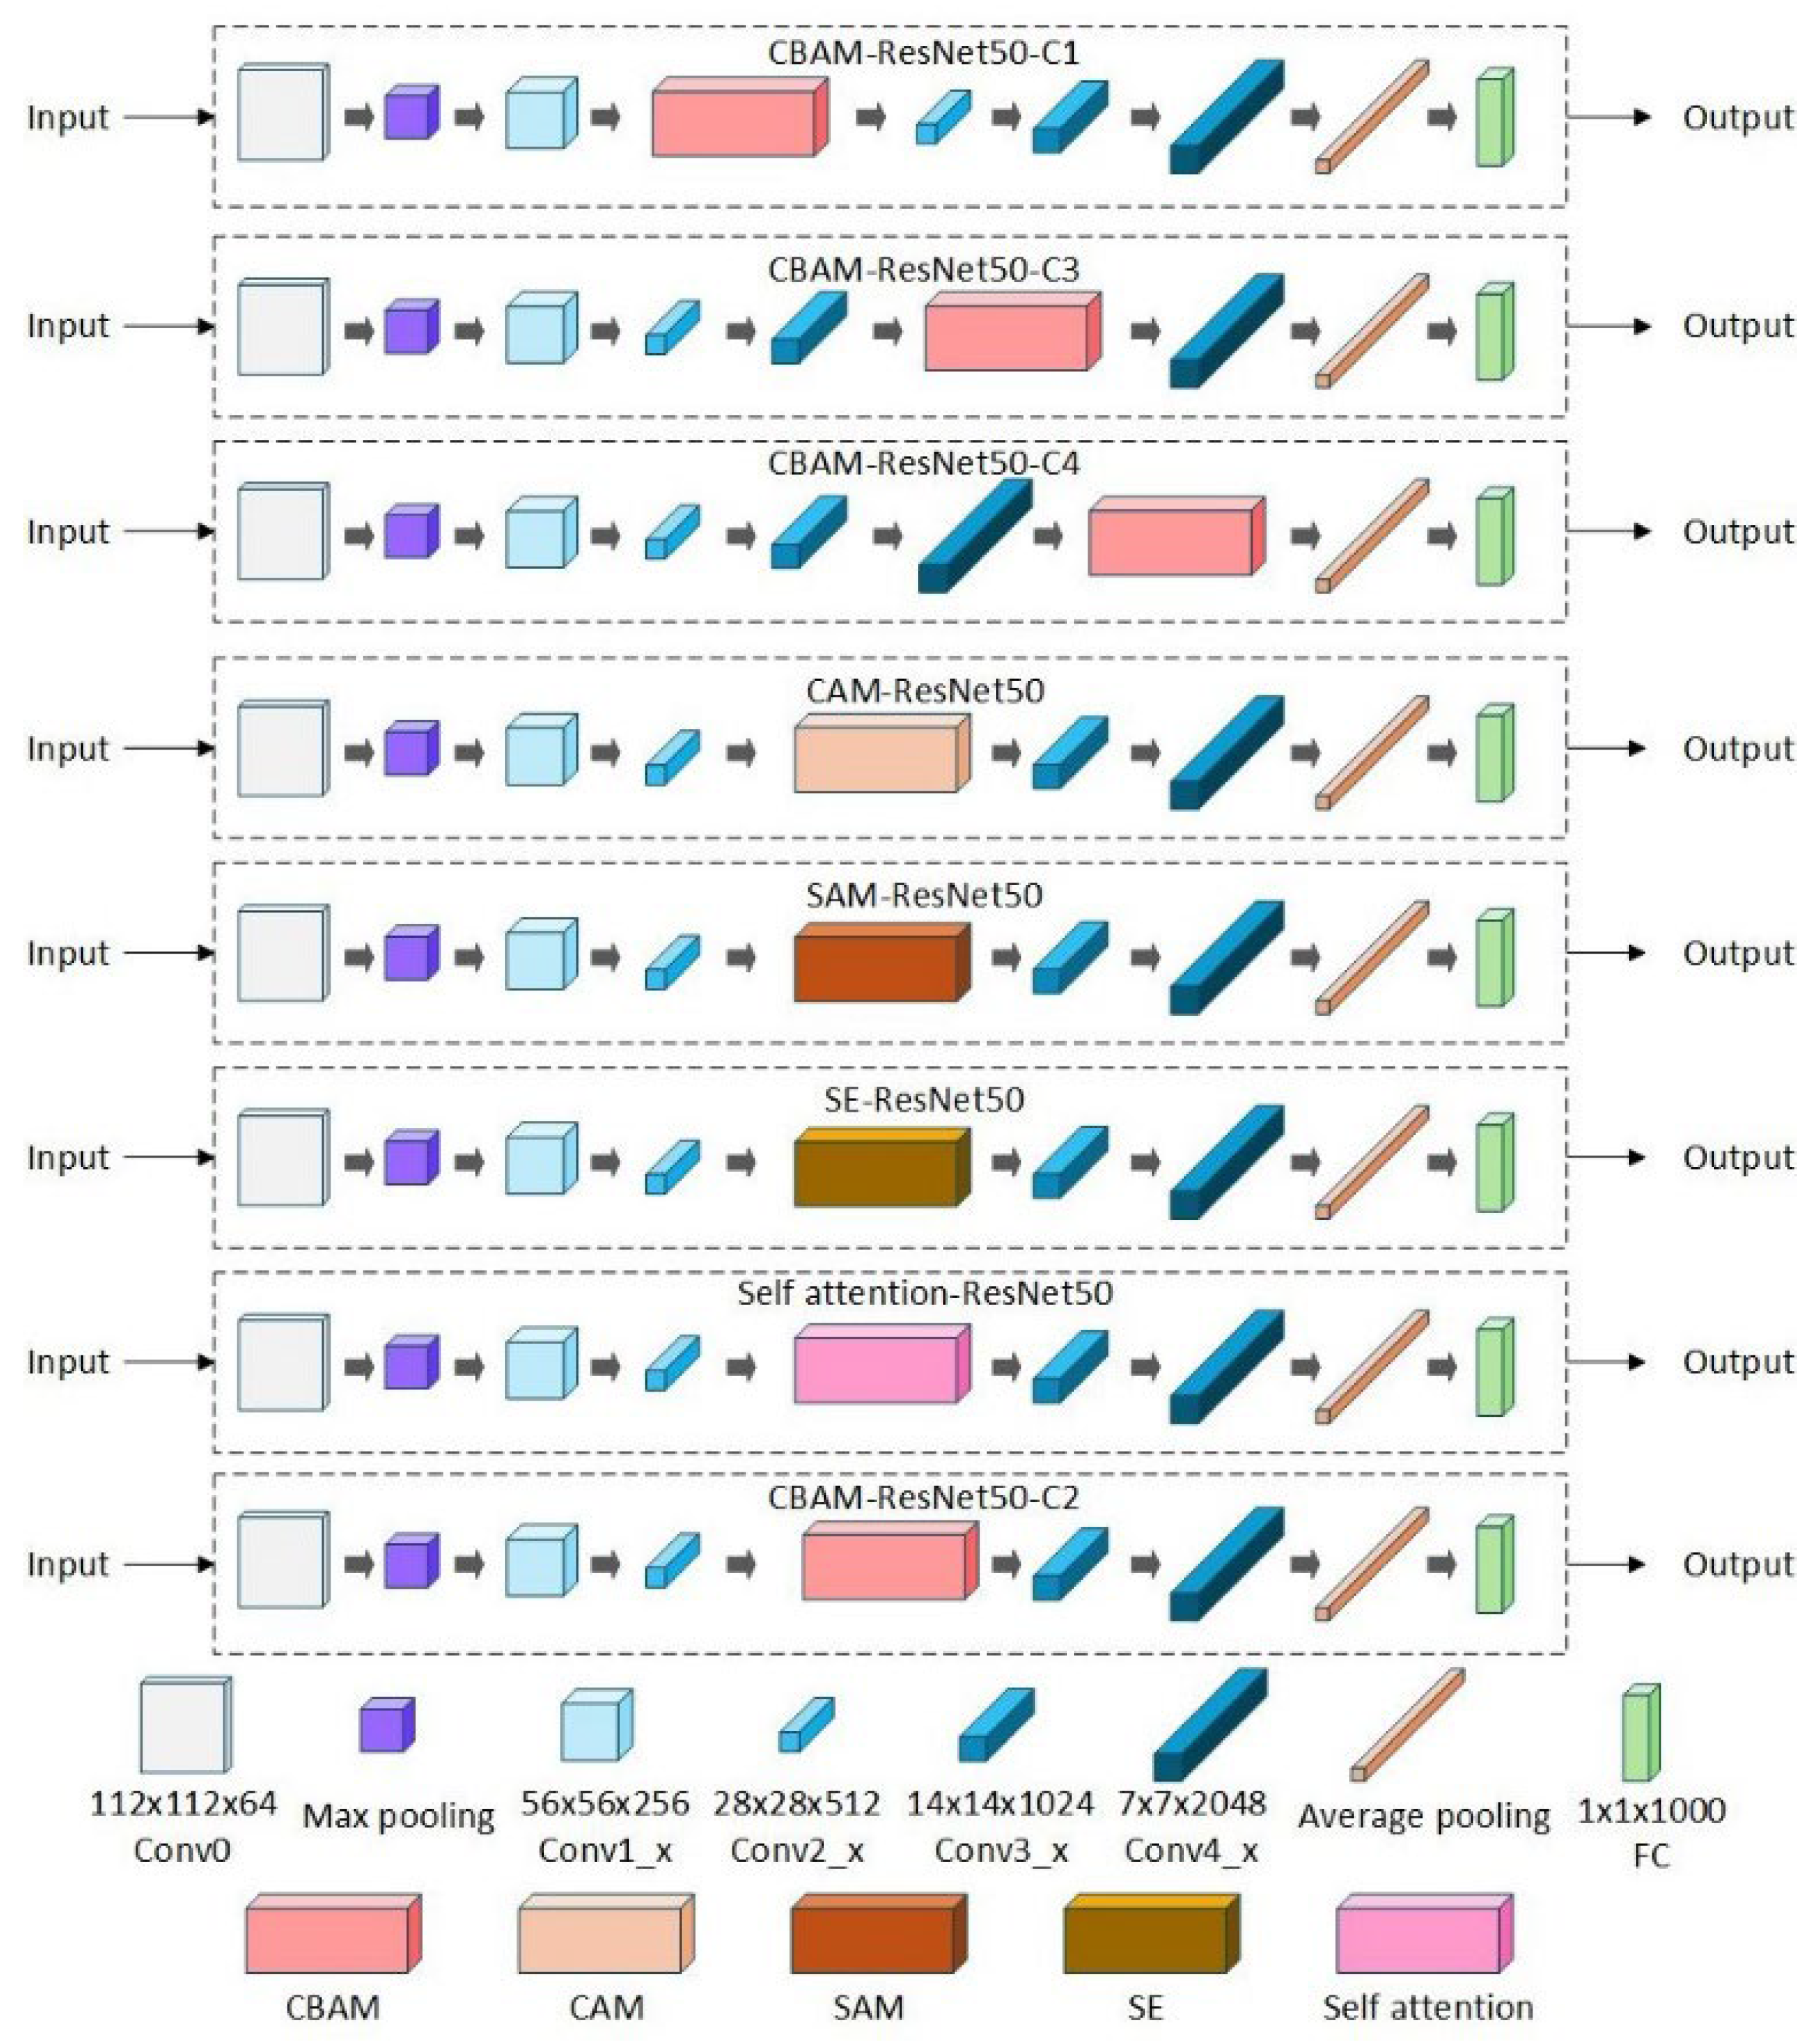
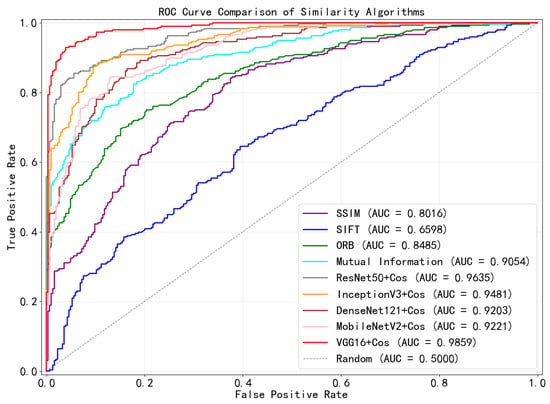
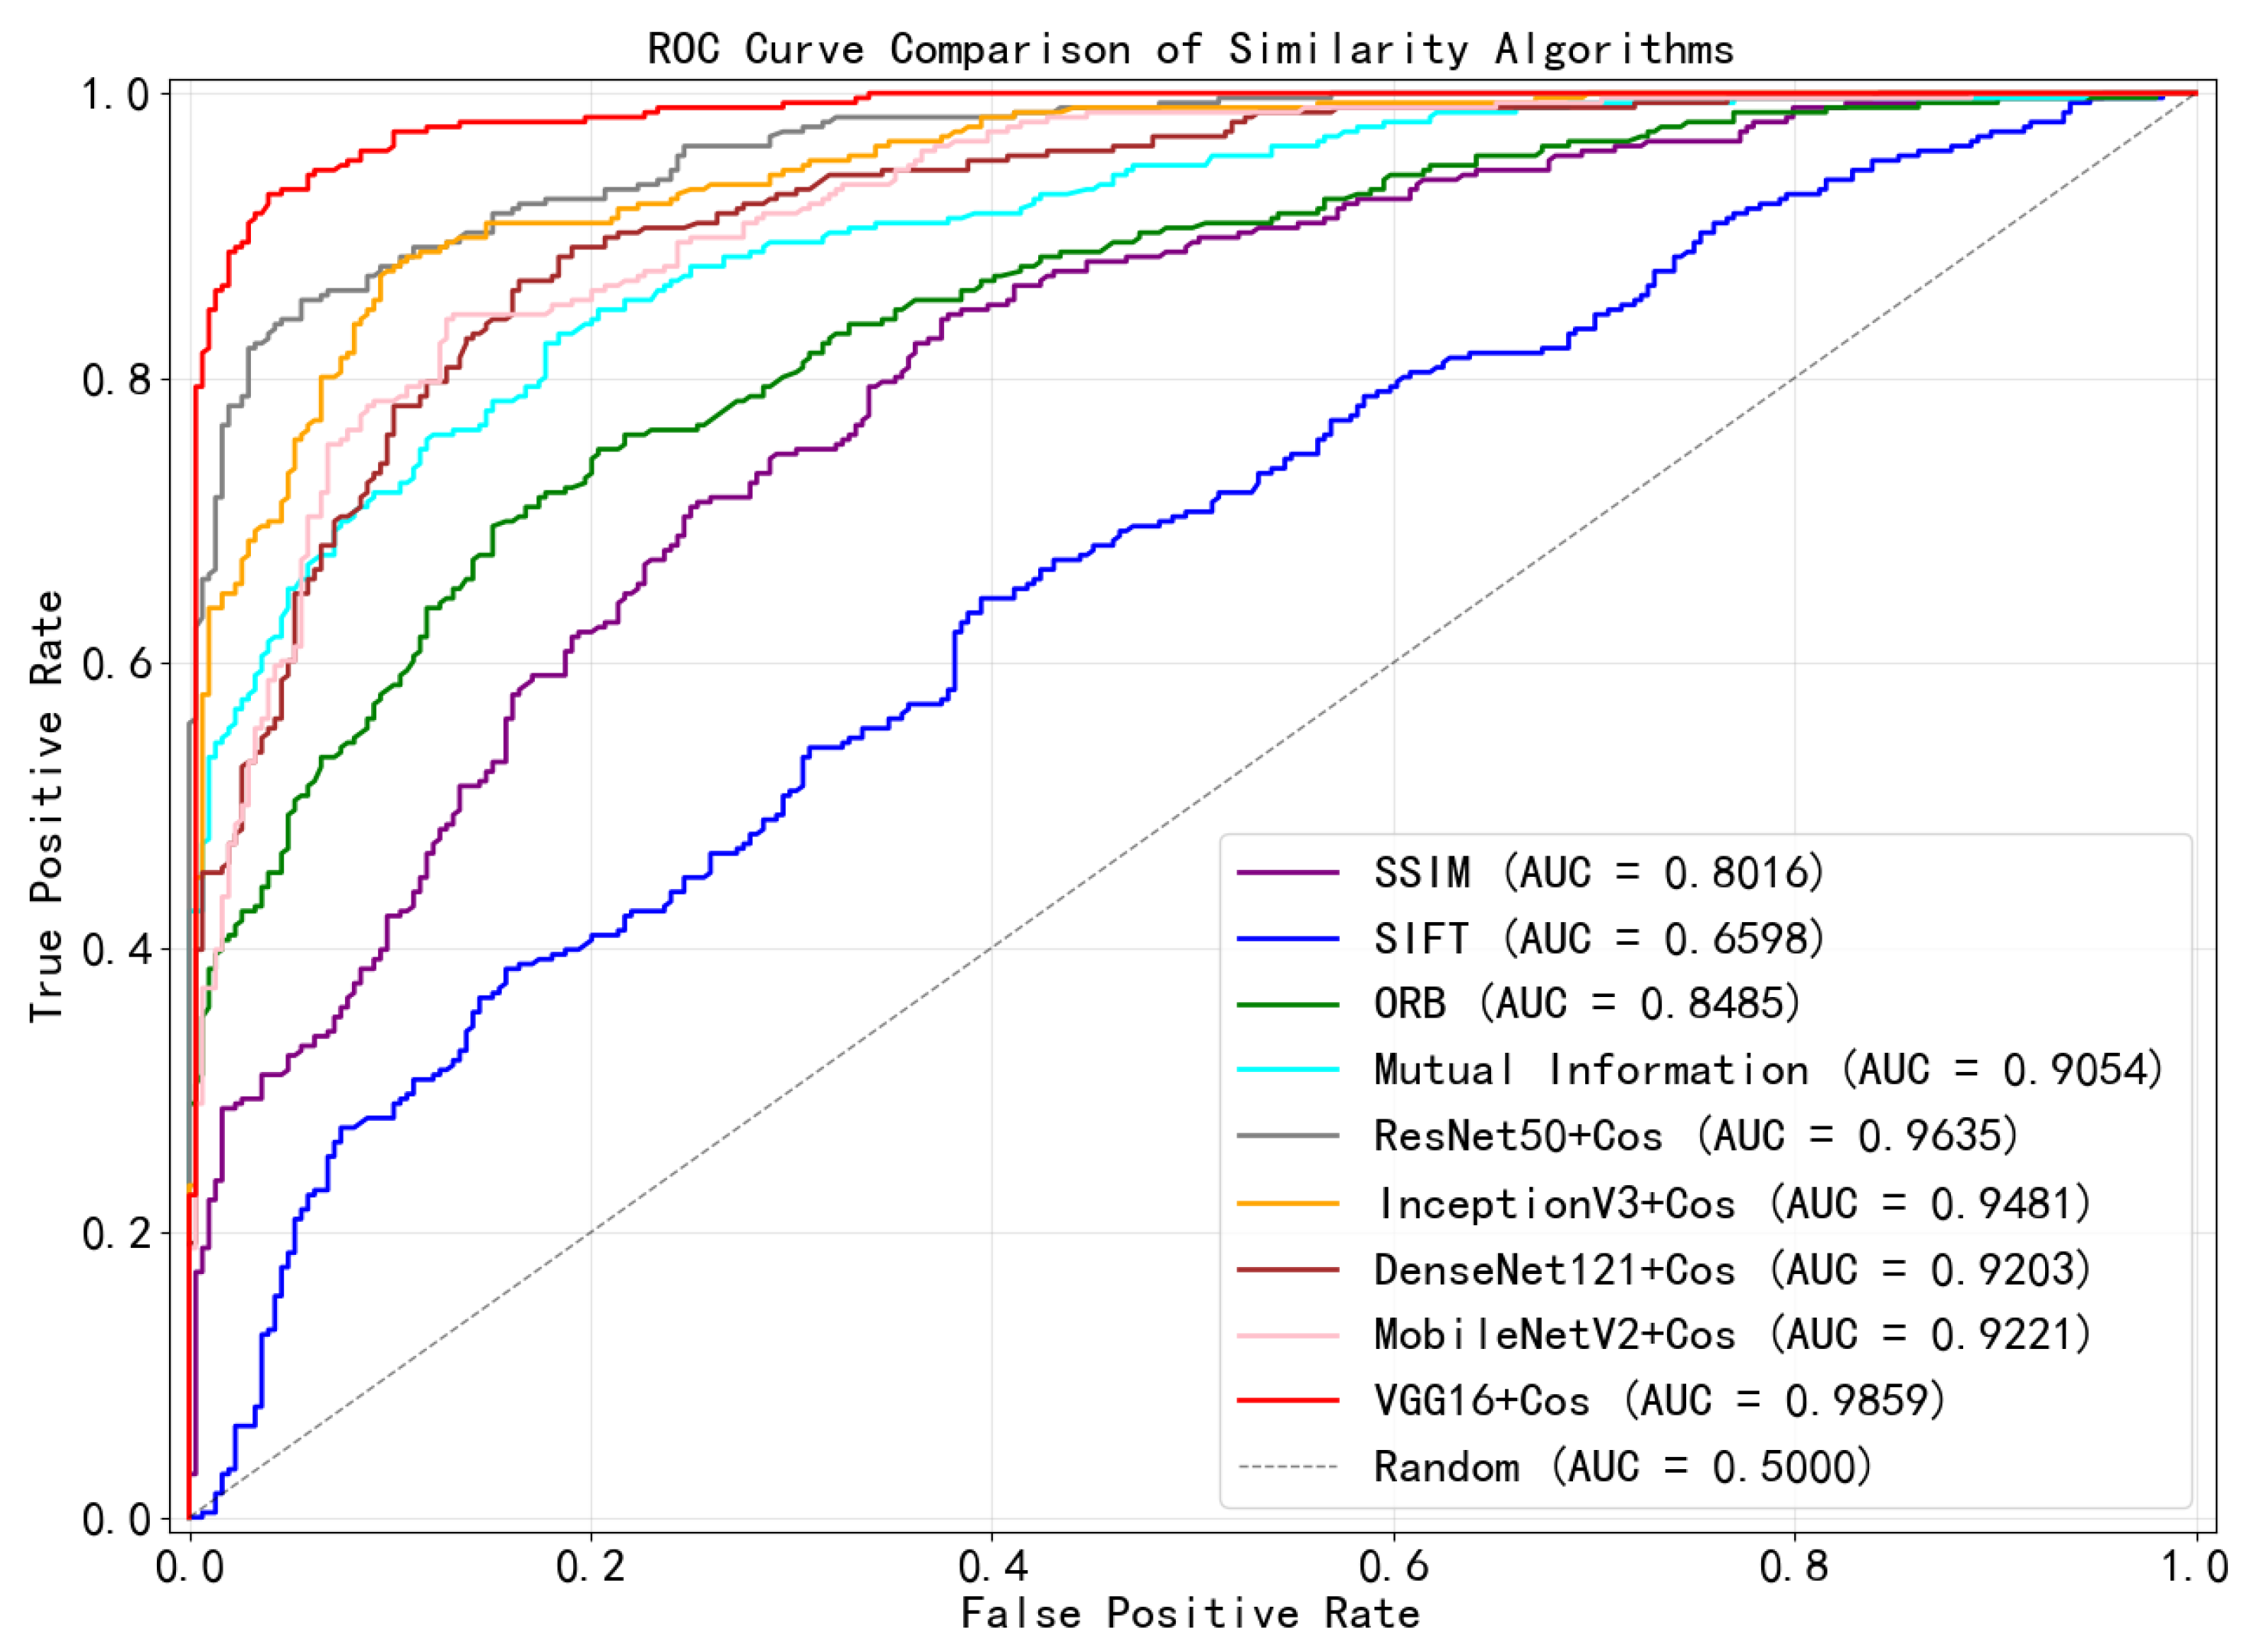
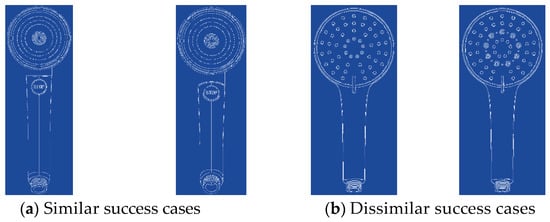
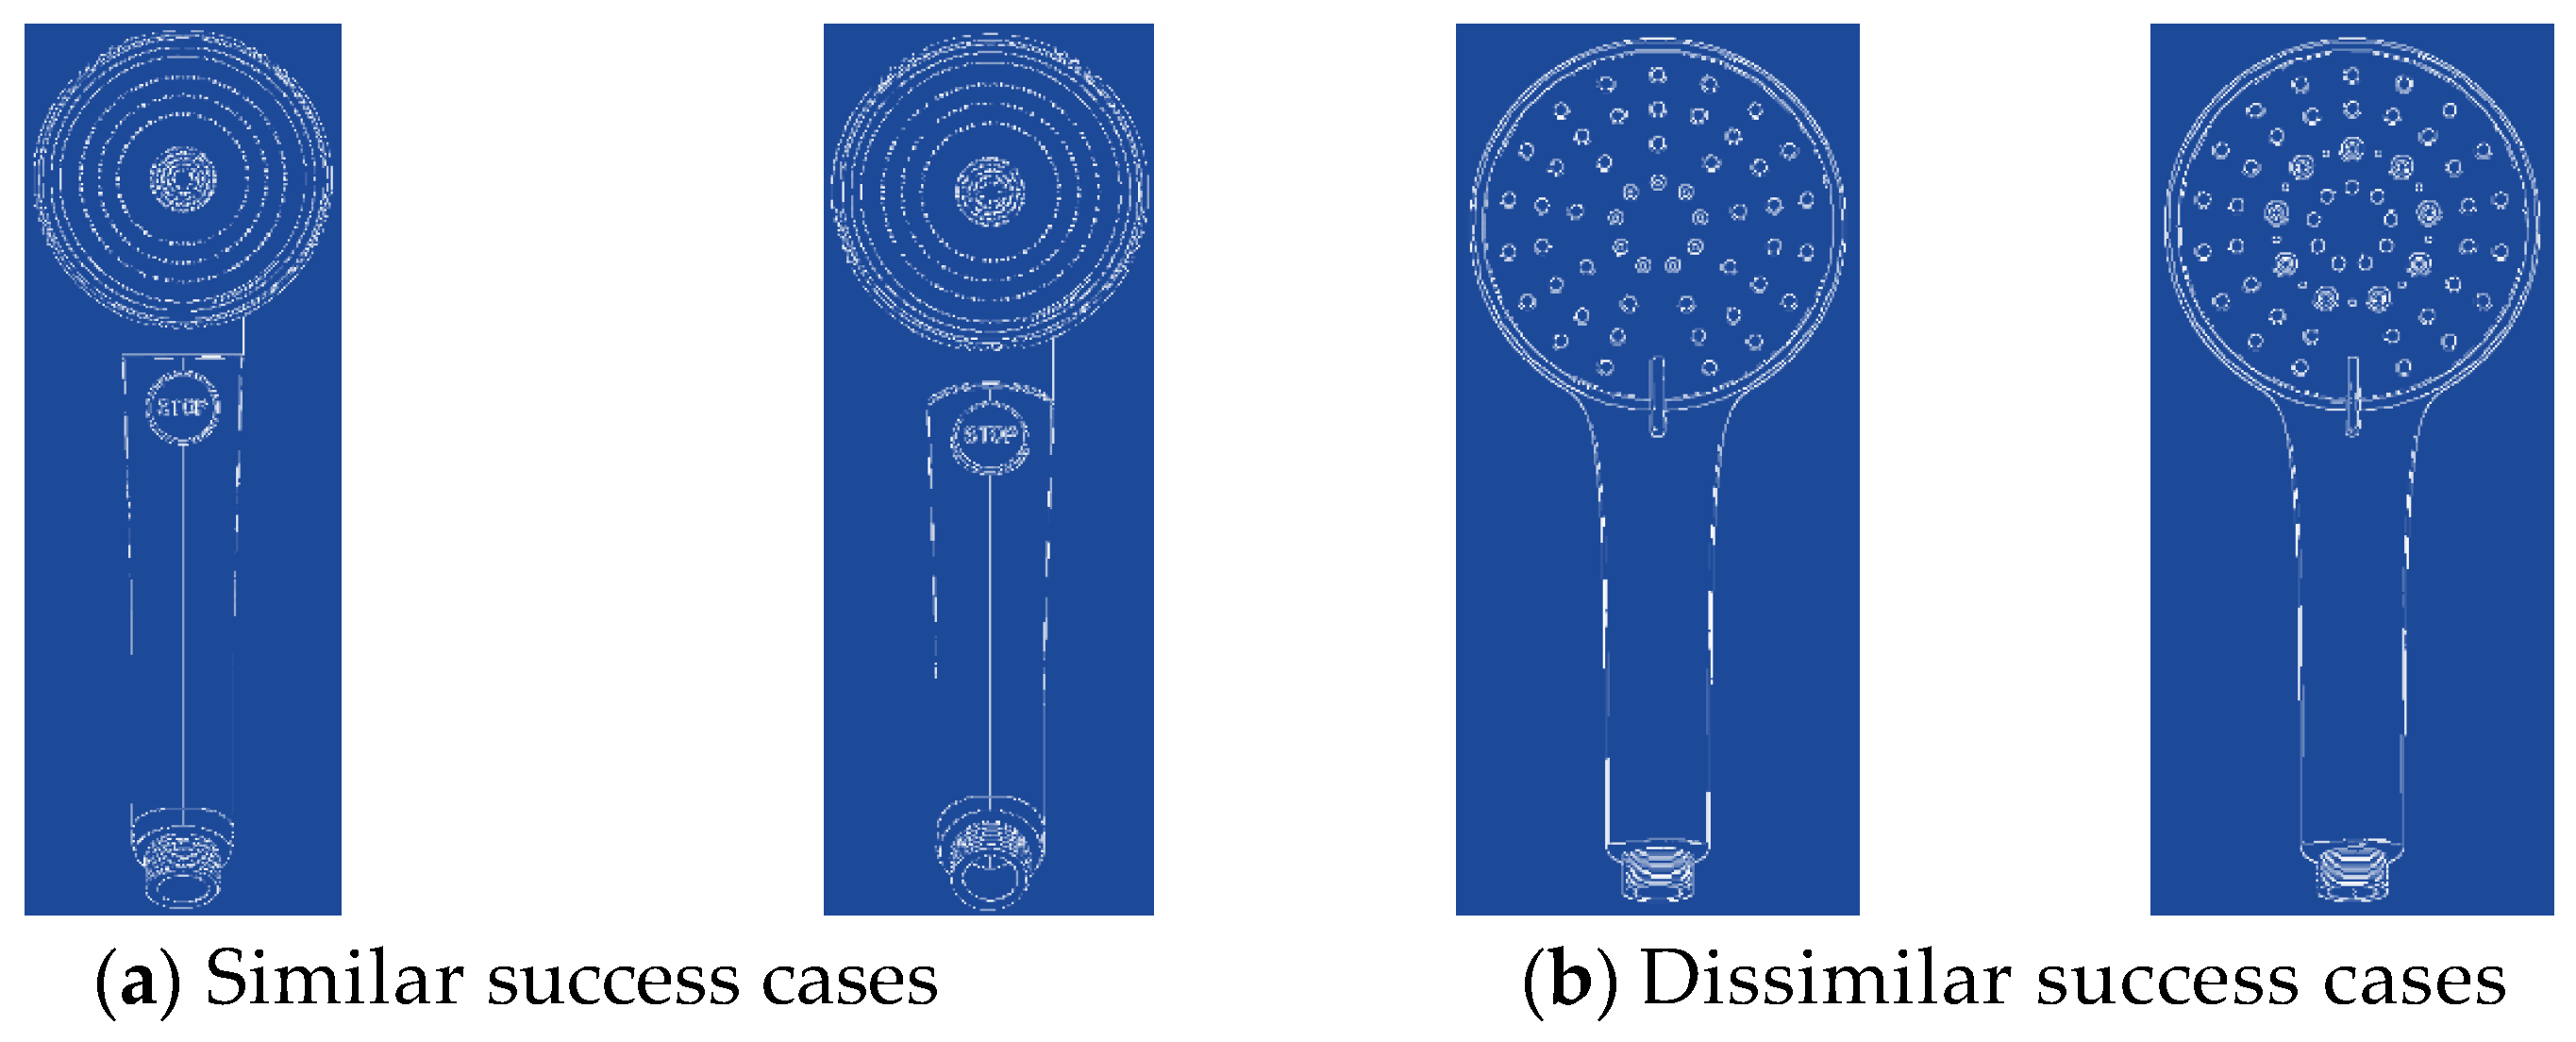
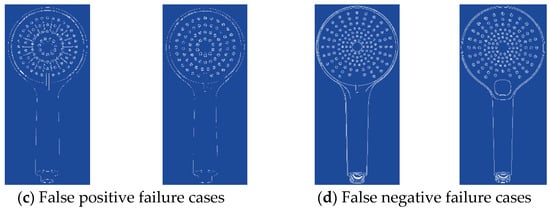
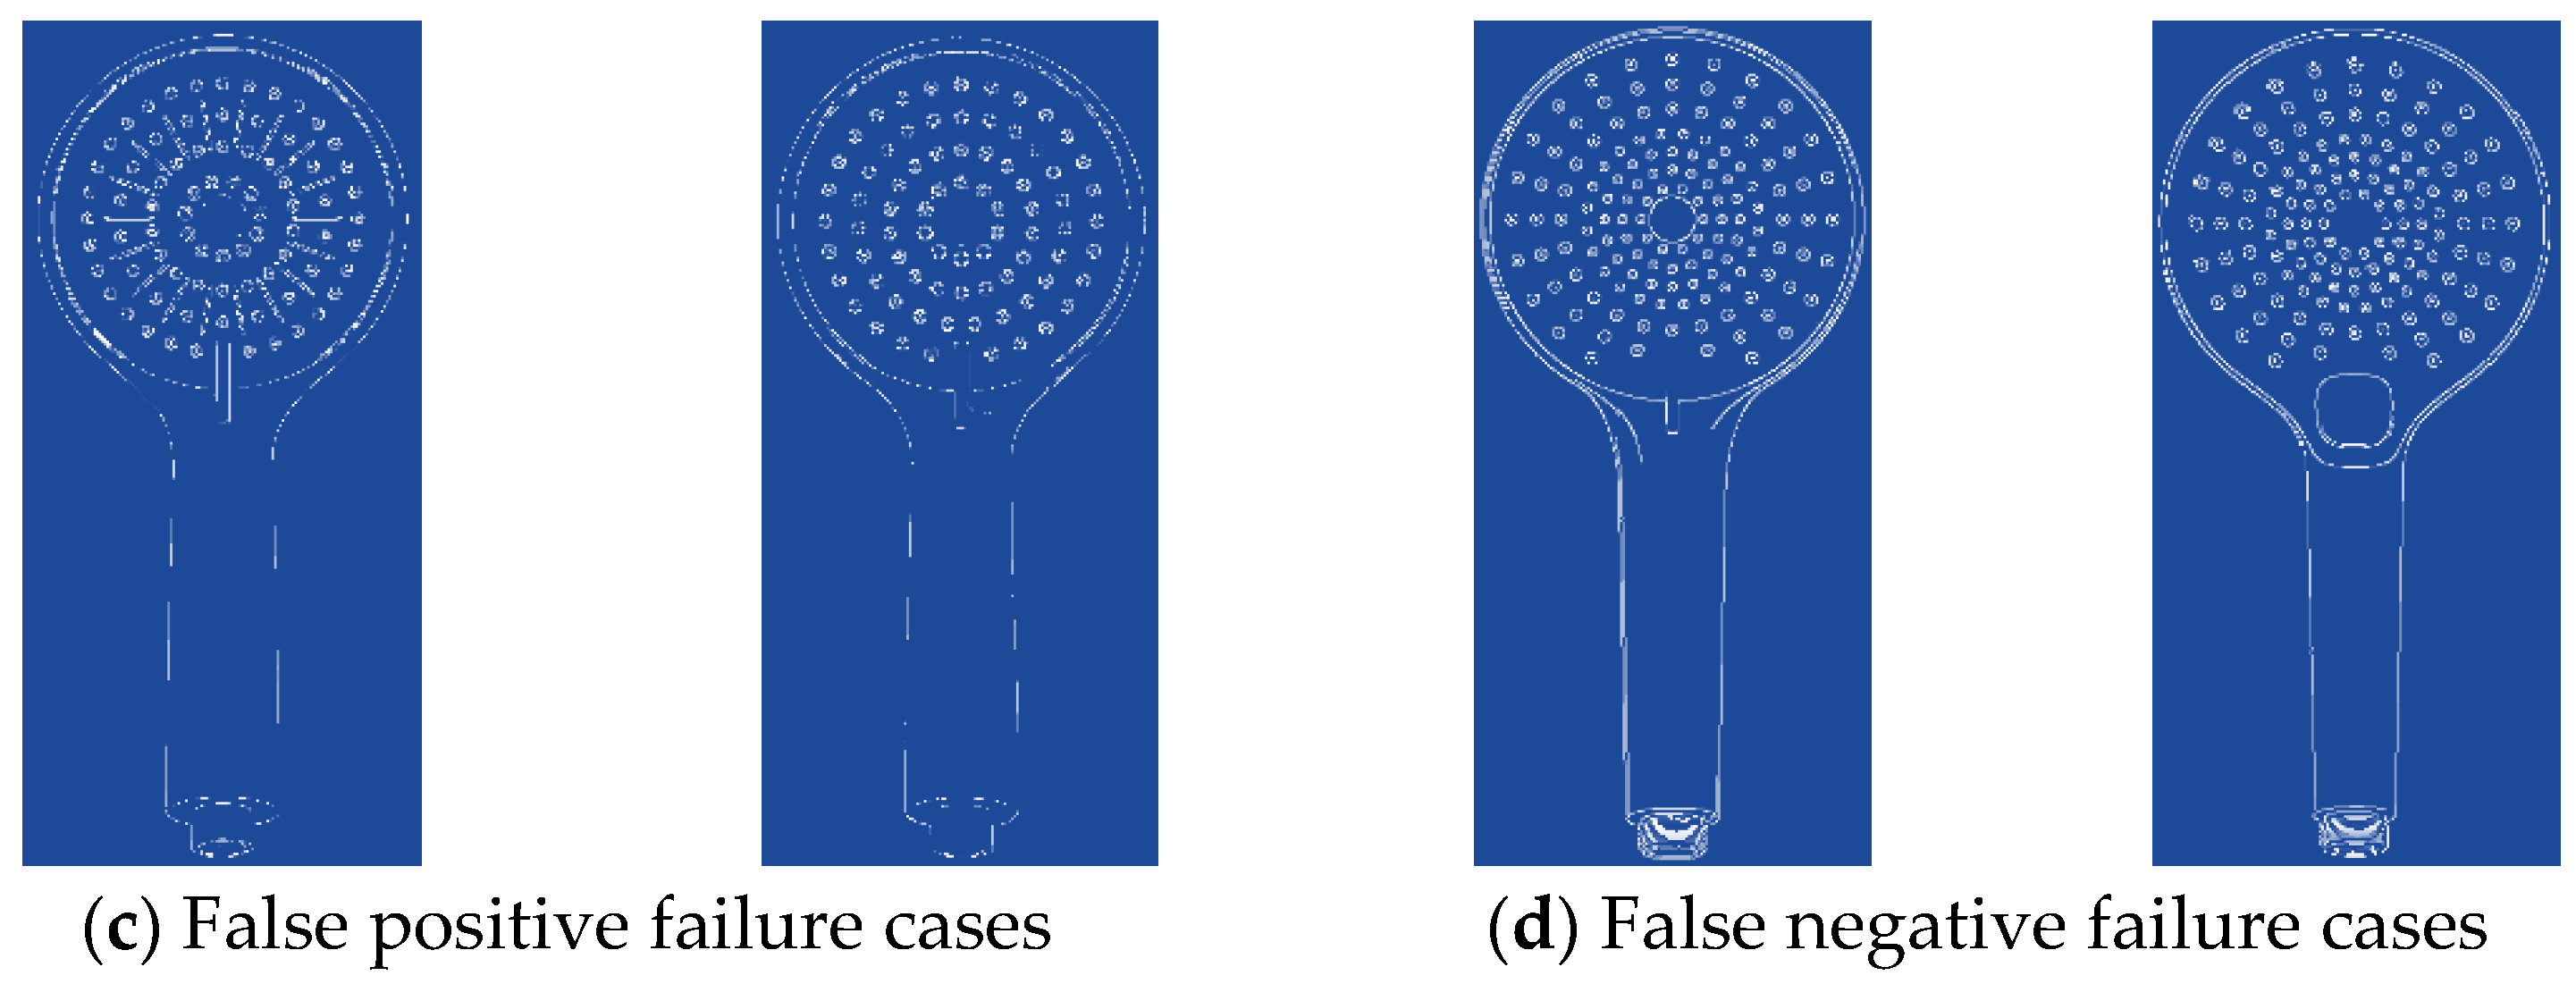
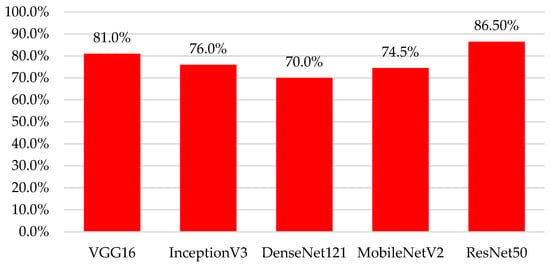
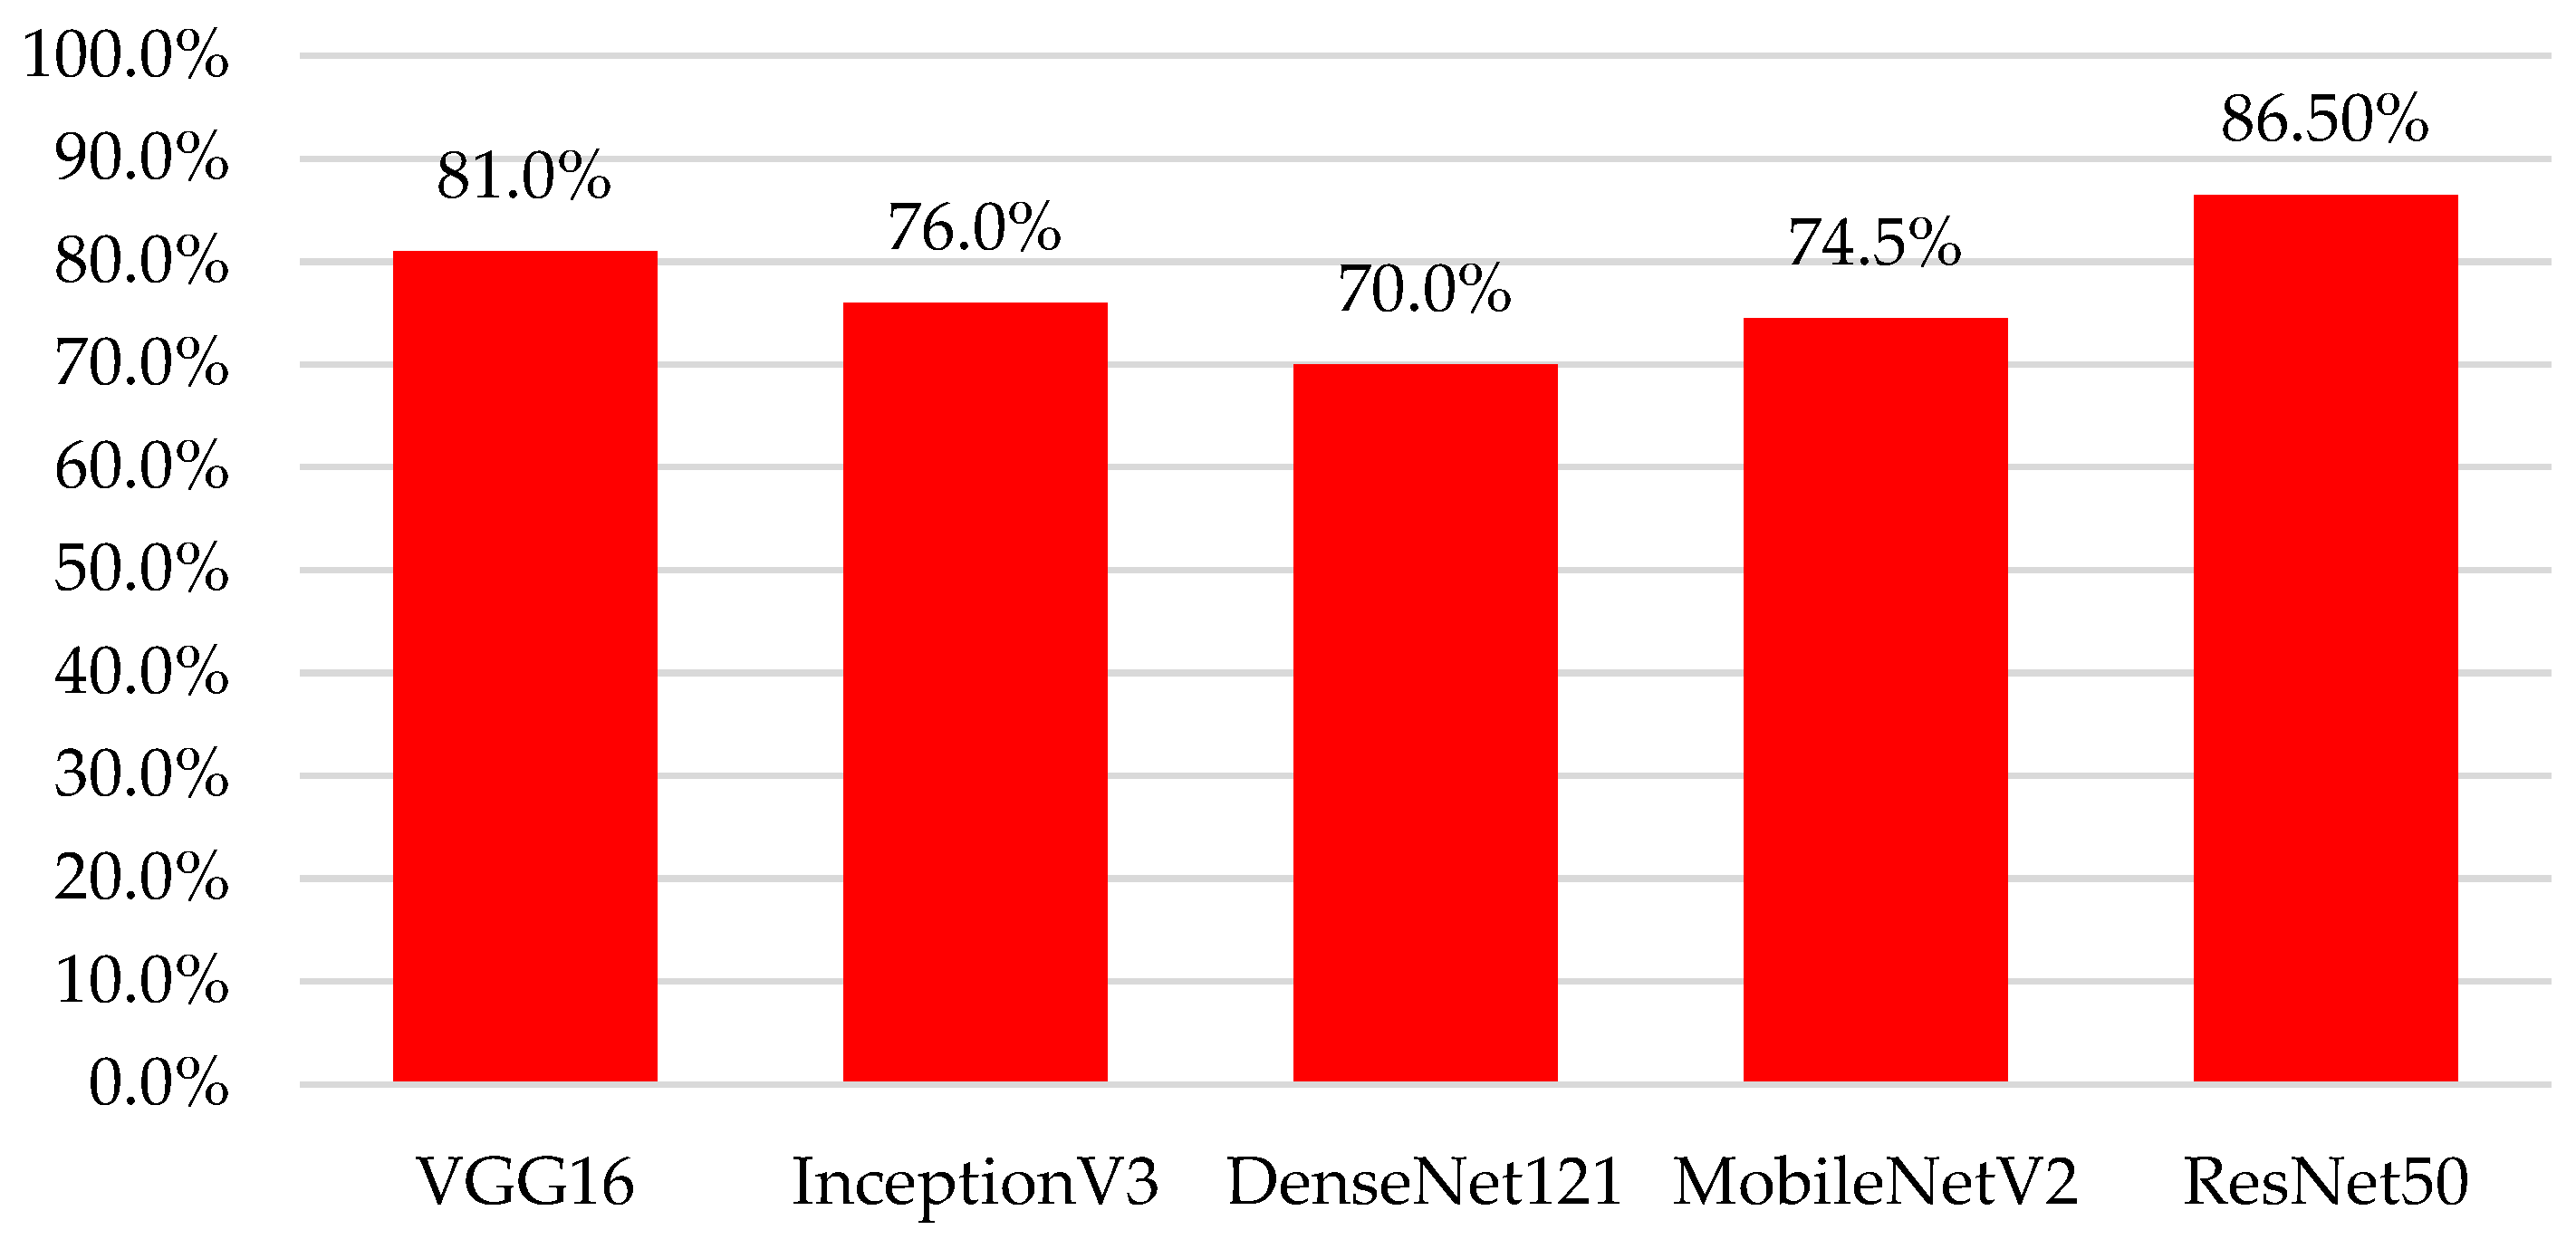
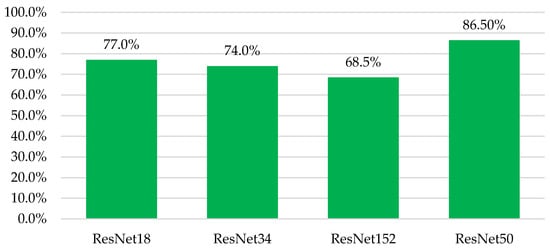
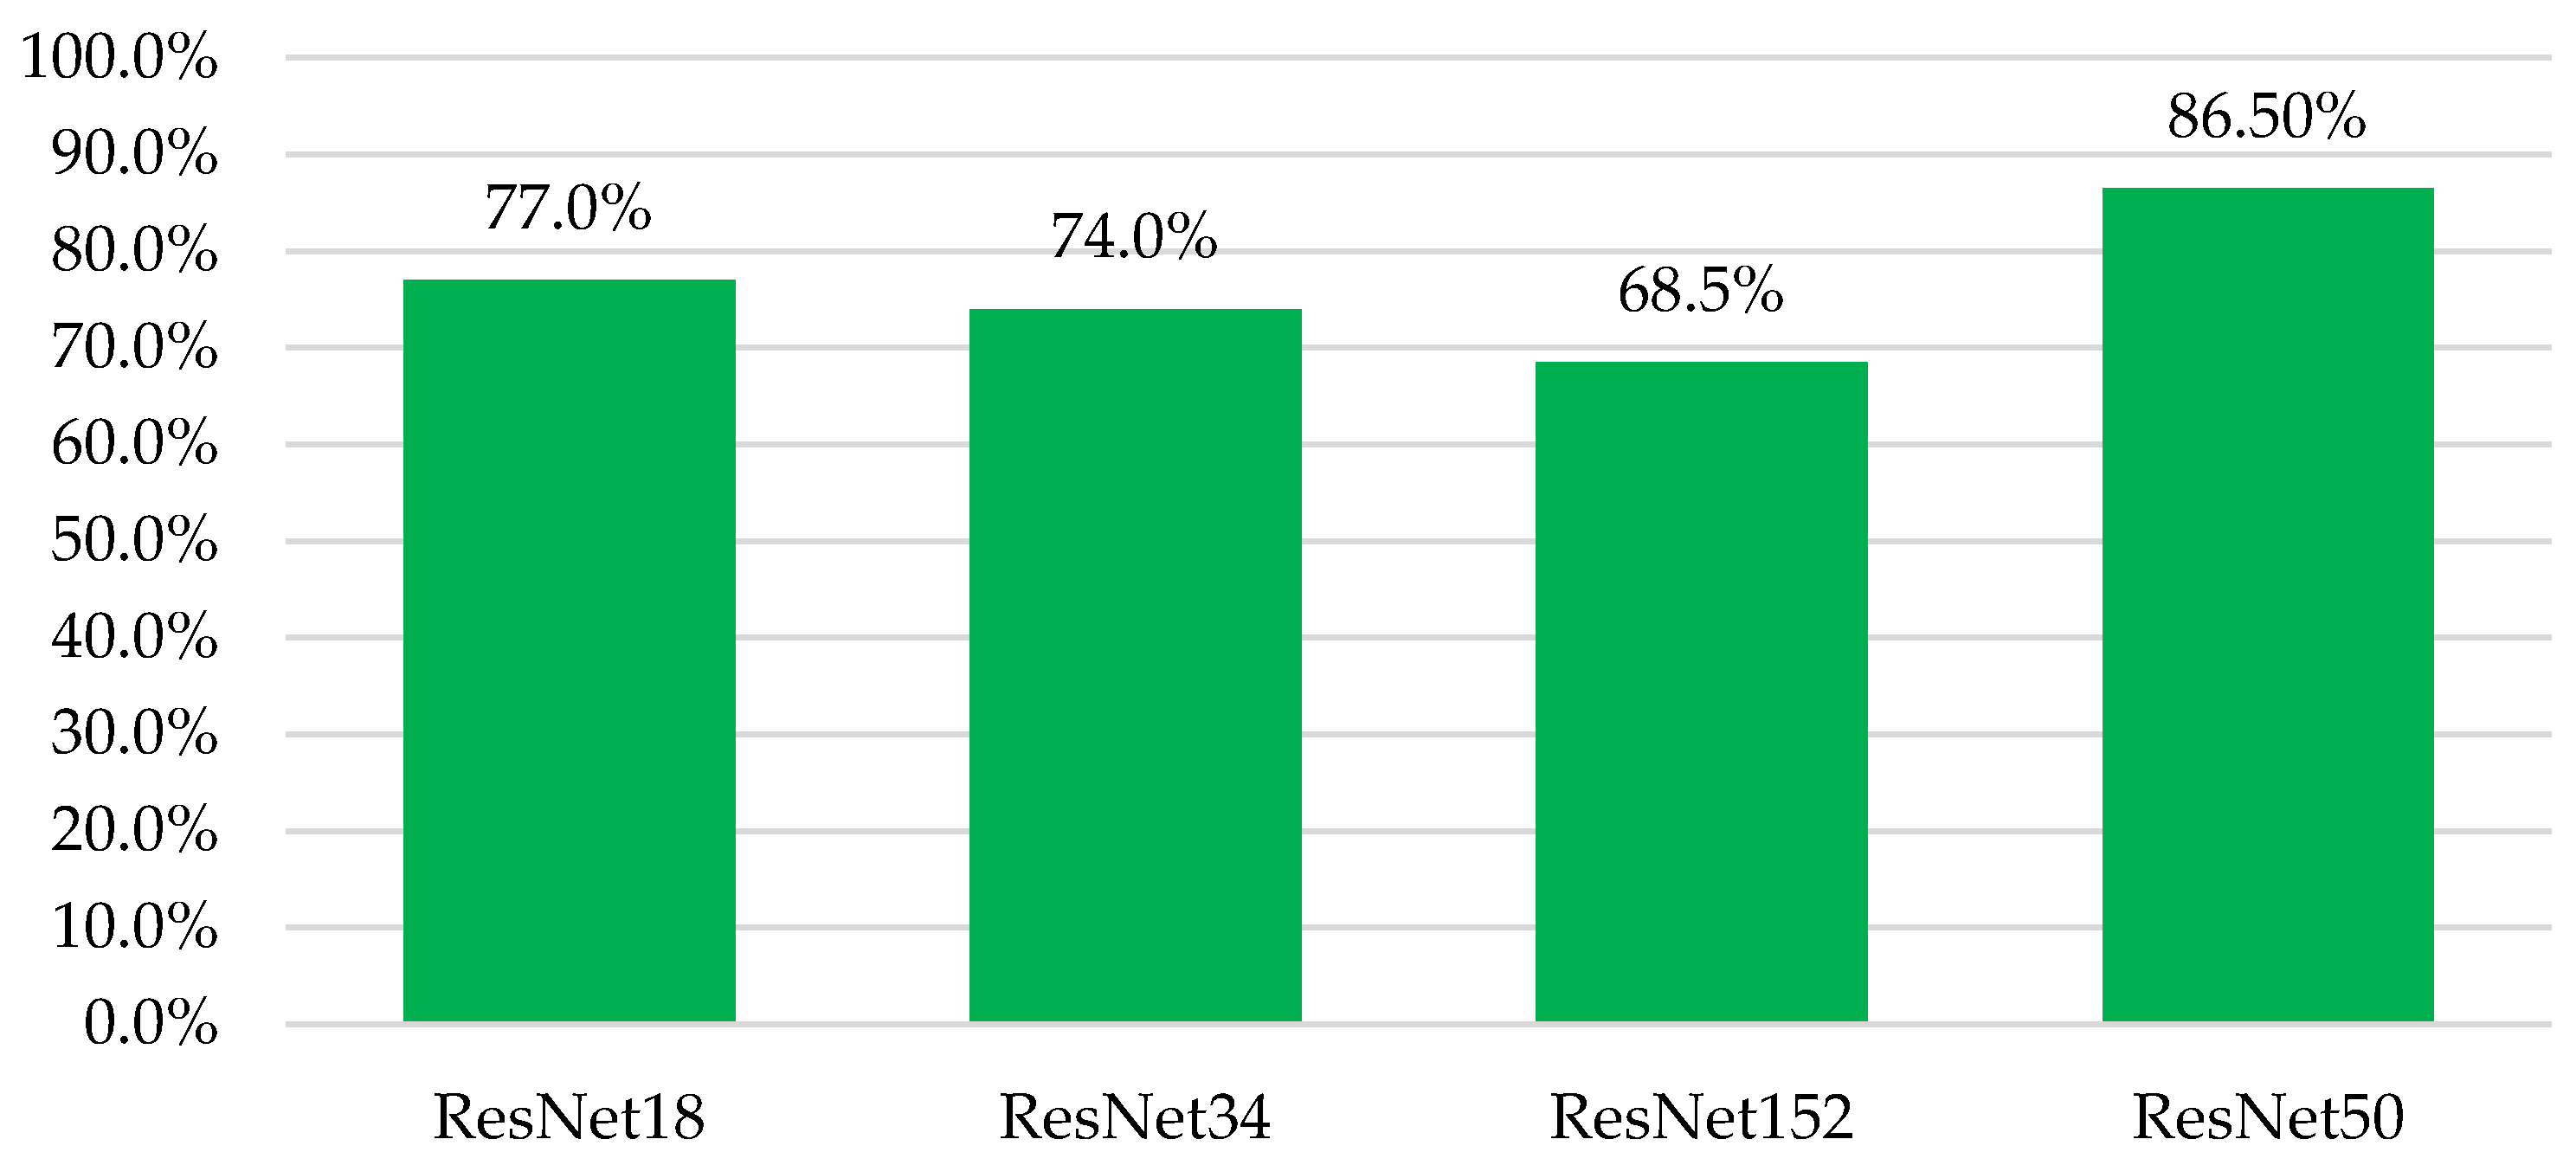
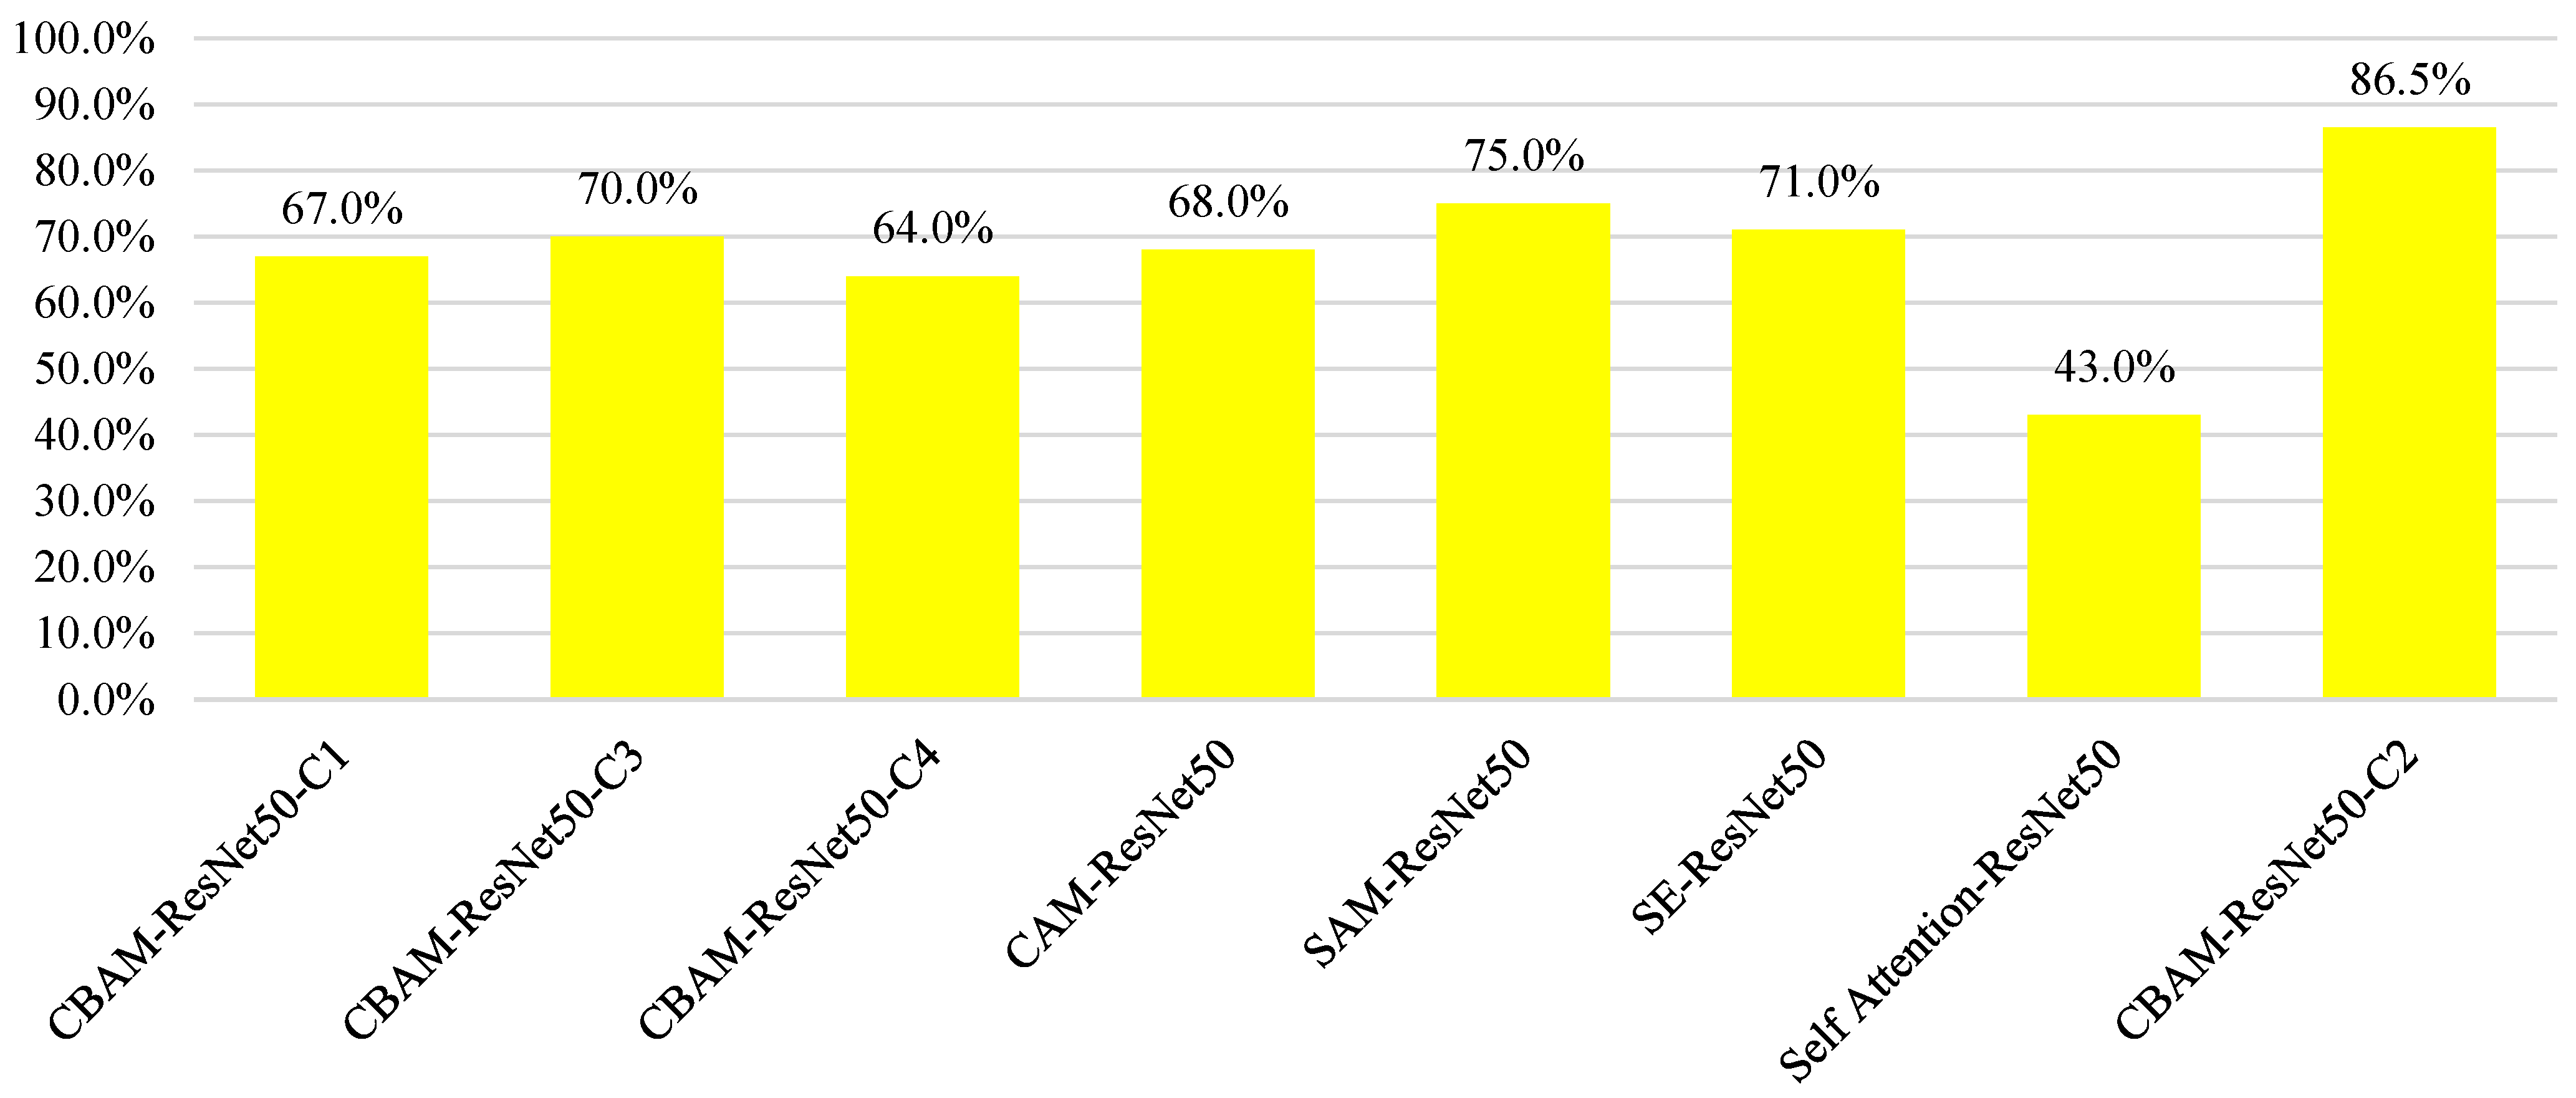
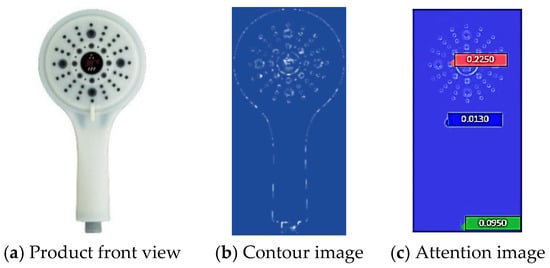
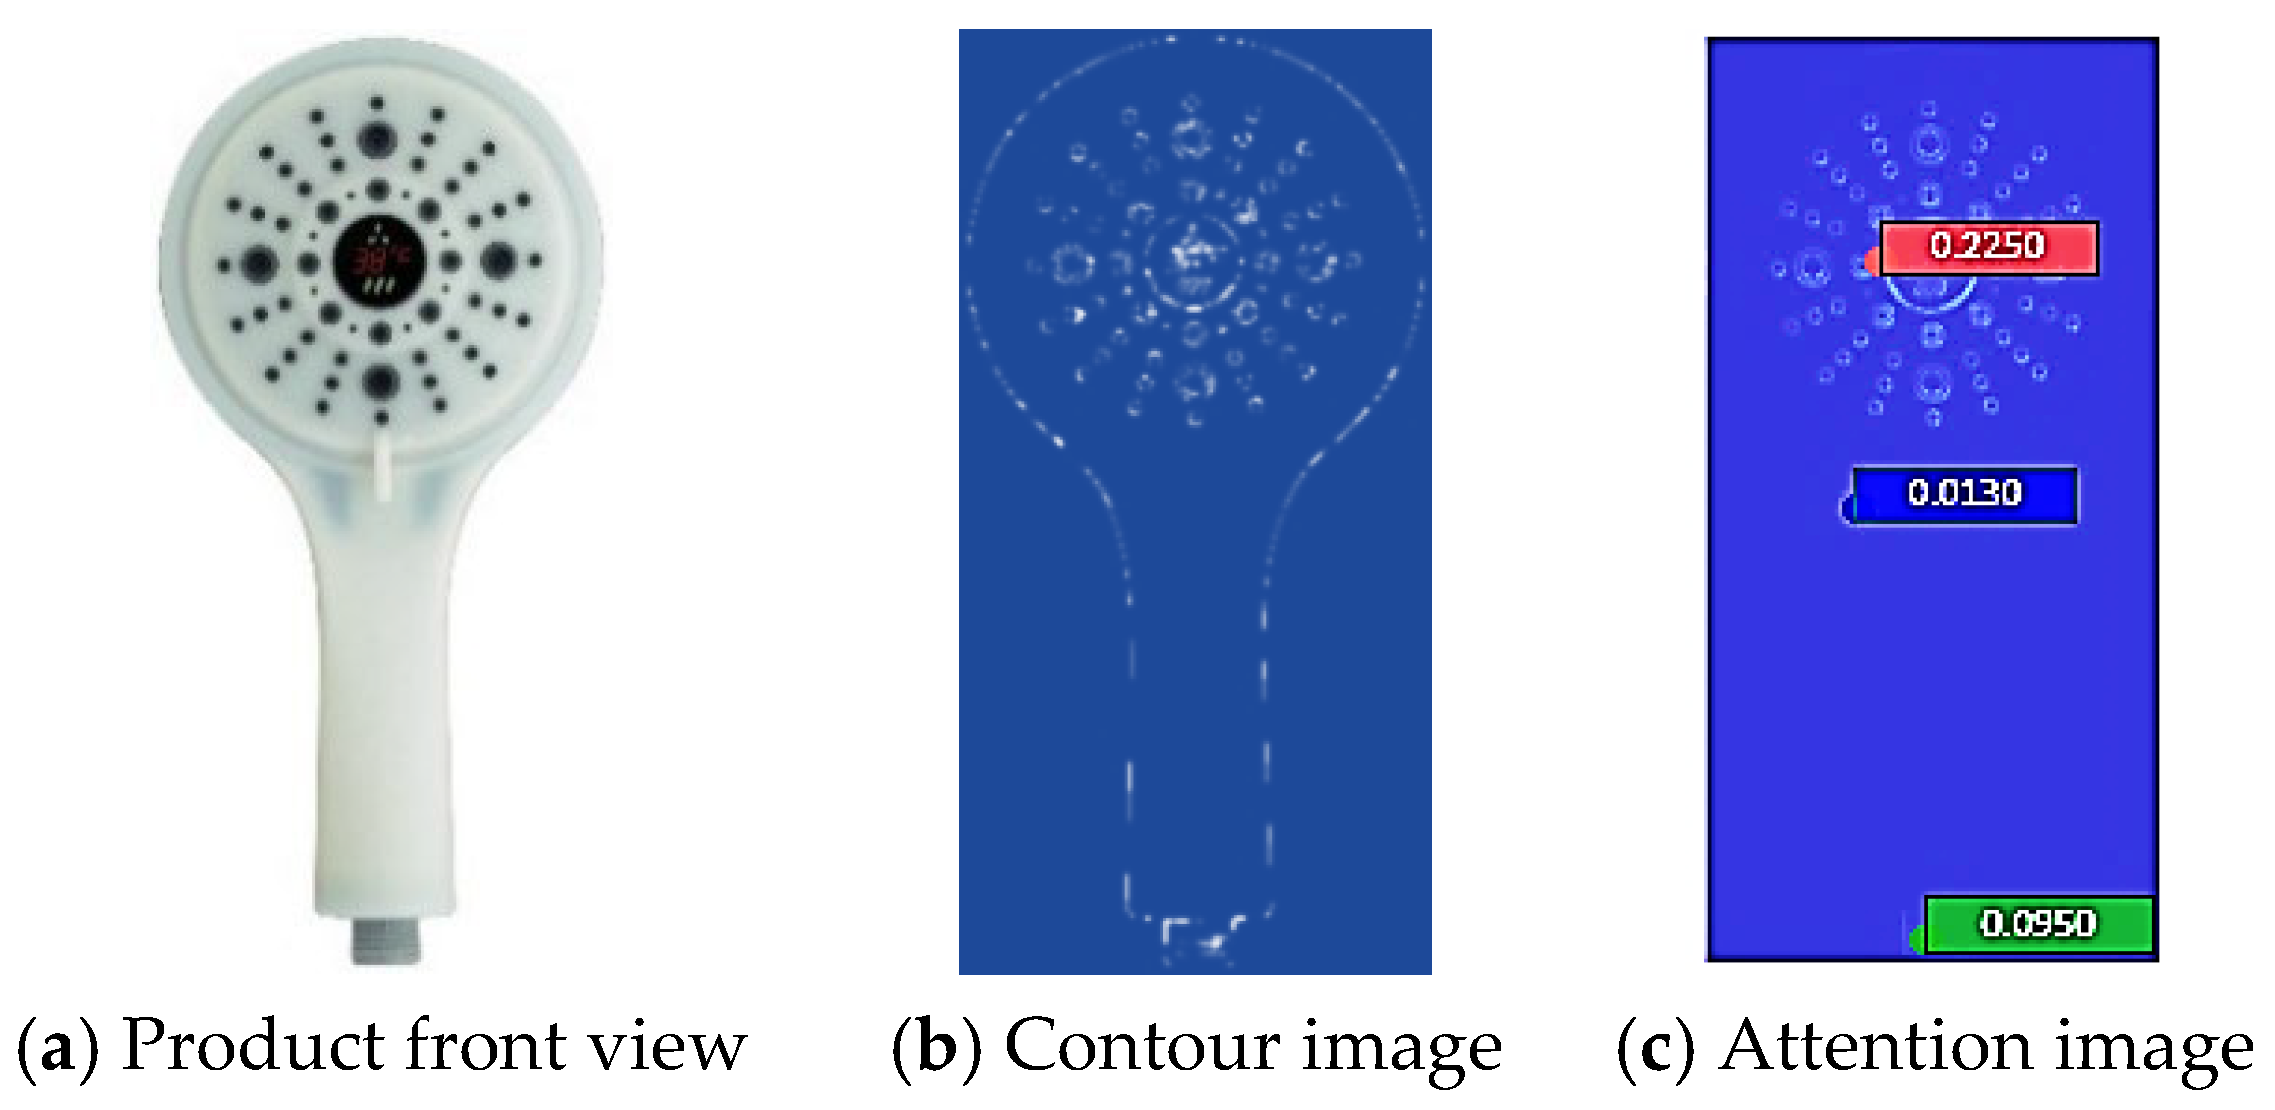
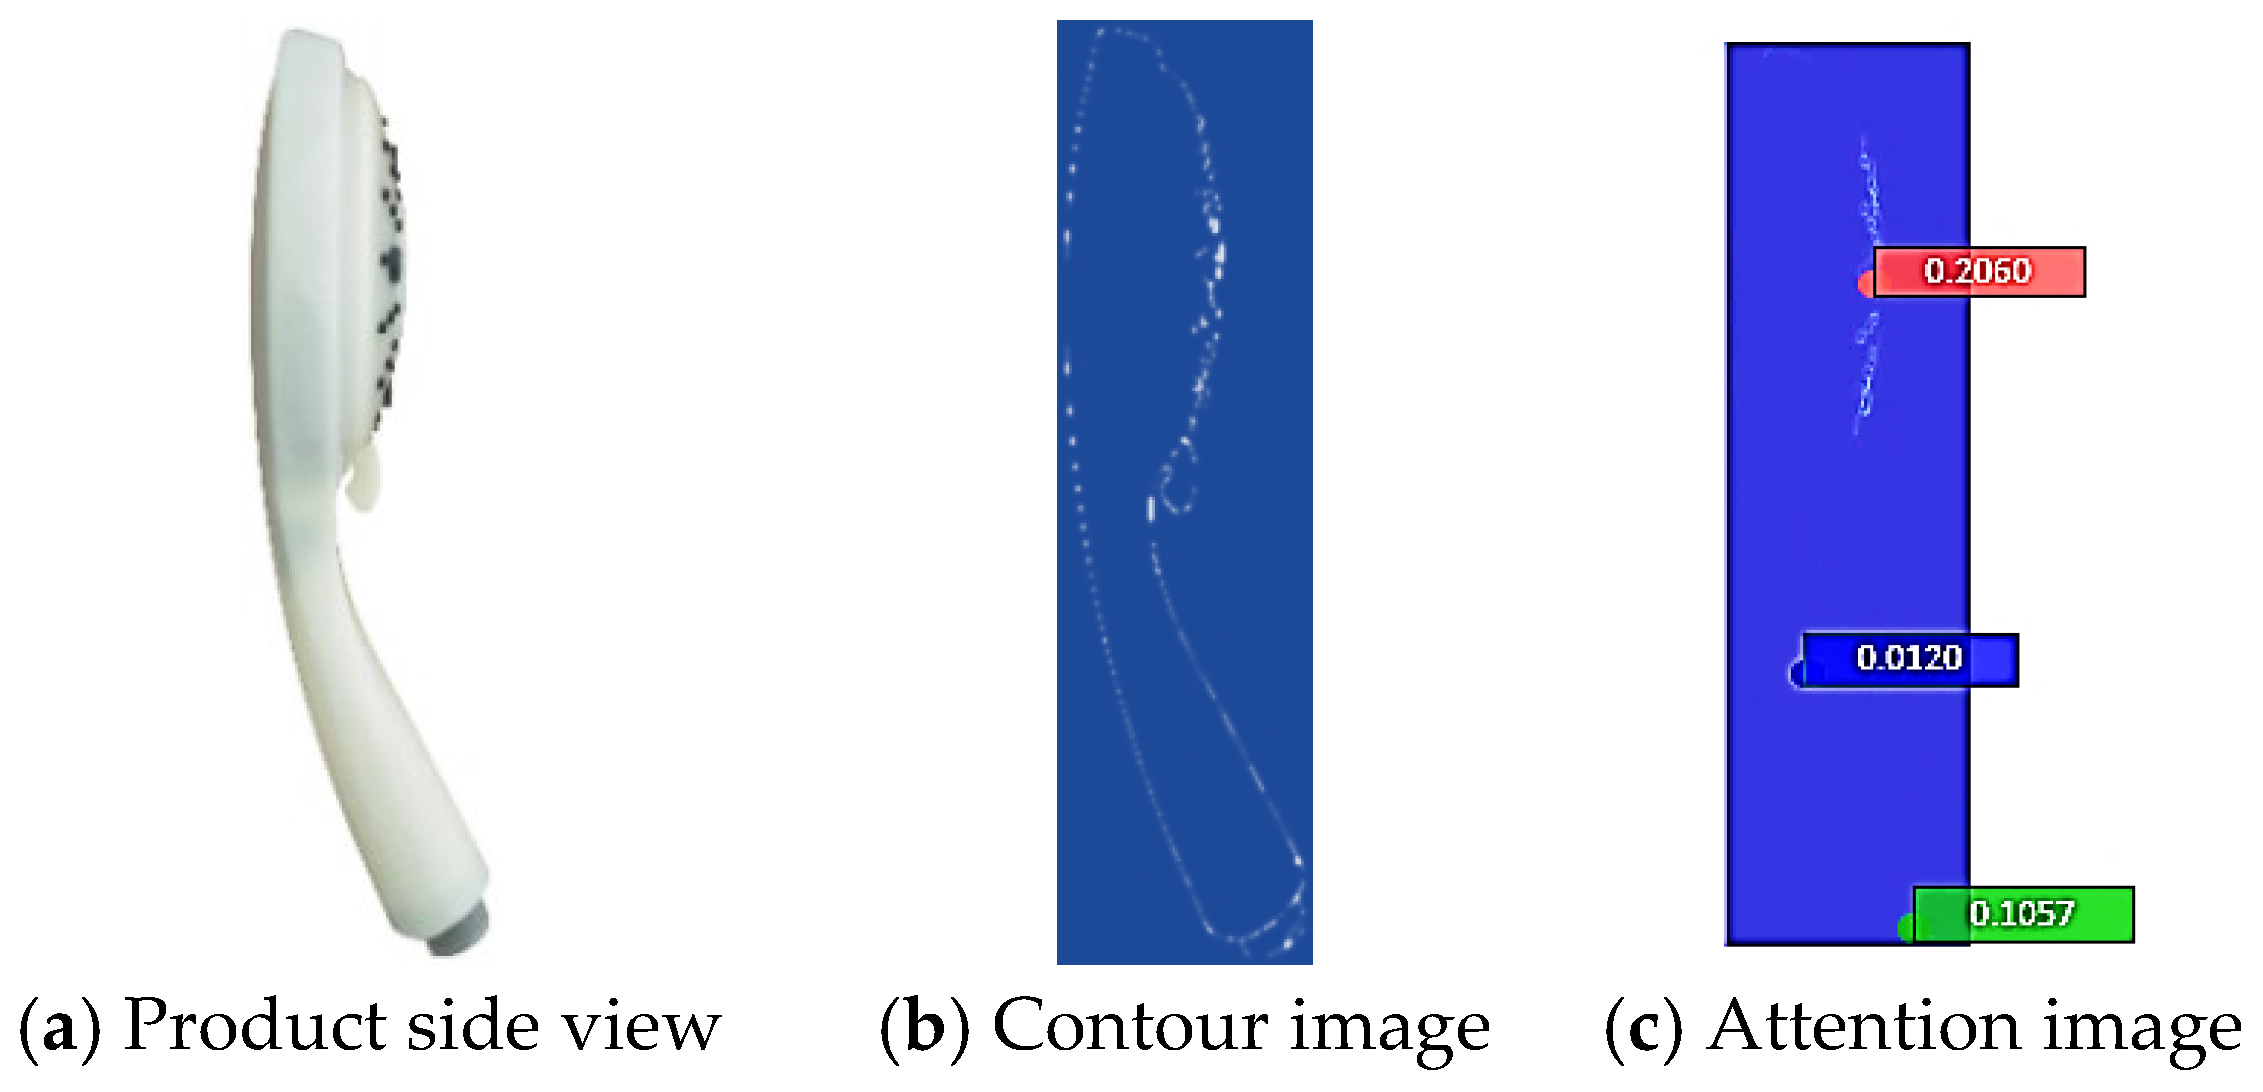
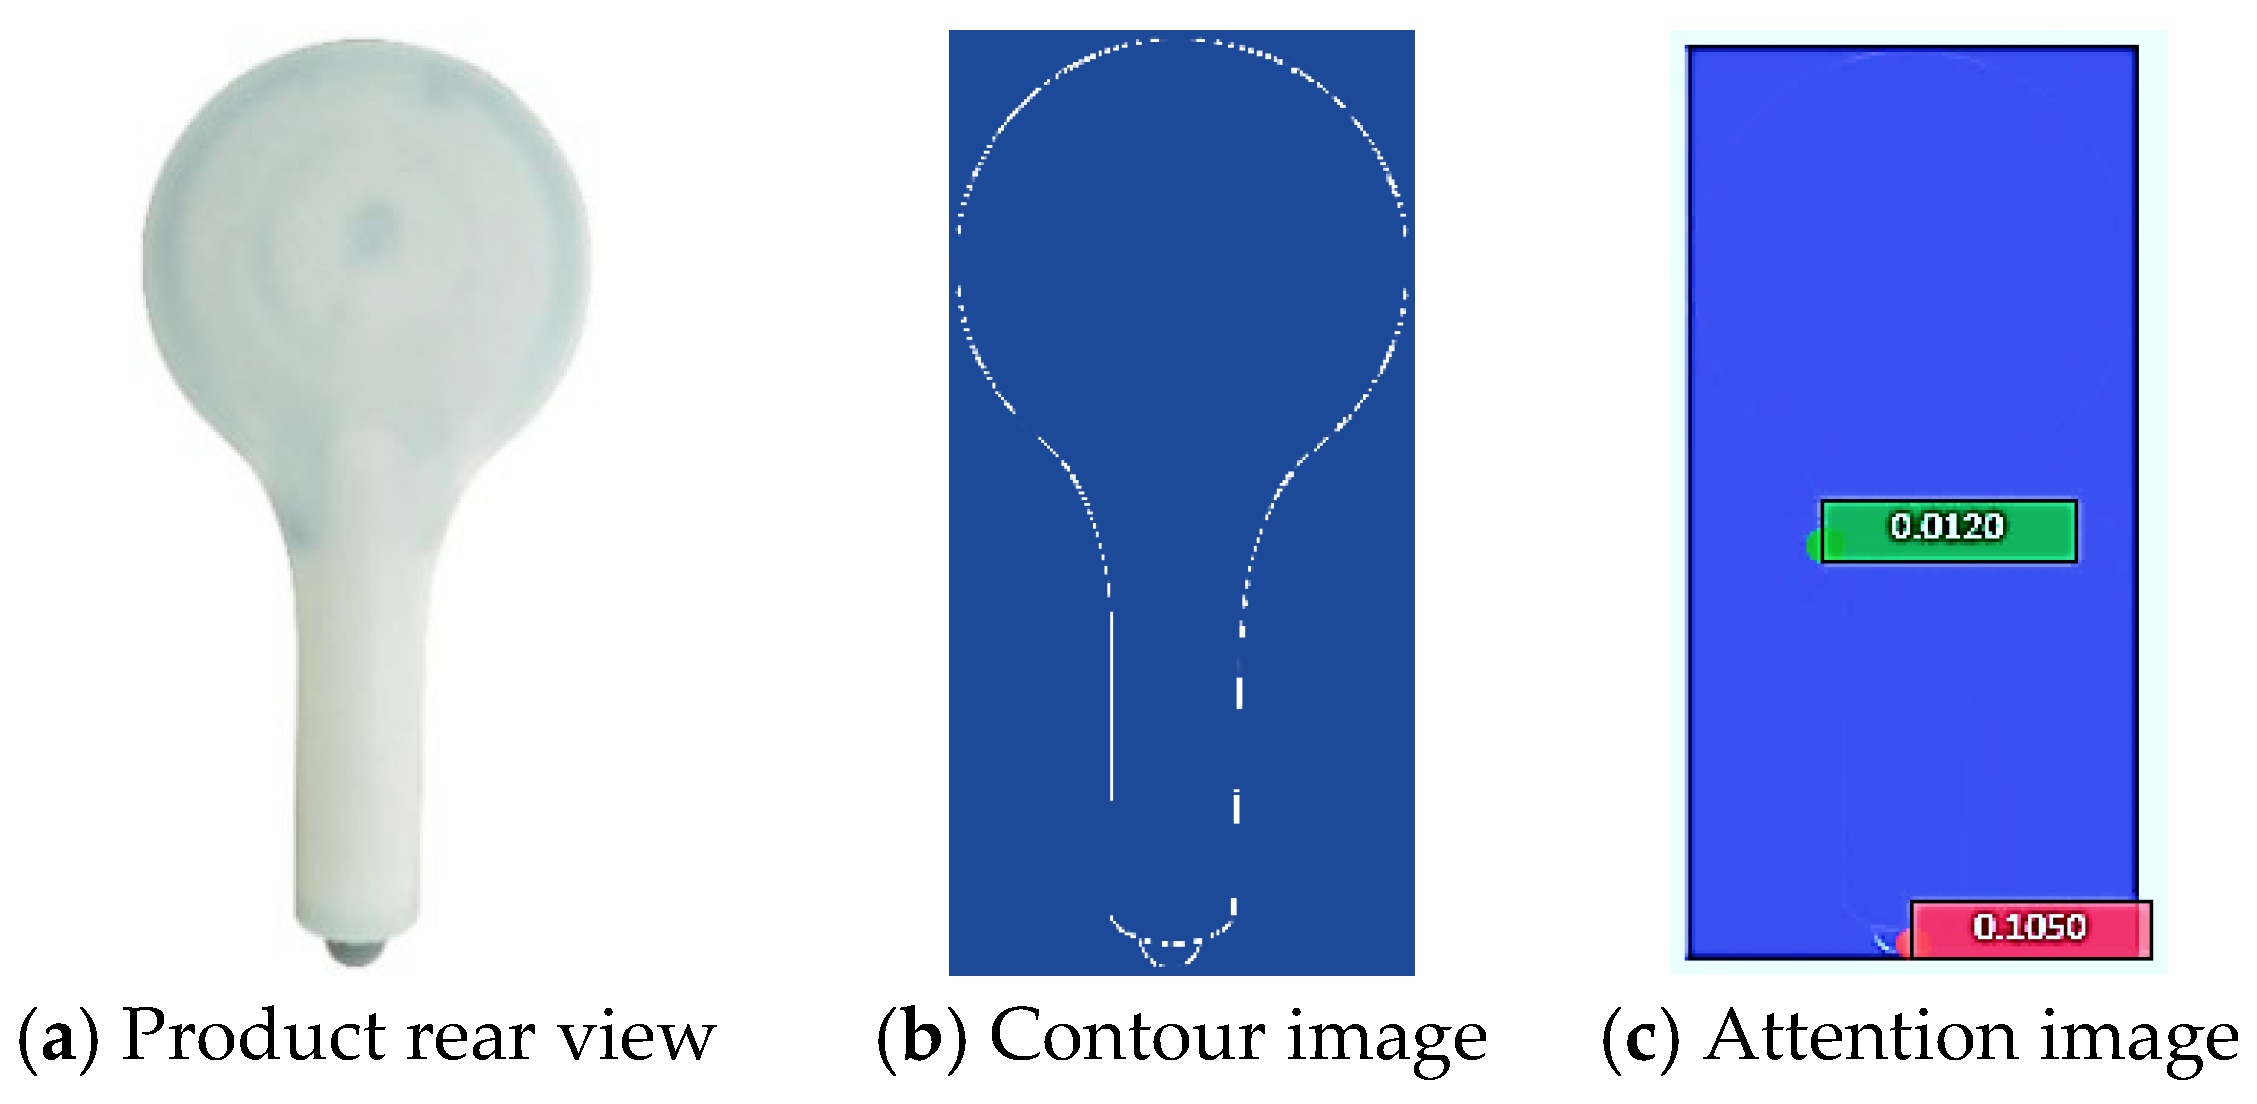
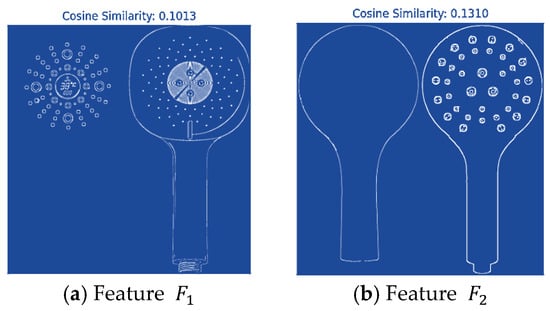
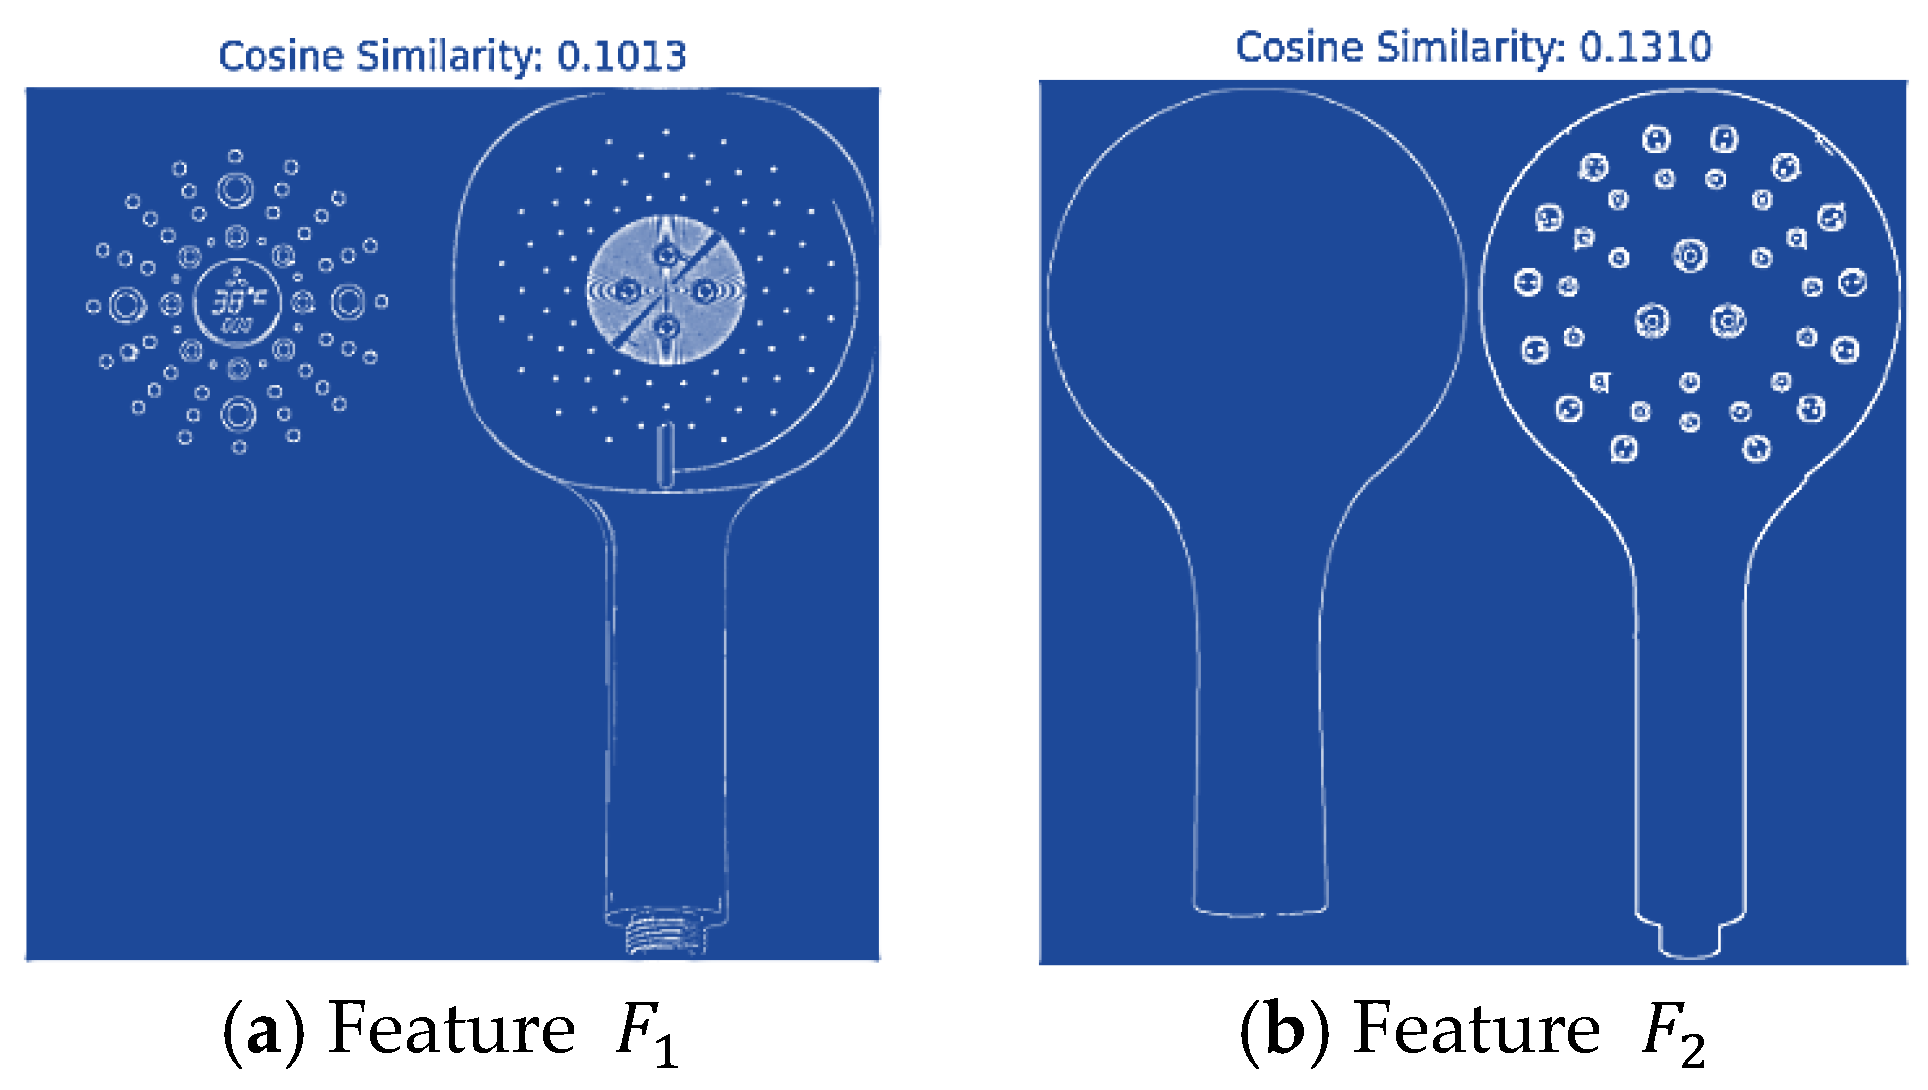
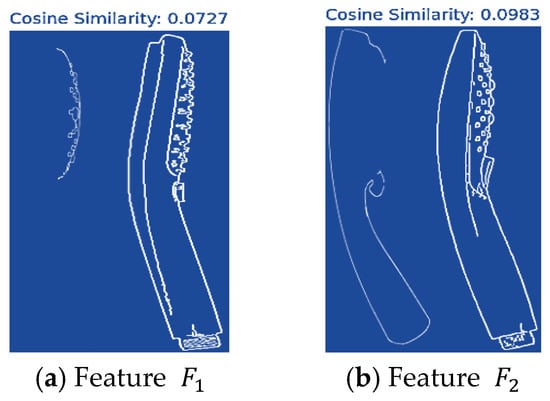
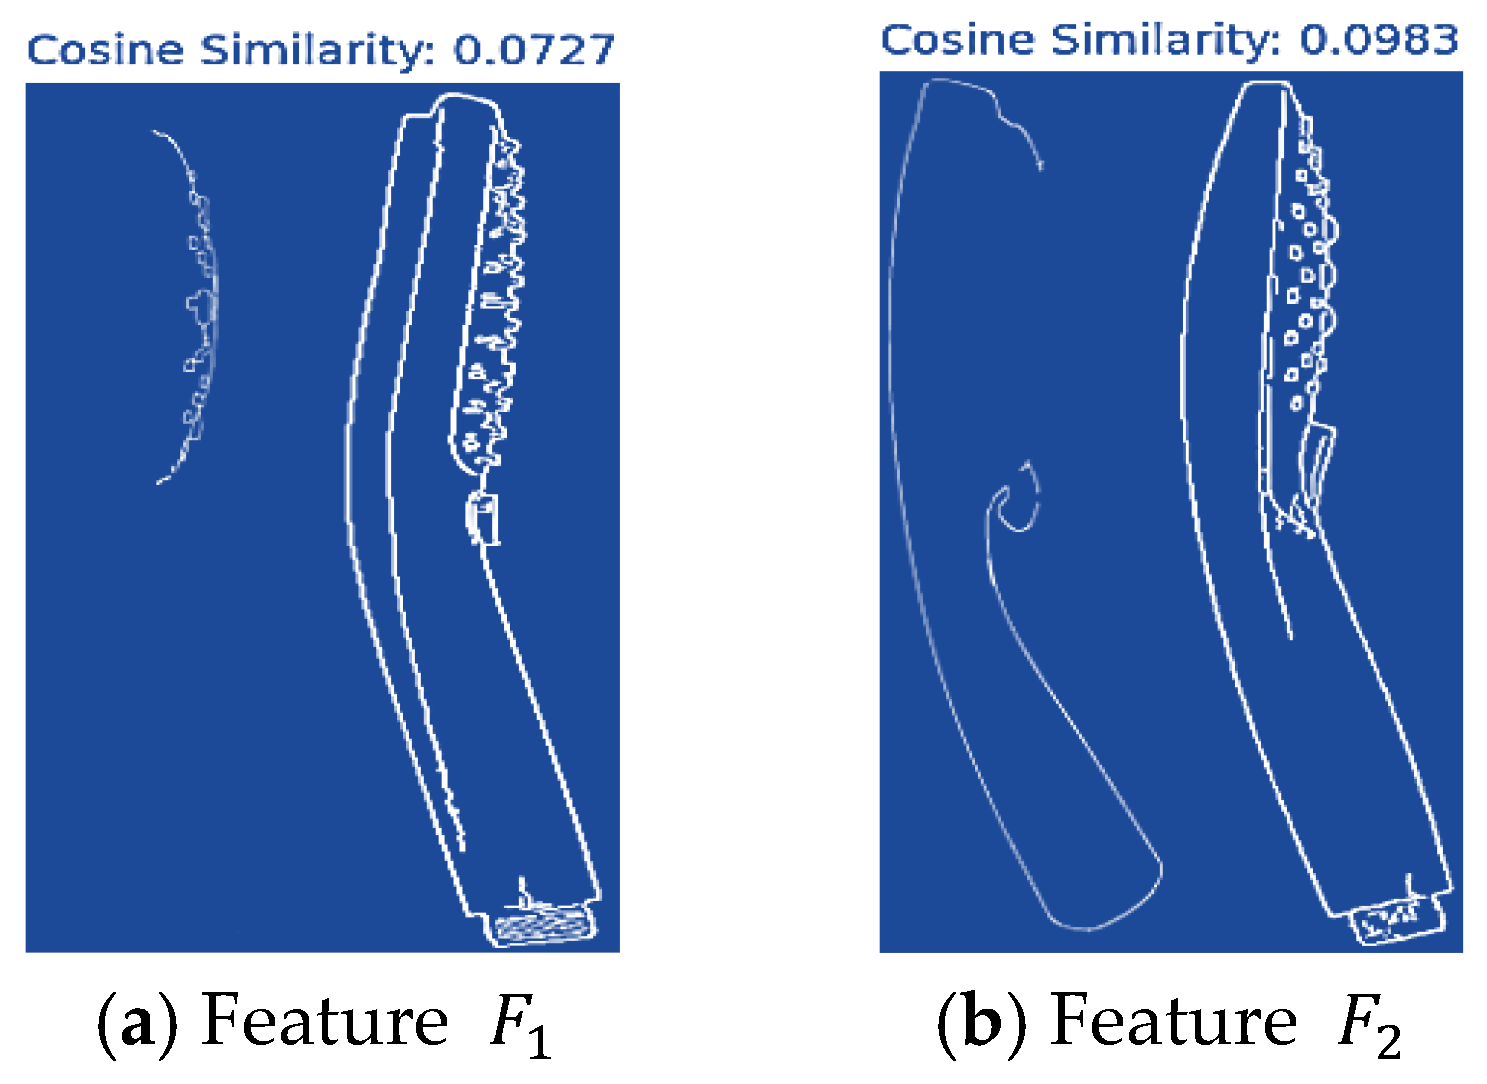
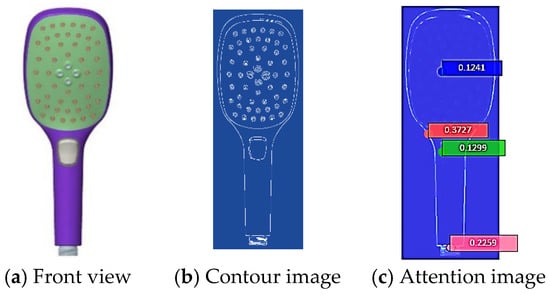
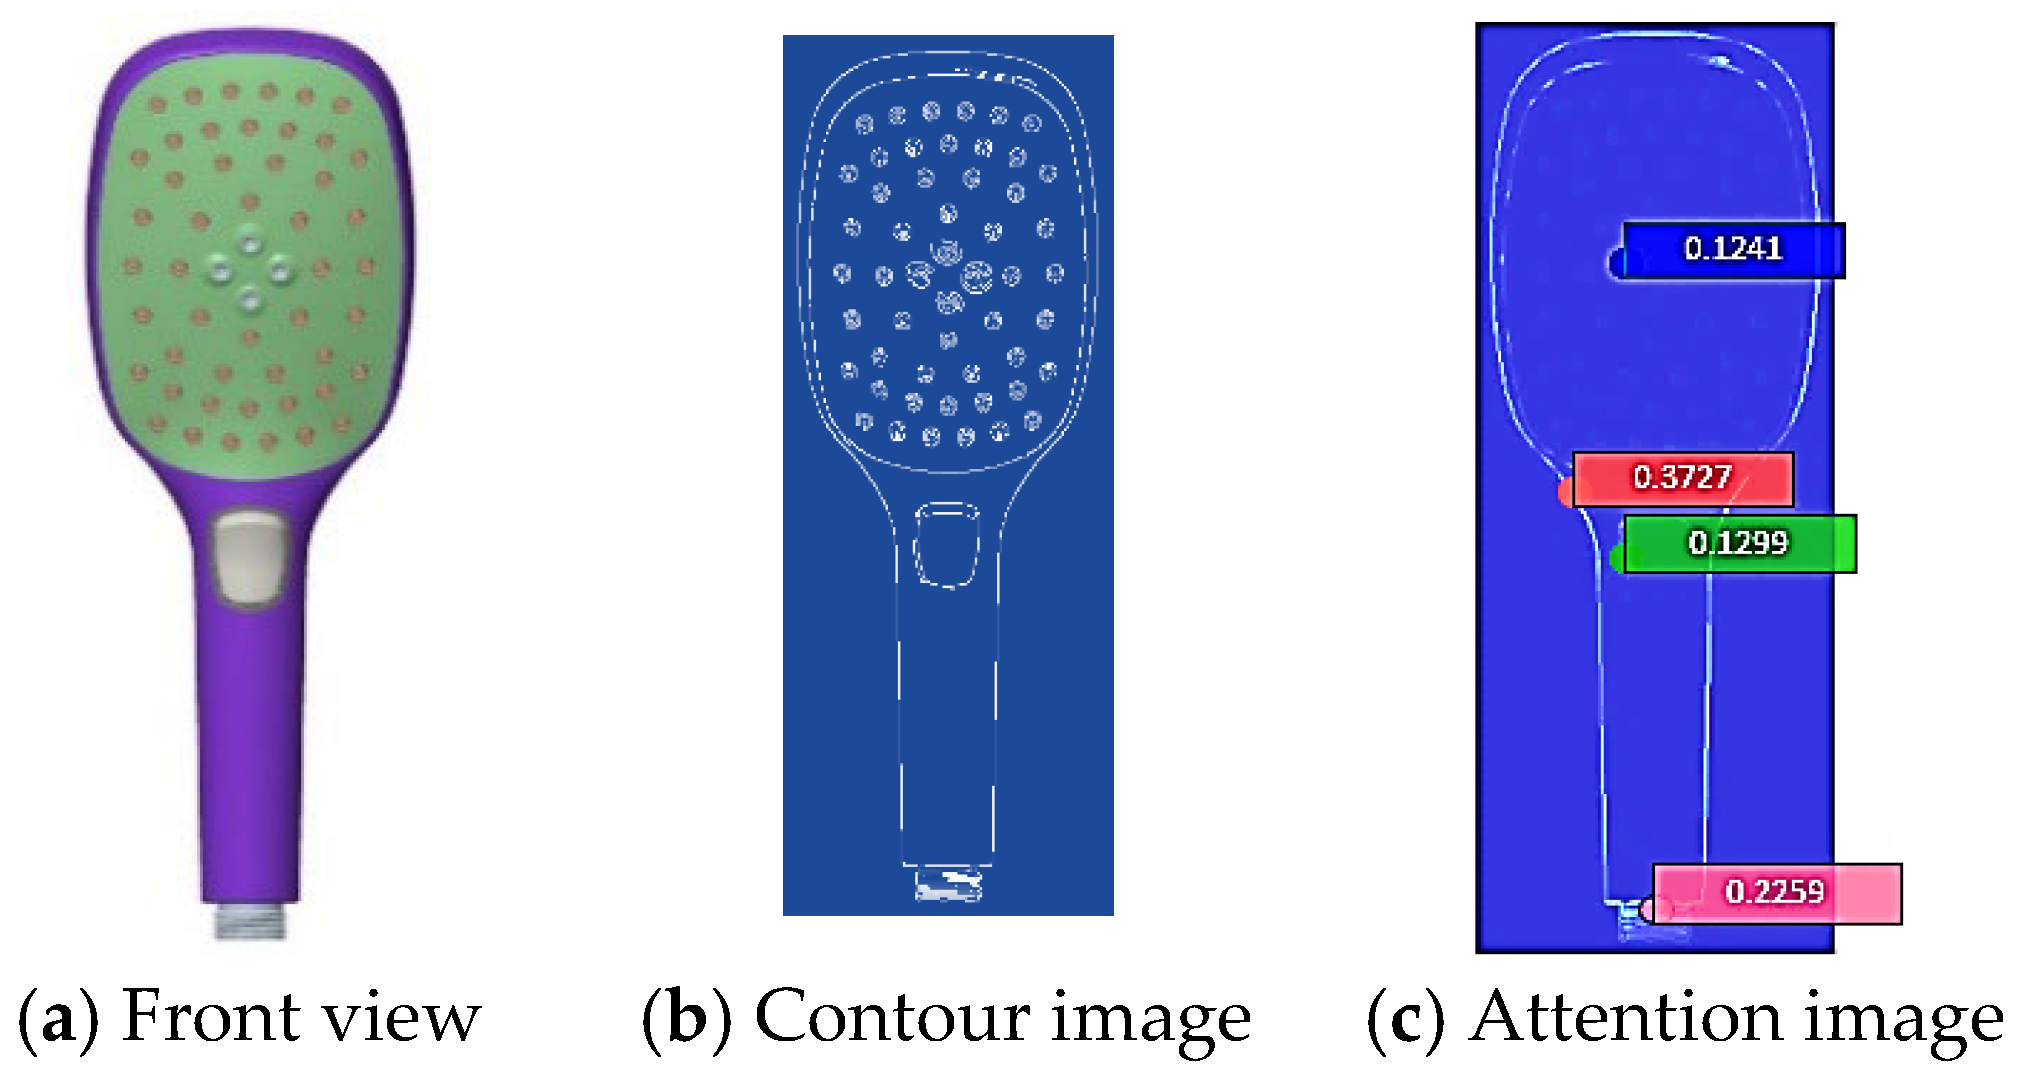
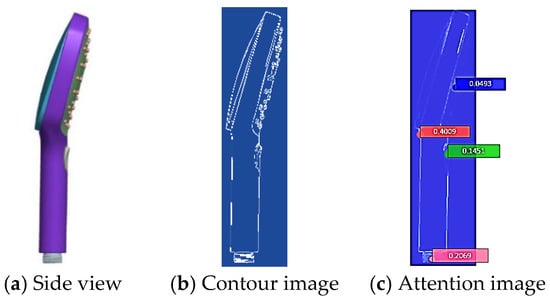
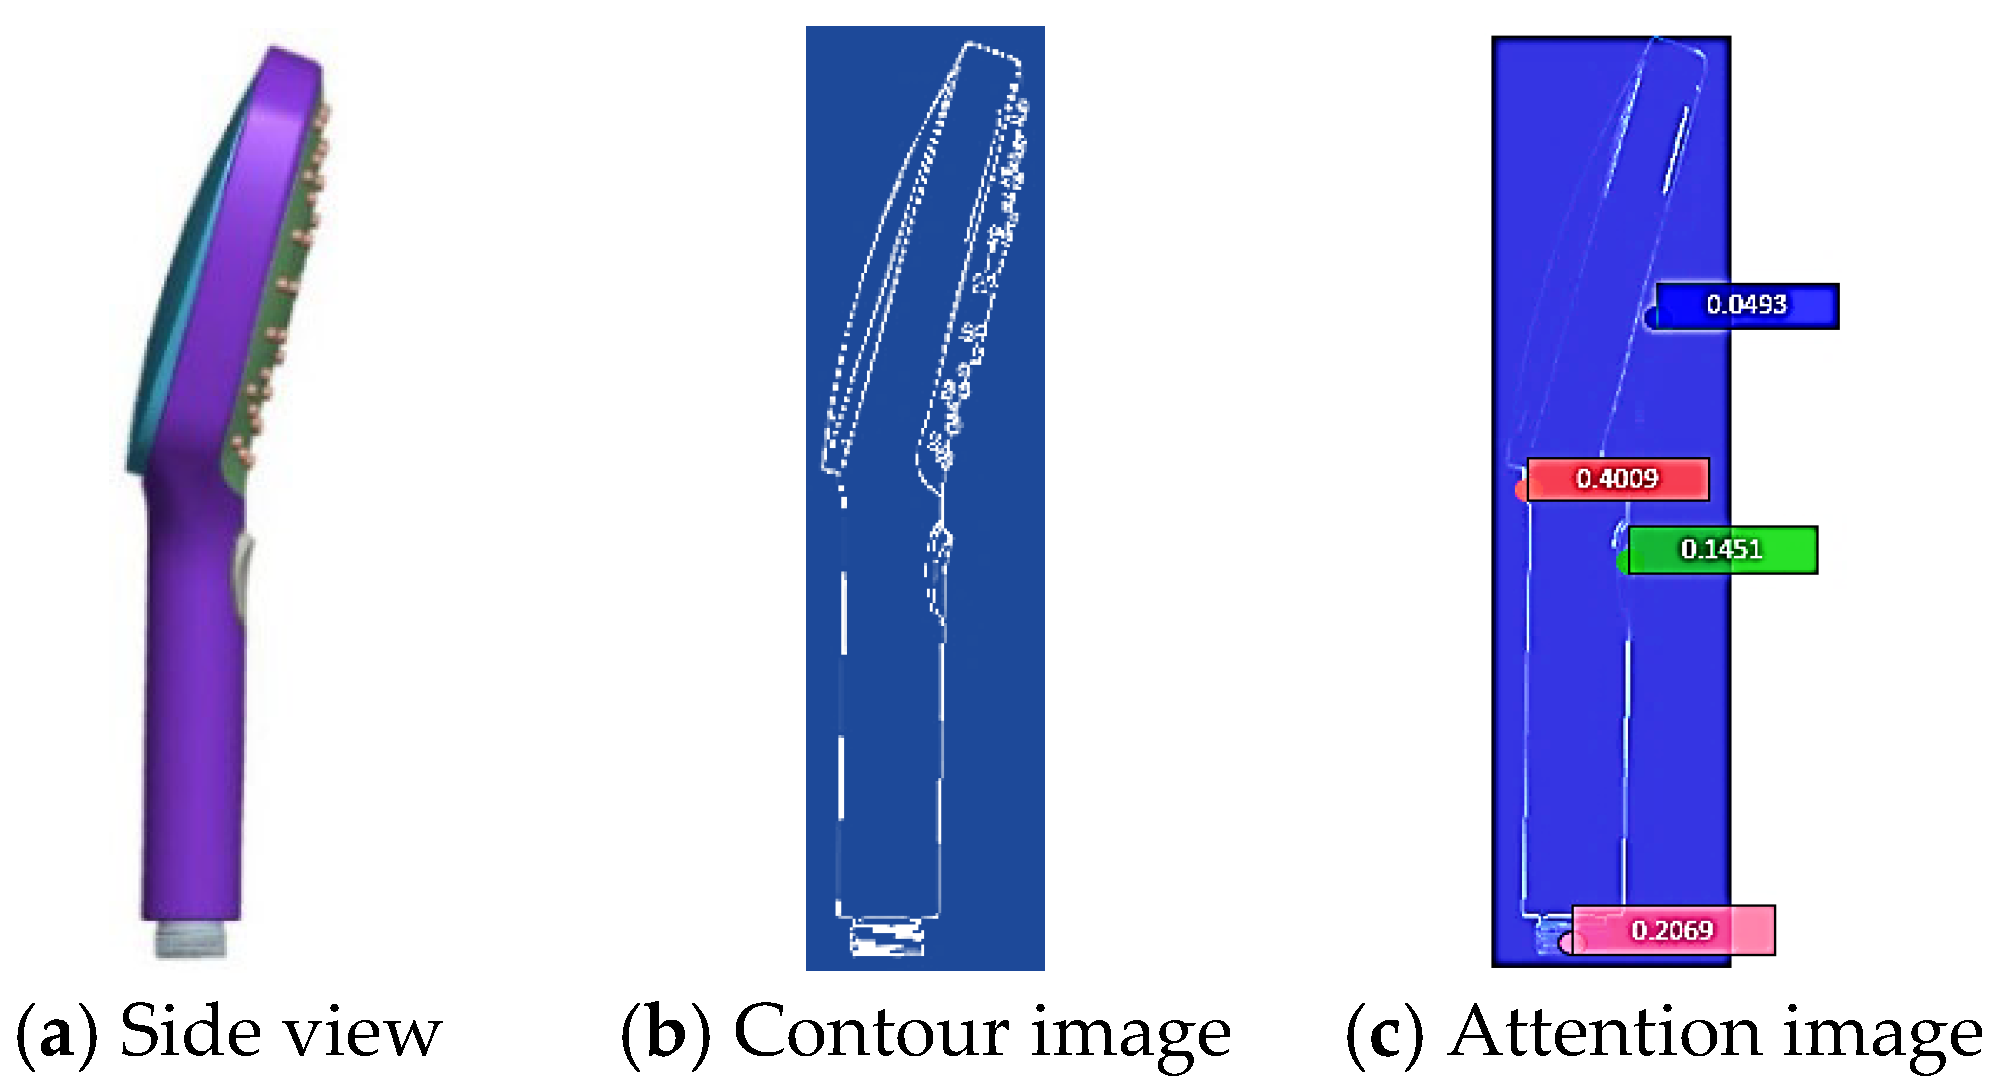
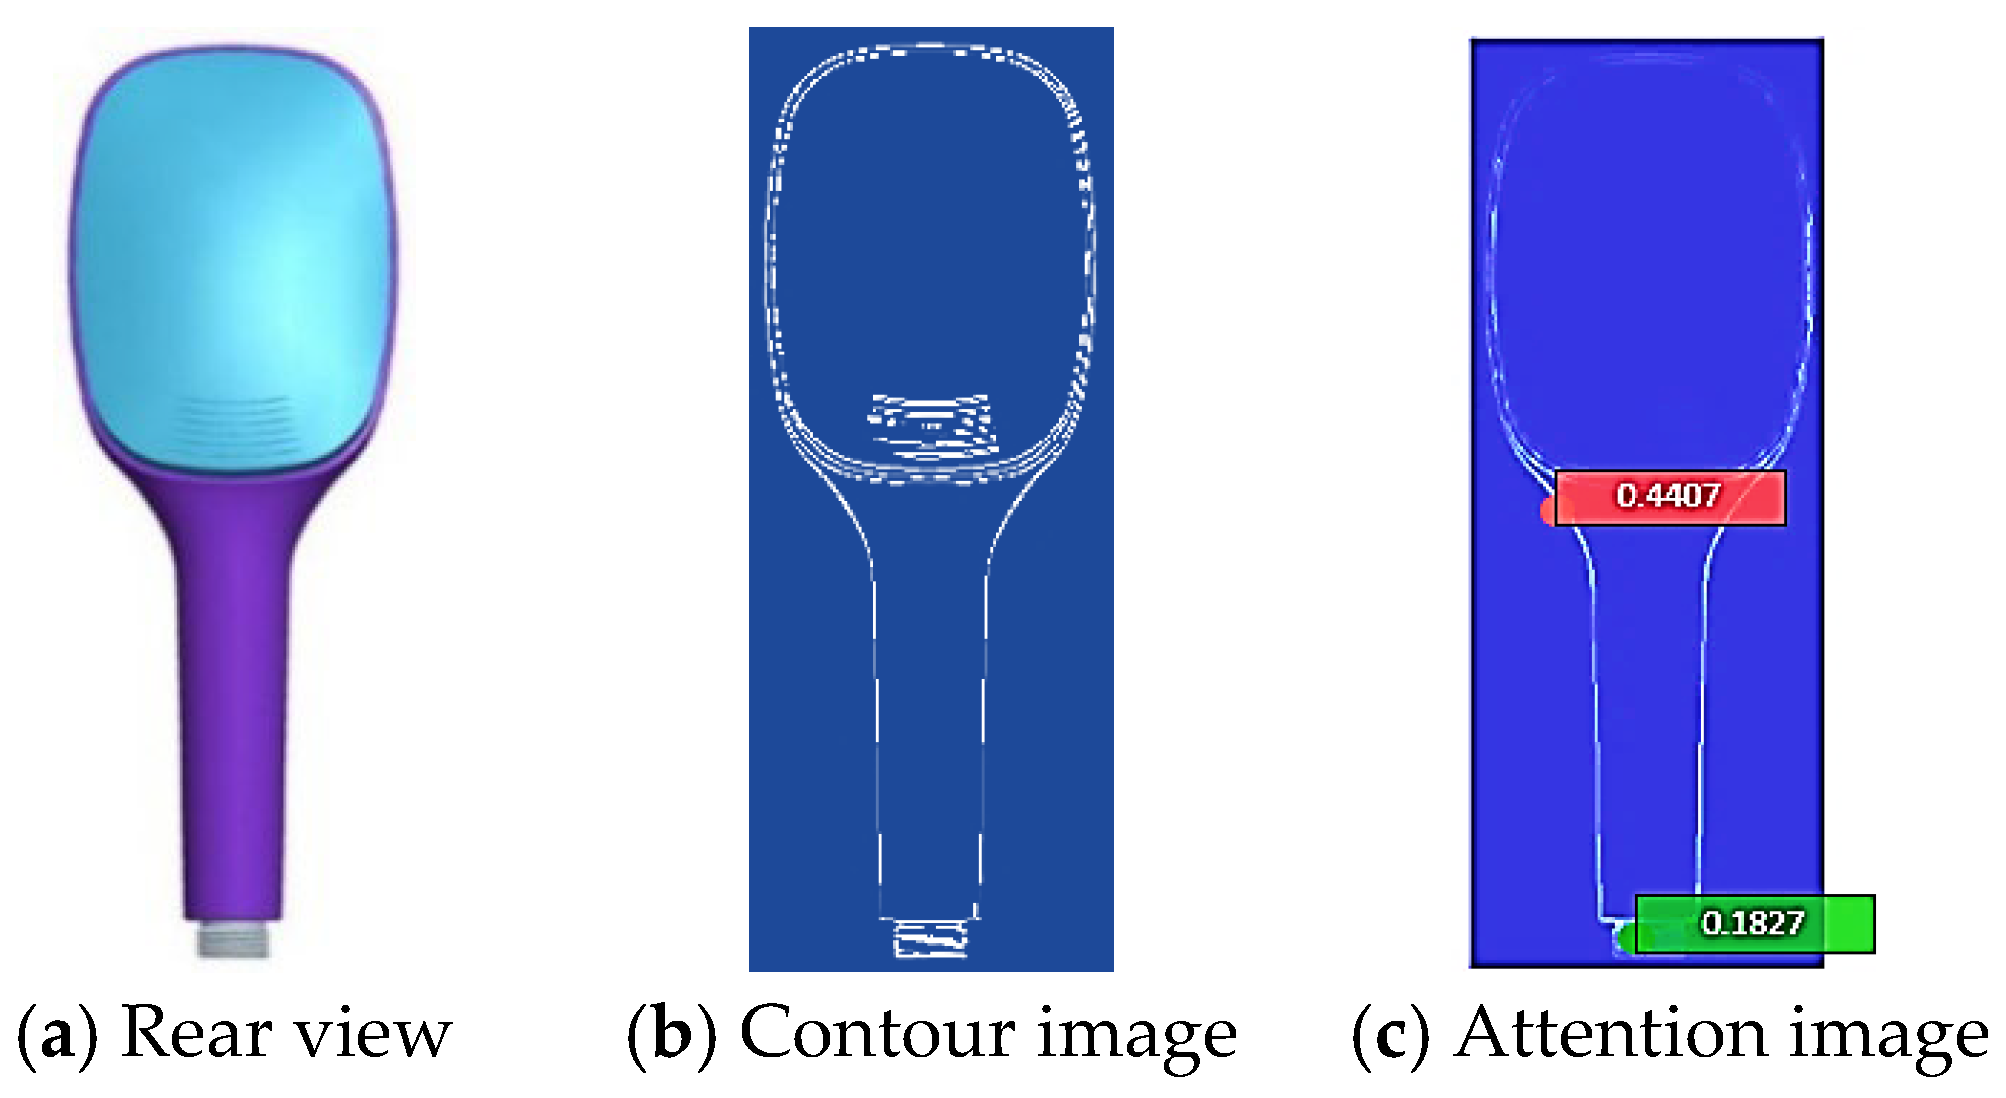
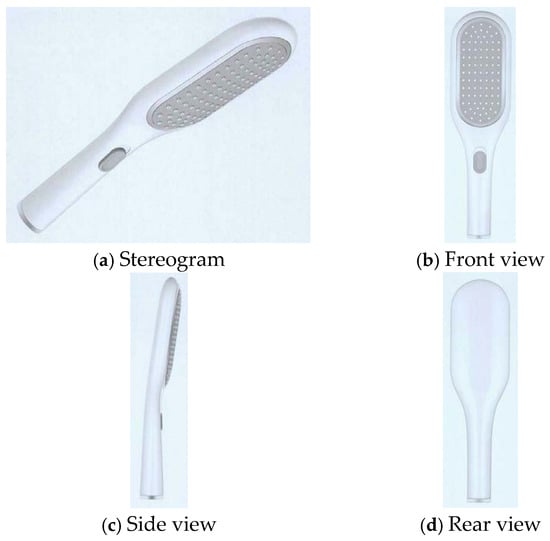
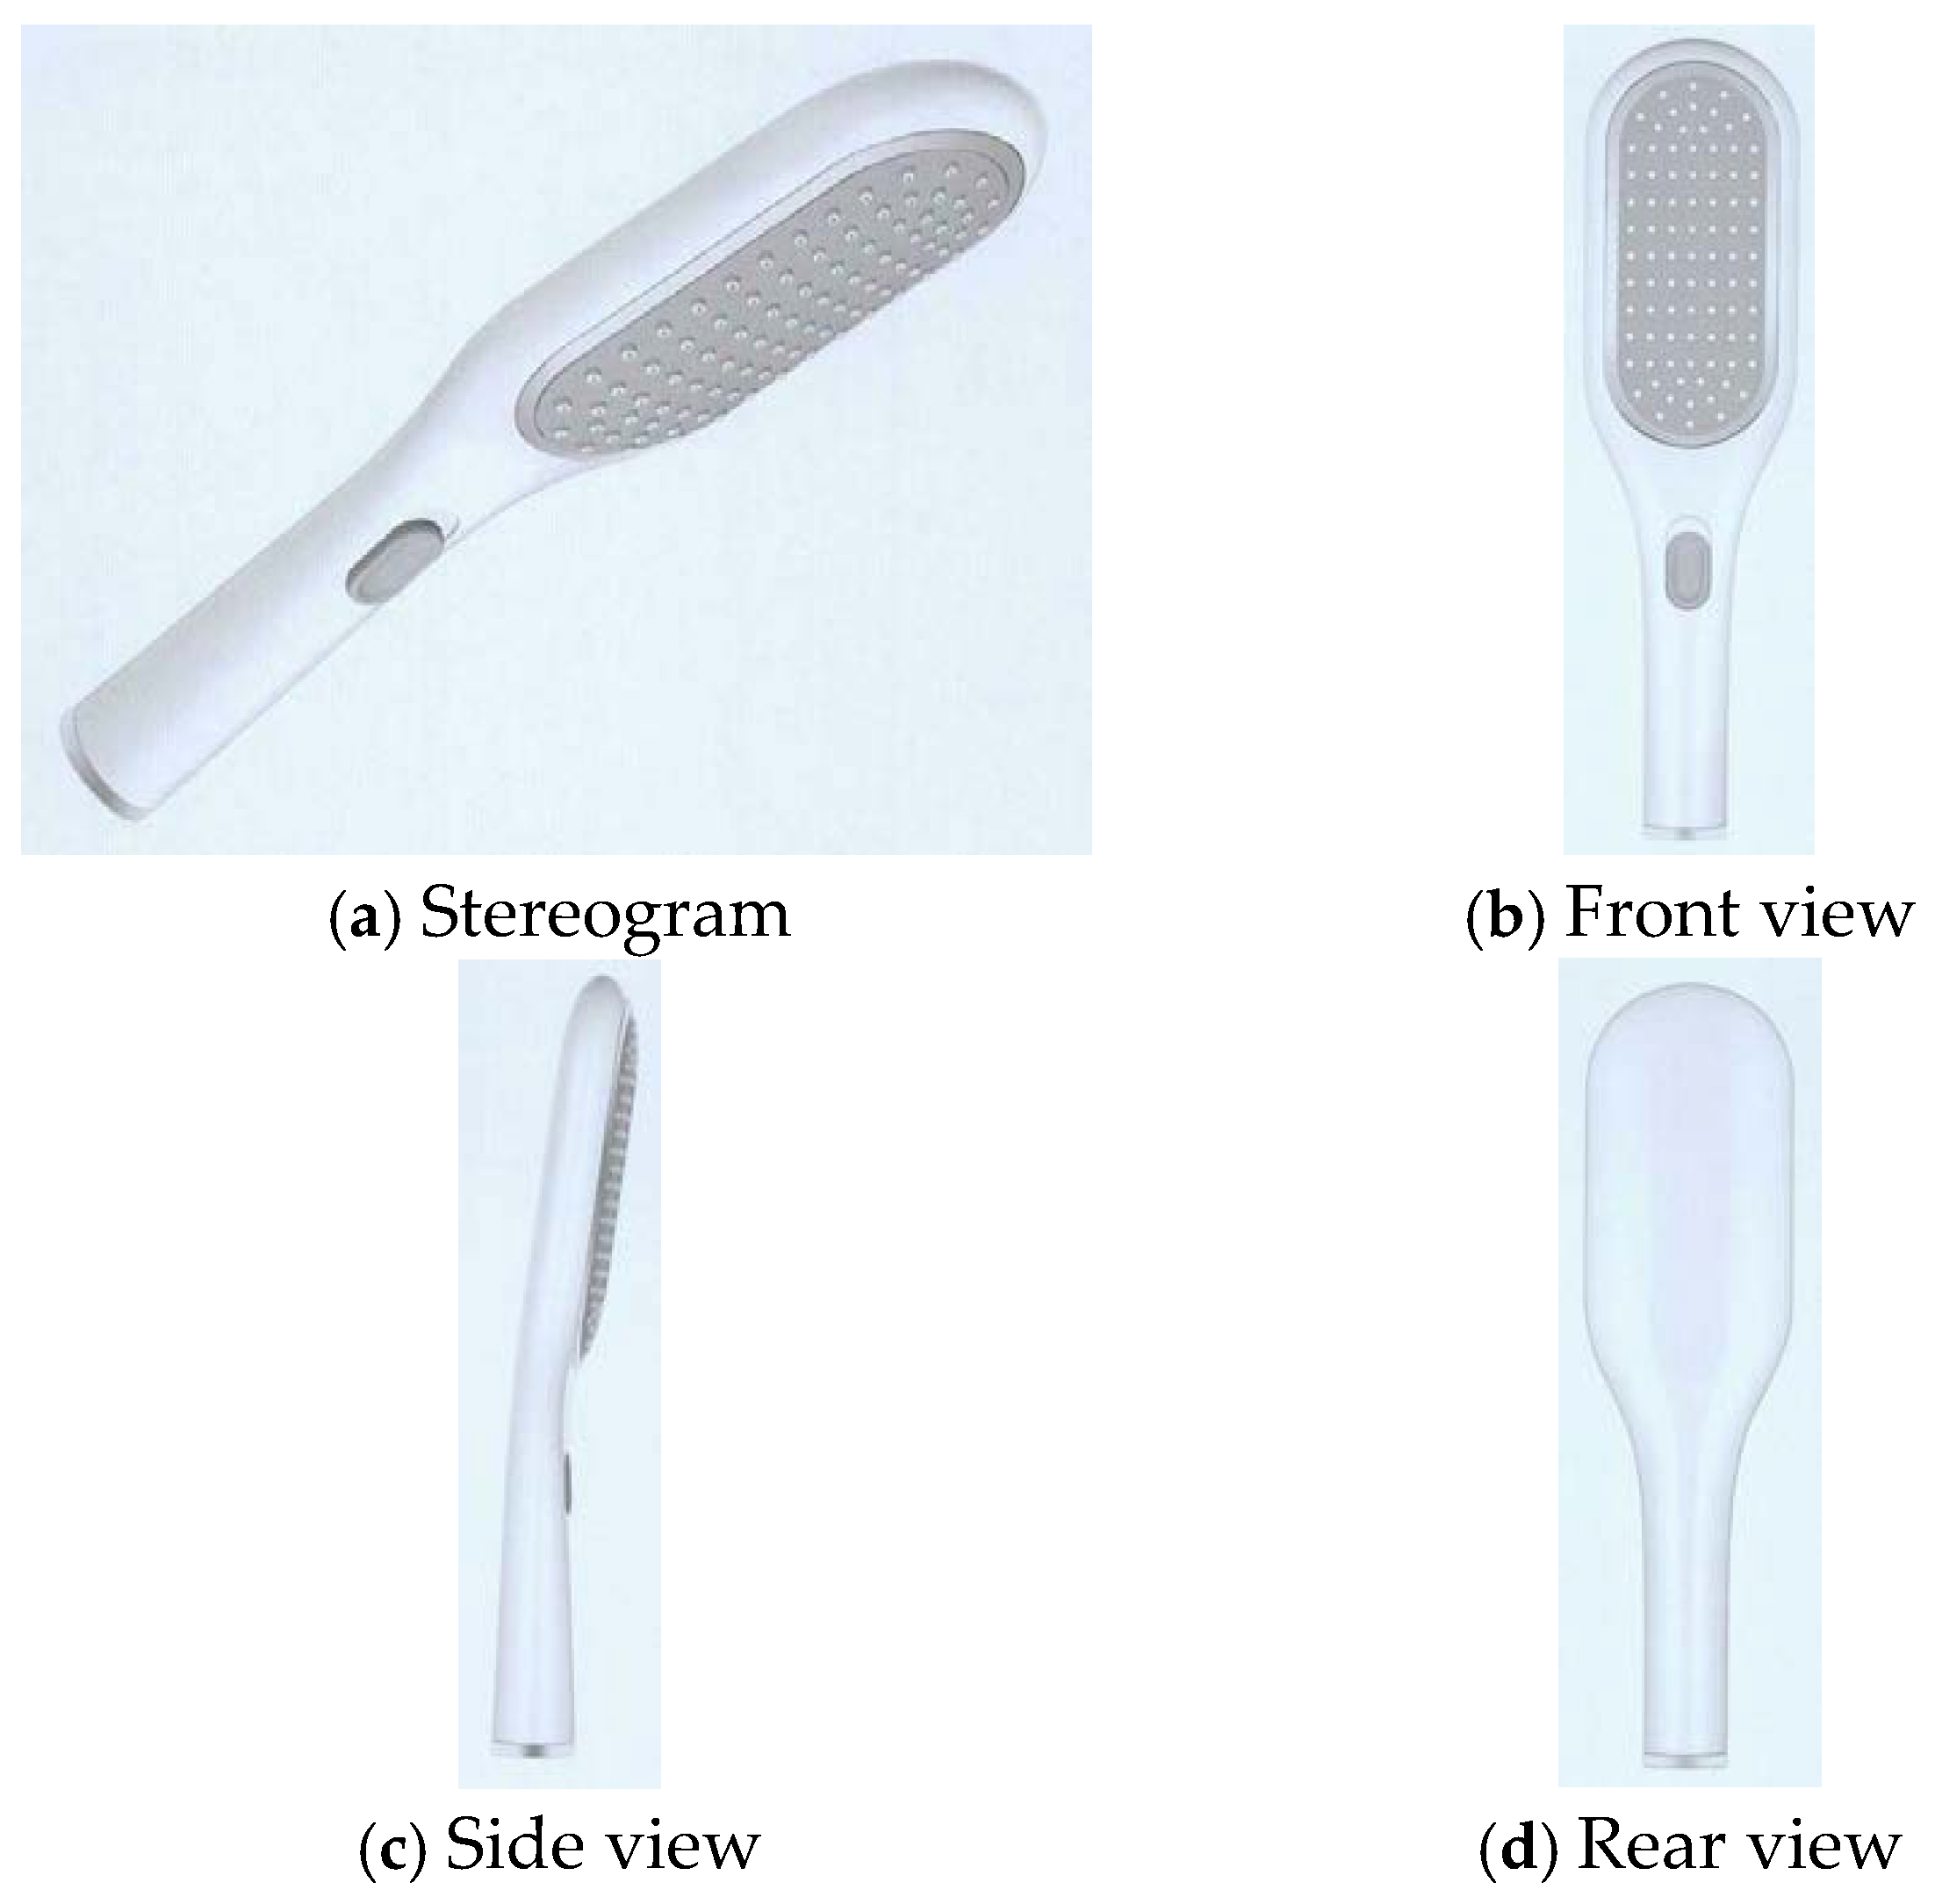
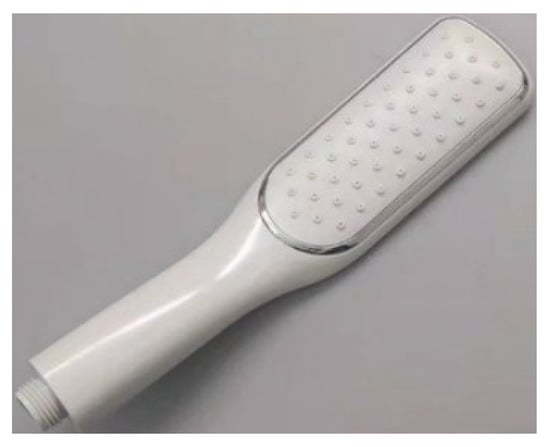
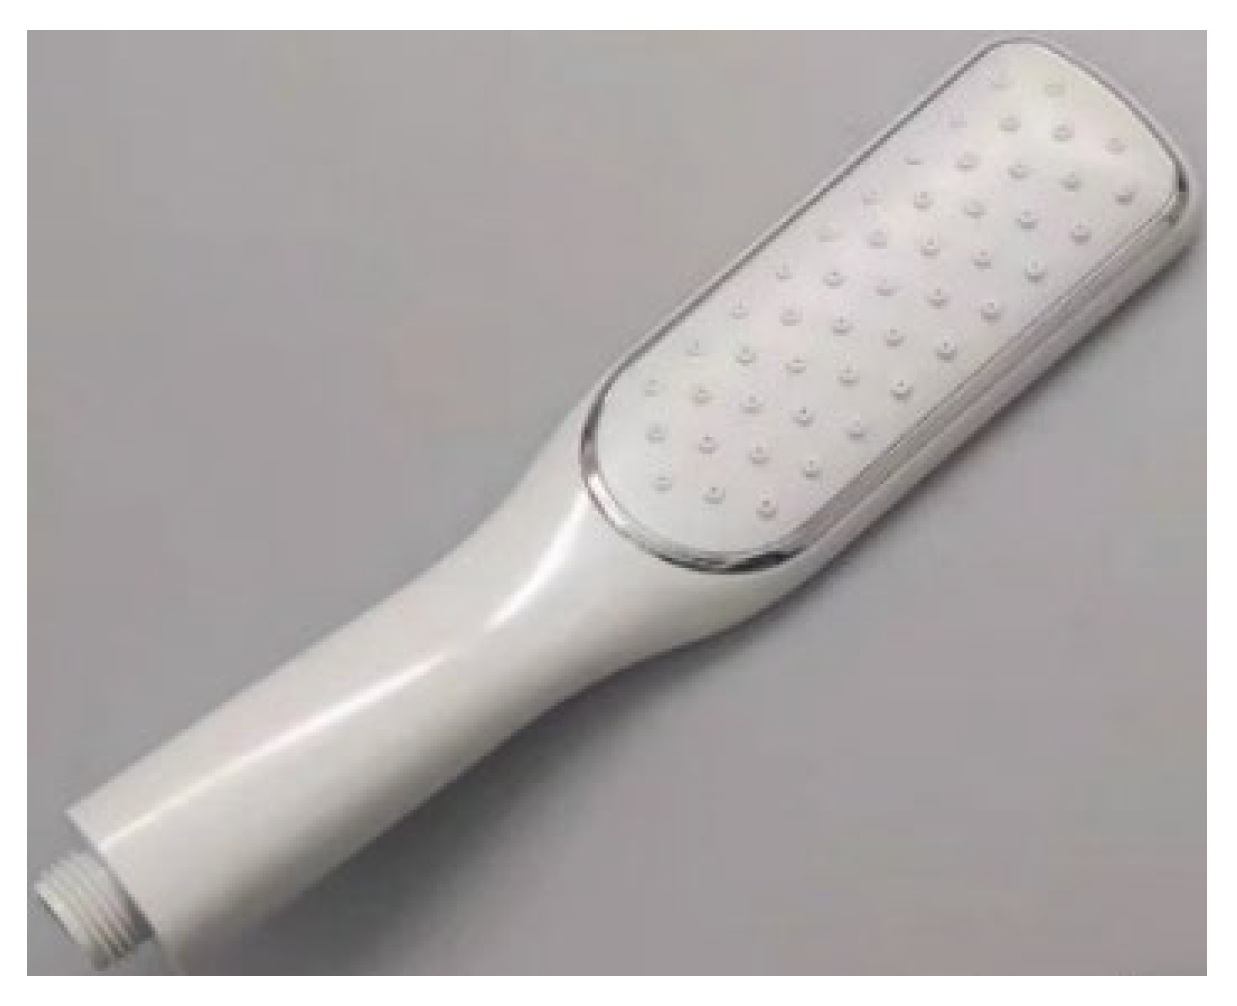
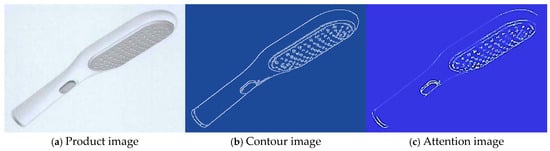
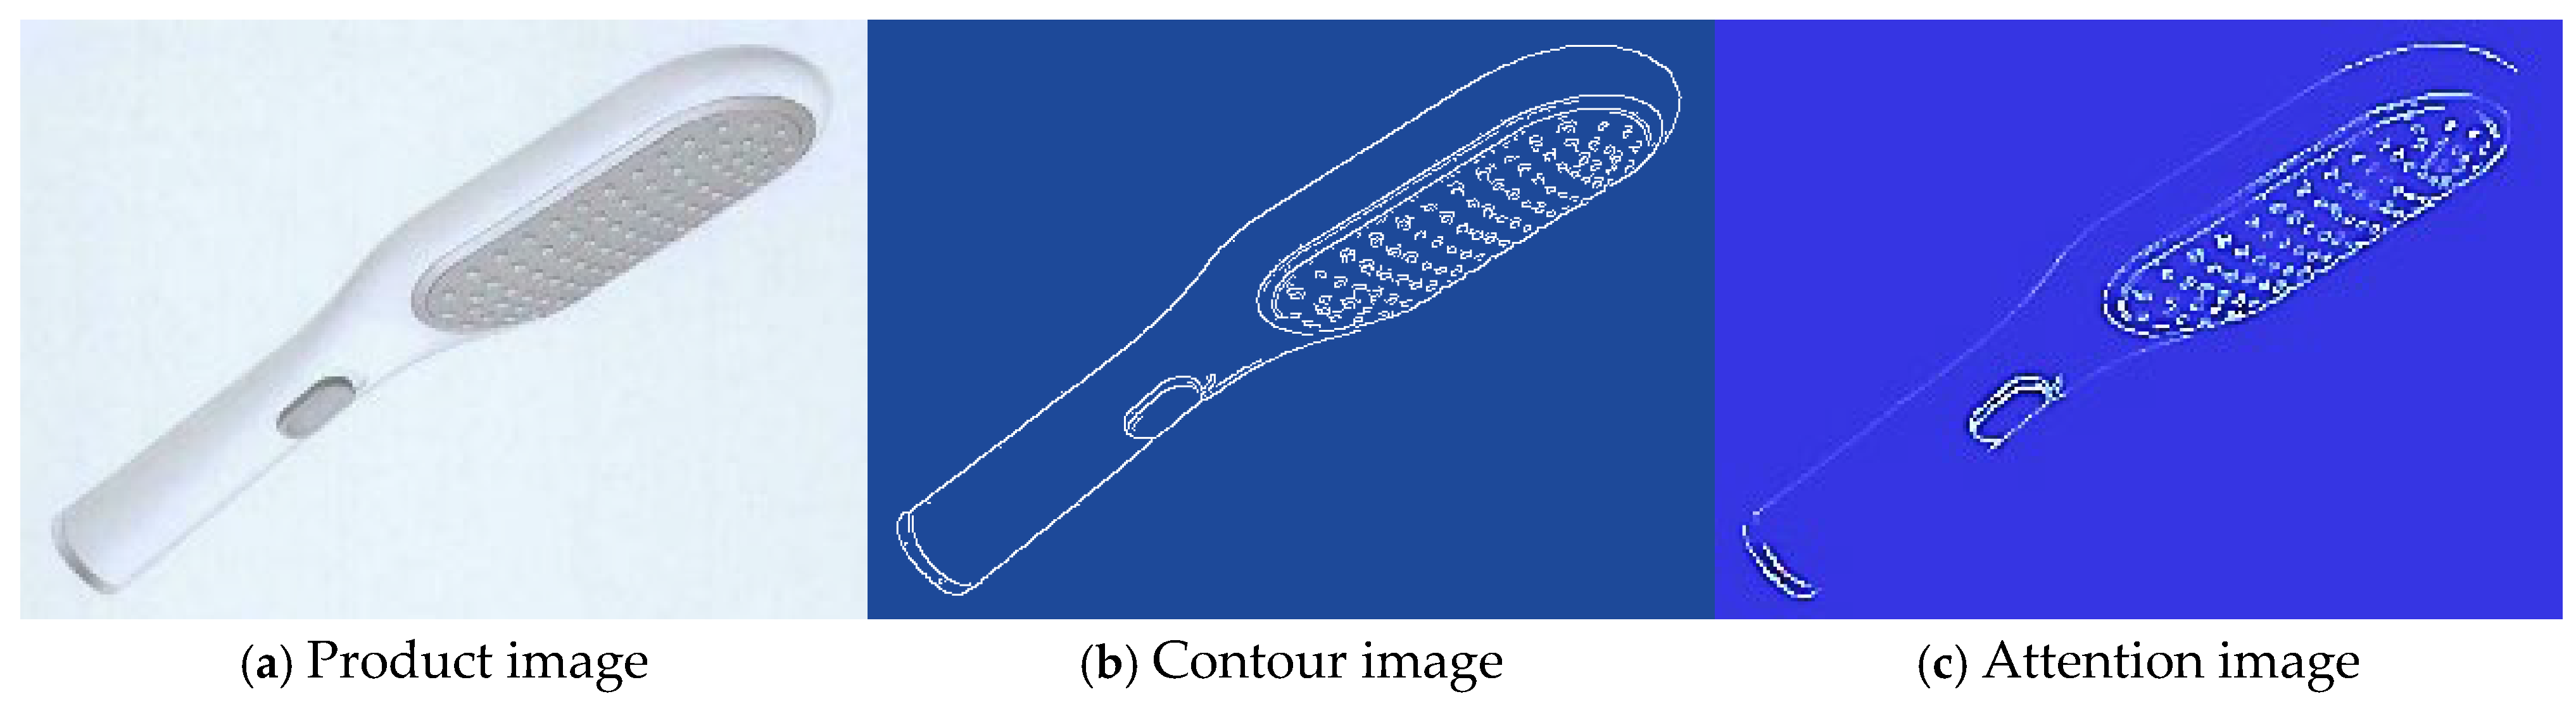
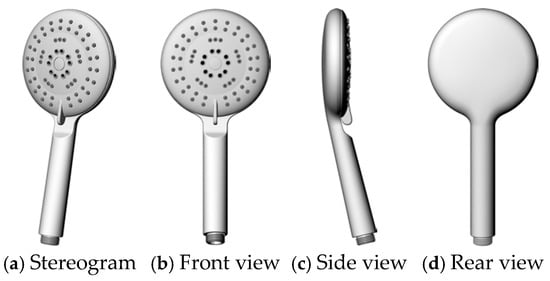
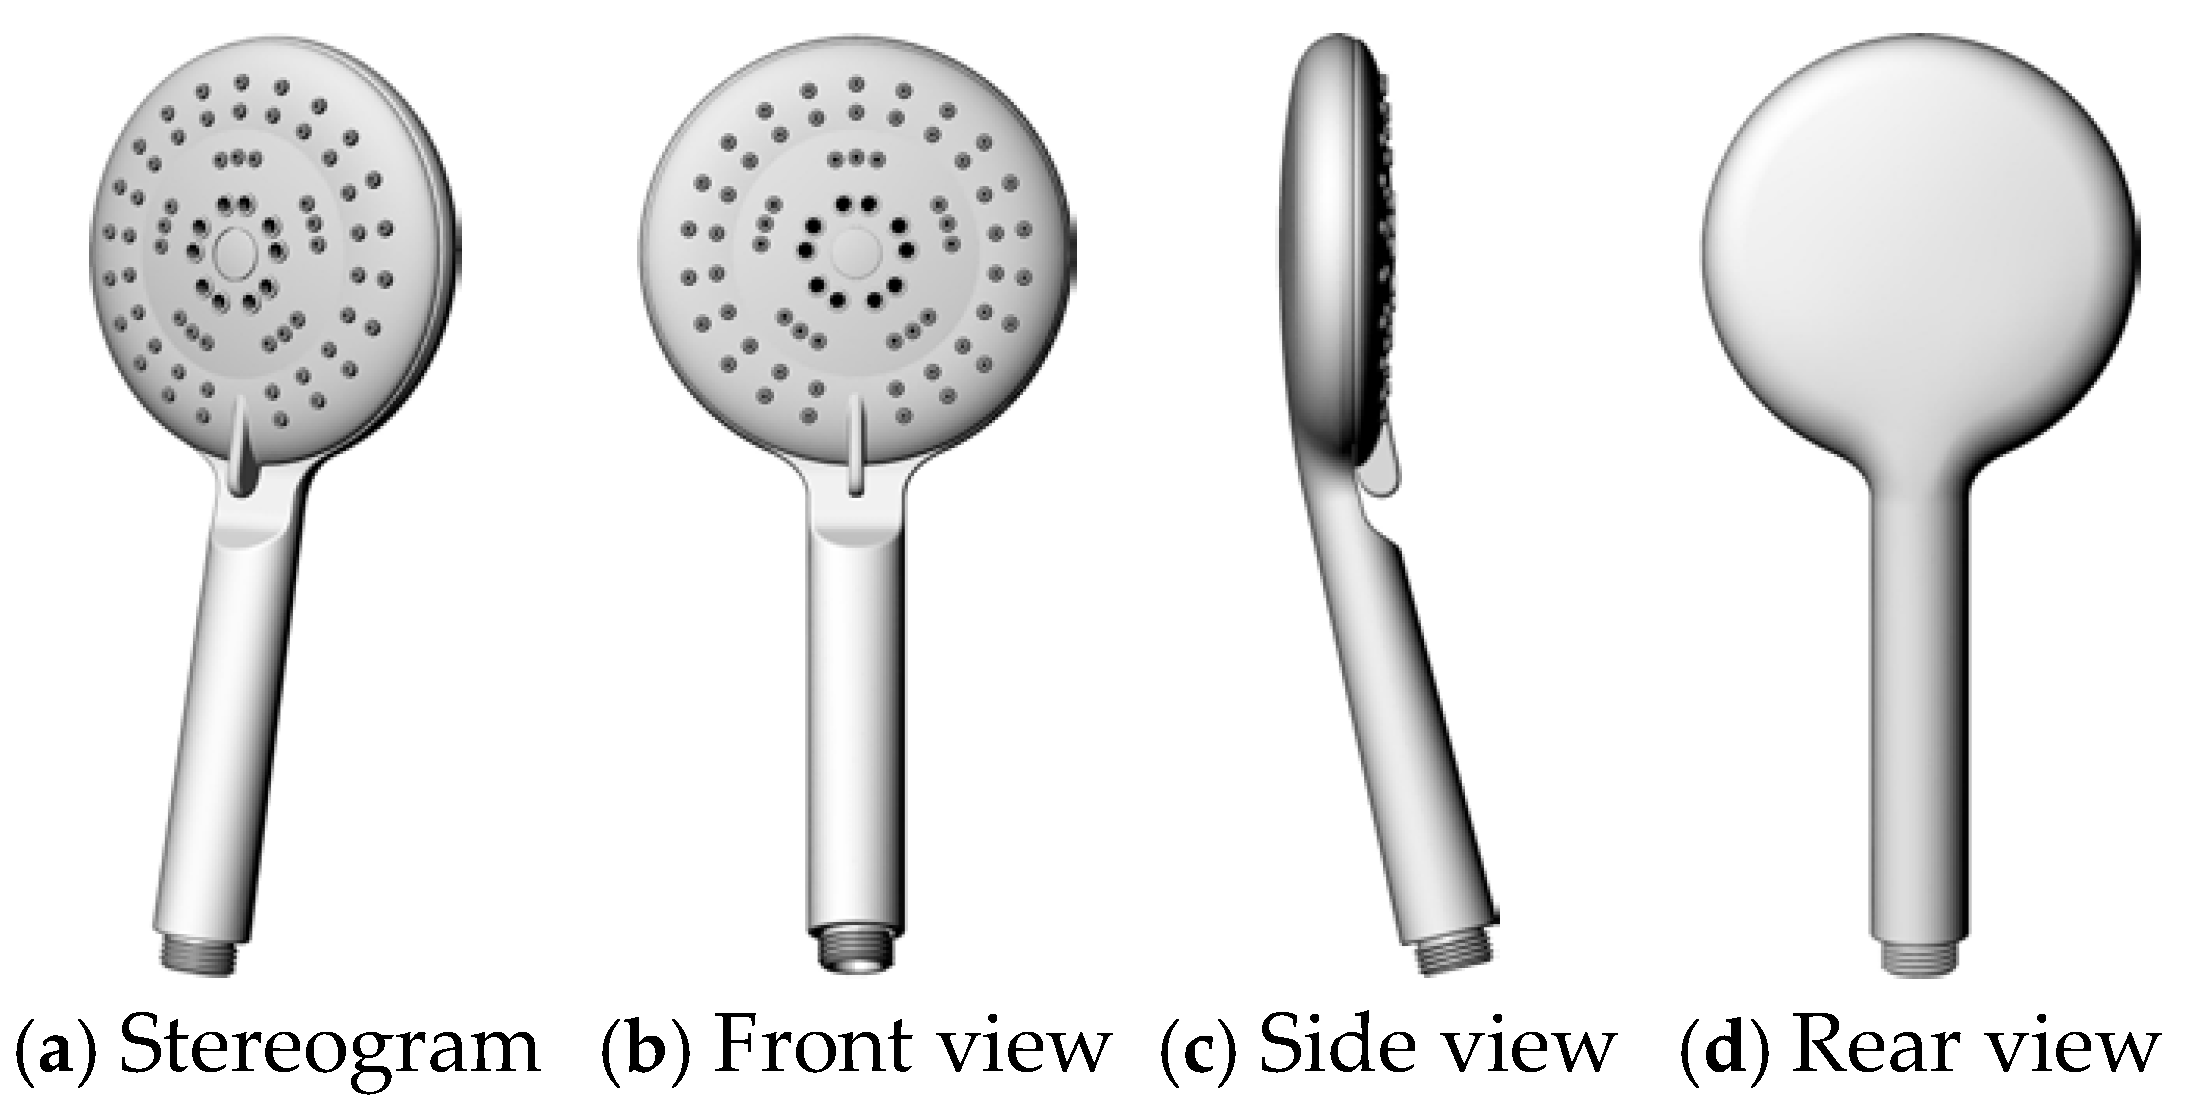
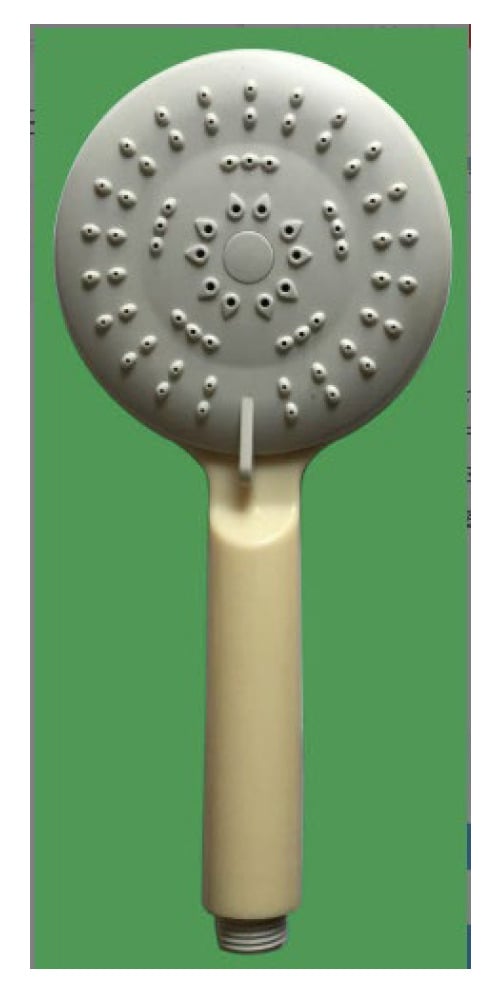
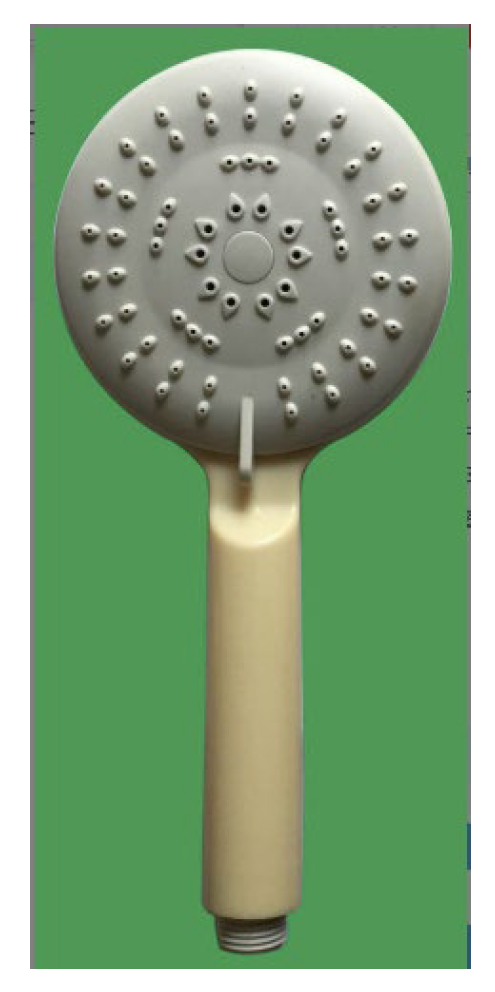
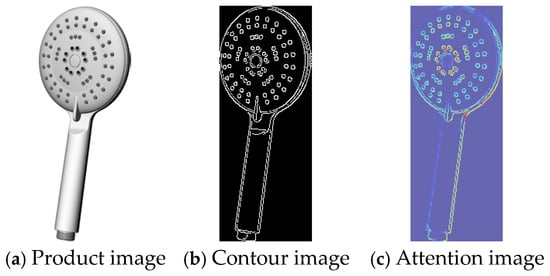
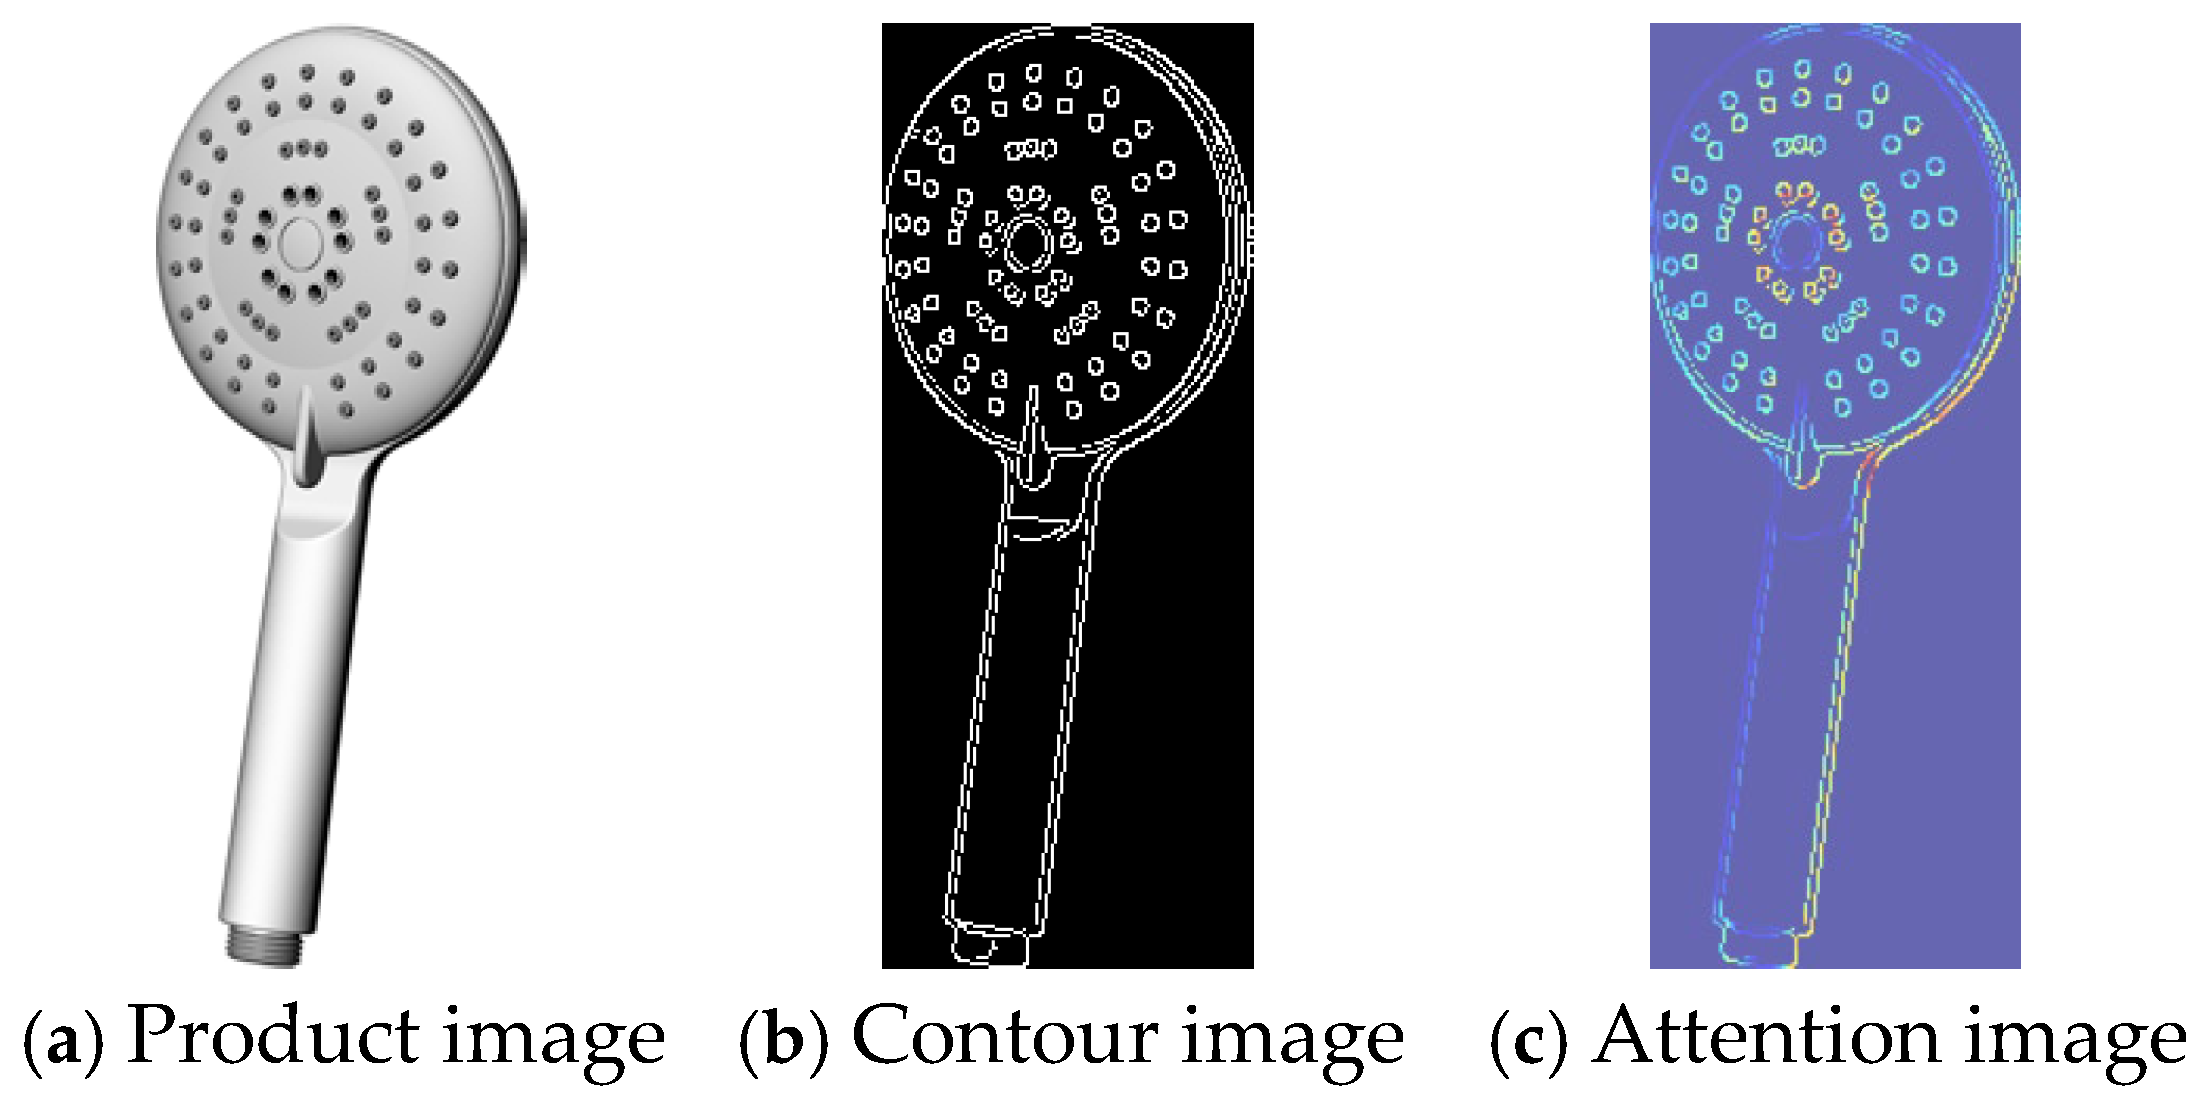

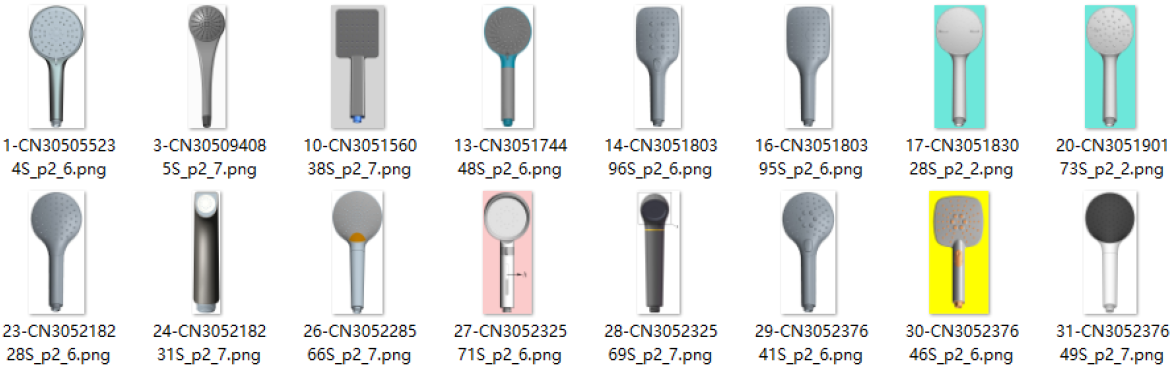
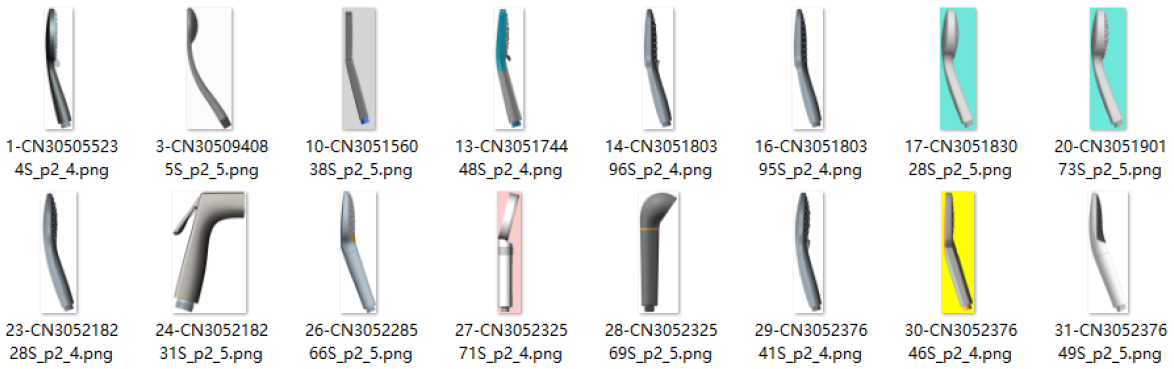
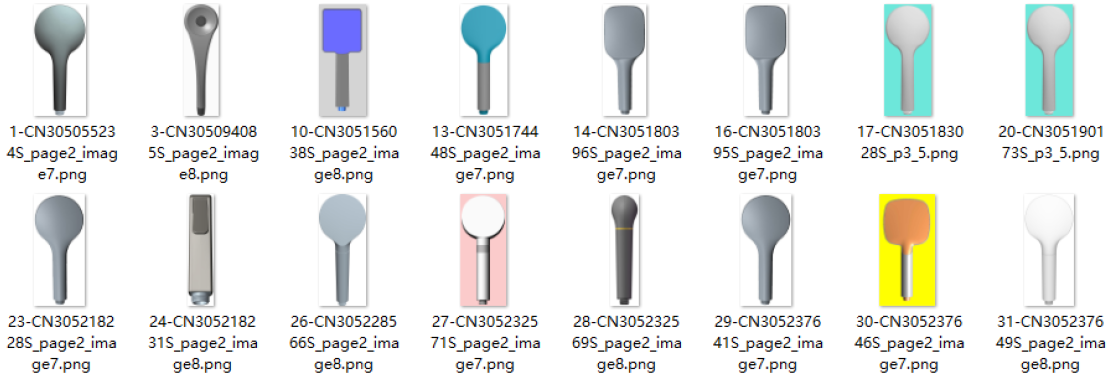
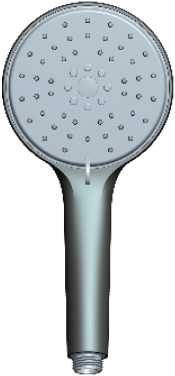
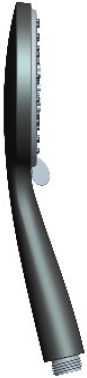
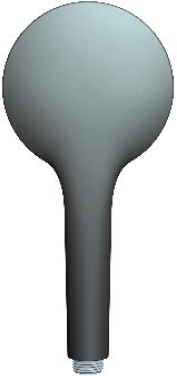
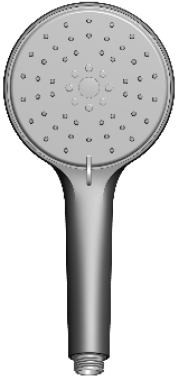
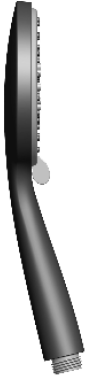
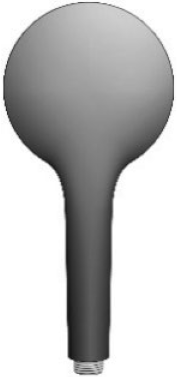
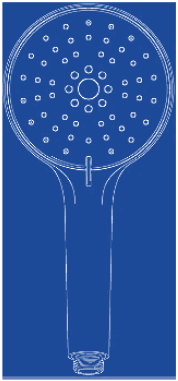

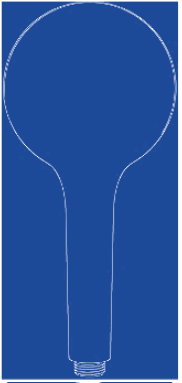
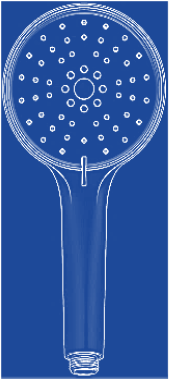


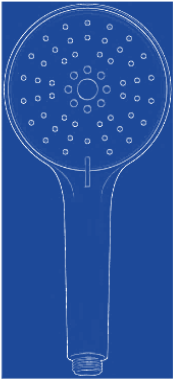

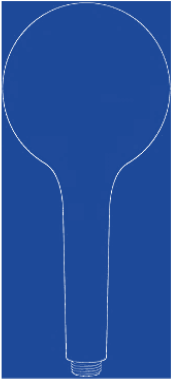
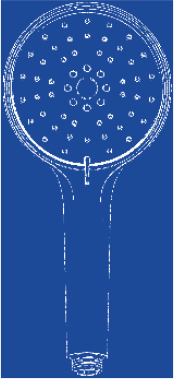


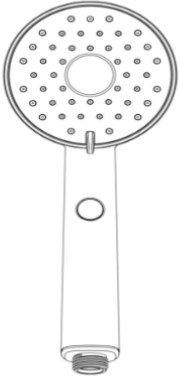

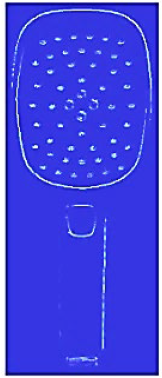
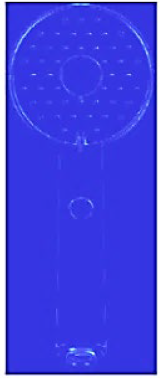
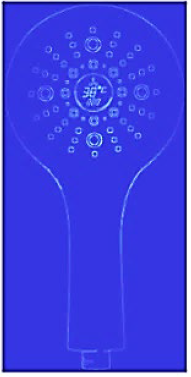
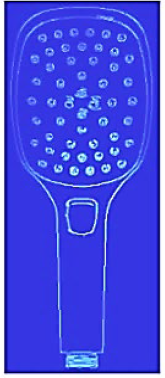
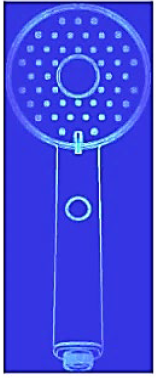
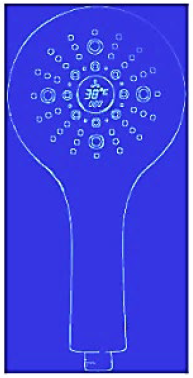
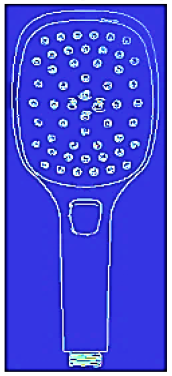
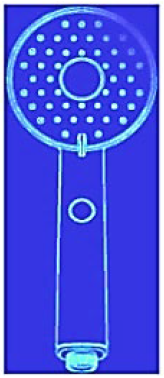
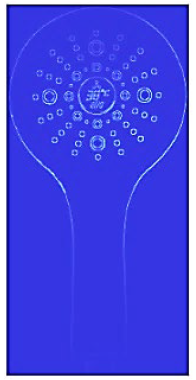
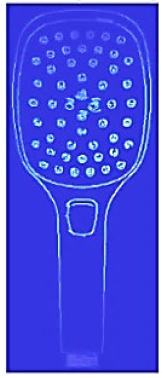
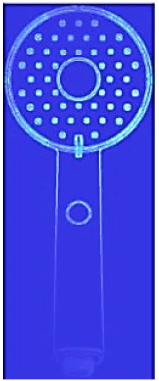
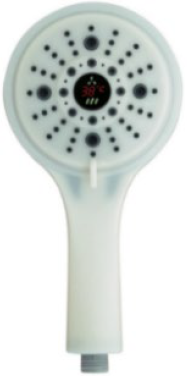
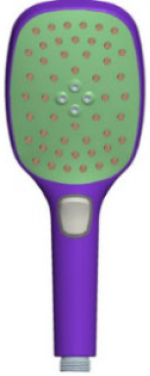
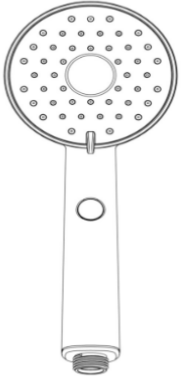
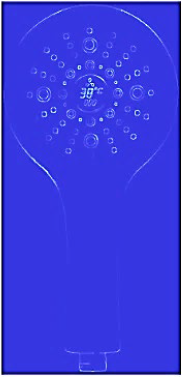
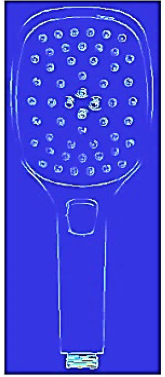
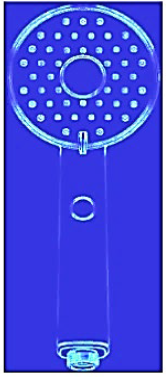
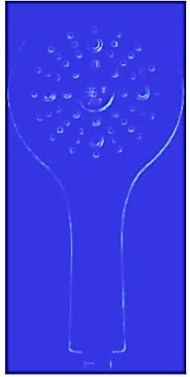
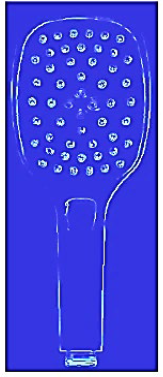
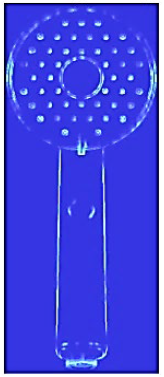

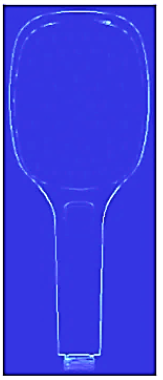
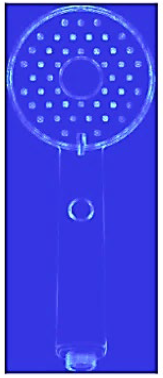
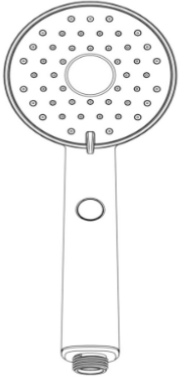


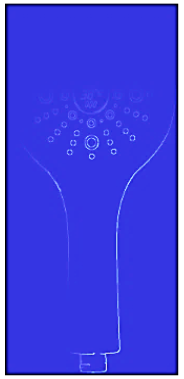
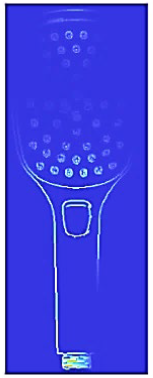
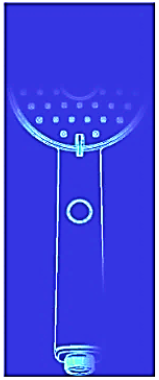
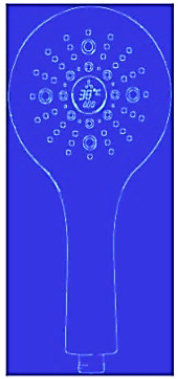
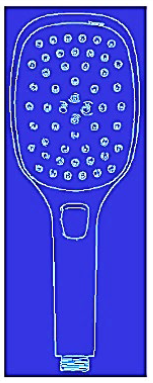
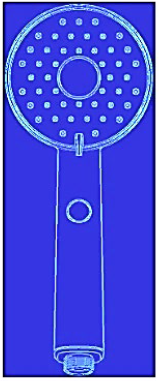

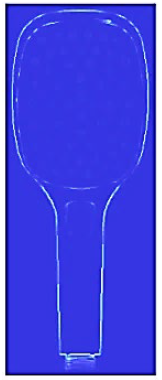
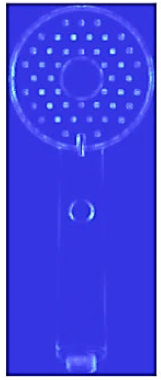
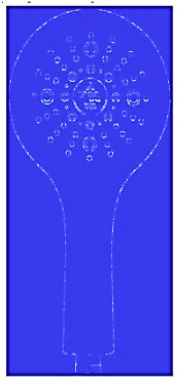
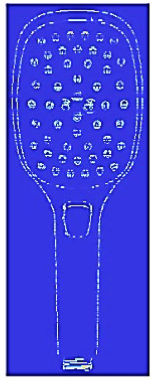
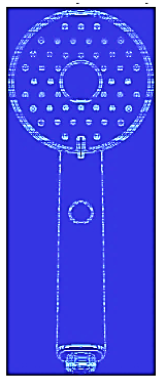




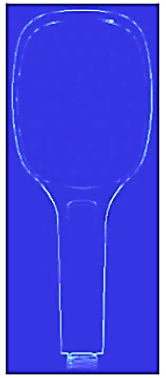
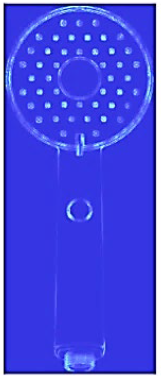
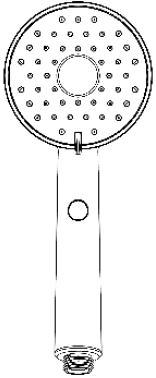

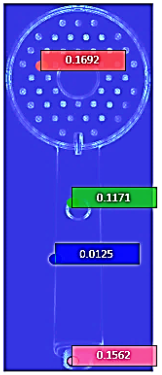
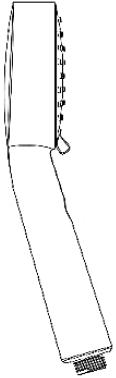

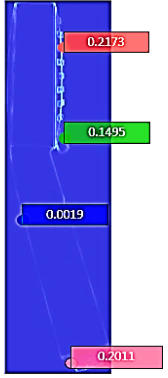
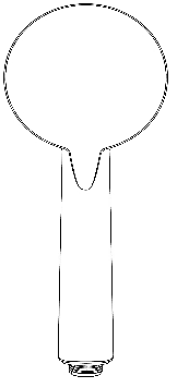

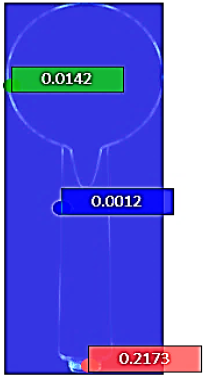
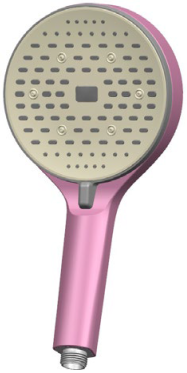
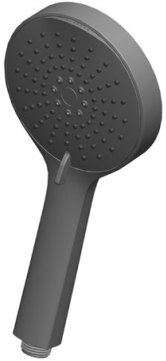
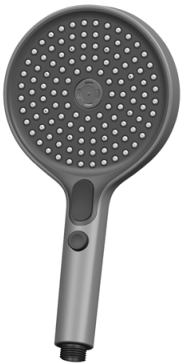
Disclaimer/Publisher’s Note: The statements, opinions and data contained in all publications are solely those of the individual author(s) and contributor(s) and not of MDPI and/or the editor(s). MDPI and/or the editor(s) disclaim responsibility for any injury to people or property resulting from any ideas, methods, instructions or products referred to in the content. |
© 2026 by the authors. Licensee MDPI, Basel, Switzerland. This article is an open access article distributed under the terms and conditions of the Creative Commons Attribution (CC BY) license.