


Highlights
How does the work link to systems science through contributions to practice, theory, and/or methodology?
- The study reframes the undergraduate systems engineering skills gap as an emergent behavior of an interacting workforce pipeline produced by feedback, accumulation, delay, and constraints across multiple stages rather than solely as a static mismatch between graduate competencies and industry expectations.
- The study demonstrates methodological traceability from a systematic literature review and causal loop structure to a quantified stock-and-flow model, with parameter assumptions documented against the closest available evidence and examined through sensitivity analysis.
What are the main findings and/or the implications?
- Under the tested assumptions, single interventions scenarios targeting student entry, experiential preparation, or graduate retention slowed deterioration but left the systems engineering skills gap larger than its initial value; only the combined interventions scenario narrowed the gap because constraints remaining elsewhere in the pipeline continued to limit the single interventions.
- The findings support coordinated action among universities, employers, and professional organizations across recruitment, preparation, and graduate transition, while also highlighting the need for SE specific enrollment, placement, and occupational data to strengthen future workforce analysis.
Abstract
Despite the growing importance of Systems Engineering (SE) in addressing complex engineered systems, a persistent gap remains between undergraduate SE education and industry workforce expectations. Existing studies have primarily examined workforce readiness, competency development, curriculum design, and industry requirements as independent issues. However, limited research has investigated how these factors interact dynamically over time to influence the SE skills gap. The aim of this study is to examine how educational preparation, SE perception, and workforce transitions interact over time to influence the undergraduate SE workforce pipeline and resulting skills gap. A system dynamics stock-and-flow model was developed to represent the undergraduate SE workforce pipeline based on findings from a systematic literature review and a causal loop diagram. The model was used to evaluate the effects of intervention strategies through scenario analysis, and the results suggest that under baseline assumptions, the model produced a widening skills gap, while isolated interventions produced partial improvements. The combined intervention produced the strongest improvement in skilled workforce growth and skills gap reduction. This study contributes a dynamic perspective on undergraduate SE workforce development and provides an exploratory simulation framework for evaluating policies intended to improve SE workforce readiness.
1. Introduction
Systems Engineering (SE) has become increasingly important for addressing complex and engineered systems. Contemporary engineering problems often involve interacting technical, organizational, human, and lifecycle dimensions that cannot be addressed effectively through one disciplinary perspective alone [1,2,3]. As engineered systems become more interconnected and adaptive, organizations require professionals who can integrate requirements, architecture, modeling, verification, stakeholder needs, and decision-making across system boundaries [4,5]. SE therefore provides an integrative approach for managing complexity across the system lifecycle.
Despite the growing relevance of SE, a persistent gap remains between undergraduate SE preparation and industry workforce expectations [6]. The SE skills gap refers to the misalignment between the competencies expected in practice and the preparation provided through education and workforce development [7]. Employers increasingly require graduates who can demonstrate systems thinking, requirements engineering, modeling and simulation, communication, interdisciplinary collaboration, lifecycle thinking, and model-based systems engineering (MBSE) capabilities [6,8,9]. However, undergraduate SE education remains unevenly represented across institutions, and SE is often perceived as a specialization rather than a clearly defined undergraduate discipline [10,11,12]. This creates a workforce development challenge in which student awareness, educational preparation, and industry expectations are not always aligned [11].
Prior research on this skills gap has identified several contributors. Studies have examined SE competencies, curriculum design, workforce readiness, industry collaboration, experiential learning, and digital engineering capability [13,14]. These gaps are especially important at the undergraduate level because students may enter the workforce before they have developed sufficient exposure to real-world systems problems, industry tools, lifecycle processes, and decision-making. Other related work has emphasized the identity and visibility of SE as a discipline, especially because SE often overlaps with adjacent fields such as industrial engineering, software engineering, aerospace engineering, project management, and general engineering practice [10,15]. These studies provide important insight into the factors associated with how SE is perceived and how this can affect workforce readiness. However, examining these factors separately provides limited understanding of how the gap evolves as students move through undergraduate education and into workforce roles. As a result, the SE skills gap is not limited to whether graduates possess technical skills; it also reflects how educational programs, industry expectations, experiential learning, and professional pathways align to develop workforce-ready systems engineers. Addressing the SE skills gap requires attention to the dynamic interdependencies among educational preparation, student entry, graduate transition, and workforce demand. These relationships suggest that the skills gap is not only a competency problem but also a workforce development problem shaped by interactions in the SE ecosystem.
System dynamics (SD) is proposed as the method for examining this type of problem because it represents how accumulations, flows, feedback loops, and delays can show behavior over time [16,17,18]. Prior conceptual work has used causal loop diagrams (CLDs) to represent feedback relationships among SE perception, curriculum alignment, graduate output, skilled workforce development, and skills gap pressure [19]. While CLDs are useful for identifying feedback structure, they do not quantify accumulations or simulate how the system changes over time [20]. A stock-and-flow model is therefore needed to examine how the undergraduate SE workforce pipeline behaves under baseline and intervention conditions.
To address this gap, a stock-and-flow SD model of the undergraduate SE workforce pipeline was developed in this study. The aim of the study is to examine how educational preparation, SE perception, and workforce transitions interact to influence the behavior of the undergraduate SE skills gap over time. The model is also used to compare the behavior generated by selected intervention scenarios focused on SE perception, experiential learning opportunities, and graduate retention. The model builds upon a prior systematic literature review (SLR) and a CLD of the SE skills gap. Scenario analysis is used to compare baseline behavior with intervention strategies focused on mitigating the SE skills gap. The novelty of this study lies in the development of a quantified stock-and-flow representation of the undergraduate SE workforce pipeline that integrates educational and workforce mechanisms within a single dynamic structure. Unlike prior studies that examined STEM pipelines broadly or assessed SE competencies and workforce expectations separately, this study represents the skills gap as an endogenous outcome of interactions across the pipeline. It also provides traceability from a prior systematic literature review and causal loop diagram to simulation-based analysis of alternative intervention strategies.
The theoretical contribution is the framing of the undergraduate SE skills gap as an evolving system behavior produced by interacting workforce pipeline mechanisms. That is, the skills gap is not treated as only a deficiency in graduate skills; the model represents how the gap can emerge from relationships among interacting factors in SE discipline. This view is consistent with systems theory and thinking because it emphasizes feedback, accumulation, delays, and structural interactions previously treated as a static comparison of graduate capabilities and industry expectations. The methodological contribution is the use of SD to move from qualitative feedback to simulation-based policy analysis. The prior causal loop structure provided insight into feedback relationships, but the stock-and-flow model represents accumulation and transition quantitatively and enables comparisons of alternative intervention scenarios.
The practical contribution of this study is an exploratory simulation framework for comparing isolated and coordinated interventions affecting the undergraduate SE workforce pipeline. Under the model assumptions, the framework allows decision-makers to examine how alternative intervention strategies may influence workforce behavior over time. The model is intended to support systems analysis by university administrators, SE program leaders, curriculum committees, industry partners, professional associations, and workforce policy stakeholders concerned with undergraduate SE education and workforce development.
The remainder of this paper is structured as follows. Section 2 presents the background and related work. Section 3 presents the materials and methods, including the model boundary, stock-and-flow formulation, data sources, equations, and scenario design. Section 4 presents the simulation and scenario analysis results. Section 5 discusses the implications for SE education, workforce development, and policy implications, and Section 6 concludes the paper by summarizing the main contributions, limitations, and future research directions.
2. Background and Related Work
The literature on SE workforce readiness has largely focused on identifying the competencies expected of systems engineers and comparing those expectations with educational preparation [21,22]. This work provides an important foundation for defining the content of the SE skills gap, including systems thinking, modeling, communication, lifecycle knowledge, and interdisciplinary capability. However, much of the literature remains diagnostic and cross-sectional. It identifies SE competencies, educational gaps, or employer expectations at a particular point in time but provides limited explanation of how these gaps develop as students enter SE undergraduate programs, progress through education, transition into employment, and leave the workforce.
A prior SLR of the SE skills gap synthesized research on SE education, workforce development, competencies, and industry needs [14] and identified four recurring themes: workforce readiness and educational alignment, SE competencies, digital engineering capabilities, and organizational factors. These findings suggest that the SE skills gap is shaped by the interaction of educational preparation, professional competencies, technological requirements, and organizational conditions rather than by a single curriculum or graduate capability issue. However, the reviewed studies primarily identified gaps, requirements, and contributing factors and provided limited explanation of how these elements interact through an undergraduate workforce pipeline over time. The findings of the review informed the constructs represented in the present model. Workforce readiness and educational alignment informed the representation of training- and curriculum-related factors. SE competencies and digital engineering capabilities informed the representation of SE competence. Organizational factors informed the representation of graduate transition, retention, and movement into or out of SE-related roles. Therefore, this study extends the prior review by examining these constructs as interacting components of a dynamic workforce development system.
Related work on SE workforce development emphasizes that SE capability is built through a combination of formal education, training, mentoring, and applied experience [23,24]. This is important because SE practice requires the integration of technical knowledge, stakeholder needs, lifecycle processes, and decision-making across system boundaries. Formal instruction can introduce SE concepts, but applied experiences such as internships, co-ops, capstone projects, industry-sponsored projects, and mentoring provide opportunities for students to practice SE in realistic contexts [25].
SE perception and disciplinary identity are also relevant to workforce development. If SE is viewed only as a specialization within other engineering fields, students may have limited awareness of SE as an undergraduate discipline or career pathway [26,27]. Conversely, clearer communication of SE identity, value, and career relevance may improve student interest and strengthen early pipeline participation [28,29]. Therefore, this study treats SE perception and experiential learning as model variables that influence different parts of the undergraduate workforce pipeline. The undergraduate context is especially important because it represents an early entry point into the SE workforce pipeline. When students have limited exposure to applied systems problems, lifecycle processes, digital engineering environments, or industry tools, they may graduate with conceptual knowledge but insufficient readiness for SE practice [30]. Thus, workforce readiness is not treated in this study as an outcome of degree completion but as a developmental process shaped by curriculum alignment, faculty competence, experiential learning opportunities, graduate transition, and retention within SE pathways. Several research approaches could be used to examine the SE skills gap, including competency assessment, program analysis, surveys, and empirical evaluation [4,8,9]. These approaches are valuable for identifying relationships, measuring differences, or prioritizing workforce development factors. However, they do not directly represent how students, graduates, and skilled workforce members accumulate at different stages of a pipeline or how changes in one stage affect consequent workforce outcomes over time. SD was selected because the research problem involves stocks, transition flows, feedback relationships, and changes in workforce behavior over time [16,17,18]. This approach makes it possible to examine not only whether individual factors are important but also how their interactions influence the trajectory of the skilled workforce and skills gap.
This study also builds on prior causal loop modeling of the SE skills gap [14]. The prior CLD represented feedback relationships among SE perception, curriculum alignment, incoming students, graduates, skilled workforce development, and skills gap pressure. It identified reinforcing and balancing feedback loops that suggested the SE skills gap may persist because of interactions among student entry, educational capacity, workforce development, and industry needs. The prior CLD provided a useful conceptual foundation, but it was not designed to simulate behavior over time. CLDs can represent feedback structures, but they do not quantify accumulations and rates of change. This limitation is important because changes introduced at one stage of the workforce pipeline affect later stages only as individuals move through the student, graduate, and skilled workforce stocks. This is shown in Figure 1 below.
Figure 1.
Causal loop diagram [19]. “II” denotes a delay in the causal relationship.
SD has previously been applied to STEM education, academic workforce development, student retention, and policy intervention [31,32]. Prior studies demonstrated the usefulness of SD in examining progression, workforce entry and exit, and policy interventions over time. However, the studies reviewed generally address STEM or professional workforce systems broadly, limiting their ability to examine how interventions at different stages of the pipeline interact. This study differs by focusing specifically on the undergraduate SE workforce pipeline and by linking educational preparation, workforce development, and professional demand within one dynamic model. This is relevant because education systems involve delayed outcomes. Consequently, an intervention introduced at one point in the system may fail to impact the final outcome due to the multiple phases involved. SD is therefore appropriate for examining how accumulations, transitions, and feedback relationships shape the undergraduate SE workforce pipeline and skills gap over time.
Therefore, this study advances the prior literature review and causal loop model in two respects. First, it translates the constructs from the literature and qualitative feedback relationships into a quantitative stock-and-flow structure. Second, it uses that structure to examine how interventions influence the skilled workforce and skills gap trajectory over time using scenario analysis, yielding results that could not be obtained via competency identification or qualitative causal mapping alone.
3. Materials and Methods
The undergraduate Systems Engineering (SE) skills gap is examined from a systems theory perspective and operationalized using a system dynamics (SD) approach. The model is informed by SE education and the workforce readiness literature and represents the interactions among educational capacity, workforce development, and skills gap dynamics within the undergraduate SE education to workforce pathway. The modeling framework is designed to capture the accumulation of students, graduates, and skilled workforce members, as well as the feedback mechanisms that influence workforce development over time. In this study, the skills gap is represented as the difference between the desired skilled SE workforce and actual skilled SE workforce generated through the undergraduate pipeline. To operationalize this framework, this study follows an SD modeling process consisting of problem definition, system conceptualization, stock-and-flow formulation, model parameterization, model testing, and scenario analysis.
3.1. Problem Definition
The problem addressed in this study is the persistence of the SE skills gap. The skills gap is defined as the difference between the desired skilled SE workforce and the actual skilled SE workforce available through the undergraduate SE education pipeline. This definition supports a dynamic interpretation of the problem because the skilled workforce changes over time as students enter SE programs, complete training, transition into workforce roles, and exit the workforce.
The purpose of the model is to examine how the undergraduate SE workforce pipeline behaves over time and to evaluate whether the interventions can improve skilled workforce growth and reduce the skills gap. The model focuses on the transition from incoming students to graduates and then to the skilled SE workforce. It also represents losses from the pipeline through student attrition, graduate transfer into other career pathways, and workforce retirement. This structure allows us to examine whether the current undergraduate pipeline is sufficient to sustain the skilled SE workforce and whether intervention strategies can influence the long-term trajectory of the skills gap.
The model was developed to examine the structure and behavior of the undergraduate SE workforce pipeline under baseline and intervention conditions. Its purpose is to support systems thinking about the SE workforce pipeline by representing the feedback structures, accumulations, delays, and flow relationships that influence workforce development. The baseline scenario represents current conditions, while the intervention scenarios represent changes in SE perception and graduate retention.
3.2. Research Design
The research design followed the SD modeling process adapted from established guidance that emphasizes problem identification, system conceptualization, model formulation, model testing, and model use [33,34]. In this study, the process was operationalized through five stages: problem definition, conceptual model development, stock-and-flow formulation, model parameterization and testing, and scenario analysis.
First, the undergraduate SE skills gap was defined as a workforce pipeline problem involving the difference between the desired and actual skilled workforce. Second, prior findings from an SLR were used to identify major themes and variables associated with the SE skills gap, including workforce readiness and educational alignment, SE competencies, digital engineering capabilities, and organizational and implementation factors [14]. Third, a previously developed CLD was used to identify feedback structures among SE perception, incoming students, graduate output, skilled workforce development, and the skills gap [19]. Fourth, these conceptual relationships were translated into a stock-and-flow model by classifying variables as stocks, flows, auxiliary variables, or parameters. Fifth, the model was parameterized using bachelor’s level SE completion data and scenario-based assumptions for variables not directly available in national datasets.
After parameterization, the model was evaluated using dimensional consistency testing, structure verification, and extreme condition testing. Dimensional consistency was checked in Vensim DSS Academic 10.4.0 (Ventana Systems, Inc., Harvard, MA, USA) to ensure compatibility among stock, flow, auxiliary, and parameter units. Structure verification was conducted by comparing the stock-and-flow model with the prior CLD- and SLR-derived variables. Extreme-condition tests were used to examine whether the model produced interpretable behavior under limiting assumptions, such as reduced student inflow, reduced graduate transfer, or increased perception rate [35,36]. Sensitivity analysis was also performed to determine the robustness of the model, using a baseline scenario and intervention scenarios [37]. The baseline scenario represented current conditions, while the intervention scenarios were used to evaluate how changes in SE perception, experiential opportunities, and graduate retention influence the skilled workforce and skills gap over time. This procedure allowed the study to move from qualitative systems conceptualization to quantitative simulation while maintaining traceability between the literature, causal structure, stock-and-flow model, and scenario results. The simulation was carried out for a 10-year period.
The model boundary was defined around the undergraduate SE education to workforce pathway, focusing on bachelor-level SE education and the transition from incoming students to graduates and then to the skilled SE workforce. The central stock of interest is the skilled workforce, while the skills gap is calculated as the difference between the desired and actual skilled workforce. Several elements were excluded from the model to maintain a focused and interpretable structure. The model does not include masters or doctoral SE graduates, international labor flows, wage effects, curriculum differences across universities, employer hiring practices, changing macroeconomic conditions, or detailed occupational mobility across engineering fields. These were excluded because the model’s purpose is limited in scope to examining the undergraduate SE workforce pipeline rather than to creating a comprehensive labor market model.
3.3. Stock-and-Flow Model
The model adopts a pipeline structure in which individuals accumulate in successive developmental categories and move between them through transition flows. Similar SD workforce models have represented capability development through sequential experience levels, such as novice, competent, and expert, with progression governed by training and experience [38,39]. In this study, the stages are defined by the undergraduate SE pathway: incoming students, graduates, and skilled workforce. These stocks represent successive positions in the education-to-workforce pipeline rather than individual expertise levels.
The CLD, as seen in Figure 1, served as the conceptual foundation for identifying the major causal relationships among factors that affect the SE skills gap. In this study, these qualitative feedback relationships were translated into a quantitative stock-and-flow structure to support simulation over time. The translation process involved classifying variables from the CLD into stocks, flows, auxiliary variables, and parameters. The variables that accumulate over time were represented as stocks, including incoming students, graduates, and skilled workforce. The processes that increase or decrease these stocks were represented as flows, including perception, training, attrition, experts, transfers, and retirement. The variables that influence the flows, such as curriculum alignment, faculty competence, experiential opportunities, SE competence, desired skilled workforce, skills gap, and skills gap ratio, were represented as auxiliary variables. The resulting model therefore enables the feedback structure identified in prior work to be examined through baseline simulation and intervention scenario analysis. The CLD diagram from a previous study is presented below.
The stock-and-flow model represents the main stages through which individuals move as they progress from undergraduate SE education into SE workforce roles. The stock-and-flow structure was implemented in Vensim DSS Academic 10.4.0 (Ventana Systems, Inc., Harvard, MA, USA) and used to simulate workforce pipeline behavior over time. Vensim DSS Academic 10.4.0 (Ventana Systems, Inc., Harvard, MA, USA) was used as the simulation environment for implementing and running the model. The stock-and-flow model consists of the model structure, equations, parameter assumptions, and scenario settings. These elements were documented so that the model can be reproduced, tested, or adapted by other researchers and decision-makers. The first stock, incoming students, represents individuals currently in the undergraduate SE education pipeline. This stock increases through the perception flow, which represents student entry into the undergraduate SE pipeline as influenced by the visibility, perceived value, and disciplinary identity of SE. Incoming students decrease through two outflows: training, the rate at which students complete the undergraduate SE pipeline and enter the graduate stock; and attrition, students leave the undergraduate SE pipeline before completion.
The second stock, graduates, represents bachelor’s level SE graduates who are available to transition into SE workforce roles. This stock increases through the training flow and decreases through two outflows: experts, the rate at which graduates transition into the skilled SE workforce; and transfers, graduates who leave the SE workforce pathway and enter other fields.
The third stock, skilled workforce, represents the accumulated stock of bachelor’s trained SE professionals who have entered SE or related systems roles. This stock increases through the experts flow and decreases through retirement, which represents workforce exits from the skilled SE workforce over time.
The auxiliary variables influence the movement of individuals through the model. Curriculum alignment, faculty competence, and experiential opportunities influence training and contribute to SE competence. SE competence represents the aggregate knowledge, skills, and abilities needed for effective SE practice, including MBSE proficiency. Desired skilled workforce represents the target workforce level used to calculate the skills gap. Skills gap is defined as the difference between the desired and actual skilled workforce. The skills gap ratio normalizes this difference and represents the shortage pressure affecting training. This is shown in Figure 2 below.
Figure 2.
Stock-and-flow model of the SE skills gap.
The model structure therefore links the undergraduate education pipeline to workforce development through three mechanisms. First, perception influences student entry into the SE pipeline. Second, curriculum alignment, faculty competence, experiential opportunities, and SE competence influence the movement from education to workforce readiness. Third, the skills gap creates pressure for training, while workforce exits reduce the skilled workforce over time. Together, these mechanisms allow the model to examine whether the undergraduate SE pipeline can sustain the skilled workforce and reduce the skills gap under baseline and intervention conditions. Appendix A.1 describes the stock-and-flow model, including the stocks, flows, auxiliary variables, and parameters used to represent the undergraduate SE workforce pipeline.
The model was parameterized using publicly available postsecondary education data and assumptions based on these data. Model parameters were specified as values used to operationalize the stock-and-flow equations. These parameters included initial stock values, transition rates, time constants, and normalized assumptions for variables not directly observed in the empirical dataset. The primary empirical input was the 2023–2024 Integrated Postsecondary Education Data System (IPEDS) Completions file from the National Center for Education Statistics (NCES) website [40]. SE programs were identified using Classification of Instructional Programs (CIP) code 14.2701. The model focuses on the undergraduate Systems Engineering workforce pipeline; therefore, the dataset was filtered to include bachelor’s degree completions only. The total number of bachelor-level Systems Engineering completions for the 2023–2024 period was 596 persons. Based on this completion rate, certain assumptions were made to establish the initial education pipeline stock. The initial incoming students stock was estimated by multiplying the annual bachelor’s completion count by the assumed undergraduate training period. With an assumed training period of four years, the initial incoming students stock was calculated as 596 × 4 = 2384 persons. This value represents an approximate four-year undergraduate SE student pipeline under steady completion conditions. The initial graduates stock was set to 596 persons, corresponding to the 2023–2024 bachelor’s level SE completion count. The initial skilled workforce stock was estimated because a direct national workforce count for bachelor’s level SE-trained graduates is not available as a distinct occupational category. The skilled workforce stock was therefore approximated using the annual bachelor’s completion count, an assumed average career duration, and an assumed workforce entry fraction. The initial skilled workforce was calculated as 596 × 40 × 0.80 = 19,072 persons, where 40 years represents the assumed average workforce participation period and 0.80 represents the assumed fraction of bachelor’s level SE graduates who enter SE or closely related systems roles [41]. As mentioned earlier, the workforce count for SE is not a distinct category. For example, on the Bureau of Labor Statistics (BLS) website, SE is combined with other occupations, and industrial engineering was used as a closely related occupational proxy. Therefore, to estimate the desired skilled workforce, we used the projections focused on Industrial Engineers [42]. The BLS projects roughly 25,200 job openings per year in the United States (U.S.) alone. The model therefore uses 25,200 persons as an exploratory benchmark for desired skilled workforce rather than a measured workforce target. This value establishes an initial gap between the desired and actual skilled workforce and allows the model to examine whether the undergraduate SE pipeline can reduce the gap over time.
The training period was set to four years to represent the nominal duration of a full-time U.S. bachelor’s degree in SE. The value reflects the standard program structure rather than the average observed time to degree [43]. The expertise period was set to one year to represent the assumed transition from recent graduate to skilled workforce. National graduate outcome data are frequently used to evaluate employment and further education outcomes within six months of graduation [44]. A one-year period was therefore selected as a conservative transition time that allows for variation in job search, further preparation, and workforce entry. It does not represent the time required to attain full professional expertise. The handover period was set to 40 years to approximate the average workforce participation period before exit. This value is consistent with a general career span beginning in the early twenties and extending to the early-to-mid sixties. The value is treated as a literature-informed structural assumption rather than an empirically measured average. The attrition rate was assessed against cumulative attrition evidence from broader STEM and engineering education. National longitudinal data indicate that approximately 48% of beginning bachelor’s level STEM students left STEM within six years [45]. Earlier engineering education research similarly reported cumulative losses of approximately 40% from engineering pathways [46]. Under baseline conditions, an attrition rate of 0.05 per year produced a cumulative pipeline loss of approximately 45%, which falls within the range reported in the literature. The value was therefore a literature-informed approximation rather than a directly observed annual SE attrition rate. The transfer rate was set to 0.10 per year based on observed early career outcomes for engineering graduates. National survey data show that approximately two years after graduation, 60% of engineering graduates were working in engineering jobs and 18% in other science and engineering related fields, with approximately 14% employed in non-engineering fields [41]. As the modeled skilled workforce is defined to include SE and closely related systems-oriented roles, the non-engineering percentage provides the boundary reference for movement out of the modeled workforce. In the model, transfers and experts operate as competing outflows from the graduates stock; with a baseline SE Competence of approximately 0.633 and an expertise period of one year, a transfer rate of 0.10 implies that approximately 13.6% of graduates leave through the transfer flow before entering the skilled workforce, consistent with this reference. Since the underlying data report engineering graduates in aggregate rather than SE graduates specifically, the values are treated as literature-informed approximations rather than empirically measured SE transfer rates, and they were tested via sensitivity analysis. The perception rate was set to 0.02 per year in the baseline scenario to represent current levels of SE visibility, perceived value, and disciplinary identity affecting student entry into the pipeline. As there was no longitudinal estimate identified for the rate at which workforce visibility translates into SE enrollment, the numerical value was specified as a theoretically informed baseline assumption. The American Society for Engineering Education (ASEE) reported 16,871 full-time bachelor’s students enrolled in the combined industrial, manufacturing, and systems engineering category [47]. The modeled inflow therefore represents approximately 2.3% of this broader enrollment stock, indicating that the assumed entry flow is modest relative to the scale of related undergraduate engineering enrollment. Also, the ASEE category includes multiple disciplines and reports fall enrollment rather than annual entrants, it was used only as a plausibility benchmark and not as a direct estimate of the perception rate. The parameter was tested in the sensitivity analysis.
Curriculum alignment, faculty competence, and experiential opportunities are normalized, dimensionless factors. There are no direct national measures available for these constructs. For curriculum alignment, the baseline value of 0.80 represents substantial but incomplete alignment. Accredited engineering programs are subject to the Accreditation Board for Engineering and Technology (ABET) criteria governing curriculum content and student outcomes, while industry evidence identifies persistent gaps in professional, interdisciplinary, and cross-functional skills [3], and the prior SLR found that alignment with evolving industry expectations remains incomplete [14]. The value of 0.80 therefore represents a structured normalization of the evidence of strong curricular capacity with a meaningful residual gap, rather than an observed percentage of aligned curricula or competencies. Faculty competence was likewise set to 0.8, representing strong formal capability with a residual gap for SE practice. ABET criteria require faculty qualifications and professional development appropriate to the program, supporting a relatively high baseline value. However, SE is an integrative and practice-oriented discipline in which professional capability develops through the application of knowledge across complex projects and organizational settings. This is consistent with the INCOSE professional certification framework that incorporates documented SE experience in addition to knowledge assessment [48]. Faculty may therefore possess strong academic and technical qualifications while having varying levels of sustained practitioner experience in SE contexts, a constraint also identified in the prior review [14]. The value of 0.8 normalizes this as strong instructional capacity with a gap in experience. Experiential opportunities’ central role is grounded in the profession’s account of how SE competence develops. The INCOSE handbook states that professional development, particularly in SE, occurs largely through experience and on-the-job learning [49]. This framework supports experiential learning in playing a central role in competence formation but does not provide a direct national measure of experiential access in undergraduate SE programs. The baseline value of 0.30 was therefore established as a structured normalization. Undergraduate programs provide substantial formal instruction, but student access to the sustained experiential settings through which SE competence primarily develops is more limited. The prior SLR similarly identified insufficient opportunities for applied and practice-based learning as an important gap in undergraduate SE preparation [14]. The value of 0.30 therefore represents meaningful but limited experiential access rather than the percentage of competence attributable to experience or a directly observed national participation rate. These values were tested over the specified range in the sensitivity analysis.
3.4. Model Equations and Scenario Analysis
The stock-and-flow model was formulated using standard SD notation, in which each stock is calculated as the integral of its inflows minus its outflows over time. The model equations are shown in Appendix A.2. The equations were implemented in Vensim DSS Academic 10.4.0 (Ventana Systems, Inc., Harvard, MA, USA) using annual time steps and units of persons, persons/year, years, and dimensionless values. Dimensionless values were used for normalized constructs such as curriculum alignment, faculty competence, experiential opportunities, SE competence, and skills gap ratio.
Scenario analysis was conducted to evaluate the systemic implications of intervention strategies for the undergraduate SE workforce pipeline. Each simulation scenario was run under identical model structure and baseline conditions, except for the parameters associated with the targeted intervention levers. This approach allowed differences in model behavior to be attributed to specific changes in perception, graduate retention, and experiential learning opportunities. The intervention levers were selected based on their relevance to the baseline behavior of the model, and their practical relevance for SE education and workforce development. Perception rate was selected because it influences student entry into the undergraduate SE pipeline. Transfer rate was selected because it represents graduate leakage from the SE workforce. Experiential opportunities was selected because it influence both training and SE competence. Together, these variables represent leverage points that can be acted upon through recruitment, career development, industry engagement, and applied SE learning opportunities. Scenario selection followed three criteria. First, the intervention levers had to represent conditions that education or workforce stakeholders could deliberately influence. Training period, expertise period, and handover period describe institutional or career duration assumptions rather than direct policy instruments, while desired skilled workforce represents an external demand benchmark. These variables were therefore not treated as intervention levers. Second, the scenarios were selected to cover distinct mechanisms across the undergraduate SE education-to-workforce pipeline. Perception rate influences student entry, experiential learning opportunities influences educational preparation and the development of SE competence, and transfer rate represents graduate movement outside SE and closely related systems roles. The scenario set therefore permits the comparison of interventions affecting recruitment, preparation, and graduate workforce retention. Third, scenario selection considered both the potential for improvement and the gaps identified in the prior review. Curriculum alignment and faculty competence influence the same educational capacity pathway as experiential opportunities; but both were assigned relatively high baseline values of 0.80 on the normalized 0–1 scale (see Section 3.3). Experiential opportunities had a lower baseline value of 0.30 and was identified in the prior review as an important gap in undergraduate SE preparation [14]. It was therefore selected as the focal educational capacity intervention. Undergraduate attrition was also considered, but preliminary attrition reduction produced only a modest change in outcome magnitude and did not generate behavior distinct from the baseline; attrition rate was consequently retained in the sensitivity analysis rather than included as a principal scenario.
The baseline scenario (S0) represents the current reference condition of the undergraduate SE workforce pipeline without additional intervention. In this scenario, the perception rate, transfer rate, and experiential learning opportunities were set to 0.02/year, 0.10/year, and 0.30, respectively. This scenario provides the reference for evaluating whether the existing undergraduate SE pipeline is sufficient to sustain the skilled workforce and reduce the skills gap over time.
The perception intervention scenario (S1) examines the effect of improving SE visibility, perceived value, and disciplinary identity. In this scenario, the perception rate was increased from 0.02/year to 0.08/year, while the transfer rate and experiential learning opportunities were held at their baseline values. This scenario represents interventions such as stronger undergraduate recruitment, clearer SE career pathways, outreach to prospective students, and improved communication of SE as a distinct discipline.
The retention intervention scenario (S2) examines the effect of reducing graduate movement out of the SE workforce pathway. In this scenario, the transfer rate was reduced from 0.10/year to 0.02/year, while the perception rate and experiential learning opportunities were held at their baseline values. This scenario represents interventions such as stronger industry partnerships, career advising, employer engagement, and clearer employment pathways for SE graduates.
The experiential learning intervention scenario (S3) examines the effect of expanding applied SE learning opportunities. In this scenario, experiential learning opportunities were increased from 0.30 to 0.80, while the perception rate and transfer rate were held at their baseline values. This scenario represents an expansion of internships, co-ops, industry sponsored projects, capstone experiences, applied MBSE activities, mentoring, and other experiential learning mechanisms that support SE workforce readiness.
The combined intervention scenario (S4) examines the effect of simultaneously improving SE perception, reducing graduate transfer, and expanding experiential learning opportunities. In this scenario, the perception rate was increased to 0.08/year, the transfer rate was reduced to 0.02/year, and experiential learning opportunities was increased to 0.80. This scenario represents a coordinated workforce development strategy that acts on both the front end of the pipeline, by increasing student entry, and the workforce transition stage, by improving applied preparation and reducing graduate leakage.
The scenario formulation follows the logic of simulation-based policy analysis in SD [37]. Simulation experiments were carried out to examine how alternative intervention levers influence system behavior over time. This approach supports the comparison of single and combined interventions and provides insight into which leverage areas produce the strongest long-term effects on the skilled SE workforce and the skills gap. The intervention values were specified as ambitious policy experiments rather than marginal parameter adjustments. S1 increased the perception rate from 0.02 to 0.08 per year to represent a sustained and coordinated effort to improve SE visibility and recruitment. S2 reduced the transfer rate from 0.10 to 0.02 per year, lowering the model proportion of graduates leaving the pathway from approximately 13.6% to 3.1%. S3 increased experiential opportunities from 0.30 to 0.80, bringing it to the same level as curriculum alignment and faculty competence. S4 combined all three interventions. These scenarios are intended as bounded comparisons of distinct and actionable leverage points rather than an exhaustive representation of all possible interventions.
Model verification was conducted to assess whether the stock-and-flow model was internally consistent, structurally aligned with the conceptual model, and capable of producing interpretable behavior under limiting conditions [35]. The verification process included dimensional consistency testing, structure verification, and extreme condition testing and sensitivity analysis [36].
First, dimensional consistency testing was conducted in the software to ensure that all model equations were compatible across units. Stocks were specified in persons, flows in persons/year, time constants in years, rates in 1/year, and normalized constructs as dimensionless variables. The process was used to confirm that each stock accumulated in- and outflows with compatible units and that auxiliary variables did not introduce unit inconsistency into the flow equations.
Second, structure verification was conducted by comparing the stock-and-flow model with the prior CLD and SLR constructs. The ensured that the stock-and-flow formulation preserved the main conceptual relationships identified in prior work, including the roles of SE perception, curriculum alignment, experiential learning opportunities, graduate transition, skilled workforce development, and the skills gap. This comparison helped us confirm that the simulation model remained consistent with the conceptual feedback structure.
Also, extreme condition testing was conducted by assigning limiting values to select parameters and checking whether the model behavior remained consistent with the intended logic. Perception rate, transfer rate, and experiential learning opportunities were each set to zero in separate test runs. These tests indicated that the model produced interpretable behavior under limiting assumptions and did not generate structurally inconsistent responses. Finally, one-at-a-time sensitivity analysis was conducted to determine whether the reported behavior modes and scenario comparisons depended on the selected baseline parameter values. This analysis was particularly important because several parameters were based on assumptions or indirect estimation rather than direct measurement, as summarized in Section 3.3. Each parameter was varied while all other parameters were held at their baseline values. All selected parameters were varied by ±25% from their baseline values to assess whether reasonable variation in uncertain assumptions altered the model’s behavior modes or scenario rankings. Hekimoğlu and Barlas [50] note that sensitivity ranges should preferably be informed by empirical system data but that ±20% is commonly used when defining parameter distributions in system dynamics sensitivity analysis. The model’s robustness was then assessed using two criteria: whether the baseline behavior pattern persisted, and whether the combined intervention scenario, S4, remained more effective than the baseline and each single intervention scenario.
The model was developed as an exploratory SD model; verification focused on internal consistency, structural logic, and behavior under expected conditions. The model was not calibrated against historical workforce time-series data because SE-specific national workforce transition data were not available. Therefore, the simulation results are interpreted as behavior-over-time patterns rather than precise workforce forecasts.
4. Results
The baseline scenario represents the reference condition of the undergraduate SE workforce pipeline. This represents a current condition case in which SE visibility and disciplinary identity remain limited, there is graduate movement out of the SE workforce pathway, and applied SE learning opportunities are not widespread. Under baseline conditions, the skilled workforce declines gradually over the 10- year simulation horizon. The skilled workforce begins at approximately 19,072 persons and decreases to 16,355 persons by the end of the simulation period. At the same time, the skills gap increases from approximately 6128 persons to 8844 persons. This behavior indicates that, under baseline assumptions, the undergraduate SE workforce pipeline is not sufficient to maintain the skilled workforce at the desired level. The widening skills gap is driven by the imbalance between workforce inflow and workforce exit.
The experts flow, which represents the transition of graduates into the skilled SE workforce, declines sharply during the early simulation period and remains below the retirement flow throughout the baseline run. Although the retirement flow also decreases gradually, this decline occurs because the skilled workforce stock itself is shrinking. Therefore, the reduction in retirement does not indicate improved workforce sustainability; rather, it reflects the declining size of the workforce stock. The training flow remains relatively low and nearly stable over time. This suggests that the undergraduate pipeline continues to produce graduates, but not at a rate sufficient to rebuild the graduate transition pool or offset workforce exits. The baseline behavior therefore reflects a structurally constrained pipeline in which limited experiential learning opportunities, low SE perception, and graduate leakage reduce the system’s ability to replenish the skilled workforce.
Overall, the baseline simulation establishes the reference trajectory for the intervention analysis. Without changes to perception, graduate retention, or experiential learning opportunities, the model produces a declining skilled workforce and a widening skills gap. This result supports the need to evaluate intervention scenarios that target key leverage points in the undergraduate SE workforce pipeline.
The perception intervention scenario tested the effect of increasing the perception rate from 0.02/year to 0.08/year while holding transfer rate and experiential learning opportunities at their baseline values. Compared with the baseline scenario, the perception intervention improved pipeline behavior but did not fully close the skills gap. Training increased steadily over the simulation horizon, indicating that stronger SE visibility, perceived value, and disciplinary identity increased the inflow and throughput of the undergraduate SE pipeline. The experts flow initially declined but later recovered, reflecting the delayed effect of increased student entry on workforce transition. However, because experiential learning opportunities and transfer rate remained at baseline levels, the skilled workforce still declined slightly and the skills gap continued to widen, although less severely than in the baseline scenario. This suggests that perception-based interventions can strengthen the front end of the pipeline but may be insufficient as a standalone strategy for closing the SE skills gap.
The retention intervention scenario was designed to test the effect of reducing graduate movement out of the SE workforce pathway by lowering the transfer rate from 0.10/year to 0.02/year while holding perception rate and experiential learning opportunities at baseline values. This scenario produced only limited improvement relative to the baseline. The skilled workforce continued to decline, and the skills gap continued to widen over the simulation horizon. Training remained low and nearly flat, indicating that the intervention did not affect the upstream production of graduates. Although the reduction in transfer rate decreased graduate leakage, the experts’ flow remained below the retirement flow, preventing sustained growth in the skilled workforce. This result suggests that reducing graduate leakage alone is insufficient to close the SE skills gap when student entry and applied learning opportunities remain constrained.
The experiential learning intervention scenario tested the effect of increasing experiential learning opportunities from 0.30 to 0.80 while holding perception rate and transfer rate at their baseline values. Compared with the baseline scenario, this intervention improved system performance but did not eliminate the skills gap. The skilled workforce remained more stable in the early simulation period and declined more gradually over time, while the skills gap increased at a slower rate than under baseline conditions. The intervention produced a strong initial increase in the training and experts flows, reflecting the role of experiential learning in strengthening both undergraduate preparation and SE competence. However, both flows declined over time because perception remained at baseline levels, limiting sustained replenishment of the pipeline. As a result, the experts’ flow eventually fell below the retirement flow, preventing long-term growth in the skilled workforce. These results suggest that experiential learning opportunities are an important leverage point for improving workforce readiness, but they are insufficient as a standalone strategy for closing the SE skills gap. The combined intervention scenario tested the simultaneous effect of increasing the perception rate to 0.08/year, reducing the transfer rate to 0.01/year, and increasing experiential learning opportunities to 0.80. Among all scenarios examined, this intervention produced the strongest improvement in system behavior. The skilled workforce increased gradually over the simulation horizon, while the skills gap declined steadily. The training flow increased substantially, indicating a stronger undergraduate pipeline throughput, and the experts’ flow rose over time after a brief initial decline. Unlike the baseline and single intervention scenarios, the experts flow exceeded the retirement flow for most of the simulation period, allowing the skilled workforce stock to grow. These results suggest that a coordinated intervention strategy that simultaneously improves SE perception, reduces graduate leakage, and expands applied SE learning opportunities is more effective than isolated interventions for reducing the undergraduate SE skills gap.
Table 1 summarizes the end of horizon outcomes for the baseline and intervention scenarios. Each single intervention improved the 2035 skilled workforce relative to the baseline. The perception (S1) and experiential learning (S3) interventions produced increases of approximately 9% and 8%, respectively, and their end values were within approximately 1% of one another. The retention (S2) intervention produced a smaller improvement. However, in each single-intervention scenario, the 2035 skills gap remained larger than its initial value, indicating that the interventions slowed the deterioration but did not reverse the baseline trajectory. The combined intervention, S4, was the only scenario that ended the simulation with a skills gap smaller than its initial value. Under S4, the gap decreased from 6128 persons at initialization to 3742 persons in 2035, while the skilled workforce was approximately 31% larger than under the baseline scenario.
Table 1.
Comparison of end-of-horizon outcomes across the baseline and intervention scenarios.
Figure 3 compares the skills gap and skilled workforce trajectories under the baseline and combined intervention scenarios. The baseline gap widens throughout the simulation period, whereas the coordinated intervention progressively reduces the gap and ends below its initial value. The baseline is the red curve, and the combined intervention is the blue curve.
Figure 3.
Comparison of baseline and combined intervention trajectories for (a) skills gap and (b) skilled workforce.
From the sensitivity analysis, the baseline behavior pattern was preserved across all tested parameter ranges. In every run, the skilled workforce declined from its initial value, and the skills gap widened relative to the starting condition. The combined intervention, S4, also remained the strongest scenario at both extremes of every tested range, producing a larger skilled workforce than the baseline and each single-intervention scenario. The largest variation in the 2035 skilled workforce occurred for the handover period and skilled workforce entry fraction, followed by curriculum alignment, faculty competence, and experiential opportunities. The variation in the perception rate, attrition rate, transfer rate, and expertise period produced comparatively smaller changes at the end of 2034. Table 2 presents the full results.
Table 2.
Univariate sensitivity analysis: all parameters varied ±25% about baseline.
Overall, the principal behavior mode and central scenario conclusion were robust across the tested ranges, although the magnitude of the projected workforce remained sensitive to assumptions about career duration, workforce entry, and educational capacity.
5. Discussion
The simulation results suggest that the undergraduate SE skills gap is better understood as a dynamic workforce pipeline problem than as a mismatch between education and industry. Across the scenarios, the skills gap trajectory was shaped by how the three intervention dimensions affected movement through the workforce pipeline. SE perception influenced student entry, experiential learning influenced training and SE competence, and graduate retention influenced the number of graduates available to transition into the skilled workforce. These effects shaped the experts’ flow, while the balance between experts and retirement determined whether the skilled workforce increased or declined. When experts remained below retirement, the skilled workforce declined and the skills gap widened; when experts exceeded retirement, the skilled workforce increased and the skills gap narrowed. The strongest improvement occurred when recruitment, preparation, and retention were addressed together.
Further, two structural features of the system help explain why the simulated patterns take the form they do. The first is delay. The pipeline separates upstream interventions from their workforce effects through the four-year training period and the subsequent transition into practice. The interventions affecting perception and educational preparation therefore act with a lag and accumulate gradually rather than producing immediate gains in the skilled workforce. This is consistent with the general behavior of systems containing substantial delays and accumulations, in which the effects of structural interventions emerge only after intermediate stocks have adjusted [16]. The second feature is the shifting of the binding constraint. Each single-intervention scenario relieves one constraint on workforce growth, that is, entry, preparation, or graduate retention, while constraints elsewhere in the pipeline remain active. Additional entrants are still limited by educational preparation, better prepared graduates remain subject to movement outside the modeled workforce pathway, and improved graduate retention has a limited effect when the upstream supply of prepared graduates remains small. Improving one stage of the pipeline does not remove constraints elsewhere; instead, another stage may become the primary bottleneck. This explains why every single-intervention scenario improves outcomes but still ends with a skills gap larger than at initialization when the simulation terminates, whereas the combined intervention reverses the trajectory under the tested conditions.
Also, because the single-intervention scenarios were specified as deliberately ambitious policy experiments, their inability to reverse the widening gap suggests that intervention at one point in the pipeline is insufficient within the model structure and parameter ranges examined. The skills gap therefore emerges from the interaction of feedback, accumulation, delay, and constraints across the pipeline rather than from a deficiency located at any single stage. This interpretation is consistent with the framing introduced in Section 1 and extends the treatment of the skills gap beyond a static comparison of graduate capabilities and workforce expectations.
The findings have several implications for SE education and workforce development. First, SE perception appears to be an important condition for improving the skills gap. In this model, the perception intervention illustrates the effect of delay particularly clearly. Increasing the perception rate expands entry into the undergraduate pipeline, but these new students do not immediately become members of the skilled workforce. They must first accumulate within the incoming students stock, complete undergraduate preparation, enter the graduates stock, and then transition through the experts flow. The delayed recovery of experts under this scenario is therefore a structural consequence of the education-to-workforce pipeline rather than evidence that recruitment has no effect. At the same time, increasing entry alone does not resolve constraints in preparation or graduate transition, which explains why the intervention slows the widening gap without reversing it. Perception does not only refer to the attractiveness of SE as a career choice. It also reflects the visibility, perceived value, and disciplinary identity of SE. This is important because SE is often viewed as a specialization and it overlaps with industrial engineering, software engineering, aerospace engineering, project management, and general engineering [10,11,12]. This is also supported by the literature suggesting that if SE improves in identity, then the perceived value of SE will improve, which can influence student recruitment [51,52]. Ultimately, if students do not clearly understand SE as a distinct undergraduate discipline and career pathway, the pipeline may remain limited even when workforce demand exists.
Second, experiential learning opportunities are important because they influence both training and SE competence. Internships, co-ops, industry-sponsored projects, capstone experiences, applied SE activities, and other forms of applied learning provide students with opportunities to connect SE concepts to real systems. According to Lombardo and Eichinger [53], SE capability is developed substantially through experience, mentorship, and applied practice rather than formal instruction alone. The experiential learning scenario suggests that applied preparation can improve the workforce readiness of the pipeline, but the effect is limited when student entry remains weak. This suggests that experiential learning should not be treated only as an instructional enhancement; it should be part of a broader workforce development strategy.
Third, graduate retention matters, but it is not sufficient by itself. By reducing the transfer out of the SE workforce pathway, this can help retain graduates for SE-related roles, but the model suggests that this intervention has limited effect if the upstream pipeline does not produce enough prepared graduates. This finding is important for industry partners because hiring and retention strategies should be connected to educational partnerships, student awareness, and applied preparation. A stronger SE workforce pipeline requires coordination between universities, employers, professional organizations, and workforce development stakeholders.
The sensitivity analysis indicates that the study’s principal conclusions are robust within the tested parameter ranges. The stronger sensitivity to the handover period and skilled workforce entry fraction reflects the direct influence of these assumptions on workforce persistence and initial system scale. The comparatively greater effects of curriculum alignment, faculty competence, and experiential opportunities also highlight the importance of educational capacity in shaping the graduate-to-workforce transition. By contrast, the smaller effects of the individual pipeline rates suggest that modest changes to isolated transition parameters are insufficient to alter the overall system behavior. These findings support the conclusion that coordinated interventions are more effective than isolated changes, while also showing that the numerical projections remain sensitive to assumptions about career duration, workforce entry, and educational capacity. Although the model was not calibrated to reproduce a historical trajectory, its baseline behavior was compared with independently reported workforce conditions.
The baseline simulation produces a persistent and widening gap between the desired skilled workforce and the skilled workforce as workforce exits exceed additions from graduates. This behavior is compatible with the demand-side evidence used to benchmark the model. The U.S. Bureau of Labor Statistics projects sustained annual openings and faster-than-average employment growth for industrial engineers, the closest occupational proxy used in the study [42]. Broader national evidence also shows continued growth in the STEM workforce relative to the non-STEM workforce [54]. In addition, the SE education literature has identified shortages of systems engineers and SE educators [23]. These sources do not provide an SE-specific historical trajectory, but they support the plausibility of sustained workforce demand and continuing supply constraints. On the supply side, the model was initialized using the observed 2023–2024 IPEDS count of 596 bachelor-level SE completions [40]. ASEE Fall 2023 enrollment data for the broader combined category of Industrial, Manufacturing, and Systems Engineering were used only as a contextual benchmark for the scale of related undergraduate enrollment [47]. Since these sources differ in disciplinary coverage and provide a point in time rather than integrated longitudinal data, they were not used to claim direct reproduction of observed workforce behavior. The comparisons indicate that the model’s initial conditions and qualitative baseline behavior are compatible with the external evidence available. No longitudinal national SE workforce series was identified against which formal behavior reproduction testing could be conducted; accordingly, the model is interpreted as an exploratory structure for examining the consequences of alternative interventions rather than as a forecasting model.
The practical implications for universities and SE program leaders is that improving SE workforce readiness requires more than curriculum revision alone. The results suggest that improving workforce readiness requires acting on both entry and preparation, the two mechanisms associated with the largest single-intervention improvements in the model. Curriculum alignment should be supported by applied learning opportunities, stronger industry engagement, and clearer communication of SE identity and career pathways. In addition, SE programs may benefit from making SE more visible early in the undergraduate experience and from connecting students to real-world systems problems through internships, co-ops, projects, and capstone partnerships. SE programs should also track graduate placement into SE and related systems roles as a program-level indicator of movement through the graduate-to-workforce transition represented in the model.
The retention scenario’s effect indicates that employer engagement concentrated only at the hiring stage acts relatively late in the pipeline and is constrained by the number of prepared graduates available. The model therefore suggests that industry may have greater leverage when it also engages in SE undergraduate education as this can help improve student perception, provide applied learning opportunities, and reduce graduate movement into non-SE pathways. Employers can support the pipeline through mentorship, project sponsorship, internships, recruitment partnerships, and clearer articulation of SE career roles.
The implication for policymakers and professional organizations is that the model highlights the value of coordinated strategies. The combined scenario produced an approximately 31% improvement in the skilled workforce at the end of the simulation horizon relative to the baseline, compared with approximately 9% for the strongest single intervention. This result suggests that paired initiatives, for example, professional society outreach and visibility efforts, combined with funding for experiential learning partnerships between universities and employers may produce greater improvement than initiatives concentrated at only one stage. Professional organizations such as INCOSE are particularly well positioned to strengthen the entry stage by improving disciplinary identity, visibility, and understanding of SE career pathways. They can support this through student outreach, mentoring networks, career materials, student chapters, and clearer communication of entry-level SE roles and competencies.
Finally, this study’s data limitations also have a policy implication. SE is not consistently represented as a distinct occupational and educational category in national datasets, which constrains workforce planning and empirical model development. A more systematic collection of SE-specific enrollment, completion, placement, and occupational data would strengthen the evidence base for future workforce analysis and policy design. The current model was parameterized using U.S. data and workforce information. Therefore, the numerical results should be interpreted within the U.S. context. However, the stock-and-flow structure is not inherently limited to the U.S. Thus, the model can be adapted to other regions by using local data and parameter values.
6. Conclusions
In this study, a stock-and-flow simulation model was developed to examine the undergraduate Systems Engineering (SE) skills gap as a dynamic workforce pipeline problem. The model represented the movement of individuals from incoming students to graduates and then to the skilled SE workforce, while also accounting for student attrition, graduate transfer into other career pathways, workforce exit, SE perception, experiential learning opportunities, and skills gap pressure. The purpose of the model was not to produce exact national workforce forecasts but to examine behavior-over-time patterns under baseline and intervention conditions.
The baseline simulation produced a declining skilled workforce mode and a widening skills gap. This behavior suggests that, under baseline assumptions, the undergraduate SE pipeline does not replenish the skilled workforce at a rate sufficient to offset workforce exits. The single-intervention scenarios produced partial improvements but did not fully shift the system into sustained workforce growth. The retention intervention had a limited effect because it reduced graduate leakage without strengthening student entry or applied preparation. The perception intervention improved the front end of the pipeline by increasing student entry and training, while the experiential learning intervention improved preparation and SE competence. However, each intervention alone left other constraints active.
Under the stated assumptions, the combined intervention produced the strongest improvement in reducing the widening skills gap. When SE perception was increased, graduate transfer was reduced, and experiential learning opportunities were expanded simultaneously, the skilled workforce shifted toward growth and the skills gap shifted toward narrowing. Within the boundaries and assumptions of the model, this result indicates that the undergraduate SE skills gap is unlikely to be addressed effectively through a single isolated intervention strategy. Instead, the results support a coordinated workforce development strategy that strengthens recruitment, applied learning, graduate transition, and retention together.
This study contributes to SE education and workforce development research by integrating educational preparation and workforce transition mechanisms within a quantified model of the undergraduate SE pipeline. Theoretically, it frames the skills gap as an evolving system behavior produced by interactions across the workforce pipeline rather than only as a static mismatch between graduate capabilities and workforce expectations. Methodologically, it extends the prior SLR and CLD by translating their findings into a stock-and-flow structure that supports behavior-over-time analysis and comparisons of intervention strategies. The model therefore provides an exploratory framework for examining how coordinated changes across the pipeline may influence skilled workforce development and the resulting skills gap.
Despite these contributions, this study has some limitations. First, several parameter values rely on assumptions or indirect parameterization rather than direct measurement. Although each assumed value was assessed against the closest available evidence, as described in Section 3.3, and varied in the sensitivity analysis in Section 3.4, suitable national SE measurements were not identified for some parameters. The numerical outcomes were also particularly sensitive to assumptions concerning career duration and the proportion of graduates entering the skilled workforce. The desired skilled workforce is similarly an exploratory benchmark because SE is not represented consistently as a distinct occupation in national statistics. The projections for industrial engineers were used as the closest available occupational proxy. Projected annual openings were used to establish the approximate scale of workforce demand rather than as a directly measured SE workforce target.
Second, the model structure represents a single national pipeline using three aggregate stocks and therefore does not capture heterogeneity across institutions, programs, student populations, industries, or occupational settings. It also excludes pathways such as graduate education, movement into SE roles from other academic disciplines, and mid-career entry into or exit from SE-related work. The skilled workforce is defined broadly to include SE and closely related system roles. This boundary is consistent with the broader occupational proxy used on the demand side but remains a modeling choice necessitated by the absence of a consistently delineated SE occupational category.
Third, the model is parameterized using U.S. education and workforce evidence, so its numerical results apply to the U.S. context. Differences in educational structures, degree duration, accreditation systems, occupational classifications, and labor market conditions across countries are not represented. Although the underlying stock-and-flow structure is not inherently country-specific, application in another national context would require re-parameterization using locally appropriate education, workforce, and transition data.
Fourth, the model boundary excludes several broader labor market mechanisms, including compensation and wage competition, employer hiring behavior, mobility among engineering occupations, immigration, economic cycles, and changes in industry demand. These factors could influence student entry, graduate transition, workforce transfer, and retirement. Their exclusion means that the scenarios isolate selected education and workforce development mechanisms rather than reproduce the complete labor market in which these mechanisms operate.
Finally, no longitudinal national SE workforce series was identified against which formal behavior reproduction testing could be conducted. Model assessment therefore emphasized structural consistency, dimensional consistency, extreme condition testing, and sensitivity analysis, consistent with the exploratory purpose of the model [50]. Accordingly, the results should be interpreted as conditional behavior-over-time patterns generated by the specified structure and assumptions, rather than as quantitative predictions of future labor market outcomes.
Future research should refine the model using additional empirical data on SE student progression, graduate placement, occupational transition, and workforce retention. Behavioral validation can also be conducted to examine the robustness of the behavior modes under different assumptions given suitable longitudinal SE data or established reference behaviors. The model can be expanded to include graduate-level SE pathways, regional workforce demand, and stronger links between industry participation and educational capacity. Future work should also employ participatory modeling workshops with academic and industry stakeholders to improve model credibility and support practical intervention design.
Funding
This research received no external funding.
Institutional Review Board Statement
Not applicable.
Informed Consent Statement
Not applicable.
Data Availability Statement
The original contributions presented in this study are included in the article.
Conflicts of Interest
The author declares no conflict of interest.
Appendix A
Appendix A.1
This section describes the variables in the stock-and-flow model.
Table A1.
Elements of the system dynamics model.
Appendix A.2
This section presents the model equations used in the stock-and-flow simulation.
Table A2.
Model equations used in stock-and-flow simulation.
References
- Sheard, S.A.; Mostashari, A. Principles of complex systems for systems engineering. Syst. Eng. 2009, 12, 295–311. [Google Scholar] [CrossRef] [Scilit]
- Graessler, I.; Grewe, B. Stages of Systems Engineering: An Analysis and Characterization of Systems Engineering Approaches. Systems 2025, 13, 53. [Google Scholar] [CrossRef] [Scilit]
- Wade, J.; Gerardo, H.; Sorenson, H. Systems engineering competency expectations, gaps, and program analysis. In Proceedings of the INCOSE International Symposium, Detroit, MI, USA, 25–30 June 2022; John Wiley & Sons, Ltd.: Hoboken, NJ, USA, 2022; Volume 32, pp. 1359–1372. [Google Scholar] [CrossRef] [Scilit]
- Kasser, J.; Frank, M.; Zhao, Y.Y. Assessing the competencies of systems engineers. In Proceedings of the 7th Bi-Annual European SE Conference (EUSEC), Stockholm, Sweden, 23 May 2010; INCOSE: San Diego, CA, USA, 2010; Volume 26, p. 2010. [Google Scholar]
- Henderson, K.; McDermott, T.; Salado, A. MBSE adoption experiences in organizations: Lessons learned. Syst. Eng. 2024, 27, 214–239. [Google Scholar] [CrossRef] [Scilit]
- Akundi, A.; Ravipati, P.R.T.; Luna Fong, S.A.; Otieno, W. Industry-Driven Model-Based Systems Engineering (MBSE) Workforce Competencies—An AI-Based Competency Extraction Framework. Systems 2025, 13, 781. [Google Scholar] [CrossRef] [Scilit]
- De Souza, R.A. Maturity Curve of Systems Engineering. Doctoral Dissertation, Naval Postgraduate School, Monterey, CA, USA, 2008. [Google Scholar]
- Marnewick, A.L.; Handley, H.A. A framework of international competencies for systems engineers. In Proceedings of the INCOSE International Symposium, Virtual, 20–22 July 2020; John Wiley & Sons, Ltd.: Hoboken, NJ, USA, 2020; Volume 30, pp. 1253–1265. [Google Scholar] [CrossRef] [Scilit]
- Camelia, F.; Ferris, T.L.; Behrend, M.B. The effectiveness of a systems engineering course in developing systems thinking. IEEE Trans. Educ. 2019, 63, 10–16. [Google Scholar] [CrossRef] [Scilit]
- Emes, M.; Smith, A.; Cowper, D. Confronting an identity crisis—How to “brand” systems engineering. Syst. Eng. 2005, 8, 164–186. [Google Scholar] [CrossRef] [Scilit]
- Akeel, U.U.; Bell, S.J. Discourses of systems engineering. Eng. Stud. 2013, 5, 160–173. [Google Scholar] [CrossRef] [Scilit]
- Honoré-Livermore, E.; Fossum, K.R.; Veitch, E. Academics’ perception of systems engineering and applied research projects. Syst. Eng. 2022, 25, 19–34. [Google Scholar] [CrossRef] [Scilit]
- Squires, A.; Olwell, D.; Roedler, G.; Ekstrom, J.J. Gaps in the body of knowledge of systems engineering. In Proceedings of the INCOSE International Symposium, Rome, Italy, 9–12 July 2022; John Wiley & Sons, Ltd.: Hoboken, NJ, USA, 2012; Volume 22, pp. 1967–1976. [Google Scholar]
- Oladimeji, O. A Systematic Literature Review of the Systems Engineering Skills Gap. Am. Soc. Eng. Manag. 2026; accepted. [CrossRef] [Scilit]
- Parnell, G.S.; Kenley, C.R.; Specking, E.; Pohl, E. Systems Engineering and Industrial Engineering. In Proceedings of the INCOSE International Symposium, Detroit, MI, USA, 25–30 June 2022; John Wiley & Sons, Ltd.: Hoboken, NJ, USA, 2022; Volume 32, pp. 1010–1021. [Google Scholar] [CrossRef] [Scilit]
- Sterman, J.D. Business Dynamics: Systems Thinking and Modeling for a Complex World; McGraw-Hill: Columbus, OH, USA, 2000. [Google Scholar]
- Forrester, J.W. System dynamics—A personal view of the first fifty years. Syst. Dyn. Rev. J. Syst. Dyn. Soc. 2007, 23, 345–358. [Google Scholar] [CrossRef] [Scilit]
- Bala, B.K.; Arshad, F.M.; Noh, K.M. System Dynamics; Springer: Singapore, 2017. [Google Scholar] [CrossRef] [Scilit]
- Oladimeji, O.; Macanas, J.; Michaelson, R. Addressing the Systems Engineering Skills Gap with Industry Demands Using System Dynamics. In Proceedings of the American Society for Engineering Management 2025 International Annual Conference, Boise, ID, USA, 24–27 September 2025. [Google Scholar]
- Binder, T.; Vox, A.; Belyazid, S.; Haraldsson, H.; Svensson, M. Developing system dynamics models from causal loop diagrams. In Proceedings of the 22nd International Conference of the System Dynamic Society, Oxford, UK, 25–29 July 2004; Volume 82. [Google Scholar]
- Wasson, C.S. System Engineering Competency: The Missing Element in Engineering Education. In Proceedings of the 20th Anniversary of the INCOSE International Symposium, Chicago, IL, USA, 12–15 July 2010; John Wiley & Sons, Ltd.: Hoboken, NJ, USA, 2010; Volume 20, pp. 21–36. [Google Scholar] [CrossRef] [Scilit]
- Graessler, I.; Hentze, J.; Oleff, C. Systems engineering competencies in academic education: An industrial survey about skills in systems engineering. In Proceedings of the 2018 13th Annual Conference on System of Systems Engineering (SoSE), Paris, France, 19–22 June 2018; IEEE: New York, NY, USA, 2018; pp. 501–506. [Google Scholar] [CrossRef] [Scilit]
- Muller, G.; van Veen, L.; van den Aker, J. Systems Engineering Education: From Learning Program to Business Value. Systems 2023, 11, 510. [Google Scholar] [CrossRef] [Scilit]
- Sheppard, K.G.; Nastasi, J.A.; Hole, E.; Russell, P.L. SE Capstone: Implementing a Systems Engineering Framework for Multidisciplinary Capstone Design. In Proceedings of the 2011 ASEE Annual Conference & Exposition, Vancouver, BC, Canada, 26–29 June 2011; pp. 22–1278. [Google Scholar] [CrossRef] [Scilit]
- Sheppard, K.G.; Nastasi, J.; Hole, E. A Pilot for Multidisciplinary Capstone Design Incorporating a Systems Engineering Framework. In Proceedings of the 2012 ASEE Annual Conference & Exposition, San Antonio, TX, USA, 10–13 June 2012; pp. 25–88. [Google Scholar]
- Kasser, J.; Hitchins, D. 3.4.1 yes systems engineering, you are a discipline. In Proceedings of the INCOSE International Symposium, Rome, Italy, 9–12 July 2012; Volume 22, pp. 416–431. [Google Scholar] [CrossRef] [Scilit]
- Pennock, M.J.; Wade, J.P. The top 10 illusions of systems engineering: A research agenda. Procedia Comput. Sci. 2015, 44, 147–154. [Google Scholar] [CrossRef] [Scilit]
- Wasson, C. The Systems Engineering Conundrum: Where is the ENGINEERING? In Proceedings of the INCOSE International Symposium, Virtual, 17–22 July 2021; Volume 31, pp. 848–871. [Google Scholar] [CrossRef] [Scilit]
- Beasley, R.; O’Neil, A. Selling Systems Engineering by Searching for the Sweet Spot. In Proceedings of the INCOSE International Symposium, Edinburgh, Scotland, 18–21 July 2016; John Wiley & Sons, Ltd.: Hoboken, NJ, USA, 2016; Volume 26, pp. 300–317. [Google Scholar] [CrossRef] [Scilit]
- Bertoni, A. A reverse engineering role-play to teach systems engineering methods. Educ. Sci. 2019, 9, 30. [Google Scholar] [CrossRef] [Scilit]
- Tsai, Y.N.; Fang, C.C. A System Dynamics Approach to Modeling Student Dropout Behavior and Evaluating Educational Policy Interventions. IEEE Access 2025, 13, 216053–216068. [Google Scholar] [CrossRef] [Scilit]
- Strauss, L.M.; Borenstein, D. A system dynamics model for long-term planning of the undergraduate education in Brazil. High. Educ. 2015, 69, 375–397. [Google Scholar]
- Martinez-Moyano, I.J.; Richardson, G.P. Best practices in system dynamics modeling. Syst. Dyn. Rev. 2013, 29, 102–123. [Google Scholar] [CrossRef] [Scilit]
- Duggan, J. An introduction to system dynamics. In System Dynamics Modeling with R; Springer International Publishing: Cham, Switzerland, 2016; pp. 1–24. [Google Scholar]
- Schwaninger, M.; Grösser, S. System dynamics modeling: Validation for quality assurance. In System Dynamics: Theory and Applications; Springer US: New York, NY, USA, 2020; pp. 119–138. [Google Scholar]
- Qudrat-Ullah, H. On the validation of system dynamics type simulation models. Telecommun. Syst. 2012, 51, 159–166. [Google Scholar]
- Cavana, R.Y. Scenario modelling for managers: A system dynamics approach. In Proceedings of the 45th Annual Conference of the ORSNZ, Auckland, New Zealand, 29–30 November 2010; University of Auckland: Auckland, New Zealand, 2010; pp. 219–228. [Google Scholar]
- Ghaffarzadegan, N.; Xue, Y.; Larson, R.C. Work-education mismatch: An endogenous theory of professionalization. Eur. J. Oper. Res. 2017, 261, 1085–1097. [Google Scholar] [CrossRef] [Scilit] [PubMed]
- Appel, D.C.; Mansouri, M. System dynamics modeling of the STEM education and outreach career pipeline. IEEE Trans. Technol. Soc. 2022, 3, 143–153. [Google Scholar] [CrossRef] [Scilit]
- National Center for Education Statistics. Integrated Postsecondary Education Data System. U.S. Department of Education. Available online: https://nces.ed.gov/ipeds (accessed on 31 May 2026).
- Gilmartin, S.K.; Antonio, A.L.; Brunhaver, S.R.; Chen, H.L.; Sheppard, S.D. Career plans of undergraduate engineering students: Characteristics and contexts. In US Engineering in a Global Economy; Freeman, R.B., Salzman, H., Eds.; University of Chicago Press: Chicago, IL, USA, 2018; pp. 49–85. [Google Scholar]
- U.S. Bureau of Labor Statistics. Industrial Engineers. In Occupational Outlook Handbook; U.S. Bureau of Labor Statistics: Washington, DC, USA, 2025. Available online: https://www.bls.gov/ooh/architecture-and-engineering/industrial-engineers.htm (accessed on 15 July 2026).
- National Center for Education Statistics. Appendix B. Glossary. U.S. Department of Education, Institute of Education Sciences. Available online: https://nces.ed.gov/programs/raceindicators/glossary.asp (accessed on 15 July 2026).
- National Science Board. The STEM Labor Force: Scientists, Engineers, and Skilled Technical Workers (Science and Engineering Indicators 2024, NSB-2024-5); National Science Foundation: Alexandria, VA, USA, 2024. Available online: https://ncses.nsf.gov/pubs/nsb20245/ (accessed on 15 July 2026).
- Chen, X. STEM Attrition: College Students’ Paths Into and Out of STEM Fields (NCES 2014-001rev); National Center for Education Statistics, Institute of Education Sciences, U.S. Department of Education: Washington, DC, USA, 2013. Available online: https://nces.ed.gov/pubsearch/pubsinfo.asp?pubid=2014001rev (accessed on 15 July 2026).
- Seymour, E.; Hewitt, N.M. Talking About Leaving: Why Undergraduates Leave the Sciences; Westview Press: Boulder, CO, USA, 1997. [Google Scholar]
- American Society for Engineering Education. Profiles of Engineering and Engineering Technology, 2024; American Society for Engineering Education: Washington, DC, USA, 2025; Available online: https://ira.asee.org/by-the-numbers/ (accessed on 15 July 2026).
- International Council on Systems Engineering. Start Your Certification. Available online: https://www.incose.org/certification/start-your-certification/ (accessed on 15 July 2026).
- International Council on Systems Engineering. INCOSE Systems Engineering Handbook: A Guide for System Life Cycle Processes and Activities, 4th ed.; Walden, D.D., Roedler, G.J., Forsberg, K., Hamelin, R.D., Shortell, T.M., Eds.; John Wiley & Sons: Hoboken, NJ, USA, 2015. [Google Scholar]
- Hekimoğlu, M.; Barlas, Y. Sensitivity analysis of system dynamics models by behavior pattern measures. In Proceedings of the 28th International Conference of the System Dynamics Society, Seoul, Republic of Korea, 25–29 July 2010; Available online: https://proceedings.systemdynamics.org/2010/proceed/papers/P1260.pdf (accessed on 6 June 2026).
- Godwin, A.; Potvin, G.; Hazari, Z.; Lock, R. Identity, critical agency, and engineering: An affective model for predicting engineering as a career choice. J. Eng. Educ. 2016, 105, 312–340. [Google Scholar] [CrossRef] [Scilit]
- Patrick, A.D.; Prybutok, A.N. Predicting persistence in engineering through an engineering identity scale. Int. J. Eng. Educ. 2018, 34, 251–363. [Google Scholar]
- Lombardo, M.; Eichinger, R. The Career Architect Development Planner, 1st ed.; Lominger Limited. Inc.: Minneapolis, MN, USA, 1996. [Google Scholar]
- U.S. Bureau of Labor Statistics. STEM Occupations: Past, Present, and Future. In Spotlight on Statistics; U.S. Bureau of Labor Statistics: Washington, DC, USA, 2017. Available online: https://www.bls.gov/spotlight/2017/science-technology-engineering-and-mathematics-stem-occupations-past-present-and-future/pdf/science-technology-engineering-and-mathematics-stem-occupations-past-present-and-future.pdf (accessed on 15 July 2026).
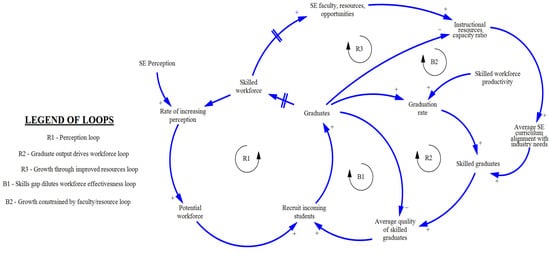
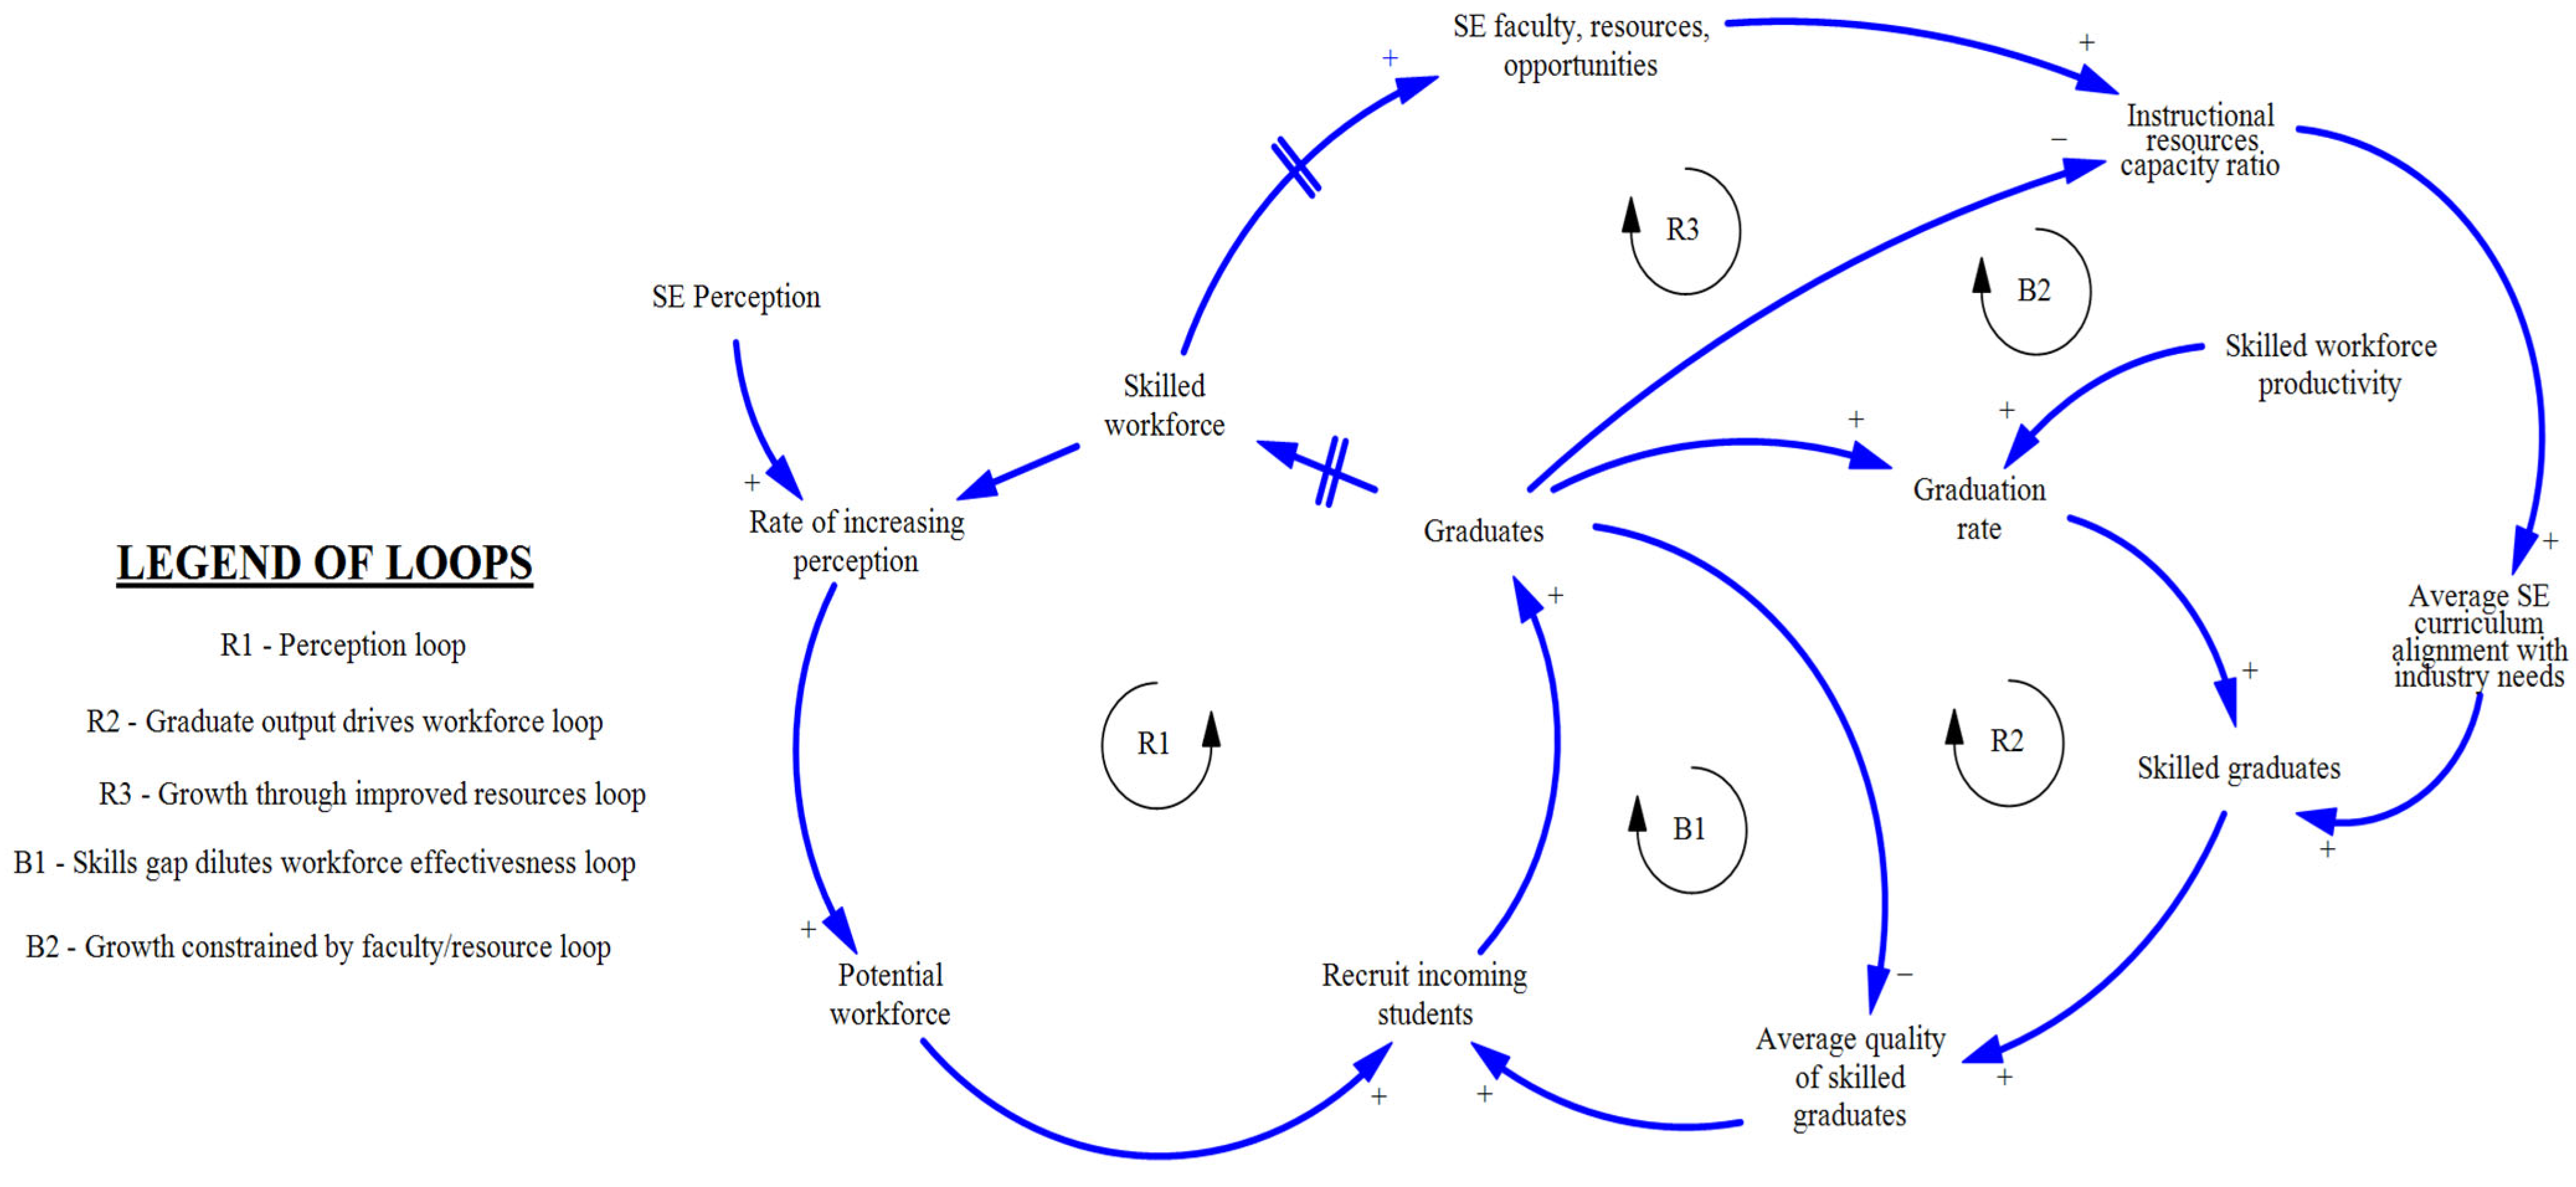
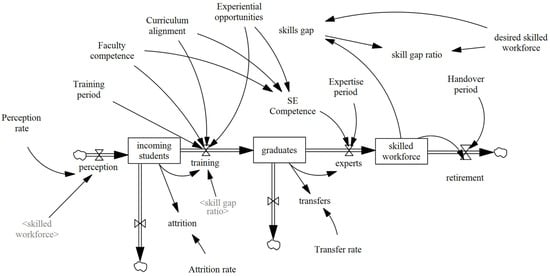
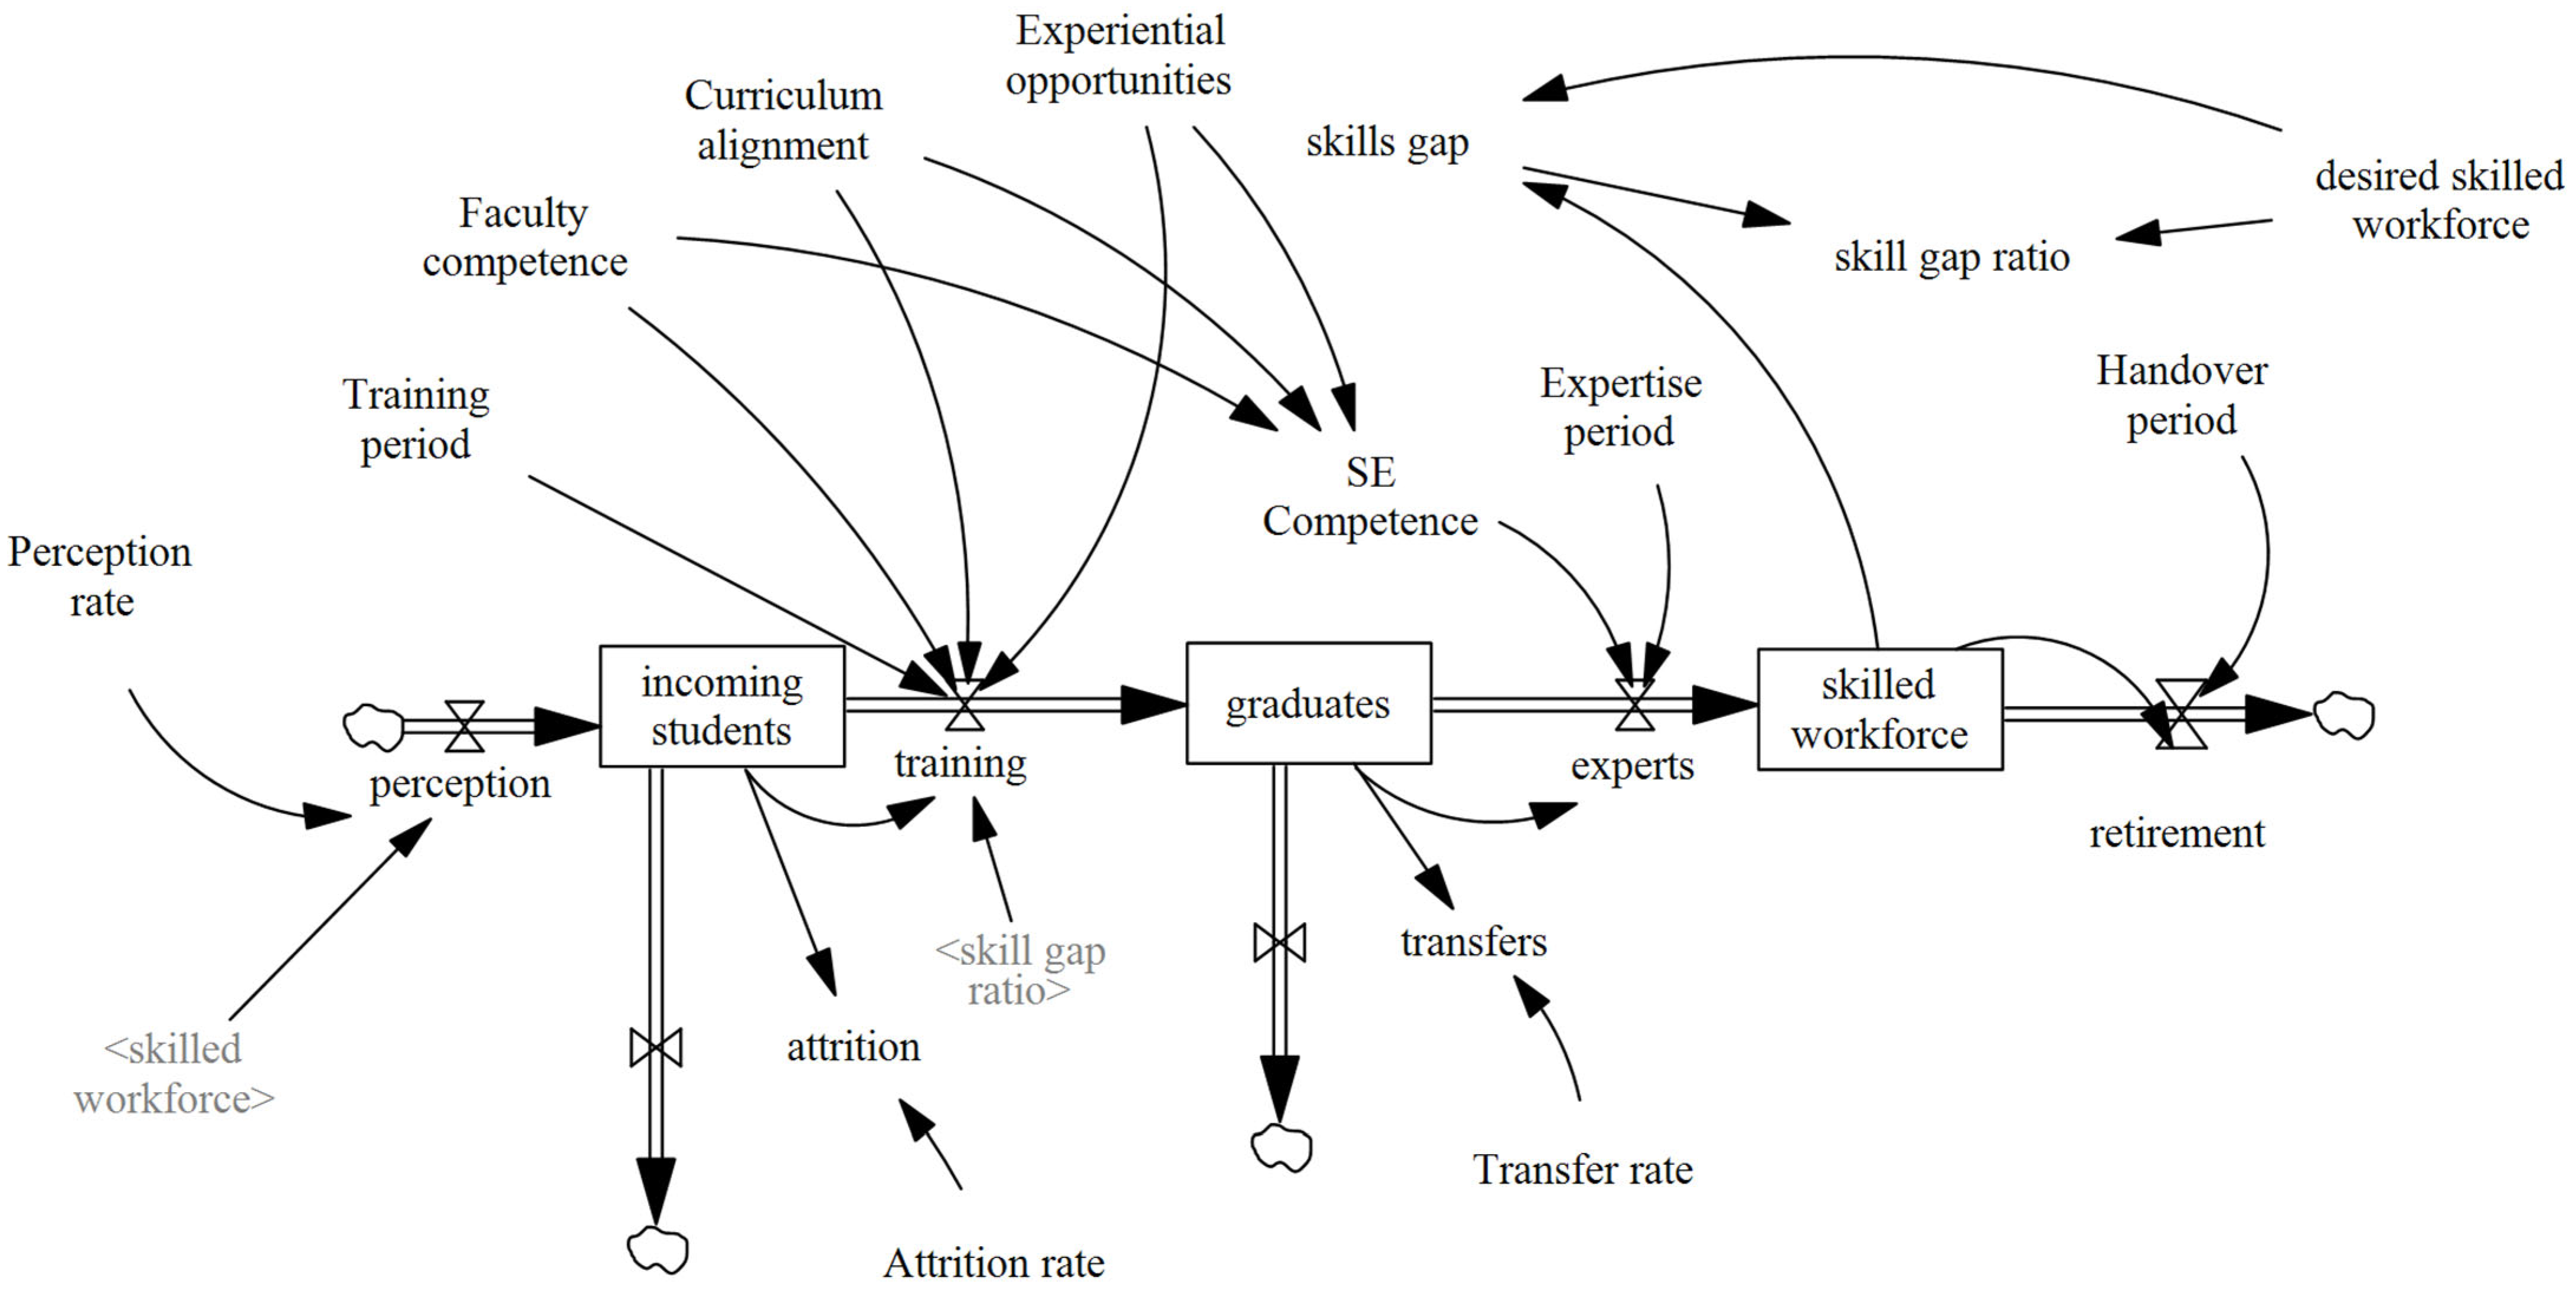
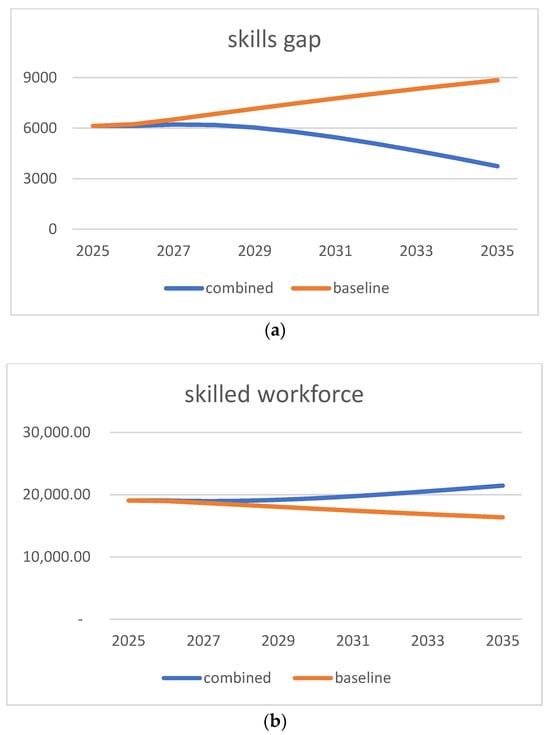
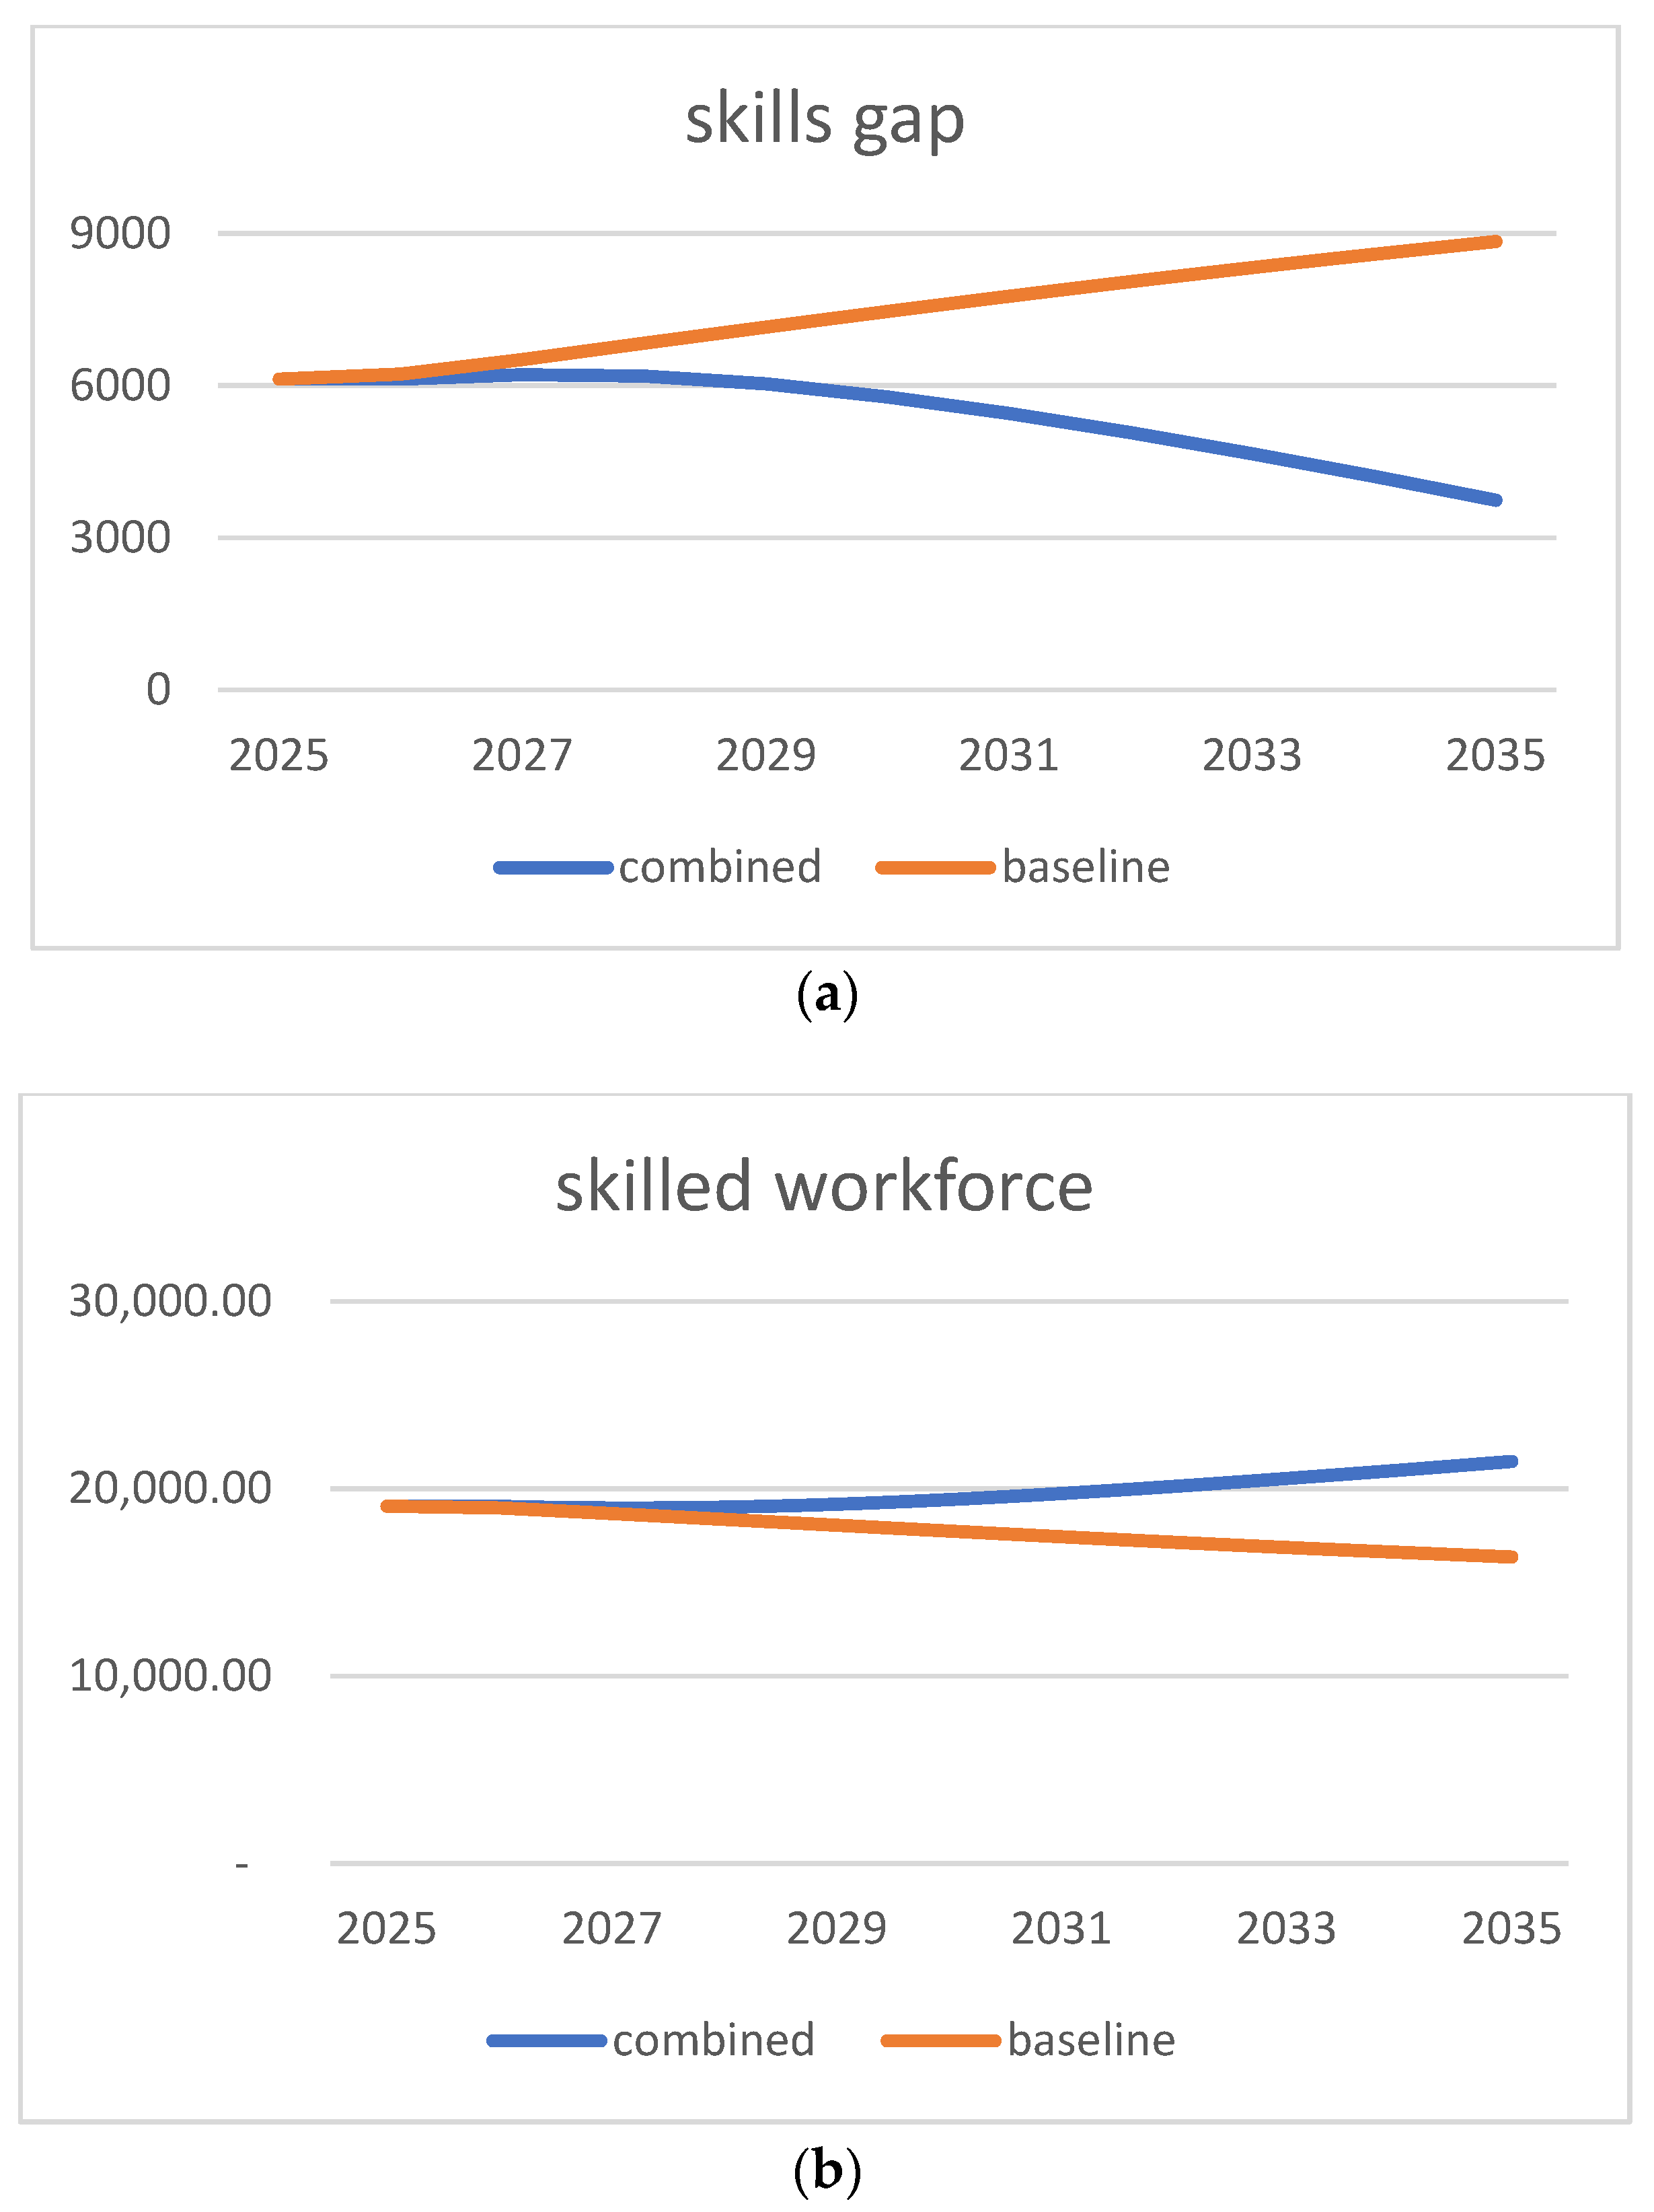

Disclaimer/Publisher’s Note: The statements, opinions and data contained in all publications are solely those of the individual author(s) and contributor(s) and not of MDPI and/or the editor(s). MDPI and/or the editor(s) disclaim responsibility for any injury to people or property resulting from any ideas, methods, instructions or products referred to in the content. |
© 2026 by the author. Licensee MDPI, Basel, Switzerland. This article is an open access article distributed under the terms and conditions of the Creative Commons Attribution (CC BY) license.