Article

Unveiling the Black Box: Nonlinear Effects of Digital Transformation on Financial Distress with XGBoost-SHAP Model

1
School of Economics and Management, Harbin Institute of Technology, Weihai 264209, China
2
School of Computer Science and Technology, Harbin Institute of Technology, Weihai 264209, China
3
Development Research Center of Shandong Provincial People’s Government, Jinan 250011, China
*
Authors to whom correspondence should be addressed.
Systems 2026, 14(8), 905; https://doi.org/10.3390/systems14080905
Submission received: 1 June 2026 / Revised: 20 July 2026 / Accepted: 28 July 2026 / Published: 1 August 2026

Highlights

Please indicate how your work links to systems science via your contributions to systems practice, theory, and or methodology.
  • XGBoost-SHAP captures non-linear interactions and threshold effects, advancing systems methodology and practice.
  • XGBoost outperforms traditional Logit regression in both AUC and PR_AUC for financial distress prediction.
What are the main findings and/or the implications of the main findings?
  • The marginal contribution of digital transformation to risk reduction is non-linear, stabilizing only beyond a critical threshold.
  • Digital transformation and operating profit margin are identified as key protective features, while the asset-liability ratio is the primary risk driver.

Abstract

Existing research lacks consensus on how digital transformation affects financial distress, and traditional linear models struggle to capture complex variable dynamics. This study examines the link from prediction and association perspectives by constructing a high-precision financial risk prediction model and using explainable methods to explore feature contributions. Using 2010–2024 data from Chinese A-share listed companies, we apply Logit regression to assess the association between digital transformation and financial distress, and introduce an XGBoost model with SHAP for prediction and interpretability. Results show that XGBoost outperforms Logit (AUC, PR_AUC). Logit regression reveals a negative correlation between digital transformation and distress probability, which SHAP further supports. Higher digitalization corresponds to lower predicted risk, with non-linear characteristics: at low levels, marginal contributions fluctuate; beyond a threshold, the mitigation effect stabilizes. Feature importance identifies the asset-liability ratio as the top risk factor, while digital transformation and operating profit margin serve as key protective features. This paper contributes by constructing a digital transformation index and integrating it into the financial distress prediction model, comparing traditional econometric models with machine learning models, and using SHAP to provide an interpretable framework for understanding the digital transformation–financial distress association.

1. Introduction

The global economy is undergoing profound digital transformation. Digital technologies like AI, cloud computing, big data, and blockchain are reshaping industries at an unprecedented pace. In China, digital transformation has been elevated to a national strategy. Policies such as “Made in China 2025,” the “15th Five-Year Plan,” and the “Digital China” initiative clearly outline this strategy. Corporate digital transformation has become a key driver for high-quality economic development and a new development paradigm. As one of the world’s largest digital economies, China offers a unique institutional and market context. This context is crucial for studying the financial consequences of digital transformation.
On the one hand, China’s A-share market features a Special Treatment (ST/*ST) system. This system provides an objective standard for identifying corporate financial distress. It issues risk warnings based on accounting metrics, such as consecutive losses or net assets falling below registered capital. This reduces subjective bias in measuring financial distress. On the other hand, Chinese enterprises exhibit a unique dual-path transformation, driven by both government policy and market forces—a feature that distinguishes them from the more market-exclusive models in developed economies. Thus, it offers a new perspective on the relationship between digital transformation (DX) and financial distress (FD).
However, the impact mechanism of DX on FD is complex. It has drawn widespread attention from Chinese academia and industry. First, digital transformation is widely seen as a way to improve efficiency. It optimizes resource allocation, reduces operating costs, and expands market boundaries. Based on the Resource-Based View (RBV), digital technologies help firms build unique capabilities, thereby creating a competitive advantage [1]. Moreover, research shows that these technologies enhance production and management efficiency, thereby boosting profitability and risk resilience [2]. Under the “dual circulation” strategy, DX helps firms integrate into global value chains, which improves international competitiveness. For instance, using data from Chinese listed firms, Cui and Wang found that DX lowers the probability of financial distress by reducing agency costs and easing financing constraints [3].
Conversely, digital transformation brings significant risks and challenges. It requires massive initial investments in R&D, equipment, and talent, which increases short-term financial burdens for many firms, especially SMEs [4]. Furthermore, DX may divert firms from their core competencies, leading to higher earnings volatility [5]. From a cost–benefit perspective, Sun et al. note that excessively rapid transformation can exceed a firm’s absorptive capacity and may actually exacerbate financial distress risks [4]. Therefore, the relationship between DX and FD may be complex and non-linear: moderate digital investment reduces risk, while excessive or insufficient transformation can have adverse effects. Understanding this complex relationship is of practical significance, as it helps corporate managers formulate prudent strategies and regulators prevent systemic financial risks.
Traditional financial distress prediction studies often use linear model or generalized linear model. However, the formation of financial distress involves complex non-linear interactions, and distressed firm samples are typically the minority classes, leading to severe sample imbalance. Traditional models thus have limited predictive accuracy and generalization in handling these issues [6,7]. Recently, ensemble learning algorithms like XGBoost have shown great promise, possessing strong non-linear fitting capabilities and adapting well to structured data [8,9]. However, the “black box” nature of machine learning limits their credibility in decision-making, as decision-makers need high-precision predictions but also require an understanding of the rationale. The SHAP (Shapley Additive Explanations) method addresses this by quantifying each feature’s marginal contribution based on Shapley values from game theory, thus providing an effective tool for improving model interpretability [10,11].
This study is positioned as a prediction-oriented empirical analysis supplemented by association analysis, with two core objectives. First, it builds a high-precision XGBoost-based financial distress prediction model and systematically compares it with a traditional Logit model to evaluate performance improvements. Second, it uses SHAP to analyze feature contributions, revealing association patterns between key variables like DX and FD. Notably, SHAP analysis reveals the direction and strength of feature contributions, reflecting association patterns at the prediction level rather than strict causal mechanisms. Accordingly, this paper selects appropriate methods, evaluation metrics, and interpretation strategies.
The marginal contributions of this paper are threefold. First, it systematically incorporates DX into the financial distress prediction model and conducts a large-sample empirical test within the Chinese A-share market context, thereby expanding the variable system in financial distress prediction research [12]. Second, it compares the predictive performance of XGBoost and traditional Logit model, providing empirical guidance for method selection in financial distress early-warning research. Third, it uses SHAP to reveal the contribution and impact patterns of feature variables, offering an interpretable analytical framework for understanding the DX-FD association. This study provides references for emerging market enterprises to enhance financial resilience during digital transformation and methodological support for regulators to optimize risk monitoring systems.

2. Theoretical Background and Problem Formulation

2.1. Research on Digital Transformation and Financial Distress

The impact of digital transformation on corporate financial distress is a critical issue in management and finance studies, as firms face unprecedented opportunities and challenges under the global wave of the digital economy. Understanding this impact is vital for sustainable development and risk avoidance [3,13]. This section first builds a unified analytical framework based on multiple theoretical perspectives, then reviews progress in financial distress prediction methods, and finally clarifies the innovative contribution of this study.
Existing research on this topic relies on various theoretical perspectives, generally forming two views: “risk mitigation” and “risk induction.” However, these views are not mutually exclusive; they likely reflect the differentiated effects of digital transformation at different development stages and under varying conditions. Therefore, this study constructs a unified theoretical framework, drawing upon the RBV, Information Asymmetry Theory (IAT), Agency Theory (AT), and Transaction Cost Theory (TCT).
Research supporting the “risk mitigation” effect is based on the following logic. First, the RBV suggests that digital transformation builds unique data assets and digital capabilities, and also fosters digital organizational capabilities. These elements help firms form inimitable competitive advantages, thereby enhancing their risk resilience [3,14]. Second, IAT highlights that digital transformation improves internal transparency and external disclosure quality, effectively reducing information friction between firms and creditors or investors, and consequently lowering external financing costs and easing financing constraints [15,16,17]. Third, TCT indicates that digital technologies significantly reduce information search, bargaining, and monitoring costs, thus optimizing resource allocation efficiency [18,19,20].
Empirical studies also support this perspective. Using data from Chinese A-share listed firms, Cui and Wang found that digital transformation reduces the probability of financial distress by lowering agency costs and easing financing constraints [3]. Furthermore, Yousaf et al., in a systematic review of financial distress prediction literature, pointed out that digital-related variables are increasingly becoming important predictors [21].
Conversely, research supporting the “risk induction” view emphasizes the potential costs and risks. First, from the perspective of AT, managers may over-invest in digitalization, driven by personal motives to expand business or by short-term performance pressures, leading to resource misallocation and reduced investment efficiency [5]. Second, organizational change theory (OCT) views digital transformation as a systematic project that requires substantial upfront capital and organizational adjustment costs. If digital investments exceed a firm’s financial or absorptive capacity, cash flow may tighten, thereby exacerbating financial pressure [4]. Sun et al. empirically demonstrate that transformation speed has a non-linear relationship with financial distress risk, as excessively rapid transformation may surpass a firm’s absorptive and integrative capacities, thereby increasing that risk [4]. Li et al. also find that digital transformation may divert firms from their core businesses, increasing financial investment allocations and leading to higher earnings volatility [5].
Synthesizing these two theoretical views, this paper posits a non-linear relationship between digital transformation and financial distress, which is unlikely to be a simple linear promotion or inhibition. The theoretical basis for this non-linearity is as follows. First, network effects theory (NET) suggests that the value of digital technologies grows non-linearly with application scale and depth, and benefits to operational efficiency, information environment, and governance only emerge after reaching a critical scale. Before this threshold, firms may face financial pressure from high investments without adequate efficiency gains. Second, organizational learning theory (OLT) indicates that absorbing digital technologies requires enhanced organizational capabilities, involving a learning curve with high initial learning and trial-and-error costs. The marginal contribution to financial performance may initially be negative or weak, but as experience accumulates and complementary capabilities improve, marginal benefits increase and stabilize. Third, the Dynamic Capabilities Perspective suggests that converting digital investments into substantive dynamic capabilities (e.g., sensing, capturing, and transforming) takes time, and this conversion inherently involves time-varying and non-linear characteristics. Based on these theoretical deductions, this paper expects a threshold effect, whereby the risk-mitigating effect of digital transformation will only fully manifest after the transformation level crosses a specific critical point.

2.2. Research on Financial Distress Prediction Based on Machine Learning Algorithms

With the rapid development of artificial intelligence, financial distress early-warning models have undergone a paradigm shift from traditional statistical methods to machine learning algorithms. Traditional models, such as Multivariate linear regression, Logit, and Probit regressions, offer clear functional forms and good interpretability, but they have inherent limitations, including difficulties in handling high-dimensional features, capturing non-linear relationships, and addressing sample imbalance [6,7]. In recent years, machine learning methods, including decision tree ensembles, Support Vector Machines (SVM), and Neural Networks, have gained widespread application in financial distress prediction, driven by their strong pattern recognition capabilities and adaptability to complex data structures [22,23].
Regarding specific methods, early studies often employed Artificial Neural Networks (ANN). Yang et al. found that ANN models exhibit good classification performance [24]. Chen et al. proposed a regularized sparse neural network method to address variable selection and local optimum problems [25]. Other research explored the application of simulated annealing optimization in neural network training. However, ANN models face challenges in practical applications, such as a high risk of overfitting, complex hyperparameter tuning, and instability with small sample data.
Recently, tree-based ensemble learning models have become mainstream in this field. Chi et al. proposed a decision tree ensemble method based on optimized sampling probabilities and achieved good results in financial distress prediction [26]. Deng et al. built an interpretable ensemble learning model using data from Chinese listed companies [27]. From a systemic risk perspective, Wang and Liang proposed an adaptive weighted XGBoost-Bagging hybrid model [28]. Abrahamsen et al. systematically compared various machine learning models for predicting financial distress in Nordic firms [22], and Tanaka et al. also used Random Forests to construct a multi-stage early-warning system [29]. Notably, Ben Jabeur et al. and Carmona et al. verified the superior performance of the XGBoost algorithm and demonstrated its effectiveness in predicting corporate bankruptcy and business failure [9,10].
These studies show that ensemble learning methods like XGBoost have a solid empirical foundation in financial distress prediction. However, their predictive performance in the Chinese A-share market context, particularly when digital transformation features are included, warrants further empirical testing.
In summary, scholars have accumulated substantial work on the financial consequences of digital transformation and the construction of machine learning warning models, which lay a solid foundation for this study. Nevertheless, existing research presents several gaps for further exploration. First, the literature remains divided on the relationship between digital transformation and financial distress, with few studies systematically investigating potential non-linear association patterns. Second, current early-warning research mainly focuses on traditional financial ratios and corporate governance indicators, while research incorporating digital transformation features into warning models remains scarce. Third, although ensemble learning algorithms excel in prediction accuracy, their inherent “black box” nature limits credibility and operability in actual financial decisions. While SHAP has been used to improve model interpretability [10,11], systematic analyses combining SHAP with digital transformation variables in the context of Chinese listed companies are still rare.
Based on this literature review, this paper proposes the following research questions:
  • RQ1: Controlling for other financial and governance factors, what is the association between the degree of digital transformation and corporate financial distress—linear or non-linear?
  • RQ2: Does the XGBoost model systematically outperform the traditional Logit model in predicting financial distress among Chinese A-share listed firms, using metrics such as AUC, PR_AUC, and F1?
  • RQ3: Based on the SHAP interpretability method, which feature variables make significant contributions to financial distress prediction, and what are the characteristics of their impact directions and marginal contribution patterns?
To address these questions, this study selects feature variables from the dimensions of financial status and corporate governance, introduces the XGBoost algorithm to build a prediction model and systematically compares it with the traditional Logit model. Meanwhile, it combines SHAP interpretability technology to analyze the contribution and impact patterns of feature variables. Ultimately, this study aims to provide an analytical framework that balances prediction accuracy and interpretability for financial risk early warning in Chinese listed companies. Figure 1 illustrates the research framework of this study.

3. Methodology

3.1. Sample Selection and Data Processing

This study selects the period from 2010 to 2024 as the sample timeframe, based on three main considerations. First, the global financial crisis of 2008–2009 severely impacted corporate financial behavior and capital markets, but after 2010 the market environment stabilized, so corporate financial conditions better reflect the outcomes of normal operational decisions. Second, around 2010, corporate digital transformation in China entered an accelerated phase due to strong government promotion, leading to a significant increase in digital practices and information disclosures by listed companies, which provides a comparable and reliable data foundation for the research. Third, regarding data availability, annual report text data for listed companies after 2010 are relatively complete and of high quality.
The initial research sample consists of Chinese A-share listed companies from 2010 to 2024. Data on corporate digital transformation are derived from textual analysis of annual reports, while financial and corporate governance data are sourced from the CSMAR database and the CNRDS platform. It should be noted that the digital transformation indicator is constructed based on annual reports, so for firm-quarter-level regression analyses, the DX value remains identical across all four quarters within the same year. To address the issue of non-independent observations resulting from this, robust standard errors clustered at the firm level are employed in subsequent regression analyses. Annual data are used for validation in robustness checks.
To meet the research objectives and ensure data comparability and reliability, we further processed the raw data as follows: (1) Exclude companies in the financial sector; (2) Exclude companies in abnormal trading status; (3) Exclude firms with severe missing values or unobtainable data for key research variables; (4) Perform a two-sided 1% trimming on relevant continuous variables and standardize the measurement units of the variables. Ultimately, a total of 187,801 valid firm-quarter observations meeting the research requirements were obtained for data analysis and empirical testing.

3.2. Variable Definitions and Measurement

3.2.1. Explanatory Variables

Digital Transformation (DX): Following the methodology of Wu et al., this paper categorizes DX into five technological domains, including artificial intelligence, cloud computing, blockchain, big data, and digital technology application [2]. Based on these categories, a dictionary of characteristic keywords is constructed, as shown in Table 1.
During text processing, we use the Python 3.12 jieba tool to segment the annual report texts, then match and count keywords based on the constructed dictionary. To mitigate measurement bias caused by varying report lengths, we standardize the raw keyword frequencies by dividing them by the total word count (in thousands). Following Zheng et al., we add one to the standardized frequencies and take the natural logarithm, yielding the final proxy for DX [30]. To validate this indicator, we manually review a random sample of 200 annual reports to verify the accuracy of the keyword matching.

3.2.2. Dependent Variables

Financial Distress (FD): FD refers to a state where a firm faces severe difficulties in repaying maturing debts and meeting going-concern requirements [31]. In the Chinese A-share market, Special Treatment (ST or *ST) serves as a formal regulatory risk warning applied to companies exhibiting financial abnormalities or violations [32].
Specifically, following Qian et al., this paper defines a listed company as financially distressed if it meets either of the following conditions. (1) its audited net profit is negative for two consecutive accounting years; or (2) its audited ending net assets for the most recent accounting year fall below its registered capital, implying that net asset per share is lower than the stock’s par value. Samples meeting either criterion are assigned a value of 1 (Financial Distress) and 0 otherwise [33]. Companies designated as ST due to information disclosure violations or other non-financial irregularities are excluded to ensure accurate measurement of financial distress.

3.2.3. Control Variables

To ensure the comprehensiveness of the prediction model and the reliability of the empirical analysis, this study selects feature variables from four dimensions: financial structure, operational efficiency, corporate governance, and growth capability, following studies by Yousaf et al. and Zhang et al. [21,23].
The core variables include the asset-liability ratio (LEV), operating profit margin (OPM), total asset turnover (ATO), cash flow ratio (CFR), largest shareholder ownership (Top1), independent directors ratio (Indep), ownership nature (Ownership), and High-Tech Enterprise (HTE). These variables serve as feature variables in the prediction models and control variables in the empirical regressions. Their definitions and descriptions are presented in Table 2.
LEV: The LEV reflects a company’s level of indebtedness and debt repayment ability. It is one of the most direct and widely used indicators of financial risk and an indispensable variable in financial distress early warning models [23,34]. A high ratio typically indicates high financial leverage and significant repayment pressure, thereby increasing financial risk [35]. In the context of digital transformation, high debt may constrain digital investment due to the substantial upfront capital required [35]; however, if digital transformation can effectively improve a company’s efficiency and profitability, it may also improve the debt structure over the long term.
OPM: The OPM measures a company’s core business profitability and is a key indicator of operational health, which significantly affects financial risk and investment decisions [23,34]. A higher margin indicates strong profitability, providing more internal funds for digital transformation and reducing reliance on external financing [3]. At the same time, firms with strong profitability are better equipped to withstand financial risks arising from market fluctuations.
ATO: The ATO reflects the operational efficiency of a company’s assets and is a key indicator of management efficiency, and changes in it are closely related to financial risk [23,34]. A high ratio indicates efficient asset utilization, meaning the firm generates more revenue with fewer assets [3]. This efficiency helps reduce operational risks, thereby lowering the likelihood of financial distress.
CFR: The CFR reflects a firm’s ability to generate cash from operations and is considered a more reliable indicator of financial health than profit metrics, as profits can be manipulated, whereas cash flow more accurately captures debt-repayment capacity and operational quality [23,34]. Healthy operating cash flow underpins continued operations and risk resilience, providing a stable funding source for digital transformation [3]. Firms with ample cash flow possess greater financial flexibility, enabling them to better cope with uncertainty and reduce financial distress risk [3].
Top1: The Top1 reflects equity concentration, a core element of corporate governance that profoundly affects strategic decision-making and risk management [23,34]. Moderate concentration helps establish stable control, enhances decision-making efficiency, and thereby facilitates the implementation of digital transformation strategies [35]. However, excessive concentration may lead to a “dominant shareholder” problem, eroding minority shareholder interests, or even resulting in asset stripping, thus increasing financial risks [35].
Indep: The Indep reflects the board’s oversight independence and effectiveness. The independent director system is a crucial component of modern corporate governance, and its role in improving decision-making quality and risk prevention has drawn wide attention [23,34]. A higher proportion typically indicates stronger oversight, enabling more effective checks on management and reducing opportunistic behavior, thereby mitigating financial risks [23]. In the context of digital transformation, the expertise and independence of independent directors may facilitate more prudent evaluation and oversight of digital investments [23].
Ownership: A dummy variable coded 1 for state-owned enterprises (SOEs) and 0 otherwise. SOEs typically enjoy preferential bank credit and government bailouts, resulting in lower financing constraints; during crises, market expectations of a government “safety net” significantly reduce their default probability. However, SOEs often suffer from absentee ownership, inadequate management incentives, and policy burdens (e.g., overstaffing), which lead to operational inefficiency and loss accumulation. Thus, although SOEs face lower short-term distress risk, their long-term efficiency disadvantages may increase potential vulnerability.
HTE: A dummy variable equals 1 if a firm is officially certified as a High-Tech Enterprise, and 0 otherwise. High-tech firms are characterized by high R&D investment, long payback periods, volatile cash flows, scarce tangible collateral, and high failure rates—factors that heighten liquidity risk. Conversely, they benefit from policy dividends such as tax reductions and government subsidies, which help ease financial pressures.

3.3. Model Construction

3.3.1. Logit Model

Given that FD is a binary dependent variable, this study employs the Logit model as the baseline regression to analyze the association between DX and the probability of corporate FD, while controlling for industry and year fixed effects and other financial and corporate governance factors. The Logit model assumes a linear relationship between the latent variable and the explanatory variables, with parameters estimated using maximum likelihood. The model specification is as follows:
Model 1:
ln P ( F D i , t = 1 ) 1 P ( F D i , t = 1 ) = β 0 + β 1 D X i , t + n = 2 9 β n C o n t r o l s i , t + u i + p i + ϵ i , t
where P ( F D i , t = 1 ) denotes the probability that firm i is in financial distress in year t; D X i , t represents the degree of digital transformation of firm i in year t ; n = 2 9 β n C o n t r o l s i , t represents a linear combination of all control variables; i and t denote firm and year, respectively; u i denotes industry fixed effects; p i denotes year fixed effects; and ε i , t represents the random error term.

3.3.2. The XGBoost Model

XGBoost (eXtreme Gradient Boosting) is an efficient engineering implementation of Gradient Boosting Decision Trees (GBDT), proposed by Chen and Guestrin. It builds a strong learner by integrating multiple weak learners and, at each iteration, fits the residuals of the previous prediction while introducing regularization terms to control model complexity, which effectively prevents overfitting. Compared with Random Forests’ parallel Bagging strategy, XGBoost’s serial Boosting strategy reduces bias more effectively; and compared with LightGBM and CatBoost, it demonstrates good stability and broad community support for medium-sized structured data. XGBoost has been successfully applied in various scenarios, including corporate bankruptcy prediction, business failure prediction, and financial risk early warning for Chinese listed companies. Therefore, this paper selects XGBoost as the primary machine learning method. The mathematical principles of the XGBoost model are as follows:
y ^ i = k = 1 K f k ( x i ) , f k F
where F is the function space of decision trees. In each round t, a new tree ft is added to optimize the objective function.
The XGBoost objective function includes a loss function and a regularization term, reflecting the bias-variance trade-off. In the t-th iteration, the objective function is:
L ( t ) = i = 1 n l y i , y ^ i ( t 1 ) + f t ( x i ) + Ω ( f t )
  • l : a differentiable loss function
  • Ω ( f t ) : a regularization term that controls tree complexity
Performing a second-order Taylor expansion of the loss function:
L e t   g i = y ^ ( t 1 ) l ( y i , y ^ ( t 1 ) ) , h i = y ^ ( t 1 ) 2 l ( y i , y ^ ( t 1 ) ) , t h e n : L ( t ) i = 1 n l ( y i , y ^ ( t 1 ) ) + g i f t ( x i ) + 1 2 h i f t ( x i ) 2 + Ω ( f t )
The constant term can be neglected during optimization, so the objective function simplifies to: L ~ ( t ) = i = 1 n g i f t ( x i ) + 1 2 h i f t ( x i ) 2 + Ω ( f t )
Define a tree as: f t ( x ) = w q ( x ) , w R T , q : R d { 1 , 2 , , T }
  • T : Number of leaf nodes
  • w j : Weight (predicted value) of the j-th leaf node
  • q ( x ) : Function mapping the sample to a leaf
The regularization term is defined as: Ω ( f ) = γ T + 1 2 λ j = 1 T w j 2
  • γ : Penalty coefficient for the number of leaf nodes (controls tree complexity, prevents excessive depth)
  • λ : L2 regularization coefficient (smooths leaf weights)
Group samples by leaf nodes: Let I j = { i | q ( x i ) = j } denote the set of samples falling on the jth leaf. Then the objective function is rewritten as:
L ~ ( t ) = j = 1 T i I j g i w j + 1 2 i I j h i + λ w j 2 + γ T
Define: G j = i I j g i , H j = i I j h i , Then: L ^ t = j = 1 T G j w j + 1 2 ( H j + λ ) w j 2 + γ T
For each leaf node, this is a quadratic function of w j that minimizes at w j * = G j H j + λ . Substituting the optimal w j * yields the minimum loss under the tree structure: L ^ * ( t ) = 1 2 j = 1 T G j 2 H j + λ + γ T
This value serves as the basis for evaluating the quality of tree splits.
When constructing the tree, a greedy algorithm is used to find the optimal split point. For a node, splitting it into left and right subnodes yields the following gain:
G a i n = 1 2 G L 2 H L + λ + G R 2 H R + λ ( G L + G R ) 2 H L + H R + λ γ
The optimal split point is selected by maximizing this gain, thereby constructing the optimal decision tree.

3.3.3. The SHAP Explanation Framework

SHAP (SHapley Additive exPlanations) is a model interpretation framework based on Shapley values from cooperative game theory [36]. Its core idea is to decompose the model’s prediction into the sum of marginal contributions from each feature variable, thereby quantifying the impact strength and direction of each feature on the prediction result of a specific sample. The calculation of SHAP values follows specific principles: for each sample, it considers all possible feature combinations, calculates the marginal change in prediction when a feature is added to different combinations, and finally computes the weighted average of all these marginal contributions. For tree models, the Tree SHAP algorithm can be used, which utilizes tree structure information and has a computational complexity of O(TLD2), where T is the number of trees, L is the number of leaf nodes, and D is the tree depth—significantly superior to the exponential complexity of Kernel SHAP. The mathematical expression for this method is:
y i = y b a s e + f x i 1 + f x i 2 + + f x i n
In this equation, y i represents the model’s predicted value for the i-th sample, y b a s e represents the baseline prediction (typically the mean of the training set predictions), and f x i k represents the SHAP value for the k -th feature of the i -th sample, i.e., the marginal contribution of that feature to the prediction.

4. Analysis of Results

4.1. Descriptive Statistics

The descriptive statistics are presented in Table 3. The mean value of DX was 1.5194, indicating that the overall level of digital transformation among Chinese listed companies during the sample period was moderate, with considerable room for improvement. The relatively large standard deviation indicates marked heterogeneity across firms in their transformation pace and disclosure intensity, which provides a practical basis for examining the impact of these factors on FD.
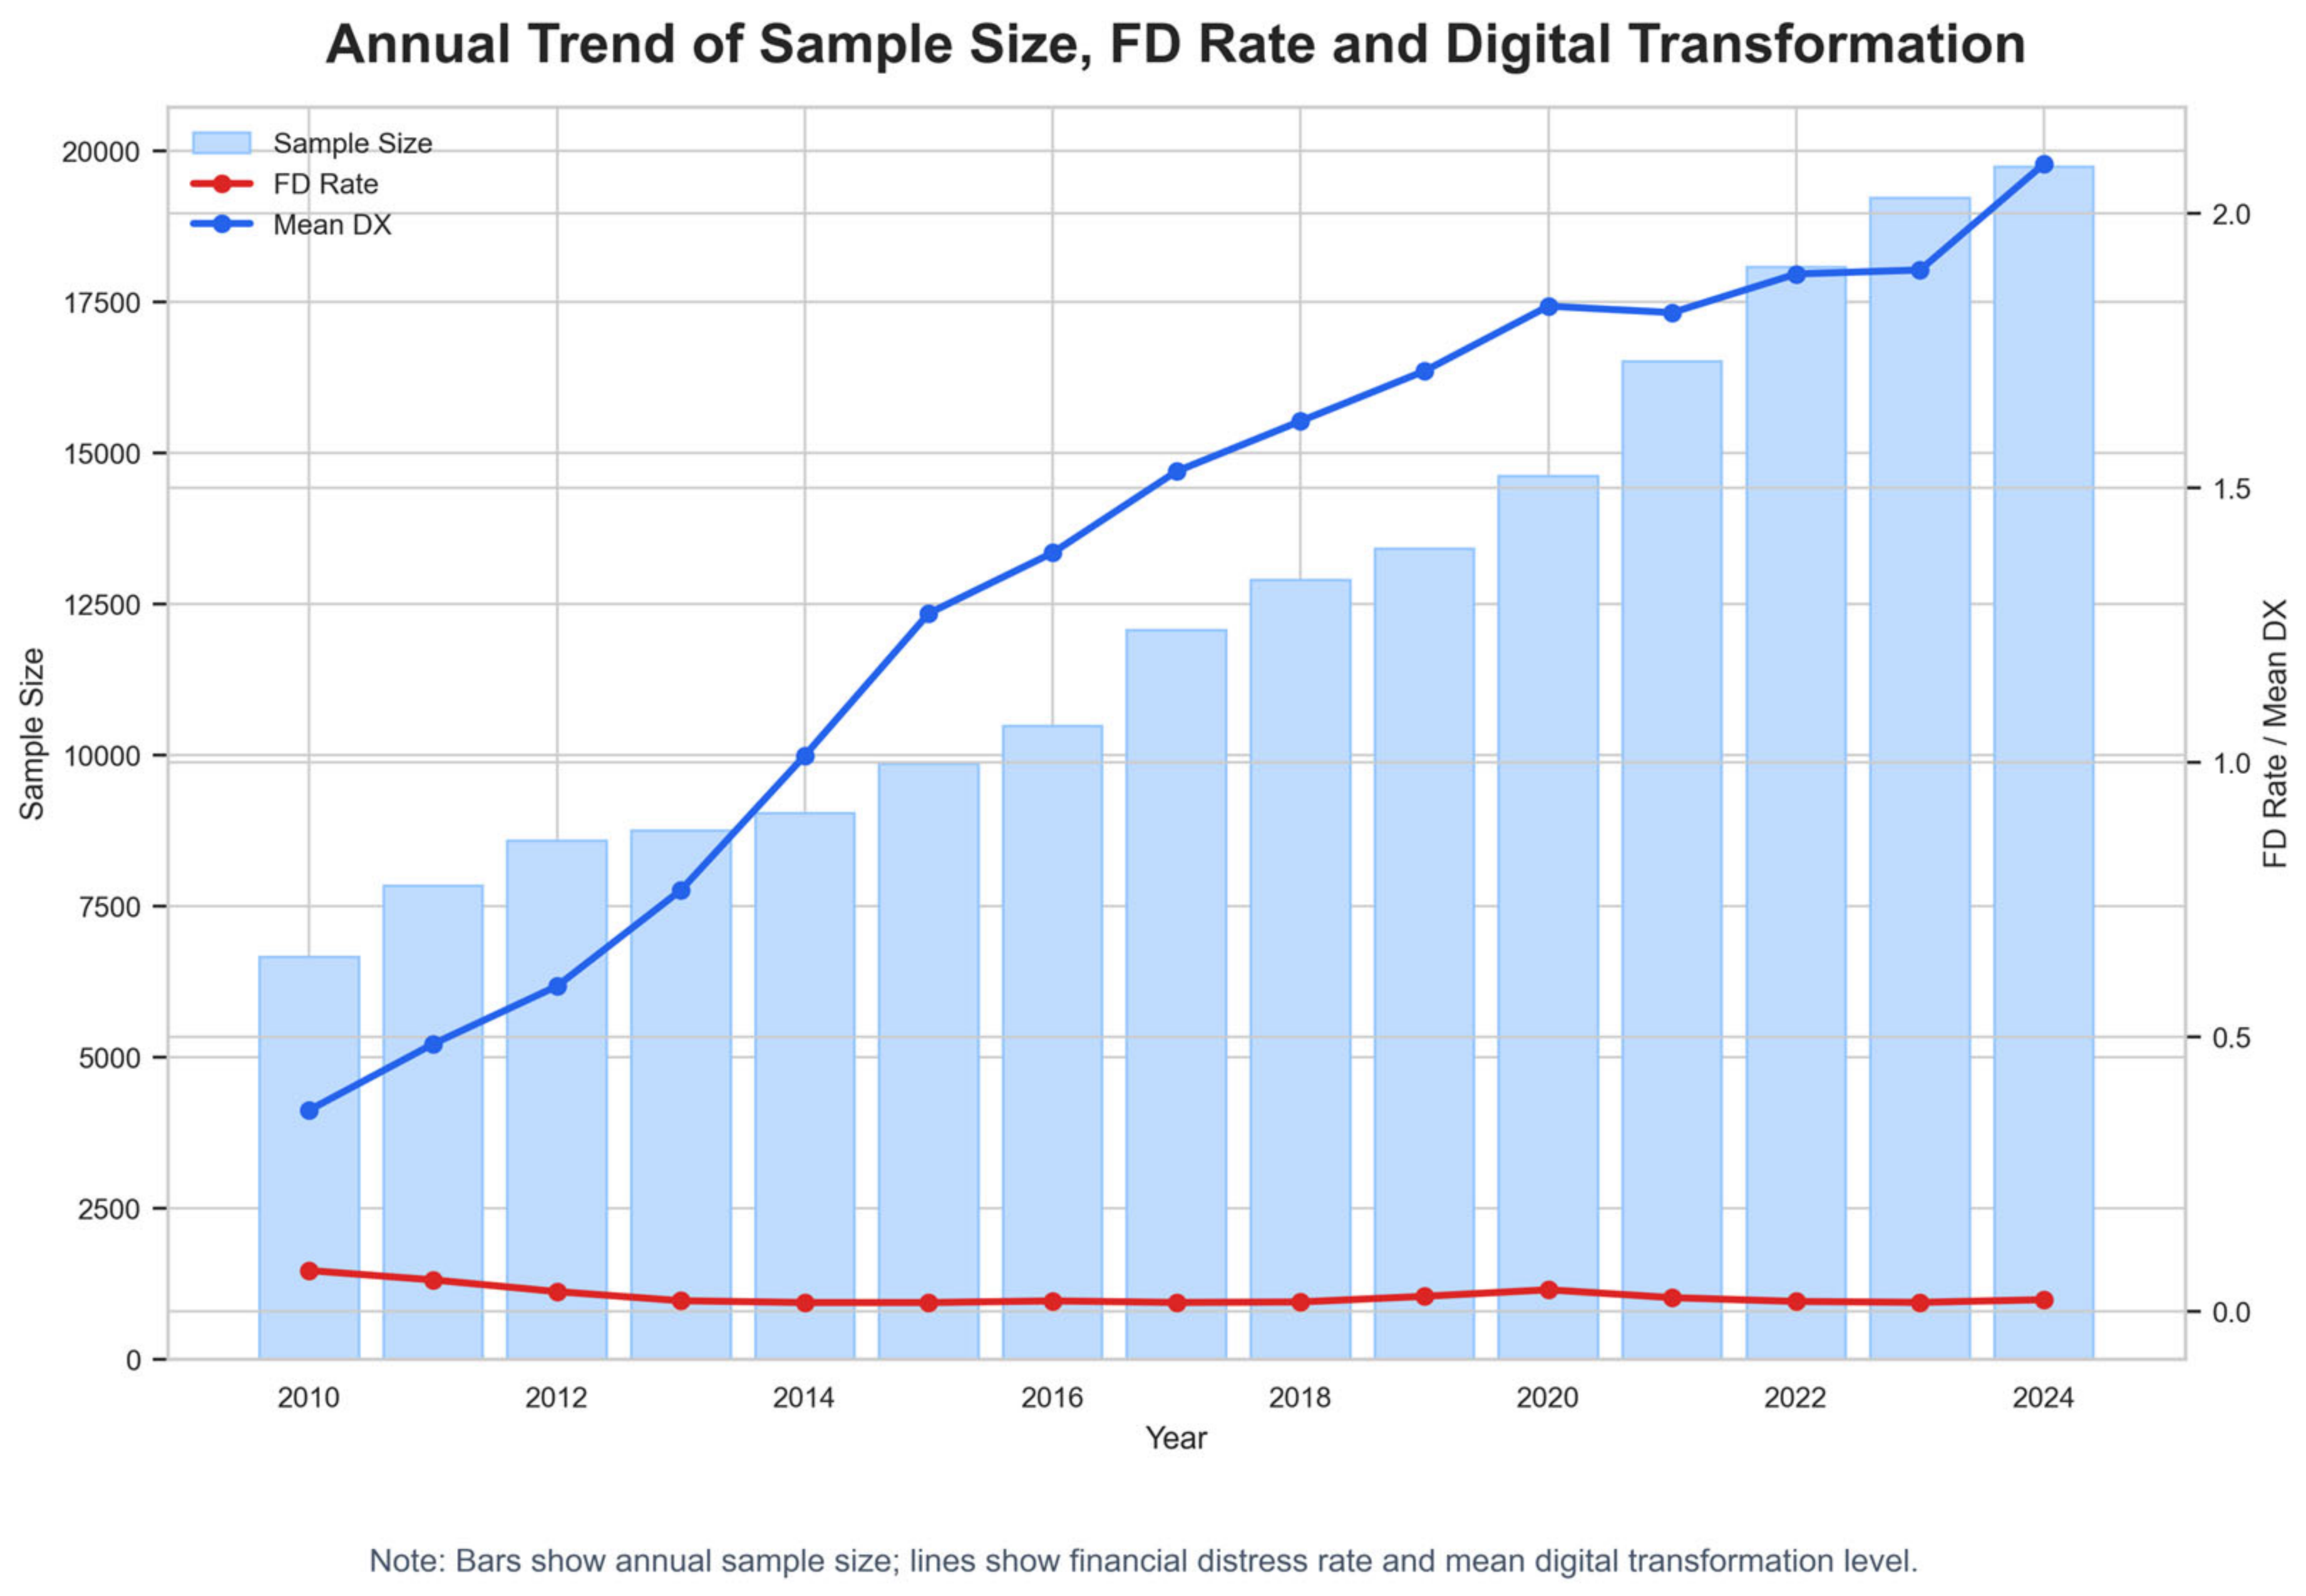
To further explore the temporal characteristics of the core variables, Figure 2 displays the time-series trends of three key indicators—annual sample size, proportion of financially distressed firms, and digital transformation—across the full sample from 2010 to 2024. Overall, corporate digitalization exhibits distinct temporal evolution characteristics, which necessitates strict control for year fixed effects and the use of time-series segmentation in subsequent modeling. This approach helps mitigate information confounding and estimation biases that may arise from simple random grouping, thereby enhancing the reliability of the empirical results.

4.2. Baseline Regression Analysis

Table 4 reports the baseline regression results. The results show that the coefficient of DX is significantly negative, indicating that a higher degree of DX reduces the probability of FD, consistent with our theoretical expectations. As control variables and identification conditions were progressively added and tightened, the coefficient remained robust in direction and significance, with no sign reversal or loss of significance, providing preliminary support for the reliability of our core findings.

4.3. Robustness Tests

To ensure the accuracy of the findings, robustness tests were conducted using methods such as excluding outlier years and reducing the sample size. The results are shown in Table 5.
Given the pandemic’s unique impact on business operations, we excluded the 2020 sample from the regression analysis, effectively reducing interference from extreme events and ensuring the reliability of our conclusions. The coefficient of DX remains significantly negative at the 1% level (−0.2148), indicating that the mitigating effect of DX on FD persists even after excluding the exceptional year.
To further validate the robustness of our findings, we randomly selected 80% of the sample, mitigating estimation biases arising from specific sample structures and outliers. The subsample regression yields a coefficient of −0.1825 for DX, also significant at the 1% level, with its direction and significance closely matching those of the main regression, further confirming the stability and credibility of our core conclusions.

4.4. Machine Learning Analysis and Visualization of Results (XGBoost & SHAP)

This section is organized into two parts: predictive performance evaluation and feature contribution analysis. For model training, we adopt a temporal split strategy: data from 2010 to 2020 serve as the training set (including a validation set) and data from 2021 to 2024 as the test set, simulating out-of-sample prediction in real-world settings. Five-fold cross-validation is performed within the training set for hyperparameter selection.
The hyperparameters of the XGBoost model are determined via Bayesian optimization using the Optuna framework. The optimized search space includes learning rate (eta: 0.01–0.3), maximum tree depth (max_depth: 3–10), subsample ratio (subsample: 0.6–1.0), column subsample ratio (colsample_bytree: 0.6–1.0), minimum child weight (min_child_weight: 1–10), and L1/L2 regularization parameters (alpha/lambda: 0–10).
Since distressed firms account for only about 5–8% of the sample, we apply SMOTE (Synthetic Minority Oversampling Technique) to oversample the minority class in the training set. Furthermore, we use PR_AUC, rather than accuracy, as the primary metric for model selection.

4.4.1. Model Performance and Metrics Evaluation

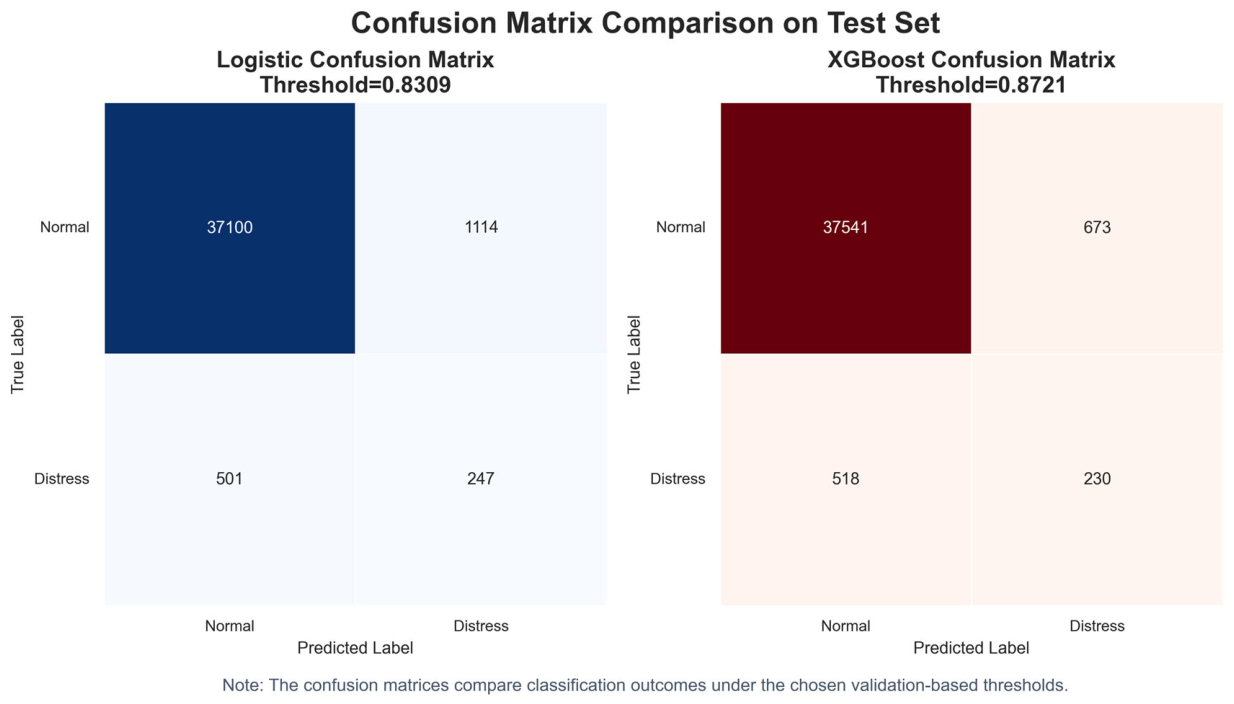
The traditional Logit and XGBoost models were run and their performance in identifying FD was compared on a time-segmented test set, as shown in Figure 3.
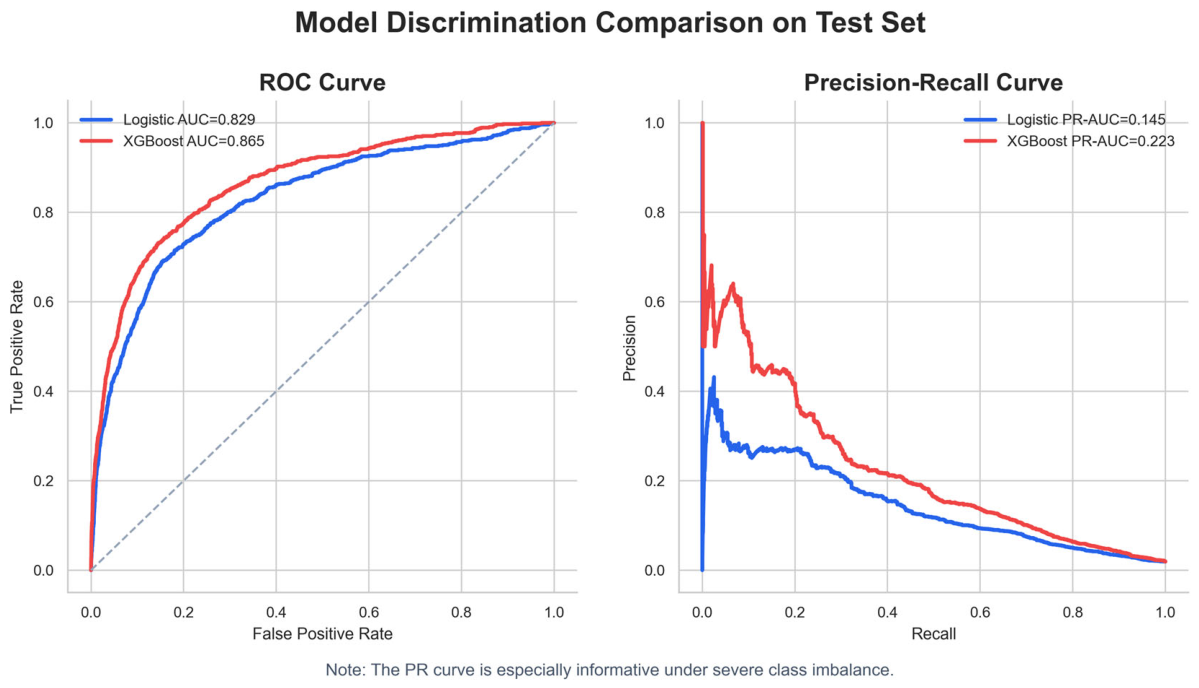
Using a confusion matrix, this study derived multiple evaluation metrics (accuracy, precision, recall, F1 score, and AUC) to evaluate and compare the two models’ predictive performance, with results presented in Table 6. Additionally, the discriminatory capabilities of the two models were compared, as shown in Figure 4.
A comparison of the core evaluation metrics on the test set reveals that XGBoost outperforms Logit across most key indicators (Table 6), demonstrating superior predictive performance. Detailed analysis is as follows.
Regarding AUC, which measures overall discriminatory power, XGBoost achieves 0.8653, higher than Logit’s 0.8288, with A DeLong test confirming statistical significance (p < 0.01), indicating a systematic improvement in distinguishing distressed firms. For PR_AUC, which focuses more on the positive class (financial distress), XGBoost scores 0.2233 versus 0.1447 for Logit, suggesting stronger ranking ability for the minority class under class imbalance. In terms of Precision, XGBoost significantly outperforms Logit, implying a lower false positive rate. That is, a higher proportion of predicted-distressed firms as actually distressed. Regarding Recall, Logit (0.3302) is slightly higher than XGBoost (0.3075), but both identify about 70% of actual distressed firms. For F1 score, the harmonic mean of Precision and Recall, XGBoost (0.2786) surpasses Logit (0.2342), indicating better overall classification quality after balancing false positives and negatives.
Overall, XGBoost excels in AUC, PR_AUC, Precision, and F1, making it particularly suitable for applications with strict false-positive control (e.g., bank credit approval). Conversely, Logit’s slightly higher Recall may be preferred when missed-detection costs are critical. In a multi-model comparison including Random Forest, LightGBM, and CatBoost, XGBoost achieves the best performance in both AUC and PR_AUC, validating its selection as the primary prediction method in this study.

4.4.2. Threshold Optimization and the Precision–Recall Trade-Off

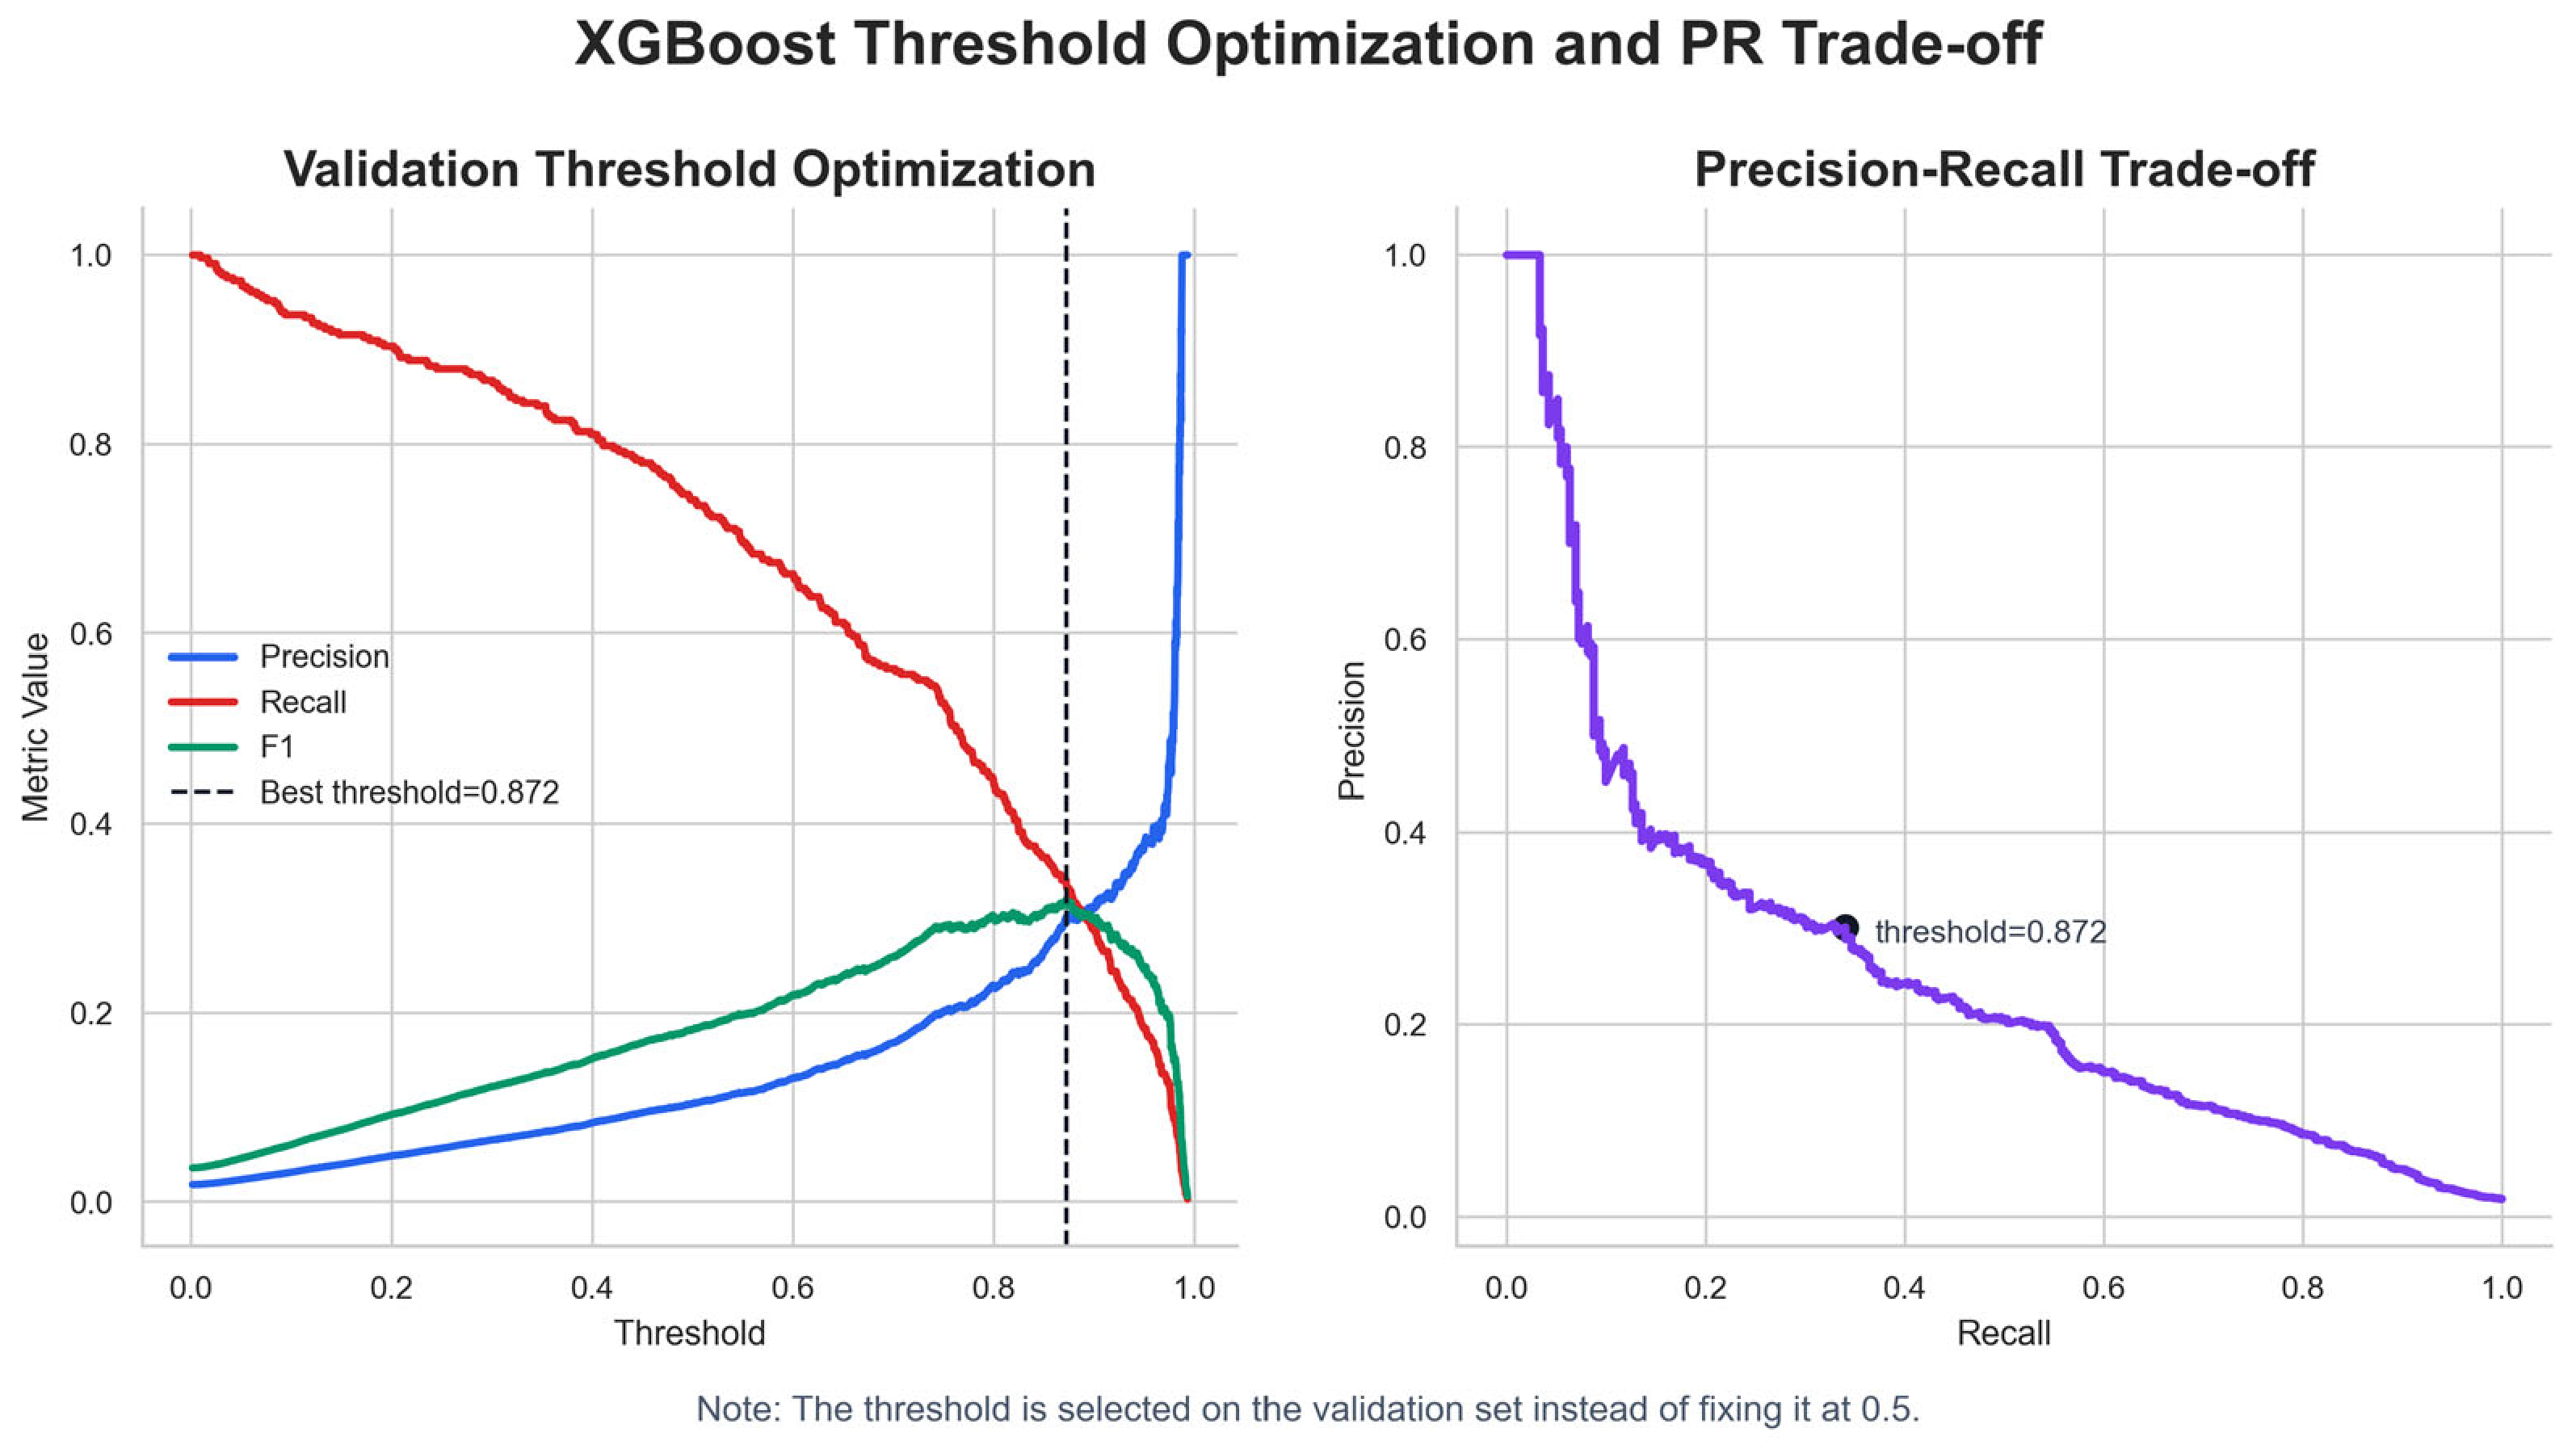
To meet the high recall requirements in financial risk early-warning scenarios, this study optimizes the classification threshold of the XGBoost model via grid search. As shown in Figure 5, the model achieves an optimal balance between recall and precision when the threshold is raised from the default 0.5 to 0.872. At this threshold, the recall rate is further improved, effectively reducing the risk of missing distressed firms. It should be noted that threshold selection depends on the preferences of the specific application scenario. If decision-makers prioritize reducing the false positive rate, a lower threshold should be chosen; conversely, if reducing the missed detection rate is more critical, a higher threshold is preferred.

4.4.3. SHAP Explanatory Analysis

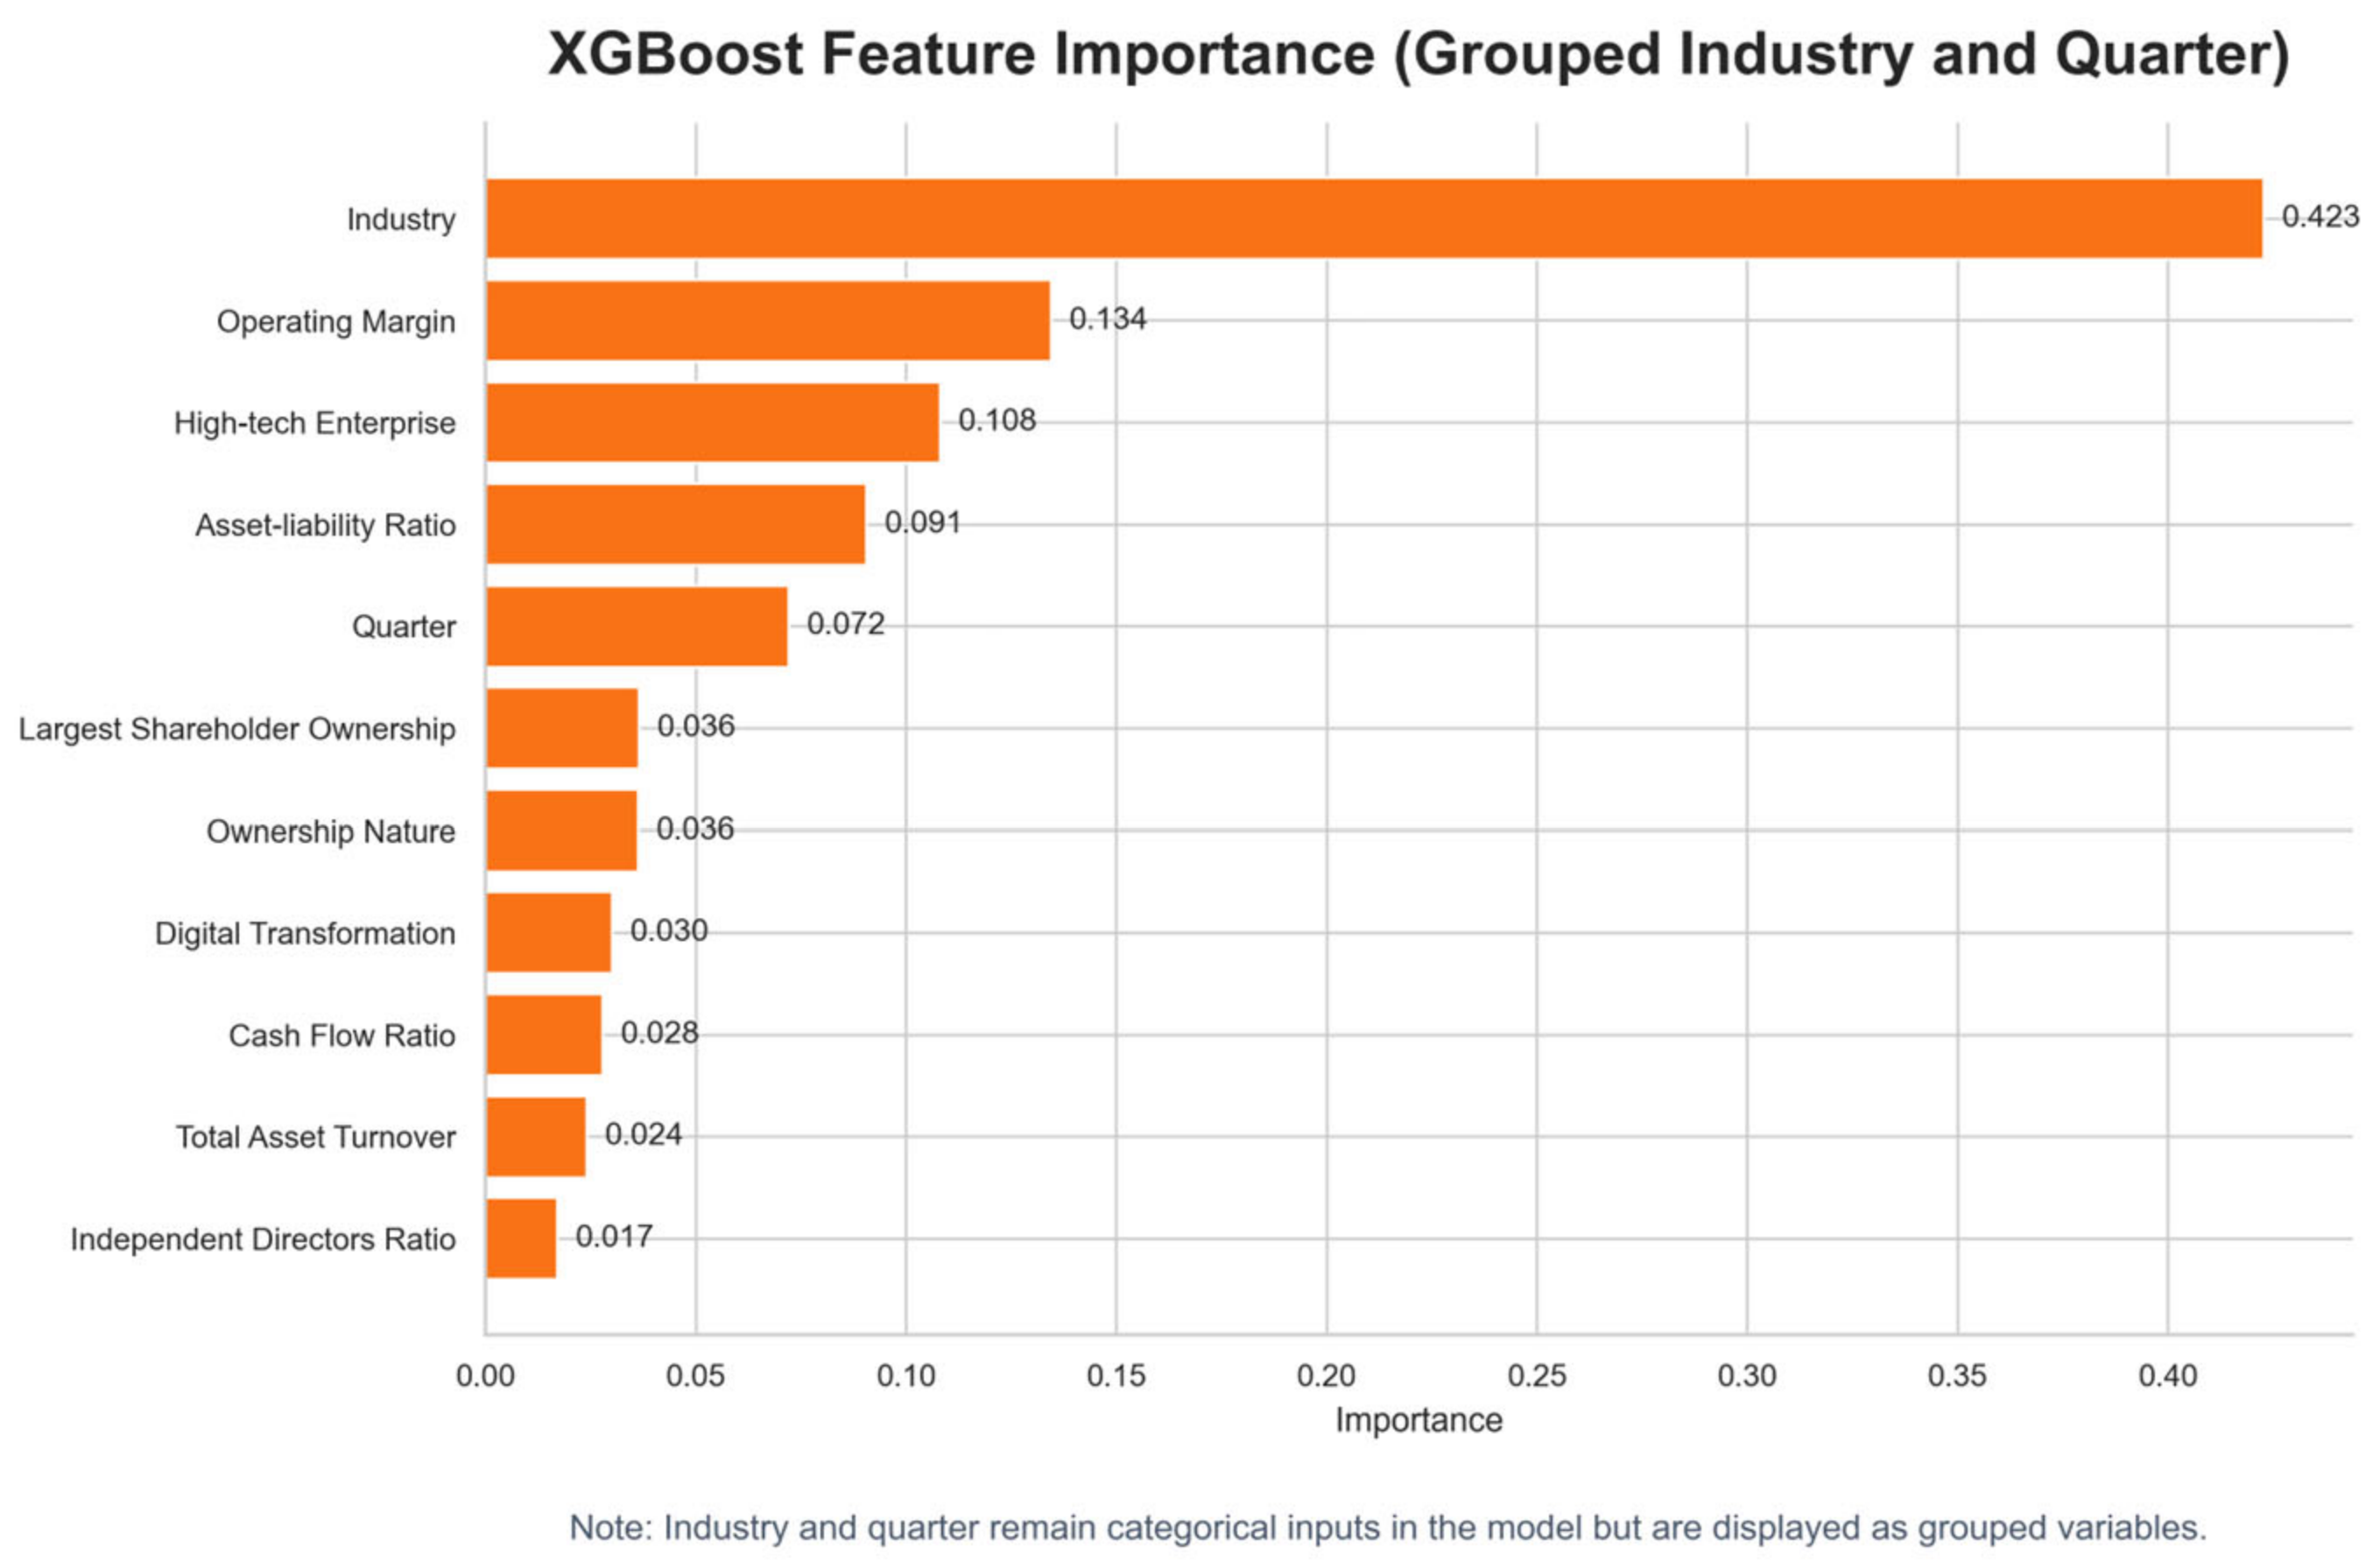
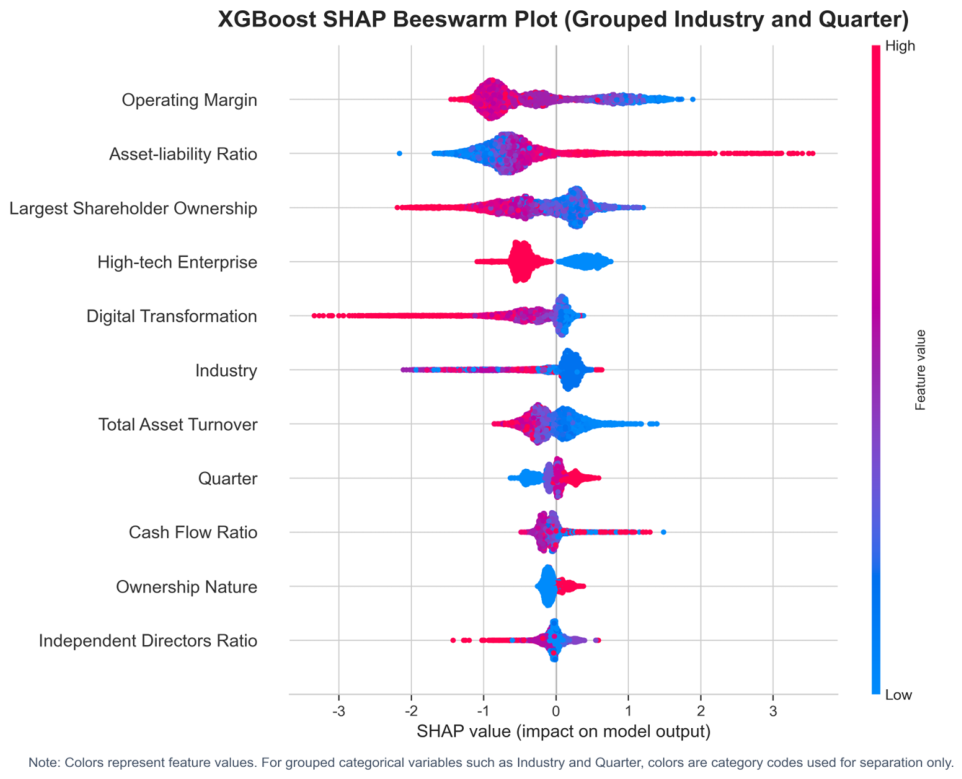
At the model interpretation level, we employ the SHAP method to analyze feature importance, marginal impact directions, interaction effects, and prediction paths of typical samples. To avoid cluttering the main text with numerous industry subcategories, we merge industry and quarter into a single categorical feature for visualization, with results shown in Figure 6. Additional SHAP-based interpretability results are presented in Figure 7. It is crucial to emphasize that the SHAP analysis reveals the direction and strength of each feature’s contribution to model predictions, a feature importance assessment at the predictive level, rather than a test of economic causal mechanisms. SHAP values reflect how a feature affects the model’s predictive output, not how it causally alters FD risk in the real world.
Based on the feature importance and SHAP value analysis of the XGBoost model, this study explores the contribution patterns of various feature variables to FD predictions. After controlling for industry and quarter, the most significant predictors mainly relate to endogenous operational quality and micro-governance structures. OPM ranks first in feature importance. SHAP analysis indicates that a high OPM tends to reduce the predicted probability of FD, which aligns with the empirical understanding that firms with strong profitability typically have more robust financial conditions.
The LEV serves as a primary risk predictor, with a high LEV increasing the predicted probability of FD, which is consistent with the financial principle that high leverage heightens financial vulnerability.
The Top1 and DX also demonstrate stable predictive contributions. A higher Top1 tends to reduce the predicted distress probability, supporting the corporate governance logic of the large shareholder “interest alignment effect.” Similarly, DX contributes negatively to the predicted probability, indicating that, ceteris paribus, firms with higher digitalization levels face a relatively lower predicted risk of FD.
In summary, the XGBoost-SHAP analysis reveals the contribution patterns of feature variables in predicting FD. OPM and LEV emerge as the most critical protective and risk features, respectively, while Top1 and DX provide additional predictive information. These contribution patterns reflect statistical associations learned by the training data and offer a predictive-level reference framework for understanding the multifaceted drivers of FD.

4.4.4. SHAP Dependencies and Interaction Effects

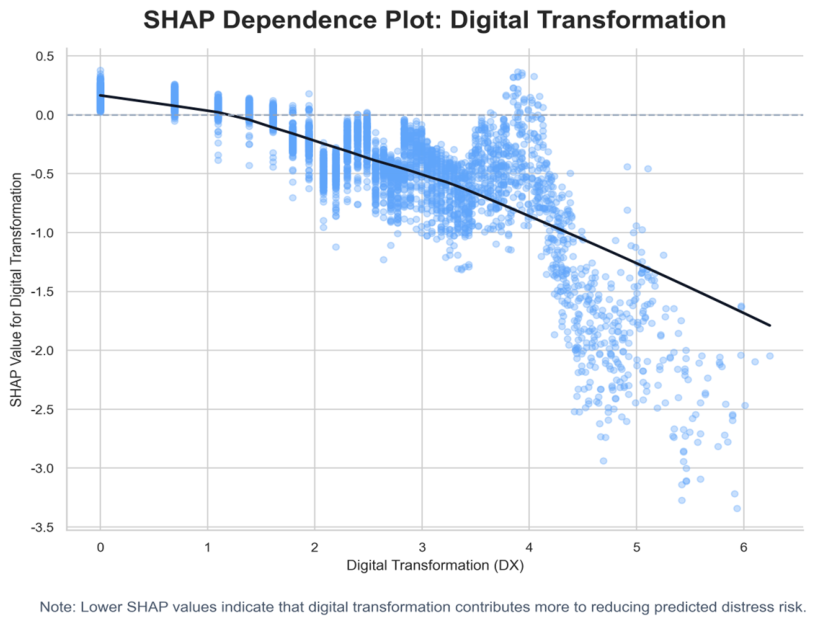
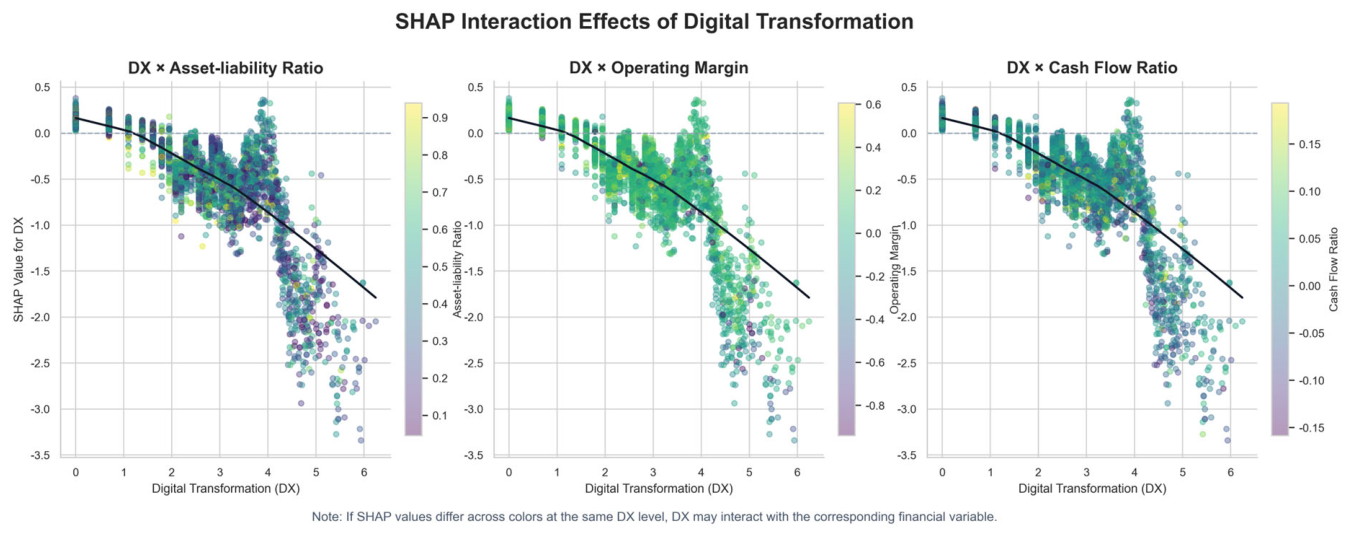
To further examine the contribution pattern of DX to FD prediction, Figure 8 presents the SHAP dependence plot for DX, which reveals a non-linear relationship between DX and the predicted risk of FD.
In the low-level range of DX, SHAP values exhibit high volatility and unclear directions, indicating that low levels of digitalization contribute unstably to distress prediction. As the degree of digitalization increases, SHAP values generally show a downward trend, suggesting that higher digitalization levels correspond to a lower predicted risk. In the medium-to-high range, the downward trend of SHAP values tends to flatten.
This non-linear pattern indicates that the marginal contribution of DX to distress prediction varies across stages, echoing the “threshold effect” hypothesis derived in the theoretical section. However, it should be noted that this reflects the association pattern learned by the model, rather than a strict causal threshold effect.
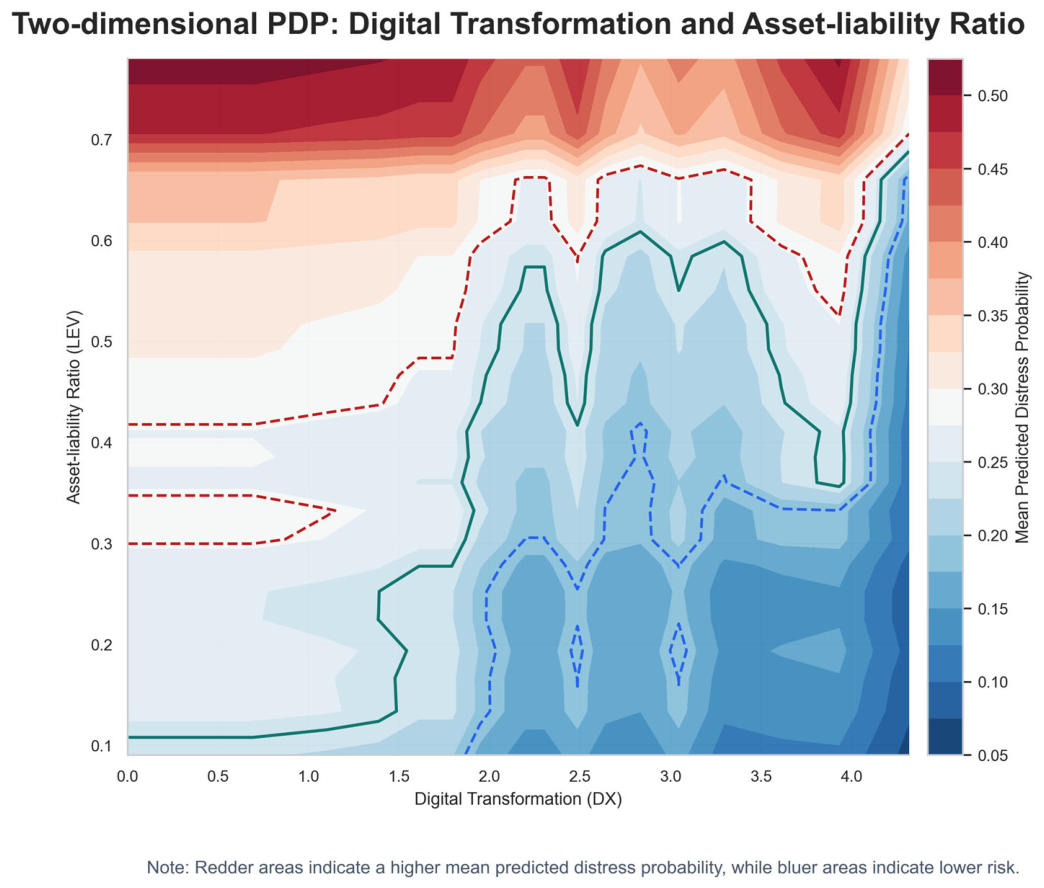
The univariate Partial Dependence Plot (PDP) in Figure 9 further illustrates the interaction pattern between DX and the LEV, indicating that for firms with a higher degree of DX, the LEV has a relatively weaker effect on increasing the predicted probability of FD. This implies a substitutive interaction at the predictive level, where digitalization serves as an important moderating feature in the model’s risk evaluation. This finding provides predictive-level insights for corporate risk management, suggesting that DX can be viewed as a potential hedge against high leverage risk. However, it is important to note that this interaction is statistical, not causal.
This study further utilizes SHAP interaction plots (Figure 10) to examine the non-linear interaction mechanisms between DX and the LEV, OPM, and CFR in predicting FD. The results indicate that DX does not operate in isolation but generates significant synergies with a firm’s capital structure, profitability, and cash flow, jointly shaping its financial risk profile. DX plays a critical moderating role in predicting FD. It not only directly reduces risk but also interacts deeply with core financial indicators by optimizing capital structure tolerance, amplifying profitability advantages, and strengthening cash flow management, thereby building a multidimensional defense system against FD.

4.4.5. SHAP Explanation Diagram—Typical Case Analysis

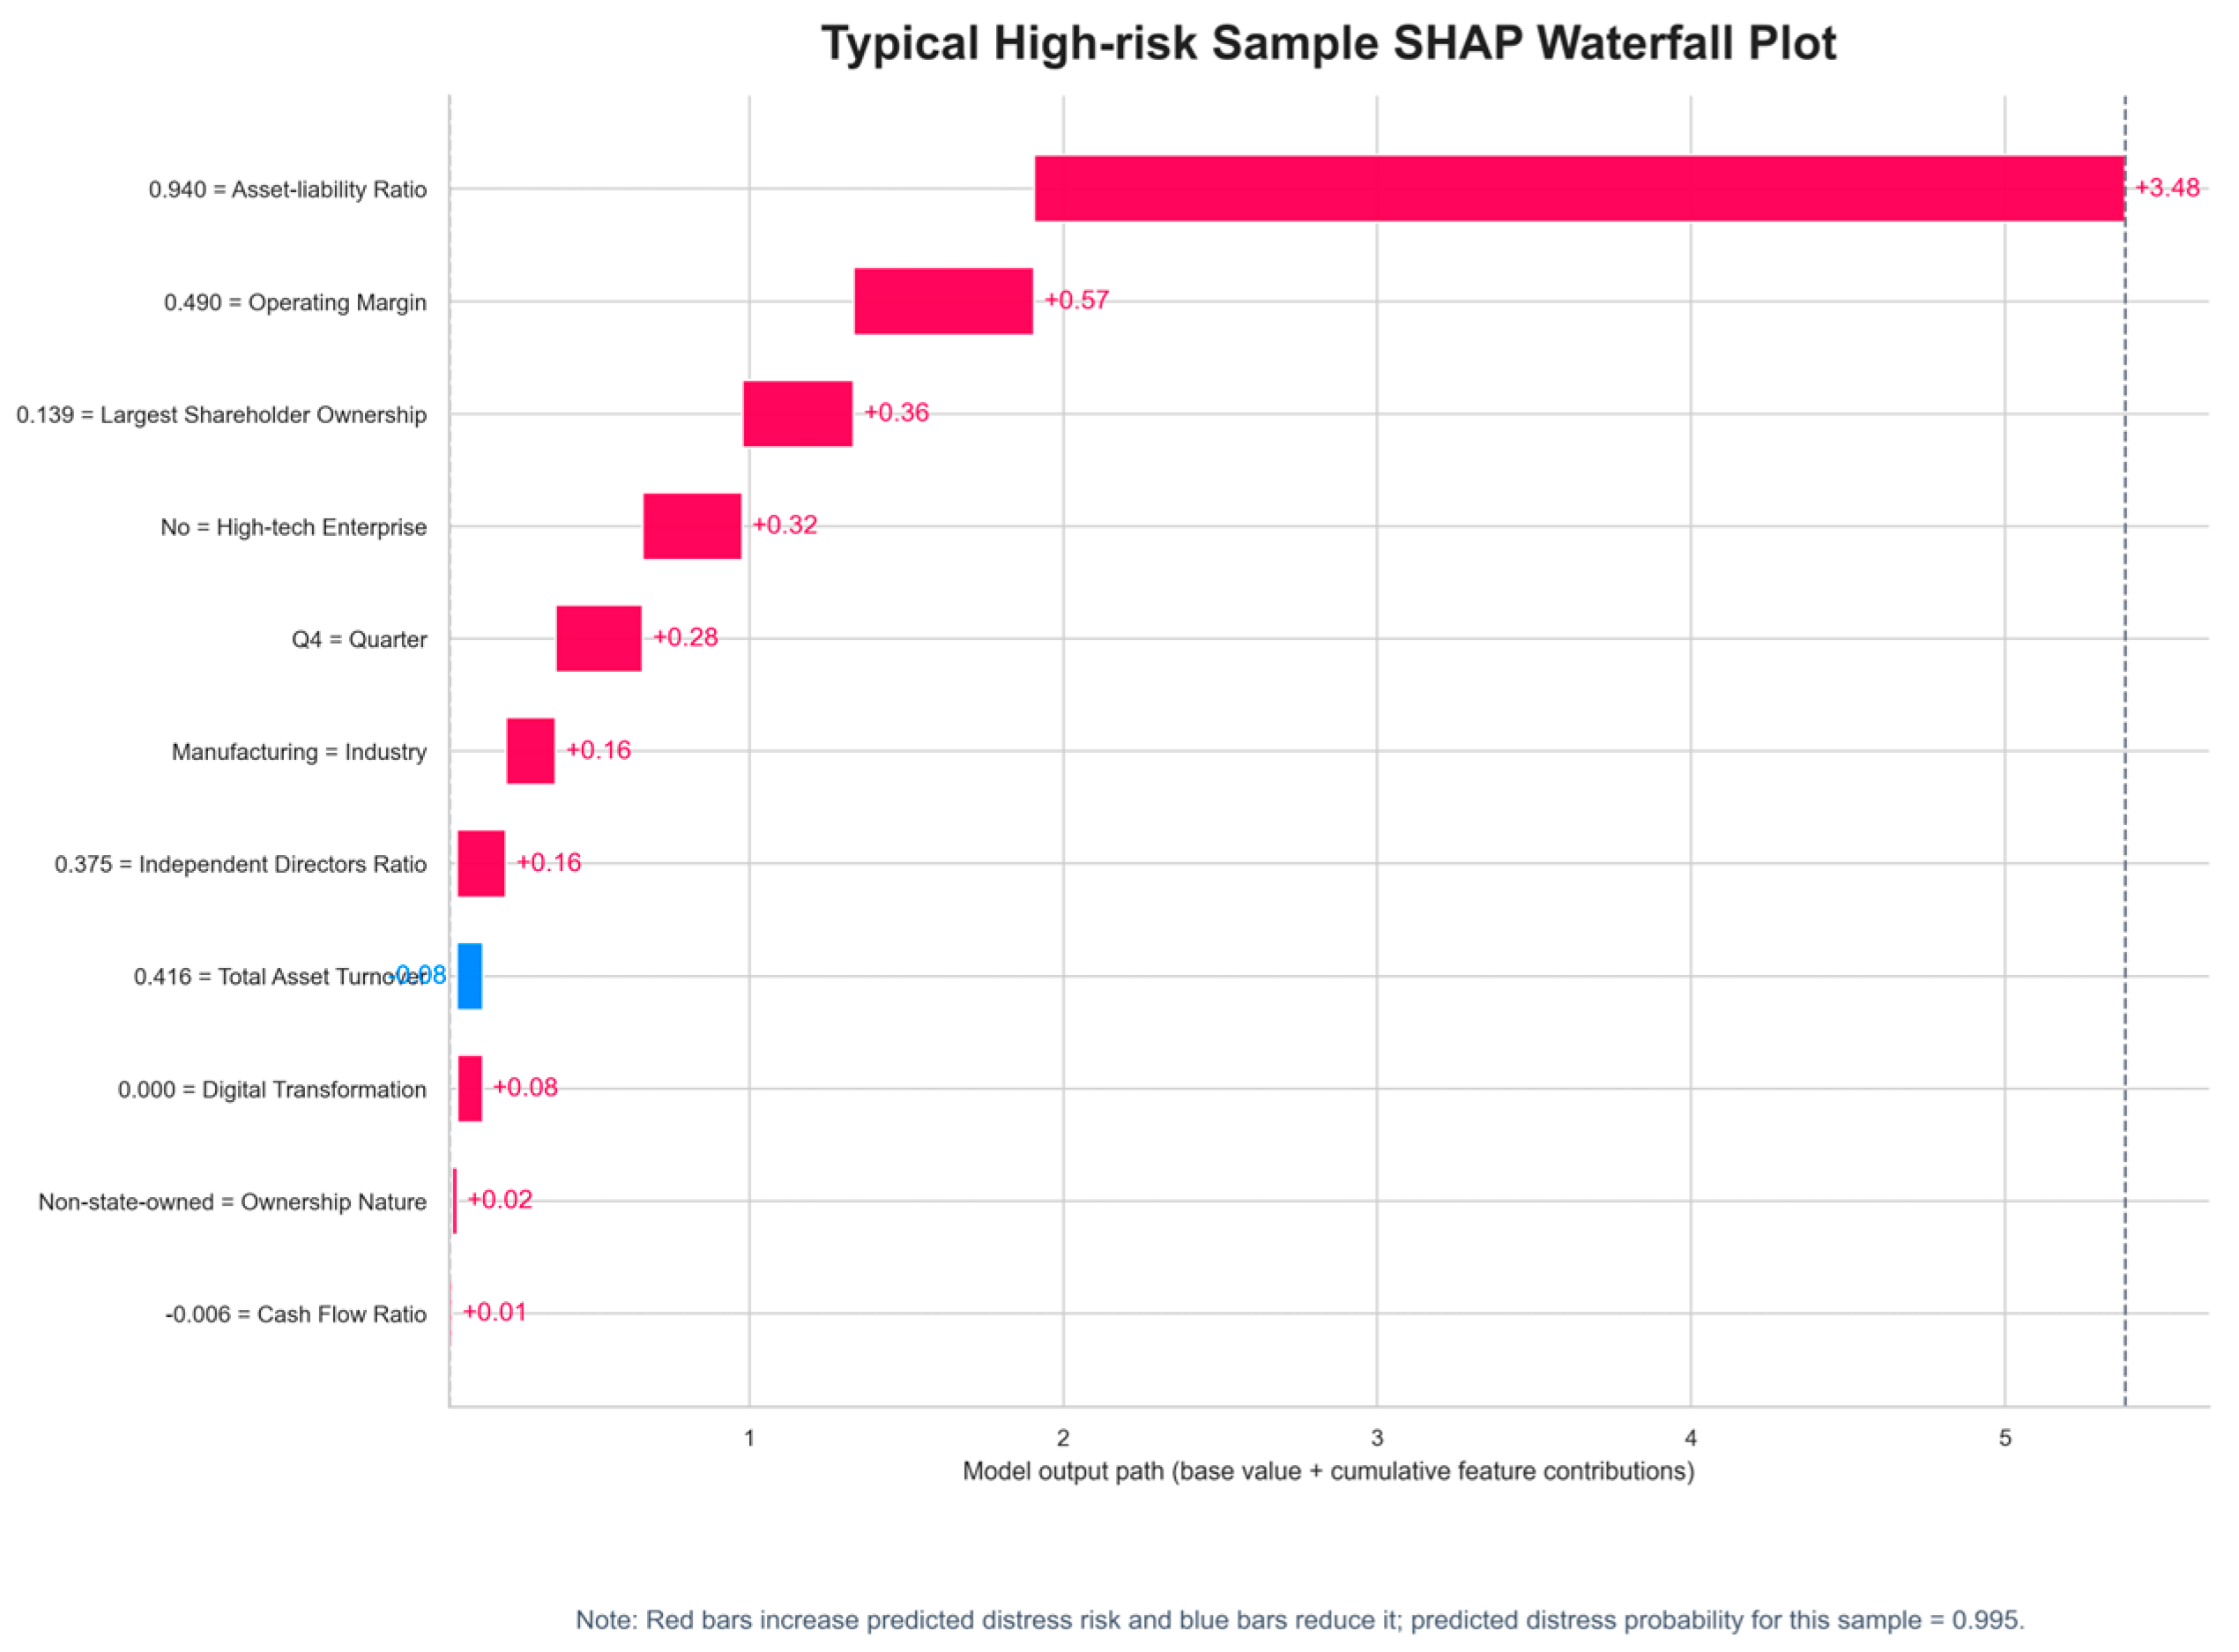
This study analyzed the SHAP waterfall diagram (Figure 11) for a typical high-risk sample to reveal the characteristic attribution mechanisms underlying FD. The final predicted score for this sample was f(x) = 5.383, corresponding to an FD probability of 0.995. The marginal contributions of feature variables exhibit significant heterogeneity.
The LEV is the primary driver of the risk surge, with a SHAP value as high as +3.48, accounting for the vast majority of the risk increment. This indicates that, despite some profitability, the firm’s earning power remains insufficient relative to its extremely high debt burden, failing to effectively cover debt costs. Operational efficiency and industry dividends attempt to hedge risk to some extent, but their impact falls far short of offsetting the massive shock from high leverage. Meanwhile, firms without a digital strategy lack effective buffer mechanisms when facing high leverage, leaving their risk exposure fully exposed.
In summary, the defining characteristics of this high-risk sample are high leverage, insufficient profit coverage, and a lack of digital buffers. The combined effects of these risk factors ultimately led the model to classify it as extremely high-risk.

5. Discussion

This study systematically compares the performance of the XGBoost model and the traditional Logit model in predicting FD among Chinese A-share listed companies, and utilizes the SHAP method for feature contribution analysis, yielding several meaningful findings. This section discusses the results from four dimensions: dialogue with existing literature, theoretical contributions, practical implications within the Chinese context and external validity, and research limitations with future directions.

5.1. Comparison with Existing Literature

The findings of this study present multiple points of comparison with existing literature. First, regarding the relationship between DX and FD, the Logit regression results indicate a significant negative correlation, aligning with the findings of Cui and Wang based on Chinese listed companies and further enriching the empirical evidence for the “risk mitigation” effect of digitalization [3].
Unlike previous literature, this study uses SHAP analysis to reveal a non-linear association pattern between DX and the predicted risk of FD, where the marginal contribution of digitalization is unstable at low levels but tends to stabilize after crossing a certain threshold. This finding echoes the study by Sun et al., which highlights a non-linear relationship between the speed of DX and corporate distress risk [4]. However, this study offers a different analytical approach to this non-linear characteristic from the perspective of predictive modeling.
In terms of predictive methodology, XGBoost outperforms traditional statistical models in predicting corporate failure, consistent with the findings of Ben Jabeur et al. and Carmona et al. [9,10]. This study extends the aforementioned research in three ways. First, the scope of comparison is expanded from a single Logit baseline to an XGBoost ensemble learning model. Second, it validates the applicability of XGBoost based on the sample characteristics of the Chinese A-share market. Third, a DeLong test is employed to confirm the statistical significance of the AUC difference, providing a more rigorous statistical basis for the model comparison conclusions.

5.2. Theoretical Contributions

The theoretical contributions of this paper are primarily reflected in the following aspects.
First, it expands the theoretical analysis framework regarding the relationship between DX and FD. This study integrates the RBV, IAT, AT, TCT, and OLT into a unified framework, and proposes a “non-linear threshold” theoretical hypothesis for how DX affects FD. Existing literature mainly focuses on the linear association between the two [3,37]. In contrast, this study provides theoretical logic for understanding their non-linear relationship from the perspectives of network effects, learning curves, and dynamic capabilities. The non-linear association pattern revealed by SHAP analysis at the predictive level provides preliminary empirical reference for this theoretical hypothesis.
Second, it enriches the variable system in FD prediction research. Existing studies mostly concentrate on traditional financial ratios and corporate governance indicators [6,23]. Building upon the variable framework suggested by Yousaf et al., this study systematically introduces DX features into the prediction model [21]. The findings show that DX has a stable marginal contribution in the predictive model, particularly by providing additional predictive information through interactions with other financial variables. This offers empirical evidence for expanding the early-warning indicator system for FD.
Third, it demonstrates the methodological value of explainable machine learning in financial research. Through SHAP interpretability analysis, this paper mitigates the “black box” problem of ensemble learning models to a certain extent, providing a feasible analytical paradigm for future research to enhance interpretability while maintaining predictive accuracy. The feature contribution patterns revealed by SHAP analysis offer a foundation for hypothesis generation in subsequent, more in-depth causal identification studies, notably the predictive interaction relationship between DX and the LEV.

5.3. Practical Implications Within the Chinese Context and External Validity

At the practical level, the findings of this study offer several implications. First, for corporate managers, the marginal contribution of DX to the predicted risk of FD is non-linear, implying that digital investment decisions must consider a critical mass. Fragmented and superficial digitalization attempts may be insufficient to produce significant risk mitigation effects; therefore, enterprises need to formulate systematic digital strategies to ensure that the transformation reaches a level capable of generating network and synergy effects.
Second, for investors and creditors, the XGBoost-SHAP early-warning model can serve as a supplementary risk assessment tool. The generated SHAP values can decompose the risk structure of specific firms, facilitating more targeted due diligence and post-loan monitoring.
Third, for regulatory authorities, the early-warning framework constructed in this study provides a methodological reference for improving the capital market’s risk monitoring system. By dynamically updating training data and periodically retraining the model, it is expected to enhance the early identification capability for systemic risks.
It is crucial to note that the findings of this study are deeply embedded in China’s institutional and market environment. First, the ST/*ST special treatment system in the Chinese A-share market provides a relatively standardized benchmark for identifying FD—an institutional arrangement without a perfect counterpart in developed markets. Therefore, the definition and measurement of FD require careful adjustment in cross-country comparisons. Second, the DX of Chinese enterprises is strongly driven by government policies, from “Made in China 2025” to the “15th Five-Year Plan” for the digital economy. Policy guidance plays a vital role in corporate digitalization decisions, differing from the market-exclusive models in developed economies. Third, the financial structure of the Chinese capital market is dominated by indirect financing (bank credit), which may amplify the effect of DX in alleviating financing constraints through the information asymmetry channel. These institutional characteristics suggest that caution is required when directly generalizing the findings of this study to other institutional environments.

5.4. Research Limitations and Future Directions

This study inevitably has certain limitations owing to various factors, and these remain to be addressed in future research.
First, although the measurement of DX follows current mainstream practices, there remains room for improvement. This study constructs the DX indicator based on keyword frequency in annual reports. Although manual spot checks and text length standardization have been applied, text analysis methods may still be affected by selective disclosure and impression management strategies, and may not fully reflect the true depth of digital application within firms. Future research could employ multi-dimensional objective indicators for cross-validation, such as the number of digital patents, IT investment intensity, and the proportion of intangible assets related to software and information technology, to enhance the accuracy and robustness of the measurement.
Second, endogeneity remains a concern. Neither the Logit regression nor the XGBoost prediction model can establish a causal relationship between DX and FD. Financially healthier firms may have more resources to invest in digitalization, and this reverse causality issue needs to be addressed using quasi-experimental methods, such as instrumental variable estimation, difference-in-differences (DID). The predictive-level association patterns revealed by the SHAP analysis in this study can serve as a foundation for hypothesis generation in future, more focused causal identification research.
Third, the selection of control variables is relatively limited. This study only selects representative variables from various dimensions. Future research could expand the number of control variables for further verification.
Finally, the sample in this study is limited to Chinese A-share listed companies. The applicability of the conclusions to other contexts (e.g., non-listed firms, firms in other emerging market economies or developed economies) requires further examination.

6. Conclusions

Based on data from Chinese A-share listed companies spanning 2010 to 2024, this study examines the association between DX and corporate FD using Logit regression and the XGBoost machine learning method, combined with SHAP interpretability analysis, and constructs a FD prediction model. The main conclusions are as follows.
First, the Logit regression results indicate a significant negative correlation between DX and the probability of FD. This association remains robust after controlling for multiple variables and conducting several robustness tests.
Second, the XGBoost model outperforms the traditional Logit model across key metrics, including an AUC of 0.8653, a PR_AUC of 0.2233, and an F1 score of 0.2786, validating the performance advantages of machine learning methods in FD prediction. However, the difference in recall rates between the two models is relatively small; thus, the choice of method should depend on the specific application scenario.
Third, the SHAP interpretability analysis reveals that the contribution of DX to the predicted risk of FD is non-linear—unstable at low digitalization levels but tending to stabilize after crossing a certain threshold. This preliminarily demonstrates the threshold effect at the predictive level.
Fourth, the LEV emerges as the most significant risk feature in predicting FD, while the OPM and DX serve as primary protective features.
These findings provide empirical references at the predictive and associative levels, contributing to a better understanding of the complex relationship between DX and FD, and offering methodological support for corporate digital strategic decision-making and financial risk early-warning practices.

Author Contributions

Conceptualization, G.Z., Z.Z. and S.H.; methodology, G.Z., Z.Z. and S.H.; software, G.Z., H.Y. and C.W.; validation, G.Z., H.Y. and C.W.; formal analysis, G.Z.; resources, Z.Z. and S.H.; data curation, G.Z., H.Y. and C.W.; writing—original draft preparation, G.Z.; writing—review and editing, Z.Z. and S.H.; visualization, G.Z., H.Y. and C.W.; supervision, S.H.; project administration, S.H.; funding acquisition, S.H. All authors have read and agreed to the published version of the manuscript.

Funding

This research was supported by the Shandong Province Social Science Planning Research Project (Grant No. 22DGLJ01).

Institutional Review Board Statement

Not applicable.

Informed Consent Statement

Not applicable.

Data Availability Statement

The raw data supporting the conclusions of this article will be made available by the authors on request.

Conflicts of Interest

The authors declare no conflicts of interest.

References

  1. Saarikko, T.; Westergren, U.H.; Blomquist, T. Digital transformation: Five recommendations for the digitally conscious firm. Bus. Horiz. 2020, 63, 825–839. [Google Scholar] [CrossRef]
  2. Wu, F.; Hu, H.; Lin, H.; Ren, X. Enterprise digital transformation and capital market performance: Empirical evidence from stock liquidity. J. Manag. World 2021, 37, 130–144+110. [Google Scholar] [CrossRef]
  3. Cui, L.; Wang, Y. Can corporate digital transformation alleviate financial distress? Financ. Res. Lett. 2023, 55, 103983. [Google Scholar] [CrossRef]
  4. Sun, B.; Zhang, Y.; Zhu, K.; Mao, H.; Liang, T. Is faster really better? The impact of digital transformation speed on firm financial distress: Based on the cost-benefit perspective. J. Bus. Res. 2024, 179, 114703. [Google Scholar] [CrossRef]
  5. Li, S.; Yang, Z.; Tian, Y. Unexpected consequence of enterprise digital transformation on financial investments. J. Corp. Account. Financ. 2024, 35, 121–134. [Google Scholar] [CrossRef]
  6. Ashraf, S.; G. S. Félix, E.; Serrasqueiro, Z. Do Traditional Financial Distress Prediction Models Predict the Early Warning Signs of Financial Distress? J. Risk Financ. Manag. 2019, 12, 55. [Google Scholar] [CrossRef]
  7. Kadkhoda, S.T.; Amiri, B. A Hybrid Network Analysis and Machine Learning Model for Enhanced Financial Distress Prediction. IEEE Access 2024, 12, 52759–52777. [Google Scholar] [CrossRef]
  8. Chohan, M.A.; Li, T.; Ramakrishnan, S.; Sheraz, M. Artificial Intelligence in Financial Risk Early Warning Systems: A Bibliometric and Thematic Analysis of Emerging Trends and Insights. Int. J. Adv. Comput. Sci. Appl. 2025, 16, 1336–1351. [Google Scholar] [CrossRef]
  9. Ben Jabeur, S.; Stef, N.; Carmona, P. Bankruptcy Prediction using the XGBoost Algorithm and Variable Importance Feature Engineering. Comput. Econ. 2023, 61, 715–741. [Google Scholar] [CrossRef]
  10. Carmona, P.; Dwekat, A.; Mardawi, Z. No more black boxes! Explaining the predictions of a machine learning XGBoost classifier algorithm in business failure. Res. Int. Bus. Financ. 2022, 61, 101649. [Google Scholar] [CrossRef]
  11. Romero Martínez, M.; Pozuelo Campillo, J.; Carmona Ibáñez, P. Ethical transparency in business failure prediction: Uncovering the black box of xgboost algorithm. Span. J. Financ. Account. Rev. Esp. Financ. Contab. 2025, 54, 135–165. [Google Scholar] [CrossRef]
  12. Chen, T.; Guestrin, C. XGBoost: A Scalable Tree Boosting System. In Proceedings of the 22nd ACM SIGKDD International Conference on Knowledge Discovery and Data Mining, San Francisco, CA, USA, 13–17 August 2016; pp. 785–794. [Google Scholar] [CrossRef]
  13. Lin, J. Digital Transformation Strategies and Practices for Corporates. Adv. Econ. Manag. Polit. Sci. 2024, 96, 204–213. [Google Scholar] [CrossRef]
  14. Xue, Y.; Zhang, X. Digital transformation and corporate capital structure: Evidence from China. Pac. Basin Financ. J. 2024, 84, 102299. [Google Scholar] [CrossRef]
  15. Niu, Y.; Wang, S.; Wen, W.; Li, S. Does digital transformation speed up dynamic capital structure adjustment? Evidence from China. Pac. Basin Financ. J. 2023, 79, 102016. [Google Scholar] [CrossRef]
  16. Wang, Y.; Song, X.; Zhou, J. Does firms’ digitalization affect trade credit provision? Asia-Pac. J. Account. Econ. 2025, 32, 329–357. [Google Scholar] [CrossRef]
  17. Wang, S.; Wen, W.; Niu, Y.; Li, X. Digital transformation and corporate labor investment efficiency. Emerg. Mark. Rev. 2024, 59, 101109. [Google Scholar] [CrossRef]
  18. Xu, Y.; Ke, J.; Liu, J.; Zhai, Z. A study on the impact of enterprise digital transformation on the debt financing cost. Macroeconomics 2023, 4, 14–26+116. [Google Scholar] [CrossRef]
  19. Sun, C.; Zhang, Z.; Vochozka, M.; Vozňáková, I. Enterprise digital transformation and debt financing cost in China’s A-share listed companies. Oecon. Copernic. 2022, 13, 783–829. [Google Scholar] [CrossRef]
  20. Feng, X. The Impact of Enterprise Digital Transformation on the Cost of Debt Financing: An Empirical Analysis Based on the Moderating Effect of Audit Quality. In Proceedings of the 2025 2nd International Conference on Economic Data Analytics and Artificial Intelligence, Changsha, China, 14–16 November 2025; pp. 179–186. [Google Scholar]
  21. Yousaf, U.B.; Ullah, I. Corporate governance and financial distress: A review of the theoretical and empirical literature. Int. J. Financ. Econ. 2024, 29, 1627–1679. [Google Scholar] [CrossRef]
  22. Abrahamsen, N.-G.B.; Nylén-Forthun, E.; Møller, M.; de Lange, P.E.; Risstad, M. Financial Distress Prediction in the Nordics: Early Warnings from Machine Learning Models. J. Risk Financ. Manag. 2024, 17, 432. [Google Scholar] [CrossRef]
  23. Zhang, T.; Zhu, W.; Wu, Y.; Wu, Z.; Zhang, C.; Hu, X. An explainable financial risk early warning model based on the DS-XGBoost model. Financ. Res. Lett. 2023, 56, 104045. [Google Scholar] [CrossRef]
  24. Yang, L.-W.; Binh, N.T.; Yi, J.M. Advanced Techniques for Financial Distress Prediction. Forecasting 2026, 8, 2. [Google Scholar] [CrossRef]
  25. Chen, Y.; Guo, J.; Huang, J.; Lin, B. A novel method for financial distress prediction based on sparse neural networks with L_1/2 regularization. Int. J. Mach. Learn. Cybern. 2022, 13, 2089–2103. [Google Scholar] [CrossRef] [PubMed]
  26. Chi, G.; Li, C.; Zhou, Y.; Li, T. Financial distress prediction with optimal decision trees based on the optimal sampling probability. J. Risk Model. Valid. 2024, 18, 19–44. [Google Scholar] [CrossRef]
  27. Deng, S.; Luo, Q.; Zhu, Y.; Ning, H.; Shimada, T. Financial risk forewarning with an interpretable ensemble learning approach: An empirical analysis based on Chinese listed companies. Pac. Basin Financ. J. 2024, 85, 102393. [Google Scholar] [CrossRef]
  28. Wang, W.; Liang, Z. Financial distress early warning for Chinese enterprises from a systemic risk perspective: Based on the adaptive weighted xgboost-bagging model. Systems 2024, 12, 65. [Google Scholar] [CrossRef]
  29. Tanaka, K.; Higashide, T.; Kinkyo, T.; Hamori, S. A multi-stage financial distress early warning system: Analyzing corporate insolvency with random forest. J. Risk Financ. Manag. 2025, 18, 195. [Google Scholar] [CrossRef]
  30. Zheng, C.; Zhang, X.; Hu, S.; Hao, P. How Does Digital-Green Synergy Affect Key Core Technological Innovation in China? Empirical Evidence from A-Share Listed Companies. Emerg. Mark. Financ. Trade 2025, 62, 3660–3685. [Google Scholar] [CrossRef]
  31. Hou, G.D.; Tong, D.L.; Liew, S.Y.; Choo, P.Y. Improving financial distress prediction using machine learning: A preliminary study. ITM Web Conf. 2024, 67, 01050. [Google Scholar] [CrossRef]
  32. Zhao, Y.; Fang, Y. Financial Account Audit Early Warning Based on Fuzzy Comprehensive Evaluation and Random Forest Model. J. Math. 2022, 2022, 3090335. [Google Scholar] [CrossRef]
  33. Qian, H.; Wang, B.; Yuan, M.; Gao, S.; Song, Y. Financial distress prediction using a corrected feature selection measure and gradient boosted decision tree. Expert. Syst. Appl. 2022, 190, 116202. [Google Scholar] [CrossRef]
  34. Wang, Z.; Li, Y.; Cui, Z.; Zheng, W.; Wang, T. A machine learning-based study of credit risk in supply chain finance of listed service-oriented enterprises in China. Pac. Basin Financ. J. 2026, 96, 103043. [Google Scholar] [CrossRef]
  35. Luo, W.; Yu, Y.; Deng, M. The impact of enterprise digital transformation on risk-taking: Evidence from China. Res. Int. Bus. Financ. 2024, 69, 102285. [Google Scholar] [CrossRef]
  36. Takefuji, Y. Beyond XGBoost and SHAP: Unveiling true feature importance. J. Hazard. Mater. 2025, 488, 137382. [Google Scholar] [CrossRef] [PubMed]
  37. You, Z.; Zhao, S. Enterprise digital transformation and financial risk. Adv. Econ. Manag. Res. 2023, 4, 114–128. [Google Scholar] [CrossRef]
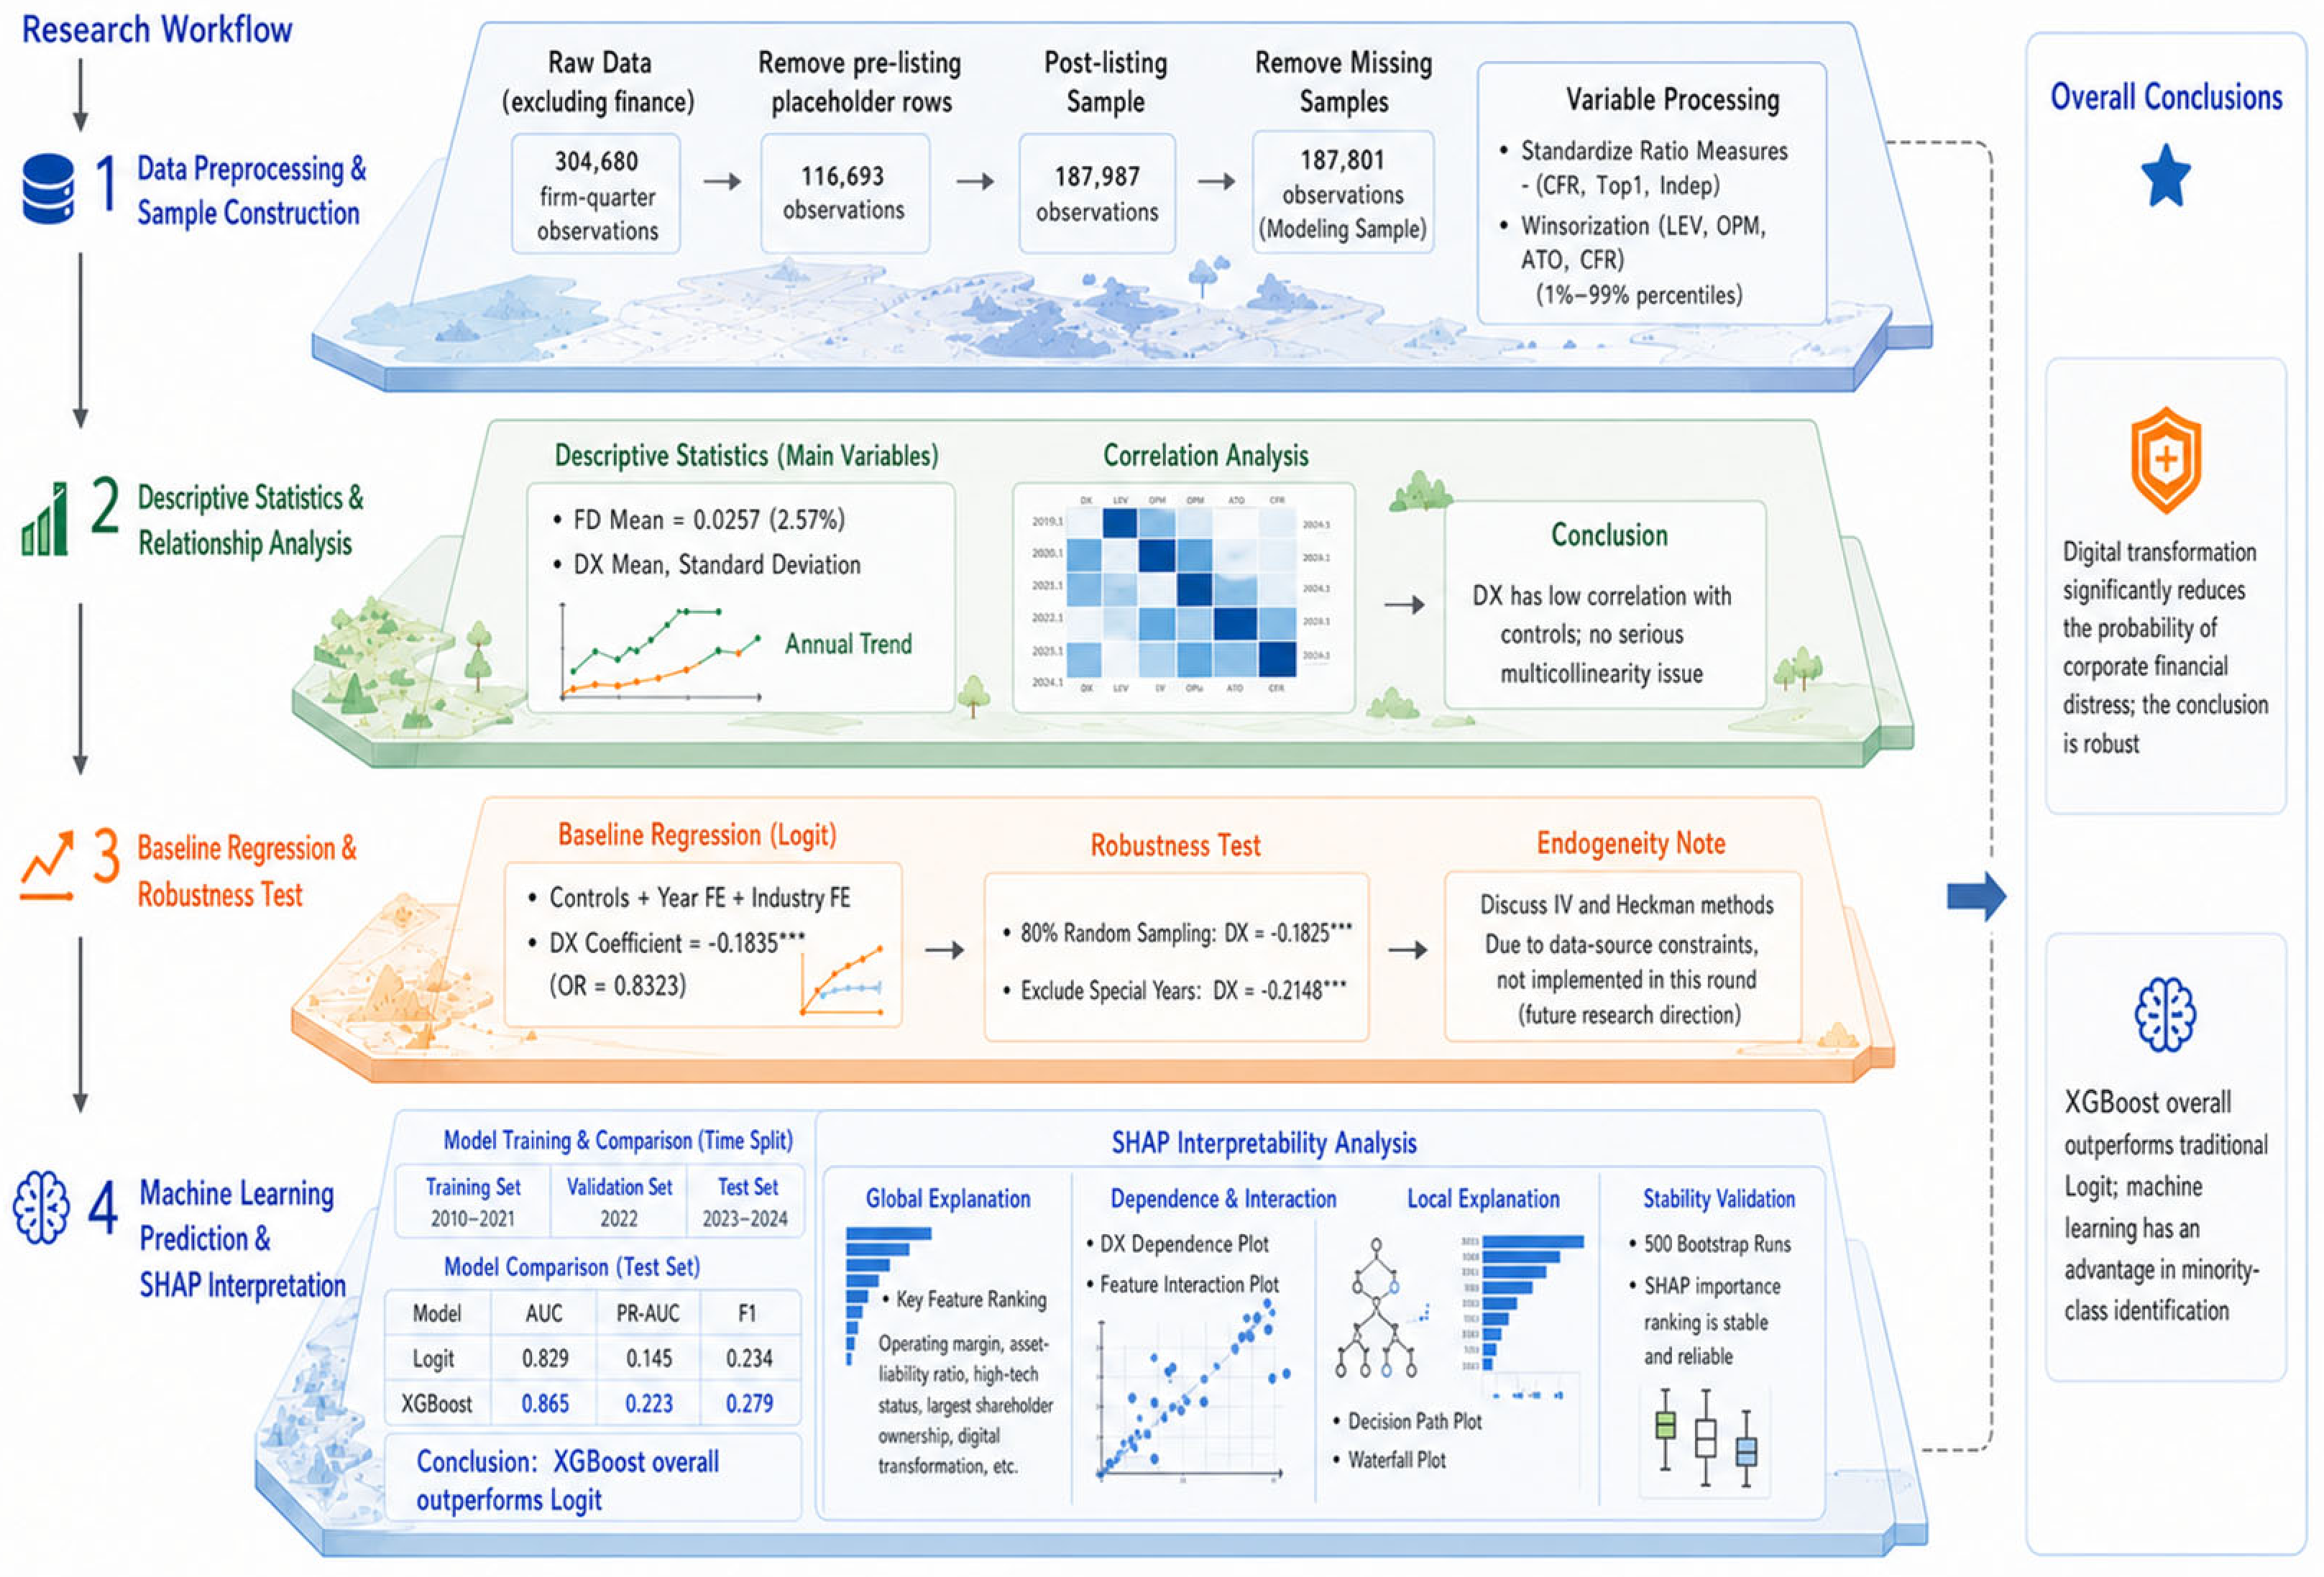
Figure 1. Research framework of the study. Note: *** p < 0.01.
Systems 14 00905 g001
Figure 2. Annual trend of sample size, FD rate and digital transformation.
Systems 14 00905 g002
Figure 3. Comparison of Model Confusion Matrices.
Systems 14 00905 g003
Figure 4. ROC and PR curves on the test set.
Systems 14 00905 g004
Figure 5. XGBoost Threshold Optimization and Precision–Recall Trade-off Plot.
Systems 14 00905 g005
Figure 6. XGBoost Feature Importance.
Systems 14 00905 g006
Figure 7. XGboost-SHAP Swarm Plot.
Systems 14 00905 g007
Figure 8. SHAP Dependency Diagram for DX.
Systems 14 00905 g008
Figure 9. Two-dimensional PDP of DX and LEV.
Systems 14 00905 g009
Figure 10. SHAP Interaction Effect Diagram for Digital Transformation and Key Variables.
Systems 14 00905 g010
Figure 11. SHAP waterfall plot for a typical high-risk sample.
Systems 14 00905 g011
Table 1. Keywords for Digital Transformation.
DimensionKeyword
Artificial Intelligence TechnologyArtificial Intelligence, Business Intelligence, Image Recognition, Investment Decision Support Systems, Intelligent Data Analysis, Intelligent Robotics, Machine Learning, Deep Learning, Semantic Search, Biometric Technology, Facial Recognition, Speech Recognition, Identity Verification, Autonomous Driving, Natural Language Processing
Cloud computing technologyCloud Computing, Stream Computing, Graph Computing, In-memory Computing, Multi-party Secure Computation, Brain-inspired Computing, Green Computing, Cognitive Computing, Converged Architecture, Hundreds of millions of Concurrent Connections, Exabyte-scale Storage, Internet of Things, Cyber-physical Systems
Blockchain technologyBlockchain, Digital Currency, Distributed Computing, Differential Privacy Technology, Smart Financial Contracts
Big Data TechnologyBig Data, Data Mining, Text Mining, Data Visualization, Heterogeneous Data, Credit Reporting, Augmented Reality, Mixed Reality, Virtual Reality
Applications of Digital TechnologyMobile Internet, Industrial Internet, Mobile Connectivity, Internet Healthcare, E-commerce, Mobile Payments, Third-Party Payments, NFC Payments, Smart Energy, B2B, B2C, C2B, C2C, O2O, NetUnion, Smart Wearables, Smart Agriculture, Smart Transportation, Smart Healthcare, Smart Customer Service, Smart Home, Robo-advisory, Smart Tourism and Culture, Smart Environmental Protection, Smart Grid, Smart Marketing, Digital Marketing, Unmanned Retail, Internet Finance, Digital Finance, Fintech, Financial Technology, Quantitative Finance, Oopen Banking
Table 2. Variable Definitions and Indicator Descriptions.
Variable CategoriesVariable NameVariable SymbolNote
Dependent variableFinancial DistressFD1 = Financial distress, 0 = Financial normal
Explanatory variableDigital TransformationDXNatural logarithm of (1 + standardized keyword frequency)
Control variableAsset-liability RatioLEVTotal liabilities at year-end/Total assets at year-end
Operating Profit MarginOPMOperating profit/Operating revenue
Total Asset TurnoverATORevenue/Average total assets
Cash Flow RatioCFRRatio of net cash flow from operating activities to total assets
Largest Shareholder OwnershipTop1Number of shares held by the largest shareholder/Total issued shares
Independent Directors RatioIndepNumber of independent directors/Total number of board members
Ownership NatureOwnership1 for state-owned enterprises (SOEs), 0 otherwise
High-Tech EnterpriseHTE1 for certified High-Tech Enterprises, 0 otherwise
Table 3. Descriptive Statistics for Key Variables.
VariableSample SizeMeanSDMinMax
FD187,8010.02570.15810.00001.0000
DX187,8011.51941.42140.00006.3936
LEV187,8010.41430.21390.04550.9397
OPM187,8010.07450.1968−0.94060.6058
ATO187,8010.38350.33580.01791.8637
CFR187,8010.01580.0595−0.15850.1934
Top1187,8010.33590.15010.00000.8999
Indep187,8010.37760.05590.00001.0000
Ownership187,8010.27020.44410.00001.0000
HTE187,8010.62210.48490.00001.0000
Table 4. Results of the Logit Baseline Regression.
VariableModel 1Model 2Model 3
DX−0.2417 ***
(0.0123)
−0.2055 ***
(0.0128)
−0.1835 ***
(0.0.54)
LEV 3.7952 ***
(0.1046)
4.1212 ***
(0.0186)
OPM −2.0974 ***
(0.0596)
−2.0380 ***
(0.0643)
ATO −0.2659 ***
(0.0522)
−0.4993 ***
(0.0618)
CFR −1.8174 ***
(0.3271)
−1.6663 ***
(0.3430)
Top1 −3.4113 ***
(0.1303)
−3.2065 ***
(0.1321)
Indep 0.3366
(0.2700)
0.6383 **
(0.2628)
Ownership −0.1081 ***
(0.0349)
−0.0624 *
(0.0351)
HTE 0.7392 ***
(0.036)
0.9118 ***
(0.0386)
Industry fixed effectsNoNoYes
Year fixed effectsNoNoYes
Constant−3.3213 ***
(0.0199)
−3.9440 ***
(0.1294)
−3.9306 ***
(0.1869)
Note: *** p < 0.01, ** p < 0.05, * p < 0.10.
Table 5. Results of Robustness Tests.
ModelSample SizeDX_CoefficientDX_OR
Base Model187,801−0.1835 ***
(0.0154)
0.8323
80% Random sample150,241−0.1825 ***
(0.0.174)
0.8332
Exclude pandemic years138,584−0.2148 ***
(0.0192)
0.8067
Note: *** p < 0.01.
Table 6. Comparison of Evaluation Criteria.
ModelAUCPR_AUCPrecisionRecallF1Accuracy
Logistic0.82880.14470.18150.33020.23420.9585
XGBoost0.86530.22330.25470.30750.27860.9694
Disclaimer/Publisher’s Note: The statements, opinions and data contained in all publications are solely those of the individual author(s) and contributor(s) and not of MDPI and/or the editor(s). MDPI and/or the editor(s) disclaim responsibility for any injury to people or property resulting from any ideas, methods, instructions or products referred to in the content.