


Abstract
Icing and galloping disasters threaten the safe operation of power transmission lines, and effective response depends on multi-agent collaboration. To address the insufficient attention paid in existing studies to grassroots execution constraints, this paper constructs a tripartite evolutionary game model involving local governments, power grid enterprise O&M management, and grassroots O&M teams. The model integrates collaborative investment, agency costs, benefit sharing, and multi-layer reward–punishment mechanisms into a unified framework. Replicator dynamics and numerical simulations are then used to analyze the evolution of collaborative strategies; the parameters are non-dimensional benchmark values rather than empirically calibrated estimates. The results show that the system exhibits multi-stability and path dependence, with fully non-collaborative and fully collaborative equilibria possibly remaining stable simultaneously. The combination of strong government regulation and incentives with high-level enterprise collaborative management is the key mechanism for overcoming the low-collaboration trap, and strict accountability has higher marginal policy efficiency than equivalent subsidies. Reducing grassroots execution costs and moderately increasing their share of disaster mitigation benefits can accelerate collaborative convergence and expand the attraction basin of the high-collaboration equilibrium. This study provides theoretical support and mechanism-design implications for enhancing the resilience of collaborative emergency response for power transmission lines under extreme weather conditions.
1. Introduction
As critical arteries of modern power systems, transmission lines provide fundamental support for socioeconomic activities through their safe and stable operation. However, against the backdrop of global climate change, extreme winter weather events have become increasingly frequent, and icing-induced galloping has emerged as one of the major hazards threatening the safety of high-voltage transmission lines [1,2]. Such disasters not only trigger large-scale power outages but also cause structural damage to power facilities, including towers, conductors, and fittings, resulting in prolonged recovery periods and substantial socioeconomic losses. Therefore, developing an efficient and sustainable emergency response system has become a major challenge shared by the global power industry.
In response to these challenges, substantial progress has been made in the technical prevention and mitigation of icing hazards on transmission lines, mainly along three research directions. The first focuses on icing formation mechanisms and meteorological forecasting, including long-term icing risk prediction models and high-resolution monitoring frameworks [3,4]. The second concerns sensing and digital monitoring technologies, such as deep learning-based icing thickness prediction, digital twin-enabled dynamic early warning platforms, and online detection systems based on multi-scale image recognition [5,6]. More broadly, the digitalization of critical infrastructure—through digital-twin platforms, IoT-based sensing, and AI-assisted analytics—is increasingly recognized as a key enabler of grid situational awareness, predictive maintenance, and resilience under extreme operating conditions [7]. These developments provide the technological substrate on which the multi-actor collaborative behaviors examined in the present study ultimately operate, and they motivate treating coordination quality, rather than sensing capability alone, as the binding constraint on emergency-response performance. The third involves engineering prevention and mitigation measures, including de-icing devices, anti-galloping fittings, and specialized protection schemes for key “three-crossing” corridors involving expressways and high-speed railways [8]. Meanwhile, some studies have extended conventional reliability analysis to the systematic vulnerability assessment of power grid infrastructure under compound meteorological hazards [9,10]. Recent international research has accordingly emphasized the resilience of power infrastructure to extreme weather, including the hardening of critical transmission lines against severe storms [11] and multi-stage strategies that combine line hardening with mobile resources and repair-crew dispatch for distribution-system restoration under ice storms [12]. Collectively, these advances have substantially improved the power grid’s capacity for hazard anticipation and physical defense against icing events.
However, the actual performance of emergency response depends not only on technical preparedness but, more importantly, on coordinated actions among multiple actors across administrative levels and organizational boundaries. Specifically, local governments are responsible for establishing regulatory and fiscal frameworks; the operation and maintenance management of power grid enterprises coordinates prior disaster-prevention investments and cross-departmental response dispatch; and frontline maintenance teams undertake substantive implementation tasks, including inspection, reinforcement, de-icing, and on-site emergency repair. The efficiency of coordination among these three actors directly determines the response speed and implementation quality of emergency resource allocation in disaster scenarios. Accordingly, evolutionary game theory has increasingly been introduced into studies of multi-actor emergency governance, with representative applications including government–enterprise collaboration in public health emergencies and Natech compound risks involving natural–technological interactions [13,14]. Evolutionary game theory has likewise been applied to multi-actor coordination in energy systems—for example, to government–grid–user interaction in electricity-market demand-side management [15] and to tripartite co-evolution among generation enterprises, grid operators, and regulators under dynamic incentive and penalty mechanisms [16]. In particular, a growing body of work frames such multi-actor coordination as a principal–agent problem, in which higher-level regulators or managers must design incentive and supervisory mechanisms to align the behavior of lower-level agents under information asymmetry and attenuated oversight. Recent studies have analyzed government–enterprise and central–local–enterprise interactions in emergency and safety governance using evolutionary-game and reward–penalty mechanisms [17,18], consistently identifying opportunistic behavior and inadequate supervision as central obstacles to sustained collaboration. This principal–agent perspective directly motivates the present study’s explicit modeling of the intra-enterprise friction between O&M management and frontline teams, which the more common government–enterprise binary framework leaves implicit.
Despite progress in both technical prevention and emergency coordination, three major gaps remain in the existing literature. First, in terms of research focus, studies on icing-induced galloping have mainly concentrated on technical issues such as monitoring and early warning, de-icing efficiency, and infrastructure reinforcement. However, the multi-actor behavioral interactions that determine whether technical measures can be implemented in a timely manner have not been sufficiently characterized, and the transmission mechanism between technical preparedness and organizational execution remains unclear. Second, in terms of modeling granularity, most evolutionary game studies on emergency coordination adopt a binary “government–enterprise” framework, in which enterprises are often treated as unitary rational actors. This approach overlooks the reality that frontline maintenance teams undertake final implementation tasks under conditions of information asymmetry, weakened supervision, and relatively high opportunity costs. Consequently, intra-enterprise principal–agent frictions constitute a systematic blind spot in existing models, making it difficult to explain the governance dilemma in which policies are formally in place but implementation fails in practice. Third, in terms of equilibrium structure, some studies tend to discuss a unique stable strategy, whereas regional divergence characterized by “similar policies but markedly different performance” is commonly observed in practice. How low-coordination traps emerge, how path dependence affects long-term performance, and whether mechanism optimization at the frontline level can help the system cross critical thresholds require further clarification.
To address these gaps, this study develops a tripartite evolutionary game model for collaborative emergency response of transmission lines under icing-induced galloping disasters, explicitly incorporating frontline maintenance teams as independent strategic actors. Within a unified framework, the model integrates disaster mitigation benefits, collaborative investment costs, frontline agency costs, benefit-sharing weights, and multi-level reward–punishment mechanisms. It further derives the tripartite replicator dynamic equations and the local stability conditions based on the Jacobian matrix, and conducts numerical simulations under three scenarios: low incentives, high incentives, and frontline mechanism optimization. The practical importance of such coordination is illustrated by the 2008 freezing-rain and snowstorm disaster in southern China, in which prolonged icing inflicted heavy damage on transmission systems across Hunan, Guizhou, Hubei, Jiangxi, and Guangxi, and the effectiveness of the response hinged on the interplay of governmental command, enterprise resource allocation, and frontline repair and de-icing.
The marginal contributions of this study are threefold. First, at the theoretical level, it reveals the possible coexistence of multiple stable states and path dependence in the collaborative emergency response system for icing-induced galloping, thereby providing an evolutionary game explanation for low-coordination traps. Second, at the policy level, it identifies the mechanism through which “strong regulation–strong incentives plus high collaborative management” expands the basin of attraction of the high-coordination equilibrium. Third, at the mechanism level, it quantifies the effects of reduced frontline implementation costs and adjusted benefit-sharing weights on the speed of coordination convergence and the basin of attraction of the high-coordination equilibrium, thereby offering a reference for emergency mechanism design in regions frequently exposed to extreme winter weather.
The remainder of this paper is organized as follows: Section 2 defines the research problem and presents the behavioral assumptions of the tripartite evolutionary game. Section 3 constructs the payoff structure and derives the three-dimensional replicator dynamic system. Section 4 analyzes the evolutionary equilibrium points and their local stability conditions based on the Jacobian matrix. Section 5 conducts numerical simulations under three policy scenarios, examines the structure of the basin of attraction of the high-coordination equilibrium, and performs sensitivity analysis of key control parameters. Section 6 summarizes the main conclusions and discusses policy implications, research limitations, and future research directions.
2. Problem Description and Model Assumptions
2.1. Collaborative Emergency Response for Transmission Lines Under Icing-Induced Galloping Disasters
Icing-induced galloping disasters are characterized by sudden onset, wide spatial impact, and substantial difficulty in emergency response [19]. In terms of physical consequences, icing and galloping impose considerable mechanical stress on transmission conductors and fittings, leading to strand breakage, jumper faults, and galloping-induced fatigue damage. In severe cases, they may cause line tripping, tower collapse, conductor breakage, and large-scale power outages. In terms of response conditions, icing-induced galloping is often accompanied by extreme weather conditions, such as low temperatures, rain, snow, and road icing, which impede emergency repair and material transportation. As a result, no single actor can efficiently cope with such disasters by relying solely on its own resources.
Empirically, recent case studies of transmission-line trip faults and tower damage under severe snow-and-ice conditions, together with regional icing-risk assessments for high-voltage and ultra-high-voltage corridors, have documented both the scale of icing-induced losses and the difficulty of post-event recovery [20]. These accounts complement earlier reviews of the large-scale 2008 ice catastrophe across southern China [21] and provide the empirical backdrop against which the qualitative mechanisms identified in this study can be interpreted.
Against this background, emergency response for transmission lines under icing-induced galloping disasters is no longer merely a technical issue for a single power grid enterprise, but rather a multi-actor collaborative governance problem involving local governments, the operation and maintenance management of power grid enterprises, and frontline maintenance teams within enterprises. The overall effectiveness of collaborative emergency response depends on coordination across three levels. First, local governments must provide sufficient policy support and regulatory constraints. Second, the operation and maintenance management of power grid enterprises must make forward-looking investments in disaster prevention and establish effective internal incentive mechanisms. Third, frontline maintenance teams must effectively carry out specific tasks, including inspection, reinforcement, information reporting, and emergency response.
However, because the actors differ in their objective functions and constraints, several typical problems are commonly observed in practice. At the governmental level, insufficient regulation and incentives weaken power grid enterprises’ motivation to maintain sustained and high-level investment in disaster prevention and mitigation. At the enterprise level, the operation and maintenance management is constrained by cost pressures, leading to uneven attention to icing-induced galloping risks and inadequate implementation of internal assessment systems. At the frontline level, under information asymmetry and insufficient supervision, maintenance teams may engage in opportunistic behaviors, such as perfunctory compliance and free-riding. The interaction of these factors makes it difficult for the collaborative emergency response system for icing-induced galloping disasters to achieve a stable and sustainable state of high-level coordination.
Given this practical context, it is necessary to develop a theoretical model that characterizes the interactive behaviors and dynamic evolution of local governments (G), the operation and maintenance management of power grid enterprises (E), and frontline maintenance teams (B). Such a model can be used to analyze the evolutionary patterns and stability conditions of multi-actor collaborative emergency response strategies under different policy and management parameters, thereby providing a theoretical basis for improving collaborative emergency response mechanisms.
2.2. Tripartite Actors and Decision-Making Behaviors
Based on the practical context of collaborative emergency response for transmission lines under icing-induced galloping disasters, the relevant participants are abstracted into the following three representative categories of actors.
- (1)
- Local Governments and Emergency Management Departments
Local governments and their functional departments, including emergency management, development and reform, and transportation authorities, act as regulators of public safety and representatives of public interests. They influence the behavioral choices of power grid enterprises in preventing and mitigating icing-induced galloping disasters by formulating policies for power supply security and production safety, conducting safety inspections and accident accountability procedures, and providing fiscal subsidies and tax incentives. Their strategy set is defined in Equation (1).
SG = {strong regulation–strong incentives, weak regulation–weak incentives}
Here, “strong regulation–strong incentives” means that the government intensifies supervision, inspection, and accident accountability for power grid enterprises while providing relatively high levels of fiscal subsidies or policy support. By contrast, “weak regulation–weak incentives” corresponds to lower regulatory intensity and limited incentive measures.
- (2)
- Operation and Maintenance Management of Power Grid Enterprises
The operation and maintenance management of power grid enterprises refers to the departments and managerial personnel responsible for transmission line operation, maintenance, and emergency management, such as transmission inspection and maintenance centers and operation and maintenance branches. This actor determines the overall level of investment in the prevention and mitigation of icing-induced galloping disasters, including the construction of monitoring and early warning systems, the deployment of de-icing equipment, the reserve of emergency supplies, and the organization of joint drills. It also designs internal assessment and incentive mechanisms to constrain and guide the emergency response behaviors of frontline maintenance teams. Its strategy set is defined in Equation (2).
SE = {high collaborative management, low collaborative management}
In Equation (2), “high collaborative management” refers to a relatively high level of investment in monitoring and early warning, material and personnel preparedness, and internal coordination, as well as the active guidance of frontline teams in collaborative emergency response through performance assessment, rewards, and penalties. By contrast, “low collaborative management” refers to maintaining only basic compliance-oriented operation, maintenance, and emergency investments, with a relatively weak awareness of coordination.
- (3)
- Frontline Operation and Maintenance Teams of Power Grid Enterprises
Frontline operation and maintenance teams refer to grassroots operation, maintenance, and repair units responsible for routine transmission line inspections, hidden-hazard identification, ice removal, and emergency repair. They are the direct executors of collaborative emergency response measures. The quality of their implementation directly affects the probability of accidents and the severity of losses caused by icing-induced galloping disasters. Their strategy set is defined in Equation (3).
SB = {conscientious implementation, perfunctory implementation}
Here, “conscientious implementation” refers to carrying out inspection, reinforcement, information reporting, and emergency response in strict accordance with emergency plans and on-site response cards. By contrast, “perfunctory implementation” refers to reducing actual work input and exhibiting free-riding behavior in the absence of effective supervision and incentives.
Within the evolutionary game framework, the three types of actors are each regarded as populations composed of a large number of homogeneous individuals. Under the assumption of bounded rationality, individuals adjust their strategy choices according to their own payoff levels. The proportion of individuals adopting a given strategy changes over time, thereby forming the dynamic evolutionary process of multi-actor collaborative emergency response strategies.
2.3. Basic Model Assumptions
Based on the behavioral characteristics and interaction logic of the three actors described above, the following basic assumptions are made for model construction.
Assumption 1 (Bounded Rationality and Population Evolution): Local governments, the operation and maintenance management of power grid enterprises, and frontline maintenance teams are all boundedly rational actors. They cannot determine the optimal strategy under complete rationality in a single decision-making process; instead, they learn and imitate by comparing the payoff performance of different strategies in actual operations. Each type of actor is represented by a population composed of a large number of individuals, who adjust their strategies through information exchange and experiential imitation. This process gives rise to population behavior in which strategy proportions evolve over time and can be characterized by replicator dynamic equations in evolutionary game theory.
Assumption 2 (Binary Strategy Setting): To highlight the core conflict of the problem and simplify the analysis, the strategies of the three actors are abstracted into two alternatives for each actor. Local governments choose either “strong regulation–strong incentives” or “weak regulation–weak incentives”; the operation and maintenance management of power grid enterprises chooses either “high collaborative management” or “low collaborative management”; and frontline maintenance teams choose either “conscientious implementation” or “perfunctory implementation.” The diverse policy instruments and management measures observed in practice can be regarded as different combinational mappings of these binary strategies. In practice, government regulation and incentives, enterprise collaborative management, and frontline implementation are continuous or multi-level rather than strictly binary. The binary setting is adopted as a tractable simplification that retains the central behavioral tension of the problem—whether each actor actively engages in collaborative response or not—while abstracting away intermediate effort levels and the fine-grained intensity of regulation and incentives. Moreover, because each actor is modeled as a population, the proportion adopting the active strategy varies continuously between zero and one, so the aggregate level of engagement is represented as a graded rather than an all-or-nothing quantity.
Assumption 3 (Exogenously Given Disaster Probability): During the study period, the probability of an icing-induced galloping disaster is given as p ∈ (0, 1), which varies with regional climatic conditions and transmission line characteristics. When making strategy choices, the three actors base their decisions on expected payoffs, weighing the probability-weighted payoffs under both disaster and non-disaster scenarios.
Assumption 4 (Coexistence of Disaster Mitigation Benefits and Coordination Costs): The payoffs of the three actors consist of four components: direct economic losses and indirect social losses caused by icing-induced galloping disasters; disaster mitigation benefits and improved recovery speed resulting from high collaborative management and conscientious implementation; transfer gains, such as government subsidies, rewards, and internal performance incentives; and the human and material resource costs invested by each actor in collaborative emergency response. A higher level of coordination reduces disaster losses but also increases the costs of preventive and collaborative inputs.
Assumption 5 (Incentives and Penalties Embedded in the Payoff Function): Under different regulation–incentive strategies, local governments impose differentiated fiscal subsidies and accident penalties on power grid enterprises. Under different management strategies, the operation and maintenance management of power grid enterprises implements differentiated assessment rewards and accountability measures for frontline teams. Incentive and constraint mechanisms, including subsidies, rewards, and fines, influence strategy choices by altering the actors’ net payoffs.
Assumption 6 (Incomplete Information with Gradual Learning): When making decisions, the three actors cannot fully observe the specific strategy choices or true costs and benefits of the other actors. Instead, they obtain limited information from historical experience, external information, and local observations. Through long-term repeated interactions, the actors gradually revise their perceptions of the environment and the behavior of their counterparts based on observed payoff outcomes, and dynamically adjust their own strategies accordingly.
Under these assumptions, an evolutionary game model among local governments, the operation and maintenance management of power grid enterprises, and frontline maintenance teams can be constructed. By analyzing the dynamic evolution of the strategy proportions of the three actors under different parameter conditions, the model reveals the evolutionary mechanism and stable coordination conditions of collaborative emergency response for transmission lines under icing-induced galloping disasters.
2.4. The 2008 Southern China Freezing-Rain and Snowstorm Disaster
The 2008 freezing-rain and snowstorm disaster in southern China illustrates both the severity of large-scale icing events and the collaborative nature of the response they demand. From 10 January to early February 2008, the region experienced an unprecedented low-temperature, rain, snow, and freezing event, dominated by freezing rain and notable for its record-breaking intensity and exceptionally long duration, with Guizhou and Hunan setting provincial records [22]. The event disrupted transportation, energy supply, power transmission, communications, and daily life across thirteen to fourteen provinces.
Power-grid damage was severe and spatially uneven. Nationally, the event disrupted on the order of 25,000 transmission lines of 10 kV and above and damaged about 2000 substations; at the backbone level, roughly 4126 lines were damaged and more than 1500 towers at 220 kV and above collapsed, with direct economic losses exceeding US$16 billion, on the order of RMB 110 billion [3,21]. Damage concentrated in Hunan, Guizhou, Jiangxi, and Hubei: in Jiangxi alone, icing destroyed 116 towers at 500 kV and 142 at 220 kV and affected about 7.5 million customers; maximum ice diameters reached 40–60 mm in Hunan and up to about 300 mm in Guizhou, far above the 15–30 mm design standard; and in Chenzhou, Hunan, about 4.6 million residents lost power for roughly twelve days [22].
Recovery relied on coordinated action across three levels. Local governments led emergency command, public mobilization, and reconstruction; State Grid Corporation of China and China Southern Power Grid organized restoration in their respective service areas; and frontline maintenance teams carried out inspection, de-icing, and repair under harsh field conditions. Locally managed and rural systems with weaker grid structure and thinner material, technical, and personnel support tended to recover more slowly than systems backed by the large grid companies. In the following years, the grid operators conducted systematic anti-icing research, raised line design standards, and deployed icing monitoring and early-warning systems, DC de-icing equipment, and drone-assisted inspection; that comparable events recurred—for example, in 2018—indicates that such measures mitigate rather than eliminate the hazard. Taken together, these features—heavy disaster losses, a response spanning government, enterprise, and frontline levels, divergent outcomes across regions with different organizational capacity, and the gradual strengthening of frontline technical support—motivate the tripartite model developed in the following sections.
3. Construction of a Tripartite Evolutionary Game Model for Emergency Response to Icing-Induced Galloping of Transmission Lines
3.1. Payoff Components and Parameter Settings
In the context of icing-induced galloping disasters, the net payoffs of local governments G, the operation and maintenance management of power grid enterprises E, and frontline maintenance teams B can be uniformly expressed as a combination of “disaster mitigation benefits + incentive gains − costs and penalties.” This section defines three categories of parameters in sequence: disaster losses and mitigation benefits, collaborative input costs, and incentive and penalty mechanisms.
3.1.1. Disaster Losses and Mitigation Benefits of Icing-Induced Galloping
Let the probability of an icing-induced galloping disaster during the study period be p ∈ (0, 1). When all three actors adopt passive strategies, the comprehensive loss caused by the disaster, including direct economic losses, indirect losses from power outages, and accountability costs, is denoted by L0. When one or more actors shift to collaborative strategies, this loss is reduced through different mechanisms:
when the operation and maintenance management of power grid enterprises adopts “high collaborative management,” losses are reduced by ΔLE > 0 through monitoring, early warning, and proactive investment; when local governments adopt “strong regulation–strong incentives,” losses are reduced by ΔLG > 0 through policy coordination and cross-departmental integration; and when frontline maintenance teams adopt “conscientious implementation,” losses are reduced by ΔLB > 0 through rigorous inspections and rapid response.
Under the ideal scenario in which all three actors collaborate, the lower bound of disaster loss is given in Equation (4).
The disaster mitigation benefits are allocated among the three actors according to predefined proportions. Let the weighting coefficients of the power grid enterprise, local government, and frontline maintenance teams in the allocation of mitigation benefits be θE, θG, and θB, respectively, which satisfy Equation (5).
These weights characterize the benefit-sharing structure of disaster mitigation outcomes among the three actors and serve as key parameters for identifying frontline implementation incentives.
In practice, the shared disaster mitigation benefit is the avoided loss—the reduction in the comprehensive disaster loss , which comprises direct economic losses, indirect losses from outages, and accountability costs—so it is a composite, monetary-equivalent quantity rather than a single value stream, and , , and denote the proportions of this avoided loss attributed to the three actors. The concrete form of the benefit differs by actor: for the power grid enterprise it is mainly operational and financial value, such as avoided repair and restoration outlays, reduced outage penalties, and sustained supply reliability; for the local government it is mainly social and reputational value, such as maintained public safety and social stability and reduced accountability exposure; and for the frontline teams it is mainly performance-based value, such as internal rewards and recognition and reduced exposure to blame for implementation failures. Because these components are aggregated into a single avoided-loss measure, the coefficients act as a normalized composite-value split rather than a division of one specific monetary item.
3.1.2. Collaborative Input Costs and Management Costs
All three actors incur additional costs when adopting collaborative strategies: when the operation and maintenance management of power grid enterprises adopts “high collaborative management,” additional investments are required for early warning and monitoring system construction, emergency material reserves, and joint drills, and the corresponding cost is denoted by CE > 0; when local governments implement “strong regulation–strong incentives,” additional expenditures are required for supervision and inspection, emergency coordination, and fiscal subsidies, and the regulatory cost is denoted by CG > 0; and when frontline maintenance teams adopt “conscientious implementation,” additional workload is required in terms of increased inspection frequency, de-icing operations, and training drills, and the opportunity cost is denoted by CB > 0.
When the three actors adopt passive strategies, the above additional costs can be approximately regarded as zero or assumed to be embedded in baseline operational costs; therefore, they are not explicitly included in the model.
3.1.3. Incentive and Penalty Mechanisms
Local governments and the operation and maintenance management of power grid enterprises influence the net payoffs of other actors through incentive and penalty mechanisms, which are specified as follows: Under the “strong regulation–strong incentives” strategy, local governments provide fiscal subsidies RE > 0 to power grid enterprises that choose high collaborative management. Conversely, enterprises whose low collaborative management leads to ineffective disaster response or accidents are subject to fines or accountability measures, with the penalty level denoted by PE > 0. Under the “high collaborative management” strategy, the operation and maintenance management of power grid enterprises grants performance rewards RB > 0 to frontline teams that adopt conscientious implementation. Conversely, teams whose perfunctory implementation results in ineffective emergency response are subject to economic penalties or deductions in performance assessments, with the penalty level denoted by PB > 0.
In the benchmark model, the above incentive and penalty instruments are assumed to be fully coupled with the active strategies of the corresponding upper-level actors. That is, government subsidies and enterprise accountability penalties become substantively effective when the government adopts strong regulation–strong incentives, whereas internal rewards and accountability pressure on frontline teams become substantively effective when enterprises adopt high collaborative management under government supervision. When governments or enterprises choose passive strategies, the corresponding levels of subsidies, rewards, and penalties are assumed to be substantially weakened and are therefore approximated as zero.
This fully coupled setting is adopted as a benchmark specification rather than as a claim that all real-world incentive instruments are completely absent under weak regulation or low collaborative management. In practice, incentive mechanisms may be partially coupled. For instance, enterprises may still face baseline safety penalties under routine supervision, frontline teams may receive baseline performance rewards or deductions under ordinary assessment systems, and some government subsidies may be conditional on verified disaster mitigation outcomes rather than solely on the enterprise’s declared management strategy. Therefore, the fully coupled benchmark represents a limiting case in which the active strategies of upper-level actors are required to activate strong incentive–constraint pressure.
3.2. Complete Payoff Matrix and Strategy Combinations
This subsection specifies the net payoff of each actor under every pure-strategy combination , with , giving the complete payoff matrix of the game; the expected payoffs and payoff differences that govern the replicator dynamics are derived from it below.
Recall from Equation (6) that the net payoffs of the power grid enterprise O&M management, the local government, and the frontline O&M teams under are denoted , , and , where the subscript denotes a collaborative strategy and a passive one. Under a given combination, the total disaster-loss reduction from collaborative actions is
so the expected residual loss is , which remains non-negative by the feasibility condition in Equation (4). The matrix is written in normalized form with the fully passive combination as reference point; adding any strategy-independent constant to all payoffs of a given actor leaves every payoff difference, and hence the replicator equations, unchanged.
In this normalized form, each actor receives a mitigation benefit only when it participates. The enterprise and the frontline teams internalize private shares and of the avoided loss, whereas the local government, as steward of public welfare, internalizes the full societal avoided loss; consistent with Equation (5), , and the complementary public share does not enter the government’s payoff difference separately because the government already values the total benefit. The enterprise bears the input cost , receives the subsidy under strong regulation, incurs penalty if it stays passive under strong regulation, and funds the frontline reward only when its own high collaborative management, strong government regulation, and conscientious frontline implementation coincide. The government bears the regulatory cost and pays when the enterprise collaborates. The frontline teams bear the execution cost and receive the incentive ( or ) only when high enterprise collaborative management and strong government regulation are both present. The penalties and represent accountability, performance, and reputational losses borne by the penalized actor rather than the fiscal revenues of the punishing actor.
Accordingly, the normalized net payoff functions are
Evaluating Equations (7)–(9) at the eight combinations yields the complete payoff matrix in Table 1.
Table 1.
Complete 2 × 2 × 2 payoff matrix of the tripartite evolutionary game.
Table 1 gives each actor’s payoff under every combination. For example, under the enterprise obtains , receives , bears , and funds ; the government obtains the full benefit , bears , and pays ; and the frontline teams obtain , receive , and bear . Under , by contrast, the enterprise incurs for staying passive under strong regulation, while the government obtains only its own coordination benefit net of .
The matrix also makes the transfer structure explicit. The frontline reward is funded by the enterprise and received by the frontline teams under the same condition——so it appears as in and in and balances exactly. The penalty is borne by an enterprise that chooses under , and by frontline teams that choose when high enterprise collaborative management and strong government regulation are both present; both are accountability or reputational losses rather than transfers to the punishing actor.
For the local government in particular, the payoff represents public welfare rather than an intrinsic regulatory utility: its benefit is the reduction in the comprehensive societal disaster loss—avoided direct economic and indirect social losses—reflecting its role as a representative of public interest. This benefit is net of the government’s fiscal outlays, namely the subsidies it provides to enterprises that adopt high collaborative management, and of its administrative and regulatory cost for strong regulation, inspection, and accountability. Penalties imposed on enterprises act primarily as a regulatory deterrent that shapes enterprise behavior rather than as a fiscal revenue source for the government. The government’s payoff is therefore a composite of public-welfare, fiscal, and regulatory components, with public welfare as the objective and the fiscal and regulatory terms entering as costs.
3.3. Expected Payoffs and Replicator Dynamic Equations
Let , , and denote the proportions of enterprise O&M management, local governments, and frontline O&M teams adopting , , and , respectively (the time argument is omitted below). The expected payoff of each actor is obtained by weighting the relevant payoffs in Table 1 by the strategy probabilities of the other two actors.
For the enterprise population, given and ,
and the population average payoff is
Substituting the entries of Table 1, the net payoff difference between high and low collaborative management is
For the local government population, given x and z,
The average payoff of the local government population is given in Equation (16).
For the frontline O&M team population, given x and y,
The average payoff of the frontline maintenance team population is given in Equation (19).
Equations (13) and (19) are obtained directly from the full payoff matrix in Table 1; the subsequent replicator dynamics therefore rest on the explicit payoff construction of all eight pure-strategy combinations rather than on assumed or implicit incremental payoffs.
By the replicator dynamic theory, the proportion adopting a higher-payoff strategy increases over time. For the enterprise population,
At x = 0 or x = 1, the evolutionary driving force naturally becomes zero. Similarly, the evolutionary equations for the proportions y(t) and z(t) of collaborative strategies in the local government and frontline maintenance team populations are given in Equations (21) and (22), respectively.
Combining these, the complete tripartite evolutionary game system is
Equation (23) is the tripartite replicator dynamic system. The sign of each payoff difference governs whether the corresponding collaborative strategy diffuses or declines: spreads high collaborative management among enterprise O&M management, spreads strong regulation among local governments, and spreads conscientious implementation among frontline O&M teams; negative payoff differences drive the corresponding populations toward passive strategies.
4. Evolutionary Equilibrium and Stability Analysis
Based on the tripartite replicator dynamic system in Equation (23), this section analyzes the equilibrium structure and local stability properties of the collaborative emergency response system. Compared with a general statement based on evolutionary game theory, the stability claims in this section are derived directly from the specific mathematical structure of the proposed system. In particular, we distinguish between pure-strategy vertex equilibria, boundary mixed equilibria, and interior mixed equilibria, and we clarify the scope of the separatrix-based interpretation used in the numerical simulations.
4.1. Evolutionary Equilibrium Conditions
The evolutionary game equilibrium corresponds to the equilibrium point of dynamic system (23), namely the state point (x*, y*, z*) that satisfies Equation (24).
Since the six boundary surfaces of [0, 1]3 are invariant manifolds, the equilibrium points of system (23) can be classified into three categories according to the dimensionality of their interior components.
- (1)
- Pure-Strategy Equilibria (Vertex Equilibrium Points)
When x*, y*, z* ∈ {0, 1}, the state (x*, y*, z*) corresponds to a strategy combination in which all three actors adopt pure strategies. The system has 23 = 8 vertex equilibrium points: E1 = (0, 0, 0), where all three actors adopt passive strategies; E8 = (1, 1, 1), where all three actors adopt collaborative strategies; and the remaining points E2–E7, which represent partially collaborative combinations, such as (1, 0, 0), (0, 1, 0), (0, 0, 1), (1, 1, 0), (1, 0, 1), (0, 1, 1).
- (2)
- Boundary Mixed Equilibria (Edge/Face Equilibrium Points)
When one of the three actors is in an interior mixed state, for example 0 < x* < 1, while the other actors adopt pure strategies, the corresponding zero-payoff-difference condition in Equation (25) must be satisfied simultaneously.
Corresponding expressions can also be derived for the cases of y* and z*. Such equilibrium points characterize a local indifference state in which one actor is indifferent between collaborative and passive strategies, given the pure-strategy choices of the other actors. They are typically center-type or saddle-type equilibrium points and generally lack asymptotic stability.
- (3)
- Interior Mixed Equilibria
When 0 < x*, y*, z* < 1, the conditions in Equation (26) must be satisfied simultaneously.
This type of equilibrium corresponds to a mixed state of “global indifference,” in which all three actors are indifferent between collaborative and passive strategies. Its existence and location are jointly determined by model parameters, such as disaster mitigation benefits, coordination costs, subsidies, and penalty intensity. Because a simple analytical solution is generally difficult to obtain, numerical methods are often required. According to general evolutionary game theory, such interior equilibria are at most center-type or saddle-type equilibria and do not constitute evolutionarily stable strategy (ESS).
4.2. Jacobian Matrix and Local Stability Criterion
4.2.1. General Form of the Jacobian Matrix
Let the right-hand-side vector field of system (23) be denoted by F(x, y, z) = F(1, 2, 3)T, whose components are given in Equation (27).
The Jacobian matrix of the system is given in Equation (28).
Noting that ΔπE depends only on y and z, ΔπG depends only on x and z, and ΔπB depends only on x and y, the diagonal and off-diagonal elements of the Jacobian matrix exhibit the separated structure shown in Equation (29).
4.2.2. Stability of Mixed Equilibria and the Pure-Strategy Nature of Stable States
The Jacobian in Equation (29) gives the stability of any mixed equilibrium a particularly transparent form. Whenever a population sits in an interior state—its share strictly between and —the equilibrium condition requires the corresponding net payoff difference to vanish, so the diagonal Jacobian term for that direction, , or , is exactly zero. A population already resting at a pure state (share or ) contributes only along its own diagonal, because every off-diagonal term in its row carries the factor , or and therefore disappears. Evaluated at a mixed equilibrium, the Jacobian is consequently block-triangular, and the block that governs the mixed directions has an identically zero diagonal.
The stability conclusion follows directly from this structure. A block with zero diagonal has zero trace, so the eigenvalues governing the mixed directions sum to zero and cannot all be negative; at a fully interior equilibrium the entire Jacobian has zero trace. Any equilibrium with one or more interior coordinates is therefore at most a saddle or a center and is never asymptotically stable. Asymptotic stability requires every population to settle at a pure state, so the asymptotically stable equilibria coincide exactly with the pure-strategy vertices whose eigenvalues are given by Equation (30) and classified in Table 2.
Table 2.
Eigenvalues and Stability Criteria of Pure-Strategy Equilibrium Points.
4.2.3. Diagonalization Properties of Pure-Strategy Equilibrium Points
At any pure-strategy equilibrium point (x*, y*, z*) ∈ {0, 1}3, since x*(1 − x*) = y*(1 − y*) = z*(1 − z*) = 0, the Jacobian matrix in Equation (28) degenerates into a diagonal matrix. Its diagonal elements are precisely the three eigenvalues, as shown in Equation (30).
Accordingly, the following local stability criteria can be obtained: (1) If all three eigenvalues are negative, the pure-strategy equilibrium is asymptotically stable and thus constitutes an evolutionarily stable strategy (ESS); (2) if all three eigenvalues are positive, the equilibrium is an unstable source point; and (3) if the eigenvalues have mixed signs, the equilibrium is a saddle point that attracts trajectories only on specific submanifolds and does not constitute an ESS. Table 2 presents the eigenvalue sign conditions and ESS criteria corresponding to the eight pure-strategy equilibrium points.
Table 2 intuitively reveals the structural characteristics of the proposed model. The same set of net payoff differences, ΔπE, ΔπG, ΔπB, appears simultaneously in the eigenvalue expressions of multiple equilibrium points but with opposite signs. This implies that, within certain parameter ranges, multiple pure-strategy equilibria may simultaneously satisfy the ESS conditions, indicating the coexistence of multiple stable states.
4.3. Parameter Conditions for Key Equilibria and Multistability Analysis
4.3.1. Fully Non-Collaborative Equilibrium (0, 0, 0)
If all three eigenvalues are negative, the pure-strategy equilibrium is a locally asymptotically stable point; if all three eigenvalues are positive, it is an unstable source point; and if the eigenvalues have mixed signs, it is a saddle point. Based on this criterion, the condition under which the fully non-collaborative equilibrium (0, 0, 0) becomes a locally asymptotically stable point is given as follows:
The economic implication of this condition is that, under an initial configuration in which all three actors adopt passive strategies, it is not cost-effective for any single actor to unilaterally shift to a collaborative strategy. In other words, the disaster mitigation benefits of collaboration cannot be fully internalized by any individual actor, the costs of collaborative inputs are relatively high, and government subsidies and penalties, together with internal enterprise incentives, are insufficient to offset the marginal costs. In this case, even if a small number of actors attempt to collaborate, it is difficult to generate a positive demonstration effect, and the system as a whole remains locked into a low level of coordination over the long term. This state corresponds to the low-coordination trap observed in practice and represents the core governance dilemma examined in this study.
4.3.2. Fully Collaborative Equilibrium (1, 1, 1)
The condition under which the fully collaborative equilibrium (1, 1, 1) becomes a locally asymptotically stable point is given as follows:
This condition indicates that, under a configuration in which all three actors have already adopted collaborative strategies, any actor deviating from collaboration will experience a decline in net payoff. The corresponding practical policy–management conditions are as follows: under “strong regulation–strong incentives,” the government provides sufficient subsidies and policy support to highly collaborative enterprises while imposing effective accountability on low-collaboration behavior; under “high collaborative management,” enterprises offer quantitative and transparent performance rewards and promotion channels to teams that implement tasks conscientiously while strictly holding teams accountable for perfunctory implementation; and collaborative measures, such as proactive investment, information sharing, and line-specific response cards, can substantially reduce losses caused by icing-induced galloping disasters, such that disaster mitigation benefits exceed additional costs.
4.3.3. Coexistence of Multiple Stable States and Path Dependence
Equations (31) and (32) constrain the signs of payoff differences in different neighborhoods and are therefore not necessarily mutually exclusive. Thus, within certain parameter ranges, the system may simultaneously exhibit two locally stable equilibria: full non-collaboration and full collaboration. In this case, the evolutionary outcome depends on the position of the initial state relative to the evolutionary separatrix. When the initial level of coordination is low, the system may converge to the low-coordination trap; when the initial level of coordination is high, it may converge to the high-coordination state. This structure provides a path-dependence explanation for the practical phenomenon of “similar policies but markedly different performance.”
Proposition 1 (Coexistence of Multiple Stable States). When Equations (31) and (32) hold simultaneously, system (23) has two asymptotically stable equilibrium points, namely (0, 0, 0) and (1, 1, 1). According to the general theory of continuous dynamical systems, the basins are separated by an invariant basin boundary; in numerical simulations this boundary is operationally referred to as the evolutionary separatrix. When the boundary is generated by the stable manifold of one or more hyperbolic saddle equilibria, it can be interpreted as a saddle-type separatrix.
Under this condition, the system evolution exhibits pronounced path dependence. If the initial coordination level (x(0), y(0), z(0)) lies on the side of the separatrix closer to the origin, the system converges to the low-coordination trap; otherwise, it converges to the high-coordination equilibrium. In other words, under the same set of policy–management parameters, different regions may evolve toward diametrically opposite long-term outcomes solely because of differences in their initial coordination endowments.
Furthermore, when the strict inequalities in Equation (31) or Equation (32) degenerate into equalities, a zero eigenvalue appears and the local stability classification changes; the exact bifurcation type requires additional center-manifold analysis, and the stability structure of the system shifts as the parameters vary continuously. This implies the existence of clear policy thresholds in governance practice. If one-off or short-term policy adjustments fail to cross these thresholds, they will be insufficient to alter the long-term evolutionary direction of the system. Only by continuously strengthening incentives, institutionalizing arrangements, and promoting exemplary demonstrations can the expected collaborative returns of the actors be raised as a whole, thereby systematically shifting the sign structure of the payoff differences ΔπE, ΔπG, and ΔπB in favor of collaboration and truly driving the system across the separatrix.
The above theoretical analysis provides three testable core propositions for the numerical simulations in Section 5. First, under typical low-incentive parameters, it examines whether (0, 0, 0) and (1, 1, 1) can simultaneously constitute ESSs, indicating the coexistence of multiple stable states. Second, when the incentive intensity is increased to a high-incentive scenario, it tests whether the low-coordination equilibrium becomes unstable, thereby making (1, 1, 1) the unique ESS. Third, it assesses whether optimization of frontline micro-level mechanisms can systematically enlarge the basin of attraction of the high-coordination equilibrium by shifting the position of the separatrix.
The incentive structure analyzed above is fully coupled: subsidies and penalties take effect only when the corresponding joint-strategy conditions hold—for example, the enterprise penalty applies only under strong government regulation, and the frontline reward and penalty only when high enterprise collaborative management and strong regulation coincide. A natural question is whether partial coupling—baseline penalties that apply regardless of the regulatory state, or subsidies conditioned on participation alone—would alter the equilibrium structure. Since the replicator dynamics depend only on the payoff differences, such modifications leave the model and its eight pure-strategy equilibria intact and act only by shifting the payoff differences at the corners. A baseline penalty on passive behavior adds a positive term to the relevant payoff difference even at the fully passive state—for instance, a baseline frontline penalty raises and a baseline enterprise penalty raises —which makes the fully non-collaborative equilibrium harder to sustain and, when the baseline penalties are large enough to render these differences positive, removes its stability altogether, so that no low-coordination equilibrium remains. Conditional subsidies act in the same direction by raising the payoff of early collaboration. Partial coupling therefore does not change the qualitative dynamics but shifts the balance toward high coordination.
5. Numerical Simulation and Results Analysis
To verify the conclusions on multistability and path dependence derived from the theoretical analysis in Section 4 and to further characterize the mechanisms through which key incentive–constraint parameters affect the evolutionary trajectories of the system, this section conducts numerical simulations of the tripartite evolutionary game dynamic system in Equation (23). The simulations are organized progressively in terms of parameter settings, scenario evolution, basin-of-attraction characterization, and sensitivity analysis, corresponding respectively to the local dynamics, global robustness, and marginal response characteristics of the system.
5.1. Simulation Design and Parameter Settings
5.1.1. Simulation Tools and Payoff-Difference Functions
The simulations are performed using the ode45 solver in MATLAB R2021b to integrate the system trajectories over the time interval [0, T] with T = 80. The integration tolerances are set to a relative tolerance of 1 × 10⁻⁸ and an absolute tolerance of 1 × 10⁻¹⁰. To maintain an explicit correspondence between the payoff-difference functions and the model parameters, the tripartite net payoff differences ΔπE, ΔπG, and ΔπB are parameterized, based on dynamic system (23), into the specific forms shown in Equation (33):
Equation (33) shows that when the power grid enterprise adopts high collaborative management, it can receive the subsidy RE from the government and avoid the penalty PE, while also paying the performance reward RB to frontline teams that implement tasks conscientiously. When the local government adopts strong regulation–strong incentives, it obtains public benefits from the reduction in society-wide disaster losses but must bear the subsidy expenditure RE and the regulatory cost CG. When frontline teams implement tasks conscientiously, they can receive the reward RB and avoid the penalty PB under the dual incentives of high collaborative management by the enterprise and strong governmental regulation. These settings are consistent with the practical logic of incentive–constraint mechanisms.
5.1.2. Baseline Parameters, Selection Rationale, and Scenario Settings
The numerical simulation uses normalized benchmark parameters rather than empirically calibrated monetary values; its aim is to examine how different incentive–constraint structures shape the evolutionary direction, convergence speed, and basin of attraction of collaborative strategies. This normalization is justified by a scale-invariance property of the dynamics. If all payoff-related parameters——are multiplied by a common positive constant , each payoff difference is multiplied by the same constant, for . Because the replicator equations are , , and , such a rescaling only changes the time unit and leaves the equilibria, their stability, and the basin structure unchanged. What matters is therefore the signs and relative magnitudes of the parameters, which are fixed by the considerations below.
The baseline loss is normalized as , and the mitigation benefits are set as , , . Enterprises and frontline teams act directly on the hazard—through monitoring, inspection, reinforcement, de-icing, and emergency repair—so their mitigation contributions are higher, whereas the government contributes mainly through indirect coordination, regulation, and mobilization; hence . The sum keeps the residual loss positive even under full collaboration, .
The collaborative costs are , , , reflecting the larger resource demands of enterprise investment and frontline execution relative to government coordination. They are chosen so that collaboration is not automatically payoff-dominant under weak incentives: at , the unilateral payoff differences near the fully passive state are so neither enterprises nor frontline teams have a unilateral incentive to act while the others remain passive—the condition that makes a low-coordination trap possible. Conversely, under the strong-incentive settings the subsidies, rewards, and penalties are large enough that strong government regulation, high enterprise collaborative management, and conscientious frontline implementation reinforce one another, so that the fully collaborative equilibrium (1, 1, 1) can also become locally stable; the high-incentive scenarios are constructed accordingly. The disaster probability is set at , representing a medium-to-high risk environment rather than an empirically universal frequency: at this level expected mitigation benefits and collaborative costs are of comparable magnitude, which is the informative regime for threshold effects and multistability, whereas a much lower p makes collaboration generally unattractive and a much higher p makes it almost automatic. The baseline parameters are summarized in Table 3, and the three comparative scenarios in Table 4.
Table 3.
Global baseline parameters and selection rationale.
Table 4.
Parameter Settings under the Three Simulation Scenarios.
The three scenarios correspond to distinct governance mechanisms rather than arbitrary numerical combinations, each satisfying specific payoff-difference conditions. Scenario 1 (low incentives, ) keeps the passive state unattractive, and , while the fully collaborative state remains attractive, , , , producing coexisting low- and high-coordination equilibria and hence path dependence. Scenario 2 (high incentives, , , , ) makes collaboration payoff-superior once regulation or dual incentives are active, with and . Scenario 3 (frontline optimization: reduced from 12 to 8, raised from 0.30 to 0.35, raised from 8 to 10, with adjusted to 0.35 so that ) changes the frontline activation condition: rises from under Scenario 2 to , so frontline teams can be activated by enterprise collaboration alone, before government regulation becomes strong—explaining the faster convergence and larger high-coordination basin. The scenario parameters are listed in Table 4.
5.1.3. Initial Conditions and Evaluation Criteria
To examine path dependence, four representative initial states are used, with the three proportions set jointly at , , , and , spanning low to high initial coordination. A trajectory is taken to converge to the high-coordination equilibrium when , , and all approach , and to the low-coordination equilibrium when they approach . For convergence-speed comparisons, the first time at which a proportion reaches is used as the threshold-hitting time. For basin-of-attraction analysis, an initial state is classified into the high-coordination basin when the terminal state satisfies ; this is an operational classification rule for comparing the global robustness of different mechanisms, not a redefinition of equilibrium stability, and the qualitative ranking of the scenarios does not depend on the specific cutoff.
5.2. Comparison of Evolutionary Paths Under Different Policy Scenarios
This section conducts numerical simulations for the three representative policy scenarios in sequence. Following the analytical logic of critical-threshold verification, simulation results, and mechanism interpretation, it reveals the evolutionary trajectories of the tripartite collaborative strategy proportions under the low-incentive, high-incentive, and frontline mechanism optimization scenarios. On this basis, the pathways through which key incentive parameters affect the evolutionary direction and convergence speed of the system are identified.
5.2.1. Scenario 1: A Low-Incentive Environment with Low Subsidies and Weak Penalties
In Scenario 1, both the governmental fiscal subsidy to enterprises (RE = 2) and the accident penalty (PE = 2) are set at relatively low levels. Similarly, the performance reward (RB = 2) and accountability penalty (PB = 2) imposed by power grid enterprises on frontline teams are also weak. Verification based on Equation (33) shows that when all three actors adopt low-coordination strategies (x, y, z → 0), ΔπE(0, 0) = 0.5 × 0.4 × 30 − 15 = −9 < 0, ΔπG(0, 0) = 0.5 × 20 − 10 = 0, indicating a boundary state, and ΔπB(0, 0) = 0.5 × 0.3 × 30 − 12 = −7.5 < 0. These results indicate that, under low-incentive conditions, collaborative strategies do not provide a net payoff advantage for either enterprises or frontline teams. Consequently, the overall payoff-difference structure of the tripartite game is unfavorable to the diffusion of collaborative strategies.
Figure 1 illustrates the temporal evolution of the enterprise coordination ratio x(t), the government strong-regulation ratio y(t), and the frontline team conscientious-execution ratio z(t) under four sets of initial conditions, thereby facilitating the identification of asynchronous behavioral patterns and path differences among the three actors.
Figure 1.
Scenario 1 (Low-Incentive Environment): Temporal Evolution of the Collaborative Strategy Proportions of the Three Actors.
As shown in Figure 1, under low (0.2, 0.2, 0.2) and medium-low (0.4, 0.4, 0.4) initial coordination levels, the collaborative strategy proportions of all three actors decrease monotonically after short-term fluctuations and gradually approach zero over a longer time horizon. The system consequently converges to the neighborhood of the fully non-collaborative equilibrium (0, 0, 0). This “low-incentive–low-coordination” convergence path indicates that when the overall effectiveness of the incentive–constraint mechanism is insufficient to offset the marginal costs of collaborative inputs for the actors, boundedly rational actors eventually abandon collaborative strategies through dynamic adjustment based on trial and error and imitation, even when disaster risks objectively exist. As a result, the system falls into a Pareto-inferior “low-coordination trap.”
By contrast, under relatively high initial coordination levels, namely (0.6, 0.6, 0.6) and (0.8, 0.8, 0.8), the collaborative strategy proportions of the three actors exhibit an evolutionary tendency to converge toward (1, 1, 1). This finding confirms that, under the parameter settings of Scenario 1, the system has a bistable equilibrium structure in which (0, 0, 0) and (1, 1, 1) coexist, consistent with the theoretical prediction of Proposition 1. The evolutionary direction of the system is highly dependent on the initial coordination level. The evolutionary separatrix is approximately located on the lower-coordination side of the diagonal of the unit cube, and only when the initial coordination levels of all three actors are sufficiently high can the system cross the separatrix and evolve toward the high-coordination equilibrium. This demonstrates pronounced path dependence.
5.2.2. Scenario 2: A High-Incentive Environment with Strong Subsidies and Strong Penalties
In Scenario 2, the government substantially increases the fiscal subsidy to power grid enterprises (RE = 8) and the accident-accountability penalty (PE = 10), while power grid enterprises simultaneously intensify both positive incentives (RB = 8) and negative constraints (PB = 10) for frontline teams. For this parameter set, the key threshold conditions are verified as follows: ΔπE(y = 1, z = 0) = 0.5 × 0.4 × 50 + (8 + 10) − 15 = 13 > 0, indicating that once the government fully adopts strong regulation, enterprises tend to choose high collaborative management regardless of the implementation behavior of frontline teams. Likewise, ΔπB(x = 1, y = 1) = 0.5 × 0.3 × 80 + (8 + 10) – 12 = 18 > 0, indicating that conscientious execution becomes a strictly dominant strategy for frontline teams when both the government and enterprises adopt highly collaborative strategies. Consequently, the fully collaborative equilibrium (1, 1, 1) becomes the unique evolutionarily stable state (ESS).
Figure 2 presents a three-dimensional phase diagram of the system trajectories under four sets of initial conditions, covering the full range from low to high coordination. The trajectory colors gradually transition from low to high initial coordination levels, and the stable equilibrium point (1, 1, 1) is marked with a star symbol.
Figure 2.
Scenario 2 (High-Incentive Environment): Three-Dimensional Phase Diagram of the Tripartite Evolutionary Trajectories.
As shown in Figure 2, under all four sets of initial conditions, all trajectories increase monotonically and converge to the neighborhood of (1, 1, 1) within a finite time, with smooth evolutionary paths and no reversals. This indicates that (0, 0, 0) is no longer a stable equilibrium point. From the perspective of evolutionary game theory, strong subsidies and strong penalties alter the sign structure of the key payoff differences. When the proportion of strong governmental regulation is high, the net payoff of enterprise collaboration becomes positive first, driving an increase in x(t). As x(t) increases, the expected disaster mitigation benefits and incentive gains of frontline teams also rise, causing z(t) to accelerate upward. The substantive disaster mitigation outcomes generated by conscientious implementation by frontline teams further strengthen the legitimacy of continued strong governmental regulation, thereby consolidating y(t). This process forms a positive transmission chain of “government leadership–enterprise follow-up–frontline team response–performance feedback,” which guides the system completely from low coordination to the high-coordination equilibrium.
5.2.3. Scenario 3: Strengthened Frontline Incentives Under an Optimized Coordination Mechanism
In Scenario 3, while maintaining the macro-level incentive and penalty parameters of the government and enterprises (RE = 8, PE = 10, PB = 10) broadly consistent with those in Scenario 2, the model strengthens the intrinsic motivation of frontline teams primarily through two micro-level mechanism optimizations. First, by introducing standardized “one-line, one-strategy” emergency response cards for icing-induced galloping, promoting drone-assisted inspection, and optimizing de-icing operational procedures, the additional implementation cost of frontline teams, CB, is reduced from 12 to 8. Second, by establishing a cross-departmental disaster mitigation performance evaluation system, the disaster mitigation benefit weight of frontline teams, θB, is increased from 0.30 to 0.35, while θE is correspondingly adjusted from 0.40 to 0.35, with the constraint θE + θG + θB = 1 strictly satisfied. In addition, the enterprise reward RB for frontline teams is raised from 8 to 10 to strengthen immediate incentives.
Figure 3 compares, using side-by-side time-series curves, the evolutionary trajectories of the tripartite collaborative strategy proportions in Scenarios 2 and 3 under the same initial condition, (0.2, 0.2, 0.2).
Figure 3.
Comparison of the Evolutionary Rates of the Collaborative Strategy Proportions of the Three Actors in Scenarios 2 and 3 (Initial Condition: (0.2, 0.2, 0.2)).
As shown in Figure 3, under broadly similar macro-level incentive intensities, the collaborative strategy proportions of the three actors in Scenario 3, particularly the frontline team implementation proportion z, increase more rapidly and converge earlier than those in Scenario 2. From the perspective of expected payoff differences, the reduction in CB directly enlarges ΔπB, lowering the critical value of x at which z becomes positive from approximately 0.20 in Scenario 2 to nearly zero. This implies that frontline teams already have an economic incentive to actively participate in coordination even when the enterprise coordination proportion remains low. Moreover, the increase in θB further enhances the efficiency with which disaster mitigation outcomes are translated into benefits for frontline teams. The superposition of these two effects enables positive feedback at the frontline level to propagate more rapidly to the enterprise and government levels, generating an amplification effect of “frontline initiation–whole-chain acceleration.” As a result, the overall convergence speed of the system is significantly higher than that in Scenario 2.
5.3. Cross-Sections and Quantitative Sizes of the High-Coordination Basin of Attraction
The basin of attraction of the high-coordination equilibrium characterizes the global robustness of the coordination mechanism—the range of initial states from which the system evolves toward high coordination without sustained external intervention. By Proposition 1, when and are both asymptotically stable, the unit cube splits into their two basins, separated by the two-dimensional stable manifold of the intermediate saddle, that is, the evolutionary separatrix. To locate the separatrix and measure the basin sizes, we fix , sample a grid of initial states on the – plane, integrate each under system (23) with a fourth-order Runge–Kutta scheme, and assign it to the high-coordination basin when the terminal state satisfies . The separatrix is recovered as the interface between the two basins and refined by bisection along rays from a low- to a high-coordination state; the classification is insensitive to the cutoff over , since every trajectory approaches a vertex.
Figure 4 shows the resulting cross-sections and Table 5 reports the basin sizes. The high-coordination basin grows sharply as incentives and frontline mechanisms strengthen: about 25% of the cross-section in Scenario 1, about 99% in Scenario 2, and about 100% in Scenario 3. In Scenario 1 the separatrix lies in the upper-right of the plane, so high coordination is reached only when the initial enterprise and government levels are jointly high; in Scenario 2 it retreats to a small region in which the enterprise starts highly collaborative while the government remains passive; in Scenario 3 it is pushed into the corner, so for almost any initial state at the system converges to high coordination.
Figure 4.
Comparison of Cross-Sections of the High-Coordination Basin of Attraction across the Three Scenarios (with z0 = 0.5 fixed and a classification threshold of >0.75).
Table 5.
Quantitative size of the high-coordination basin of attraction on the z0 = 0.5 cross-section.
The two effects of mechanism design are therefore distinct. Strengthening macro-level government–enterprise incentives drives the dominant expansion, enlarging the basin from about a quarter of the cross-section to nearly the whole plane between Scenarios 1 and 2; the frontline optimization in Scenario 3 removes the remaining low-coordination region and, consistent with the faster trajectories in Figure 3, also speeds convergence. Because the fractions are measured at , their absolute values depend on the assumed initial frontline level, but the ordering across the three scenarios is preserved on other cross-sections.
5.4. Local Sensitivity Analysis of Key Parameters
To examine how the main conclusions respond to changes in individual control parameters, this subsection conducts a local one-at-a-time sensitivity analysis based on the benchmark parameter set of Scenario 2. Four key variables are selected: the government subsidy , the government penalty , the frontline execution cost , and the frontline benefit-sharing weight , corresponding respectively to positive government incentives, negative government constraints, frontline burden reduction, and frontline benefit allocation.
Figure 5 presents the dynamic effects of these four parameters on z(t) under different value settings.
Figure 5.
Sensitivity Analysis of the Evolution of the Frontline Team Execution Proportion z(t) with Respect to Key Parameters.
The following conclusions can be drawn from Figure 5.
(1) The effect of government subsidy RE on z is indirect and nonlinear. An increase in RE first affects the enterprise’s collaborative decision-making, as ΔπE increases with RE, thereby promoting an increase in x. Through the amplification effect of x, it then indirectly accelerates conscientious implementation by frontline teams. Therefore, the acceleration effect of RE on z exhibits a certain lag. Moreover, once RE exceeds a critical threshold, approximately RE = 8, its marginal benefit tends to saturate. Excessively high RE produces only limited additional acceleration, suggesting that fiscal subsidy expenditure should not be expanded without restraint.
(2) The influence pathway of government penalty PE on z is similar to that of RE, but its effect is more direct and stronger. By imposing strong constraints on low-collaboration enterprises, an increase in PE forces enterprises to shift toward high collaborative management even when their initial willingness to coordinate is low, thereby activating the positive incentive mechanism for frontline teams more rapidly. As shown in Figure 5, when PE increases from 2 to 10, the convergence time of z is shortened by approximately 25–40%, outperforming an equivalent change in RE. This indicates that, under fiscal constraints, strong accountability has higher policy efficiency than strong subsidies.
(3) The execution cost of frontline teams, CB, has the most direct and pronounced effect on z. A reduction in CB directly enlarges ΔπB, shifting the critical point for the increase in z forward. When CB = 6, z begins to rise rapidly and continuously almost from the initial moment, whereas when CB = 16, z remains at a low level for an extended period. This provides direct evidence that burden-reduction measures, such as process standardization and technology empowerment, play a central role in the coordination mechanism and should be regarded as the highest-priority intervention in the design of emergency response mechanisms for icing-induced galloping. Accordingly, CB should be controlled within 10, namely CB ≤ 0.67 CE.
(4) The effect of the frontline team benefit-sharing weight θB is also direct but range-sensitive. When θB is relatively low, below 0.25, frontline teams lack sufficient perceived benefits even under relatively low costs, resulting in a slow increase in z. Once θB exceeds 0.30, its effect becomes increasingly evident. However, an excessively high θB, above 0.40, compresses θE, which may weaken enterprises’ willingness to coordinate and induce structural imbalance. Therefore, the optimization of θB has a reasonable range; it is recommended that θB be maintained between 0.30 and 0.40 and dynamically adjusted according to empirical evaluations of disaster mitigation performance.
To examine sensitivity over wider ranges and across all control parameters, each parameter is varied one at a time over a wide interval around the Scenario-2 baseline, while the remaining parameters are held fixed; for each setting, the volume fraction of initial conditions in the strategy cube that converge to the high-coordination equilibrium is recorded by sampling initial states uniformly. Table 6 summarizes the results, and the analytical corner conditions clarify the underlying mechanism: at the fully passive state the payoff differences reduce to , , and , because the reward and penalty terms are inactive when all actors are passive.
Table 6.
Wider-range one-at-a-time sensitivity of the high-coordination basin volume around the Scenario-2 baseline.
Three patterns emerge. First, the disaster probability p is the most decisive parameter: when p is low the high-coordination equilibrium is essentially unreachable, and when p is high it is reached from almost any initial state, with the switch governed by the government corner condition . Second, the collaboration costs erode the basin monotonically—steeply for near its upper range and steadily for —whereas mainly governs the speed of convergence rather than the size of the basin. Third, among the reward–penalty instruments the enterprise penalty modestly enlarges the basin while the subsidy saturates and the enterprise-funded frontline reward becomes counterproductive at high levels; the frontline penalty and the benefit-sharing split have little effect on the basin volume. These wider-range results are consistent with the trajectory-based findings above and indicate that policy should prioritize raising the perceived disaster probability and reducing collaboration costs, use penalties rather than open-ended subsidies, and avoid over-scaling the enterprise-funded frontline reward.
5.5. Robustness Analysis Under Parameter Variations
5.5.1. Robustness to Disaster-Probability Variation
The disaster probability is varied over , with the remaining parameters kept at their scenario values. When is small, expected mitigation benefits fall and collaborative strategies become less attractive, so the low-coordination equilibrium is harder to escape, particularly in Scenario 1; when is large, the high-coordination basin expands for all three actors. Across the whole range, however, the ranking of the scenarios is preserved: Scenario 1 shows the strongest path dependence and the smallest high-coordination basin, Scenario 2 enlarges that basin through stronger subsidies and penalties, and Scenario 3 enlarges it further and converges fastest through frontline cost reduction and benefit sharing. The conclusion that macro-level incentives and frontline optimization jointly promote stable collaboration is therefore not an artifact of the benchmark ; changing moves the separatrix but not the mechanism.
5.5.2. Robustness to Simultaneous Multi-Parameter Perturbations
For each scenario, 10,000 random parameter sets are generated around the benchmark values. The disaster probability , the mitigation benefits , the costs , and the reward–penalty parameters are independently perturbed within ; the weights are perturbed within with adjusted so that . Sets violating the residual-loss condition are discarded. By the vertex eigenvalue conditions in Section 4, the local stability of and is governed by the signs of the payoff differences at these corners, so five sign indicators are evaluated for each parameter set:
Here measures whether enterprises and frontline teams lack unilateral incentives near the passive state, whether the fully collaborative equilibrium remains locally stable, whether strong government regulation activates enterprise collaboration, whether enterprise collaboration alone activates frontline implementation, and whether dual government–enterprise incentives activate it. The frequencies with which each indicator holds are reported in Table 7.
Table 7.
Robustness results under simultaneous ±20% multi-parameter perturbations.
The perturbation results yield three findings. First, in Scenario 1 the passive state remains unattractive for unilateral deviations in essentially all parameter sets (), while the fully collaborative equilibrium is stable in a large share of them (), so the coexistence of low- and high-coordination equilibria is structural, not a numerical coincidence. Second, in Scenario 2 the fully collaborative equilibrium is stable in every sampled set and strong regulation always activates enterprise collaboration (), confirming the robustness of the strong-incentive conclusion. Third, the main difference between Scenarios 2 and 3 lies in frontline activation: enterprise collaboration alone rarely suffices under Scenario 2 () but usually does under Scenario 3 (), showing that reducing and strengthening and make frontline activation substantially more robust, not merely faster. Overall, the qualitative conclusions do not depend on a single parameter setting; numerical thresholds such as , , , or are normalized levels under the benchmark model rather than universal policy standards.
5.6. Comparison with the 2008 Disaster
The simulations reveal low-coordination traps, path dependence, basin-threshold effects, and acceleration through frontline optimization. The 2008 disaster described in Section 2.4 offers a natural point of comparison for these mechanisms; Table 8 places the observed emergency-response patterns alongside the corresponding model components.
Table 8.
Comparison between observed emergency-response patterns in the 2008 disaster and the model mechanisms.
The low-incentive scenario corresponds to settings in which coordination duties exist but incentives, resources, and execution capacity are insufficient, mirroring the slower recovery of weaker local and rural systems in 2008. The high-incentive scenario corresponds to strong governmental command, mobilization, and accountability reshaping enterprise payoffs, as in the emergency command systems and explicit reconstruction responsibilities of that period. The frontline-optimization scenario corresponds to the post-disaster improvements in monitoring, de-icing, and inspection. The separatrix, in turn, has a practical reading as a critical level of organizational readiness and frontline capacity, below which recovery tends to be slow and passive and above which coordination becomes self-reinforcing. This comparison is qualitative—the model parameters remain nondimensional benchmarks—but it indicates that the structure and mechanisms of the model are consistent with the patterns observed in a major icing disaster.
5.7. Results Analysis and Discussion
Based on the theoretical stability analysis, scenario simulations, basin-of-attraction comparison, local sensitivity analysis, and robustness tests, the collaborative emergency response system for transmission lines under icing-induced galloping disasters exhibits pronounced nonlinear evolution, threshold effects, and path dependence. The robustness analysis further confirms that the main conclusions are not artifacts of a single nondimensional benchmark parameter set; rather, they reflect stable structural relationships among disaster mitigation benefits, collaborative costs, reward–penalty mechanisms, and frontline implementation incentives. To facilitate the transition of the governance model from passive emergency response to proactive and stable coordination, systematic mechanism-design recommendations are proposed from the following four dimensions.
(1) Strengthen macro-level government–enterprise incentive constraints to break the low-coordination trap. The comparison between Figure 1 and Figure 2 shows that, in high-risk areas prone to icing-induced galloping, technical standards and corporate social responsibility alone are insufficient to sustain long-term collaborative emergency response. Figure 4 further shows that, in Scenario 1, approximately 75% of the initial-condition region lies within the low-coordination basin of attraction, implying that, in practical settings lacking strong intervention, collaborative emergency response in most regions will naturally evolve toward a non-collaborative equilibrium. Therefore, local governments should play a leading role by not only increasing fiscal subsidies for power grid enterprises’ proactive investments in online icing monitoring and de-icing devices, with RE ≥ 8 recommended, but also establishing a stringent post-disaster accident traceability and accountability mechanism, with PE ≥ 10 recommended. These measures can alter the sign structure of the payoff matrix in the government–enterprise game and externally inject the initial momentum needed to break the low-level equilibrium.
(2) Shift micro-level support downward to reduce burdens and improve frontline efficiency, thereby bridging the “last mile” of emergency response. Figure 3 and Figure 5 jointly reveal the bottleneck effect of frontline implementation costs on global system-wide coordination. The sensitivity analysis indicates that CB is the variable among the four parameters that has the most direct influence and the largest marginal effect on the evolution of z. Accordingly, the operation and maintenance management of power grid enterprises should vigorously promote standardized “one-line, one-strategy” emergency response cards, replace high-risk manual climbing with drone-based inspections, optimize de-icing operational procedures, and establish standardized emergency response information systems. These measures can help control CB within a reasonable range and use the rapid increase in the frontline coordination proportion to reversely drive enterprises and governments toward a stable high-coordination state.
(3) Optimize the explicit evaluation of disaster mitigation benefits and establish a reasonable benefit-sharing system. Figure 5 shows that θB has a significant acceleration effect on z within the range of 0.30–0.40, but its adjustment must also account for its impact on θE. It is recommended that a cross-departmental comprehensive evaluation platform for icing-related transmission line losses and disaster mitigation performance be established to make implicit mitigation benefits explicit. These benefits should then be translated into public safety performance assessments for governments, power supply security indicators for enterprises, and performance bonuses for frontline teams. This would ensure that θB remains no lower than 0.30, enabling frontline personnel to perceive the quantifiable positive economic feedback generated by conscientious implementation and thereby strengthening the interest-based foundation of tripartite coordination.
(4) Seize the initial window for policy intervention to cross the critical threshold of multistability. The basin-of-attraction structure revealed in Figure 4 indicates that, in both Scenarios 1 and 2, the system exhibits a distinct evolutionary separatrix. If the initial coordination level fails to cross this separatrix, the system will spontaneously slide toward the low-coordination equilibrium, and routine management alone will be unable to reverse this evolutionary trend. Therefore, managers must carefully seize the initial window before the peak disaster season or during the early stage of mechanism implementation. Through concentrated interventions, such as establishing cross-departmental joint-drill pilots, setting up special rewards for disaster-prevention equipment, and organizing emergency response competitions for icing-induced galloping, the initial coordination proportions of the three actors should be rapidly raised above the threshold required to cross the evolutionary separatrix, which corresponds to approximately x, y > 0.35 in Scenario 2. The basin-expansion results in Scenario 3 show that once the frontline incentive mechanism is in place, this threshold can be further reduced to x, y > 0.15, substantially lowering the difficulty of initiating coordination. The construction of the coordination mechanism can then enter a virtuous cycle in which mechanisms consolidate outcomes and outcomes, in turn, reinforce mechanisms.
A related question is how a system already in the low-coordination state can escape it. Within the present model there are two routes: a one-time increase in initial coordination that moves the state across the separatrix, and a strengthening of incentives that enlarges the high-coordination basin and, for sufficiently strong incentives, eliminates the low-coordination equilibrium altogether. Both routes require an external push, because the model treats the disaster probability and the mitigation benefits as fixed. An endogenous alternative is disaster-driven learning: as actors experience repeated icing losses, their perceived disaster probability and perceived mitigation benefits rise, which increases the payoff differences—in particular at the fully passive state, where and become less negative and may turn positive. Once perceived risk or benefits cross these levels, the fully non-collaborative equilibrium loses stability and the system can leave the low-coordination trap without a one-time external intervention, consistent with the model’s comparative statics, in which a higher perceived disaster probability or mitigation benefit enlarges the high-coordination basin. Endogenizing and the mitigation benefits through such a learning process—letting them adjust in response to recent disaster losses—is a natural extension of the present model and a useful direction for future work.
6. Conclusions
To address the limitation that existing studies on icing-induced galloping disasters of transmission lines emphasize technical disaster prevention while paying insufficient attention to multi-actor coordination mechanisms, this study incorporates the frontline implementation terminal into the analytical framework. Taking collaborative emergency response for transmission lines under icing-induced galloping disasters as the research object, a tripartite evolutionary game model is developed involving local governments, the operation and maintenance management of power grid enterprises, and frontline maintenance teams. On the basis of defining collaborative input costs, disaster mitigation benefit allocation, and multi-level incentive–penalty structures, the tripartite replicator dynamic equations and local stability conditions are derived. Numerical simulations are then conducted to analyze the effects of key policy parameters on the evolutionary trajectories of the system and the basins of attraction of equilibria. The main conclusions are as follows.
(1) The collaborative emergency response system exhibits pronounced multistability and path dependence. Under bounded rationality and incomplete information, the emergency decisions of the three actors constitute a dynamic adjustment process driven by payoff feedback. Theoretical analysis shows that, within certain parameter ranges, the fully non-collaborative equilibrium (0, 0, 0) and the fully collaborative equilibrium (1, 1, 1) can both remain locally asymptotically stable. Numerical simulations further indicate that, under the low-incentive scenario, the basin of attraction of the high-coordination equilibrium is relatively small, and the evolutionary direction of the system is highly dependent on the initial coordination level. Without early-stage intervention to cross the evolutionary separatrix, the system may remain locked into the low-coordination trap over the long term. This finding provides an endogenous explanation for the regional divergence observed in practice, where similar policies lead to markedly different performance outcomes.
(2) At the macro level, the combination of “strong governmental regulation–strong incentives plus high collaborative enterprise management” is an important mechanism for enabling the system to move beyond inefficient equilibria. Under the nondimensional simulation parameters specified in this study, increasing government subsidies and accident-accountability intensity can alter the net payoff structure of enterprise collaborative management, promote an increase in the proportion of enterprises adopting high collaborative management, and further activate conscientious implementation by frontline teams. The sensitivity analysis shows that, under equivalent resource constraints, strong accountability has higher marginal policy efficiency than subsidies alone and can drive the frontline implementation proportion to converge to a high level more rapidly. It should be emphasized that thresholds such as RE and PE are derived from the parameterized simulation settings of this study and should not be directly regarded as universally applicable policy standards. In practical applications, they should be calibrated according to regional disaster probabilities, transmission line importance, and historical loss data.
(3) Optimization of frontline implementation mechanisms is a critical fulcrum for achieving stable coordination. Whether macro-level policies can be translated into actual emergency response performance depends on whether frontline teams can implement tasks such as inspection and reinforcement, information reporting, de-icing, and on-site emergency repair with high quality. The simulation results show that reducing the frontline team execution cost CB has the most direct effect on z(t), while moderately increasing the frontline disaster mitigation benefit weight θB can further strengthen the endogenous motivation for conscientious implementation. However, under the constraint θE + θG + θB = 1, an increase in θB compresses the benefit shares of the other actors. Therefore, strengthening frontline incentives must be premised on not weakening enterprises’ willingness to make forward-looking disaster-prevention investments and adopt high collaborative management. A more appropriate approach is not simply to increase the distribution proportion, but rather to reduce implementation costs and expand the total distributable disaster mitigation benefits through explicit evaluation of mitigation benefits, process standardization, drone-based inspections, and digital emergency response platforms.
(4) The mechanisms identified by the model align with observed practice. The 2008 disaster shows that large-scale transmission-line icing involves not only physical damage to towers, conductors, and substations but also coordination among governments, enterprises, and frontline teams; the slower recovery of weaker grids parallels the low-coordination trap, and the post-disaster strengthening of monitoring, de-icing, and inspection parallels the frontline-optimization mechanism. This correspondence supports interpreting the model as a practically grounded framework for collaborative emergency response, while empirical calibration of the parameters with regional data remains future work.
These findings provide practical implications for emergency governance in regions frequently affected by icing-induced galloping disasters. First, during the initial stage of coordination mechanism construction, concentrated interventions, such as joint-drill pilots, special equipment subsidies, and emergency response competitions, should be adopted to enhance the initial coordination levels of the three actors and help the system cross the evolutionary separatrix. Second, during the routine operation stage, strong accountability should be combined with moderate subsidies to form the institutional backbone of government–enterprise coordination, with particular emphasis on addressing the weakness of insufficient accountability for low-collaboration behavior. Third, during the mechanism-deepening stage, the focus should be shifted downward toward burden reduction, efficiency improvement, and explicit benefit evaluation at the frontline level. Measures such as standardized response cards, drone-based inspections, optimization of de-icing procedures, and cross-departmental disaster mitigation evaluation platforms should be implemented to activate the endogenous coordination motivation of frontline teams, enabling the collaborative emergency response system to gradually shift from policy-driven operation to mechanism-based self-consistency.
This study still has several limitations. First, the model adopts a binary strategy setting to highlight the core conflict, but it does not yet capture the continuous variation and gradual adjustment of coordination levels. Future research could extend the model to continuous-strategy or multi-stage discrete-strategy frameworks. Second, this study treats parameters such as disaster probability, disaster mitigation benefits, and implementation costs as exogenous constants. In practice, however, these parameters may change dynamically with disaster evolution, seasonal variation, and technological progress. Subsequent studies could introduce stochastic disturbances, time-varying parameters, or context-dependent functions. Third, although the model is now grounded qualitatively in the 2008 southern China ice disaster (Section 2.4 and Section 5.6) and its conclusions are shown to be robust to parameter variation (Section 5.5), its parameters remain normalized theoretical values rather than empirically calibrated estimates, and the case comparison is qualitative rather than a statistical validation. Numerical thresholds such as subsidy intensity, penalty intensity, frontline execution cost, and benefit-sharing weights should therefore be read as relative benchmark levels within the model rather than directly applicable policy standards. A full empirical calibration and historical validation would require, in particular: (i) icing- and galloping-disaster archives for icing-prone provinces such as Hunan, Guizhou, Hubei, Jiangxi, and Guangxi over a recent multi-year period (e.g., 2015–2024), including disaster frequency, severity, and associated power-supply losses, to estimate the disaster probability p and the mitigation benefits ΔLE, ΔLG, ΔLB; (ii) power-grid investment and operation records—anti-icing and de-icing equipment, monitoring and early-warning systems, and emergency-reserve expenditures—to estimate the collaborative costs CE, CG and the subsidy and penalty parameters RE, PE; and (iii) frontline operation-and-maintenance cost data—labor, equipment, de-icing workload, and emergency-repair logs—to estimate the frontline execution cost CB and the reward–penalty parameters RB, PB. Combined with meteorological records, such data would allow the parameters to be calibrated and the model’s predictions to be validated against observed emergency-response outcomes, further improving its external validity and policy applicability.
Author Contributions
Investigation, Validation, Data curation, Supervision, Software, Funding acquisition, J.W. and Z.L.; Visualization, Methodology, Y.L.; Writing—Original draft, Conceptualization, M.W.; Project administration, Resources, X.C. All authors have read and agreed to the published version of the manuscript.
Funding
This research was funded by the State Grid Corporation Headquarters Science and Technology Project, Project No.: 5500-202424166A-1-1-ZN.
Data Availability Statement
No empirical datasets were generated or analyzed in this study; the source code used to perform the simulations and to compute the basin-of-attraction, sensitivity, and robustness results is available from the corresponding author on reasonable request.
Conflicts of Interest
Jinyu Wang, Zhe Li, and Yun Liang are employees of the Electric Power Research Institute of State Grid Henan Electric Power Company. This research was supported by the State Grid Corporation Headquarters Science and Technology Project (Project No. 5500-202424166A-1-1-ZN). Menglong Wu and Xiaoming Chuai are affiliated with Henan Polytechnic University and participated in this collaborative research project. The authors declare that there are no other known conflicts of interest related to this work.
Abbreviations
The following abbreviations are used in this manuscript:
| ESS | Evolutionarily stable strategy |
| O&M | Operation and maintenance |
| G | Local governments |
| E | Operation and maintenance management of power grid enterprises |
| B | Frontline maintenance teams |
References
- Niu, T.; Huang, Q.; Fang, S.; Chen, G.; Liao, R. Resilient planning for high-renewable-integrated transmission systems under the impacts of ice storm disasters. IET Renew. Power Gener. 2024, 18, 1091–1105. [Google Scholar] [CrossRef] [Scilit]
- Dikshit, S.; Alipour, A. Characterizing probability of failure of transmission tower systems under multiple climatic hazards: Wind and ice. Eng. Struct. 2025, 342, 120720. [Google Scholar] [CrossRef] [Scilit]
- Dong, B.; Jiang, X.; Yin, F. Development and prospect of monitoring and prevention methods of icing disaster in China power grid. IET Gener. Transm. Distrib. 2022, 16, 4480–4493. [Google Scholar] [CrossRef] [Scilit]
- Lu, J.; Guo, J.; Xu, X.; Yang, L. Long-term forecast method for ice disasters on power grids. Cold Reg. Sci. Technol. 2018, 155, 108–119. [Google Scholar] [CrossRef] [Scilit]
- Meng, X.; Tian, L.; Liu, J.; Jin, Q. Failure prediction of overhead transmission lines incorporating time series prediction model for wind-ice loads. Reliab. Eng. Syst. Saf. 2025, 259, 110927. [Google Scholar] [CrossRef] [Scilit]
- Nusantika, N.R.; Xiao, J.; Hu, X. Precision ice detection on power transmission lines: A novel approach with multi-scale retinex and advanced morphological edge detection monitoring. J. Imaging 2024, 10, 287. [Google Scholar] [CrossRef] [Scilit] [PubMed]
- Al-Shetwi, A.Q.; Atawi, I.E.; El-Hameed, M.A.; Abuelrub, A. Digital twin technology for renewable energy, smart grids, energy storage and vehicle-to-grid integration: Advancements, applications, key players, challenges and future perspectives in modernising sustainable grids. IET Smart Grid 2025, 8, e70026. [Google Scholar] [CrossRef] [Scilit]
- Jafarishiadeh, F.; Mohammadi, F.; Sahraei-Ardakani, M. Preventive dispatch for transmission de-icing. IEEE Trans. Power Syst. 2020, 35, 4104–4107. [Google Scholar] [CrossRef] [Scilit]
- Liu, L.; Wang, H.; Li, J.; Ren, X. DSRR model for safety vulnerability assessment of power grid infrastructure in Henan Province China. Sci. Rep. 2025, 15, 29283. [Google Scholar] [CrossRef] [Scilit] [PubMed]
- Qarahasanlou, A.N.; Barabady, J.; Barabadi, A. Atmospheric ice accretion emergency events management: Power distribution networks. Results Eng. 2025, 27, 106162. [Google Scholar] [CrossRef] [Scilit]
- Tao, R.; Zhao, D.M.; Wang, H.X.; Xia, X. Multi-stage defender-attacker-defender model for distribution system resilience enhancement in ice storms with line hardening, mobile device and repair crew dispatching. CSEE J. Power Energy Syst. 2023, 9, 1103–1118. [Google Scholar] [CrossRef] [Scilit]
- Shen, X.; Tang, J.L.; Zhang, Y.J.; Qian, B.; Li, J.H.; Zhou, M.; Zhao, Y.T.; Yin, Y.J. Dynamic evolution game strategy of government, power grid, and users in electricity market demand-side management. Mathematics 2024, 12, 3249. [Google Scholar] [CrossRef] [Scilit]
- Fan, R.; Wang, Y.; Lin, J. Study on multi-agent evolutionary game of emergency management of public health emergencies based on dynamic rewards and punishments. Int. J. Environ. Res. Public Health 2021, 18, 8278. [Google Scholar] [CrossRef] [Scilit] [PubMed]
- Guo, S.; Feng, W.; Zhang, G.; Wen, Y. Evolutionary game analysis of government–enterprise collaboration in coping with Natech risks. Systems 2024, 12, 275. [Google Scholar] [CrossRef] [Scilit]
- Cheng, L.F.; Yu, F.; Huang, P.R.; Liu, G.Y.; Zhang, M.Y.; Sun, R.B. Game-theoretic evolution in renewable energy systems: Advancing sustainable energy management and decision optimization in decentralized power markets. Renew. Sustain. Energy Rev. 2025, 217, 115776. [Google Scholar] [CrossRef] [Scilit]
- Su, C.; Xu, Z.; Wang, X.P.; Li, B. Research on the co-evolution mechanism of electricity market entities enabled by shared energy storage: A tripartite game perspective incorporating dynamic incentives/penalties and stochastic disturbances. Systems 2025, 13, 817. [Google Scholar] [CrossRef] [Scilit]
- Nan, R.; Chen, J.; Zhu, W. Evolutionary game analysis of multiple subjects in the management of major public health emergencies. Heliyon 2024, 10, e29823. [Google Scholar] [CrossRef] [Scilit] [PubMed]
- Hu, W.; Ma, F.; Li, T. An evolutionary game and simulation study of work safety governance and its impact on long-term sustainability under the supervisory system. Sustainability 2025, 17, 566. [Google Scholar] [CrossRef] [Scilit]
- Çelik, M.Z.; Sağlam, Ş.; Oral, B. Transmission Line Failures Due to High-Impact, Low-Probability Meteorological Conditions. Appl. Sci. 2025, 16, 379. [Google Scholar] [CrossRef] [Scilit]
- Liu, H.W.; He, P.; Lu, Z.; Li, J.; Lu, Z.; Jia, J. Research on probabilistic inference methods for power grid icing risk assessment: A systematic analysis incorporating ultra-high voltage line ratios. Front. Energy Res. 2025, 13, 1618421. [Google Scholar] [CrossRef] [Scilit]
- Wang, L.; Chen, Z.; Zhang, W.; Lu, Z.; Cheng, Y.; Qu, X.; Gul, C.; Yang, Y. The causes and forecasting of icing events on power transmission lines in southern China: A review and perspective. Atmosphere 2023, 14, 1815. [Google Scholar] [CrossRef] [Scilit]
- He, J.; Duan, W.; Zhou, Y.; Su, Y. Impact of media information on social response in disasters: A case study of the freezing-rain and snowstorm disasters in southern China in 2008. Int. J. Disaster Risk Sci. 2024, 15, 73–87. [Google Scholar] [CrossRef] [Scilit]
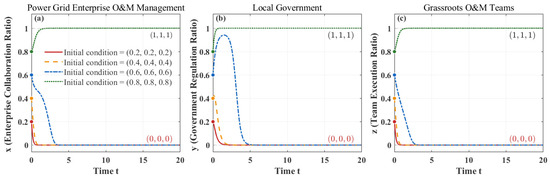
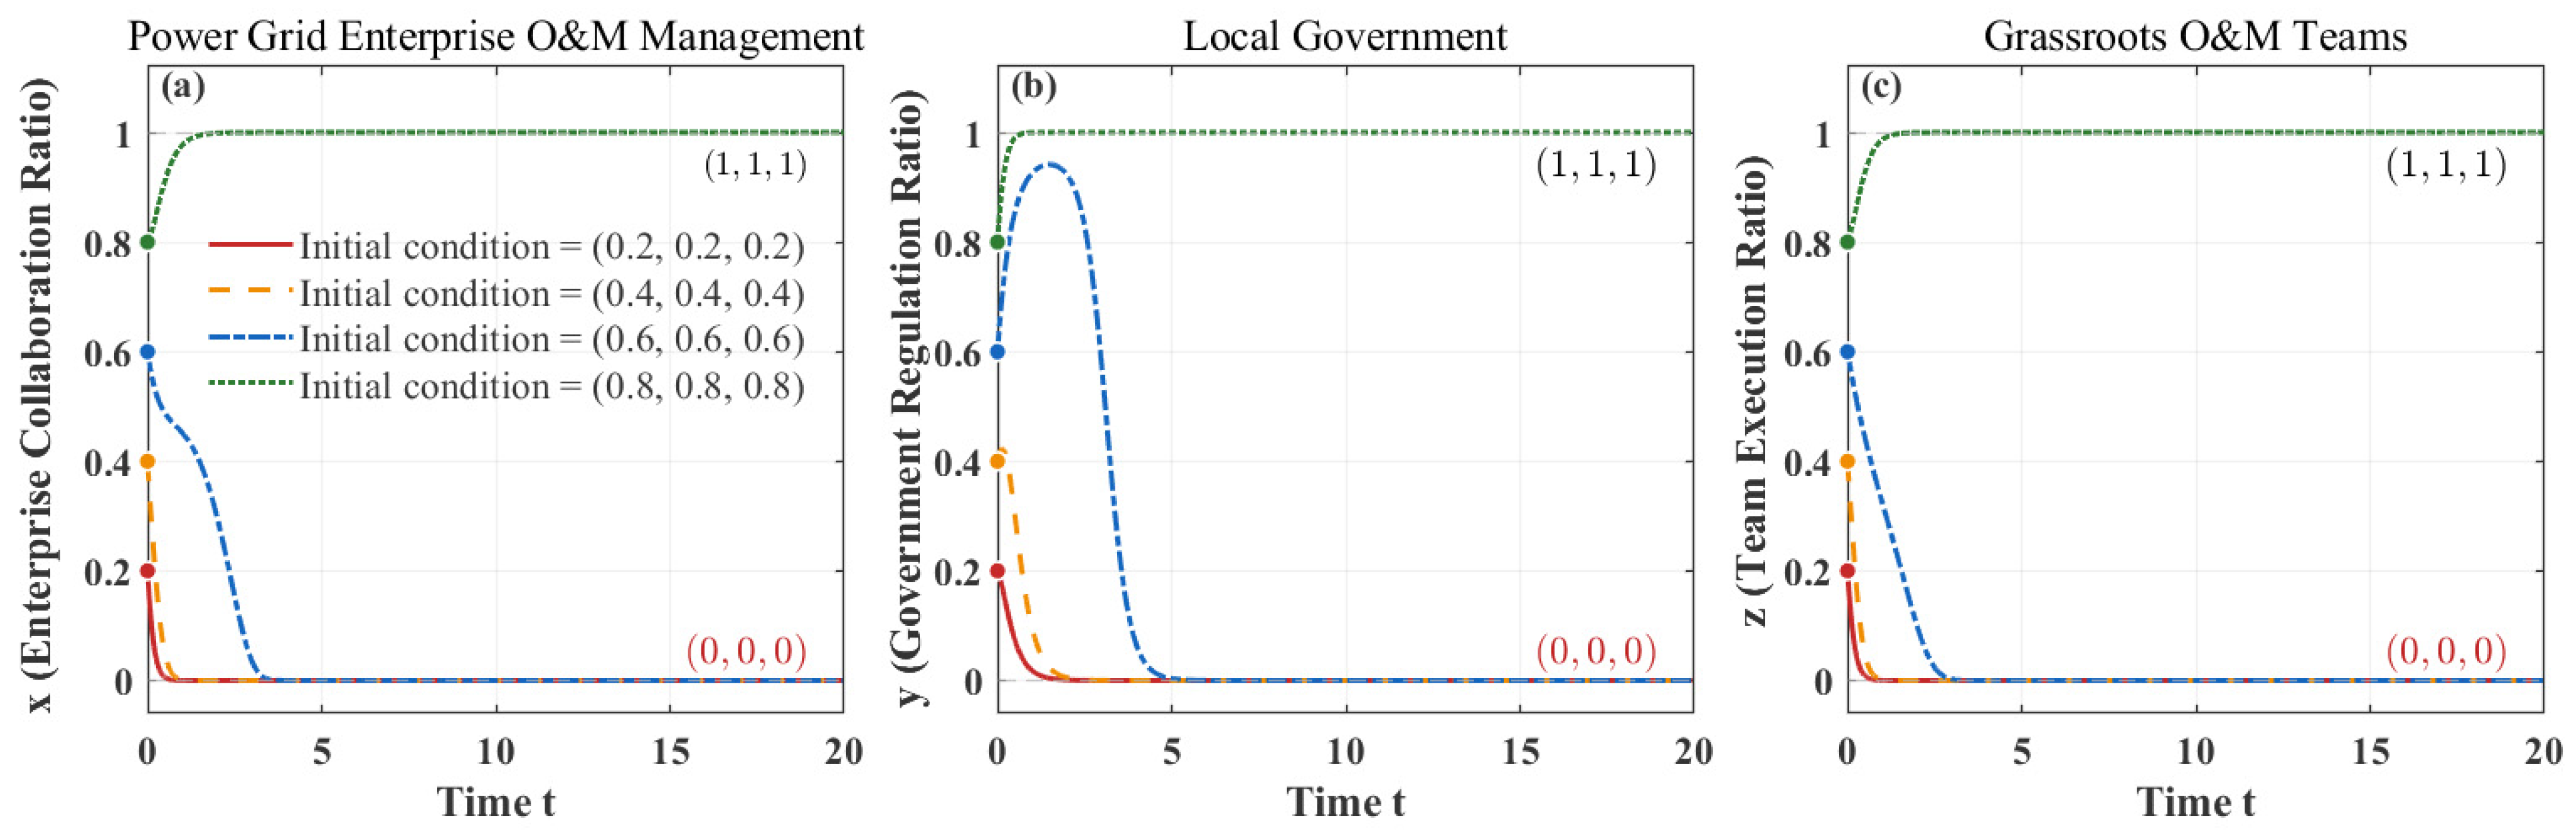
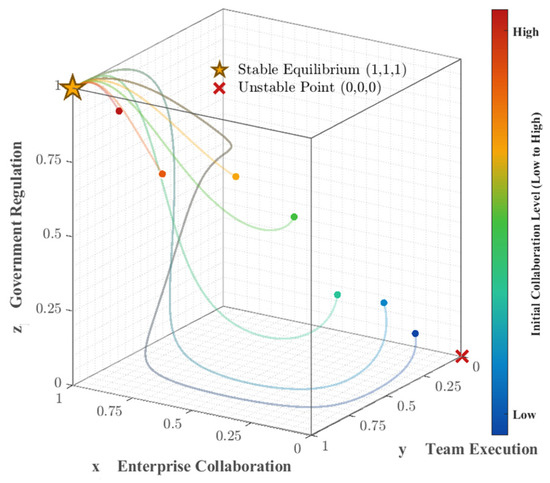
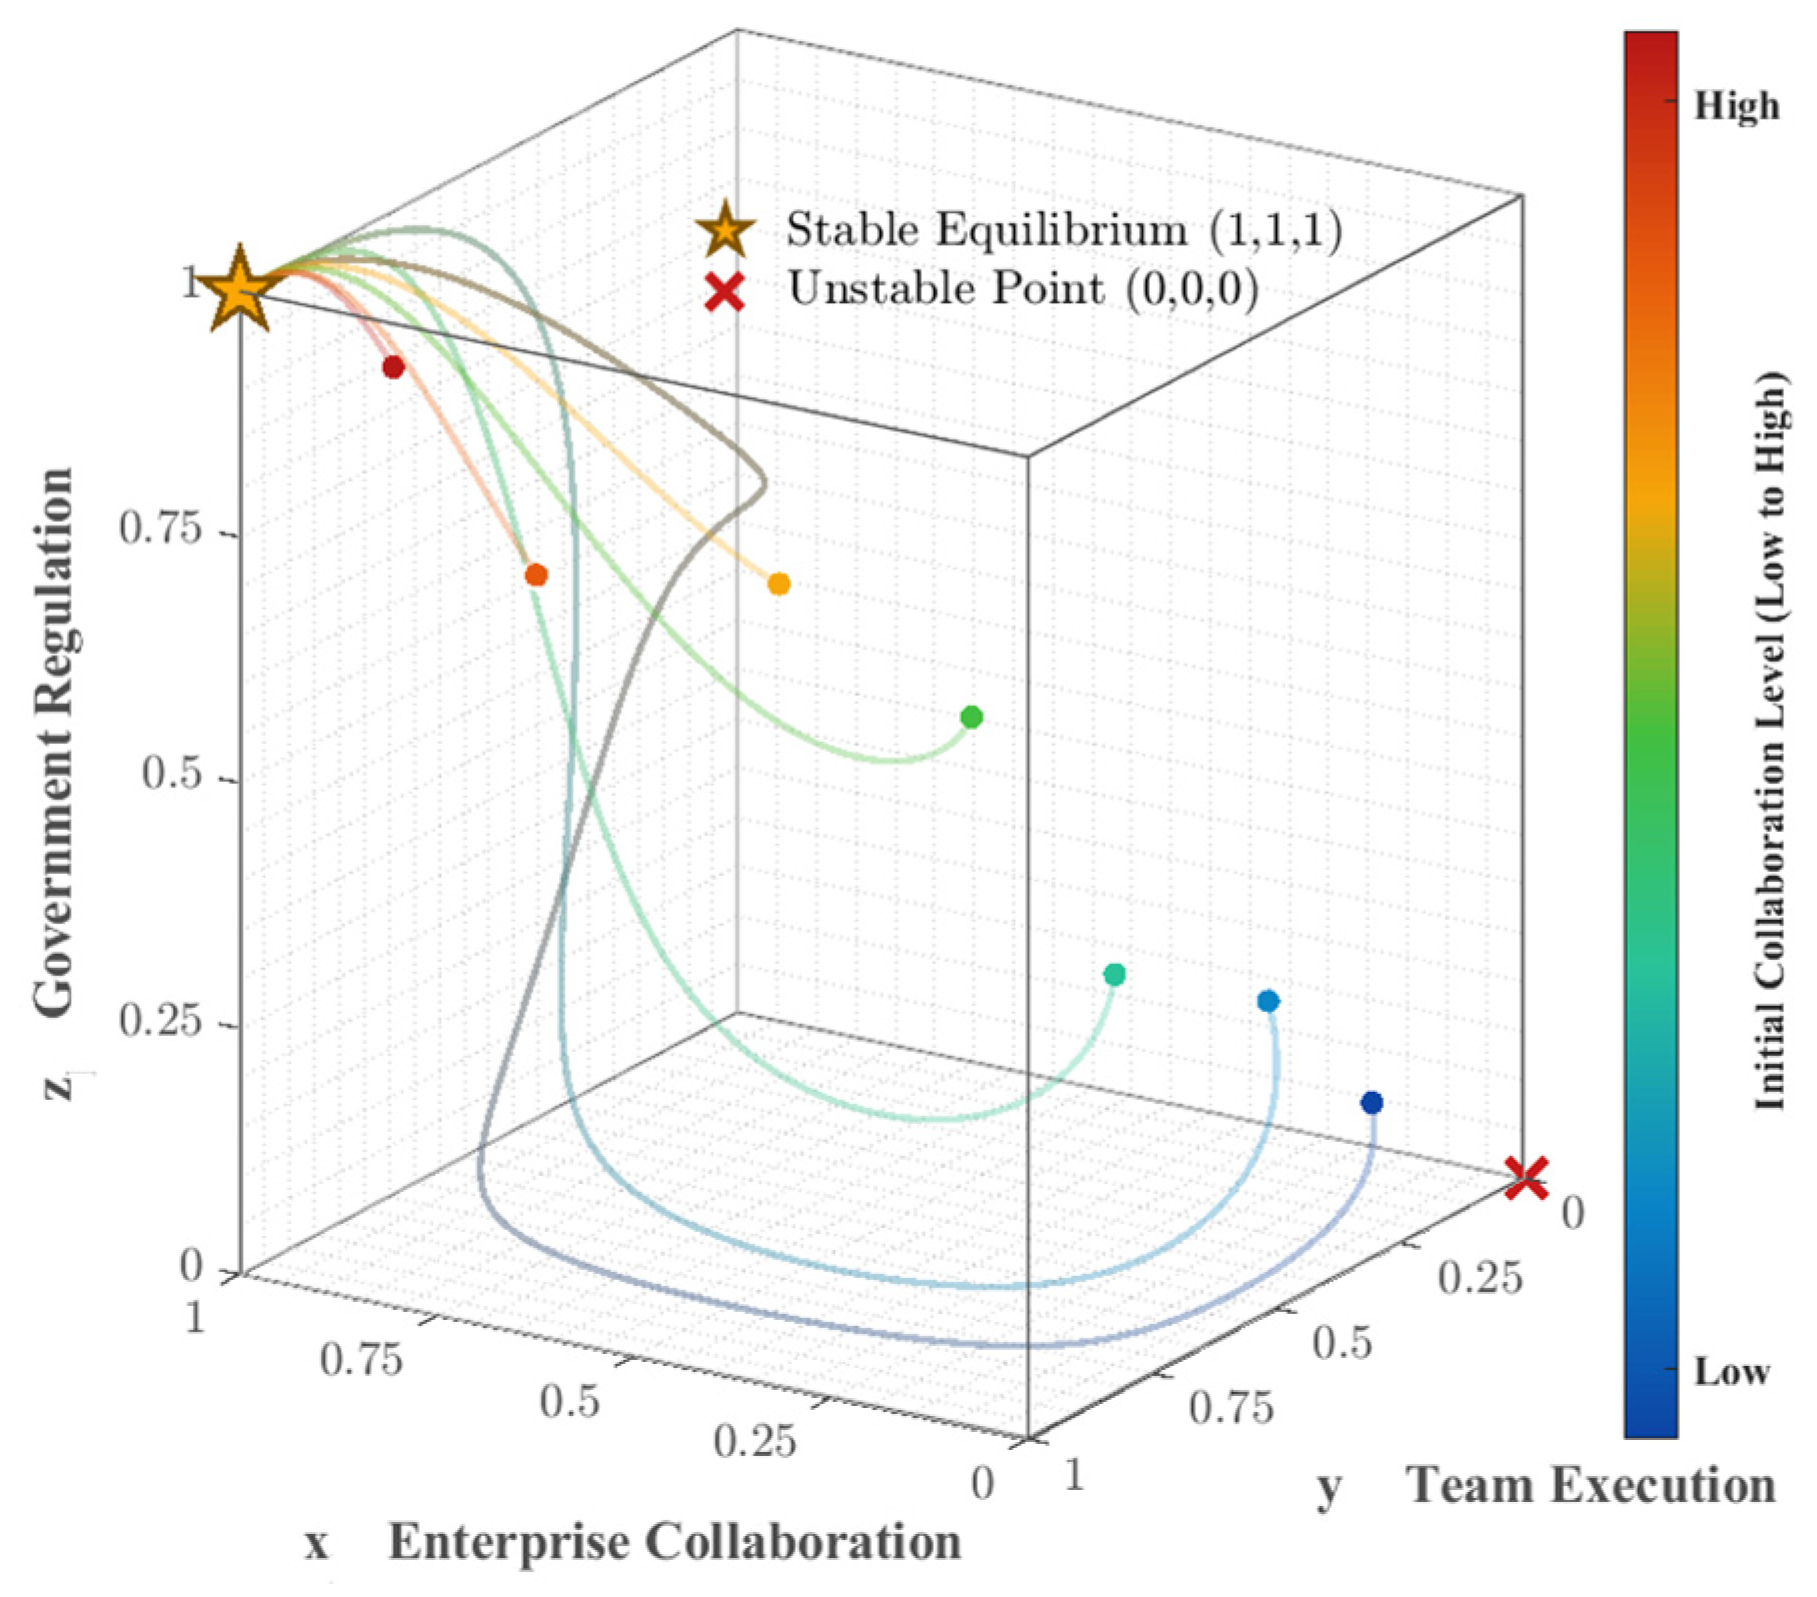
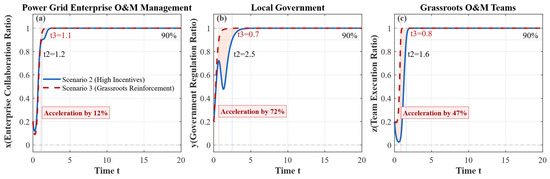
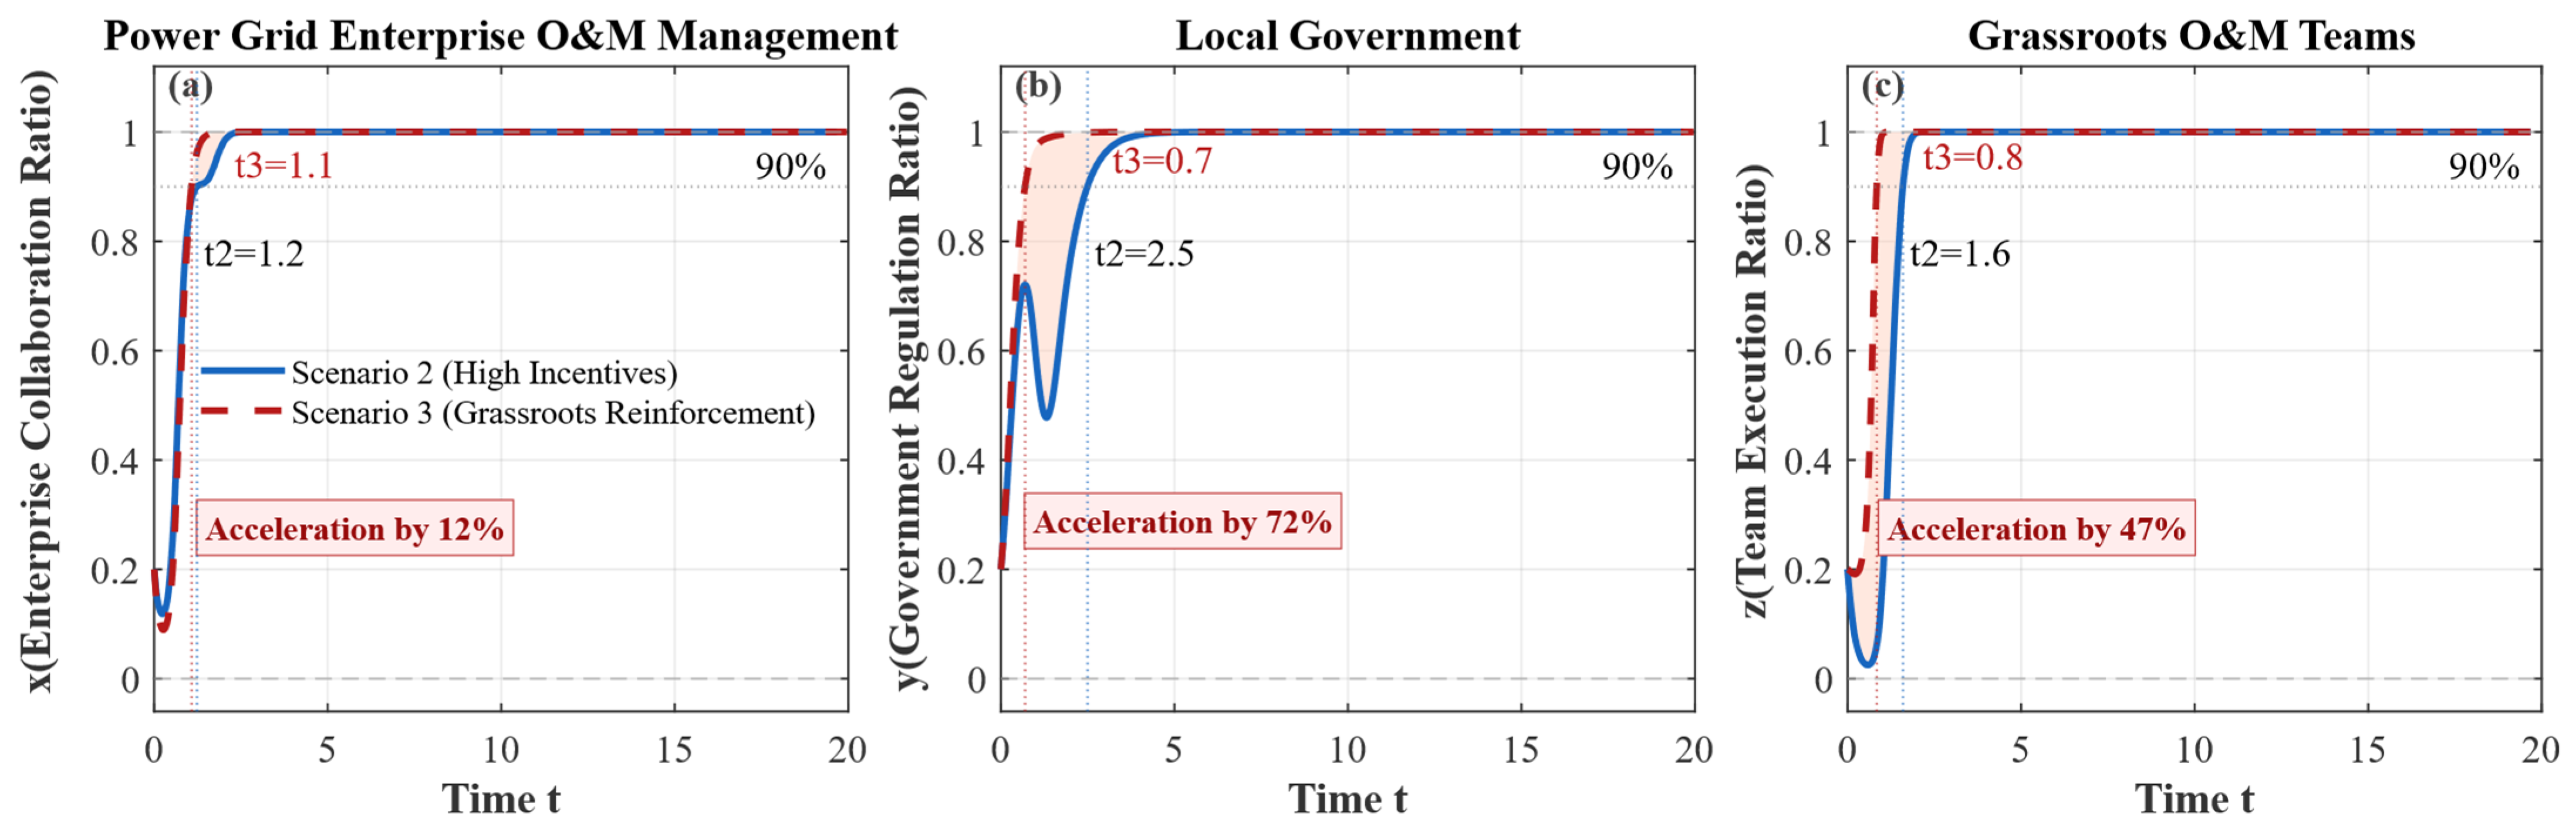
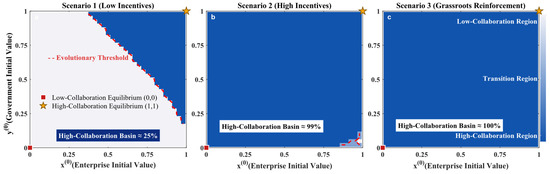
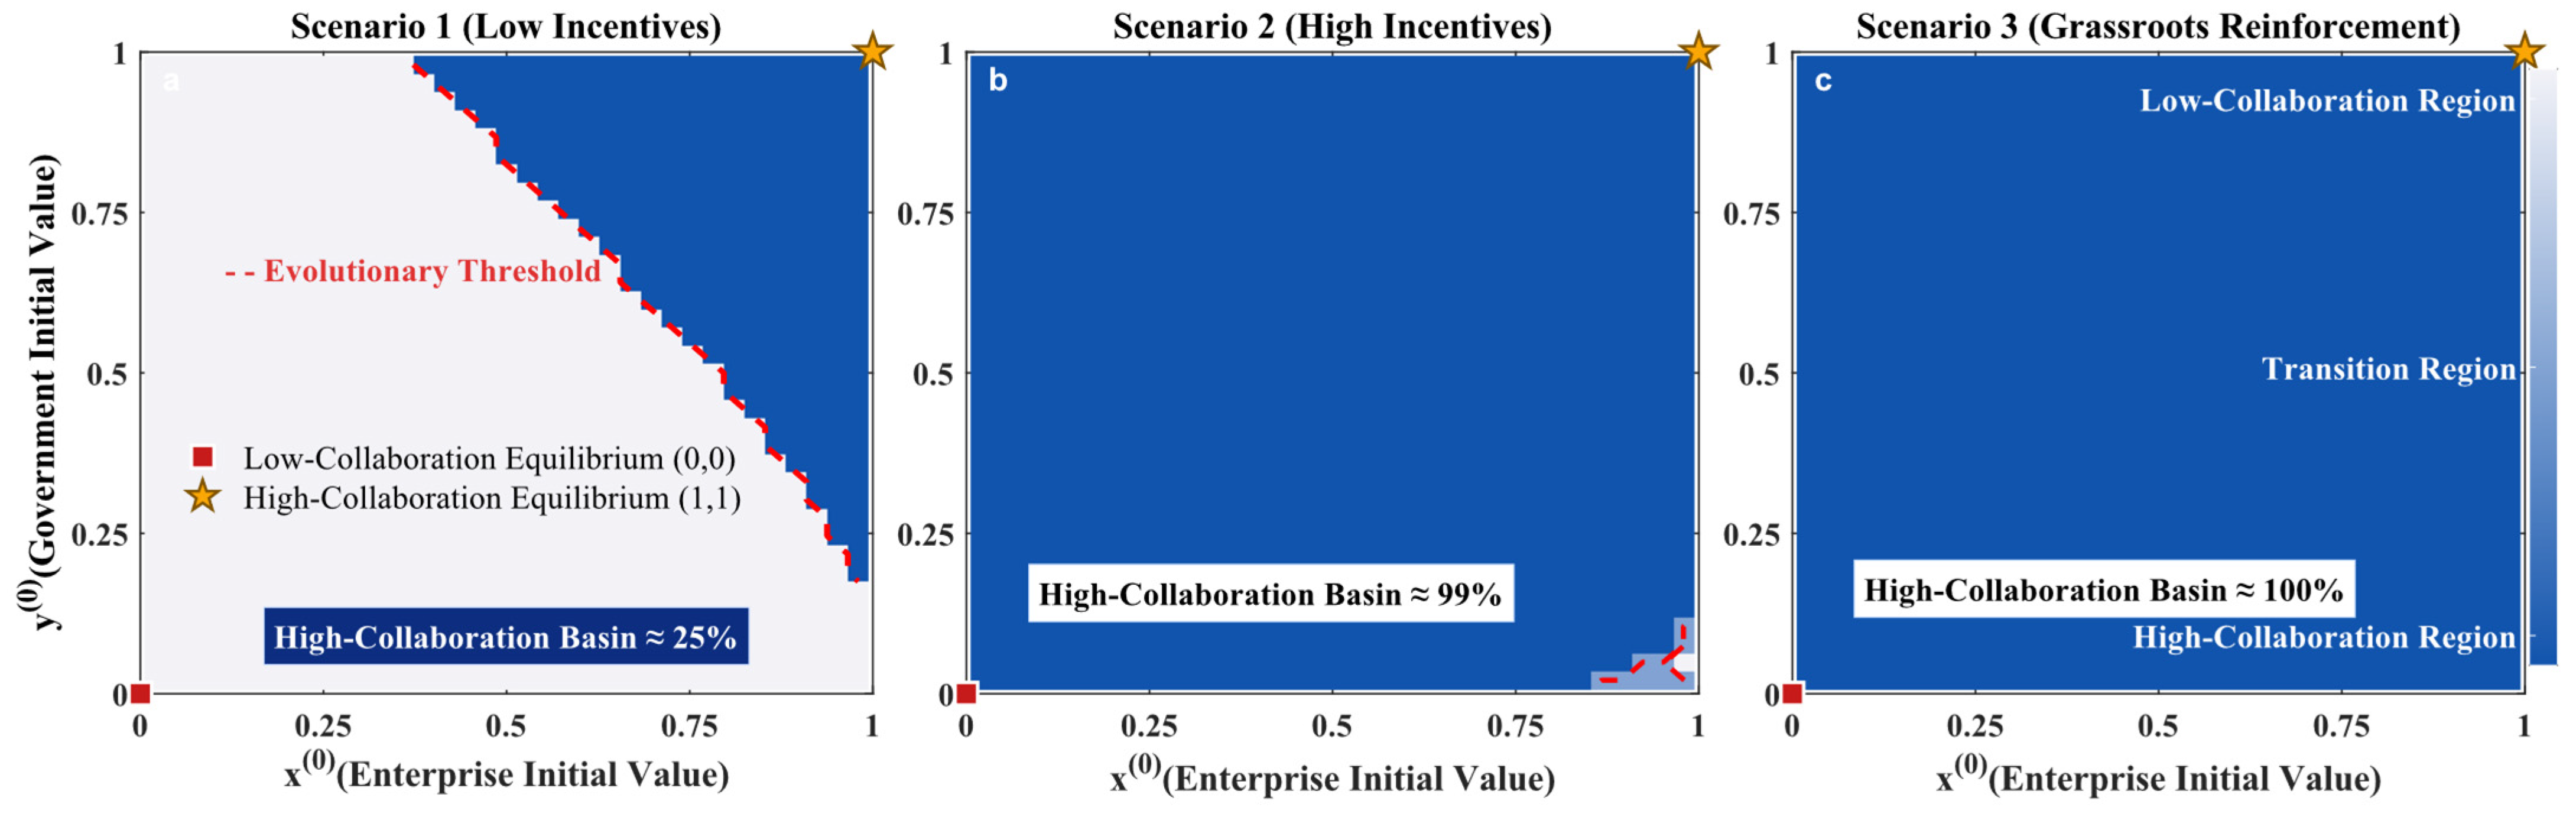
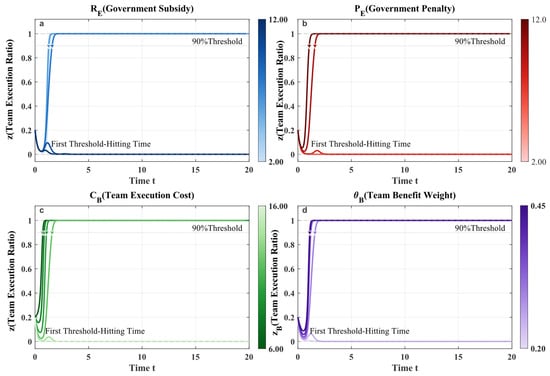

Disclaimer/Publisher’s Note: The statements, opinions and data contained in all publications are solely those of the individual author(s) and contributor(s) and not of MDPI and/or the editor(s). MDPI and/or the editor(s) disclaim responsibility for any injury to people or property resulting from any ideas, methods, instructions or products referred to in the content. |
© 2026 by the authors. Licensee MDPI, Basel, Switzerland. This article is an open access article distributed under the terms and conditions of the Creative Commons Attribution (CC BY) license.