


Abstract
Clarifying the sources of disparity and the systemic structure of influencing factors behind China’s economic resilience is crucial for promoting regional coordinated development and ensuring national security. This study constructs an evaluation index system based on the DPSIR model and employs the entropy method to measure China’s economic resilience from 2008 to 2023, examining its temporal evolution and spatial distribution. A bi-dimensional decomposition method of Gini coefficient is applied to examine disparities from both spatial and structural perspectives. Furthermore, the DEMATEL-ISM model is employed to reveal the systemic structure of influencing factors. The findings reveal that: (1) China’s economic resilience steadily improved during the study period, showing a spatial gradient of “Eastern > Central > Northeastern > Western,” with its geographic center shifting southeastward, reflecting strong spatial dependence. (2) Disparities in economic resilience have generally widened. Inter-regional differences are the main source of spatial disparities, while variations in response dominate the structural disparities. Initially, disparities were mainly due to differences in influence between eastern and western regions, but by the end of the period, disparities in driving forces became the key contributor. (3) Influencing factors follow a four-level, three-stage hierarchical structure. Foreign capital withdrawal risks, innovation investment, technological progress, factor supply, and the output of opening-up constitute deep-level factors influencing economic resilience. This study refines the evaluation framework of economic resilience and provides important references for understanding the disparities in China’s economic resilience and developing targeted improvement strategies.
1. Introduction
The global economy has entered a period of heightened uncertainty, marked by recurrent systemic shocks such as financial crises, geopolitical conflicts, and the COVID-19 pandemic. These shocks have disrupted global economic activity [1,2,3]. According to UNCTAD, global foreign direct investment flows declined by 12% in 2022, indicating increasing uncertainty and vulnerability in the global economy. Under increasingly complex external conditions, development paradigms centered primarily on the speed and scale of economic growth have become less capable of addressing emerging development challenges. Greater attention has therefore been paid to the capacity of economic systems to withstand external shocks, recover from disruption, and adapt dynamically to changing conditions. Economic resilience has consequently become an important issue in the sustainable development literature [4,5]. It is noteworthy that China has demonstrated strong resilience in the face of major risk shocks. Following the global financial crisis in 2008, the Chinese economy recovered rapidly, with GDP growth reaching 9.4% in 2009. During the COVID-19 pandemic in 2020, China was the only major economy in the world to achieve positive economic growth. However, given China’s vast territory, substantial differences exist across regions in terms of resource endowments, industrial structures, and stages of development. As a result, economic resilience exhibits pronounced spatial heterogeneity. Excessive disparities in economic resilience may not only weaken the foundation for coordinated regional development but also undermine the capacity of the overall economic system to respond effectively to risks and challenges. Therefore, systematically identifying the evolutionary characteristics of China’s economic resilience, as well as the sources of regional disparities and their influencing factors, has become an important task for promoting coordinated regional development and safeguarding national economic security.
Against this background, this study conducts a systematic investigation of economic resilience in China and seeks to address three key questions. First, what spatiotemporal evolution patterns characterize China’s economic resilience? Second, how have regional disparities in economic resilience evolved over time, what are the major sources of these disparities, and how have the contributions of different sources changed? Third, among the various factors influencing economic resilience, which factors play a decisive role, and what are the interaction relationships and hierarchical structures among them? To address these questions, this study develops an evaluation index system for economic resilience based on evolutionary resilience theory and the DPSIR framework. Using this framework, it measures China’s economic resilience and examines its spatiotemporal evolution patterns. It then employs the bi-dimensional decomposition method of Gini coefficient to decompose overall disparities from both spatial and structural perspectives, thereby identifying the major sources of economic resilience disparities and their dynamic evolution. Finally, the DEMATEL–ISM model is applied to analyze the systemic structure of influencing factors, revealing the key factors affecting the improvement of China’s economic resilience and their hierarchical transmission pathways.
From a theoretical perspective, economic resilience is a complex system involving multiple dimensions, including economic, social, ecological, and institutional factors. Its evolution is characterized by significant dynamism and nonlinearity. Existing studies have primarily focused on individual topics, such as measurement and evaluation, spatiotemporal patterns, or influencing factors, while systematic investigations of resilience evolution remain relatively limited. This study adopts a progressive analytical framework encompassing spatiotemporal pattern analysis, regional disparity decomposition, and influencing factor identification. By doing so, it contributes to a more comprehensive understanding of the complex evolutionary processes of economic resilience and further enriches the quantitative research on this topic. From a practical perspective, China is currently at a critical stage of balancing development and security, and enhancing economic resilience has become an important means of addressing various risks and challenges. Meanwhile, the regional coordinated development strategy has placed greater emphasis on narrowing regional disparities and promoting more balanced development. By revealing the spatiotemporal evolution patterns, sources of regional disparities, and key influencing factors of economic resilience in China, this study contributes to a more accurate understanding of regional resilience conditions and provides a useful reference for enhancing economic resilience according to local conditions and optimizing regional development patterns.
2. Literature Review
Existing research on economic resilience primarily follows three main trajectories. The first centers on the quantitative assessment of economic resilience, employing two primary approaches: the core variable method and the comprehensive evaluation method. The core variable method measures resilience by examining deviations in macroeconomic indicators—such as GDP growth, employment levels, and foreign trade volume—before and after external shocks [6,7,8]. This approach is straightforward and based on readily available data. However, it presents several notable limitations. On the one hand, it mainly captures an economy’s capacity to withstand and swiftly recover from shocks, while overlooking its potential for adaptive transformation through structural adjustment. On the other hand, relying on a single indicator fails to reflect the multidimensional nature of economic resilience, thus offering a limited representation of complex economic systems. In contrast, the comprehensive evaluation method has gained wider application due to its capacity to capture the complexity and nonlinearity of economic systems. For instance, Jiang et al. developed an evaluation framework encompassing five macroeconomic dimensions: consumption, investment, trade, government expenditure, and employment [9]. Similarly, Ma and Huang proposed an analytical model based on three resilience dimensions: resistance, recovery, and adaptability [10]. Although these studies differ in perspective, they generally adhere to a shared construction logic of “element decomposition–indicator mapping”—first identifying key components of economic resilience (e.g., macroeconomic domains or capability dimensions), then selecting specific indicators to represent them. This approach is conceptually clear and intuitive, effectively reflecting the multifaceted nature of economic resilience. Nonetheless, it has critical drawbacks: the pursuit of comprehensiveness often results in overly complex and loosely structured indicator systems, hindering the identification of relationships and the relative importance among variables. Moreover, the focus on static assessment limits its capacity to capture the dynamic evolution of economic resilience over time.
Secondly, regarding the spatiotemporal patterns of economic resilience, existing studies have adopted methods such as kernel density estimation, Markov chain, and spatial autocorrelation models to systematically examine its spatiotemporal evolution based on resilience metrics [11,12,13]. Due to the inherently uneven nature of regional economic development, disparities in economic resilience across regions have become an increasingly prominent topic in academic research. Early studies primarily used descriptive statistical methods to reveal surface-level differences in regional resilience through data comparisons [14,15]. While this approach provides an intuitive understanding of spatial variation, it is limited in uncovering the underlying sources of these disparities. As methodologies have advanced, analytical tools such as the Theil index and the Dagum Gini coefficient have been introduced to decompose regional differences in economic resilience [16,17], allowing for a more precise identification of spatial sources of disparity. However, it is important to recognize that disparities in economic resilience extend beyond geographic dimensions and are also embedded in core components such as resistance to shocks, recovery capacity, and adaptive renewal. Although traditional spatial decomposition methods effectively highlight geographical distribution patterns, they often fall short in examining the internal structural differences among these components. This analytical limitation risks leading to policy responses that prioritize spatial balance while neglecting the coordinated optimization of internal system functions.
Thirdly, regarding the influencing factors of economic resilience, existing research has predominantly utilized regression models, the geographic detector, and fuzzy-set qualitative comparative analysis (fsQCA) to investigate the impacts of factors such as the digital economy, industrial structure, technological innovation, the degree of openness, and government intervention on economic resilience [18,19,20]. These studies primarily focus on clarifying the direction and mechanisms through which independent variables influence economic resilience. However, the economic system is inherently a complex adaptive system characterized by self-organization, and the enhancement of resilience results from the interplay of multiple interrelated factors. Most existing approaches fail to adequately distinguish the relative importance of these factors or to capture their interactions and hierarchical relationships. The fragmented perspectives on influencing factors often lead to policy recommendations that list multiple factors without prioritization, thereby hindering efforts to focus on the core contradiction of economic resilience and reducing the precision and effectiveness of policy interventions.
To address the above research gaps, this study makes three main contributions. First, from the perspective of evolutionary resilience, it develops a dynamic evaluation framework for economic resilience based on the DPSIR model. Existing studies often treat economic resilience as a relatively static outcome and primarily focus on differences in the performance of economic systems after external shocks. Less attention has been paid to the dynamic evolutionary characteristics throughout the process of shock, adjustment, and reconfiguration. Evolutionary resilience emphasizes the capacity of economic systems to achieve transformation and upgrading through adaptive adjustment in response to external shocks. This perspective is inherently consistent with the dynamic transmission mechanism represented by the DPSIR framework, namely, the sequence of driving forces, pressure, state, influence, and response. Building on this foundation, this study incorporates the DPSIR model into the evaluation of economic resilience and integrates economic, social, environmental, and policy dimensions within a unified analytical framework. In doing so, it shifts the measurement of economic resilience from a result-oriented perspective toward a process-oriented perspective, thereby better reflecting the characteristics of complex adaptive evolution in economic systems.
Second, this study employs the bi-dimensional decomposition method of Gini coefficient to analyze the sources of economic resilience disparities from both spatial and structural perspectives. Existing studies have mainly focused on the spatial distribution characteristics of economic resilience disparities, while paying insufficient attention to their internal structural sources. Economic resilience disparities are essentially formed through the joint effects of multiple constituent dimensions. Therefore, identifying the sources of disparities solely from a spatial perspective makes it difficult to further reveal the contribution of each constituent dimension to overall disparities. To address this issue, this study further decomposes overall disparities into the disparity contributions of individual constituent dimensions on the basis of spatial decomposition. This approach enables the integrated identification of spatial and structural disparities, thereby refining policy interventions from the spatial level to the structural dimension and providing a more targeted basis for promoting coordinated regional development.
Third, this study introduces the DEMATEL-ISM model to analyze the systemic structure of factors influencing economic resilience. Existing studies often treat influencing factors as independent explanatory variables and examine them in parallel, focusing primarily on the strength of their effects on economic resilience while paying insufficient attention to the structural relationships and hierarchical relations among factors. The enhancement of economic resilience is essentially the result of interactions among multiple factors. Accordingly, this study employs the DEMATEL-ISM model to quantitatively identify inter-factor relationships, classify the influencing factors of economic resilience into surface-level, intermediate-level, and deep-level factors, and characterize their positions and transmission pathways within the overall structure. This provides theoretical support for optimizing strategies aimed at enhancing economic resilience.
3. Research Design
3.1. Evaluation Mechanism
3.1.1. Theoretical Framework of Economic Resilience
The DPSIR model, developed by the European Environment Agency as an extension of the PSR (Pressure–State–Response) framework, is founded on the principle of constructing a causal chain—“Driving Forces–Pressure–State–Influence–Response”—to systematically analyze the interactions between human activities and the ecological environment. Initially, the model was mainly applied in the field of sustainable development assessment [21,22]. It identifies the driving forces of socio-economic development, examines the environmental pressures they generate, evaluates resulting changes in environmental state and their influences on human society, and ultimately informs targeted policy responses. With the progression of interdisciplinary research, the DPSIR model’s applications have expanded beyond its original domain, now including emerging areas such as new economic development measurement [23] and public safety risk assessment [24], thus demonstrating the explanatory strength of this cross-disciplinary framework.
The explanatory framework of economic resilience has undergone a theoretical evolution from engineering resilience to ecological resilience and evolutionary resilience. This progression reflects a deepening understanding of how economic systems operate. Early engineering resilience theory originated in the fields of physics and engineering and is built on the assumption that a system has a single equilibrium state [25,26]. Under this perspective, resilience is primarily defined as the ability of a system to return to its original equilibrium after experiencing an external shock. Economic systems are therefore viewed as relatively stable and predictable linear systems, and research has mainly focused on their capacity to recover from disturbances. However, with the advancement of globalization and networked development, economic systems have become increasingly interconnected and complex, while their nonlinear characteristics have become more pronounced. As a result, the assumption of a single equilibrium state has gradually become insufficient for explaining the structural transformations and path restructuring that frequently occur in real-world economic systems [27].
Ecological resilience theory moves beyond the equilibrium-based analytical framework of engineering resilience by recognizing that a system may have multiple equilibrium states. Under this perspective, resilience is understood as the ability of a system to withstand external shocks while maintaining its core structures and functions [28]. The theory emphasizes system stability and persistence, providing a new analytical perspective for understanding how complex systems respond to external disturbances. However, ecological resilience still primarily focuses on a system’s capacity for maintenance within its existing structural framework, and offers relatively limited explanations of how economic systems reconstruct development pathways through innovation and learning [29].
With the development of evolutionary economics and complex adaptive systems theory, resilience research has further evolved toward the paradigm of evolutionary resilience. Evolutionary resilience no longer regards the restoration of an original equilibrium state as the sole objective. Instead, it emphasizes the capacity of economic systems to achieve adaptive adjustment and transformational upgrading through knowledge creation, technological innovation, and institutional adaptation when confronted with internal and external shocks [30,31]. From this perspective, resilience is reflected not only in the ability to withstand shocks and restore growth, but also in the capacity of economic systems to optimize their structures and achieve sustainable development through path creation. Therefore, economic resilience is essentially a dynamic evolutionary process encompassing the accumulation of driving forces, risks exposure, state evolution, impact transmission, and adaptive responses. Based on this understanding, this study defines economic resilience as the capacity of an economic system to withstand shocks, restore stability, and achieve adaptive transformation when confronted with internal and external uncertainties.
As shown in Figure 1, the theoretical framework of the DPSIR model exhibits strong internal consistency with the essential characteristics of economic resilience from the perspective of evolutionary resilience. In terms of analytical dimensions, economic resilience involves not only the drivers of economic growth, sources of risk shocks, system operating conditions, and the consequences of shocks, but also the adaptive adjustment processes of multiple actors, including governments, markets, and society. Through the logical chain of Driving Forces–Pressure–State–Influence–Response, the DPSIR model provides a systematic framework for characterizing the relationships among these elements. Specifically, factor supply and technological progress constitute the driving forces of sustainable economic development. Fiscal and financial risks, foreign capital withdrawal risks, and ecological pressures reflect the internal and external shocks faced by the economic system. Economic output, market potential, and industrial structure represent the operating conditions of the economic system under external shocks. Fiscal and financial security, output of opening-up, and income disparity reflect the economic and social influences generated through shock transmission. Innovation investment, environmental governance, social security, and institutional equity represent the response mechanisms through which governments and other actors enhance the adaptive and transformational capacities of the system.
Figure 1.
Evaluation framework for economic resilience based on the DPSIR model.
From the perspective of dynamic processes, evolutionary resilience emphasizes that economic systems do not simply return to their original equilibrium states. Instead, they achieve continuous evolution through structural adjustment, capacity reconstruction, and path creation in the face of shocks. The transmission chain of Driving Forces–Pressure–State–Influence–Response established by the DPSIR model corresponds closely to the evolutionary process through which economic systems progress from the accumulation of driving forces and exposure to risks to state evolution, impact manifestation, and adaptive responses. It not only reveals the foundations of economic resilience and the sources of risk, but also reflects the dynamic mechanisms underlying resilience recovery, adaptation, and transformation. Compared with evaluation frameworks that focus solely on system conditions or development outcomes, the DPSIR model captures the systemic, dynamic, and process-oriented characteristics of economic resilience. It therefore provides a more comprehensive understanding of the formation logic and evolutionary mechanisms of economic resilience. Accordingly, the DPSIR model offers an analytical framework for the comprehensive evaluation of economic resilience that combines a theoretical foundation with strong explanatory power in practice.
3.1.2. Indicator System Construction
It should be noted that economic resilience does not simply reflect the level of economic growth. Rather, it represents the comprehensive capacity of an economic system to withstand shocks, restore stability, and achieve adaptive transformation. As an open, dynamic, and complex adaptive system, the resilience of an economic system is influenced not only by economic performance, but also by factors such as social security, the institutional environment, innovation capacity, and resource and environmental constraints. Based on this understanding, this study moves beyond a perspective focused solely on economic indicators. Drawing on the perspectives of complex systems and evolutionary resilience, it follows the logical chain of Driving Forces–Pressure–State–Influence–Response to hierarchically decompose the foundations of resilience formation, sources of risk, operating conditions, impact consequences, and adaptive response mechanisms. On this basis, an economic resilience evaluation index system consisting of 5 criterion-level dimensions, 15 element-level dimensions, and 37 indicator-level variables is constructed (Table 1).
Table 1.
Evaluation index system of economic resilience.
Driving forces represent the fundamental impetus for enhancing economic resilience and comprise 2 element-level categories: factor supply and technological progress. According to neoclassical growth theory, these two components jointly underpin economic growth [32]. Although the quantitative expansion of inputs such as labor, capital, water, and energy can boost output through scale effects, their contribution is limited by the law of diminishing marginal returns, making long-term growth unsustainable. In contrast, technological progress—through innovations in production methods, optimized allocation of resources, and relaxation of factor endowment constraints—acts as a core driving force in overcoming input constraints and advancing sustainable economic development [33]. In terms of indicator selection, factor supply is characterized by four fundamental development factors—labor, capital, water resources, and energy—measured by employment in urban work units, total fixed asset investment, per capita water resources, and total electricity supply, respectively. Technological progress is represented by indicators such as the number of patent applications and turnover of the technology market, which are used to reflect regional technological innovation capacity. Since these indicators enhance the endogenous driving forces of economic development and support sustained economic growth, they are all designated as positive indicators.
Pressure refers to the internal and external shocks faced by the economic system under the influence of driving forces, comprising 3 element-level categories: fiscal and financial risks, foreign capital withdrawal risks, and ecological pressures. The traditional “extensive” development model, which relies heavily on large-scale factor inputs, often generates three types of systemic pressure. In the fiscal and financial domain, local governments stimulate growth through debt-financed infrastructure investment and real estate expansion, leading to the accumulation of fiscal deficits and growing risks of asset bubbles [34]. In terms of external shocks, the “extensive” model tends to concentrate industries in low value-added, labor- or resource-intensive sectors that depend on foreign capital inflows and export-oriented manufacturing. Consequently, rising labor costs, shifts in the international trade environment, or changes in global capital flows can easily trigger foreign capital withdrawal and disrupt industrial chains. In the domain of resources and the environment, the high-energy-consumption development model results in excessive energy use and pollutant emissions, leading to resource depletion and ecological degradation, which in turn pose rigid constraints on sustainable economic development. In terms of indicator selection, fiscal and financial risks are primarily characterized by fiscal balance conditions and the degree of dependence on real estate investment. Foreign capital withdrawal risks are measured mainly by the scale of foreign investment and the operating conditions of foreign-invested enterprises. Ecological pressures are represented from two aspects: resource consumption and environmental pollution. Together, these indicators reflect the degree of risk exposure and the potential sources of shocks faced by the economic system. Among them, the ratio of real estate development investment to total fixed asset investment, energy consumption per unit of GDP, and pollutant emissions per unit of GDP increase system vulnerability and are therefore designated as negative indicators. By contrast, the ratio of government fiscal revenue to government fiscal expenditure, total investment by foreign-invested enterprises, and foreign capital registered in foreign-invested enterprises reflect regional fiscal support capacity and the level of open development. These indicators help strengthen the ability of the economic system to withstand shocks and are therefore designated as positive indicators.
The state dimension reflects the observable condition of the economic system resulting from the combined effects of driving forces and pressure. It consists of 3 element-level categories: economic output, market potential, and industrial structure. Economic output is measured by per capita GDP, indicating the current economic scale, and GDP growth rate, reflecting the speed of economic expansion. Together, these indicators capture both developmental achievements and short-term fluctuations. Market potential is evaluated using total retail sales of consumer goods to reflect current demand, and the natural population growth rate to indicate long-term market prospects—jointly constituting the demand-side drivers of economic growth. The industrial structure dimension includes the industrial advancement index, which gauges the extent of industrial upgrading toward high-tech, high–value-added activities, and the rationalization index, which assesses the efficiency and coordination of resource allocation across industries. Together, these indices offer a comprehensive evaluation of structural economic optimization [35]. In terms of indicator selection, per capita GDP and the GDP growth rate, total retail sales of social consumer goods and the natural population growth rate, and the index of industrial structure advancement are used to characterize the sound operating conditions of the economic system from the perspectives of economic development, market demand potential, and industrial upgrading, respectively. Therefore, these indicators are designated as positive indicators. By contrast, a higher value of the index of industrial structure rationalization indicates a greater degree of resource misallocation among industries, which is not conducive to the stable operation of the economic system. It is therefore designated as a negative indicator.
Influence refers to the consequences of pressure and the state on the economy and society, comprising 3 element-level dimensions: fiscal and financial security, output of opening-up, and income disparity. Fiscal and financial security captures the tangible effects of associated risks: to service debt and sustain investment, governments may adopt expansionary monetary policies, thereby intensifying inflationary pressures. Additionally, excessive involvement of financial institutions in land mortgages and real estate lending can result in unsustainable credit expansion. Output of opening-up reflects the transmission of foreign capital withdrawal risks. When external shocks prompt capital flight, production capacity in affected industries contracts sharply, significantly reducing total imports and exports and exposing the fragility of export-oriented economies. Income disparity is a structural consequence of the extensive growth model. In pursuit of rapid economic development, China has long favored resource allocation toward cities and developed regions, leading to pronounced urban–rural and regional disparities [36]. In terms of indicator selection, fiscal and financial security is represented by the inflation rate and the ratio of outstanding loans of financial institutions to GDP, which reflect the actual consequences of fiscal and financial risks. Output of opening-up is measured by the total goods import and export volume, which captures the development outcomes of an open economy. Income disparity is characterized from two aspects: the urban–rural gap and the regional gap. Among these indicators, the ratio of regional to national per capita GDP and the ratio of regional to national per capita consumption expenditure reflect the level of regional development and residents’ welfare relative to the national average. The total goods import and export volume reflects the achievements of regional open development. Therefore, these indicators are designated as positive indicators. By contrast, higher values of the inflation rate, the ratio of outstanding loans of financial institutions to GDP, the urban–rural per capita disposable income ratio, and the urban–rural per capita consumption expenditure ratio indicate a greater accumulation of fiscal and financial risks or a higher degree of imbalance in urban–rural development. These indicators are therefore designated as negative indicators.
Response refers to a set of proactive strategies designed to enhance economic resilience, encompassing 4 element-level dimensions: innovation investment, environmental governance, social security, and institutional equity. Innovation investment bolsters the economy’s capacity to withstand foreign capital withdrawal and technological blockades, promoting a transition from input-driven to efficiency-driven growth. Environmental governance aims to mitigate the pressures of excessive resource consumption and environmental degradation, thereby strengthening the ecological foundation for sustainable development. Social security stabilizes income expectations, enhancing the buffering capacity of domestic demand against economic volatility and reducing the risk of stagnation from abrupt external demand shocks. Institutional equity promotes the equitable distribution of public services—such as healthcare, education, and transportation—thereby improving labor quality and factor mobility. This, in turn, narrows urban–rural and regional disparities while strengthening the economic system’s capacity for adaptive resource allocation and structural stability in the face of external shocks [37]. In terms of indicator selection, innovation investment is used to measure regional innovation capacity from three aspects: R&D expenditure, R&D personnel, and innovation entities. Environmental governance reflects ecological restoration capacity through indicators related to pollution control and ecological development. Social security measures the capacity to buffer social risks from the perspectives of employment security and pension security. Institutional equity reflects the degree of fairness in resource allocation through the provision of public services such as healthcare, education, and public transportation. All of these indicators represent the positive responses of governments and other actors in enhancing the adaptive and transformational capacities of the economic system. Improvements in these indicators contribute to strengthening economic resilience; therefore, they are all designated as positive indicators.
To ensure data availability and consistency in statistical standards, this study employs panel data from 30 Chinese provinces (excluding Hong Kong, Macao, Taiwan, and Tibet Autonomous Region) spanning the period 2008–2023. The indicators listed in Table 1 are primarily derived from the China Statistical Yearbook, the EPS database, and the statistical yearbooks and bulletins of respective provinces. The index of industrial structure advancement and rationalization are calculated based on the methodology proposed by Zhang et al. [38]. Missing values are imputed using linear interpolation.
3.2. Research Methods
3.2.1. Entropy Method
The entropy method, an objective weighting technique grounded in information entropy theory, is widely applied in comprehensive evaluations. Since the evaluation index system for economic resilience spans economic, industrial, social, and ecological dimensions, subjective weighting approaches often suffer from challenges such as difficulty in identifying qualified experts and excessive subjectivity. To address these issues, this study employs the entropy method to calculate China’s Economic Resilience Index (ERI). This method determines indicator weights based on the degree of variation within the data itself, thereby eliminating reliance on expert judgment and enhancing the objectivity and scientific rigor of the evaluation results. The specific calculation steps are as follows.
Step 1: Given the significant differences in measurement units across indicators, all data must be standardized. Let and represent the maximum and minimum values, respectively, of the j-th indicator across all years.
Step 2: Calculate the proportion pij of indicator j for province i.
Step 3: Calculate the entropy value ej of indicator j. The greater the variation in the data of an indicator, the smaller its entropy value, and consequently, the greater its weight. It is assumed that when , and .
Step 4: Calculate the divergence coefficient αj of indicator j.
Step 5: Calculate the weight Wj of indicator j.
Step 6: The ERI is obtained by multiplying the standardized data by the corresponding weights.
To further verify the robustness of the measurement results and to reduce potential bias arising from the use of a single weighting method, the Spearman rank correlation coefficient was employed to test the consistency of the economic resilience indices obtained using the entropy method, the improved CRITIC method, and the Vertical and Horizontal Scatter Degree (VHSD) method. The results show that the Spearman rank correlation coefficients between the improved CRITIC method and the entropy method exceed 0.95. The correlation coefficients between the VHSD method and the entropy method also exceed 0.80. All correlation coefficients are statistically significant at the 5% level. These findings indicate a high degree of consistency among the economic resilience indices obtained from different objective weighting methods, thereby confirming the robustness of the measurement results.
3.2.2. Markov Chain
This study utilizes both the traditional Markov chain and the spatial Markov chain to comprehensively examine the dynamic transition patterns of economic resilience in China. The traditional Markov chain is a mathematical model that captures the temporal evolution of a system’s state, with its mechanism represented by transition probabilities. Equation (8) indicates that the probability of economic resilience X being in a particular state at time t depends solely on its state at time t − 1. Equation (9) estimates the probability of a transition from state i in the current period to state j in the subsequent period. Here, nij denotes the number of provinces transitioning from state i to state j, ni represents the number of provinces currently in state i, and pij is the corresponding transition probability. The spatial Markov chain extends the traditional model by incorporating spatial dimensions, emphasizing that the evolution of a region’s state is significantly influenced by its neighboring environment. By constructing a spatial weight matrix to quantify interregional linkages, the traditional N × N transition matrix is expanded into a N × N × N transition matrix. In this context, pij represents the probability of transitioning from state i to state j given the spatial lag condition Ni.
3.2.3. Bi-Dimensional Decomposition Method of Gini Coefficient
The bi-dimensional decomposition method of Gini coefficient is a key quantitative technique for investigating the structure of inequality. It partitions the overall Gini coefficient into subcomponents along two axes, thereby identifying both the sources and the distributional patterns of disparities. The procedure operates on two levels: (i) spatially, by quantifying the respective contributions of intra-regional and inter-regional variation to total inequality; and (ii) compositionally, by estimating how each indicator or factor dimension contributes to the aggregate gap. Relative to the Theil index and the Dagum Gini coefficient, this approach overcomes the constraint of a single spatial dimension and enables a multidimensional reading of inequality through cross-classification analysis. Following Mussard [39], we decompose disparities in ERI into intra-regional and inter-regional components and implement the two-dimensional decomposition using Equation (10). The overall Gini coefficient is partitioned into q elements, each representing the contribution of a distinct sub-dimension of economic resilience. Specifically, k denotes the number of subgroups, xj,i is the ERI of the i-th unit in subgroup j, n is the total sample size, and μ is the mean ERI level.
3.2.4. DEMATEL-ISM Model
The DEMATEL-ISM model combines the Decision-Making Trial and Evaluation Laboratory (DEMATEL) method with the Interpretive Structural Modeling (ISM) approach, providing a comprehensive framework that integrates causal analysis with structural modeling. This methodology quantifies inter-factor interactions and establishes hierarchical relationships, offering a multidimensional perspective for analyzing complex systems. In comparison, the DEMATEL method excels at identifying key influencing factors within complex systems but is limited in revealing internal linkages and hierarchical structures. Conversely, the ISM approach effectively organizes dispersed factors into a clear multi-level hierarchy but lacks the capacity to quantify the strength of each factor’s influence [40]. Accordingly, this study adopts the DEMATEL-ISM model to systematically investigate both the intensity of influence and the hierarchical structure of factors shaping economic resilience in China.
4. The Spatiotemporal Pattern of China’s Economic Resilience
4.1. Temporal Evolution Characteristics
Figure 2 presents the temporal trends of China’s ERI and its regional sub-indices from 2008 to 2023. Overall, the index rose steadily from 0.098 in 2008 to 0.214 in 2023. Nonetheless, the average index value during the study period was only 0.148, suggesting that although economic resilience has improved, there remains considerable scope for further enhancement. Regionally, all four major areas demonstrated an upward trajectory in ERI, albeit with significant spatial disparities. The average ERI values for the eastern, central, northeastern, and western regions were 0.223, 0.132, 0.106, and 0.101, respectively, forming a descending gradient of “Eastern > Central > Northeastern > Western.”
Figure 2.
Trends in the ERI of China and its four major regions.
From the perspective of the formation mechanism of economic resilience, regional disparities are reflected not only in differences in economic output levels, but also in factors such as innovation capacity, industrial structure, market vitality, and the level of openness. As the pioneering region of China’s reform and opening-up, the eastern region has long attracted and concentrated high-end factors, including capital, technology, and talent. This has facilitated the formation of a diversified industrial system characterized by advanced manufacturing, the digital economy, and modern services. Strong innovation capacity, market vitality, and openness have further enhanced its ability to withstand external shocks and undertake adaptive adjustment. As a result, the ERI in the eastern region is significantly higher than that in other regions. The central region has steadily improved its level of economic resilience by leveraging national strategies such as the Rise of Central China Strategy and the development of the Yangtze River Economic Belt, while continuously undertaking industrial transfer from the eastern region. However, some industries in the region remain concentrated in the low- and middle-value-added segments of the global value chain. Its industrial upgrading and indigenous innovation capabilities are relatively weak, making it more sensitive to fluctuations in external markets and industrial restructuring. Consequently, the overall ERI in the central region remains lower than that of the eastern region.
The northeastern region has long exhibited a relatively low ERI, mainly constrained by industrial path dependence and insufficient development momentum. For a long period, a development model dominated by resource-based industries and heavy industries has resulted in slow industrial transformation and upgrading. Coupled with pronounced population outflow and population aging, the region has experienced insufficient market vitality and innovation capacity. As a result, it has gradually fallen into the dual predicament of resource depletion and path lock-in. The western region exhibits the lowest ERI, mainly due to deficiencies in innovation resources, high-level talent, and industrial supporting capacity. Although national strategies such as the Western Development Strategy and the Belt and Road Initiative have improved infrastructure conditions and the level of openness, the region still faces a relatively weak innovation foundation and limited capacity to attract and agglomerate production factors. At the same time, environmental constraints and geographical barriers increase the costs and risks of economic development. As a result, the capacity of the economic system to withstand shocks and sustain transformational development remains in need of further improvement.
4.2. Spatial Mobility Characteristics
This study utilizes the standard deviation ellipse method in ArcGIS 10.8.1 to analyze the spatial mobility characteristics of economic resilience in China (Table 2). Regarding centroid distribution, the geographic coordinates of the ellipse centers during the study period ranged from 113.79° E to 113.82° E and from 32.54° N to 33.73° N. The centroid shifted from Luohe at the beginning of the period to Zhumadian and eventually to Xinyang. This southeastward shift indicates that the growth rate of the ERI in southeastern China has surpassed the national average. In terms of spatial extent, the length of the short axis of the ellipse decreased from 972.64 km in 2008 to 884.84 km in 2023, while the long axis shortened from 1117.53 km to 1083.54 km. Coupled with changes in the shape index and area ratio, this suggests a more concentrated radial distribution of the ERI, reflecting a pronounced centripetal tendency. As for orientation, the azimuth angle of the ellipse declined from 21.79° in 2008 to 16.02° in 2023, indicating a slight counterclockwise rotation. Nonetheless, the spatial distribution remains predominantly aligned along the “northeast–southwest” axis.
Table 2.
Standard deviation ellipse parameters of ERI in China.
4.3. Dynamic Transition Characteristics
Based on the distribution of the ERI, the quartile method was employed to classify the 30 provinces into four categories: low resilience (L), medium–low resilience (ML), medium–high resilience (MH), and high resilience (H). On this basis, the transition probability matrices of the traditional Markov chain and the spatial Markov chain were calculated using a one-period lag as the conditioning variable (Table 3). For the spatial Markov chain analysis, a geographic distance-based spatial weight matrix was adopted to characterize interprovincial spatial relationships. Specifically, the weight matrix was constructed based on the geographic distances between provincial capital cities. The weight assigned to each pair of provinces was defined as the reciprocal of the geographic distance between them and was subsequently row-standardized to reflect the strength of spatial linkages among provinces.
Table 3.
Markov transition probability matrix of China’s economic resilience.
When spatial effects are excluded, the diagonal transition probabilities are 0.658, 0.617, 0.642, and 1.000, respectively—each exceeding the corresponding off-diagonal probabilities. This indicates a pattern of club convergence in economic resilience, with a notably strong “lock-in” effect for provinces exhibiting high resilience. To account for potential interregional interactions, the study incorporates spatial effects in analyzing the dynamic evolution of ERI. The chi-square test yields a Q-statistic of 49.28, which is statistically significant at the 1% level, confirming the existence of spatial dependence across regions. Three key insights are derived from the spatial Markov transition matrix: First, neighborhood effects significantly influence resilience transitions. Without considering spatial context, the probability of an L-type province remaining in the same category is 0.658. When neighboring provinces belong to the L, ML, MH, and H categories, the probabilities change to 0.823, 0.468, 0.545, and 0.000, respectively. Second, transition probabilities are jointly determined by initial resilience status and neighboring conditions. When adjacent to ML-type provinces, the upward transition probabilities for L, ML, and MH provinces are 0.532, 0.378, and 0.111, respectively, while H-type provinces show zero probability of downward transition. Third, proximity to H-type provinces significantly enhances upward mobility. For instance, the upward transition probabilities for ML and MH provinces increase to 0.526 and 0.579, respectively—substantially higher than in other spatial contexts. This suggests that H-type provinces exert strong positive spillover effects, enhancing neighboring regions’ risk resistance and adaptive transformation capacity through mechanisms such as industrial cooperation, technological synergy, and urban network integration.
5. Multidimensional Decomposition of ERI Disparities in China
5.1. Spatial Decomposition
Using the bi-dimensional decomposition method of Gini coefficient, this study disaggregates spatial disparities in China’s ERI into intra-regional and inter-regional components, with intra-regional disparities referring to the aggregated differences within the four major regions (Table 4). Overall, spatial disparities in ERI have exhibited an upward trend, as the Gini coefficient increased from 0.109 in 2008 to 0.145 in 2023 with a growth of 33.03%. Throughout the study period, the inter-regional Gini coefficient consistently exceeded the intra-regional coefficient, indicating that inter-regional differences are the dominant source of spatial disparities in China’s economic resilience. Regarding the sources of intra-regional differences, the average annual contribution rates of the eastern, central, western, and northeastern regions were 13.71%, 1.07%, 4.38%, and 0.26%, respectively, revealing the pattern “Eastern > Western > Central > Northeastern.” The results suggest that economic resilience is relatively evenly distributed among provinces in the central, western, and northeastern regions. In contrast, the eastern region includes both high-performing provinces such as Guangdong and Jiangsu and lower-performing ones such as Tianjin and Hebei, resulting in significant internal disparities. As for the sources of inter-regional disparities, the average contribution rates, in descending order, are as follows: Eastern–Western (40.84%) > Eastern–Central (18.32%) > Eastern–Northeastern (10.45%) > Central–Western (6.68%) > Western–Northeastern (2.55%) > Central–Northeastern (1.75%). Notably, the disparity between the eastern and western regions alone accounts for over 40% of the total, underscoring the strategic importance of enhancing economic resilience in the western region to reduce national spatial disparities.
Table 4.
Decomposition results of regional disparities in China’s economic resilience from a spatial perspective 2.
5.2. Structural Decomposition
Based on the bi-dimensional decomposition method of Gini coefficient, this study decomposes disparities in China’s economic resilience across structural dimensions, including driving forces, pressure, state, influence, and response (Figure 3). From a static perspective, differences in responses constitute the primary structural source of economic resilience disparities, with an average annual contribution of 31.61%. Contributions from driving forces and influences are somewhat lower, at 25.43% and 22.58%, respectively, while state and pressure contribute less substantially, with average annual rates of 10.28% and 10.10%. From a dynamic perspective, the contribution rates of driving forces and pressure exhibit an overall increasing trend, with average annual growth rates of 6.20% and 1.88%, respectively. Since 2021, driving forces’ differences have overtaken response differences as the dominant structural source of disparities in China’s economic resilience. In contrast, the contributions of states, influences, and responses have declined, with average annual decreases of 0.12%, 6.09%, and 0.71%, respectively. These findings indicate that reducing disparities in responses is crucial for narrowing overall differences in China’s economic resilience. It is imperative that regions integrate key domains such as innovation investment, environmental governance, social security, and institutional equity into coordinated planning to foster a shared consensus and a unified framework for regional development. Simultaneously, in light of the increasing significance of driving forces’ disparities, efforts should focus on securing resource supply and advancing technological innovation to facilitate coordinated enhancements in regional economic resilience.
Figure 3.
Decomposition results of regional disparities in China’s economic resilience from a structural perspective.
5.3. Bi-Dimensional Decomposition
To further investigate the underlying causes of regional disparities, this study applies a bi-dimensional decomposition of economic resilience differences in China. Table 5 presents the decomposition results for 2008 and 2023, highlighting the contribution rates of each component to the overall disparity. From a spatial perspective, the main source of economic resilience disparity in 2008 was inter-regional influence differences, contributing 28.01% to the total. Among these, the Eastern–Western and Eastern–Central region pairs were the most significant, accounting for 15.28% and 7.08%, respectively. By 2023, inter-regional differences in driving forces had become the dominant source, contributing 26.02% to the overall disparity, with the Eastern–Western difference alone accounting for 11.29%. From a structural perspective, in 2008, differences in driving forces, pressure, state, influence, and response between the Eastern and Western were the most significant contributors, with respective contribution rates of 4.05%, 5.69%, 4.27%, 15.28%, and 14.22%. In 2023, the Eastern–Western gap remained the largest across all five dimensions, contributing 11.29%, 7.70%, 3.90%, 5.81%, and 11.15%, respectively. Taken together, the primary source of regional economic resilience disparity shifted notably over time—from influence differences between the Eastern and Western in 2008 to driving forces differences between the same regions in 2023.
Table 5.
Bi-dimensional decomposition of economic resilience disparities in China: results for 2008 and 2023.
6. Systematic Structural Analysis of the Influencing Factors of China’s Economic Resilience
6.1. Analysis of Key Influencing Factors Based on the DEMATEL Method
6.1.1. Construction of the Direct Influence Matrix and Total Influence Matrix
The traditional DEMATEL model typically constructs the direct influence matrix based on expert judgments to identify the relationships among influencing factors. However, expert judgments are often affected by differences in knowledge background and subjective perceptions, which may introduce ambiguity and uncertainty into the identification of relationship strengths among factors. To reduce the bias associated with subjective scoring, this study follows the approach of Zhang and Huang and Yuan and Wang by taking the element-level dimensions in the economic resilience evaluation system as the analytical objects of the DEMATEL–ISM model [41,42]. Table 1 presents the weights of the evaluation indicators. Following the procedures adopted in previous studies, the weight of each element-level dimension is obtained by summing the weights of the indicators belonging to that dimension, thereby reflecting its overall information contribution to the evaluation system. For example, the weight of Technological Progress (F2) is calculated as the sum of the weights of the number of patent applications and turnover of the technology market. Following the methodology of the above studies, the ratios between the weights of influencing factors are used to measure their relative relationships, on the basis of which the direct influence matrix is constructed (Table 6). Specifically, when , .
Table 6.
Direct influence matrix A.
Furthermore, the direct influence matrix A is normalized using Equation (11). Specifically, each element of matrix A is divided by the maximum row sum of the matrix, yielding the normalized direct influence matrix N. Based on N, the total influence matrix T is obtained according to Equation (12) (Table 7), where I represents the identity matrix.
Table 7.
Total influence Matrix T.
6.1.2. Identification of Key Influencing Factors
After obtaining the total influence matrix of the influencing factors of economic resilience, the influence degree Ri, influenced degree Ei, centrality Zi, and causality Yi of each factor are calculated according to Equations (13)–(16), respectively, to identify the key influencing factors. Specifically, the influence degree represents the overall influence exerted by a given factor on other factors, whereas the influenced degree represents the overall influence received by that factor from other factors. Centrality is defined as the sum of the influence degree and the influenced degree. A larger centrality value indicates that the corresponding factor is more important within the system. Causality is defined as the difference between the influence degree and the influenced degree. When the causality value is greater than zero, the influence exerted by a factor on other factors exceeds the influence it receives, indicating that it is a cause factor. Conversely, when the causality value is less than zero, the influence received by a factor from other factors exceeds the influence it exerts, indicating that it is an effect factor.
Table 8 reports the centrality and causality scores of 15 influencing factors as determined by the DEMATEL model. Among the factors shaping economic resilience, the primary cause factors—ranked in descending order of influence—are foreign capital withdrawal risks (F4), innovation investment (F12), technological progress (F2), factor supply (F1), output of opening-up (F10), income disparity (F11), environmental governance (F13), and institutional equity (F15). These variables exert considerable influence on other factors and indirectly contribute to the enhancement of economic resilience. For example, foreign capital withdrawal risks (F4) exhibits the highest influence, suggesting that policymakers should strengthen efforts to stabilize and attract foreign investment, thereby leveraging its role in maintaining industrial chain stability, promoting technology spillovers, and supporting employment. The effect factors—ranked by their susceptibility to influence—include ecological pressures (F5), fiscal and financial security (F9), fiscal and financial risks (F3), economic output (F6), industrial structure (F8), market potential (F7), and social security (F14). These variables are significantly influenced by others and serve as direct drivers of economic resilience. For instance, ecological pressures (F5) are the most susceptible to external influence, indicating that mitigating ecological stress should be prioritized to enhance economic resilience and support a comprehensive green transformation of economic and social development.
Table 8.
Centrality and causality of influencing factors of China’s economic resilience.
To provide a clearer representation of the interrelationships among influencing factors, a cause–effect diagram (Figure 4) is constructed, with centrality and causality serving as the horizontal and vertical axes, respectively. The four quadrants of the coordinate plane are labeled as the Driving Factor Set, Auxiliary Factor Set, Independent Factor Set, and Core Issue Factor Set. Quadrant I (Driving Factor Set) comprises factor supply (F1), technological progress (F2), foreign capital withdrawal risks (F4), and innovation investment (F12). These factors exhibit both high centrality and high causality, indicating their dominant role in promoting economic resilience. Quadrant II (Auxiliary Factor Set) includes output of opening-up (F10), income disparity (F11), environmental governance (F13), and institutional equity (F15). Although these factors demonstrate relatively low centrality, their high causality suggests strong influence over other effect factors, making them important supportive contributors to economic resilience. Quadrant III (Independent Factor Set) consists of market potential (F7), industrial structure (F8), and social security (F14). These factors show low values in both centrality and causality, indicating limited importance and weak interconnection with other variables, and thus play a minimal role in enhancing economic resilience. Quadrant IV (Core Issue Factor Set) contains fiscal and financial risks (F3), ecological pressures (F5), economic output (F6), and fiscal and financial security (F9). These factors have high absolute values in both centrality and causality, signifying their critical importance and high susceptibility to influence from other variables. They represent focal points that must be addressed to effectively strengthen economic resilience. In conclusion, the 12 factors located in Quadrants I, II, and IV can be identified as the key determinants of China’s economic resilience.
Figure 4.
Relationships among the influencing factors of China’s economic resilience.
6.2. Hierarchical Structure Analysis of Influencing Factors Based on the ISM Method
6.2.1. Construction of the Reachability Matrix
To identify the major influence relationships within the system and reveal the hierarchical structure among factors, the total influence matrix must be transformed into the reachability matrix required for ISM analysis. To this end, the total influence matrix is first binarized to screen key influence relationships and construct the adjacency matrix. Following Khanam et al. and Zhang and Huang, the arithmetic mean of all elements in the total influence matrix T is selected as the threshold value [41,43]. The calculated mean value of the matrix elements is 0.0239. According to Equation (17), elements in the total influence matrix T that are greater than or equal to the threshold value are assigned a value of 1, whereas those below are assigned a value of 0, thereby yielding the adjacency matrix B. On this basis, the adjacency matrix B is added to the identity matrix I, and iterative operations are performed according to the rules of Boolean algebra. When the matrix reaches a stable state and satisfies Equation (18), the resulting matrix is the reachability matrix M (Table 9).
Table 9.
Reachability matrix M.
6.2.2. Hierarchical Classification
Based on the reachability matrix M, the set of all influencing factors of economic resilience is defined as . According to Equations (19)–(21), the reachability set , antecedent set , and their intersection set for each influencing factor can be obtained. The results are presented in Table 10. Specifically, the reachability set represents the set of factors that can be directly or indirectly influenced by factor , whereas the antecedent set represents the set of factors that can directly or indirectly influence factor . If , factor is identified as a top-level factor at the current hierarchical level. After the factors at the current level are determined, their corresponding rows and columns are removed from the reachability matrix. The above procedure is then repeated to identify factors at the subsequent level until all factors have been classified into hierarchical levels, thereby constructing the multi-level hierarchical structure of the influencing factors.
Table 10.
Hierarchical classification of economic resilience influencing factors 3.
6.2.3. Transmission Path Analysis of Influencing Factors
Figure 5 depicts the hierarchical structure of factors influencing economic resilience as identified by the ISM model. These factors are categorized into four levels: surface-level factors (L1), intermediate-level factors (L2), and deep-level factors (L3 and L4). Surface-level factors are the most immediate determinants of economic resilience and are all effect factors, including fiscal and financial risks (F3), ecological pressures (F5), and fiscal and financial security (F9). In the short term, mitigating fiscal and financial risks, enhancing fiscal security, and alleviating ecological pressure offer the most direct pathways to improve economic resilience. Intermediate-level factors act as a bridge between surface and deep levels and comprise both cause and effect factors. This category includes economic output (F6), market potential (F7), industrial structure (F8), income disparity (F11), environmental governance (F13), social security (F14), and institutional equity (F15). These factors influence upper-level variables while being affected by lower-level ones, thus playing a pivotal transitional role in strengthening economic resilience. Deep-level factors represent the fundamental drivers of economic resilience and are exclusively cause factors. These include factor supply (F1), technological progress (F2), foreign capital withdrawal risks (F4), output of opening-up (F10), and innovation investment (F12). Although these factors directly or indirectly impact other variables, they are often overlooked due to their underlying, less visible nature. From a long-term perspective, sustainable enhancement of economic resilience necessitates increased governmental focus on these deep-level factors.
Figure 5.
Hierarchical structure model of the influencing factors of China’s economic resilience. Note: Purple nodes represent cause factors, while yellow nodes represent effect factors.
Based on the foregoing analysis, several pathways to enhance economic resilience emerge, with the most direct and effective being: F4 → F10 → F6 → F5. This pathway suggests that the government can steer foreign investment into high-tech manufacturing, service trade, and related sectors through measures such as establishing free trade zones and implementing negative list management. Foreign-invested enterprises, leveraging technology spillovers and global market networks, directly expand the scale of imports and exports, deepen regional integration into global value chains, and boost opening-up output. In this process, the “factor agglomeration effect” of foreign capital not only facilitates capital accumulation but also enhances local industrial efficiency and scale expansion via forward and backward industrial linkages, thereby sustaining economic output growth [44,45]. Economic growth provides the material foundation for environmental governance: increased fiscal revenues enable local governments to augment public investment in pollution control, clean energy, and related fields; concurrently, low-carbon technologies and green management practices introduced by foreign capital contribute to reductions in energy consumption and pollutant emissions, effectively mitigating ecological pressure [46,47]. This pathway illustrates the synergy between an open economy and green development. Foreign investment-driven trade expansion and economic growth leading to ecological improvement form a replicable transmission chain for strengthening regional economic resilience.
6.2.4. Robustness Test
To examine the robustness of the ISM hierarchical structure analysis, the threshold used in the binarization of the total influence matrix was adjusted, and the hierarchical classification procedure was conducted again. The benchmark threshold was set as the arithmetic mean of all elements in the total influence matrix, which equals 0.0239. Following the approach of Xiao and Liu and Xiao et al., an alternative threshold defined as the mean plus variance was further adopted [48,49]. Since the variance of all elements in the total influence matrix is 0.0019, the alternative threshold is 0.0258. Based on this threshold, the adjacency matrix and the reachability matrix were reconstructed, and a new hierarchical structure of influencing factors was obtained accordingly. The results are presented in Figure 6.
Figure 6.
Robustness test of the ISM hierarchical classification results. Note: Purple nodes represent cause factors, while yellow nodes represent effect factors.
A comparison of Figure 5 and Figure 6 shows that the influencing factors of economic resilience exhibit a four-level hierarchical structure under the benchmark threshold, whereas the structure changes from four levels to three levels under the alternative threshold. As the threshold increases, the screening criterion used to transform the total influence matrix into the adjacency matrix becomes more stringent, resulting in the removal of some weak influence relationships. Consequently, the number of connections in the reachability matrix decreases, which is subsequently transmitted to the ISM hierarchical classification results and manifests as the merging of adjacent levels and a reduction in the total number of hierarchical levels. Therefore, this change is a normal outcome of the threshold adjustment.
A further examination of the hierarchical classification results shows that the overall classification remains largely consistent under the two threshold settings. Specifically, factor supply (F1), technological progress (F2), foreign capital withdrawal risks (F4), output of opening-up (F10), and innovation investment (F12) are consistently identified as deep-level factors. Factors F3, F5, and F9 remain surface-level factors, whereas Factors F6, F7, F8, F11, F13, F14, and F15 are consistently classified as intermediate-level factors. Although the number of hierarchical levels identified by the ISM model changes under different threshold settings, the hierarchical attributes of the influencing factors do not undergo any substantive change. In summary, the classification of economic resilience influencing factors into surface-level, intermediate-level, and deep-level categories remains consistent under different threshold settings, indicating that the findings of this study are robust.
7. Discussion
7.1. Conclusions
This study develops an economic resilience evaluation index system based on the DPSIR model and conducts a comprehensive analysis of the multidimensional disparities in China’s economic resilience and the systemic structure of its influencing factors. A range of analytical methods is employed, including the entropy method, standard deviation ellipse technique, Markov chains, bi-dimensional decomposition method of Gini coefficient, and the DEMATEL-ISM model. The main findings are as follows: Firstly, from 2008 to 2023, China’s ERI exhibited a steady upward trend, with a spatially decreasing gradient from the eastern region to the central, northeastern, and western regions. The spatial center of gravity shifted southeastward, characterized by significant agglomeration and centripetal tendencies, alongside marked spatial dependence across regions. Secondly, over the study period, overall disparities in economic resilience have widened. Spatially, inter-regional differences constitute the main source of this divergence. Structurally, disparities in response capacity are the dominant contributors. From a combined spatial–structural perspective, differences in influence and driving forces between the eastern and western regions have successively become the principal sources of overall disparity. Thirdly, the influencing factors of China’s economic resilience are structured into a hierarchical framework with four levels and three tiers. Foreign capital withdrawal risks, innovation investment, technological progress, factor supply, and output of opening-up are identified as deep-level factors influencing the enhancement of economic resilience.
The Report to the 19th CPC National Congress pointed out that the principal contradiction confronting Chinese society now lies in that between unbalanced and inadequate development and the people’s ever-growing aspirations for a better life. Against this backdrop, the problem of unbalanced and inadequate economic development has become an important topic of concern in the academic literature [50,51,52]. As an important indicator of the health of an economic system, economic resilience is examined in this study from the two dimensions of “unbalanced” and “inadequate” development. Specifically, the bi-dimensional decomposition method of Gini coefficient is employed to reveal the disparity characteristics of economic resilience and thereby address the issue of “unbalanced” development in economic resilience, while the DEMATEL–ISM model is used to identify the key factors influencing the improvement of economic resilience and their transmission pathways, thereby exploring the underlying causes of “inadequate” development in economic resilience.
The results indicate that China’s economic resilience is characterized by the coexistence of overall improvement and increasing regional divergence. The standard deviational ellipse analysis shows that the spatial center of gravity of economic resilience has shifted toward the southeast, indicating that the improvement in resilience has been faster in the southeastern region than in other regions. The southeastern coastal area has long been among the leading regions in China’s economic development and has consistently exhibited a relatively high ERI. Under the cumulative effects of circular and cumulative causation, the advantages of high-resilience regions have continued to strengthen, whereas the improvement of some less-developed regions has lagged behind. Consequently, a pattern has emerged in which overall economic resilience has improved nationwide while regional disparities have continued to widen. In other words, the evolution of China’s economic resilience is characterized more by a process of unbalanced improvement than by synchronized and balanced growth across regions.
The key influencing factors identified by the DEMATEL–ISM model provide further insights into the regional differentiation of economic resilience. Among them, foreign capital withdrawal risks, innovation investment, technological progress, factor supply, and output of opening-up jointly constitute the deep-level factors affecting economic resilience. High-resilience regions, represented by the southeastern coastal areas, generally possess significant advantages in these dimensions, enabling them to better withstand external shocks and maintain a relatively high level of economic resilience. Particularly noteworthy is that foreign capital withdrawal risks are identified as the deepest root factor. In recent years, driven by factors such as global economic fluctuations, geopolitical conflicts, and the rise of trade protectionism, some regions have faced increasing pressure from capital outflows. Existing studies have confirmed that the technology spillover and industrial upgrading effects associated with foreign capital inflows contribute to strengthening regional resilience to risks [53,54]. The findings of this study regarding the importance of foreign capital are broadly consistent with the existing literature and are also in line with the current economic context, thereby providing indirect support for the reliability of the results.
Compared with existing studies, this study not only reveals the existence of significant regional disparities in economic resilience across China, but also deepens the understanding of the structural sources of such disparities. Previous studies have generally found that interregional disparities constitute the primary source of differences in economic resilience, while paying relatively limited attention to their structural sources [55,56]. This study finds that response disparities represent the major structural source of overall economic resilience disparities. This suggests that regional differentiation in economic resilience is rooted more deeply in differences in response capacities, including innovation investment, environmental governance, social security, and institutional equity. These findings extend the existing literature and provide more targeted policy implications for promoting coordinated regional development.
7.2. Theoretical Implications
The core theoretical contribution of this study is set out below. Although existing research has advanced the explanatory framework of economic resilience from engineering resilience and ecological resilience toward evolutionary resilience, quantitative evaluations still tend to conceptualize economic resilience as a set of parallel capability dimensions, such as resistance, recovery, and evolution. This approach treats different capabilities as independent evaluation dimensions and, in essence, remains at the level of a static decomposition of resilience components. As a result, it is difficult to reveal the interrelationships among these dimensions and their mechanisms of co-evolution when responding to external shocks. Drawing on evolutionary resilience theory and the DPSIR model, this study moves beyond the fragmented understanding of resilience components in existing research. It argues that economic resilience is not a simple aggregation of multiple capabilities, but rather a continuous evolutionary process encompassing the accumulation of driving forces, risks exposure, state evolution, impact transmission, and adaptive responses. On this basis, the originally dispersed capability dimensions are reconstructed into a causal chain characterized by dynamic feedback, enabling a comprehensive depiction of the entire process through which economic systems respond to external shocks. This study not only extends the application of the DPSIR model in the field of regional economics, but also provides a new theoretical perspective for understanding the dynamic evolutionary patterns of regional economic systems and the formation logic of economic resilience.
7.3. Practical Implications
Based on the above findings, the following policy recommendations are proposed. First, China’s economic resilience exhibits a declining gradient pattern of “Eastern–Central–Northeastern–Western”. Moreover, interregional disparities constitute the primary source of the widening overall disparities, indicating that the development of economic resilience remains markedly unbalanced across regions. To address this issue, full advantage should be taken of the eastern region’s strengths in terms of economic foundations, innovation resources, and openness. Building on major national strategies such as the Coordinated Development of the Beijing–Tianjin–Hebei Region, the Integrated Development of the Yangtze River Delta, and the Guangdong–Hong Kong–Macao Greater Bay Area, efforts should be made to strengthen industrial cooperation and innovation linkages between the eastern region and the central, western, and northeastern regions. Promoting technology diffusion and the sharing of industrial upgrading experience will help enhance the capacities of less-developed regions to withstand and recover from shocks, thereby fostering the coordinated improvement of economic resilience across regions.
Second, the results indicate that response disparities constitute the primary source of economic resilience disparities in China. In essence, these disparities reflect uneven development across regions in key response dimensions, including innovation investment, environmental governance, social security, and institutional equity. To address this issue, policy optimization should be advanced in a coordinated manner across these areas. Specifically, efforts should be made to implement the innovation-driven development strategy in a coordinated way, strengthen support for R&D investment, and promote the cross-regional allocation of innovation resources. Ecological civilization development should be advanced alongside joint pollution prevention and control mechanisms to improve the balance of pollution treatment and ecological restoration capacities across regions. The transfer and continuity mechanisms of social security benefits across regions should be further improved to enhance the stability and portability of employment and pension security systems. In addition, efforts should be made to promote the equalization of basic public services and improve the accessibility and equity of public service provision in healthcare, education, and transportation. Together, these measures will help reduce the structural disparities in economic resilience.
Third, the results show that foreign capital withdrawal risks, innovation investment, technological progress, factor supply, and output of opening-up are the deep-level factors influencing the improvement of economic resilience in China. Improvements in these five factors play a significant role in enhancing China’s economic resilience. Accordingly, in terms of stabilizing foreign investment, efforts should be made to improve the dynamic monitoring and service mechanisms for key foreign-invested enterprises, establish a sound risk early-warning and response system for foreign capital withdrawal, and strengthen domestic substitution capacity in critical segments of industrial chains, thereby minimizing the adverse impacts of foreign capital withdrawal on economic performance. With regard to opening-up, measures should be taken to enhance the stability and quality of output of opening-up by expanding the coverage of export credit insurance, promoting the use of exchange rate hedging instruments, and improving customs clearance facilitation. In terms of innovation investment and technological progress, greater efforts should be devoted to advancing breakthroughs in key core technologies and strengthening innovation support for small and medium-sized enterprises. At the same time, the performance evaluation mechanism for innovation investment should be improved to enhance resource allocation efficiency, and deeper integration among industry, universities, research institutes, and users should be promoted to accelerate the commercialization of scientific and technological achievements. Regarding factor supply, further reforms of the household registration and social security systems should be advanced, cross-regional factor mobility mechanisms should be improved, and the market-based allocation efficiency of factors such as labor and capital should be enhanced. These measures will strengthen the foundational supporting role of factor supply in maintaining stable economic operation.
7.4. Limitations and Future Research
This study still has several limitations. First, although an economic resilience evaluation system covering economic, industrial, social, and ecological dimensions was constructed based on the DPSIR framework, and the robustness of the measurement results was verified using the improved CRITIC method and the vertical and horizontal dispersion method, economic resilience remains a multidimensional and complex system in which different indicators are inherently interrelated and interactive. Consequently, potential information overlap and correlations among indicators cannot be completely eliminated in the process of comprehensive evaluation. Future research could further integrate intelligent evaluation approaches, such as kernel principal component analysis and deep autoencoders, to conduct structured dimensionality reduction in the indicator system. By removing redundant information while preserving the core characteristics of economic resilience, these approaches may further enhance the scientific rigor of the evaluation results.
Second, to reduce the potential subjective bias associated with expert scoring, this study constructed the direct influence matrix based on the relative magnitudes of the weights assigned to economic resilience evaluation indicators and employed the DEMATEL–ISM model to identify the systemic structure of factors influencing economic resilience. Although this approach makes full use of objective data and improves the objectivity and reproducibility of the analytical process, constructing the direct influence matrix on the basis of indicator weights is essentially a simplified treatment. The characterization of relationships among factors relies primarily on weight information and therefore cannot fully capture the actual interaction processes among factors within a complex economic system. In addition, the DEMATEL–ISM model is fundamentally a systems science approach. Its primary function is to identify the relational structure, transmission pathways, and hierarchical relationships among factors within a complex system, rather than to serve as a causal identification tool in the strict sense. Future research could further integrate econometric approaches, such as the difference-in-differences method, instrumental variable techniques, and mediation effect models, to conduct more rigorous identification and testing of the effects of relevant factors. Such efforts would provide more reliable empirical evidence for enhancing economic resilience.
Author Contributions
Conceptualization, T.H. and X.Y. (Xiaoling Yuan); methodology, T.H. and R.L.; validation, X.Y. (Xiaoling Yuan) and T.H.; formal analysis, T.H.; resources, X.Y. (Xiaoling Yuan); data curation, T.H., X.Y. (Xinyu Yuan) and R.L.; writing—original draft preparation, T.H.; writing—review and editing, T.H., X.Y. (Xiaoling Yuan) and X.Y. (Xinyu Yuan); visualization, X.Y. (Xinyu Yuan) and R.L.; supervision, T.H. and X.Y. (Xiaoling Yuan); funding acquisition, X.Y. (Xiaoling Yuan). All authors have read and agreed to the published version of the manuscript.
Funding
This research was funded by Ministry of Education Key Projects of Philosophy and Social Sciences Research, grant number 20JZD012; National Social Science Fund Youth Project, grant number 23CTJ008.
Data Availability Statement
All data and materials are available upon request.
Conflicts of Interest
The authors declare no conflicts of interest.
References
- Choi, S.-Y. The dynamic network of industries in US stock market: Evidence of GFC, COVID-19 pandemic and Russia-Ukraine war. Heliyon 2023, 9, e19726. [Google Scholar] [CrossRef] [Scilit] [PubMed]
- Hoque, M.E.; Sahabuddin, M.; Bilgili, F. Volatility interconnectedness among financial and geopolitical markets: Evidence from COVID-19 and Ukraine-Russia crises. Econ. Anal. Policy 2024, 82, 303–320. [Google Scholar] [CrossRef] [Scilit]
- Wang, Z.; Wei, W. Regional economic resilience in China: Measurement and determinants. Reg. Stud. 2021, 55, 1228–1239. [Google Scholar] [CrossRef] [Scilit]
- Di Pietro, F.; Lecca, P.; Salotti, S. Regional economic resilience in the European Union: A numerical general equilibrium analysis. Spat. Econ. Anal. 2021, 16, 287–312. [Google Scholar] [CrossRef] [Scilit]
- Trippl, M.; Fastenrath, S.; Isaksen, A. Rethinking regional economic resilience: Preconditions and processes shaping transformative resilience. Eur. Urban Reg. Stud. 2024, 31, 101–115. [Google Scholar] [CrossRef] [Scilit]
- Brakman, S. Heterogeneous economic resilience and the great recession’s world trade collapse. Pap. Reg. Sci. 2017, 96, 3–13. [Google Scholar] [CrossRef] [Scilit]
- Du, Y.; Wang, Q.; Zhou, J. How does digital inclusive finance affect economic resilience: Evidence from 285 cities in China. Int. Rev. Financ. Anal. 2023, 88, 102709. [Google Scholar] [CrossRef] [Scilit]
- Martin, R. Regional economic resilience, hysteresis and recessionary shocks. J. Econ. Geogr. 2012, 12, 1–32. [Google Scholar] [CrossRef] [Scilit]
- Jiang, D.; Wang, X.; Zhao, R. Analysis on the economic recovery in the post-COVID-19 era: Evidence from China. Front. Public Health 2022, 9, 787190. [Google Scholar] [CrossRef] [Scilit] [PubMed]
- Ma, S.; Huang, J. Analysis of the spatio-temporal coupling coordination mechanism supporting economic resilience and high-quality economic development in the urban agglomeration in the middle reaches of the Yangtze River. PLoS ONE 2023, 18, e0281643. [Google Scholar] [CrossRef] [Scilit] [PubMed]
- Cheng, T.; Zhao, Y.; Zhao, C. Exploring the spatio-temporal evolution of economic resilience in Chinese cities during the COVID-19 crisis. Sustain. Cities Soc. 2022, 84, 103997. [Google Scholar] [CrossRef] [Scilit]
- Wang, H.; Ge, Q. Spatial association network of economic resilience and its influencing factors: Evidence from 31 Chinese provinces. Humanit. Soc. Sci. Commun. 2023, 10, 290. [Google Scholar] [CrossRef] [Scilit] [PubMed]
- Zhang, Q.; Lin, Y.; Cao, Y.; Luo, L. Analysis of the Spatiotemporal Heterogeneity and Influencing Factors of Regional Economic Resilience in China. Entropy 2025, 27, 23. [Google Scholar] [CrossRef] [Scilit] [PubMed]
- Chen, S.; Wang, D. The measurement, decomposition, and driving mechanism of economic resilience of Chinese urban agglomerations. East Econ. Manag. 2022, 36, 1–13. [Google Scholar] [CrossRef]
- Tan, J.; Zhao, H.; Liu, W.; Zhang, P.; Qiu, F. Regional economic resilience and influential mechanism during economic crisis in China. Geogr. Sci. 2020, 40, 173–181. [Google Scholar] [CrossRef]
- Cheng, K.; Wang, X.; Liu, S.; Zhuang, Y. Spatial differences and dynamic evolution of economic resilience: From the perspective of China’s eight comprehensive economic zones. Econ. Change Restruct. 2024, 57, 73. [Google Scholar] [CrossRef] [Scilit]
- Li, C.; Yu, G.; Deng, H.; Liu, J.; Li, D. Spatio-temporal pattern and the evolution of the distributional dynamics of county-level agricultural economic resilience in China. PLoS ONE 2024, 19, e0300601. [Google Scholar] [CrossRef] [Scilit] [PubMed]
- Zhang, Y.; Tan, Y.; Qiao, Z. A configuration analysis of urban economic resilience under identical external shocks. J. Zhengzhou Univ. (Philos. Soc. Sci. Ed.) 2023, 56, 41–47. [Google Scholar]
- Huang, J.; Li, Q.; Du, M.; Chen, X. Spatial and temporal variation of economic resilience and its drivers: Evidence from Chinese cities. Front. Environ. Sci. 2023, 11, 1109857. [Google Scholar] [CrossRef] [Scilit]
- Xiao, S.; Zhou, P.; Zhou, L.; Wong, S. Digital economy and urban economic resilience: The mediating role of technological innovation and entrepreneurial vitality. PLoS ONE 2024, 19, e0303782. [Google Scholar] [CrossRef] [Scilit] [PubMed]
- Chen, H.; Xu, J.; Zhang, K.; Guo, S.; Lv, X.; Mu, X.; Yang, L.; Song, Y.; Hu, X.; Ma, Y. New insights into the DPSIR model: Revealing the dynamic feedback mechanism and efficiency of ecological civilization construction in China. J. Clean. Prod. 2022, 348, 131377. [Google Scholar] [CrossRef] [Scilit]
- Lu, W.; Xu, C.; Wu, J.; Cheng, S. Ecological effect assessment based on the DPSIR model of a polluted urban river during restoration: A case study of the Nanfei River, China. Ecol. Indic. 2019, 96, 146–152. [Google Scholar] [CrossRef] [Scilit]
- Wen, T.; Qi, S.; Qian, Y. Index measurement and analysis on spatial-temporal evolution of China’s new economy based on the DPSIR model. Int. Rev. Econ. Financ. 2024, 90, 252–264. [Google Scholar] [CrossRef] [Scilit]
- Karimi Sangchini, E.; Salehpour Jam, A.; Mosaffaie, J. Flood risk management in Khorramabad watershed using the DPSIR framework. Nat. Hazards 2022, 114, 3101–3121. [Google Scholar] [CrossRef] [Scilit]
- Woods, D.D. Four concepts for resilience and the implications for the future of resilience engineering. Reliab. Eng. Syst. Saf. 2015, 141, 5–9. [Google Scholar] [CrossRef] [Scilit]
- Simmie, J.; Martin, R. The economic resilience of regions: Towards an evolutionary approach. Camb. J. Reg. Econ. Soc. 2010, 3, 27–43. [Google Scholar] [CrossRef] [Scilit]
- Martin, R.; Sunley, P.; Gardiner, B.; Tyler, P. How regions react to recessions: Resilience and the role of economic structure. Reg. Stud. 2016, 50, 561–585. [Google Scholar] [CrossRef] [Scilit]
- Baumgärtner, S.; Strunz, S. The economic insurance value of ecosystem resilience. Ecol. Econ. 2014, 101, 21–32. [Google Scholar] [CrossRef] [Scilit]
- Boschma, R. Towards an evolutionary perspective on regional resilience. Reg. Stud. 2015, 49, 733–751. [Google Scholar] [CrossRef] [Scilit]
- Halmai, P. Resilience in Focus. Certain Mechanisms of the Deepening of the Economic and Monetary Union. Pénzügyi Szle./Public Financ. Q. 2021, 66, 7–31. [Google Scholar] [CrossRef] [Scilit]
- Martin, R.; Sunley, P. On the notion of regional economic resilience: Conceptualization and explanation. J. Econ. Geogr. 2015, 15, 1–42. [Google Scholar] [CrossRef] [Scilit]
- Deng, Z.; Song, S.; Jiang, N.; Pang, R. Sustainable development in China? A nonparametric decomposition of economic growth. China Econ. Rev. 2023, 81, 102041. [Google Scholar] [CrossRef] [Scilit]
- Anakpo, G.; Oyenubi, A. Technological innovation and economic growth in Southern Africa: Application of panel dynamic OLS regression. Dev. South. Afr. 2022, 39, 543–557. [Google Scholar] [CrossRef] [Scilit]
- Li, Y. The nexus between local government debt risk, real estate sector, and financial stability. Financ. Res. Lett. 2024, 69, 106075. [Google Scholar] [CrossRef] [Scilit]
- Xue, L.; Li, H.; Xu, C.; Zhao, X.; Zheng, Z.; Li, Y.; Liu, W. Impacts of industrial structure adjustment, upgrade and coordination on energy efficiency: Empirical research based on the extended STIRPAT model. Energy Strategy Rev. 2022, 43, 100911. [Google Scholar] [CrossRef] [Scilit]
- Deng, X.; Liang, L.; Wu, F.; Wang, Z.; He, S. A review of the balance of regional development in China from the perspective of development geography. J. Geogr. Sci. 2022, 32, 3–22. [Google Scholar] [CrossRef] [Scilit]
- Xu, G. The Conjunction and Horizon of Common Wealth and Equalization of Basic Public Services in Urban and Rural Areas. Public Policy Adm. 2022, 6, 56–61. [Google Scholar] [CrossRef] [Scilit]
- Zhang, M.; Sun, X.; Wang, W. Study on the effect of environmental regulations and industrial structure on haze pollution in China from the dual perspective of independence and linkage. J. Clean. Prod. 2020, 256, 120748. [Google Scholar] [CrossRef] [Scilit]
- Mussard, S. The bidimensional decomposition of the Gini ratio. A case study: Italy. Appl. Econ. Lett. 2004, 11, 503–505. [Google Scholar] [CrossRef] [Scilit]
- He, Y.; Kang, J.; Pei, Y.; Ran, B.; Song, Y. Research on influencing factors of fuel consumption on superhighway based on DEMATEL-ISM model. Energy Policy 2021, 158, 112545. [Google Scholar] [CrossRef] [Scilit]
- Zhang, Y.; Huang, G. Evaluation of industrial development quality and analysis of influencing factors in Xi’an, China. Environ. Sci. Pollut. Res. 2022, 29, 79388–79412. [Google Scholar] [CrossRef] [Scilit] [PubMed]
- Yuan, H.; Wang, T. Critical influencing factors identification and action mechanism analysis of the sustainable development of government data openness. Libr. Inf. Serv. 2022, 66, 53–65. [Google Scholar] [CrossRef]
- Khanam, S.; Siddiqui, J.; Talib, F. A DEMATEL approach for prioritizing the TQM enablers and IT resources in the Indian ICT industry. Int. J. Appl. Manag. Sci. Eng. 2016, 3, 11–29. [Google Scholar] [CrossRef] [Scilit]
- Kugler, M. Spillovers from foreign direct investment: Within or between industries? J. Dev. Econ. 2006, 80, 444–477. [Google Scholar] [CrossRef] [Scilit]
- Li, X.; Zhou, W.; Hou, J. Research on the impact of OFDI on the home country’s global value chain upgrading. Int. Rev. Financ. Anal. 2021, 77, 101862. [Google Scholar] [CrossRef] [Scilit]
- Kisswani, K.M.; Zaitouni, M. Does FDI affect environmental degradation? Examining pollution haven and pollution halo hypotheses using ARDL modelling. J. Asia Pac. Econ. 2023, 28, 1406–1432. [Google Scholar] [CrossRef] [Scilit]
- Yu, D.; Li, X.; Yu, J.; Li, H. The impact of the spatial agglomeration of foreign direct investment on green total factor productivity of Chinese cities. J. Environ. Manag. 2021, 290, 112666. [Google Scholar] [CrossRef] [Scilit] [PubMed]
- Xiao, L.; Liu, W. Analysis of influencing factors of port service supply chain elasticity based on DEMATEL-ISM. Logist. Technol. 2024, 43, 104–118. [Google Scholar]
- Xiao, H.; Chen, C.; Dong, Y.; Zhou, J. Study on the influencing factors of ecological product value realization in national parks based on improved DEMATEL-ISM. Ecol. Econ. 2025, 41, 220–227. [Google Scholar]
- Liu, Q.; Xu, S.; Lu, X. Imbalance measurement of regional economic quality development: Evidence from China. Ann. Reg. Sci. 2020, 65, 527–556. [Google Scholar] [CrossRef] [Scilit]
- Liu, G.; Liu, Y.; Zhang, C. Factor allocation, economic growth and unbalanced regional development in China. World Econ. 2018, 41, 2439–2463. [Google Scholar] [CrossRef] [Scilit]
- Yang, W.; Huang, R.; Li, D. China’s high-quality economic development: A study of regional variations and spatial evolution. Econ. Change Restruct. 2024, 57, 86. [Google Scholar] [CrossRef] [Scilit]
- Bernat, M.; Łukaniszyn-Domaszewska, K.; Romaniuk, U.; Szewczyk, M. The role of FDI in building integrated resilience of regional development during economic crises. Econ. Environ. 2024, 91, 987. [Google Scholar] [CrossRef] [Scilit]
- Lv, H.; Lian, Y.; Hua, X. The relationship between FDI quality, new quality productivity forces, and economic resilience in China’s Yangtze River Delta region: Insights from an empirical spatial Durbin model. Humanit. Soc. Sci. Commun. 2025, 12, 1083. [Google Scholar] [CrossRef] [Scilit]
- Wang, S.; Zhang, Q.; Sun, M.; Teng, Y. Has urban public service equalization reduced regional differences in economic resilience? PLoS ONE 2024, 19, e0303236. [Google Scholar] [CrossRef] [Scilit] [PubMed]
- Shi, T.; Qiao, Y.; Zhou, Q.; Zhang, J. The regional differences and random convergence of urban resilience in China. Technol. Econ. Dev. Econ. 2022, 28, 979–1002. [Google Scholar] [CrossRef] [Scilit]
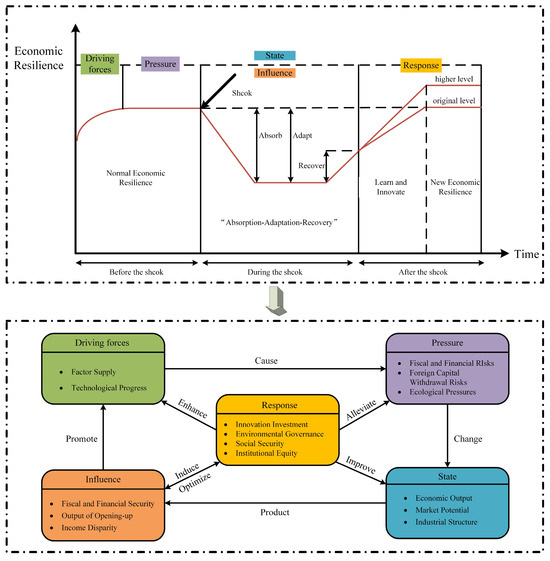
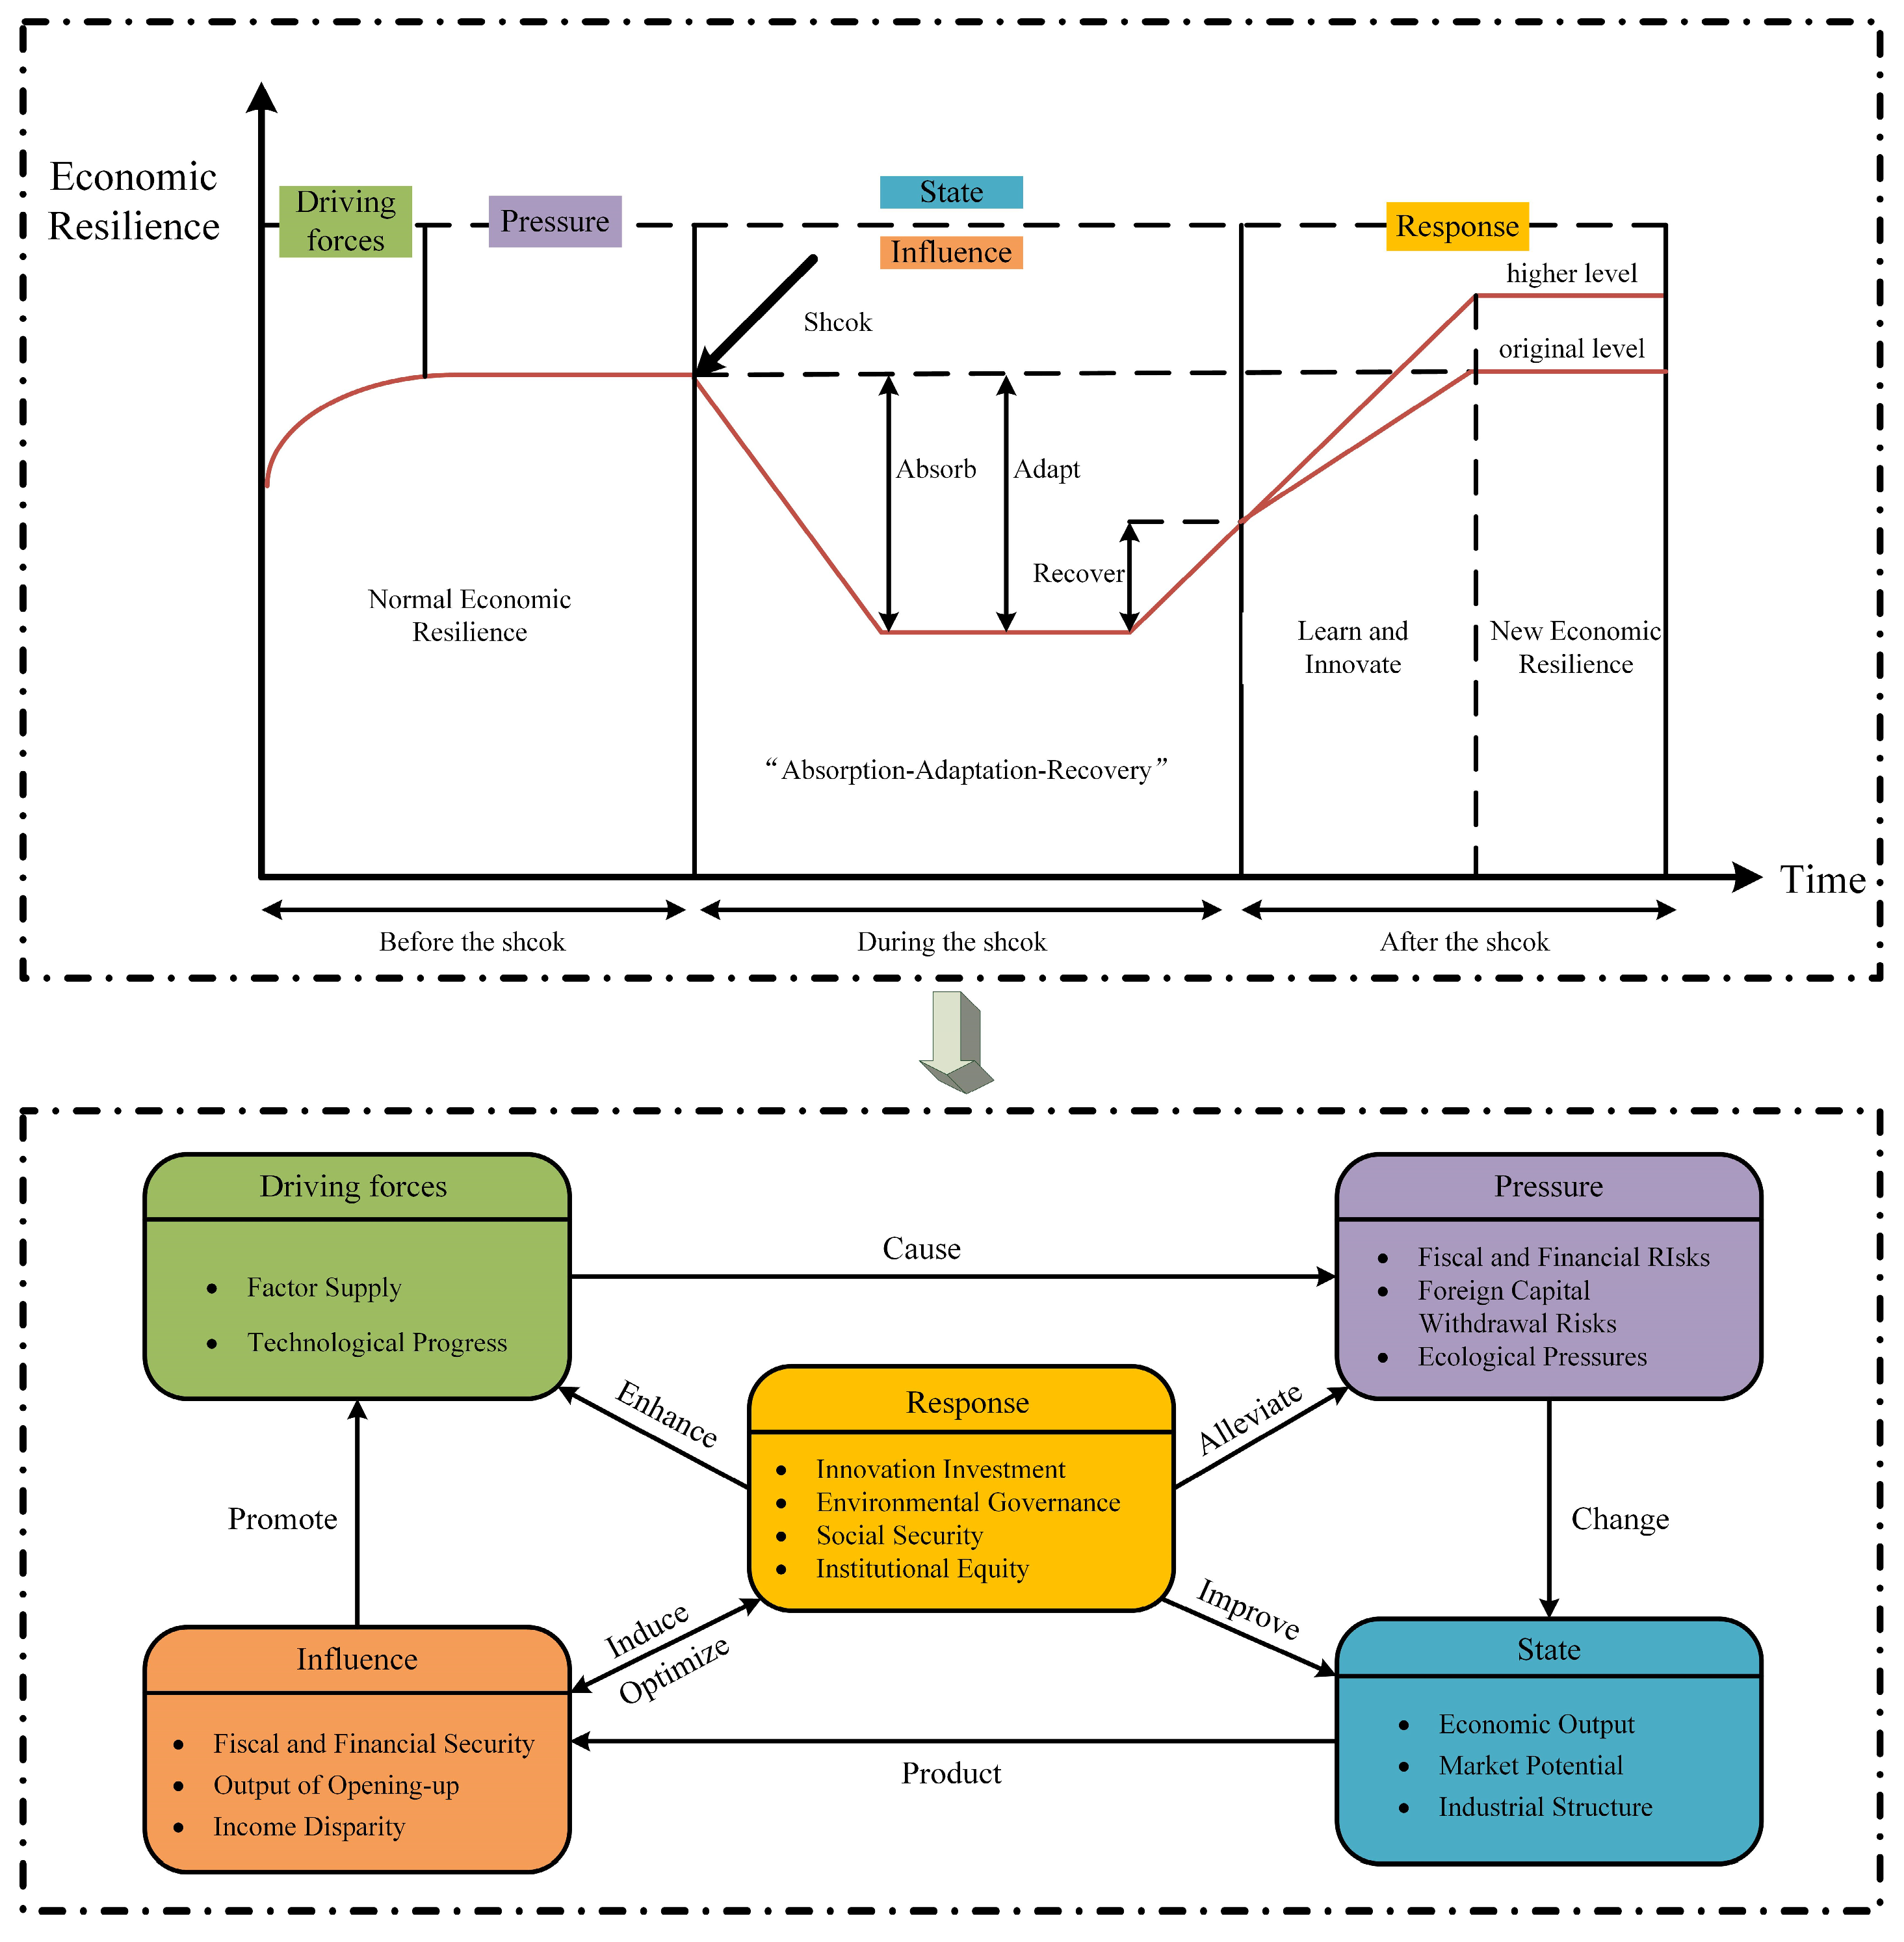
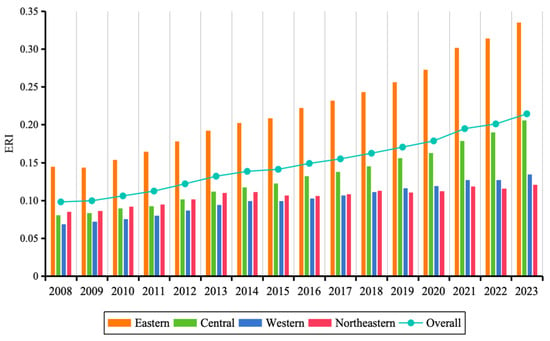
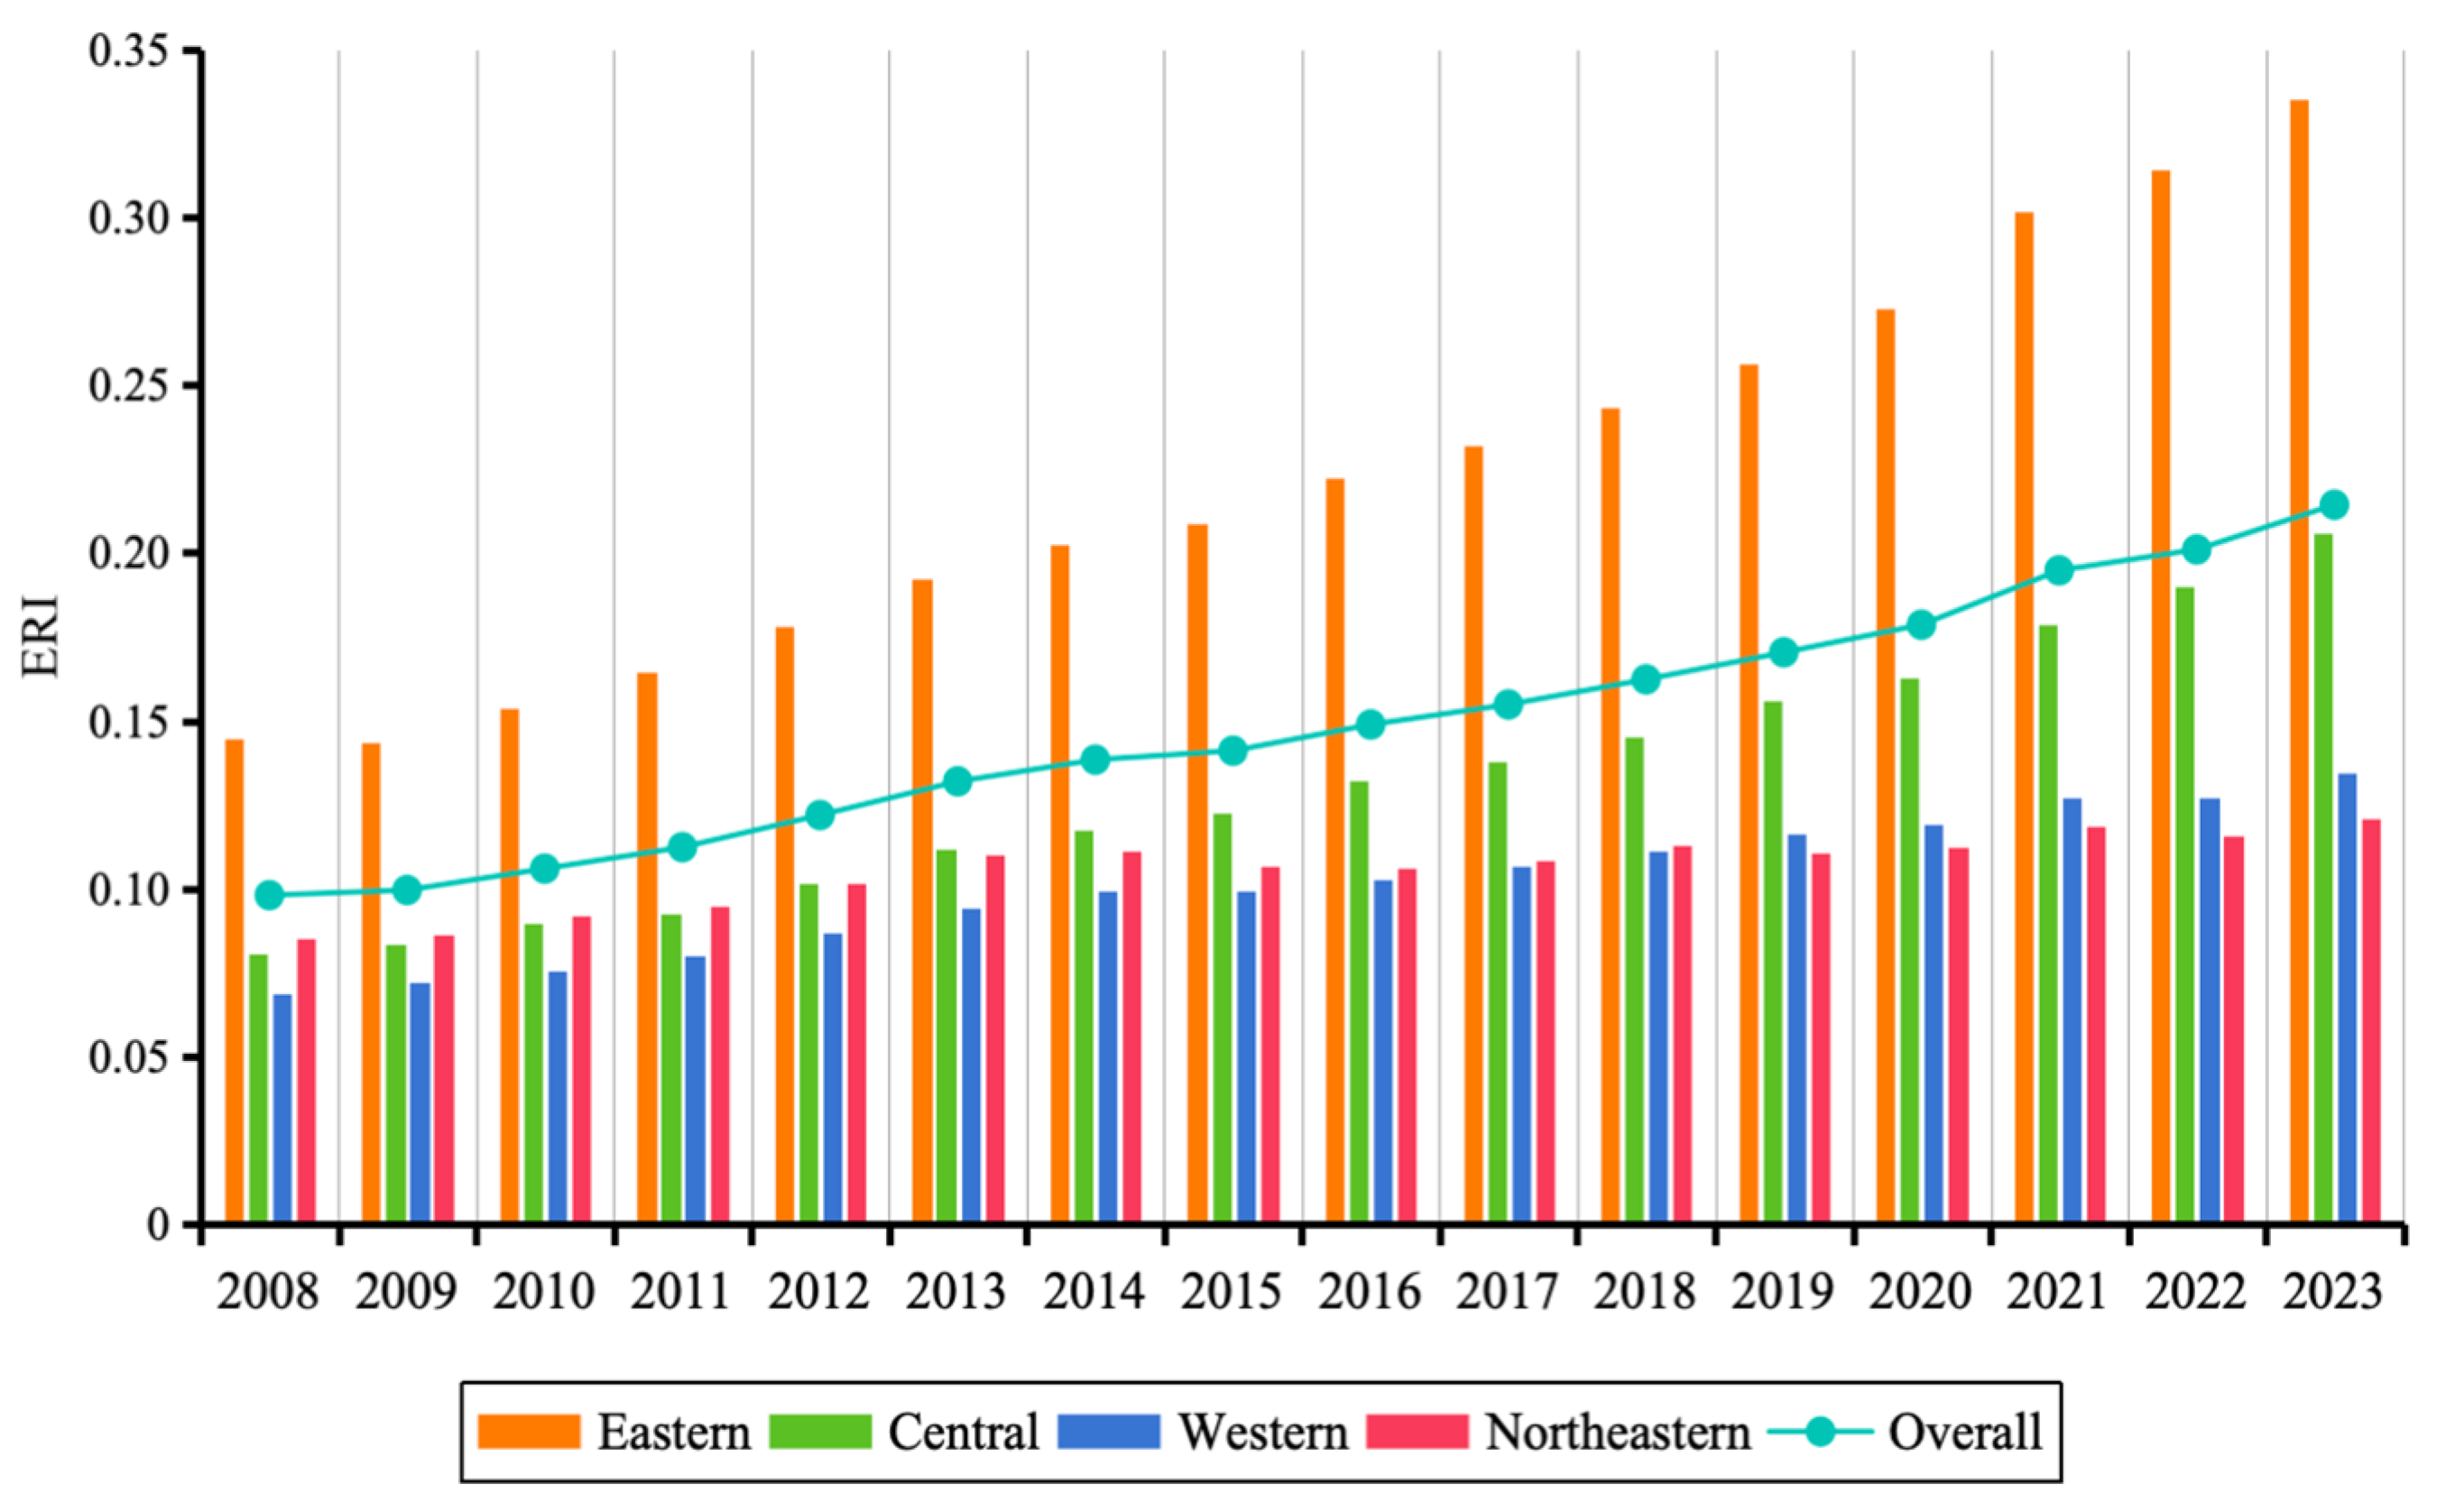
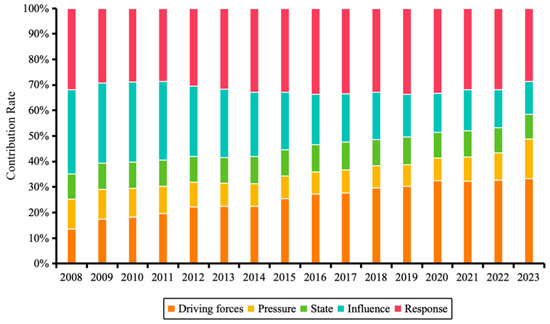
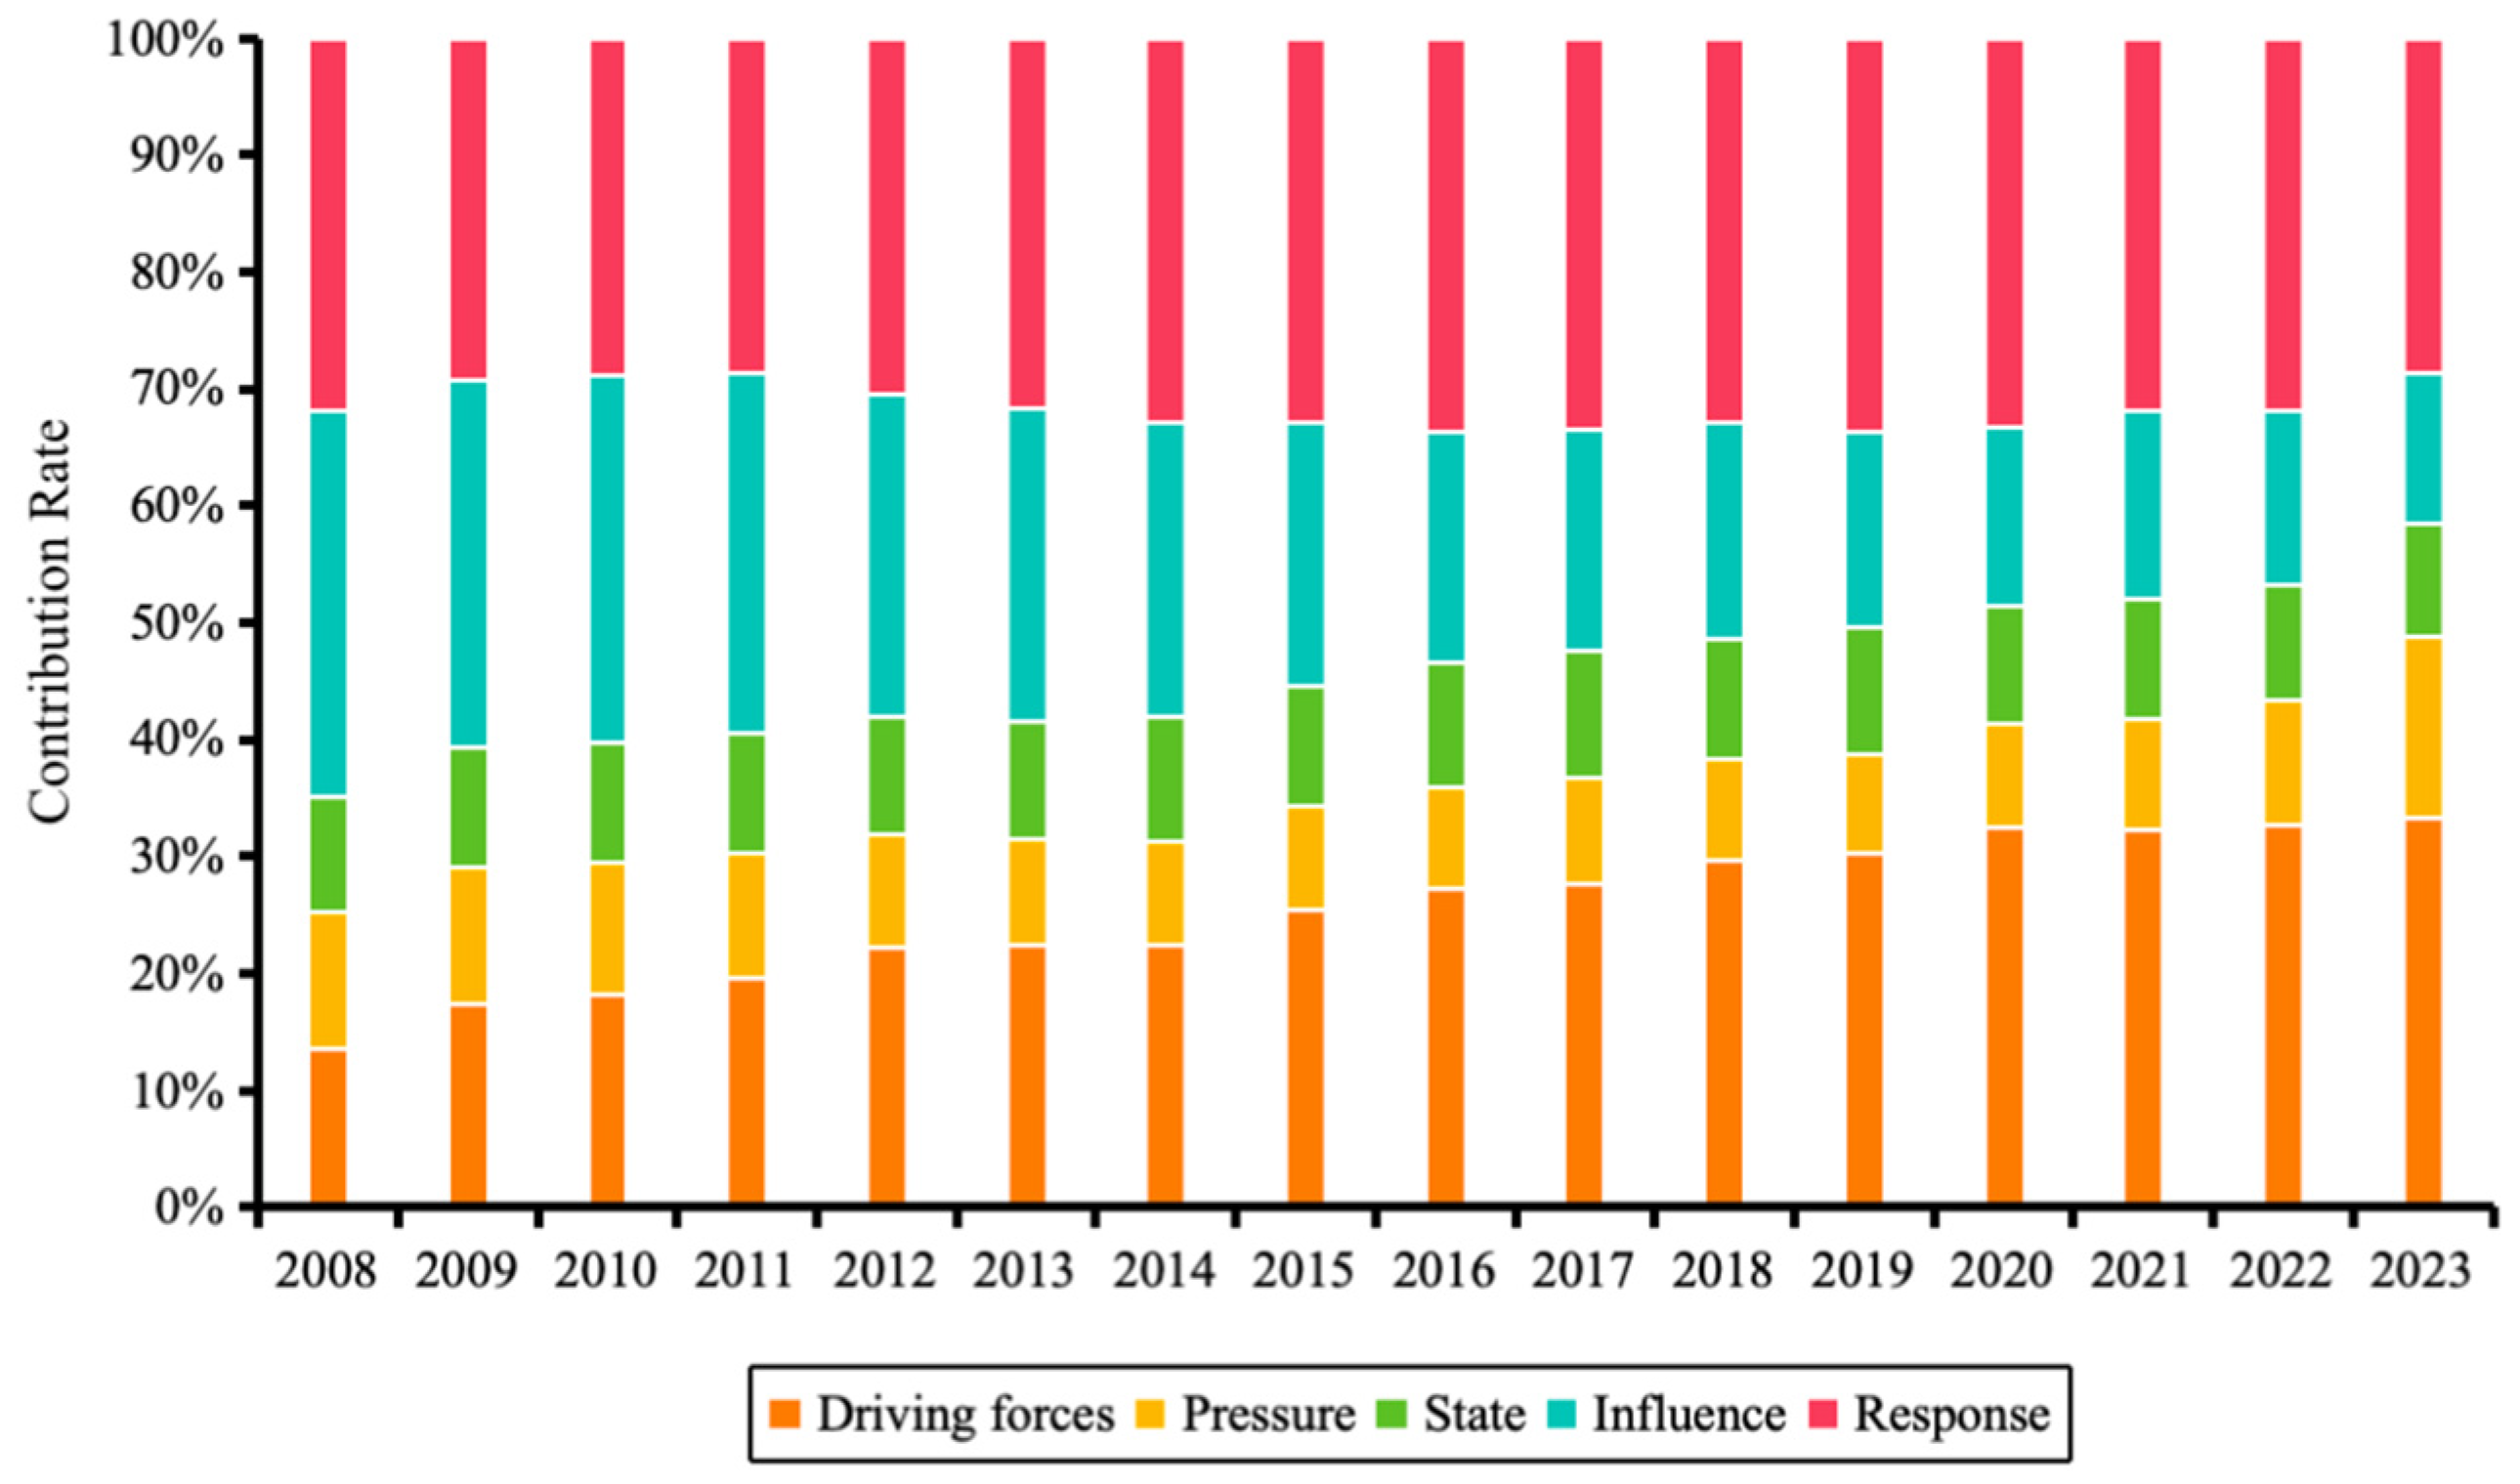
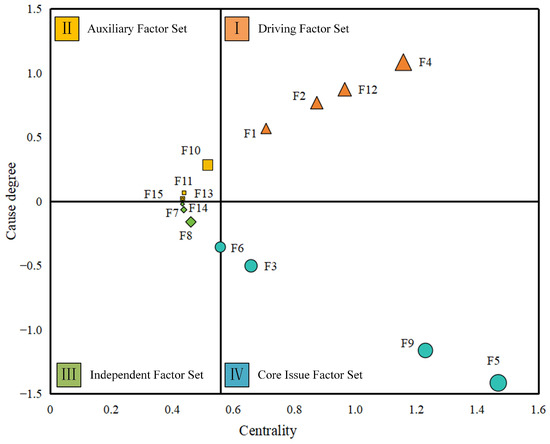
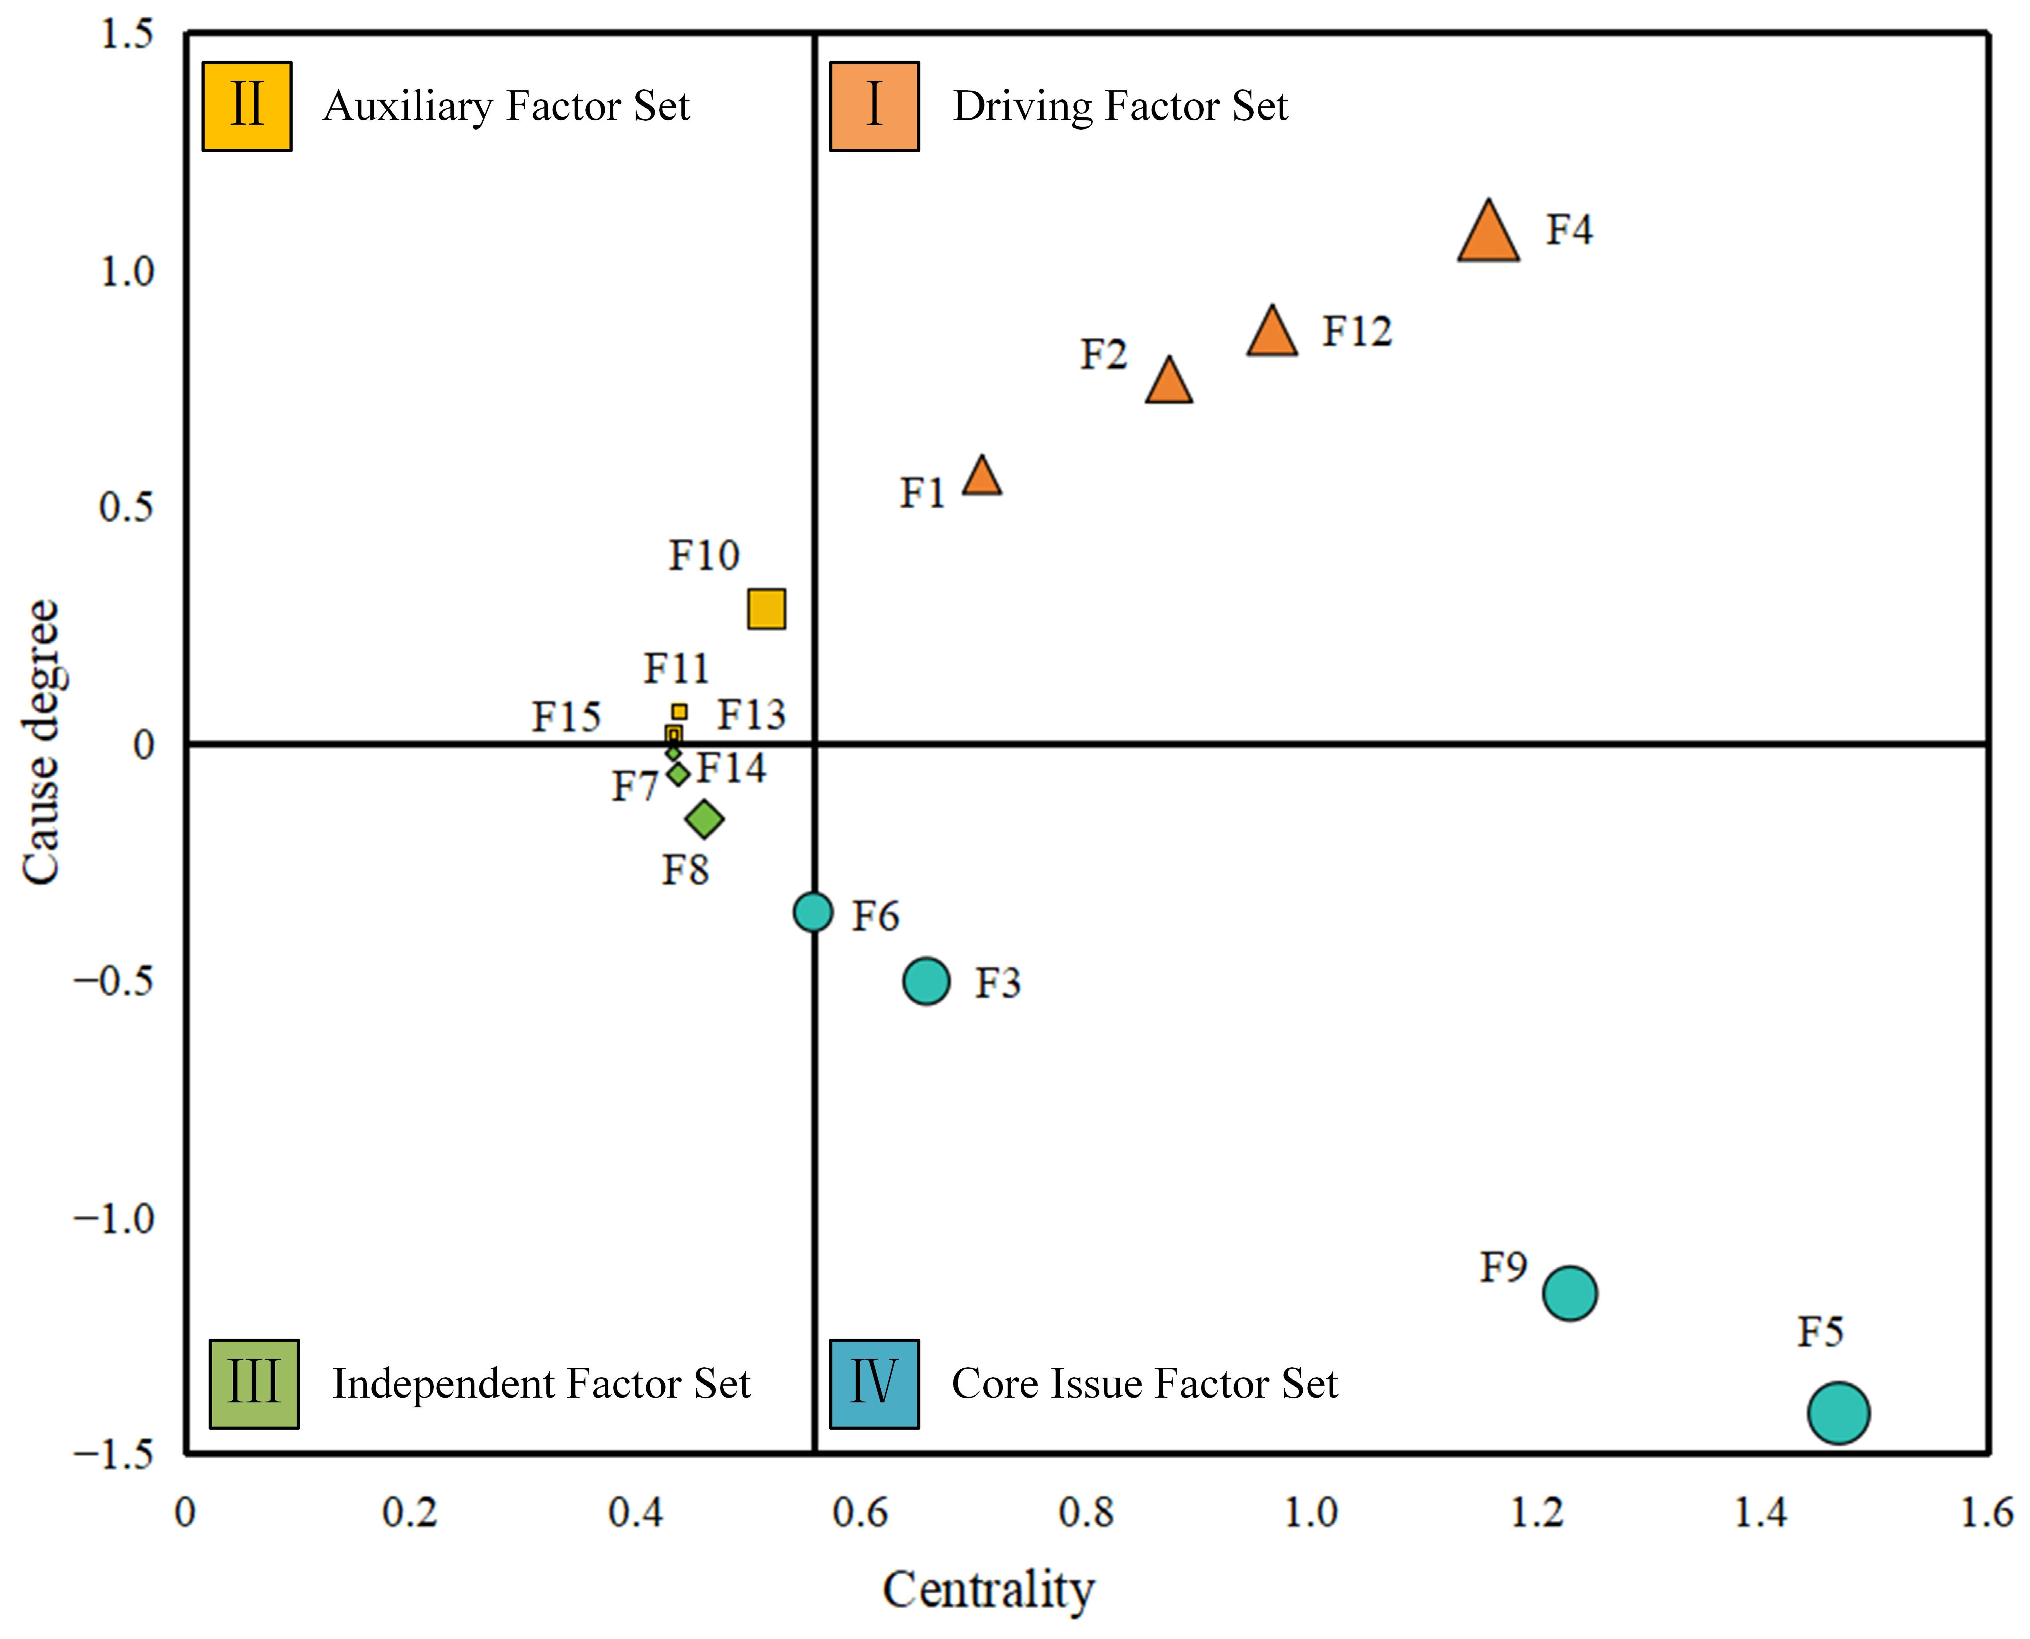
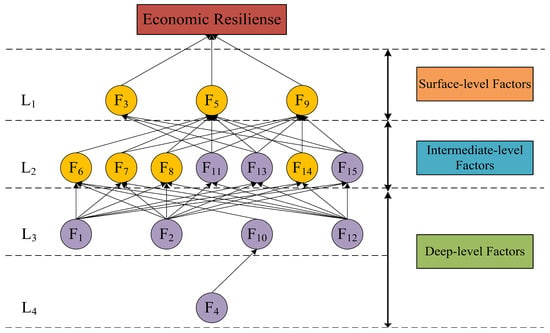
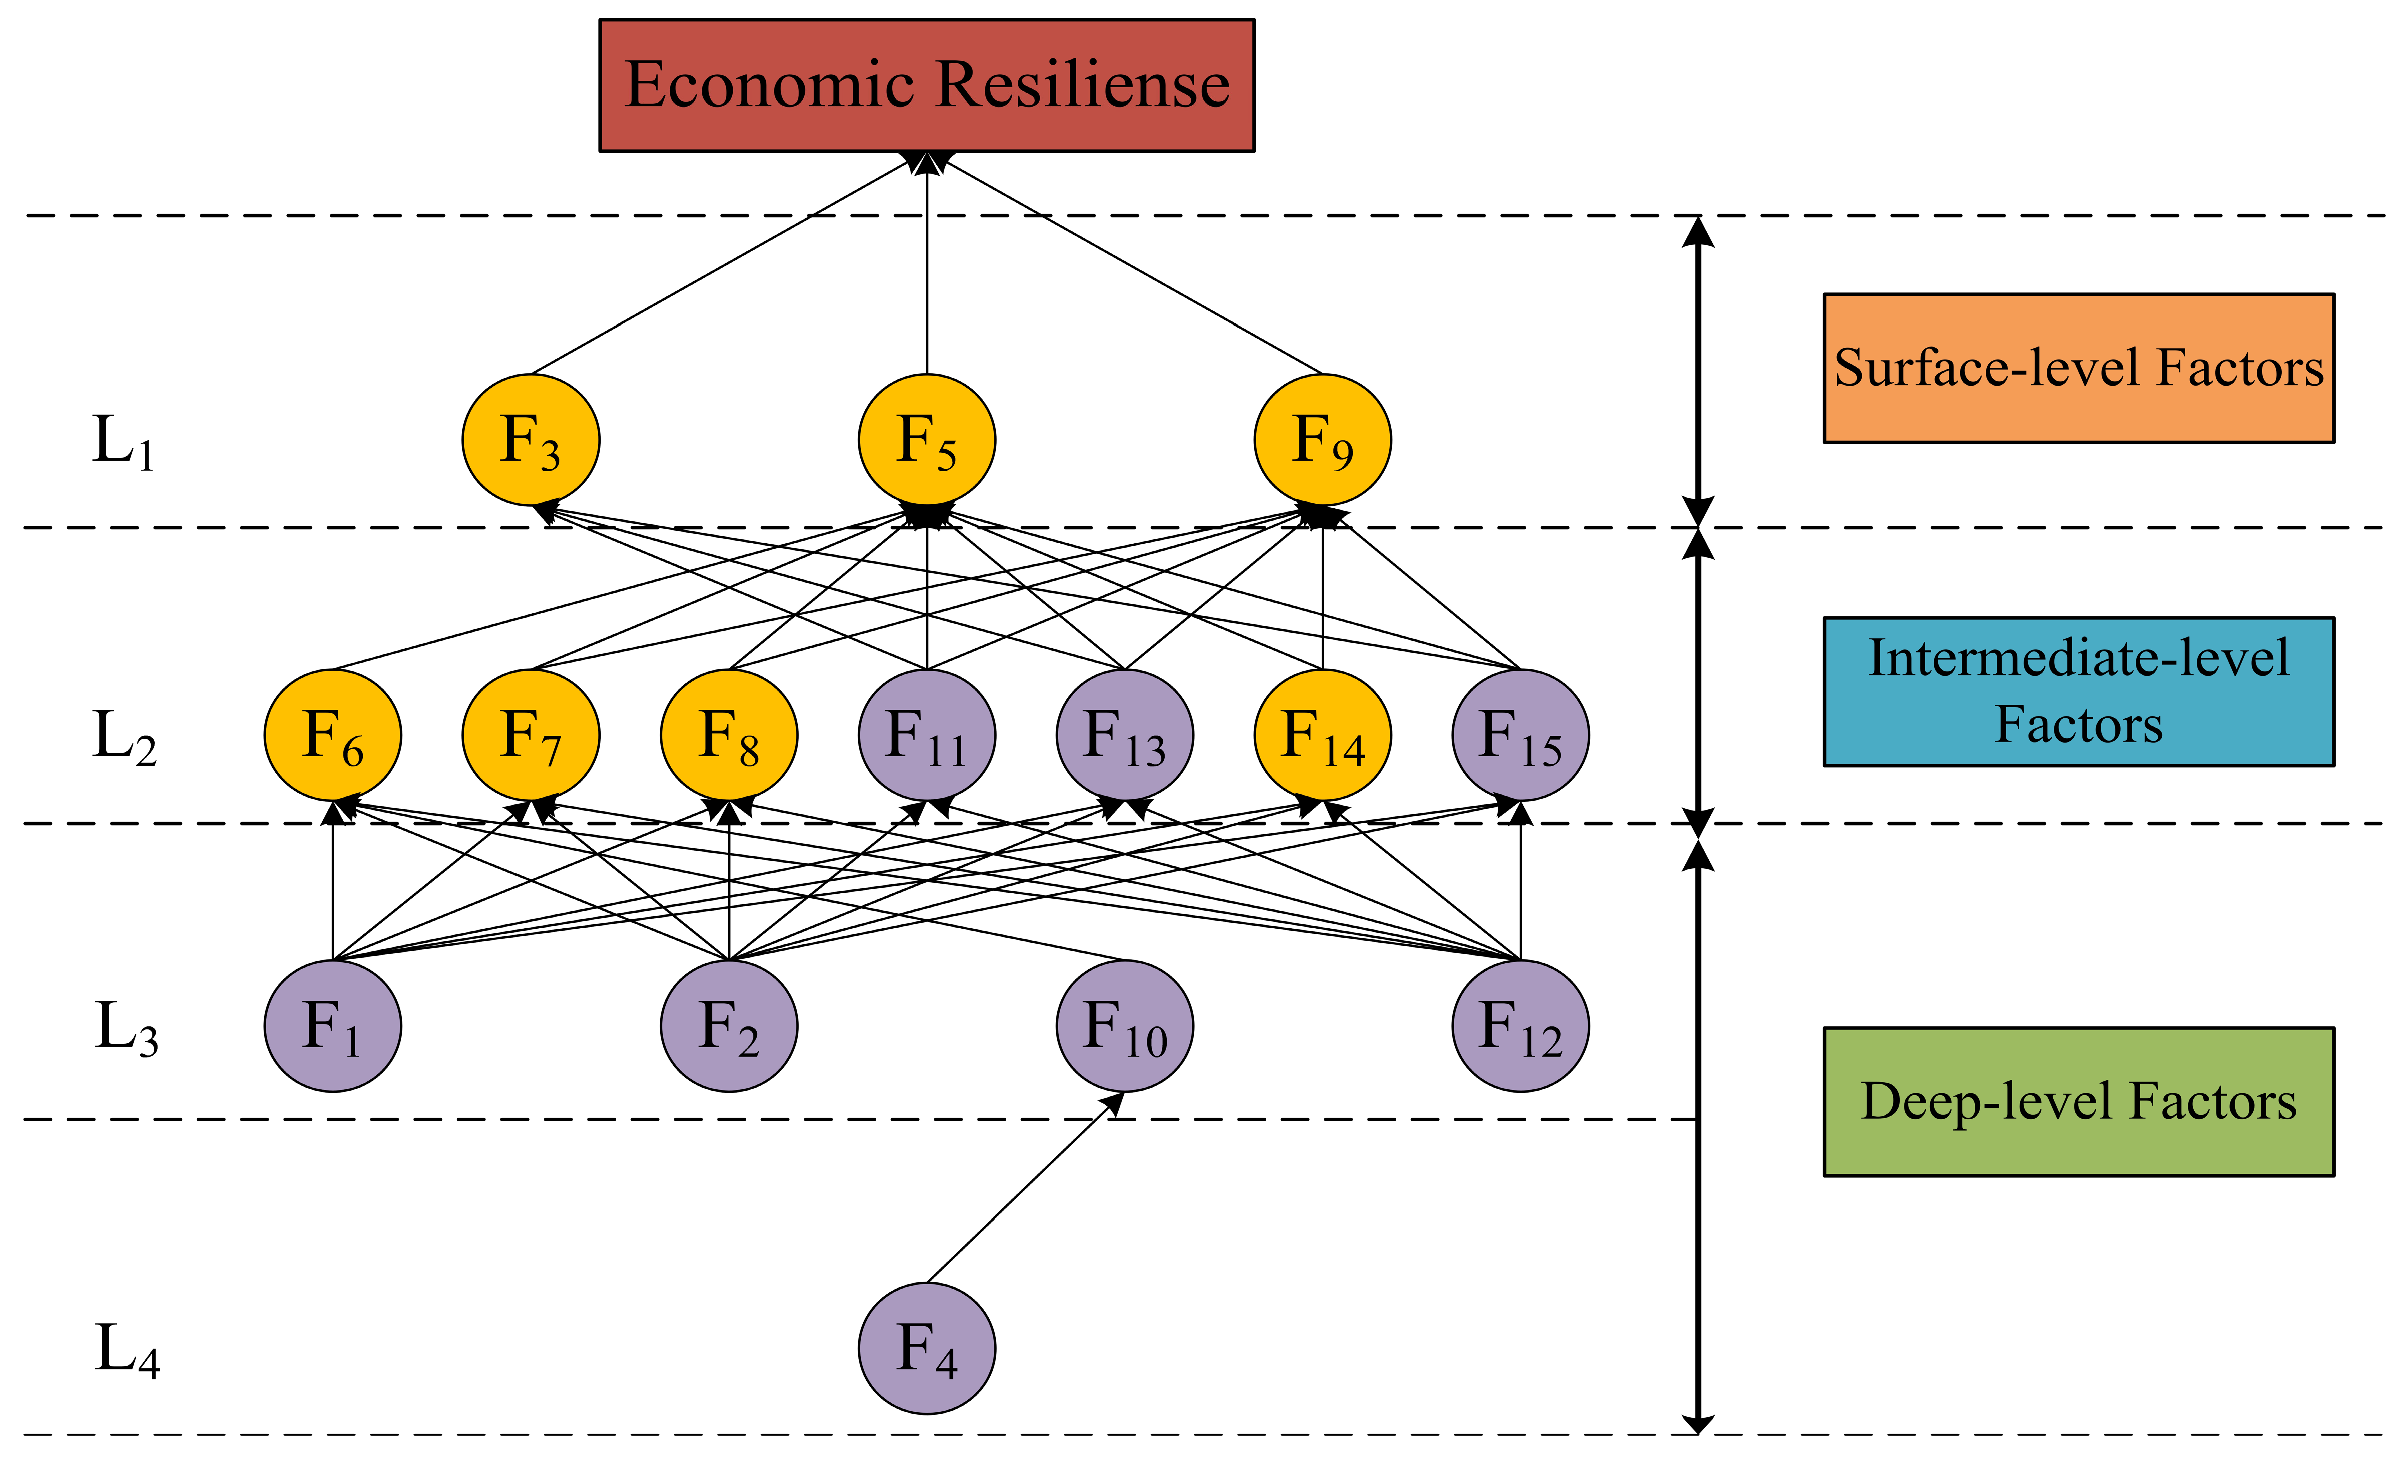
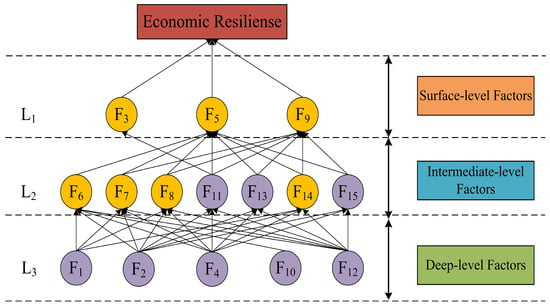
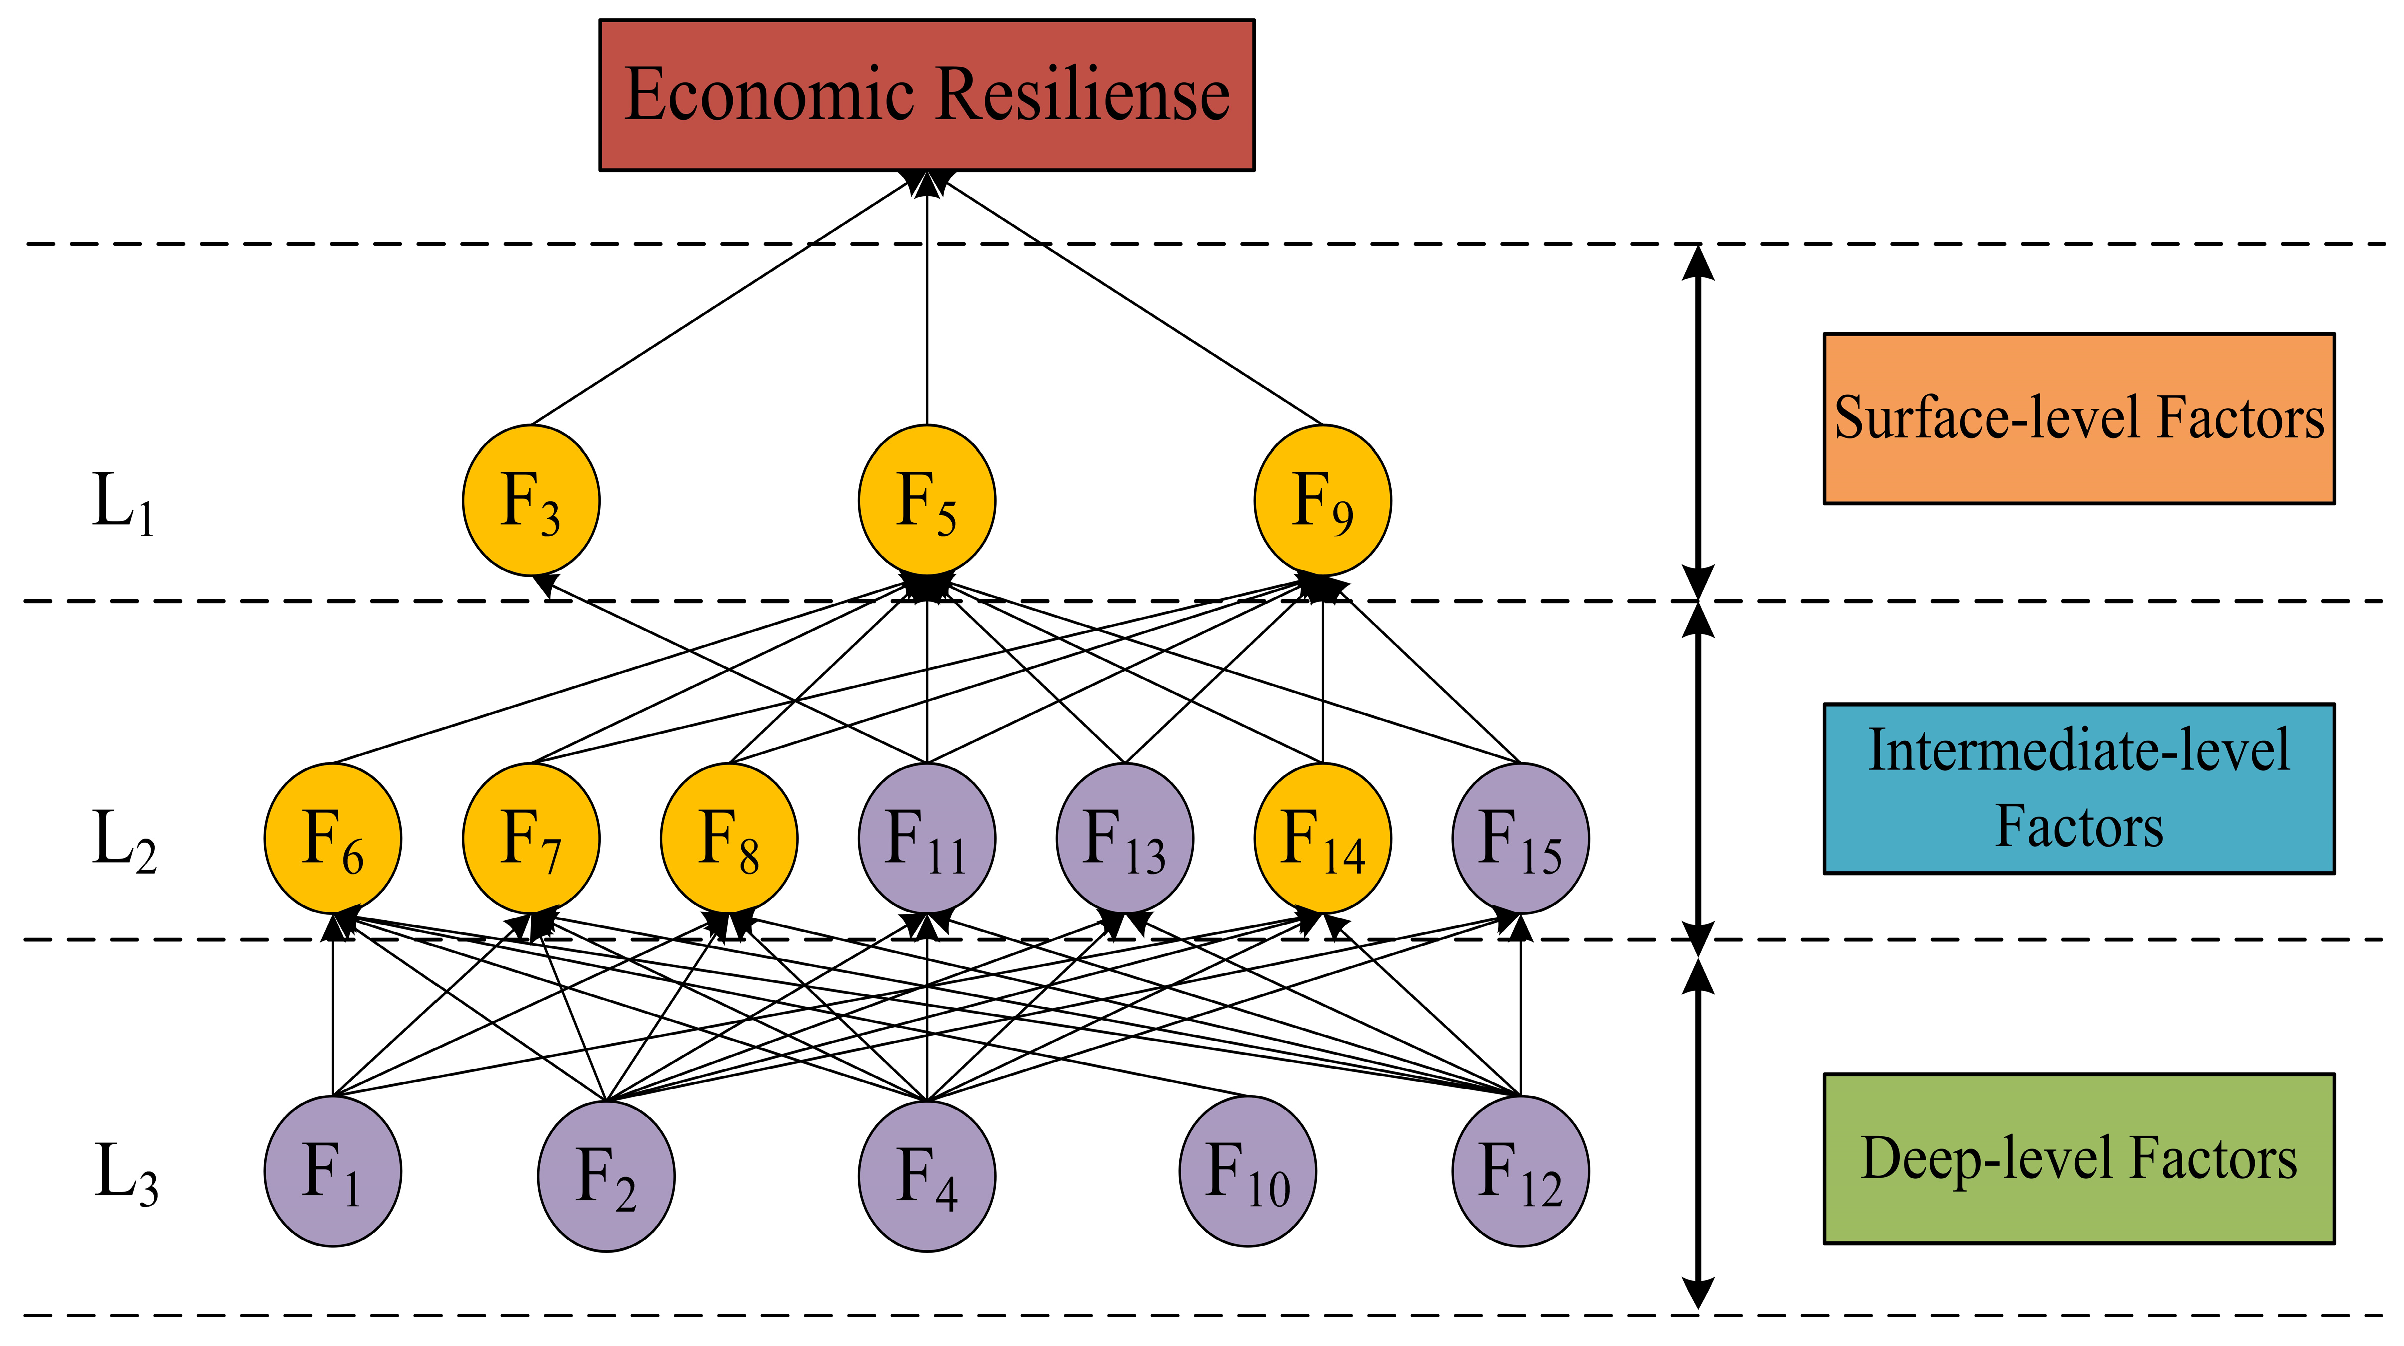

Disclaimer/Publisher’s Note: The statements, opinions and data contained in all publications are solely those of the individual author(s) and contributor(s) and not of MDPI and/or the editor(s). MDPI and/or the editor(s) disclaim responsibility for any injury to people or property resulting from any ideas, methods, instructions or products referred to in the content. |
© 2026 by the authors. Licensee MDPI, Basel, Switzerland. This article is an open access article distributed under the terms and conditions of the Creative Commons Attribution (CC BY) license.