


Abstract
The environmental effects of green finance policies involve complex systemic interactions across multiple levels, yet existing studies often adopt fragmented analytical approaches. Drawing on the multi-level perspective (MLP), this study conceptualizes the environmental impacts of Green Finance Reform and Innovation Pilot Zones (GFRIPZs) as a process of systemic green transformation involving interactions among landscape, regime, and niche levels. Using panel data of 287 prefecture-level and above cities in China from 2012 to 2022, this study applies a staggered difference-in-differences (DID) model to evaluate the environmental impacts of GFRIPZs. The results show that GFRIPZs significantly reduce both PM2.5 concentrations and CO2 emissions. Mechanism analyses based on multiple mediation models and GSEM reveal pollutant-specific differences in underlying channels. Green technological innovation (GTI) constitutes one observable pathway for PM2.5, whereas the policy effect is more closely associated with energy structure adjustment for CO2. Heterogeneity analysis further shows that PM2.5 mitigation is stronger in colder cities, while CO2 reduction is more pronounced in developed cities. These findings reveal pollutant-specific mechanisms of green finance and offer policy implications for developing countries seeking to promote systemic green transformation.
1. Introduction
The global community is currently grappling with an environmental crisis defined by the dual pressures of atmospheric pollution and climate change [1]. Despite international mitigation efforts, exposure to fine particulate matter (PM2.5) continues to cause millions of premature deaths annually, while the average global surface temperature has reached unprecedented highs. These converging threats impose substantial risks on public health, economic development, and long-term climate stability. To address these challenges, green finance has emerged as a pivotal policy instrument. By integrating financial resource allocation with environmental stewardship [2], green finance seeks to reconcile economic growth with ecological well-being.
As the world’s largest developing country, China has been at the forefront of green finance policy experimentation [3]. Building on earlier initiatives such as the 2012 Green Credit Guidelines and the 2016 Guidelines on Building a Green Financial System, China launched GFRIPZs in 2017. This policy aims to incentivize cities to explore diverse green finance practices and promote new models of sustainable development.
Although existing studies have extensively examined the environmental impacts of GFRIPZs, several important research gaps remain. First, most studies evaluate policy impacts on single pollutants [4,5], paying limited attention to the fundamental differences in physical characteristics and governance logics across pollutants. Second, the mechanisms identified in prior research are often treated as generalized transmission channels. This makes it difficult to explain why a mechanism may be effective for PM2.5 but not necessarily dominant for CO2. Third, most studies lack a systemic transition framework, leaving the interactions among technological innovation, financial restructuring, and energy transformation in shaping environmental outcomes largely unexplored.
To bridge these gaps, this study conceptualizes the environmental impacts of GFRIPZs as a process of systemic green transformation. It systematically evaluates the policy’s performance by addressing the following questions: (1) Can GFRIPZs generate significant air-carbon co-benefits?; (2) Through which mechanisms are these effects realized?; (3) Do these underlying mechanisms differ across pollutants?
This study contributes to the existing literature from three perspectives. Theoretically, it introduces the MLP into green finance policy evaluation, providing a systemic framework for explaining why different pollutants may respond to the same policy through different mechanisms. Empirically, it applies multiple mediation models and GSEM to quantitatively test the transmission mechanisms derived from the MLP, allowing us to compare whether the same green finance policy generates heterogeneous environmental pathways for PM2.5 and CO2. Practically, it provides a pollutant-specific policy framework for green finance design. By identifying the distinct mechanisms through which GFRIPZs affect PM2.5 and CO2, the findings offer actionable guidance for tailoring green finance instruments to pollutant characteristics and regional conditions.
The remainder of this paper is structured as follows. Section 2 summarizes relevant research on green finance and environmental outcomes. Section 3 develops the MLP-based framework and derives the corresponding hypotheses. Section 4 builds empirical models and describes variables. Section 5 reports the empirical results. An in-depth discussion follows to contextualize the findings in Section 6. Section 7 summarizes the study and offers targeted policy implications.
2. Literature Review
Existing literature has primarily explored the environmental impacts of GFRIPZs from the perspectives of policy effectiveness and underlying mechanisms.
Several studies confirm that GFRIPZs effectively mitigate overall air pollution [6] and significantly reduce industrial gaseous emissions [7]. Illegal emissions by heavily polluting firms are suppressed, thereby lowering nearby PM2.5 concentrations [8]. Nevertheless, Luo et al. (2024) [9] unexpectedly observed a 5.54% increase in PM2.5 concentrations in the vicinity of firms.
In terms of carbon emissions, evidence suggests that GFRIPZs exert a significant and sustained dynamic impact [10]. Carbon reduction welfare performance can also be improved [11], though this exhibits heterogeneity depending on financial development (FD) levels and locations [12]. However, Dasgupta et al. (2001) [13] argued that FD might expand production activities, thereby leading to higher carbon emissions. Nonetheless, pilot policies may increase marginal carbon abatement costs [14]. Heavily polluting firms tend to depend on end-of-pipe abatement strategies, which exhibit relatively limited effectiveness in curbing carbon emissions [15].
Only a limited number of studies have explored the co-mitigation effects. The pilot zones improve environmental quality by reducing both air pollution and carbon emissions, although these mitigation effects exhibit a time lag [16].
Regarding underlying mechanisms, industrial structure (IS) upgrading, green innovation, and energy transition are often widely analyzed based on the environmental Kuznets curve or Porter hypothesis and tested separately.
For IS upgrading, the pilot zones facilitate this process through improved resource allocation [17], guiding and regulating firms’ environmental behavior [18]. In contrast, Wen et al. (2021) [19] found that green credit policies reduce the productivity of energy-intensive firms, thereby impeding IS upgrading. Imbalanced credit allocation across industries may worsen environmental degradation [20].
For green innovation, GFRIPZs can strengthen R&D investments and promote firms’ green patent output [21] to enhance GTI capacity [22,23,24]. However, some studies suggest that the pilot zones may suppress green innovation in energy-intensive industries [25] and private firms [26]. Xu et al. (2023) [27] noted that GFRIPZs tend to stimulate strategic green innovation rather than substantive green innovation in the short run.
For energy transition, GFRIPZs help alleviate misallocation of energy resources, accelerating cities’ transition toward low-carbon energy systems [28]. The transition toward renewable energy drives energy structure (ES) transformation, thereby significantly curbing carbon emissions [29]. While industrial energy consumption declines significantly [30], no comparable effect has been observed for residential energy consumption [31].
Existing studies have provided valuable insights, yet the evidence remains fragmented and partly inconclusive. Most prior studies rely on single-level frameworks and implicitly assume relatively homogeneous mechanisms across pollutants. To address these limitations, this study introduces the MLP to derive theoretical hypotheses and empirically examine pollutant-specific mechanisms.
3. Theoretical Analysis and Hypotheses
3.1. Dual Effects on Environmental Outcomes
The MLP, proposed by Geels (2002) [32] in the field of sustainability transitions, emphasizes the fundamental transformations of socio-technical systems. It conceptualizes sustainability transitions as the outcome of interactions among landscape, regime, and niche levels. The landscape level refers to broad exogenous pressures. The regime level captures the dominant institutional systems, which tend to maintain stability through path dependency. The niche level represents protected spaces where radical innovations emerge and develop.
GFRIPZs promote the green transformation of economic agents by reshaping financial incentives, expanding green financial instruments, and guiding capital flows toward clean activities. This process may involve co-evolutionary adjustments across multiple levels rather than isolated channels. Such a systemic view aligns closely with the core logic of the MLP.
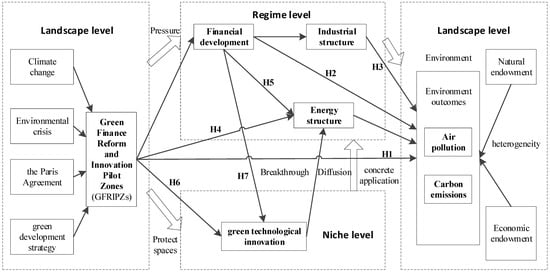
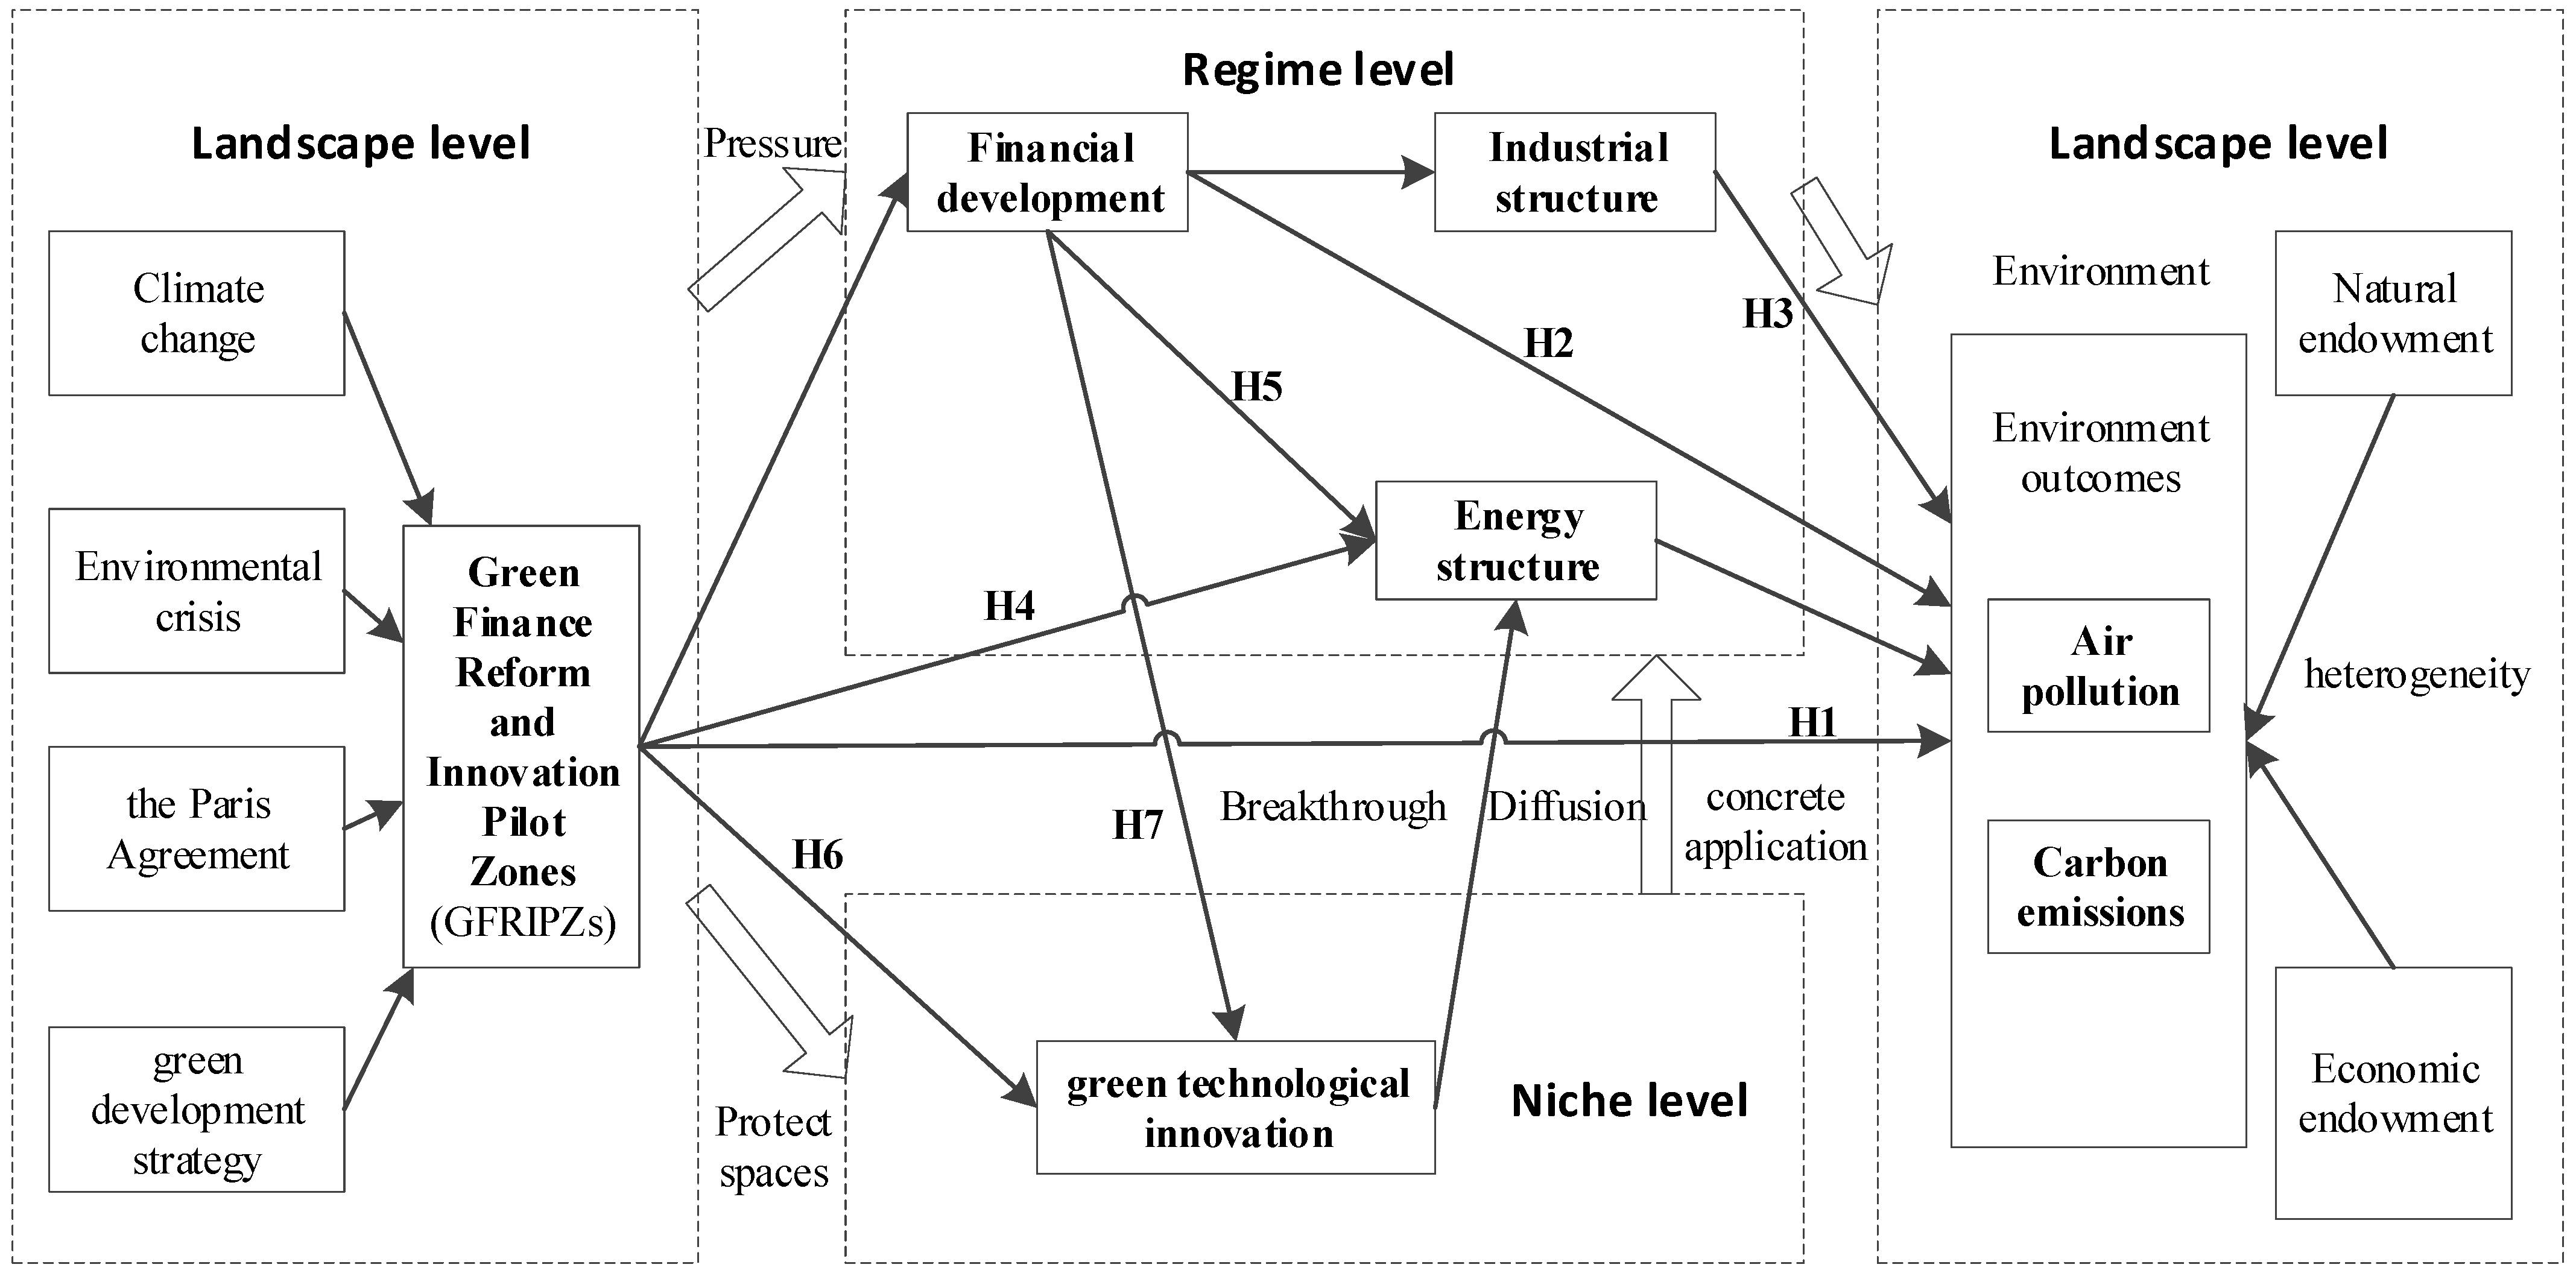
Drawing on the MLP, we map the key factors to the three analytical levels based on their structural characteristics. At the landscape level, global climate governance and China’s green development strategy create macro pressures that motivate the establishment of GFRIPZs. At the regime level, financial development, industrial structure upgrading, and energy transition represent adjustments within dominant institutional arrangements. These factors correspond to the regime level because they are deeply embedded in existing socio-technical systems with high path dependency, requiring systemic reconfiguration to alleviate lock-in effects. At the niche level, GTI corresponds to niche innovation as it initially requires protection from fossil-fuel-intensive market pressures before maturing and diffusing upward into the regime.
From this perspective, GFRIPZs can be viewed as policy interventions responding to landscape pressures. By modifying financial incentives and resource allocation, they may reconfigure existing regimes while also creating supportive conditions for niche-level GTI. As green technologies mature, they may diffuse through learning effects, market adoption, and institutional diffusion, thereby reinforcing broader regime adjustments. Since air pollutants and carbon emissions are closely associated with fossil-fuel-based energy use and industrial activities [33], GFRIPZs are expected to generate co-benefits for air pollution reduction and carbon mitigation. Accordingly, Hypothesis 1 is proposed:
H1.
GFRIPZs can reduce both air pollution and carbon emissions.
3.2. Mechanism Analysis
This study applies the MLP to delineate interactive transition pathways, treating mediators as proxies for level-specific dynamics without full conceptual reductionism. Specifically, FD, IS, and ES capture regime-level adjustments, while GTI reflects niche-level innovation dynamics.
3.2.1. Regime Adjustment Mechanism
The regime adjustment mechanism operates within the dominant institutional arrangements of the MLP.
- FD channel
GFRIPZs enhance regional FD by improving green financial infrastructure and promoting innovation in green financial products. According to the credit rationing theory proposed by Stiglitz & Weiss [34], under conditions of information asymmetry, banks tend to allocate credit via non-price rationing mechanisms. By incorporating environmental standards into credit decisions, the pilot zones restrict financing for highly polluting activities, thereby limiting the expansion of pollution-intensive production. This leads to Hypothesis 2.
H2.
GFRIPZs improve environmental outcomes by promoting FD.
- IS upgrading channel
IS adjustment faces strong structural rigidities, involving cross-sector capital reallocation and corporate restructuring with substantial sunk costs and institutional barriers [35]. These features make policy signals alone insufficient to trigger such deep structural changes. Therefore, IS upgrading relies on economic incentives and risk-sharing via financial channels. GFRIPZs improve the risk-return profile of clean sectors and increase the share of low-pollution industries by expanding green credit and environmental risk assessments. This leads to Hypothesis 3:
H3.
GFRIPZs facilitate IS upgrading through improvements in FD, thereby improving environmental outcomes.
- ES adjustment channel
The energy system exhibits greater operational flexibility. Given the existing technologies, firms can adjust the consumption shares of coal, natural gas, and electricity with relatively low sunk costs and decision thresholds [30]. Policy signals from GFRIPZs encourage forward-looking optimization of the energy mix through incremental innovations, such as energy-efficient equipment and waste heat recovery. This leads to Hypothesis 4:
H4.
GFRIPZs improve environmental outcomes through ES optimization.
- FD-driven ES transformation channel
Although energy consumption adjustments are flexible, transforming the energy supply structure is capital-intensive [31]. GFRIPZs mobilize policy-oriented finance to support clean energy projects. By enhancing the appeal of clean energy investments, the pilot zones weaken the path dependency inherent in traditional energy systems. Shifting capital toward clean energy alternatives can mitigate environmental pollution at its source. This leads to Hypothesis 5:
H5.
GFRIPZs facilitate ES optimization through improvements in FD, thereby improving environmental outcomes.
3.2.2. Niche-Driven Regime Reconfiguration Mechanism
The niche-driven regime reconfiguration mechanism highlights interactions between the niche and regime levels.
- GTI-driven optimization channel
GFRIPZs directly stimulate niche-level innovation through expectation guidance. The foreseeable prospects for green technologies incentivize firms to intensify clean technology development [36]. This aligns with endogenous growth theory, which posits that institutional incentives can internalize environmental externalities and transform green R&D into a core internal engine for sustainable economic expansion.
GTI generates environmental benefits primarily when embedded in the energy sector. Breakthroughs in renewable energy technologies increase the share of clean energy in total energy supply. Advances in energy storage technologies mitigate the intermittency of renewable energy, enhancing its penetration within the energy system. Energy-efficiency technologies reduce energy consumption intensity per unit of output. The cumulative technologies diffuse to optimize ES. This leads to Hypothesis 6:
H6.
GFRIPZs promote GTI, which in turn facilitates ES optimization and improves environmental outcomes.
- FD-led GTI channel
Beyond direct expectation guidance, GFRIPZs enhance FD by providing patient capital for GTI. By resolving maturity mismatches and absorbing early-stage innovation risks, patient capital shields green technology R&D from short-term performance pressures. This long-term financial empowerment enables firms to focus on exploratory and breakthrough green technologies at the niche level. When these niche innovations mature, they will provide the essential technological foundation for ES optimization. This leads to Hypothesis 7:
H7.
GFRIPZs promote GTI through improvements in FD, and such innovation further facilitates ES optimization, thereby improving environmental outcomes.
3.3. Pollutant-Specific Heterogeneity
The above hypotheses identify general transition pathways through which GFRIPZs may improve environmental outcomes. However, the relative dominance of these MLP-derived channels is expected to differ across pollutants due to their unique features.
Air pollution is more local and immediate in nature, with concentrations directly influenced by meteorological conditions, atmospheric dispersion, and local energy use. These features are tied to climatic conditions highly related to natural endowments, which function as landscape-level environmental constraints within the MLP. Such constraints may condition the effectiveness of GFRIPZs on air pollution by shaping regime-level adjustments in IS and ES. Thus, compared to CO2 emissions, natural endowments may exert a pronounced moderating effect on the reduction in air pollution.
In contrast, carbon emissions are cumulative and globally mixed. Their mitigation depends more on structural changes in financial allocation and production patterns. Economic fundamentals determine the resource capacity and institutional readiness of existing regimes to absorb green financial interventions and bear the costs of decarbonization. Regions with higher GDP typically possess stronger financial infrastructure and risk-bearing ability, enabling more effective regime-level transitions. Therefore, economic fundamentals are expected to moderate the carbon mitigation effects more prominently.
The research framework is illustrated in Figure 1.
Figure 1.
Analytical framework. This study conceptualizes the environmental impacts of GFRIPZs as a systemic green transition under the MLP. The framework decomposes the process into landscape, regime, and niche levels: environmental challenges motivate GFRIPZs at the landscape level; FD, IS, and ES represent regime-level adjustments; and GTI reflects niche-level innovation. GFRIPZs drive environmental improvements through regime- and niche-level mechanisms. H1: GFRIPZs → Environment. Two parallel mediation channels: H2 (GFRIPZs → FD → Environment) and H4 (GFRIPZs → ES → Environment). Four serial mediation channels: H3 (GFRIPZs → FD → IS → Environment), H5 (GFRIPZs → FD → ES → Environment), H6 (GFRIPZs → GTI → ES → Environment), and H7 (GFRIPZs → FD → GTI → ES → Environment). The dominance of these channels is expected to vary across pollutants due to their distinct characteristics.
4. Research Design
4.1. Empirical Model
4.1.1. Baseline Model
Since 2017, China has established three batches of GFRIPZs. The first batch, launched in June 2017, consists of ten cities across five provinces: Xinjiang (Changji Prefecture, Hami, and Karamay), Jiangxi (Nanchang and Jiujiang), Guizhou (Guiyang and Anshun), Zhejiang (Huzhou and Quzhou), and Guangdong (Guangzhou). The second batch, inaugurated in November 2019, comprises Lanzhou. The third batch, designated in August 2022, includes Chongqing Municipality.
These pilots encompass large, medium, and small cities from eastern, central, and western regions, suggesting that the pilot selection covers diverse regional and developmental contexts rather than only economically or environmentally advanced areas. This staggered rollout provides a clear policy shock at the city level, allowing us to treat the establishment of GFRIPZs as a quasi-natural experiment. Accordingly, we specify the following staggered DID model as the baseline:
In Equation (1): denotes air pollution concentrations or carbon emissions in city i during year t. is a policy dummy variable for GFRIPZs. For the first batch promulgated in June 2017, the dummy is assigned a value of 1 starting from 2017. For the second batch established in late November 2019, it is assigned a value of 1 starting from 2020 to reflect the actual implementation lag. For all other cities, the dummy is set to 0. represents the vector of control variables. and represent city and time fixed effects, respectively. is the random error term. A significantly negative indicates that GFRIPZs improve the corresponding environmental outcome.
To assess the validity of the DID design, we conducted pre-treatment balance tests for key control variables, together with parallel trends tests. The DID approach differences out time-invariant city-specific factors and common time trends, thereby capturing the additional changes attributable to the pilot policy.
However, the conventional two-way fixed effects (TWFE) estimator may suffer from bias caused by negative weighting in staggered settings [37]. To address this concern, we employed the Callaway and Sant’Anna DID (CSDID) estimator [38] and Goodman–Bacon decomposition [37] in robustness checks. We also conducted propensity score matching DID (PSM-DID) and placebo tests to further alleviate concerns about selection bias and unobservable confounding factors.
4.1.2. Mechanism Model
To alleviate concerns about mediator validity and ensure that the proposed mediators are plausibly affected by the GFRIPZ policy, we conducted balance tests, parallel trend tests, and pre-tests for the mechanism variables. These tests establish the empirical foundation for the subsequent mediation analysis.
Given that the observable pathways implied by the MLP involve complex multi-level interactions among mediators, we employed multiple mediation models with bias-corrected bootstrap (1000 resamples) to test the pathways. Additionally, generalized structural equation modeling (GSEM) was used as a robustness check because it allows multiple interrelated equations to be estimated within a unified system. To mitigate reverse causality, environmental outcomes were lagged by one period. The corresponding models are specified as below:
In the above equations, , , , and are the mechanism variables, representing the level of FD, GTI, IS, and ES for city i in year t, respectively. The mediation effects of FD channel and ES adjustment channel are given by and respectively. The mediation effects of the four serial mediation channels, IS upgrading channel, FD-driven ES transformation channel, GTI-driven optimization channel, and FD-led GTI channel are measured by , , , and respectively. A mediation effect is considered statistically significant if the corresponding bias-corrected confidence interval excludes zero.
4.1.3. Heterogeneity Model
This study constructed the following model to examine the heterogeneous environmental effects of GFRIPZs across different initial conditions:
In Equation (8), captures the initial conditions of climate and economic development, proxied by the pre-treatment averages of temperature and GDP over 2012–2013. As a robustness check, the 2012–2014 averages of temperature and GDP were used as alternative measures. A significantly negative indicates that higher initial temperature or stronger economic fundamentals strengthen the environmental mitigation effect of GFRIPZs.
Furthermore, to validate which specific mechanisms are moderated by these conditions, we estimated the following model:
In Equation (9), denotes the mechanism variable. A significant indicates that heterogeneity operates through this specific transition mechanism.
4.1.4. Spatial Spillover Model
Environmental effects generated by GFRIPZs may extend beyond pilot cities because of atmospheric diffusion, cross-regional economic linkages, and policy demonstration effects. To account for potential spatial spillovers, we employed the spatial Durbin model (SDM) based on a contiguity-based spatial weight matrix. The model is specified as follows:
In Equation (10), denotes the row-standardized spatial adjacency weight matrix, where elements equal 1 if two cities share a common border and 0 otherwise. denotes the spatial autoregressive parameter, capturing endogenous spatial dependence in environmental outcomes among neighboring cities. and represent the spatial lags of the policy and control variables.
4.2. Variable Specifications
Table 1 summarizes the definitions, measurements, and descriptions of all variables.
Table 1.
Definitions and descriptions of all variables.
The selection of these variables and proxies is justified by the MLP and previous studies [6,16,21,23]. While the MLP is generally developed for qualitative analyses of sustainability transitions, this study operationalizes the green transition pathways through measurable city-level indicators. It should be noted that the mapping between the MLP and the empirical variables has certain boundaries. In this study, the selected mechanism variables serve as observable proxies for specific aspects of regime and niche dynamics during the systemic green transition, rather than as comprehensive measures of the entire transition process. Therefore, the empirical results should be interpreted within the scope of these proxy indicators and should not be over-extended as direct measurements of all theoretical dimensions of the MLP.
To further examine whether the MLP-derived channels are sensitive to variable definitions, alternative measures were used for key mediators in robustness checks.
The FD indicator reflects the depth and scale of the regional financial system to support green projects. To better capture the green orientation of financial allocation, we used the green credit ratio as an alternative proxy in robustness checks. For GTI, the share of authorized green invention patents in total green patents was also used to reduce reliance on patent counts alone. The ES indicator reflects the coal dependence of China’s existing energy regime. To better capture broader energy transition dynamics, we used the share of renewable energy consumption as an alternative indicator.
4.3. Data Sources
This study utilized panel data from 287 cities at or above the prefecture level in China for the period 2012–2022. Some cities were excluded from the sample due to severe data unavailability. Changji Prefecture and Hami City were excluded from the pilot sample due to severe missing data. Constrained by data availability, our sample period ended in 2022, which provides no post-treatment observation window for the third batch of the pilot zones. Therefore, the study assesses the impacts of the first two batches of GFRIPZs on air pollution reduction and carbon abatement. Our sample still encompasses a highly representative cross-section of China’s diverse geographical, economic, and industrial landscapes. Therefore, these necessary data-driven exclusions are unlikely to significantly compromise the generalizability and credibility of our findings.
PM2.5 concentration data were obtained from NASA’s satellite-derived dataset. CO2 emissions data were sourced from the Emissions Database for Global Atmospheric Research (EDGAR). Both datasets were originally provided in gridded format. Using ArcGIS 10.8, we spatially aggregated the raw gridded data to China’s city-level administrative boundaries based on area-weighted averaging, followed by computing annual average values for each city. The consistent gridded accounting methods ensure spatial continuity and reduce missing observations common in early ground-based data. This approach enables robust cross-city and intertemporal comparisons while minimizing measurement errors associated with administrative reporting inconsistencies.
Following the IPC Green Inventory provided by the World Intellectual Property Organization (WIPO), we identified green patents based on patent type, IPC codes, and applicant address from the patent search database of the China National Intellectual Property Administration (CNIPA). Other variables are compiled from the annual Urban Statistical Yearbook of China, China Urban–Rural Construction Statistical Yearbook, China Financial Yearbook, China Energy Statistical Yearbook, and statistical yearbooks published by local statistics bureaus. Missing values in minor control variables were partially imputed using linear interpolation, which accounted for less than 3% of the total sample. Crucially, no imputation was applied to the dependent or policy variables.
5. Empirical Results
5.1. Preliminary Diagnostics and Identification Validity
5.1.1. Multicollinearity and Balance Tests
All pairwise correlations among variables were below 0.5, and the maximum variance inflation factor (VIF) was 1.5. This suggests that severe multicollinearity is unlikely to be a concern in the subsequent estimations.
Table 2 reports the pre-treatment balance test. The coefficients of the treatment indicator were statistically insignificant for the main control and all mechanism variables, suggesting that the pilot and non-pilot cities did not exhibit systematic differences in observable pre-policy characteristics. This provides preliminary support for the comparability of the treatment and control groups.
Table 2.
Balance test results.
5.1.2. Parallel Trends Test
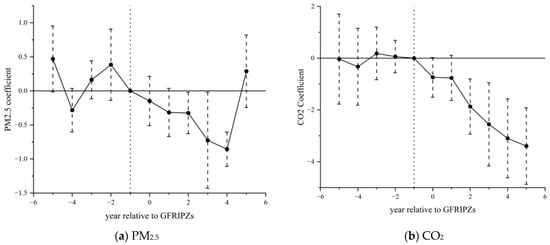
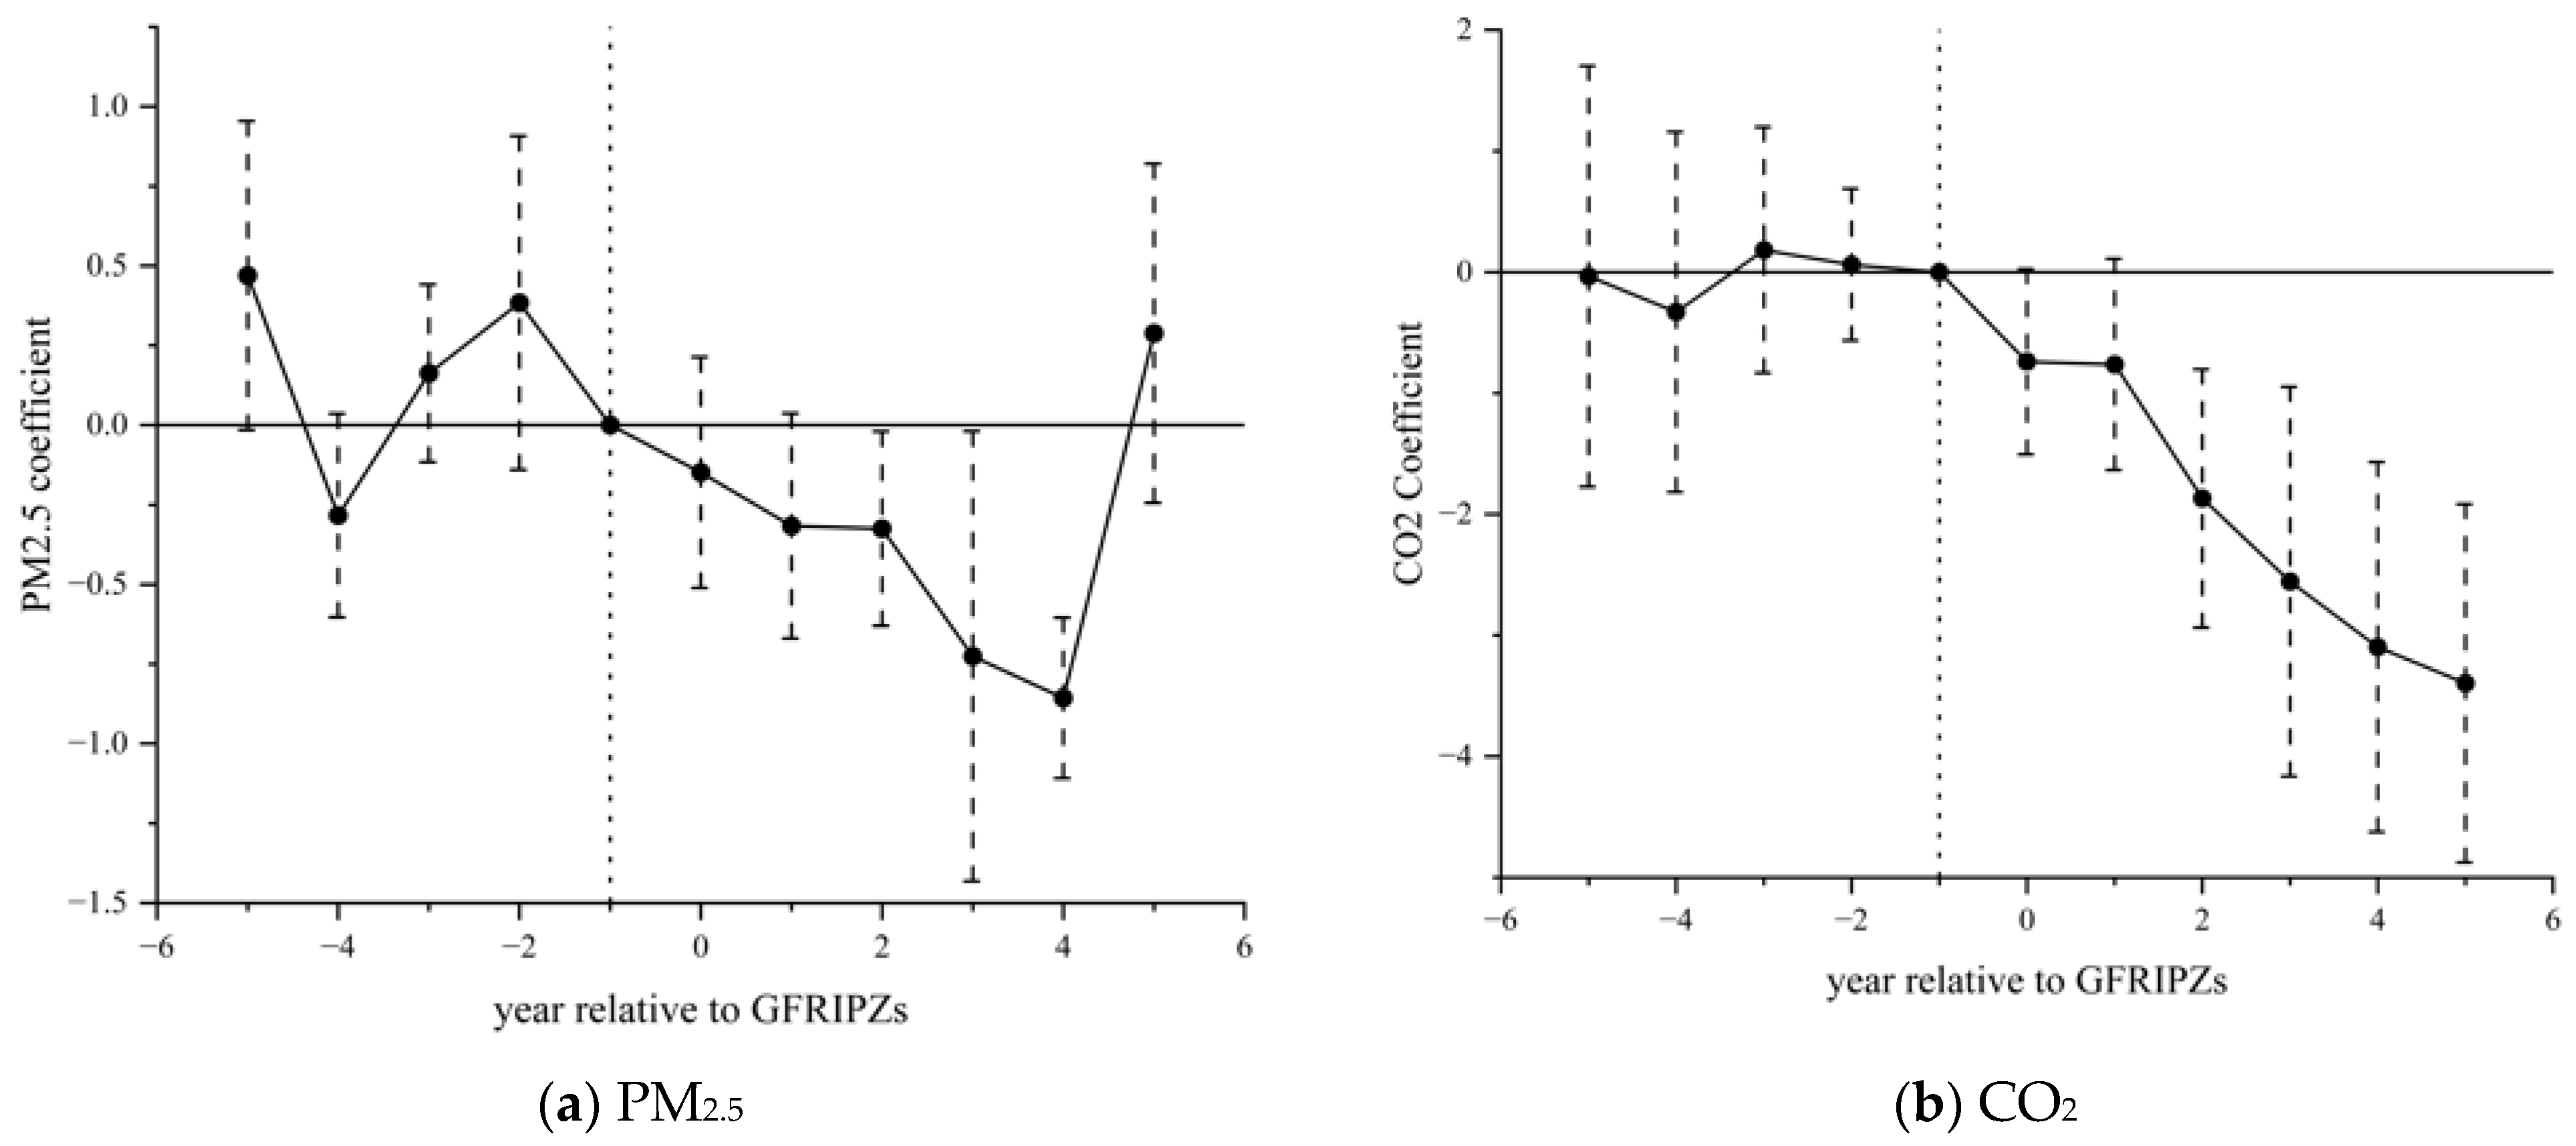
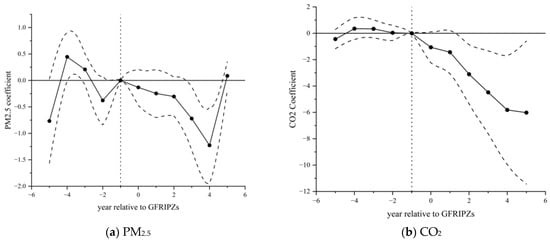
The insignificant pre-treatment coefficients shown in Figure 2 support the parallel trends assumption. The post-treatment coefficients reflect dynamic treatment effects. Their delayed emergence is consistent with the time required for green finance reallocation, green investment, and structural adjustments. The later attenuation in PM2.5 effect may reflect the short post-treatment window or sensitivity of local air pollution to meteorological and administrative conditions.
Figure 2.
Parallel trends test results.
5.2. Baseline Results
Table 3 reports the baseline results. The policy dummy was significantly negative at the 5% level for both outcomes, regardless of control inclusion. The coefficient in column (2) indicates that GFRIPZs reduced the PM2.5 concentrations by 0.533 units. Relative to the sample mean of PM2.5, this corresponds to a reduction of approximately 9.409%. Similarly, the coefficient in column (4) suggests a reduction of 1.980 units in CO2 emissions, equivalent to approximately 5.682% of the sample mean. These magnitudes indicate that the policy effect is not only statistically significant but also economically meaningful. These findings are consistent with Hypothesis 1.
Table 3.
Baseline regression results.
5.3. Robustness Checks
5.3.1. CSDID
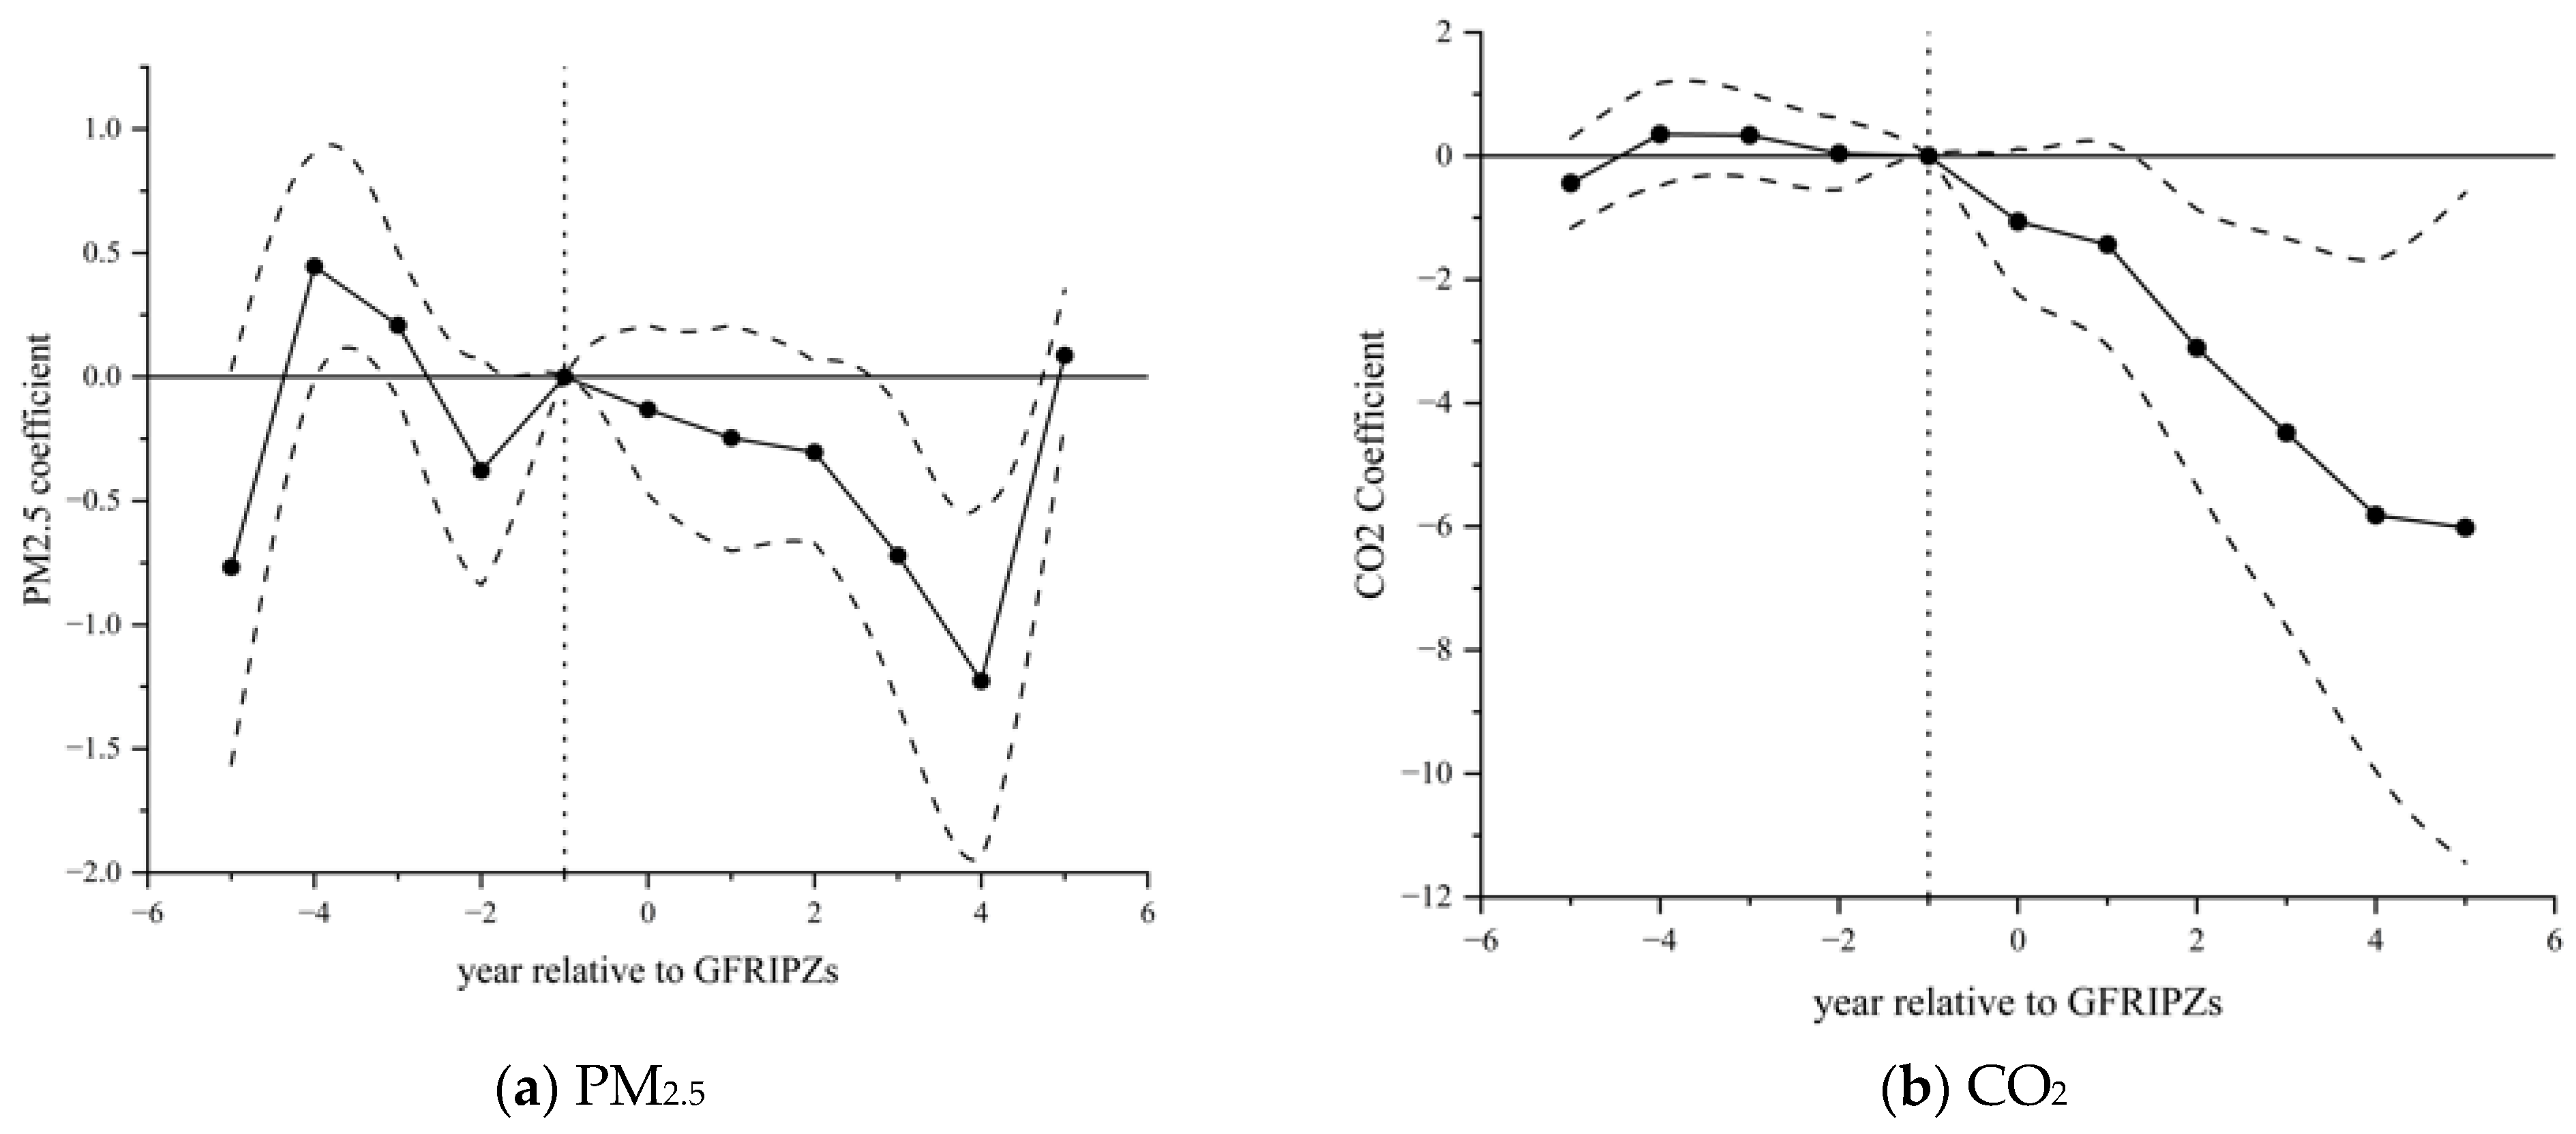
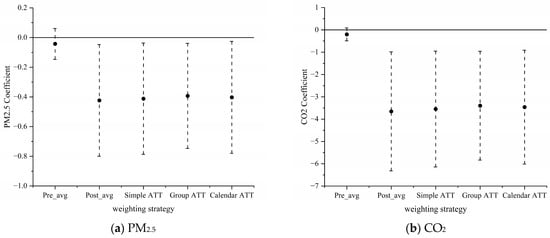
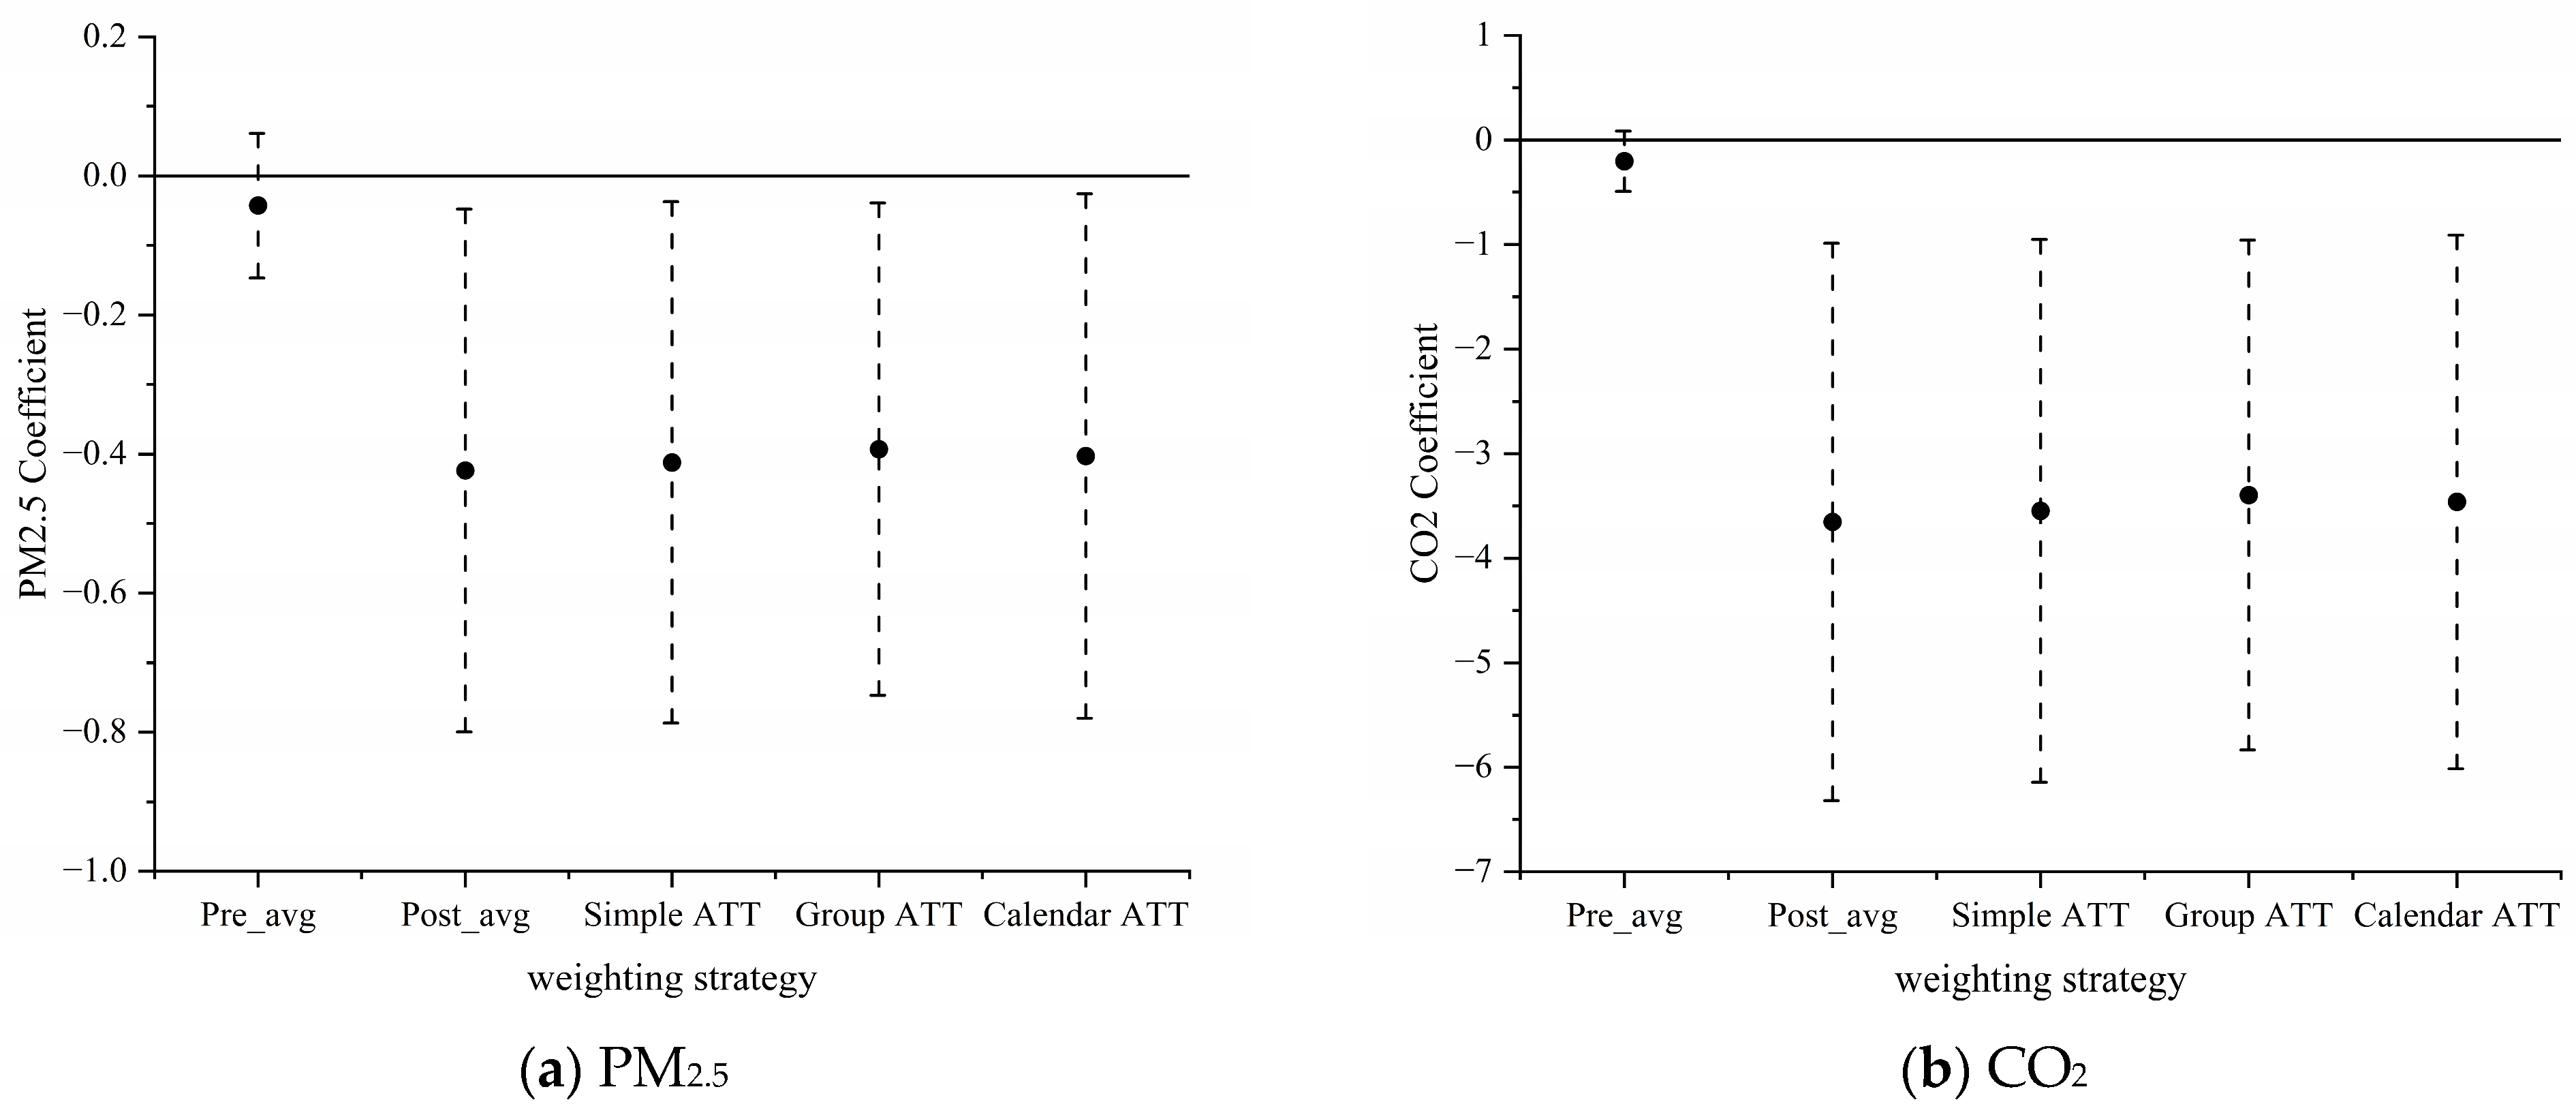
The CSDID estimator accounts for heterogeneous treatment timing by grouping units and applying appropriate weights. Figure 3 provides additional evidence supporting the parallel trends assumption. Figure 4 reports ATTs under four weighting schemes (dynamic, simple, group, and calendar). The average pre-treatment effect (Pre_avg) was insignificant, while the average post-treatment effect (Post_avg) was significantly negative for both pollutants across schemes, consistent with the baseline findings.
Figure 3.
CSDID parallel trends test results. The solid line with dots represents the estimated event-time coefficients. The dashed lines indicate the 90% confidence intervals. The vertical dashed line denotes the base line (event time = −1).
Figure 4.
CSDID ATTs under different weighting strategies.
5.3.2. PSM-DID
We first estimated the propensity scores using a logit model with the control variables as matching covariates, and then applied 1:1 nearest-neighbor matching. As shown in Table 4, the matched sample yielded statistically significant coefficients of −0.529 for PM2.5 and −2.083 for CO2.
Table 4.
PSM-DID results.
5.3.3. Placebo Test
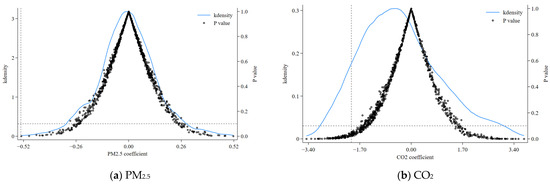
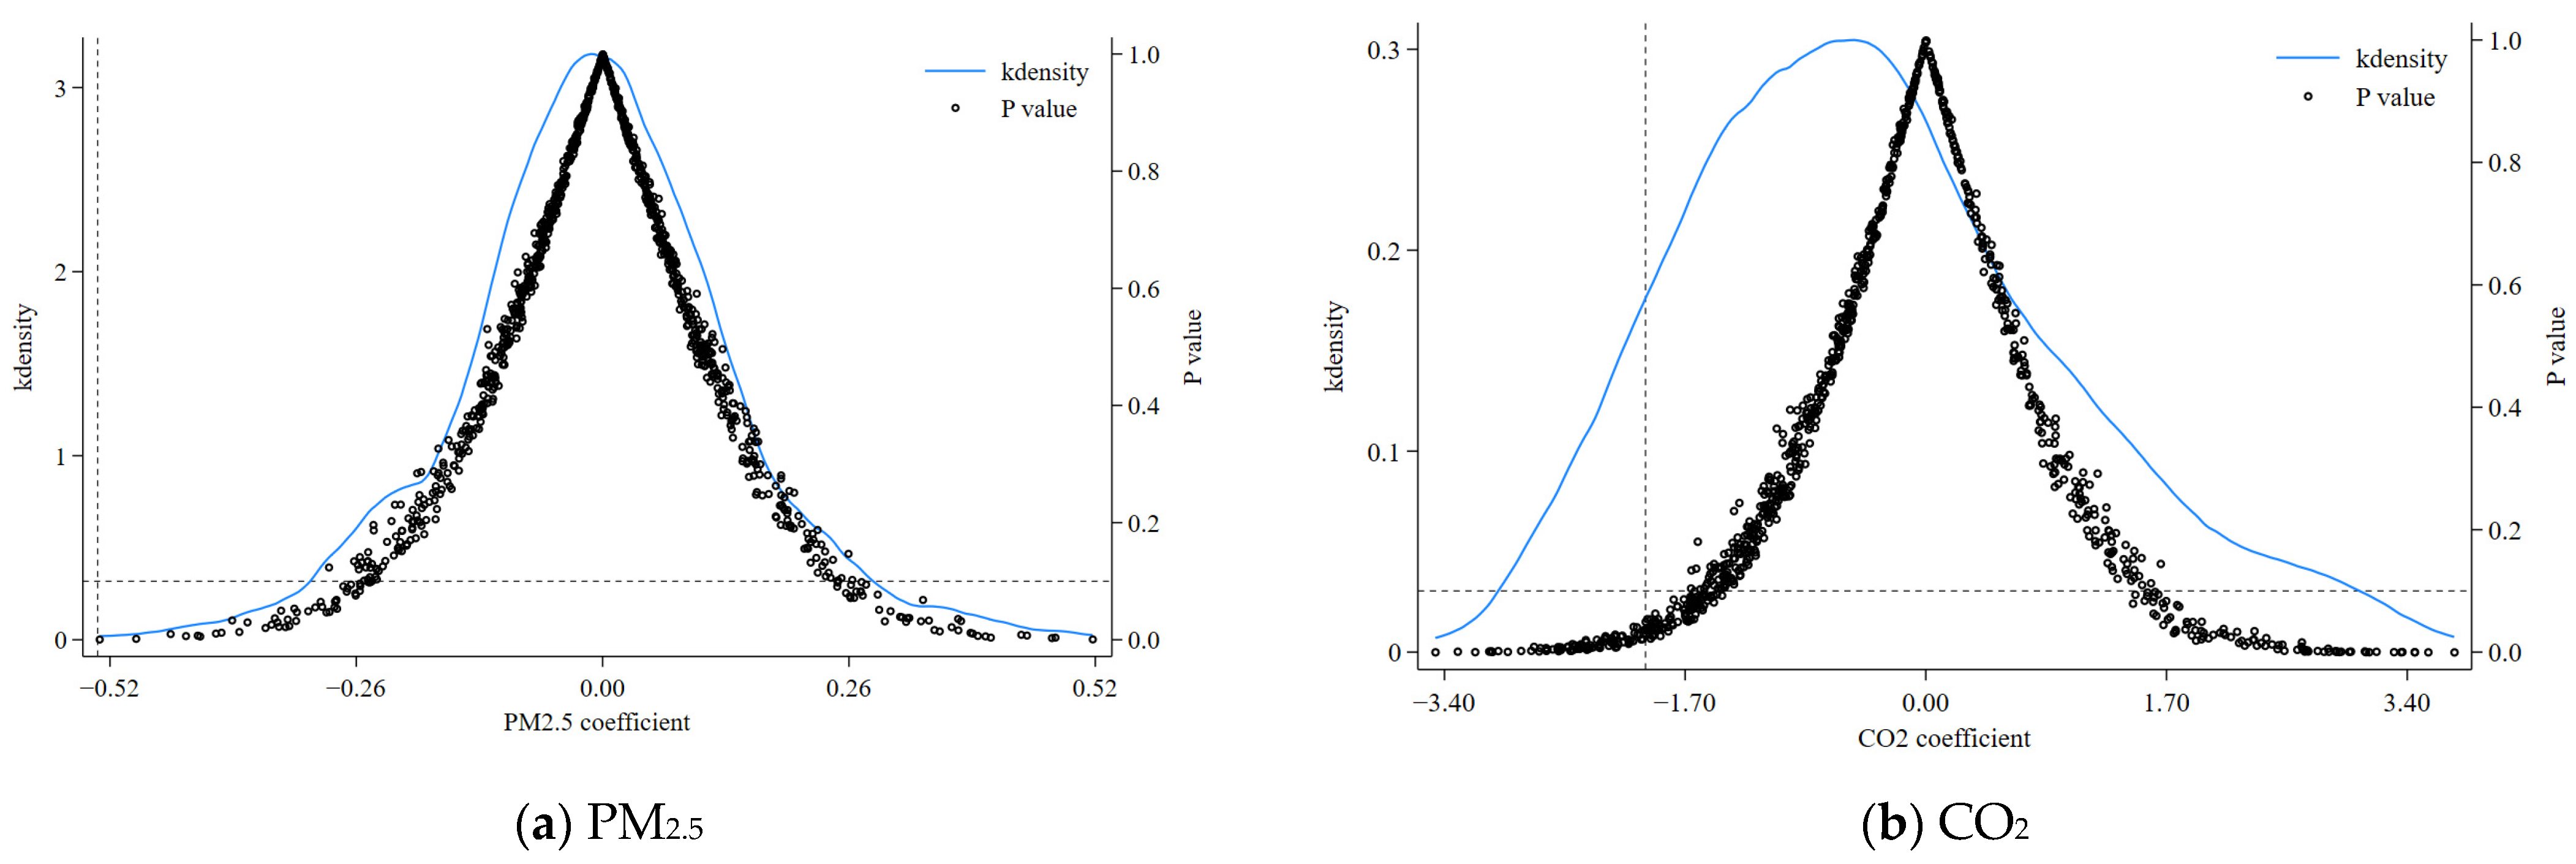
To alleviate concerns that the estimated effects are driven by random shocks or spurious policy assignment, we conducted a placebo test by randomly reassigning the treatment status and policy implementation timing across cities 1000 times. As shown in Figure 5, the resulting placebo coefficients were centered around zero and distinct from the baseline estimates. These findings further confirm the robustness of the main results.
Figure 5.
Placebo tests. The dashed vertical line indicates the coefficient estimated from the baseline model.
5.3.4. Alternative Dependent Variables
To check the sensitivity of our findings to different measurements, we replaced the original dependent variables with ground-monitored PM2.5 concentrations and per capita CO2 emissions. The results shown in Table 5 are consistent with the baseline estimates.
Table 5.
Replacing dependent variables.
5.3.5. Excluding Sub-Provincial and Higher-Level Cities
Relative to ordinary prefecture-level cities, municipalities and sub-provincial cities possess greater administrative authority and autonomy in economic development and resource allocation. They have the capacity to create expedited channels for policy implementation via high-level coordination [39]. These unique advantages may limit the generalizability of the estimated policy impacts. Therefore, municipalities and sub-provincial cities were sequentially excluded. As reported in Table 6, the policy coefficients all remained significantly negative.
Table 6.
Excluding the disturbance of administrative hierarchy results.
5.3.6. Bacon Decomposition Test
The bacon decomposition results are presented in Table 7. Notably, 99.7% of the identification weight for PM2.5 concentrations and CO2 emissions came from comparisons between treated units and never-treated units. Furthermore, the corresponding estimates were consistent with the baseline regression results, suggesting that negative-weighting concerns were limited in our setting.
Table 7.
Bacon decomposition test results.
5.3.7. Excluding Other Policies
To rule out confounding effects from concurrent environmental regulations, we identified three major policies closely associated with air pollution and carbon emission mitigation: the Key Control Zone for the Atmosphere (KCZA), Low-Carbon City Pilots (LCCP), and the Pilot Project for Ecological Compensation for Air Quality (ECAQ). Table 8 reports the results from incorporating these three policies separately and jointly into the baseline specification. Whether controlled for individually or simultaneously, the estimated coefficients of GFRIPZs remained significantly negative, supporting the previous findings.
Table 8.
Excluding other policy results.
5.4. Mechanism Results
Table 9 presents event-study results for the mechanism variables. The pre-treatment coefficients were statistically insignificant, indicating that parallel trends hold between pilot and non-pilot cities. Combined with previous balance tests, this supports the absence of pre-existing systematic disparities in mechanism variables prior to the pilot program.
Table 9.
Parallel trends tests for mechanism variables.
Table 10 further shows that GFRIPZs have statistically significant associations with the mechanism variables in the expected directions.
Table 10.
Pre-test results.
The mechanism test results are reported in Table 11. The FD channel showed weak evidence, as it was only marginally significant in GSEM. In contrast, the other channels displayed broadly consistent patterns across the baseline multiple mediation model, GSEM, and specifications using alternative mechanism variables, although the estimated magnitudes and significance levels varied.
Table 11.
Mechanism test results.
For PM2.5, GTI-related channels exhibited statistically significant negative mediation effects, though their magnitudes were relatively modest (6.3% of indirect effects). The overall indirect effect contributed around 7% to the total reduction. This suggests that the remaining reduction may be associated with direct policy effects, unobserved complementary channels, or concurrent environmental governance measures.
For CO2 emissions, a wider range of channels demonstrated statistically significant mediation effects, with the ES adjustment channel showing one of the larger contributions (around 46.4% of indirect effects). The total indirect effect reached −0.3816, accounting for around 20% of the overall reduction.
These results provide empirical evidence broadly consistent with the regime–niche interaction logic proposed by the MLP. However, the modest scale of several channels highlights the multifaceted nature of emission reduction processes.
5.5. Heterogeneity Analysis
5.5.1. Regional Heterogeneity Based on Climatic Conditions
Temperature reflects climatic variations across geographic locations and constitutes an objective natural endowment for exploring regional heterogeneity. Compared to subgroup analyses based on the East-Middle-West division, employing average temperature as a continuous variable in interaction terms allows for fuller utilization of the entire sample. This approach effectively captures the underlying climatic gradient, thereby enhancing the precision of heterogeneity identification. The results are reported in Table 12.
Table 12.
Heterogeneity by climatic conditions.
For PM2.5 concentrations, the coefficients on the temperature interaction terms were significantly positive at the 1% level, indicating that the haze-mitigation effect is stronger in colder cities. Using the average temperature over 2012–2013 as the initial climate condition, the estimated policy effect on PM2.5 for cities at the 25th percentile of temperature was −1.136, which was 1.189 and 3.192 times larger than the effects for the 50th and 75th percentiles, respectively. In contrast, the interaction coefficients for CO2 emissions were statistically insignificant.
Table 13 reveals that the climate-related heterogeneity in PM2.5 reduction was partly associated with interactions involving IS and ES adjustments. These results suggest that climatic conditions may moderate the PM2.5 effects of GFRIPZs through selected structural adjustment channels.
Table 13.
Moderated mechanism tests by climatic conditions.
5.5.2. Regional Heterogeneity Based on Economic Fundamentals
GDP reflects disparities in development levels across cities. Table 14 reports the related results.
Table 14.
Heterogeneity by economic fundamentals.
For PM2.5 concentrations, the interaction coefficients with pre-treatment GDP were not statistically significant. However, for CO2 emissions, the GDP interaction terms were significantly negative at the 1% level, suggesting that the carbon reduction effect was more pronounced in economically developed cities. Using the average GDP over 2012–2014 as the initial economic fundamental, the estimated effect for cities at the 75th percentile of initial GDP was −1.625, which was 1.283 times the magnitude of that for the 50th percentile.
Table 15 indicates that economic fundamentals moderated the CO2 effects of GFRIPZs partly through FD. This finding suggests that cities with stronger economic bases may be better able to channel green finance into carbon-reduction activities.
Table 15.
Moderated mechanism tests by economic fundamentals.
5.6. Spatial Spillover Analysis
We first examined the presence of spatial dependence using Moran’s I statistic. The results confirmed positive spatial autocorrelation in both PM2.5 concentrations and CO2 emissions, which supports the use of a spatial econometric model. Table 16 reports the SDM-DID estimates. After accounting for spatial dependence, the coefficient of the policy dummy remained significantly negative for both PM2.5 and CO2, suggesting that the baseline reduction effects are robust to spatial dependence.
Table 16.
SDM-DID results.
Table 17 further decomposes the total effects into direct and indirect effects. For PM2.5, the indirect effect for PM2.5 was −3.078, accounting for 86% of the total reduction. This suggests possible transmission of air-quality improvements to adjacent non-pilot areas. For CO2 emissions, the indirect effect was statistically insignificant, indicating that the carbon-mitigation effect is mainly reflected within pilot cities rather than through short-distance spatial spillovers. This difference also highlights the importance of considering pollutant-specific features when evaluating the environmental outcomes of green finance policies.
Table 17.
SDM-DID policy effect decomposition.
6. Discussion
Existing studies provide mixed evidence on the environmental effects of GFRIPZs. One found significant pollution or carbon reduction effects, while another reported weak or insignificant effects. Some research focusing on specific channels, regions, or short-term responses have reported weak or heterogeneous results.
Our findings help reconcile these inconsistencies by showing that the effectiveness of GFRIPZs depends on pollutant type, spatial scale, treatment timing, and mechanism structure. This interpretation is consistent with China’s official green finance policy, which emphasizes both pollution control and low-carbon transition but relies on differentiated instruments such as green credit, industrial upgrading, energy restructuring, and local environmental accountability. The significant reductions in both PM2.5 and CO2 indicate that green finance can generate environmental gains, but the underlying pathways are not uniform across pollutants.
6.1. Mechanism Discussion
To unpack the divergent mechanisms through which GFRIPZs affect PM2.5 and CO2, our analysis was conducted from the perspectives of pollutant physical properties, institutional logics, and policy instruments.
PM2.5 mitigation involves statistically detectable but limited GTI-related pathways, alongside possible direct policy effects and other unobserved channels. Its physical visibility and localized nature make PM2.5 reduction closely aligned with local officials’ short-term environmental performance incentives [40]. This institutional logic may encourage immediate and technically certain investments in abatement equipment rather than long-horizon and uncertain investments required for regime transformation. As a result, mature end-of-pipe solutions may be more attractive policy options, which is consistent with the role of niche-level technological interventions. Although the contribution of GTI-related channels is modest, their statistical significance still suggests that GTI may constitute one observable pathway through which GFRIPZs affect local air pollution.
For CO2 emissions, the mechanism results point to a more structural pathway. CO2, as a globally mixed, stock pollutant, cannot be effectively addressed through point-source technological fixes alone. Because CO2 emissions are deeply embedded in fossil-fuel combustion across economic sectors, carbon mitigation is more likely to require upstream interventions that reshape energy-use patterns. The relatively large contribution of the ES adjustment channel is consistent with this physical–institutional matching. In contrast, the FD channel provides only weak and specification-sensitive evidence, suggesting that financial development alone may not constitute an independent and robust transmission pathway. This interpretation is also consistent with China’s official carbon-neutrality policy logic, which emphasizes long-term, market-based instruments to support structural transition across financial, energy, and industrial systems.
These differences refine the MLP perspective by showing that green finance does not necessarily produce a uniform transition pathway. Instead, GFRIPZs appear to activate different combinations of niche-level innovation and regime-level adjustment depending on the pollutant being targeted. This implies that green finance research and policy implementation should fully consider the attributes of specific pollutants.
6.2. Heterogeneity Discussion
The heterogeneous effects reflect regional political economy conditions. The effectiveness depends on local fiscal capacity, financial infrastructure, industrial composition, energy dependence, and administrative incentives.
For PM2.5, the larger reduction effect in colder cities may reflect the greater abatement potential associated with heating-related industrial activity and energy-use patterns. From the MLP, colder climatic conditions can be understood as landscape-level pressures that shape the marginal effectiveness of regime-level adjustments. In this sense, colder cities may provide more favorable conditions for structural changes to translate into local air-quality improvements.
For CO2, the stronger reduction effect in economically developed cities suggests that carbon mitigation may depend more heavily on advanced financial markets, better information disclosure, and a larger pool of bankable low-carbon projects. This suggests that without a certain threshold of economic and financial development, the facilitator role of green finance in systemic decarbonization may be constrained.
6.3. Institutional Limitations and Transferability
Despite the documented benefits, several institutional limitations warrant caution. Under China’s decentralized fiscal but centralized political structure, local governments frequently face a dual-task conflict: sustaining GDP growth while fulfilling rigid environmental mandates. This tension may induce local protectionism. Furthermore, the asymmetry of environmental data between commercial banks and industrial firms creates fertile ground for greenwashing. These may explain why certain structural channels did not exhibit instant and sweeping efficacy.
Regarding transferability to other developing economies, China’s relatively strong central fiscal authority and top-down cadre evaluation system provide unique policy implementation capacity. In federal or weaker-state contexts, the regime-level coordination required for CO2 reduction may be more difficult to achieve. However, the general principle of matching policy instruments to pollutant attributes may be portable. For other developing countries, the niche-level innovation channel may be more readily replicable than the regime-level structural transformations that require centralized coordination.
7. Conclusions and Recommendations
7.1. Main Findings
The establishment of GFRIPZs offers a novel approach to addressing environmental pollution and climate challenges. Focusing on the first two batches of GFRIPZs, this study examines the policy effects on air pollution and carbon emissions, and further explores the underlying mechanisms and heterogeneity.
The main findings are as follows. First, GFRIPZs significantly reduced both PM2.5 concentrations and CO2 emissions, and the results remained robust across a series of robustness checks. Second, the mechanisms differed substantially across pollutants. For PM2.5, GTI-related channels were statistically significant but contributed only modestly. For CO2, the ES adjustment channel accounted for the largest share of the indirect effect. Third, the policy effects were moderated by local endowments. GFRIPZs generated stronger PM2.5 reductions in colder cities, while CO2 mitigation effects were more pronounced in cities with stronger economic fundamentals.
7.2. Policy Recommendations
Based on the pollutant-specific mechanisms and heterogeneity identified above, green finance policy instruments should be better matched with pollutant types, local endowments, and city development stages.
- (1)
- Green financial instruments should be differentiated according to target pollutants:
For PM2.5 mitigation, green finance should place greater emphasis on technology adoption, pollution-control equipment, and measurable abatement projects. Policy support should focus not only on technological innovation, but also on the practical diffusion of mature end-of-pipe treatment and cleaner production technologies. Green loans, fiscal interest subsidies, and guarantee instruments can be linked to verifiable reductions in PM2.5 or its major precursors.
For CO2 mitigation, green financial policy should be more closely integrated with energy-structure adjustment and long-term decarbonization targets. Financial institutions should expand green credit, transition finance, and sustainability-linked loans for energy-efficiency retrofits, renewable energy deployment, and low-carbon industrial upgrading. At the same time, credit constraints for carbon-intensive expansion projects should be strengthened to reduce the risk of fossil-energy lock-in.
- (2)
- Green finance policies should be tailored to local natural and economic endowments:
In colder and northern cities, where PM2.5 reduction effects are stronger, green finance could give priority to heating-related pollution control, clean heating transformation, and industrial energy-use optimization. Green municipal bonds, targeted fiscal subsidies, and policy guarantees may be used to support the upgrading of coal-based heating systems, industrial boilers, and other concentrated emission sources.
In less-developed cities, the priority should be reducing financing barriers for feasible green projects. Policy-based green funds, government guarantee mechanisms, and interest subsidies can help improve access to green finance for firms undertaking energy-saving retrofits and pollution-control investments. Such instruments are important to prevent cities with weaker fiscal capacity and less-developed financial markets from being excluded from green finance opportunities.
In economically developed cities, policy should encourage more market-oriented green financial innovation. These cities are better positioned to pilot transition finance, carbon-linked loans, carbon-accounting-based credit products, and collateralization of carbon emission rights. Such instruments may help convert stronger financial infrastructure and information disclosure capacity into more effective carbon-reduction outcomes.
- (3)
- The coordination and monitoring of green finance should be strengthened:
Green credit standards should be better aligned with industrial policy catalogues, energy-efficiency benchmarks, and carbon-reduction targets. Regulators should improve environmental information disclosure and strengthen the verification of firms’ actual pollution and carbon performance to reduce greenwashing risks. Where data capacity allows, emissions information can be gradually incorporated into banks’ credit assessment and risk-pricing systems, so that credit allocation is more closely linked to verified environmental performance.
7.3. Limitations and Future Research
This study provides a meaningful extension to the existing literature, yet several limitations remain. There is no unified consensus on how variables should be mapped onto different layers of the MLP, and researchers from different theoretical perspectives may construct alternative model specifications. Although the GSEM-based mechanism analysis uses lagged environmental outcomes to alleviate potential reverse causality concerns, this strategy may not fully eliminate the dynamic endogeneity issues inherent in panel data. Potential biases may still arise from unobserved time-varying factors and complex lagged relationships. Future research could combine DID with additional identification strategies, use more granular firm-level or project-level data, and incorporate spatial spillover effects into mechanism analysis.
Author Contributions
Conceptualization, P.Y. and W.X.; methodology, W.X.; software, W.X.; validation, P.Y., W.X. and J.P.C.; formal analysis, W.X.; data curation, J.P.C.; writing—original draft preparation, P.Y. and W.X.; writing—review and editing, W.X. and J.P.C.; visualization, W.X.; supervision, P.Y. All authors have read and agreed to the published version of the manuscript.
Funding
This research received no external funding.
Data Availability Statement
The raw data supporting the conclusions of this article will be made available by the authors upon request.
Conflicts of Interest
The authors declare no conflicts of interest.
Abbreviations
The following abbreviations are used in this manuscript:
| GFRIPZs | Green Finance Reform and Innovation Pilot Zones |
| MLP | Multi-level perspective |
| FD | Financial development |
| GTI | Green technological innovation |
| IS | Industrial structure |
| ES | Energy structure |
| SEs | Standard errors |
| Cons | The constant term |
References
- Bazel-Shoham, O.; Lee, S.M.; Munjal, S.; Shoham, A. Board Gender Diversity, Feminine Culture, and Innovation for Environmental Sustainability. J. Prod. Innov. Manag. 2024, 41, 293–322. [Google Scholar] [CrossRef] [Scilit]
- Hunjra, A.I.; Hassan, M.K.; Zaied, Y.B.; Managi, S. Nexus between Green Finance, Environmental Degradation, and Sustainable Development: Evidence from Developing Countries. Resour. Policy 2023, 81, 103371. [Google Scholar] [CrossRef] [Scilit]
- Qian, H.; Xu, S.; Cao, J.; Ren, F.; Wei, W.; Meng, J.; Wu, L. Air Pollution Reduction and Climate Co-Benefits in China’s Industries. Nat. Sustain. 2021, 4, 417–425. [Google Scholar] [CrossRef] [Scilit]
- Chen, R.; Yin, P.; Meng, X.; Liu, C.; Wang, L.; Xu, X.; Ross, J.A.; Tse, L.A.; Zhao, Z.; Kan, H.; et al. Fine Particulate Air Pollution and Daily Mortality. A Nationwide Analysis in 272 Chinese Cities. Am. J. Respir. Crit. Care Med. 2017, 196, 73–81. [Google Scholar] [CrossRef] [Scilit] [PubMed]
- Liu, Z.; Deng, Z.; He, G.; Wang, H.; Zhang, X.; Lin, J.; Qi, Y.; Liang, X. Challenges and Opportunities for Carbon Neutrality in China. Nat. Rev. Earth Environ. 2022, 3, 141–155. [Google Scholar] [CrossRef] [Scilit]
- Zhang, A.; Wang, S.; Liu, B. How to Control Air Pollution with Economic Means? Exploration of China’s Green Finance Policy. J. Clean. Prod. 2022, 353, 131664. [Google Scholar] [CrossRef] [Scilit]
- Muganyi, T.; Yan, L.; Sun, H. Green Finance, Fintech and Environmental Protection: Evidence from China. Environ. Sci. Ecotechnol. 2021, 7, 100107. [Google Scholar] [CrossRef] [Scilit] [PubMed]
- Zhang, Y.; Lu, J. Green Finance and Corporate Environmental Violations: A Test from the Perspective of Illegal Pollution Discharge Behaviors. Environ. Sci. Pollut. Res. 2022, 29, 48477–48490. [Google Scholar] [CrossRef] [Scilit] [PubMed]
- Luo, C.; Lyu, H.; Wen, T.; Qiang, W.W.; Lee, H.F. Green Finance and Grey Air: Assessing the Impact of Green Finance Pilot Zones on Company-Level Pollution in China. Environ. Res. Lett. 2024, 19, 094010. [Google Scholar] [CrossRef] [Scilit]
- Du, M.; Zhang, J.; Hou, X. Decarbonization like China: How Does Green Finance Reform and Innovation Enhance Carbon Emission Efficiency? J. Environ. Manag. 2025, 376, 124331. [Google Scholar] [CrossRef] [Scilit] [PubMed]
- Wang, X.; Gao, C. Does Green Finance Policy Help to Improve Carbon Reduction Welfare Performance? Evidence from China. Energy Econ. 2024, 132, 107452. [Google Scholar] [CrossRef] [Scilit]
- Meng, S.; Duan, Y.; Zhou, W. How Does Green Finance Policy Reduce the Carbon Emissions of Polluting Enterprises? A Mediation Effect Analysis of Inclusive Finance. Res. Int. Bus. Financ. 2025, 77, 102914. [Google Scholar] [CrossRef] [Scilit]
- Dasgupta, S.; Laplante, B.; Mamingi, N. Pollution and Capital Markets in Developing Countries. J. Environ. Econ. Manag. 2001, 42, 310–335. [Google Scholar] [CrossRef] [Scilit]
- Huang, H.; Mbanyele, W.; Zhang, L.; Chen, X.-L.; Song, M. Nonnegligible Transition Risks towards Net-Zero Economy: Lessons from Green Finance Initiatives in China. J. Environ. Manag. 2025, 375, 124132. [Google Scholar] [CrossRef] [Scilit] [PubMed]
- Wan, K.; Yu, X. Green Structural Monetary Policy and Firms’ Asymmetric Carbon Emission Reduction: Evidence from China. Econ. Anal. Policy 2025, 86, 1914–1928. [Google Scholar] [CrossRef] [Scilit]
- Chen, X.; Mao, Y.; Cheng, J.; Wei, P.; Li, X. Green Financial Policy, Technological Advancement Reversal, Assessment of Emission Reduction Effects. Energy Econ. 2024, 136, 107678. [Google Scholar] [CrossRef] [Scilit]
- Ge, P.; Liu, T.; Huang, X. The Effects and Drivers of Green Financial Reform in Promoting Environmentally-Biased Technological Progress. J. Environ. Manag. 2023, 339, 117915. [Google Scholar] [CrossRef] [Scilit] [PubMed]
- Yao, S.; Pan, Y.; Sensoy, A.; Uddin, G.S.; Cheng, F. Green Credit Policy and Firm Performance: What We Learn from China. Energy Econ. 2021, 101, 105415. [Google Scholar] [CrossRef] [Scilit]
- Wen, H.; Lee, C.-C.; Zhou, F. Green Credit Policy, Credit Allocation Efficiency and Upgrade of Energy-Intensive Enterprises. Energy Econ. 2021, 94, 105099. [Google Scholar] [CrossRef] [Scilit]
- Lee, C.-C.; Chang, Y.-F.; Wang, E.-Z. Crossing the Rivers by Feeling the Stones: The Effect of China’s Green Credit Policy on Manufacturing Firms’ Carbon Emission Intensity. Energy Econ. 2022, 116, 106413. [Google Scholar] [CrossRef] [Scilit]
- Liu, S.; Wang, Y. Green Innovation Effect of Pilot Zones for Green Finance Reform: Evidence of Quasi Natural Experiment. Technol. Forecast. Soc. Change 2023, 186, 122079. [Google Scholar] [CrossRef] [Scilit]
- Hou, G.; Shi, G. Green Finance and Innovative Cities: Dual-Pilot Policies and Collaborative Green Innovation. Int. Rev. Financ. Anal. 2024, 96, 103673. [Google Scholar] [CrossRef] [Scilit]
- Kilinc-Ata, N.; Camkaya, S.; Topal, S. What Role Do Foreign Direct Investment and Technology Play in Shaping the Impact on Environmental Sustainability in Newly Industrialized Countries (NIC)?: New Evidence from Wavelet Quantile Regression. Sustainability 2025, 17, 4966. [Google Scholar] [CrossRef] [Scilit]
- Shi, R.; Zhang, X.; Zhu, Z. Greening Firms through Finance: How Green Finance Drives Corporate Pollution and Carbon Reduction Synergy in China. Int. Rev. Econ. Financ. 2026, 105, 104805. [Google Scholar] [CrossRef] [Scilit]
- Chang, K.; Zeng, Y.; Wang, W.; Wu, X. The Effects of Credit Policy and Financial Constraints on Tangible and Research & Development Investment: Firm-Level Evidence from China’s Renewable Energy Industry. Energy Policy 2019, 130, 438–447. [Google Scholar] [CrossRef] [Scilit]
- Yu, C.-H.; Wu, X.; Zhang, D.; Chen, S.; Zhao, J. Demand for Green Finance: Resolving Financing Constraints on Green Innovation in China. Energy Policy 2021, 153, 112255. [Google Scholar] [CrossRef] [Scilit]
- Xu, A.; Zhu, Y.; Wang, W. Micro Green Technology Innovation Effects of Green Finance Pilot Policy—From the Perspectives of Action Points and Green Value. J. Bus. Res. 2023, 159, 113724. [Google Scholar] [CrossRef] [Scilit]
- Chen, R.; Zhang, Q.; Wang, J. Impact Assessment of Green Finance Reform on Low-Carbon Energy Transition: Evidence from China’s Pilot Zones. Environ. Impact Assess. Rev. 2025, 110, 107654. [Google Scholar] [CrossRef] [Scilit]
- Kilinc-Ata, N.; Çamkaya, S. Assessing the Impact of Technology on the EU Clean Energy Transition: Evidence from the Green Energy Mix Quality Index. Int. J. Energy Sect. Manag. 2026, 20, 1068–1087. [Google Scholar] [CrossRef] [Scilit]
- Xu, B.; Xu, R. Assessing the Carbon Intensity of the Heavy Industry in China: Using a Nonparametric Econometric Model. Environ. Impact Assess. Rev. 2023, 98, 106925. [Google Scholar] [CrossRef] [Scilit]
- Wang, D.; Mugera, A.; White, B. Directed Technical Change, Capital Intensity Increase and Energy Transition: Evidence from China. Energy J. 2019, 40, 277–296. [Google Scholar] [CrossRef] [Scilit]
- Geels, F.W. Technological Transitions as Evolutionary Reconfiguration Processes: A Multi-Level Perspective and a Case-Study. Res. Policy 2002, 31, 1257–1274. [Google Scholar] [CrossRef] [Scilit]
- Shindell, D.; Smith, C.J. Climate and Air-Quality Benefits of a Realistic Phase-out of Fossil Fuels. Nature 2019, 573, 408–411. [Google Scholar] [CrossRef] [Scilit] [PubMed]
- Stiglitz, J.E.; Weiss, A. Credit Rationing in Markets with Imperfect Information. Am. Econ. Rev. 1981, 71, 393–410. [Google Scholar]
- Chang, S.-J.; Wu, B. Institutional Barriers and Industry Dynamics. Strateg. Manag. J. 2014, 35, 1103–1123. [Google Scholar] [CrossRef] [Scilit]
- Porter, M.E.; van der Linde, C. Toward a New Conception of the Environment-Competitiveness Relationship. J. Econ. Perspect. 1995, 9, 97–118. [Google Scholar] [CrossRef] [Scilit]
- Goodman-Bacon, A. Difference-in-Differences with Variation in Treatment Timing. J. Econom. 2021, 225, 254–277. [Google Scholar] [CrossRef] [Scilit]
- Callaway, B.; Sant’Anna, P.H.C. Difference-in-Differences with Multiple Time Periods. J. Econom. 2021, 225, 200–230. [Google Scholar] [CrossRef] [Scilit]
- Jia, J.; Liang, X.; Ma, G. Political Hierarchy and Regional Economic Development: Evidence from a Spatial Discontinuity in China. J. Public Econ. 2021, 194, 104352. [Google Scholar] [CrossRef] [Scilit]
- Zheng, S.; Kahn, M.E.; Sun, W.; Luo, D. Incentives for China’s Urban Mayors to Mitigate Pollution Externalities: The Role of the Central Government and Public Environmentalism. Reg. Sci. Urban Econ. 2014, 47, 61–71. [Google Scholar] [CrossRef] [Scilit]

Disclaimer/Publisher’s Note: The statements, opinions and data contained in all publications are solely those of the individual author(s) and contributor(s) and not of MDPI and/or the editor(s). MDPI and/or the editor(s) disclaim responsibility for any injury to people or property resulting from any ideas, methods, instructions or products referred to in the content. |
© 2026 by the authors. Licensee MDPI, Basel, Switzerland. This article is an open access article distributed under the terms and conditions of the Creative Commons Attribution (CC BY) license.