


Abstract
The transition toward sustainable manufacturing requires an understanding of how industrial policies shape firms’ long-term green innovation capabilities. This study investigates the impact of China’s intelligent manufacturing pilot policy on enterprises’ sustainable green innovation, conceptualizing the policy as an exogenous driver of systemic transformation at the firm level. Using multi-period difference-in-differences (DID) regression on an unbalanced panel dataset of Chinese listed companies from 2010 to 2023, we find that the intelligent manufacturing pilot policy exerts a significantly positive effect on enterprises’ sustainable green innovation. Mechanism analyses reveal that the policy promotes sustainable green innovation through three pathways: facilitating digital transformation, alleviating financing constraints, and enhancing ESG performance. Heterogeneity analysis further indicates that the policy effects are more pronounced in eastern regions, among non-state-owned enterprises, in non-heavily polluting industries, and in technology-intensive industries. These findings provide insights into how systemic policy interventions can drive sustainable innovation at the firm level, with implications for policymakers and enterprises seeking to align industrial upgrading with long-term green development. These findings are interpreted through a system transformation lens, where intelligent manufacturing policies trigger co-evolutionary changes across digital, financial, and governance subsystems.
1. Introduction
In the contemporary global context, intelligent manufacturing is a linchpin of the Fourth Industrial Revolution. It is revolutionizing the global industrial panorama at an unparalleled tempo. It has garnered extensive attention from nations around the world [1,2]. From Europe and the United States to the Asia–Pacific region, as well as from developed economies to emerging market countries, intelligent manufacturing is regarded as a crucial strategy for enhancing national competitiveness and promoting green economic transformation [3]. The United States leverages its leading edge in information technology and high-end manufacturing to promote the research, development, and application of intelligent manufacturing technologies through the “Advanced Manufacturing Partnership Program”. This program allows the United States to strengthen its manufacturing foundation and maintain its leading position in the global high-end manufacturing competition. The European Union, which relies on the “Digital Europe Industry Plan,” is committed to building an intelligent and green industrial ecosystem. This plan will promote the coordinated upgrading of industries among member states and enhance the global influence of European manufacturing [4,5]. In Asia, Japan aims for “Society 5.0,”which involves deeply integrating intelligent manufacturing into all aspects of social development to drive the intelligent transformation and green innovation of traditional industries. Concurrently, South Korea is forging ahead with its “Manufacturing Innovation 3.0 Strategy,” cultivating globally competitive intelligent and green industrial agglomerations [6,7]. These strategic initiatives of various countries indicate that intelligent manufacturing has become a core arena for countries to compete for the high ground of global green economic development, which is closely related to a country’s long-term development and international status.
Green development is interwoven into the fabric of the Fourth Industrial Revolution and has become an exigency for global development. China has put forward the “dual-carbon” goal and actively promotes the adjustment of the energy structure and the green transformation of industries. This move is not only an inevitable choice to address environmental challenges but also an important opportunity to create new economic growth points and foster emerging industries [8,9,10]. For enterprises, continuous innovation is the foundation for survival in fierce market competition; moreover, green-oriented innovation is an inevitable choice to adapt to the trend of the times [11]. At the microeconomic level, as the main body of the market economy, enterprises can achieve green innovation through the implementation of intelligent manufacturing. This approach not only optimizes the production process and reduces resource consumption but also enhances the added value of products through technological innovation. Thus, it can strengthen the competitiveness of enterprises in the global market and create long-term economic benefits for them. From a macroeconomic perspective, enterprises’ green innovation efforts significantly contribute to the green upgrading of the industrial structure, promote the sustainable development of regional economies, and inject strong impetus into the global green economic transformation [12,13]. However, enterprises face challenges in achieving sustainable green innovation. In terms of technological innovation, the R&D of green technologies is difficult, thus requiring substantial capital and human resources with a long R&D cycle and high risks [14,15]. In terms of capital acquisition, green innovation projects have a relatively long investment payback period; in addition, financial institutions and investors provide relatively limited support [16,17]. In terms of internal enterprise management, traditional management concepts and organizational structures often focus on short-term economic benefits and have difficulty in effectively promoting the continuous development of green innovation [18,19]. At the same time, the academic community currently lacks a unified and in-depth understanding of the internal mechanisms, influencing factors, and heterogeneous manifestations of intelligent manufacturing driving enterprises’ sustainable green innovation in different industries, regions, and enterprise scales. This research gap not only limits the scientific decision-making of enterprises during the intelligent manufacturing transformation process but also restricts the government from formulating precise and effective industrial policies.
This research focuses on the influence of intelligent manufacturing on enterprises’ sustainable green innovation. We use a DID model and an impact-mechanism regression model to conduct empirical research. The data comes from the unbalanced panel of listed companies from 2010 to 2023. Our study explores the effect of intelligent manufacturing pilot policies on enterprises’ sustainable green innovation, analyzing factors like digital transformation, financing constraints, and ESG performance. Furthermore, we reveal the heterogeneous characteristics of policy impacts at different levels, such as regions, property rights, industries, and production factors. The results of this study can provide a theoretical basis for the government to formulate industrial policies and offer practical guidance for enterprises’ transformation and sustainable green innovation development.
This study adopts a system transformation perspective, which conceptualizes the intelligent manufacturing pilot policy as an exogenous intervention that triggers co-evolutionary changes across multiple subsystems within the firm—including technological, financial, and organizational–governance dimensions. Unlike conventional studies that treat green innovation as an isolated outcome of policy incentives, the system transformation perspective emphasizes that sustainable green innovation emerges from the recursive interactions among these subsystems. The policy does not merely add resources; it reconfigures the firm’s internal architecture, enabling self-reinforcing loops that sustain green innovation over time. This perspective guides our identification of three interconnected mechanisms—digital transformation, financing constraints, and ESG performance—and further predicts heterogeneous effects depending on the firm’s existing system configuration.
This study offers three main marginal contributions. First, unlike previous studies that focus on short-term green innovation outputs, we introduce a sustainable green innovation indicator that captures the accumulative and dynamic persistence of green innovation over time. This allows us to assess whether the policy fosters long-term capabilities rather than transient spikes. Second, in contrast to existing research that examines single mechanisms in isolation, we develop an integrated framework that simultaneously tests three pathways—digital transformation, financing constraint alleviation, and ESG performance enhancement—and, importantly, explores their interdependence through the lens of system transformation theory. Third, while prior work has documented heterogeneous policy effects across regions or ownership types, it has largely done so descriptively without a unifying theoretical explanation. Our study adopts a system transformation perspective to interpret these heterogeneities: we argue that firms’ initial system configurations determine how effectively the policy triggers co-evolution among subsystems. This provides a theory-grounded explanation for why eastern regions, non-state-owned firms, non-heavily polluting industries, and technology-intensive sectors reap greater benefits.
The rest of this paper is structured as follows. The second part reviews the literature, concentrating on intelligent manufacturing and enterprise green innovation. The third part conducts theoretical analysis and presents research hypotheses. It presents the analysis of the background of the implementation of intelligent manufacturing pilot policies as well as their impacts and mechanisms on enterprises’ sustainable green innovation. Then, the fourth part is about the model design and explanation. It elaborates on the model construction, variable selection, and data description. The fifth part is the empirical results. It discusses the impact of intelligent manufacturing pilot policies on enterprises’ sustainable green innovation. The sixth part contains the relevant content of conclusions and implications.
2. Literature Review
Intelligent manufacturing incorporates vital technologies such as sensor technology, cloud computing, big data analysis, and artificial intelligence. The development and application of these technologies are important criteria for evaluating the level of intelligent manufacturing [20,21]. Currently, the manufacturing industry is in the process of transitioning from mechanical automation to digital intelligence [22,23], and the number of robots used by enterprises is a common measure of this trend. Lin and Xu (2024) analyzed enterprise-level data from 2008 to 2016 using the two-stage least-squares method [24]. They found that industrial robot application effectively reduces enterprise energy intensity, and regional environmental regulations and green fiscal policies can strengthen this environmental benefit. This indicates the direct impact of intelligent manufacturing on energy consumption and the regulatory role of the external policy environment. Shen and Zhang (2023) measured intelligent manufacturing by the density of industrial robots and found it positively impacts industrial green total factor productivity, with an increasingly significant effect as the degree of intelligent manufacturing deepens [25]. Liu et al. (2025) estimated the influence of industrial robot penetration on green innovation using the Bartik instrumental variable and found it can significantly promote enterprise green innovation, emphasizing the key role of intelligent manufacturing in driving green innovation [26]. Finally, Li et al. (2025) quantified the application of artificial intelligence through text analysis [27]. They found that it improves the production and energy efficiency of manufacturing enterprises, reduces energy intensity, and has a particularly prominent impact on private enterprises and those in non-smart cities.
China has vigorously promoted intelligent manufacturing pilot projects, including smart factory pilots and intelligent manufacturing pilots. These projects have become key policy tools for promoting the upgrading of the manufacturing industry and green transformation; their implementation effects and impact mechanisms have become the focus of attention of academia and policymakers [28,29]. In addition, Xu et al. (2024) used the data of manufacturing listed companies in Shanghai and Shenzhen from 2011 to 2020 to examine the effect of intelligent manufacturing [30]. They found that intelligent manufacturing can significantly increase the number of green patent applications of enterprises by 3.676%. This outcome strongly demonstrates the promoting effect of intelligent manufacturing on enterprise green innovation from the perspective of innovation output. Moreover, Zhu et al. (2024) demonstrated that intelligent manufacturing can cut down both the total volume and intensity of enterprise carbon emissions [23]. Notably, this effect is particularly evident in non-state-owned enterprises, high-pollution industries, and inland enterprises, uncovering the diverse responses of enterprises with distinct property rights, industry types, and geographical locations to intelligent manufacturing policies. Wei et al. (2024) verified that intelligent manufacturing enhances enterprise environmental performance via multiple channels [31]. These include ramping up environmental protection investment, expanding human capital, and innovating green technologies [31]. Additionally, a “green dividend” comes into being. This research delves deep into the internal mechanisms through which intelligent manufacturing influences an enterprise’s environmental performance.
Overall, some previous studies have indicated that the implementation of intelligent manufacturing and pilot policies significantly promotes enterprise green innovation. This promotion is mainly achieved by driving technological innovation, improving production efficiency, and alleviating financing difficulties [32,33]. There are obvious differences in the implementation effects of policies among different types of enterprises. Non-state-owned enterprises, enterprises in high-pollution industries, large-scale enterprises, and those in specific regions actively respond to the policies. Additionally, the policy synergy effect also plays a crucial role in enhancing enterprise competitiveness and promoting green development [34,35].
In summary, existing studies have made important contributions. Using quasi-experimental methods, recent policy evaluation literature has examined the effects of various industrial policies on firm outcomes. For instance, Jin and Chen (2024) employed a multi-period DID design to show that intelligent manufacturing demonstration projects increase green patent applications [35]. Xu et al. (2024) used a similar approach to quantify the impact on green innovation in the pharmaceutical industry [30]. Zhu et al. (2024) applied DID to demonstrate carbon emission reductions from intelligent manufacturing [23]. While these studies provide credible estimates of average treatment effects, they leave three areas where further refinement is possible rather than completely ‘critical gaps’. First, most focus on short-term innovation outputs (e.g., annual patent counts). Whether the policy fosters sustained, accumulative green innovation—a longer-term capability—remains less explored. Second, these studies typically examine single mediating channels (e.g., financing constraints or digital adoption in isolation). The simultaneous interaction among digital, financial, and governance mechanisms has not been tested together, which may miss synergistic effects. Third, the existing DID literature largely reports heterogeneous effects descriptively (e.g., by region or ownership) without embedding them in a unifying theoretical framework. A system transformation perspective—treating the firm as a co-evolving socio-technical system—has not been systematically applied to this policy context. Such a perspective could explain why treatment effects differ across regions, ownership types, industries, and factor intensities, and how mechanisms reinforce each other. Accordingly, our study aims to complement the existing DID literature by (1) introducing a sustainable green innovation (SGI) indicator that captures persistence, (2) simultaneously testing three interconnected mechanisms within a common framework, and (3) interpreting heterogeneous effects through a system transformation lens, thereby offering a more nuanced understanding without overstating the novelty.
3. Theoretical Framework and Hypothesis
Our theoretical framework adopts a system transformation perspective, which we translate into a step-by-step causal narrative that directly links each theoretical claim to an empirical specification. Step 1 (policy as exogenous shock): The intelligent manufacturing pilot policy acts as an external intervention that reconfigures the firm’s socio-technical system. This implies a positive average treatment effect on sustainable green innovation (SGI), tested via Equation (5) in Section 4.1. Step 2 (decomposition into three subsystems): Drawing on sustainable development’s triple-bottom-line logic and resource-based/stakeholder theories, the firm’s system comprises three interdependent subsystems: technological (digital transformation), financial (financing constraints), and governance (ESG performance). The policy should significantly affect each of these. We test this via Equations (6)–(8). Step 3 (from subsystems to SGI): Improvements in each subsystem contribute to SGI through established mechanisms (reduced information asymmetry, relaxed capital constraints, stakeholder trust). The concurrent positive coefficients on all three mechanisms, together with attenuation of the policy effect when they are controlled for, provide evidence of co-evolution. Step 4 (heterogeneity as initial-configuration dependence): System transformation theory predicts that the policy’s impact varies with the firm’s starting conditions (absorptive capacity, institutional flexibility, technological regime). This is tested via subsample comparisons in Section 5.5.1, Section 5.5.2, Section 5.5.3 and Section 5.5.4. This causal narrative eliminates purely descriptive theory integration by mapping every theoretical claim to an explicit empirical test.
3.1. Institutional Background
China attaches great importance to the development of intelligent manufacturing. It regards this progress as a key measure to enhance the competitiveness of the manufacturing industry and achieve high-quality economic development. As such, it has implemented systematic top-level design and planning at the policy level. China has released a series of significant documents in succession. For example, there is the “Intelligent Manufacturing Development Plan (2016–2020)” and the “14th Five-Year Plan for the Development of Intelligent Manufacturing”. These guiding documents have defined the core position of intelligent manufacturing in the high-quality development of the manufacturing industry. On 9 March 2015, the special action for intelligent manufacturing pilot demonstrations was officially launched. Accordingly, the “Implementation Plan for the Special Action for Intelligent Manufacturing Pilot Demonstrations in 2015” was released. This special action was initiated by the Ministry of Industry and Information Technology (MIIT) of China, which issued the official document titled ‘Notice on Carrying out the Special Action of Intelligent Manufacturing Pilot Demonstration in 2015’. Pilot initiatives were carried out across six key areas: process manufacturing, discrete manufacturing, intelligent equipment and products, new intelligent manufacturing forms and models, intelligent management, and intelligent services. Starting from 2015, the Ministry of Industry and Information Technology actively pushed forward these pilots, announcing projects in batches. On 22 July 2015, the first batch of 46 pilot projects was made public. Subsequently, from 2016 to 2018, the second, third, and fourth batches were implemented. For this study, we manually selected listed companies from the pilot demonstration project list as the treatment group, while using the remaining enterprises as the control group. The phased implementation and gradual expansion of these intelligent manufacturing pilot projects led to varying participation times for different enterprises. This time-and-individual-level difference provides an ideal natural experimental setting to study the impact of intelligent manufacturing on enterprise capacity utilization. It also offers a solid practical foundation for delving into the micro-economic effects of intelligent manufacturing.
3.2. The Effect of Intelligent Manufacturing in Promoting Enterprises’ Sustainable Green Innovation
The Porter hypothesis posits that suitable external regulations can spur enterprise innovation [36]. Here, the intelligent manufacturing pilot policy acts as an external regulatory impetus, compelling enterprises to allocate resources to intelligent manufacturing upgrades. According to technology innovation theory, intelligent manufacturing’s advanced technologies like AI, big data, and cloud computing offer technical backing for enterprise green innovation, broadening innovation concepts and methods [37]. Resource-based theory suggests that enterprise resources are the wellspring of its competitive edge. Intelligent manufacturing can optimize resource allocation, allowing efficient investment of human, material, and financial resources into green innovation. This boosts resource utilization and provides a resource base for sustainable green innovation. Economy-of-scale theory indicates that as an enterprise’s production scale grows, unit costs decline [38]. Intelligent manufacturing cuts the unit cost of green innovation by enhancing production efficiency and expanding scale, enabling enterprises to invest more resources in future green innovation.
Consequently, when an enterprise adopts intelligent manufacturing, we presume the enterprise’s original production function is
where Q represents the output of the enterprise, K is the capital input, and L is the labor input. At the same time, the cost function of the enterprise is
where r is the price of capital, ω is the price of labor, c is the cost coefficient of intelligent manufacturing technology investment, and g(SGI) represents the costs related to the enterprise’s sustainable green innovation level, such as green R&D investment and costs for purchasing environmental protection equipment.
Q = f(L,K),
C = rK + ωL + cI + g(SGI),
When an enterprise increases its investment I in intelligent manufacturing technology, the production function will change according to the promoting effect of technological progress on production. The new production function is
Q′ = fL,K,I, ∂Q′∂Q > 0.
As the investment in intelligent manufacturing technology increases, the enterprise’s output will increase. Intelligent manufacturing technology can improve the degree of automation of production equipment and reduce the scrap rate during the production process, thereby increasing the quantity and quality of products.
Moreover, considering how intelligent manufacturing impacts the cost function, investing in intelligent manufacturing technology can alter the efficiency of capital and labor utilization, thereby influencing production costs. For example, the introduction of automated production equipment may reduce the demand for labor, thus leading to a decrease in labor costs ωL. At the same time, intelligent manufacturing technology may improve the utilization efficiency of capital and reduce the output cost per unit of capital; that is, it has an impact on rK. The investment in intelligent manufacturing technology changes the production cost to
C1 = r1K + ω1L + cI, r1 < r, ω1 < ω.
The investment in intelligent manufacturing technology may promote enterprises’ green innovation and reduce the costs of green innovation. For example, through big-data analysis and intelligent monitoring, enterprises can conduct green R&D accurately, thus reducing unnecessary R&D investment and lowering g(SGI). The green-innovation cost becomes g’SGI < g(SGI).
The profit function of the enterprise is π = PQ − C. After implementing intelligent manufacturing, the profit function becomes π’ = PQ’ − C1 − g’SGI. Given that ∂Q’∂Q > 0, C1 ≤ C and g’SGI < g(SGI), then π’ > π.
Once an enterprise adopts intelligent manufacturing, two things happen. First, it directly promotes green innovation as production-process energy consumption and waste emissions decrease. For instance, intelligent production equipment allows for precise control, cutting down on raw material waste and energy use. Second, intelligent manufacturing boosts product quality and production efficiency, strengthening the enterprise’s market competitiveness and increasing its profits. These extra profits can be channeled into green innovation R&D, driving sustainable green innovation. Based on this, this study puts forward the following research hypothesis:
H1:
The intelligent manufacturing pilot policy has a significantly positive effect on enterprises’ sustainable green innovation. Investment in intelligent manufacturing technology raises enterprise profits by increasing output and cutting costs. Motivated by profit maximization, enterprises will allocate more resources to sustainable green innovation, thus enhancing their sustainable green innovation level.
3.3. Theoretical Logic Underlying the Three Mechanisms
The selection of digital transformation, financing constraints, and ESG performance as mediating mechanisms is not arbitrary but grounded in the system transformation perspective introduced in Section 3.2. Under this perspective, a firm is conceptualized as a socio-technical system comprising three interdependent subsystems: a technological subsystem, captured by digital transformation; a financial subsystem, captured by financing constraints; and a governance subsystem, captured by ESG performance.
These three subsystems correspond to the three core functions that any firm must perform to achieve sustainable green innovation: ability to innovate (technology), ability to fund (finance), and ability to align incentives (governance). The intelligent manufacturing pilot policy, as an exogenous landscape-level intervention, simultaneously impacts all three subsystems. Digital transformation enables process optimization and knowledge diffusion (H2); relaxed financing constraints reallocate capital toward long-term green R&D (H3); and enhanced ESG performance internalizes environmental externalities and builds stakeholder trust (H4). Moreover, these subsystems interact: digital transformation generates traceable data that reduces information asymmetry for financiers, linking H2 and H3; improved ESG performance attracts green investors, which further funds digital upgrades, linking H4 and H2. Thus, the three mechanisms are not isolated mediators but co-evolving components of a system-wide transformation. The system transformation perspective therefore provides the theoretical justification for examining exactly these three mechanisms together.
3.3.1. Enabling Effect of Digital Transformation
The intelligent manufacturing pilot policy encourages enterprises to actively pour resources into digital technologies including big data, artificial intelligence, and cloud computing. These technologies become seamlessly embedded in every facet of enterprise production and operations. As a result, production procedures are streamlined, and resource allocation effectiveness is elevated. In terms of production process optimization, enterprises can accurately grasp the resource requirements of each production link, reduce resource waste and energy consumption, and achieve green production with the help of big-data analysis [39]. Based on technology innovation diffusion theory, digital technologies break down the information silos within enterprises, thereby promoting knowledge sharing and collaborative innovation. The R&D department can use data analysis to explore new R&D directions for green technologies. Additionally, the production department can adjust production parameters in a timely manner based on real-time data to improve green production efficiency. The marketing department can leverage data to understand consumers’ green demands and drive enterprises to develop green innovative products that meet market needs. Therefore, this research advances the following research hypothesis:
H2:
The intelligent manufacturing pilot policy promotes enterprises’ sustainable green innovation by enhancing their digital transformation. Digital transformation serves as a mediating channel through which the policy drives sustainable green innovation.
3.3.2. Alleviating Effect of Financing Constraints
According to information asymmetry theory and signaling theory, information asymmetry exists between enterprises and investors in the financial market. Enterprise green innovation projects face financing difficulties because of information opacity and difficult risk assessment [40]. When the intelligent manufacturing pilot policy is implemented, enterprises produce a vast quantity of data during the intelligent manufacturing phase. This includes data related to production efficiency, product quality, and energy consumption. Such data provides a comprehensive view of a company’s operational state and growth potential. Financial institutions can use this data to precisely evaluate enterprise risks, thereby cutting down on information-gathering and risk-assessment expenses. In terms of signaling theory, enterprises adopting intelligent manufacturing transmit positive signals to the market. These signals suggest they possess innovation capabilities and development potential, which bolsters investors’ confidence. Through intelligent manufacturing, the operational status and future prospects of enterprises are enhanced, making it easier for them to secure financing. With financing constraints eased, enterprises can allocate extra funds to green innovation R&D and purchase environmental protection equipment, thus driving sustainable green innovation. Accordingly, this study posits the following research hypothesis:
H3:
The intelligent manufacturing pilot policy spurs enterprises’ sustainable green innovation by alleviating their financing constraints. There is a positive correlation between the degree of financing constraint alleviation and the level of enterprises’ sustainable green innovation.
3.3.3. Enhancement Effect of ESG Performance
Based on stakeholder theory, firms are required to strike a balance among the interests of various stakeholders, including shareholders, consumers, employees, local communities, and the natural environment [41]. The intelligent manufacturing pilot policy promotes enterprises to implement intelligent manufacturing, which helps to enhance their ESG performance. In terms of the environment, intelligent manufacturing optimizes production processes, thus achieving efficient energy utilization and waste reduction. In terms of social responsibility, it creates high-quality employment opportunities and improves employees’ skills and benefits. In terms of corporate governance, digital management improves operational transparency and decision-making efficiency [42]. After an enterprise’s ESG performance is enhanced, it can gain recognition from consumers, favor from investors, and praise from society. By integrating green innovation into the heart of their strategies, upping investment in green innovation, creating green products, and refining production processes, enterprises can fulfill stakeholders’ anticipations regarding their green development. The logical framework of the paper is shown in Figure 1. In light of this, this study puts forward the following research hypothesis:
Figure 1.
Logical framework of the paper.
H4:
The intelligent manufacturing pilot policy exerts a positive influence on enterprises’ sustainable green innovation by elevating their ESG performance. A high level of ESG performance within an enterprise can effectively drive its sustainable green innovation.
4. Model Design and Explanation
4.1. Model Specification
This research precisely examines the influence of the intelligent manufacturing pilot policy on the degree of enterprises’ sustainable green innovation through constructing a multi-period difference-in-differences (DID) model. The DID model can efficiently manage macro-factors that vary with time and the individual dissimilarities among enterprises. As a result, it can accurately determine the causal impacts of the policy implementation.
In the context of this study, the core explanatory variable is the intelligent manufacturing pilot policy (Policy), which is a dummy variable. The variable being explained is the extent of enterprises’ sustainable green innovation, denoted as SGI. Therefore, the DID model is specified as follows:
where lnSGIi,t represents the natural logarithm of the sustainable green innovation level of the i-th enterprise in period t. α is the constant term. Meanwhile, β is the key coefficient of concern in this study. Its magnitude and significance reflect the net impact of the intelligent manufacturing pilot policy on the level of enterprises’ sustainable green innovation. If β is significantly positive, the intelligent manufacturing pilot policy promotes the enterprises’ sustainable green innovation. If β is significantly negative, the policy inhibits the enterprises’ sustainable green innovation. If β is not significant, the policy has no obvious impact on the enterprises’sustainable green innovation. Control is a series of control variables, including enterprise size (size), return on equity (roe), total debt ratio (tl), ownership concentration (Shrcr), Tobin’s Q (tobin), and enterprise age (age). These variables control other factors that may affect the level of the enterprises’ sustainable green innovation from multiple dimensions, such as enterprise financial status, scale characteristics, market value, and development stage. γj is the coefficient of each control variable, thus reflecting the degree of their impact on the level of the enterprises’ sustainable green innovation. μi represents the individual fixed effect, which is used to control for the characteristics of enterprises that do not change over time, such as unique organizational culture and geographical location. These factors may affect the enterprises’ green innovation decisions but remain relatively stable in the short term. τt represents the time fixed effect. It controls for the macrofactors that change over time and are faced by all enterprises, such as the macroeconomic situation, the overall technological development trend of the industry, and national-level green innovation policies. Thus, it ensures that the model estimation results are not interfered by these common time trends. ϵi,t is the random error term.
In addition, when exploring the impact mechanism of the intelligent manufacturing pilot policy on the level of enterprises’ sustainable green innovation, the following impact regression models are constructed to deeply analyze the roles played by the degree of digital transformation (digital), the level of financing constraints (SA), and the level of ESG performance (hesg). The intelligent manufacturing pilot policy may promote enterprises’ sustainable green innovation by driving their digital transformation. Therefore, a model for the impact of policy implementation on digital transformation is constructed as follows:
where digitali,t represents the degree of digital transformation of the i-th enterprise in period t. α0 is the constant term, and α1 reflects the impact coefficient of the intelligent manufacturing pilot policy on the degree of digital transformation. If α1 is significantly positive, the degree of digital transformation plays a positive mediating role between the intelligent manufacturing pilot policy and the level of enterprises’ sustainable green innovation. A high degree of an enterprise’s digital transformation entails a strong promoting effect of the intelligent manufacturing pilot policy on the level of its sustainable green innovation. Conversely, it plays a negative mediating role. The intelligent manufacturing pilot policy may promote the enterprises’ sustainable green innovation by alleviating their financing constraints. Therefore, a model for the impact of policy implementation on financing constraints is constructed as follows:
where SAi,t is the financing constraint level of the i-th enterprise in period t. β0 is the constant term, and β1 reflects the impact coefficient of the policy on the financing constraint level. If β1 is significantly negative, the policy can alleviate the financing constraints of enterprises.
Finally, the intelligent manufacturing pilot policy may promote the enterprises’ sustainable green innovation by enhancing their ESG performance level (hesg). A model for the impact of policy implementation on ESG performance is constructed as follows:
where hesgi,t denotes the ESG performance level of the i-th enterprise during the t-th period. γ0 is the constant term, and γ1 reflects the impact coefficient of the policy on the ESG performance level. If γ1 is significantly positive, the policy can enhance the ESG performance of enterprises.
4.2. Variable Selection and Explanation
4.2.1. Explained Variable
The level of enterprises’ sustainable green innovation reflects the long-term input and output capabilities of enterprises in the field of green innovation, thus embodying the accumulativeness and dynamics of innovation. This study measures it from the dimension of innovation output using green patent data. Given the limitations in the disclosure of green innovation R&D funds by listed companies, accurate input data are difficult to obtain. Therefore, the output indicator of the number of green patent applications is a reasonable alternative option. Among them, Patentt−2, Patentt−1, and Patentt represent the green innovation levels of two-period lag, one-period lag, and the current period, respectively. SGIt, that is, the sustainability of the current-period green innovation, is a quantitative manifestation of the level of the enterprises’ sustainable green innovation. This calculation method can effectively capture the change trend of the enterprises’ green innovation in the time series and comprehensively reflect the sustainable development ability of this innovation.
Unlike conventional green innovation measures that rely on single-period patent counts, our focus is on sustainable green innovation (SGI), defined as the persistence and accumulative momentum of green innovation over time. A firm may temporarily increase patents in response to a policy (a transient spike), whereas SGI captures whether green innovation is sustained (self-reinforcing), which is the expected outcome of genuine system transformation. The formula is
This ratio reflects the growth trend over a rolling two-year window: >1 indicates sustained innovation; <1 signals decline. Thus, SGI measures long-term institutionalization of green innovation, not short-term fluctuations.
As seen in Table 1, First, the dependent variable lnSGI is the natural logarithm of the ratio of rolling two-year patent sums, which typically ranges between 0 and 4.32. Consequently, the absolute scale of the intercept is driven by the scaling of the control variables (e.g., lnsize has a mean of 3.1 and a coefficient of about 9.8, so the term 9.8 × 3.1 ≈ 30.4 accounts for most of the intercept’s magnitude). Second, the inclusion of city and year fixed effects absorbs unobserved heterogeneity, which shifts the baseline level but does not affect the estimated treatment coefficient. Third, the intercept has no direct economic interpretation in a differenced model; only the treatment coefficient (Policy) and the relative differences across control variables are meaningful. A standard practice in panel DID regressions with logged outcome variables and large fixed-effect constants is to focus on the marginal effects rather than the absolute level of the intercept. The magnitude of the intercept does not undermine the validity or interpretation of the estimated policy effect.
Table 1.
Descriptive statistical results of the main variables.
4.2.2. Core Explanatory Variable
The intelligent manufacturing pilot policy (Policy) is the core explanatory variable, which is used to determine whether an enterprise implements intelligent manufacturing. This variable is a dummy variable. If an enterprise implements intelligent manufacturing in a certain year, Policy takes a value of 1 in that year and subsequent years. If it does not implement intelligent manufacturing, the value is 0. This setting can clearly distinguish between the samples of enterprises that have implemented intelligent manufacturing and those that have not, which is helpful for accurately evaluating the impact of the intelligent manufacturing pilot policy on the level of enterprises’ sustainable green innovation.
4.2.3. Control Variables
- (1)
- Enterprise size (size) significantly influences an enterprise’s innovation capacity and resource distribution. Generally, large enterprises have abundant resources and can invest funds in R&D and technological upgrades, including green innovation. This study uses the total assets of an enterprise to measure its size. A high number of total assets of an enterprise indicates that the enterprise has sufficient available resources and may have high strength and potential in green innovation.
- (2)
- Return on equity (roe) serves as an indicator that mirrors an enterprise’s profitability. It reveals how effectively the enterprise utilizes its capital to generate profits. Enterprises with strong profitability have abundant funds to support innovation activities, including investment in green innovation [43]. Return on equity is measured by calculating the ratio of an enterprise’s net profit to its owners’ equity. A high value of this indicator entails an enterprise’s favorable profit situation as well as a strong ability to provide financial support for green innovation.
- (3)
- The total debt ratio (tl) measures the debt burden and financial risk of an enterprise. A high debt ratio may limit the enterprise’s financing ability and capital liquidity, thus affecting its investment in innovation activities [43]. The total debt ratio is represented by the ratio of the total liabilities at the end of the year to the total assets. A high debt ratio imposes significant financial pressure on the enterprise, which might adversely affect its investment in green innovation.
- (4)
- Ownership concentration (Shrcr) impacts an enterprise’s decision-making and governance. With concentrated ownership, major shareholders can better drive long-term strategic investments like green innovation [43]. Overly dispersed ownership may slow decision-making. Here, we measure ownership concentration by the largest tradable shareholder’s shareholding ratio to analyze its effect on sustainable green innovation.
- (5)
- Tobin’s Q value (tobin) represents the ratio of an enterprise’s market value to asset replacement cost, indicating investment value and market expectations. A high Q implies market optimism about future profitability, spurring innovation to maintain or boost market value [44]. We calculate it as the ratio of market value to total assets to explore its link with sustainable green innovation.
- (6)
- Enterprise age (age) reflects experience and development stage. Mature firms may have a rigid organization despite a complete R&D system, while young firms can be more innovative [43]. We calculate enterprise age as the difference between the current year and the listing year to analyze its impact on green innovation.
4.2.4. Mechanism Variables
- (1)
- Degree of digital transformation (digital): We measure an enterprise’s digital transformation degree from five aspects: AI, big data, cloud computing, blockchain, and digital application. By counting 76 relevant word frequencies, we can gauge this degree. Digital transformation helps enterprises optimize production, improve resource allocation, and share knowledge, thus affecting green innovation. As Zhang et al. (2025) pointed out, a higher level of digitization makes it more likely for enterprises to achieve green innovation breakthroughs using digital technology [45].
- (2)
- Financing constraint level (SA) was developed by Hadlock and Pierce. It is calculated based on the company’s size and age and can effectively measure the financing constraints of an enterprise. Generally, small and young companies have high SA index values, thus indicating great financing constraints. Financing constraints will affect the enterprise’s ability to obtain funds, thereby restricting investment in green innovation. In this study, the impact mechanism of financing constraints on the enterprise’s sustainable green innovation is analyzed through the SA index [46].
- (3)
- ESG performance level (hesg): We utilize the Huazheng Rating’s ESG index to assess an enterprise’s ESG performance. ESG performance encompasses the enterprise’s environmental, social, and corporate governance aspects. Sound ESG performance enables enterprises to build a favorable image and draw investment, and may encourage them to invest more in green innovation for sustainable development. A high ESG index reflects enhanced environmental, social, and governance performance, signifying positive outcomes from the enterprise’s sustainable green innovation efforts.
4.3. Data Sources and Explanation
This study examines the impact of the intelligent manufacturing pilot policy on enterprises’ sustainable green innovation levels. To ensure reliable and scientific conclusions, data sources are extensive and representative, spanning from 2010 to 2023. For sustainable green innovation levels, data on the number of green patent applications is sourced from the National Intellectual Property Administration’s patent database. These are quantified using a pre-set formula, considering application numbers across different periods, effectively reflecting the sustainability of green innovation. The intelligent manufacturing pilot policy (Policy) data is gathered by screening listed pilot enterprises from the “Announcement of the Ministry of Industry and Information Technology on Announcing the List of Intelligent Manufacturing Pilot Demonstration Projects”. Control variable data mainly comes from the China Stock Market & Accounting Research database and the Wind database. Among mechanism variables, the degree of digital transformation (digital) data is obtained through big-data text mining of enterprise annual reports, announcements, and official websites. By counting 76 digital-related word frequencies across AI, big data, cloud computing, blockchain, and digital application dimensions, the digital transformation degree of enterprises is measured, providing data for studying its mediating effect between the policy and sustainable green innovation. The financing-constraint-level data is calculated using the SA index by Hadlock and Pierce, based on enterprise financial data. The ESG performance level (hesg) data uses the Huazheng Rating’s ESG index. All data excludes PT, ST, *ST-listed enterprises, financial firms, and those with severely missing major financial data, resulting in 38,685 sample sizes. The descriptive statistics of the specific related variables are shown in Table 1.
5. Empirical Results
5.1. Parallel Trend Test
Prior to performing the empirical analysis with the multiperiod DID model, a rigorous test was carried out on the crucial parallel trend assumption. As depicted in Figure 2, the test findings indicate that during the four-year period preceding the policy implementation (from pre4 to pre1), the dynamic policy effect fluctuated around zero, and the overall trend line maintained relative stability. This outcome strongly suggests that the experimental and control groups exhibited comparable development trends in the explained variable before the policy took effect, thereby satisfying the parallel trend assumption. Consequently, the multiperiod DID model can be reasonably and reliably employed for the subsequent assessment of the policy’s impact.
Figure 2.
Parallel trend test results.
Meanwhile, starting from the year when the policy was implemented (current), the dynamic policy effect increased rapidly and reached its peak in the second year after the implementation (post2). Although a gradual downward trend occurred afterward, it remained above zero in the fifth year after the implementation (post5). This result not only validates the parallel trend assumption but also provides an intuitive demonstration. It shows that following the implementation of the policy, it exerted a notably positive influence on the variables being explained, particularly the level of enterprises’ sustainable green innovation. Moreover, this positive impact emerged rapidly in the early stage of the policy implementation and continued to play a role for a certain period.
5.2. Benchmark Regression Analysis
This research constructs four models to examine the impact of the intelligent manufacturing pilot policy (Policy) on the level of enterprises’ sustainable green innovation (lnSGI). In Table 2, Model (1) contains only Policy, used for a basic look at Policy’s influence on lnSGI. Model (2) adds year fixed effects to Model (1), controlling for time-varying macro-factors and reducing time-trend interference. Model (3) incorporates control variables like enterprise size and financial status on the basis of Model (1), controlling other factors from multiple angles to cut omitted-variable errors, yet without addressing the time trend. Model (4) combines the strengths of Model (2) and Model (3), including control variables and year fixed effects to minimize estimation bias and boost the reliability of estimating the Policy–lnSGI relationship. Regression results show Policy coefficients in the four models are 1.2671, 0.4418, 0.4893, and 0.4070 respectively, all significantly positive at the 1% level. This clearly shows the intelligent manufacturing pilot policy positively promotes enterprises’ sustainable green innovation.
Table 2.
Benchmark regression results.
Regarding control variables, in Model (3) and Model (4), lnsize coefficients are 10.3243 and 9.8164, significantly positive at 1%, indicating larger enterprises have higher sustainable green innovation levels. In Model (4), the lnShrcr coefficient is 0.0723, positive at 10%, meaning concentrated ownership spurs major shareholders to drive green innovation. The lntobin coefficient in Model (4) is 0.0775, positive at 1%. Since Tobin’s Q reflects market value recognition, a high value motivates sustainable green innovation. High-Tobin’s-Q enterprises invest in green innovation to maintain and boost market value, meeting market green-development expectations. In Model (3) and Model (4), lnage coefficients are 0.5900 and 0.4912, significantly positive at 1%, suggesting older enterprises with rich technical, management, and market resources have higher sustainable green innovation levels. Regarding the scale of the constant term (e.g., −30.9193 in column 4), this large absolute value is driven by the scaling of the control variables (e.g., the product of lnsize coefficient 9.8164 and its mean 3.103 alone contributes approximately 30.5) and the fixed effects. It does not affect the interpretation of the Policy coefficient or the model’s validity. We therefore focus on the marginal effects of the policy and control variables.
5.3. Robustness Test
5.3.1. Placebo Test Results
Figure 3 illustrates the results of the placebo test, a vital procedure for validating the robustness of research findings and the reliability of causal relationships. The red curve in the figure depicts the fitting of the p-value distribution, while the orange scatter points represent the estimated coefficients from each randomization along with their corresponding p-values. As evident from Figure 3, the majority of the randomly generated estimated coefficients cluster around zero. Moreover, most of the p-values exceed 0.05. This outcome suggests that the significant influence of the intelligent manufacturing pilot policy on the level of enterprises’ sustainable green innovation, as observed in the benchmark regression, is unlikely to be attributable to random elements or unaccounted confounding factors. This placebo test strongly bolsters the authenticity of the policy’s impact in the study and the credibility of the causal inference. It further validates the robustness of the aforementioned benchmark regression results.
Figure 3.
Placebo test.
5.3.2. Propensity Score Matching Difference-in-Differences Test
The propensity score matching difference-in-differences method (PSM-DID) is a prevalent technique for assessing policy effects. Figure 4 presents the kernel density distribution of propensity scores prior to PSM-DID matching. Notably, there are distinct disparities between the kernel density curves of the treatment group’s (solid black line) and the control group’s (dashed orange line) propensity scores. This suggests that, before matching, the treatment and control groups exhibit substantial differences in various characteristics influencing policy implementation or outcomes. Directly conducting a DID analysis in this situation could lead to inaccurate estimation results due to sample selection bias. Conversely, Figure 5 shows that the kernel density curves of the treatment and control groups’ propensity scores nearly overlap. This indicates that the PSM process has effectively eliminated most of the sample selection bias. As a result, the research conclusions derived from the PSM-DID method are both reliable and convincing.
Figure 4.
Prematch results of PSM-DID.
Figure 5.
PSM-DID matching results.
As shown in Model (1) of Table 3, in the ordinary least squares (OLS) estimation, the coefficient of Policy is 0.9859, significantly positive at the 1% significance level. This result initially suggests that the intelligent manufacturing pilot policy implementation strongly promotes enterprises’ sustainable green innovation. However, OLS estimation may be affected by factors like omitted variables and sample selection bias, resulting in biased estimates. To address this, in Model (2), after applying the fixed-effect model to control for individual and time fixed effects, the Policy coefficient is 0.4070, still significant at the 1% level. The fixed-effect model can, to some extent, mitigate biases from individual heterogeneity and time trends, improving the accuracy of the policy effect estimation. In Model (3)’s cross-sectional PSM-DID regression (on_support column), the Policy coefficient is 0.4051, significant at the 1% significance level. The PSM-DID method, via PSM, effectively reduces sample selection bias, making the treatment and control groups comparable in key characteristics. The result is consistent with that of the fixed-effect model, confirming the significant positive impact of the intelligent manufacturing pilot policy on enterprises’ sustainable green innovation and enhancing the reliability and robustness of the research findings.
Table 3.
Benchmark regression and cross-sectional PSM-DID regression results.
5.3.3. One-Period Lag Test
Model (1) in Table 4 presents the level of enterprises’ sustainable green innovation with a one-period lag (L.lnSGI). This particular test aims to validate the lag effect of the policy’s influence and to explore how the green innovation level in the previous period impacts the current period. The findings reveal that the coefficient of Policy is 0.4311, and it is significantly positive at the 1% significance level. This result implies that even with a one-period lag, the positive effect of the intelligent manufacturing pilot policy on enterprises’ sustainable green innovation remains substantial. It indicates that the impact of the policy has a certain degree of persistence, rather than being an accidental or short-lived occurrence. As such, it provides support for the conclusion that the policy exerts a long-term positive influence on enterprises’ green innovation endeavors.
Table 4.
Robustness test results.
5.3.4. Deletion of Some Samples
Model (2) displays the regression analysis results following the removal of samples from the four direct-administered municipalities: Beijing, Tianjin, Chongqing, and Shanghai. These cities’ samples were excluded as their economic and technological development levels markedly differ from those of other regions, potentially compromising the research results’ generalizability. In this model, the coefficient of Policy is 0.4381, significantly positive at the 1% significance level. When compared to the benchmark regression, neither the coefficient nor its significance level undergoes substantial changes. This finding suggests that after eliminating these special-region samples, the policy’s positive influence on the level of enterprises’ sustainable green innovation remains strong. Evidently, the unique circumstances of individual regions do not undermine the study’s conclusions.
5.3.5. Replacement of Fixed Effects and Clustering Methods
Model (3) includes industry fixed effects to account for unobservable industry-level factors affecting enterprises’ sustainable green innovation. The Policy coefficient is 0.4070 with a t-value of 3.38. It is similar to the benchmark regression (controlling individual and year fixed effects) and significant at 1%. This shows the policy’s promoting effect on sustainable green innovation stays significant with industry fixed effects.
Model (4) changes the clustering dimension from enterprise-level to industry-level to consider variable correlations in the industry. The Policy coefficient remains 0.4070, significant at 5%. Despite a slightly lower significance, the coefficient is stable. This indicates the policy impact on sustainable green innovation persists after adjusting the clustering dimension, and the results are robust to clustering method changes.
5.4. Endogeneity Analysis
Endogeneity can arise from omitted variables, reverse causality, or measurement error. To mitigate these concerns, we employ an instrumental variable (IV) strategy. Following the literature on infrastructure and digital technology adoption, we construct the IV as the interaction between a time-invariant geographic feature—the city’s topographic undulation degree (average slope within the urban administrative area)—and a linear time trend. The underlying logic is twofold.
Relevance (correlation condition): Topographic undulation affects the cost and feasibility of constructing network infrastructure, including high-speed broadband and logistics networks, which are essential for intelligent manufacturing adoption. Cities with flatter terrain tend to have better digital infrastructure and lower costs for deploying smart manufacturing systems. The interaction with a time trend captures the increasing importance of digital connectivity over the sample period.
Exclusion restriction (exogeneity condition): The topographic undulation of a city is determined by natural geography and is exogenous to firm-level green innovation decisions. The exclusion restriction requires that the IV affects sustainable green innovation only through the intelligent manufacturing policy, not through any other channel. We acknowledge that this assumption cannot be directly tested, but we provide indirect evidence to support its plausibility. First, topographic undulation does not directly influence firm R&D budgets, environmental strategies, or patenting behavior, as it is a physical characteristic unrelated to economic or regulatory incentives for green innovation. Second, we control for a rich set of city- and firm-level covariates that could otherwise correlate with both terrain and innovation outcomes. While we cannot definitively rule out all potential violations, these checks increase confidence in the exclusion restriction.
We recognize that the exclusion restriction cannot be directly tested and that our causal interpretation relies on the assumption that topographic undulation affects green innovation only through intelligent manufacturing policy adoption. While we have controlled for a rich set of covariates and conducted balance and falsification tests, the validity of the IV estimate is conditional on this maintained assumption. Readers should therefore interpret the IV results as suggestive evidence rather than definitive proof of causality, and future research could explore alternative identification strategies.
The study uses the two-stage least squares method for instrumental variable regression, with results in Table 5. In the first stage, the IV coefficient is 0.0042, significant at 1%, showing a strong correlation between the IV and Policy. In the second stage, the Policy coefficient is 12.0465, significantly positive at 1%. Compared to benchmark regression, the coefficient change post-endogeneity treatment implies the policy effect was likely affected by endogeneity before. After resolving this, the intelligent manufacturing pilot policy still strongly promotes enterprise sustainable green innovation, strengthening the research conclusions’ robustness and persuasiveness.
Table 5.
Regression results of instrumental variables.
5.5. Heterogeneity Analysis
5.5.1. Regional-Level Characteristics
This section divides the research samples into three regions (the eastern, central, and western regions) for regression analysis, with results shown in Table 6. In the eastern region, the Policy coefficient is 0.4507, significantly positive at the 1% level. This shows that the intelligent manufacturing pilot policy strongly promotes enterprises’ sustainable green innovation there. The eastern region’s developed economy, rich tech resources, strong industrial base, and favorable innovation ecosystem enable enterprises to leverage local advantages like advanced tech, high-quality talent, and complete infrastructure during policy implementation, driving green innovation and sustainable development. In the central region, the Policy coefficient is 0.3938, not significant. The central region lags behind the east in economic development, tech investment, and innovation. Despite some promoting effects of the policy, it has not reached a significant level. Central-region enterprises implementing the policy may face resource shortages and limited technology absorption, restricting the policy’s impact on sustainable green innovation. In the western region, the Policy coefficient is 0.2517, significantly positive at the 10% level. The intelligent manufacturing pilot policy can promote enterprises’ sustainable green innovation to some extent, but less effectively than in the east. The western region’s lagging economy, smaller enterprise scale, and insufficient innovation investment mean enterprises face many difficulties when implementing the policy, limiting its effectiveness.
Table 6.
Regional heterogeneity regression results.
5.5.2. Property Right Characteristics
This section centers on property right characteristics, categorizing sample enterprises into state-owned and non-state-owned based on their property right natures, and analyzes their green innovation performances.
As shown in Model (1) of Table 7, within the state-owned enterprise group, the Policy coefficient is 0.2470, yet it is not significant. State-owned enterprises typically enjoy advantages in resource procurement and policy backing. But due to their substantial social responsibilities and relatively intricate decision-making procedures, they might encounter limitations from institutional mechanisms when acting on the intelligent manufacturing pilot policy for green innovation. Hence, the policy has a negligible impact on enhancing their sustainable green innovation level. In Model (2), for non-state-owned enterprises, the Policy coefficient is 0.6831, significantly positive at the 1% level. Non-state-owned enterprises are exposed to fierce market competition and are highly attuned to market opportunities. Upon implementing the intelligent manufacturing pilot policy, they can nimbly adjust strategies and promptly allocate resources to the green innovation sector. Thus, the policy significantly promotes the sustainable green innovation level of non-state-owned enterprises. Owing to differences in property right natures, enterprises vary in their response and utilization of the intelligent manufacturing pilot policy, with non-state-owned enterprises having an edge in leveraging the policy for green innovation.
Table 7.
Regression results of property rights and industry heterogeneity.
5.5.3. Industry Type Characteristics
This study classifies enterprises as heavily polluting based on the secondary industry classification in the “Industry Classification Guidelines for Listed Companies” issued by the China Securities Regulatory Commission to define such industries.
From Model (3) in Table 7, for heavily polluting industries, the Policy coefficient is 0.5399, not significant. These industries face intense environmental protection pressure and significant technical transformation hurdles. Although the intelligent manufacturing pilot policy offers green innovation opportunities, the high difficulty of technical change and costly equipment renewal within these industries prevent the policy from fully manifesting its positive effects in the short term. As a result, its impact on enhancing sustainable green innovation levels is not substantial.
In Model (4), for non-heavily polluting industries, the Policy coefficient is 0.4365, significantly positive at the 1% level. These industries typically have rapid technological updates and a strong capacity to adopt new technologies. After implementing the intelligent manufacturing pilot policy, non-heavily polluting industry enterprises can swiftly pool resources and integrate intelligent manufacturing into production and innovation, effectively boosting sustainable green innovation levels. This indicates that industry type significantly influences the policy’s effectiveness, with non-heavily polluting industries having great potential to promote green innovation using the intelligent manufacturing pilot policy.
5.5.4. Characteristics of Production Factors
All the sample industries in this research are categorized into three types according to the intensity of production factors, namely technology-intensive industries, capital-intensive industries, and labor-intensive industries. Model (1) in Table 8 focuses on technology-intensive industries. The Policy coefficient is 0.5616, significantly positive at the 1% level. These industries rely heavily on tech innovation, boasting strong innovative capabilities and a solid tech base. The intelligent manufacturing pilot policy offers them advanced tech tools and innovation platforms. This allows for effective resource integration and speeds up green tech R&D and application, significantly enhancing enterprises’ sustainable green innovation.
Table 8.
Regression results of heterogeneity of factors of production.
In contrast, the policy’s impacts on capital-intensive and labor-intensive industries are not significant. Capital-intensive industries have substantial fixed assets, with large investments in production equipment and infrastructure. While the policy aids in improving production and resource efficiency, the Policy coefficient is 0.4806, not significant due to high production adjustment costs and long equipment renewal cycles. For instance, intelligent manufacturing transformation demands significant capital for equipment overhaul and system upgrades, curbing the policy’s effect. Labor-intensive industries depend mainly on a large labor force for production, having weak tech innovation. When implementing the policy, they encounter issues like low employee skills and financial shortages. Also, the demand for and application of intelligent manufacturing tech in some enterprises are restricted. As a result, the Policy coefficient is −0.0182, not significant, showing the policy has little impact on these enterprises’ sustainable green innovation levels.
5.6. Further Analysis of the Influence Mechanism
This section delves into the research of the underlying mechanisms. It examines the roles of the degree of digital transformation (lndigital), the level of financing constraints (lnSA), and the ESG performance level (lnhesg) as mediating channels through which the intelligent manufacturing pilot policy affects enterprises’ sustainable green innovation. Specifically, we test whether the policy significantly influences each mechanism variable (Step 1 of the two-step mediation approach), consistent with the theoretical framework in Section 3.3. The regression results are presented in Table 9.
Table 9.
Regression results of influencing mechanism analysis.
In Model (2), the Policy coefficient for lndigital is 0.1678, significantly positive at the 1% level. This shows that the degree of digital transformation serves as a positive mediating channel the relationship between the intelligent manufacturing pilot policy and enterprises’ sustainable green innovation. When enterprises have a high degree of digital transformation, the policy’s promoting effect on sustainable green innovation is pronounced.
Model (3) reveals that the Policy coefficient for lnSA is −0.0074, significantly negative at the 1% level. This indicates a negative mediating effect of the financing constraint level between the policy and sustainable green innovation. Fewer financing constraints for enterprises mean a stronger promoting effect of the intelligent manufacturing pilot policy on sustainable green innovation. When financing constraints are low, after implementing intelligent manufacturing, improvements in product quality, production efficiency, and market share expansion and increased profit expectations can be smoothly translated into loan support from financial institutions and investor investment. Enterprises can then allocate funds to green R&D and equipment purchases, strongly driving sustainable green innovation. Conversely, high financing constraints limit green innovation investment even with intelligent manufacturing in place, making it hard for the policy to fully realize its promoting effect on sustainable green innovation.
In Model (4), the Policy coefficient for lnhesg is 0.0676, significantly positive at the 1% level. This implies that enterprises with high ESG performance levels place greater emphasis on green development and deeply integrate green innovation into their corporate strategies upon implementing the intelligent manufacturing pilot policy. Good ESG performance gives enterprises more motivation and resources to develop green products and technologies, significantly enhancing the policy’s promoting effect on sustainable green innovation. However, for enterprises with low ESG performance, their focus on and investment in green innovation are relatively lacking. Even with intelligent manufacturing implemented, the policy’s promoting effect on sustainable green innovation will be substantially diminished. The positive and significant coefficients on all three mechanisms (0.1678, −0.0074, 0.0676) confirm that the policy simultaneously upgrades the technological, financial, and governance subsystems, consistent with the system transformation logic.
6. Conclusions and Implications
6.1. Research Conclusions
This research investigated the influence of the intelligent manufacturing pilot policy on enterprises’ sustainable green innovation. By constructing a multiperiod DID model and an influence mechanism regression model, an empirical analysis was carried out on the unbalanced panel data of listed companies spanning from 2010 to 2023. The key conclusions are as follows:
Firstly, consistent with previous studies that document positive effects of intelligent manufacturing on green innovation [47,48], we find that the intelligent manufacturing pilot policy significantly promotes enterprises’ sustainable green innovation. Extending beyond prior work, which typically focuses on short-term innovation outputs, our study uses a sustainable green innovation (SGI) indicator that captures the persistence of innovation over time. This reveals that the policy generates lasting, accumulative effects rather than transient spikes—a distinction not previously examined.
Secondly, while existing literature has separately identified digital transformation [49], financing constraints [50], and ESG performance as facilitators of green innovation [51], our study contributes by simultaneously testing these three mechanisms within a unified system transformation framework. We find that all three pathways operate concurrently, with coefficients of 0.1678 (digital), −0.0074 (financing constraints alleviation), and 0.0676 (ESG). This co-occurrence supports our theoretical proposition that the policy triggers interdependent subsystem changes—a finding that singular mechanism studies would miss.
Finally, our heterogeneity results both corroborate and extend prior evidence. In line with regional heterogeneity findings, we confirm that eastern regions benefit most. Regarding ownership, we found that non-state-owned enterprises respond more strongly than state-owned ones. However, we extend the literature by systematically examining industry-type (heavily and non-heavily polluting) and factor-intensity (technology-, capital-, labor-intensive) heterogeneities. The non-significant effects in capital- and labor-intensive industries reveal that the policy’s transformative potential is constrained by sectoral technological capabilities. These patterns collectively support the system transformation perspective: initial system configurations (regional innovation ecosystems, ownership flexibility, pollution intensity, factor endowments) fundamentally shape the policy’s impact.
Taken together, our findings support a system transformation perspective: the intelligent manufacturing pilot policy does not simply impose a linear incentive but triggers coordinated upgrading across technological, financial, and governance subsystems. The positive coefficients on all three mechanisms (digital transformation, financing constraint alleviation, and ESG improvement) with statistical significance demonstrate co-evolutionary change rather than isolated adjustments. Furthermore, the heterogeneity results—stronger effects in eastern regions, non-state-owned firms, non-heavily polluting industries, and technology-intensive sectors—reveal that the system’s initial configuration (regional innovation capacity, ownership flexibility, industry technology regimes, factor endowments) profoundly shapes the magnitude and speed of transformation. These patterns are exactly what the system transformation perspective would predict: path-dependent, context-sensitive, and multi-dimensional.
6.2. Policy Implications
Based on the above research conclusions, we propose the following policy suggestions to enhance the promoting role of intelligent manufacturing in enterprises’ sustainable green innovation.
First, to leverage the main positive effect of the intelligent manufacturing pilot policy on sustainable green innovation (ATE = 0.407, p < 0.01, Table 2 column 4), governments should continue expanding intelligent manufacturing demonstration projects, particularly by reducing entry barriers for small and medium-sized enterprises. Policy support should shift from one-time subsidies to long-term incentive mechanisms to encourage persistent rather than sporadic innovation.
Second, addressing the three mediating mechanisms (digital transformation: 0.1678, p < 0.01; financing constraints: −0.0074, p < 0.01; ESG: 0.0676, p < 0.01; all from Table 9), we recommend, for digital transformation, to invest in public industrial internet platforms and provide technical assistance for legacy equipment retrofitting; for financing constraints, establish green credit guarantee funds and encourage financial institutions to use smart manufacturing data as collateral for loans, lowering information asymmetry; for ESG performance, mandate ESG disclosure for pilot enterprises and link ESG ratings to preferential access to government procurement and low-interest loans. These three levers should be implemented in a coordinated manner, as their co-evolution produces synergistic effects.
Third, responding to heterogeneity findings (eastern region: 0.4507, p < 0.01; central: 0.3938, n.s.; western: 0.2517, p < 0.10; state-owned: 0.2470, n.s.; non-state-owned: 0.6831, p < 0.01; non-heavily polluting: 0.4365, p < 0.01; technology-intensive: 0.5616, p < 0.01; capital- and labor-intensive: n.s.; from Table 6, Table 7 and Table 8), policies should be differentiated: regionally, central and western regions need stronger infrastructure and absorptive capacity support to catch up with the east. Ownership-wise, state-owned enterprises require streamlined decision-making and green innovation performance metrics, while non-state-owned firms need more policy transparency. Industry-wise, heavily polluting industries should receive phased transition subsidies and clean technology vouchers. Factor-intensity-wise, capital- and labor-intensive industries need customized upskilling programs and low-cost automation solutions to overcome adoption barriers.
Fourth, to foster system transformation rather than isolated changes, policymakers should adopt a holistic perspective. Evaluation frameworks should monitor not only aggregate patent counts but also the persistence (SGI) and the co-movement of digital, financial, and governance indicators. Cross-departmental coordination is essential to align incentives and avoid siloed implementation.
Author Contributions
Conceptualization, S.F. and H.J.; methodology, S.F.; software, S.F.; validation, H.Z. and Z.Y. All authors have read and agreed to the published version of the manuscript.
Funding
This research appreciates the funding from the Beijing Nova Program of Science & Technology under grant (Z191100001119100).
Institutional Review Board Statement
Not applicable.
Informed Consent Statement
Not applicable.
Data Availability Statement
The original contributions presented in this study are included in the article. Further inquiries can be directed to the corresponding author.
Conflicts of Interest
The authors declare no conflicts of interest.
References
- Ma, S.; Ding, W.; Liu, Y.; Zhang, Y.; Ren, S.; Kong, X.; Leng, J. Industry 4.0 and cleaner production: A comprehensive review of sustainable and intelligent manufacturing for energy-intensive manufacturing industries. J. Clean. Prod. 2024, 467, 142879. [Google Scholar] [CrossRef] [Scilit]
- Khan, I.S.; Ahmad, M.O.; Majava, J. Industry 4.0 and sustainable development: A systematic mapping of triple bottom line, Circular Economy and Sustainable Business Models perspectives. J. Clean. Prod. 2021, 297, 126655. [Google Scholar] [CrossRef] [Scilit]
- Yu, L.; Zhang, Q. Measurement of new qualitative productivity kinetic energy from the perspective of digital and green collaboration--comparative study based on European countries. J. Clean. Prod. 2024, 476, 143787. [Google Scholar] [CrossRef] [Scilit]
- Benedetti, I.; Guarini, G.; Laureti, T. Digitalization in Europe: A potential driver of energy efficiency for the twin transition policy strategy. Socio-Econ. Plan. Sci. 2023, 89, 101701. [Google Scholar] [CrossRef] [Scilit]
- Giagnocavo, C.; Duque-Acevedo, M.; Terán-Yépez, E.; Herforth-Rahmé, J.; Defossez, E.; Carlesi, S.; Delalieux, S.; Gkisakis, V.; Márton, A.; Molina-Delgado, D.; et al. A multi-stakeholder perspective on the use of digital technologies in European organic and agroecological farming systems. Technol. Soc. 2025, 81, 102763. [Google Scholar] [CrossRef] [Scilit]
- Dohale, V.; Ambilkar, P.; Mangla, S.K.; Narkhede, B.E. Critical factors to sustaileanant innovations for net-zero achievement in the manufacturing supply chains. J. Clean. Prod. 2024, 455, 142295. [Google Scholar] [CrossRef] [Scilit]
- Madzík, P.; Falát, L.; Yadav, N.; Lizarelli, F.L.; Čarnogurský, K. Exploring uncharted territories of sustainable manufacturing: A cutting-edge AI approach to uncover hidden research avenues in green innovations. J. Innov. Knowl. 2024, 9, 100498. [Google Scholar] [CrossRef] [Scilit]
- Wang, H.; Wang, C.; Liu, Q.; Zhang, X.; Liu, M.; Ma, Y.; Yan, F.; Shen, W. A data and knowledge driven autonomous intelligent manufacturing system for intelligent factories. J. Manuf. Syst. 2024, 74, 512–526. [Google Scholar] [CrossRef] [Scilit]
- Gao, K.; Zhao, X.; Guo, R.; Guo, Z. Identifying roles of a cleaner energy consumption structure in industrial green transformation: A multi-dimensional perspective considering spatial spillovers and transmission mechanisms. Energy 2025, 323, 135776. [Google Scholar] [CrossRef] [Scilit]
- Jiang, J.X.; Wang, J.J.; Cheng, Y. The impact of industrial transformation on green economic efficiency: New evidence based on energy use. Pet. Sci. 2024, 21, 3644–3655. [Google Scholar] [CrossRef] [Scilit]
- Zou, T. Technological innovation promotes industrial upgrading: An analytical framework. Struct. Change Econ. Dyn. 2024, 70, 150–167. [Google Scholar] [CrossRef] [Scilit]
- Liu, B.; Huang, Y.; Chen, M.; Lan, Z. Towards sustainability: How does the digital-real integration affect regional green development efficiency? Econ. Anal. Policy 2024, 83, 42–59. [Google Scholar] [CrossRef] [Scilit]
- Tariq, G.; Sun, H.; Ali, S. Environmental footprint impacts of green energies, green energy finance and green governance in G7 countries. Carbon Footpr. 2024, 3, 5. [Google Scholar] [CrossRef] [Scilit]
- Lin, B.; Xie, Y. Positive or negative? R&D subsidies and green technology innovation: Evidence from China’s renewable energy industry. Renew. Energy 2023, 213, 148–156. [Google Scholar] [CrossRef] [Scilit]
- Dong, Q.; Zhong, C.; Geng, Y.; Dong, F.; Chen, W.; Zhang, Y. A bibliometric review of carbon footprint research. Carbon Footpr. 2024, 3, 3. [Google Scholar] [CrossRef] [Scilit]
- Zheng, Z.; Li, X.; Han, X.; Shi, D.; Liu, J. Better green financial instrument: Government green fund and corporate new energy technology innovation. Energy Econ. 2025, 143, 108234. [Google Scholar] [CrossRef] [Scilit]
- Senna, P.P.; Bonnin Roca, J.; Barros, A.C. Overcoming barriers to manufacturing digitalization: Policies across EU countries. Technol. Forecast. Soc. Change 2023, 196, 122822. [Google Scholar] [CrossRef] [Scilit]
- Huang, Y.; Liu, S.; Gan, J.; Liu, B.; Wu, Y. How does the construction of new generation of national AI innovative development pilot zones drive enterprise ESG development? Empirical evidence from China. Energy Econ. 2024, 140, 108011. [Google Scholar] [CrossRef] [Scilit]
- Ding, J.; Li, L.; Zhao, J. How does fintech prompt corporations toward ESG sustainable development? Evidence from China. Energy Econ. 2024, 131, 107387. [Google Scholar] [CrossRef] [Scilit]
- Wang, H.J.; Zheng, M.Q.; Yin, H.T.; Chang, C.P. Green innovation, industrial structure and urban eco-efficiency in Chinese cities. Econ. Anal. Policy 2024, 82, 1011–1024. [Google Scholar] [CrossRef] [Scilit]
- Wang, J.; Xu, C.; Zhang, J.; Zhong, R. Big data analytics for intelligent manufacturing systems: A review. J. Manuf. Syst. 2022, 62, 738–752. [Google Scholar] [CrossRef] [Scilit]
- Wang, M.; Tao, F.; Zuo, Y.; Xiang, F.; Wang, L.; Nee, A.Y.C. Top ten intelligent algorithms towards smart manufacturing. J. Manuf. Syst. 2023, 71, 158–171. [Google Scholar] [CrossRef] [Scilit]
- Zhu, H.Y.; Bao, W.P.; Yu, G.J. How can intelligent manufacturing lead enterprise low-carbon transformation? Based on China’s intelligent manufacturing demonstration projects. Energy 2024, 313, 134032. [Google Scholar] [CrossRef] [Scilit]
- Lin, B.Q.; Xu, C.C. The effects of industrial robots on firm energy intensity: From the perspective of technological innovation and electrification. Technol. Forecast. Soc. Change 2024, 203, 123373. [Google Scholar] [CrossRef] [Scilit]
- Shen, Y.; Zhang, X. Intelligent manufacturing, green technological innovation and environmental pollution. J. Innov. Knowl. 2023, 8, 100384. [Google Scholar] [CrossRef] [Scilit]
- Liu, X.Q.; Cifuentes-Faura, J.; Yang, X.D.; Pan, J.Y. The green innovation effect of industrial robot applications: Evidence from Chinese manufacturing companies. Technol. Forecast. Soc. Change 2025, 210, 123904. [Google Scholar] [CrossRef] [Scilit]
- Li, H.Y.; Lu, Z.Q.; Zhang, Z.P.; Tanasescu, C. How does artificial intelligence affect manufacturing firms’ energy intensity? Energy Econ. 2025, 141, 108109. [Google Scholar] [CrossRef] [Scilit]
- Liu, W.; Hou, J.; Cheng, Y.; Yuan, C.; Lan, R.; Chan, H.K. The potential of smart factories in reducing environmental emissions: The evidence from Chinese listed manufacturing firms. Humanit. Soc. Sci. Commun. 2024, 11, 1354. [Google Scholar] [CrossRef] [Scilit]
- Wen, X.; Zhao, X.; Zhang, Z.; Liu, Y.; Li, Z.; Zhang, J. Strengthening the role and exploring the effectiveness of new climate finance target. Carbon Footpr. 2025, 4, 15. [Google Scholar] [CrossRef] [Scilit]
- Xu, M.; Liu, X.; Li, O. Can intelligent manufacturing drive green development in China’s pharmaceutical industry?--Evidence from listed enterprises. Energy 2024, 308, 132953. [Google Scholar] [CrossRef] [Scilit]
- Wei, X.H.; Jiang, F.; Chen, Y.; Hua, W.H. Towards green development: The role of intelligent manufacturing in promoting corporate environmental performance. Energy Econ. 2024, 131, 107375. [Google Scholar] [CrossRef] [Scilit]
- Li, H.J.; Zhang, Y.; Li, Y. The impact of the digital economy on the total factor productivity of manufacturing firms: Empirical evidence from China. Technol. Forecast. Soc. Change 2024, 207, 123604. [Google Scholar] [CrossRef] [Scilit]
- Liu, Y.; Deng, L. Mapping carbon emission networks in China: Insights from province-level spatial differentiation. Carbon Footpr. 2024, 3, 18. [Google Scholar] [CrossRef] [Scilit]
- Li, Z.S.; Xie, W.H.; Wang, Z.; Wang, Y.J.; Huang, D.Y. Antecedent configurations and performance of business models of intelligent manufacturing enterprises. Technol. Forecast. Soc. Change 2023, 193, 122550. [Google Scholar] [CrossRef] [Scilit]
- Jin, M.H.; Chen, Y. Has green innovation been improved by intelligent manufacturing?—Evidence from listed Chinese manufacturing enterprises. Technol. Forecast. Soc. Change 2024, 205, 123487. [Google Scholar] [CrossRef] [Scilit]
- Chen, H.; Li, C.; Liu, J.; Xu, R. Navigating digital frontiers: The impact of China’s cybersecurity law on corporate digital innovation. Int. Rev. Financ. Anal. 2025, 103, 104182. [Google Scholar] [CrossRef] [Scilit]
- Zhang, P.; Yang, H.; Chen, C.; Wang, T.; Jia, X. The impact of population aging on corporate digital transformation: Evidence from China. Technol. Forecast. Soc. Change 2025, 214, 124070. [Google Scholar] [CrossRef] [Scilit]
- Liu, B.; Cifuentes-Faura, J.; Ding, C.J.; Liu, X. Toward carbon neutrality: How will environmental regulatory policies affect corporate green innovation? Econ. Anal. Policy 2023, 80, 1006–1020. [Google Scholar] [CrossRef] [Scilit]
- Xiu, G. Analyzing the impact of supply chain and digitalization in the Chinese economy: What is the role of energy consumption, government expenditure, and industrialization in environmental pollution? Energy Econ. 2025, 145, 108412. [Google Scholar] [CrossRef] [Scilit]
- Han, L.; Li, J. Does green finance reform promote corporate carbon emission reduction? Evidence from China’s green finance reform and innovation pilot zones. Econ. Anal. Policy 2025, 85, 2091–2111. [Google Scholar] [CrossRef] [Scilit]
- Mahajan, R.; Lim, W.M.; Sareen, M.; Kumar, S.; Panwar, R. Stakeholder theory. J. Bus. Res. 2023, 166, 114104. [Google Scholar] [CrossRef] [Scilit]
- Sahoo, S.; Islam, N.; Kumar, A.; Mangla, S.K. Exploring relationship between digital dexterity, supply chain quality management, agility and performance-Empirical evidence from Indian B2B manufacturers. Ind. Mark. Manag. 2025, 127, 44–61. [Google Scholar] [CrossRef] [Scilit]
- Tang, L.; Zhang, T.; Wang, J.; Liu, B.; Huang, Y. “Dual synergistic” transformation and corporate total factor productivity: Empirical evidence from China. Econ. Anal. Policy 2025, 85, 717–732. [Google Scholar] [CrossRef] [Scilit]
- Chen, J.; Wang, N.; Lin, T.; Liu, B.; Hu, J. Shock or empowerment? Artificial intelligence technology and corporate ESG performance. Econ. Anal. Policy 2024, 83, 1080–1096. [Google Scholar] [CrossRef] [Scilit]
- Zhang, Y.; Liu, B.; Xue, J.; Chen, Y.; Zhao, F. Would geopolitical risks be the new driver of the energy transition? An empirical study on renewable energy technology innovation. Energy Econ. 2025, 141, 108100. [Google Scholar] [CrossRef] [Scilit]
- Hadlock, C.J.; Pierce, J.R. New Evidence on Measuring Financial Constraints: Moving Beyond the KZ Index. Rev. Financ. Stud. 2010, 23, 1909–1940. [Google Scholar] [CrossRef] [Scilit]
- Wang, M.; Yu, X.; Hong, X.; Yang, X. Can digital finance promote green innovation collaboration in enterprises? Glob. Financ. J. 2025, 65, 101109. [Google Scholar] [CrossRef] [Scilit]
- Wang, S.; Li, J.Y. How carbon emission trading mechanism and supply chain digitization affect manufacturing enterprises’competitiveness? Evidence from China. J. Clean. Prod. 2024, 452, 142164. [Google Scholar] [CrossRef] [Scilit]
- Wang, S.; Xu, Z.; Wu, C.; Hua, L.; Zhu, D. Towards region-based robotic machining system from perspective of intelligent manufacturing: A technology framework with case study. J. Manuf. Syst. 2023, 70, 451–463. [Google Scholar] [CrossRef] [Scilit]
- Wang, S.; Yu, D.H.; Sun, M.L. Can internet development improve carbon emission efficiency for manufacturing? The role of market integration. J. Environ. Manag. 2024, 366, 121815. [Google Scholar] [CrossRef] [Scilit] [PubMed]
- Wang, Z.S.; You, J.; Li, T.; Zhang, Y.B. The era of digital trade: Exploring new mechanisms and threshold effects for green upgrading of manufacturing companies. J. Environ. Manag. 2025, 373, 123433. [Google Scholar] [CrossRef] [Scilit] [PubMed]
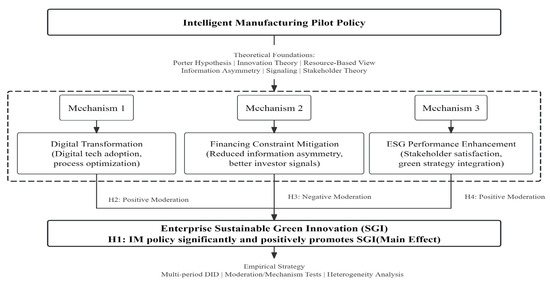
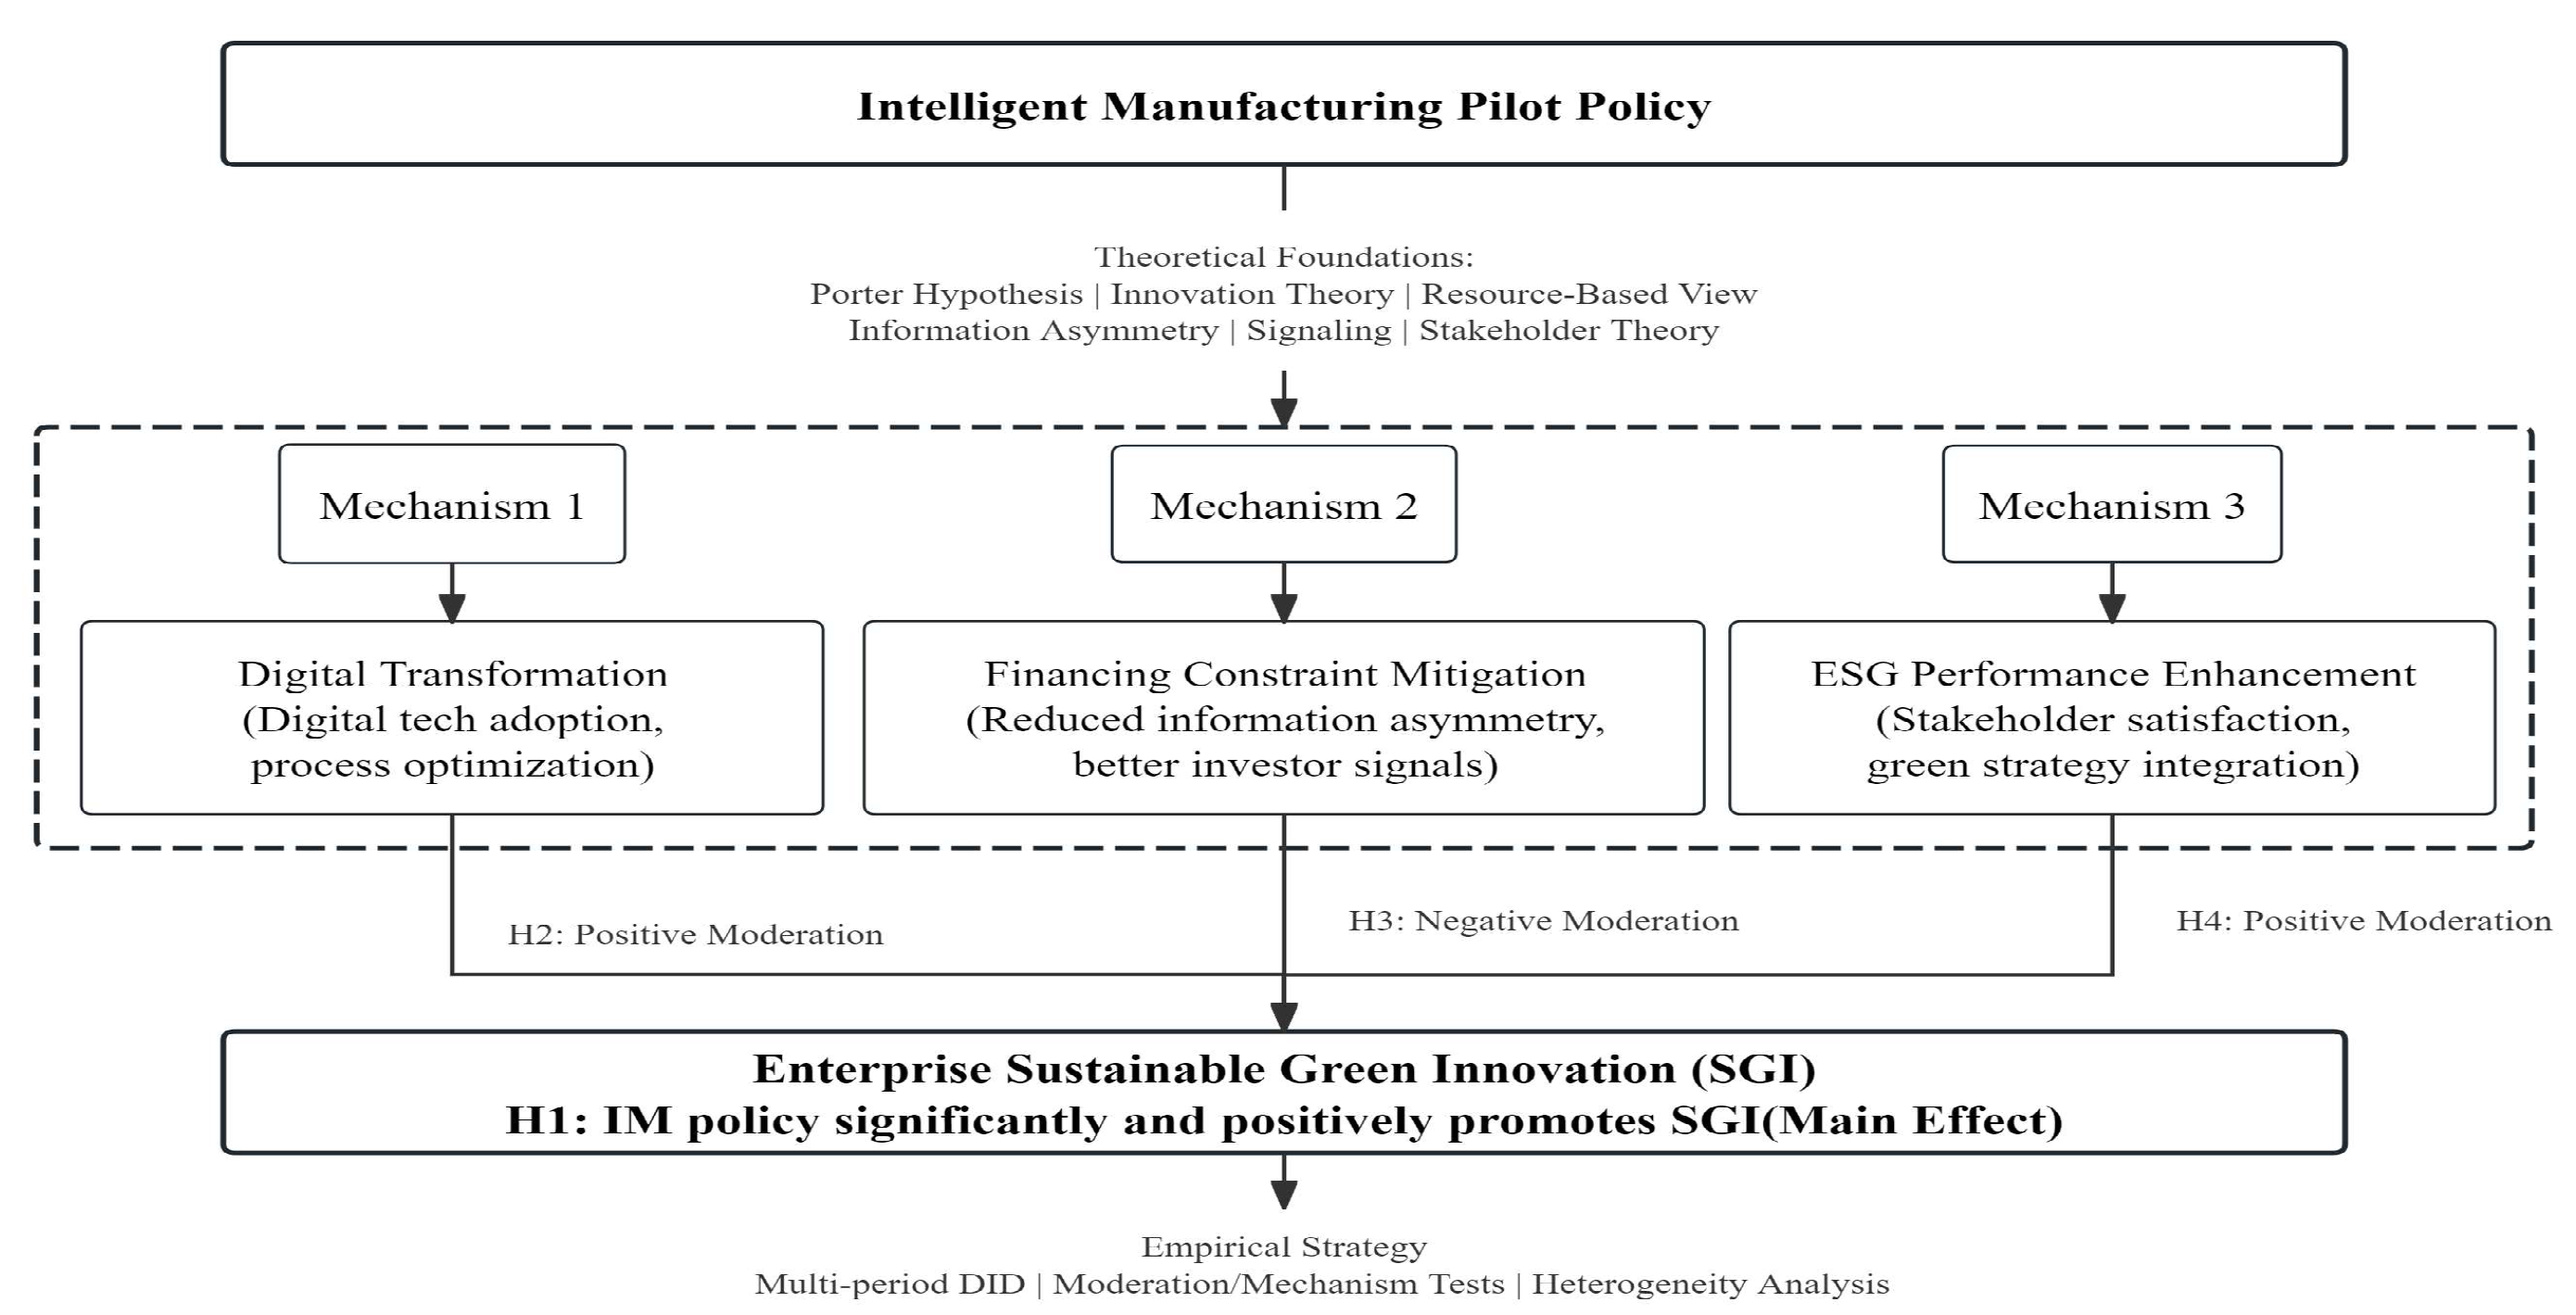
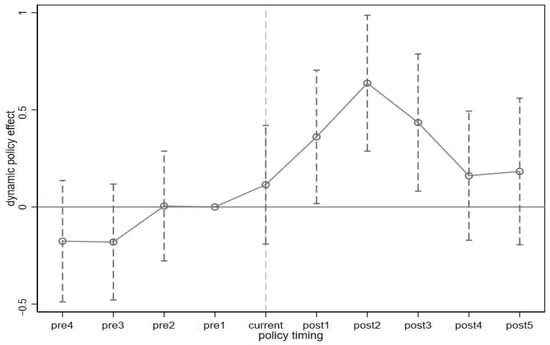
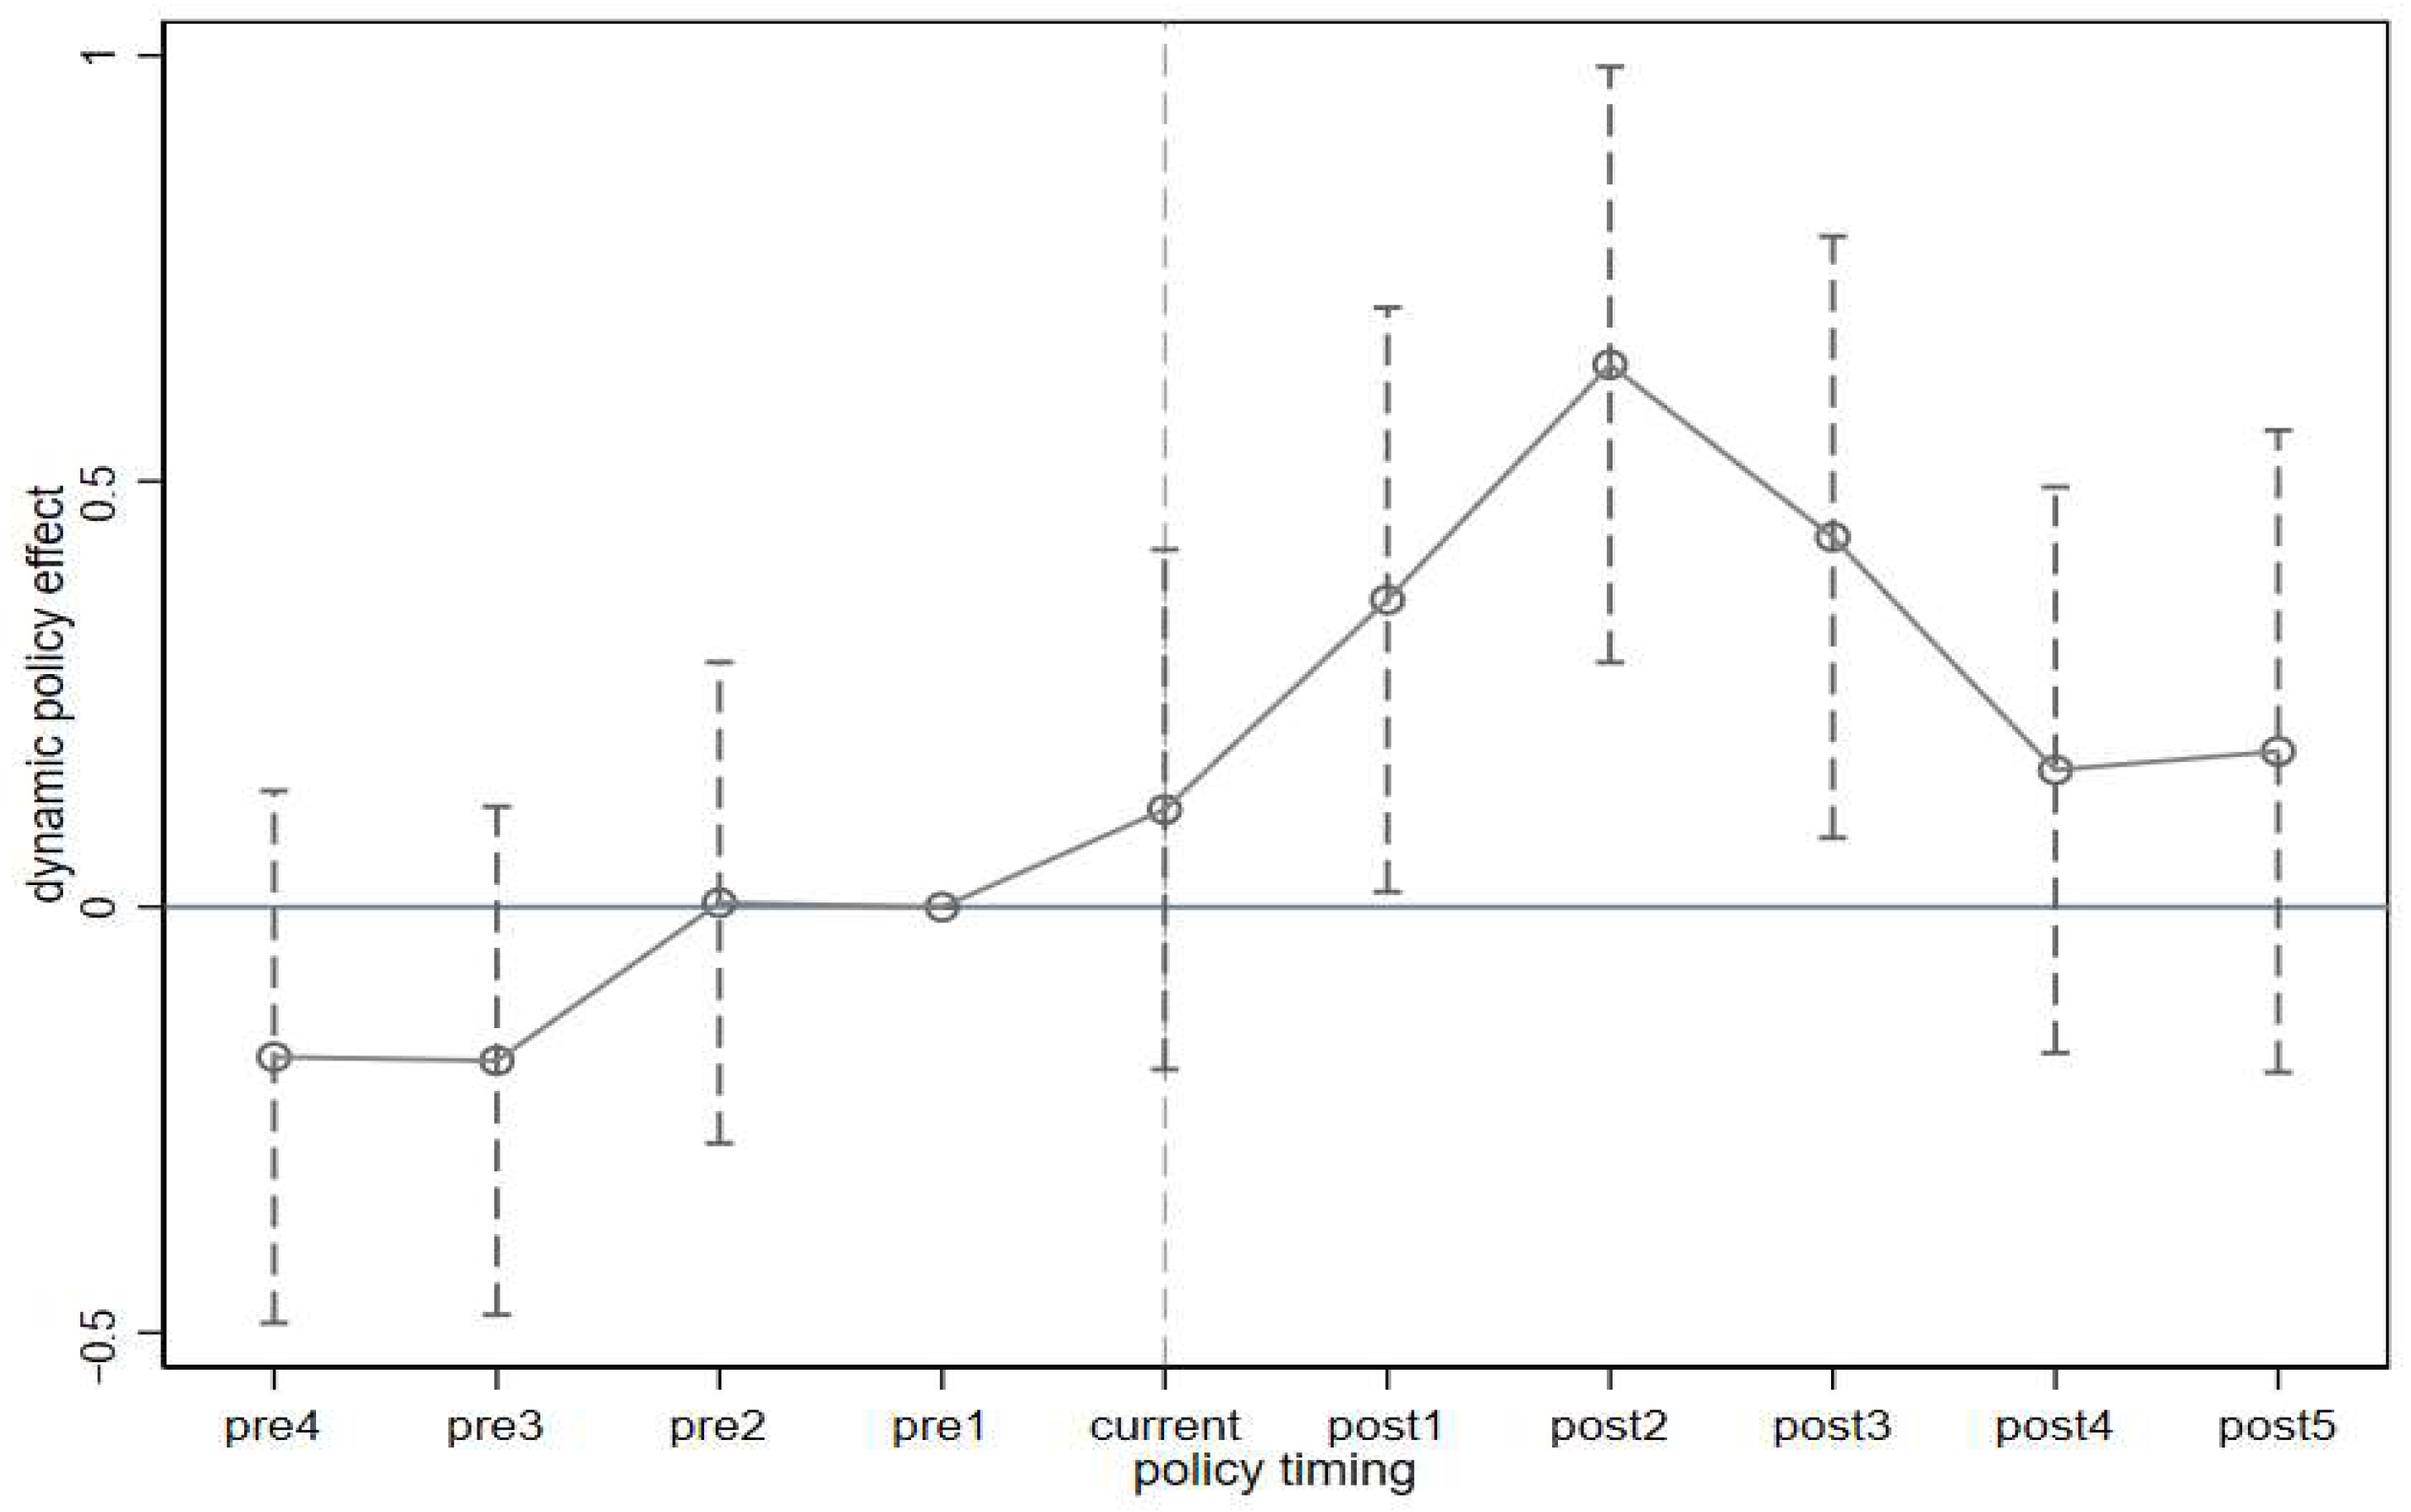
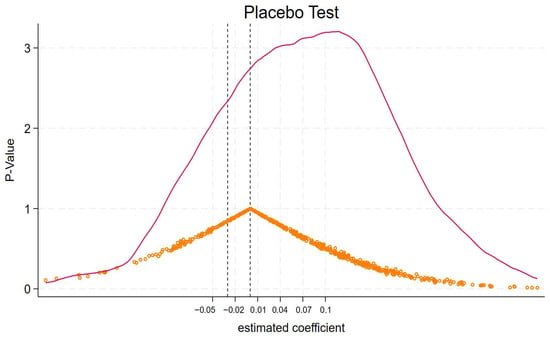
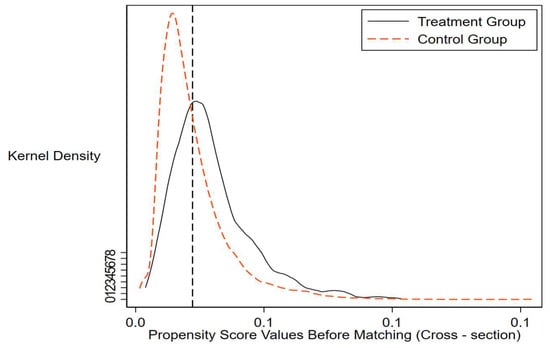
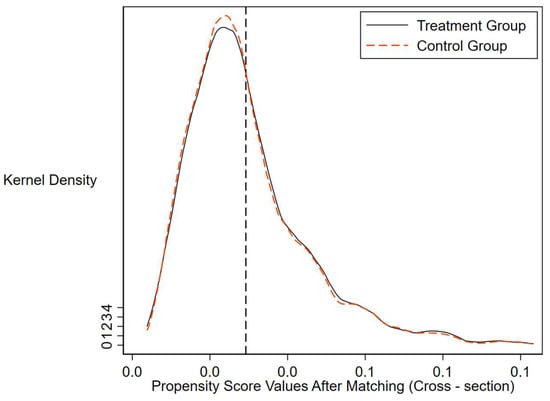
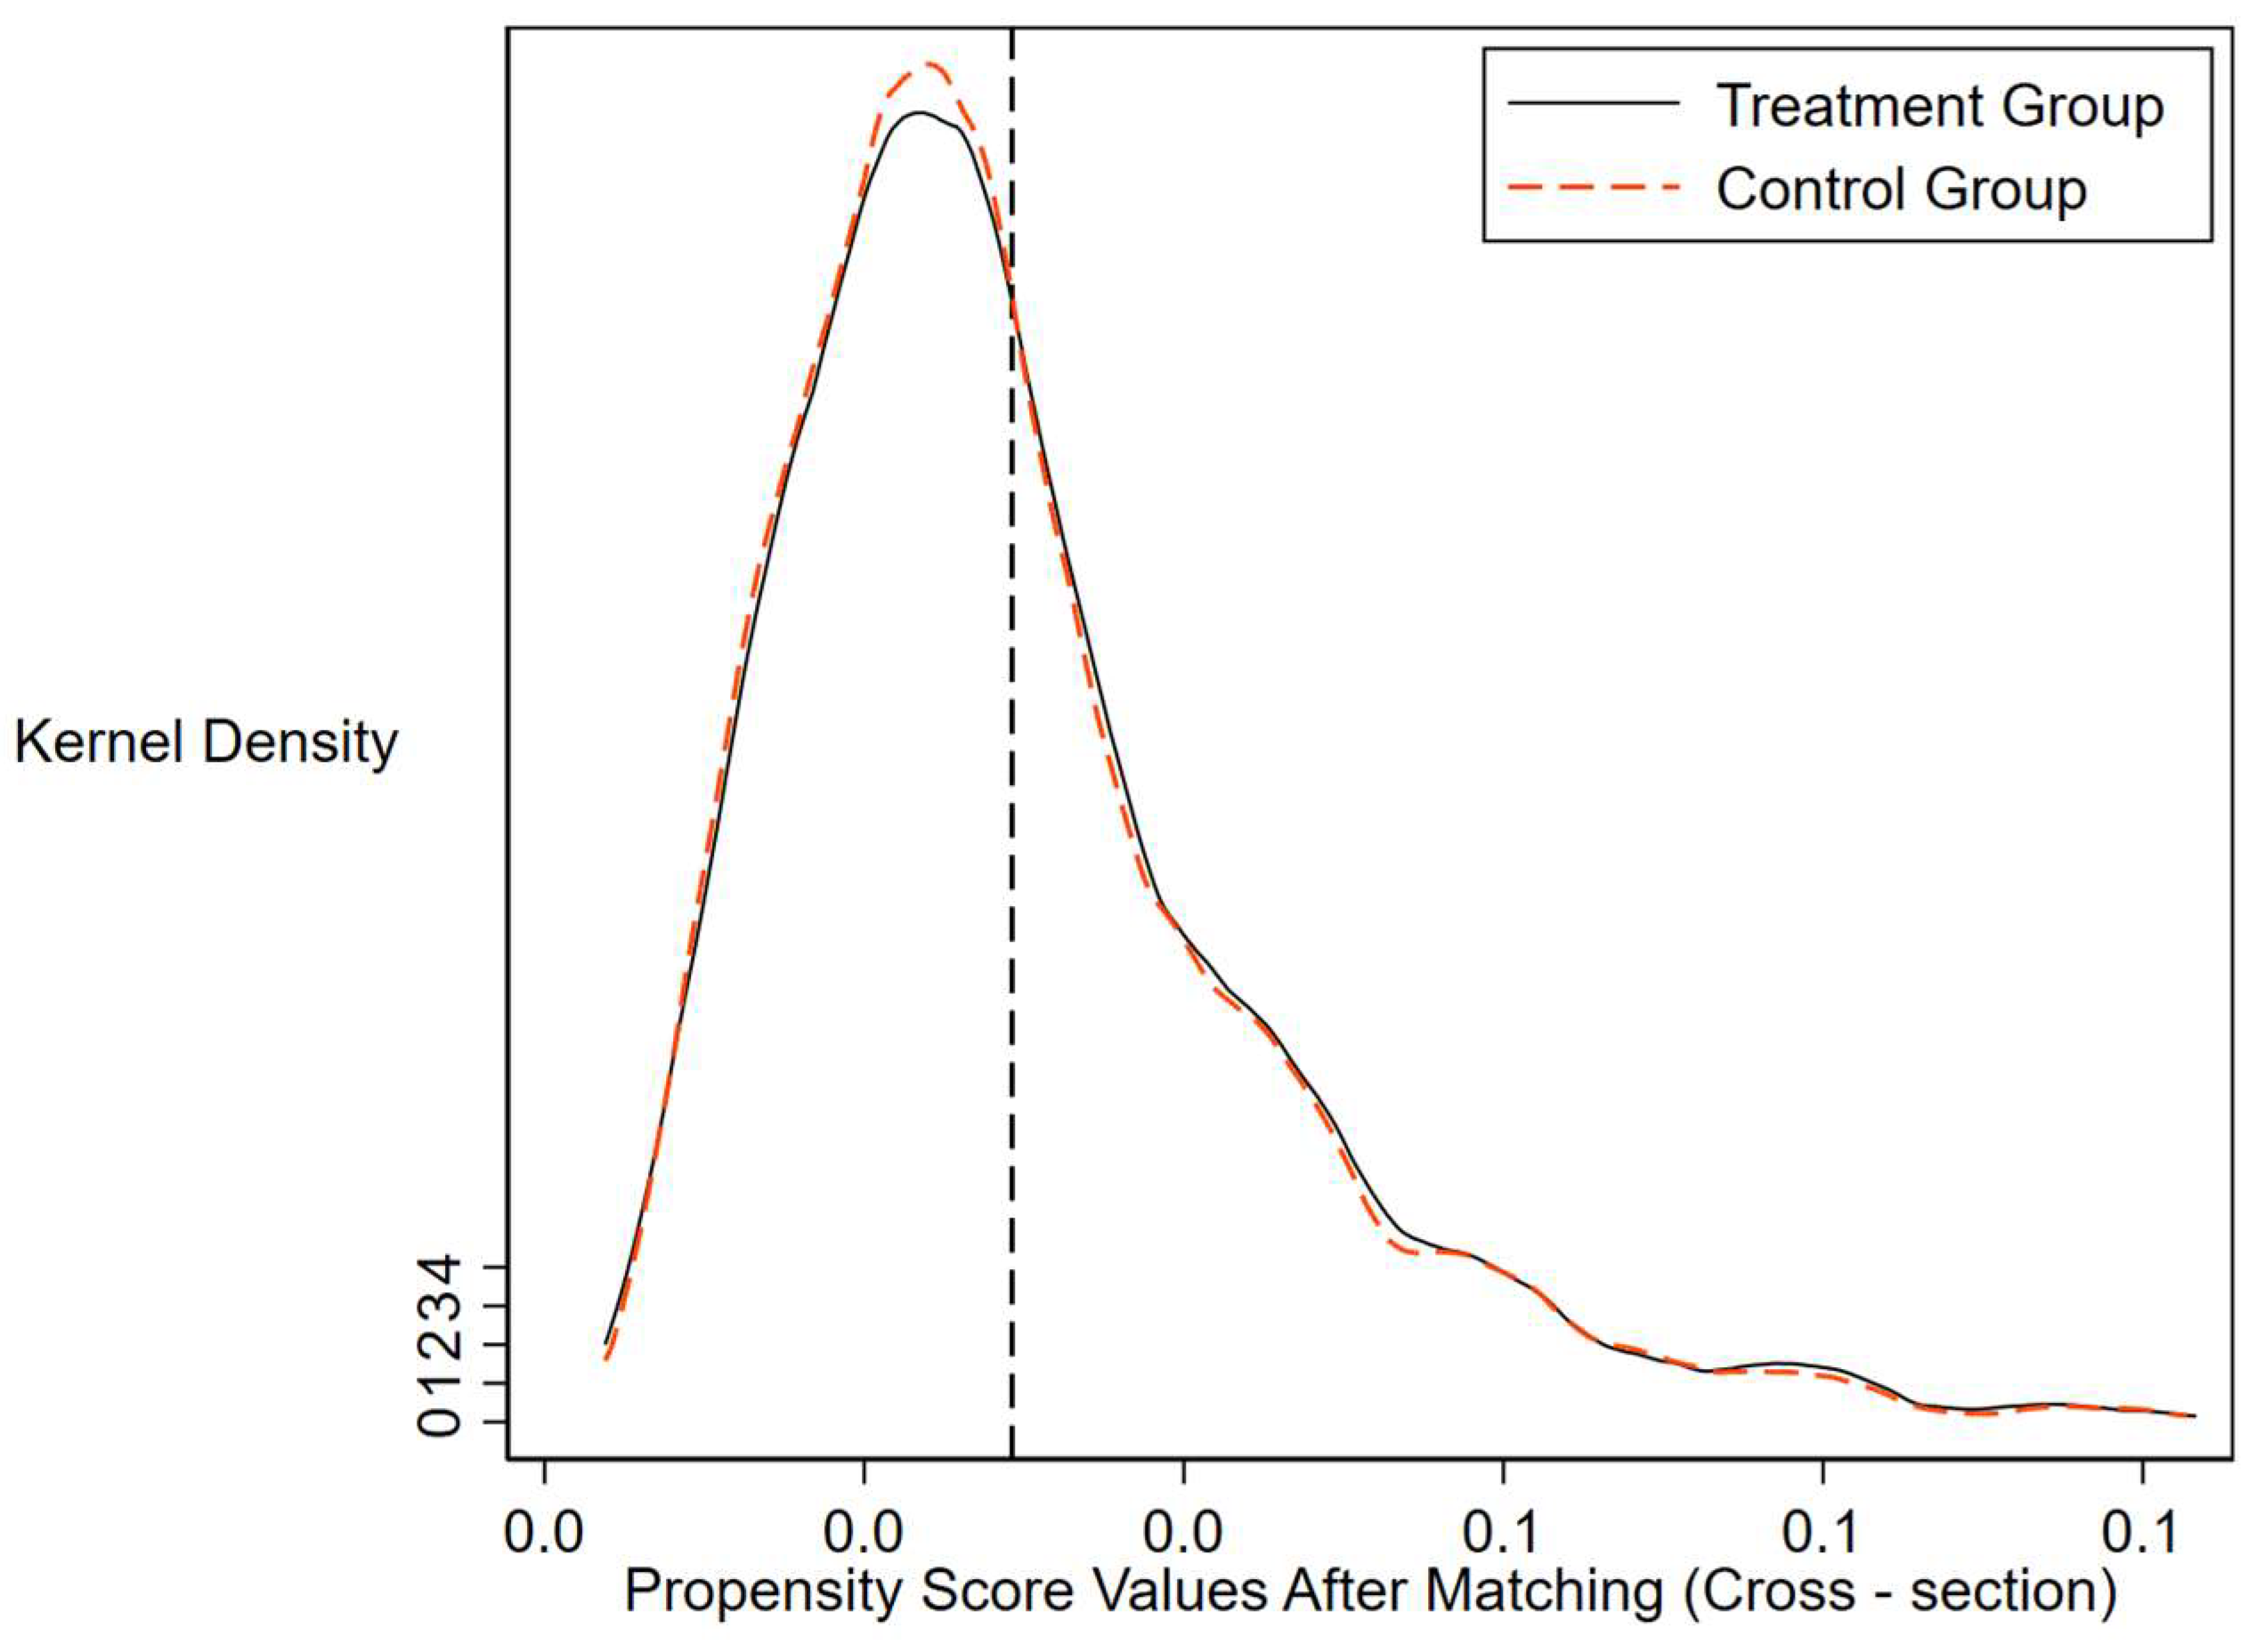

Disclaimer/Publisher’s Note: The statements, opinions and data contained in all publications are solely those of the individual author(s) and contributor(s) and not of MDPI and/or the editor(s). MDPI and/or the editor(s) disclaim responsibility for any injury to people or property resulting from any ideas, methods, instructions or products referred to in the content. |
© 2026 by the authors. Licensee MDPI, Basel, Switzerland. This article is an open access article distributed under the terms and conditions of the Creative Commons Attribution (CC BY) license.