


Abstract
Accurate identification of key nodes in complex networks is vital for optimizing system robustness and controlling information spread. Existing centrality metrics struggle to balance the continuous extraction of global topological features with the fine-grained perception of local structures, while traditional heuristic algorithms also face severe resolution limitations. To address these issues, this paper proposes a node importance evaluation method based on fractional-order topological propagation and local information entropy (FSEC). This method overcomes the limitations of discrete integer-order propagation inherent in traditional graph walks. It constructs a continuous fractional-order topological propagation operator within the spectral graph theory framework. This enables the smooth projection of node degree features into the global topological space, thereby yielding high-order global impact factors. Furthermore, an information theory mechanism is introduced to quantify the probability distribution of a node’s information contribution within its local neighborhood. The local structural information entropy is then calculated to reflect the node’s asymmetric control over micro-level information flow. Deliberate attack simulations were conducted on nine real-world networks and three types of artificial network models. The results show that the proposed FSEC algorithm significantly outperforms baseline algorithms like Autoencoder and Graph Neural Network (AGNN), Degree Centrality, k-shell, PageRank, and Mixed Degree Decomposition (MDD) in degrading the largest connected component (LCC) and global network efficiency (NE). The proposed method also achieves the minimum Area Under the Curve (AUC) values globally. Its monotonicity is slightly lower than that of AGNN but superior to all other baseline algorithms. In addition, SIR simulations further confirm the effectiveness of the FSEC method. This approach successfully resolves the ranking tie problem among nodes in the same topological layer.
1. Introduction
Complex networks serve as essential models to characterize various real-world interactive systems. They have been widely applied in interdisciplinary research, including sociology, computer science, biology, and traffic engineering [1,2,3]. Depending on their topological positions, nodes within a network play different roles, significantly impacting the maintenance of network connectivity, the promotion of information diffusion, and the suppression of epidemic spreading. Meanwhile, a few critical nodes often play decisive roles [4,5]. Therefore, designing accurate and efficient node evaluation methods for node important evaluation not only holds significant theoretical value in network science but also provides essential guidance for practical applications, such as critical infrastructure protection and public opinion control in social networks.
In recent years, researchers have proposed numerous node importance evaluation algorithm based on multiple dimensions, including local properties, global paths, and iterative propagation [6,7]. Local indicators, such as Degree Centrality (DC), measure importance by counting the number of a node’s direct neighbors [8]. While offering extremely low computational complexity, this method exclusively considers the first-order neighborhood, thereby neglecting the node’s global topological position. To address this limitation, indicators based on global paths have been proposed, including Betweenness Centrality (BC) and Closeness Centrality (CC) [9,10]. BC quantifies information control by calculating the proportion of shortest paths passing through a node, while CC evaluates the average distance from a node to all other nodes. Although these global indicators can accurately capture the macroscopic topological structure of the network, their calculation typically relies on the shortest global path traversal. This results in high time complexity, creating severe computational bottlenecks in large-scale networks.
To strike a balance between computational efficiency and evaluation accuracy, heuristic algorithms based on iterative propagation and structural stripping have emerged as a prominent research focus. For instance, the k-shell (KS) decomposition algorithm partitions the network into distinct core layers by recursively removing nodes with degrees less than or equal to the current shell index [11]. However, the KS assigns identical same score to nodes within the same topological layer, limiting its resolution and failing to distinguish their true individual influence. Alternatively, the PageRank algorithm and its variants simulate random walks to achieve global weight convergence, which effectively mitigates the bias influence of local high-degree nodes [12].
In recent years, the concept of entropy from information theory has been introduced to complex networks to quantify topological heterogeneity and information flow uncertainty [13,14,15]. While early information-theoretic centrality methods primarily focused on macroscopic entropy, recent research has shifted toward precisely characterizing the structural influence of individual nodes within their local microenvironments. Although non-extensive entropy effectively captures the fractal features and strongly correlated dynamics of complex systems [16,17], Shannon entropy maintains significant theoretical advantages for evaluating microscopic node influence due to its strict additivity and parameter-free nature [18,19]. Consequently, developing a unified analytical framework remains a major challenge. Such a framework must overcome the limitations of traditional discrete propagation to extract global high-order topological features while accurately capturing structural asymmetry at the local level.
Fractional calculus offers a novel perspective to address these challenges [20,21]. Because traditional integer-order methods are restricted to local diffusion, they struggle to characterize long-range interactions and non-local diffusion behaviors [22]. In contrast, fractional-order operators overcome the limitations of discrete hop counts [23]. Within spectral graph theory, this approach utilizes a smooth mapping of the operator’s eigenvalue spectrum. By non-linearly adjusting the distribution weights of high- and low-frequency network components, this mapping effectively extracts high-order topological features that reflect non-local associations, facilitating a more comprehensive evaluation of global node influence.
Inspired by the aforementioned theories, this paper proposes a novel node evaluation method named fractional-order spreading entropy centrality (FSEC) to address the limitations of existing centrality metrics. Departing from traditional discrete-step graph spreading, FSEC constructs a continuous fractional-order topological spreading operator within the framework of spectral graph theory by performing a smooth algebraic mapping on the eigenvalues of the symmetric normalized adjacency matrix. The FSEC algorithm first takes the degree feature of nodes as the initial state and uses the fractional-order operator to perform a global orthogonal projection. This captures high-order global influence factors that break through integer topological limits. Subsequently, this global influence factor is transformed into a local information contribution probability distribution within the node’s direct neighborhood, and the corresponding local structural information entropy is calculated.
The main contributions of this paper are as follows:
- (1)
- The proposed method overcomes the limitations of discrete propagation inherent in traditional random walks or integer powers of adjacency matrices. By using spectral decomposition to extract the eigenvalues of the normalized adjacency matrix and performing parameterized mapping in a fractional-order space, it facilitates continuous global diffusion of network topological influence.
- (2)
- It not only examines the absolute outward influence of a node but also places it within a local information micro-environment. By calculating the local spreading entropy, it solves the prevalent issues of score overlap and low monotonicity found in traditional metrics.
- (3)
- Comprehensive deliberate attack simulations and SIR spreading experiments were conducted on nine real-world complex networks and three classic network models. Experimental results show that the FSEC algorithm outperforms baseline algorithms, such as AGNN, Degree Centrality, KS, PR, and MDD, in destroying the network’s LCC and NE, which is further evidenced by achieving the minimum Area Under the Curve (AUC) values. Furthermore, it exhibits strictly superior ranking monotonicity.
The organization of this paper is as follows: Section 2 briefly reviews the basic concepts and related work of complex networks and node importance evaluation; Section 3 details the derivation of the mathematical method and algorithm flow for FSEC; Section 4 introduces the experimental datasets and evaluation metrics, providing an in-depth comparative analysis and discussion of the simulation results for LCC, NE, monotonicity, AUC, and SIR; and finally, Section 5 concludes the paper.
2. Basic Theory
In network science and graph theory, complex networks are typically modeled as topological graph for quantitative analysis. We let G = (V, E) be an undirected and unweighted graph, where V = {v1, v2, …, vN} is the set of N nodes, while E = {(vi, vj)|vi, vj ∈ V} is the set of M edges. The topological structure of the network can be represented by an adjacency matrix A. For an undirected and unweighted graph, if an edge exists between node vi and node vj, the matrix element is Aij = 1; otherwise, it is Aij = 0.
Node importance evaluation aims to assign a quantitative score to each node in the network. This score reflects its criticality in topological connectivity or information control. Existing classical algorithms are mainly divided into the following categories.
Degree Centrality (DC): DC represents the direct connections of node i [24].
K-shell decomposition (KS): The KS algorithm is based on the peeling idea of the network’s core–periphery structure. It iteratively removes nodes with a degree less than or equal to the current shell value. The shell value of the removed nodes is recorded as ks [25].
PageRank algorithm (PR): The PR algorithm was initially used for webpage ranking. It is based on a biased random walk model [26]. The PR value of node i is determined by the PR values of its neighbor nodes and the connection probability:
where d is the damping factor and N(i) is the set of neighbor nodes for node i.
Mixed Degree Decomposition (MDD): The MDD algorithm aims to solve the problem of a large number of nodes having the same score in k-shell decomposition [27]. In the traditional k-shell peeling evolution, the edge information between nodes and the removed peripheral nodes is completely discarded. The MDD algorithm reintroduces these invalid edges and applies a weight penalty. This achieves memory and compensation for the local connection history of the nodes.
In any iterative peeling stage, the initial total degree ki of node i can be strictly decomposed into two parts:
where ki(r) is the residual degree and ki(e) is the exhausted degree. λ ∈ [0, 1] is an adjustable parameter, which we set to 0.7.
3. Proposed Method
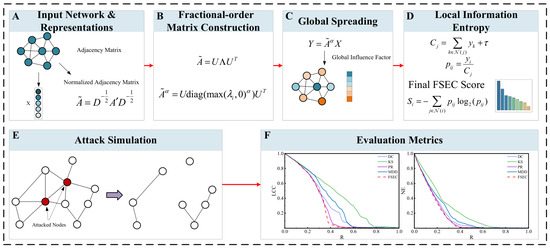
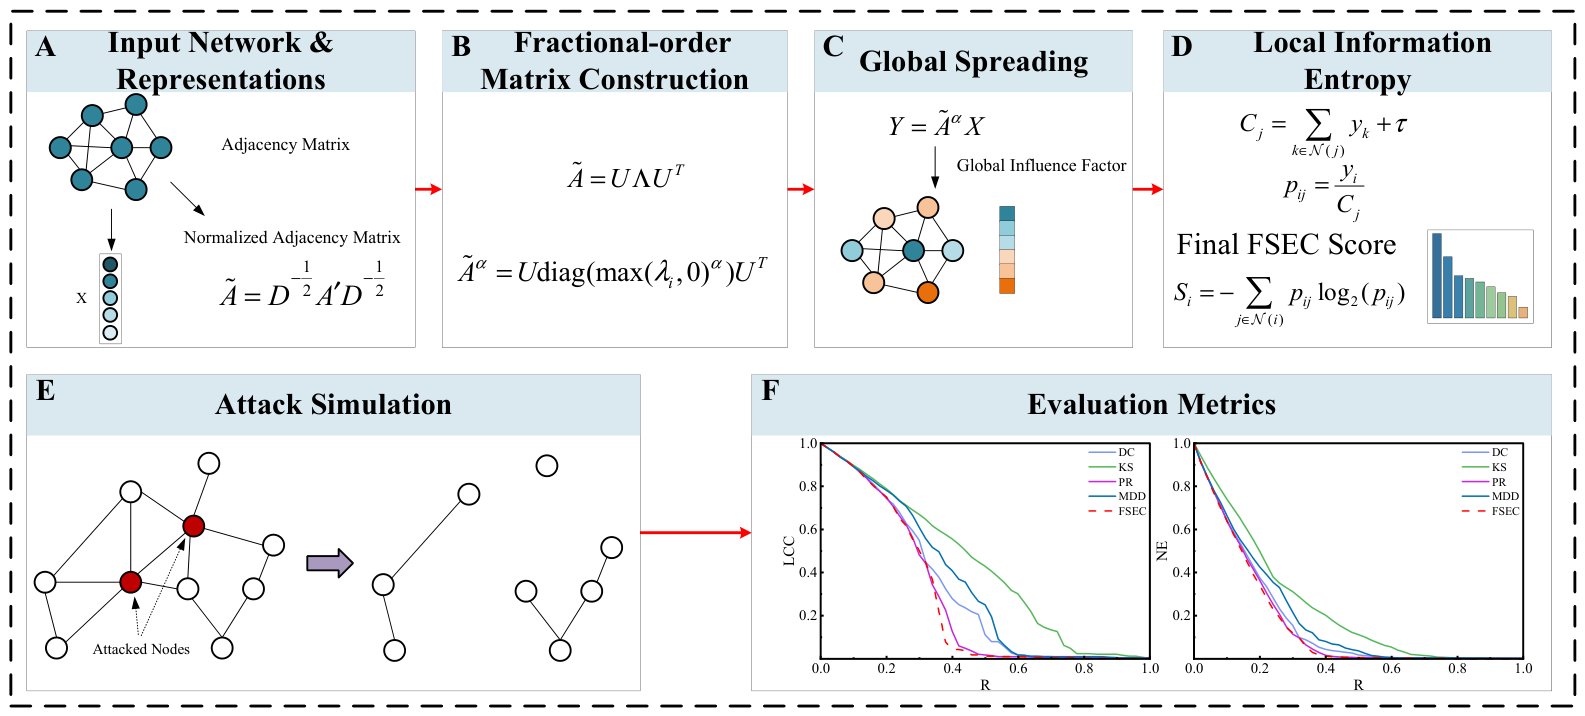
Existing centrality metrics often struggle to balance global topological feature extraction and local structure perception. To address this limitation, this paper proposes fractional-order spreading entropy centrality (FSEC), a node evaluation method that fuses fractional-order topological spreading with local information entropy. By utilizing spectral graph theory to generalize integer-order neighborhood expansion to a continuous fractional-order space to compute a global influence factor. Subsequently, it quantifies the local control of nodes through information entropy. The workflow of the FSEC algorithm is shown in Figure 1.
Figure 1.
Workflow of the FSEC algorithm.
3.1. Construction of Fractional-Order Topological Spreading Operator
Traditional methods based on random walks or adjacency matrix powers can only capture discrete integer-order hop information. This paper introduces fractional-order matrix theory to construct a continuous topological spreading operator in the spectral domain. Specifically, we utilize spectral eigendecomposition to formulate the fractional-order operator rather than computing direct matrix fractional powers. Since the eigenvalues of the normalized adjacency matrix (denoted as ) typically fall within the range [−1, 1], computing direct fractional powers yields complex numbers, which lack physical interpretability for evaluating node topological importance. By transforming the operation into the spectral domain, we explicitly introduce a filtering mechanism max(λi,ε)—where λi represents the i-th eigenvalue and ε is a small positive stabilization constant—to eliminate negative eigenvalues. This formulation guarantees that the resulting fractional-order operator remains strictly real valued and mathematically stable.
First, given a network G, we define its adjacency matrix with self-loops as A′ ∈ ℝN×N:
where I denotes the identify matrix. We extract the degree values of all nodes in the graph to form the initial state vector X∈ℝN×1, where Xi = ki. The symmetric normalized adjacency matrix is calculated as:
where D denotes the degree matrix with added self-loops. To calculate the fractional order of the normalized adjacency matrix, we perform eigenvalue decomposition as follows:
where U is the orthogonal eigenvector matrix and Λ is the diagonal matrix of eigenvalues. Following the eigendecomposition, we introduce a non-linear filtering mechanism max(λi,ε) as a regularization strategy. This mechanism eliminates the negative eigenvalues of the matrix and ensures numerical stability using a sufficiently small constant ε (set to 10−6). When processing large-scale complex networks without this regularization constraint, perturbations from floating-point arithmetic precision may cause numerical oscillations during the fractional-order mapping. By incorporating the threshold ε into the mapping equation, we construct the modified fractional-order topological spreading operator:
where α ∈ (0, 1) is the fractional-order hyperparameter. This regularization strategy ensures that the resulting matrix is stable and real valued. From the perspective of spectral graph theory and graph signal processing, the fractional-order operator in Equation (7) acts as a non-linear frequency-domain filter [28,29]. The dominant eigenvalues of the normalized adjacency matrix reflect the globally smooth structure of the network topology. Introducing the fractional-order exponent increases the numerical gradients in the high-eigenvalue region. This mechanism helps capture subtle structural differences. By globally spreading the initial state X through this operator, we obtain the global influence factor vector Y ∈ ℝN×1 of the nodes:
3.2. Local Information Entropy
After obtaining the global influence factor Y, traditional methods usually use it directly as the node importance score. This paper further proposes using local information entropy to quantify the structural control of a node within its direct neighborhood.
To ensure the non-negativity and numerical stability of the probability calculation, we first apply the rectified linear unit to Y:
The local receiving capacity Cj of node j is defined as the sum of the influence factors of all its neighbor nodes:
where N(j) is the set of first-order neighbors of node j.
Therefore, we define the influence probability distribution pij of node i on its neighbor node j. This probability represents the proportion contributed by node i among all the influences received by node j:
where τ is set to 10−9 to avoid division by zero.
Finally, based on the information theory framework, we calculate the fractional-order spreading entropy centrality score Si for node i:
A higher score Si indicates stronger topological asymmetry and control of the node in the network. The pseudocode of FSEC is shown in Algorithm 1.
| Algorithm 1. Fractional-Order Spreading Entropy Centrality (FSEC) |
| Input: G = (V, E), Fractional parameter α, Small constants ϵ, τ |
| Output: Node centrality score dictionary S |
| 1: Initialize state vector X |
| 2: Construct adjacency matrix A′ with self-loops (Equation (4)) |
| 3: Compute diagonal degree matrix D |
| 4: Compute normalized matrix (Equation (5)) |
| 5: Perform eigen-decomposition: (Equation (6)) |
| 6: Filter negative eigenvalues and construct fractional-order operator: (Equation (7)) |
| 7: Compute global influence vector Y by Equation (8) |
| 8: Apply non-linear activation by Equation (9) |
| 9: Initialize empty dictionary S |
| 10: for j in V do |
| 11: Calculate local receiving capacity by Equation (10) |
| 12: end for |
| 13: for each node i ∈ V do |
| 14: Initialize Si = 0 |
| 15: for each neighbor j ∈ N(i) do |
| 16: Calculate transition probability by Equation (11) |
| 17: if pij > 0 then |
| 18: Si = Si − pijlog2(pij) |
| 19: end if |
| 20: end for |
| 21: end for |
| 22: return S |
3.3. Time Complexity Analysis
The computational cost of the proposed FSEC algorithm mainly arises from constructing the fractional-order topological propagation operator. The algorithm performs a full eigendecomposition on the N × N dense symmetric normalized adjacency matrix to obtain the orthogonal eigenvector matrix and the eigenvalue spectrum. This step has a theoretical time complexity of O(N3). The subsequent fractional-order matrix reconstruction and global projection multiplication operations take O(N3) and O(N2) time respectively. The local information entropy calculation module only traverses the nodes and their first-order neighborhoods. Its time complexity is O(|E|). Therefore, the overall time complexity of the basic algorithm is strictly bounded by the eigendecomposition process and results in O(N3). This exact spectral decomposition method ensures computational accuracy in small and medium networks. However, it creates severe computational and memory bottlenecks for large-scale complex networks.
To overcome this scalability limitation for large networks, a potential solution is to introduce an approximate spectral method based on Chebyshev polynomials. This creates a scalable version of the FSEC algorithm. This approach treats the fractional-order operator as a spectral filter. It uses a Chebyshev polynomial truncated at order K to approximate this non-linear mapping function. This converts the need for the eigendecomposition of a dense matrix into K recursive multiplications between a sparse matrix and the input feature vector. By adopting this approximate method, the algorithm avoids explicitly calculating and storing the dense fractional-order matrix. This reduces the time complexity of computing the global propagation factor from O(N3) to O(K|E|). The approximation order K is typically a very small constant. Therefore, this scalable version achieves a linear time complexity relative to the number of network edges while strictly controlling the theoretical error bound. This makes it highly feasible to process networks with millions of nodes.
4. Simulation Experiment Results
4.1. Datasets
To comprehensively evaluate the effectiveness and generalization ability of the proposed FSEC algorithm, this paper selects nine real-world networks (available at https://github.com/hkzstudy/Complex-Network-Dataset (accessed on 1 May 2026)) and three classical artificial network models for simulation experiments (all networks are undirected). Table 1 details the basic topological parameters of the nine real-world datasets. These networks cover multiple domains, including social relationships, biological neural networks, citation systems, and infrastructure. They exhibit different scales, clustering degrees, and assortativity characteristics.
Table 1.
Basic parameters of real-world network datasets.
Notably, several raw networks contain disconnected components. To ensure the valid calculation of global path metrics and rigorous comparisons, this paper extracts the largest connected subgraphs of these networks in advance. The parameters of these three networks listed in Table 1, along with all subsequent simulation experiments, are strictly based on their largest extracted connected subgraphs, where <K> is the average degree; CC is the average clustering coefficient; ρ is the network density; APL is the average shortest path length; NE is the network efficiency; d is the network diameter; and ass represents the assortativity coefficient.
Furthermore, to verify the performance of the algorithm under different typical topological evolution rules, this paper constructs artificial network models of the same scale. The specific parameter settings are shown in Table 2.
Table 2.
Parameter settings of network models.
4.2. Evaluation Metrics
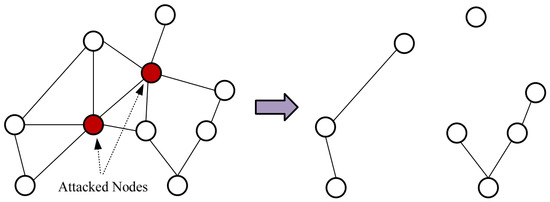
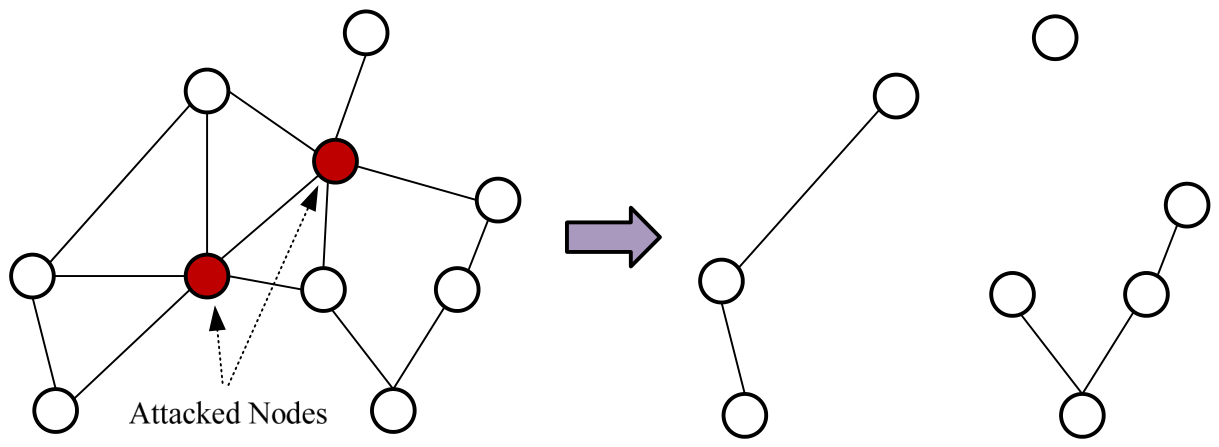
To comprehensively and objectively quantify the accuracy and resolution of node importance evaluation algorithms, this paper simulates deliberate attacks. Under this framework, we evaluate network robustness using the relative size of the largest connected component (LCC) and network efficiency (NE). Additionally, we introduce the monotonicity metric to quantify the ranking discrimination of the algorithms. The changes in the network under attack are shown in Figure 2.
Figure 2.
Network changes under attack.
- (1)
- Largest connected component (LCC): The LCC metric measures the ability of a network to maintain global connectivity after suffering structural damage [30].where N′ is the number of nodes in the current largest connected component of the network.
- (2)
- Network efficiency (NE): From the perspective of dynamic information propagation, NE reflects the ease of information exchange among nodes within the network [31].where dij represents the shortest path length between node i and node j in the network, while E′ is the current network efficiency.
- (3)
- Monotonicity: The monotonicity metric strictly quantifies the micro-level ability of centrality algorithms to distinguish the influence of different nodes in the network [32]. The calculation formula for monotonicity is given as:where Nb represents the total number of nodes that are assigned the same score b. A monotonicity value closer to 1 indicates a stronger ranking discrimination of the algorithm.
- (4)
- Susceptible–Infected–Recovered (SIR): To accurately evaluate the predictive performance of the proposed algorithm in dynamic spreading and cascading failure scenarios, we adopt SIR as an objective benchmark. We define the cumulative infection scale F(t) as the core evaluation metric. It is calculated as follows:where I(t) and R(t) represent the number of nodes in the infected state and the recovered state at time step t, respectively.
- (5)
- Area Under the Curve (AUC): AUC aims to comprehensively quantify the cumulative robustness of the network during the entire deliberate attack process from a global evolutionary perspective. Mathematically, it performs discrete integration on the evolution curve of the network performance metrics.
4.3. Results Analysis
To comprehensively evaluate the effectiveness and generalization ability of the proposed FSEC algorithm, systematic simulations are conducted on nine real-world networks and three artificial network models. The baseline methods include the four algorithms described in Section 2, as well as the AGNN model [33] and a random attack strategy (averaged over 10 independent runs).
4.3.1. Experimental Results on Real Datasets
- (1)
- LCC Results Analysis
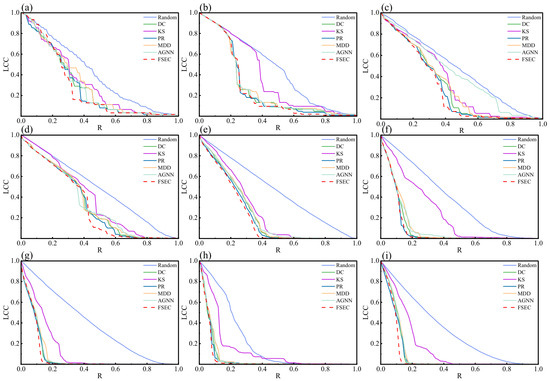
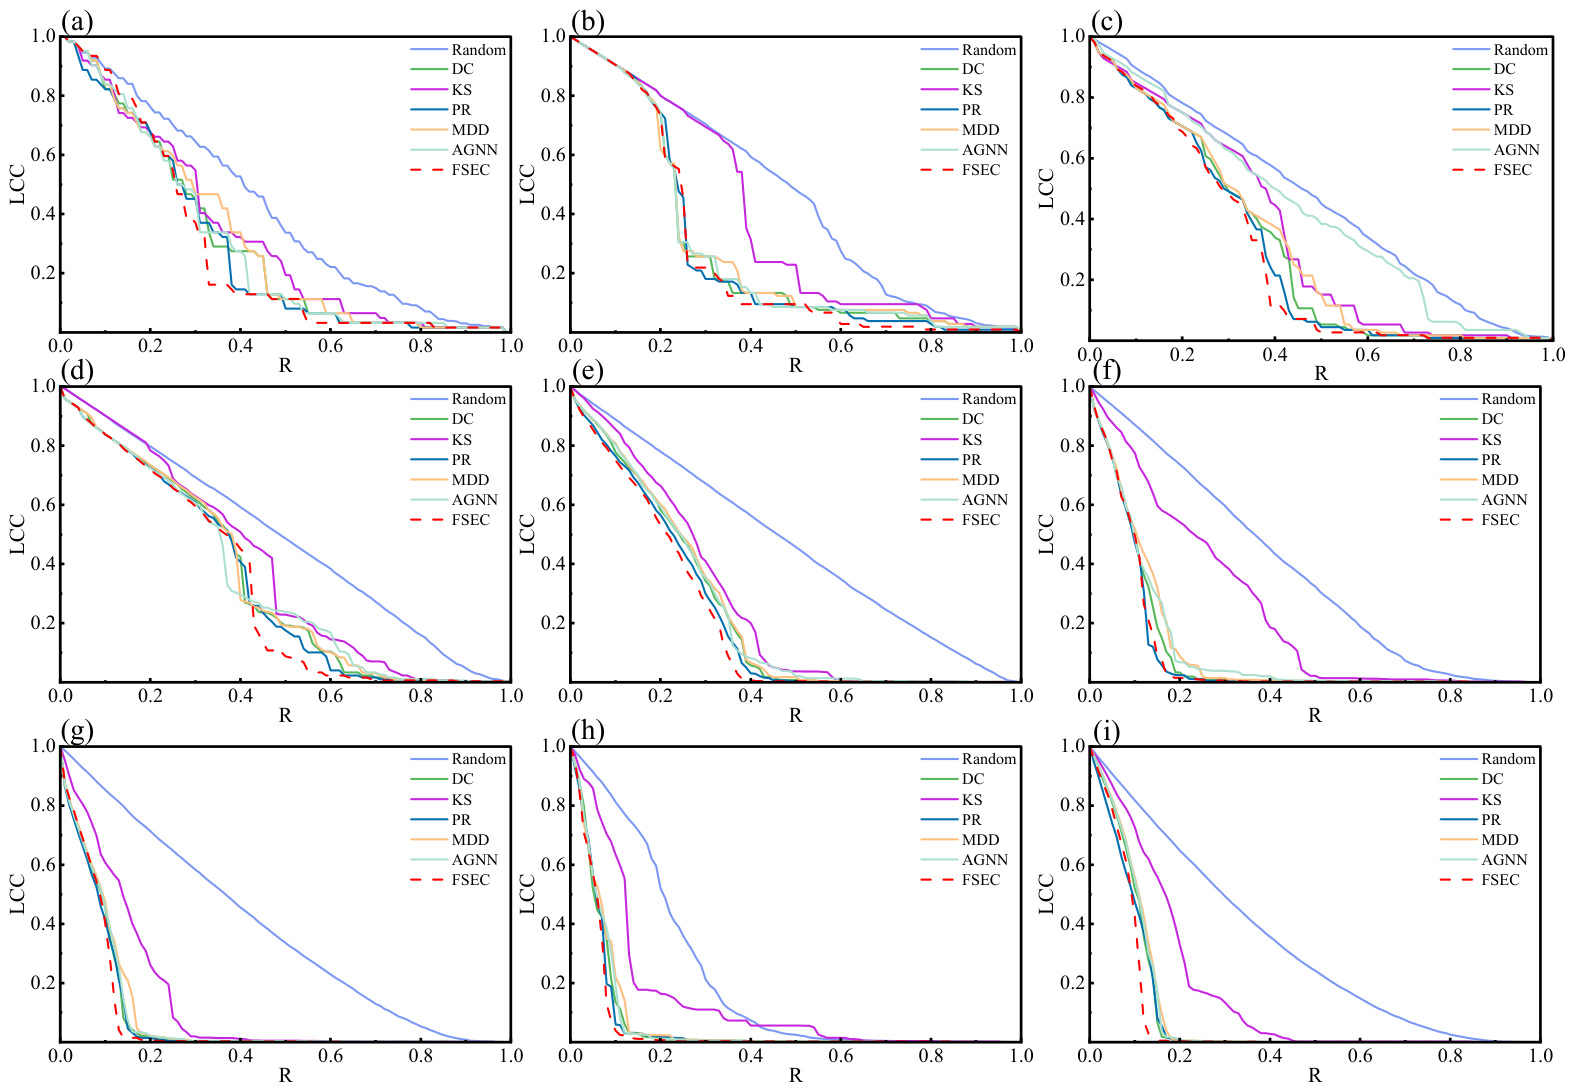
Figure 3 and Table 3 present the impact of different node removal strategies on the LCC size across nine real-world networks. The horizontal axis, R, represents the fraction of removed nodes, while the vertical axis denotes the normalized LCC value. A steeper curve descent indicates higher accuracy in evaluating node importance. Specifically, a more effective strategy requires a smaller fraction of removed nodes to dismantle global network connectivity. We define this threshold as LCC = 0.1. Overall, random attacks exhibit the lowest efficiency in destroying network connectivity, while deliberate attack strategies perform significantly differently across networks with various attributes.
Figure 3.
LCC changes in real networks under different deliberate attacks: (a) Dolphins; (b) Polbooks; (c) Adjnoun; (d) Celegansneural; (e) Polblogs; (f) Cora; (g) Maayan; (h) Power; and (i) Twin.
Table 3.
The fraction of removed nodes required to reduce LCC to 0.1 under different attack strategies in real-world networks.
To further verify the adaptability of the algorithms to network heterogeneity, we conduct a stratified analysis based on the functional domains of the real-world networks as follows.
First, in information networks, the FSEC algorithm achieves the optimal destruction effect during the node removal process. As shown in Table 3, FSEC only needs to remove 37% and 35% of the nodes in the Polbooks and Polblogs networks to reduce the LCC below 0.1. This performance comprehensively outperforms traditional metrics and the AGNN.
Second, FSEC demonstrates a strong ability to capture structural features in biological networks. This is particularly evident in the densely connected Celegansneural network. FSEC reduces the LCC to 0.1 by removing only 50% of the nodes. This removal fraction is 15.3% lower than that of the second-best algorithm PR (59%). FSEC can therefore target the hub nodes maintaining the global structure at an earlier stage.
Finally, the advantage of FSEC is highly prominent in infrastructure networks. The Power grid features a long average path length. The AGNN achieves an excellent threshold of 11% in this network. However, FSEC only needs to remove 9% of the nodes to cause the same degree of network collapse. In the Twin city network with strong positive assortativity, FSEC also outperforms the highly competitive DC and PR algorithms.
Compared to other baseline algorithms, KS performs the worst in most networks. Its LCC curves exhibit obvious step-like stagnation. This is mainly because the KS algorithm has severe resolution limitations. A large number of nodes are assigned to the same shell, causing the ranking mechanism to fail. PR, MDD, and AGNN demonstrate competitiveness in most datasets. However, their performance fluctuates due to limited local receptive fields or the complexity of network topologies. Overall, the FSEC algorithm effectively overcomes the evaluation bias caused by discrete topological features. It achieves this by introducing a continuous fractional-order propagation operator and integrating local information entropy. Consequently, FSEC exhibits optimal and stable performance consistency across different functional types of networks.
- (2)
- NE Results Analysis
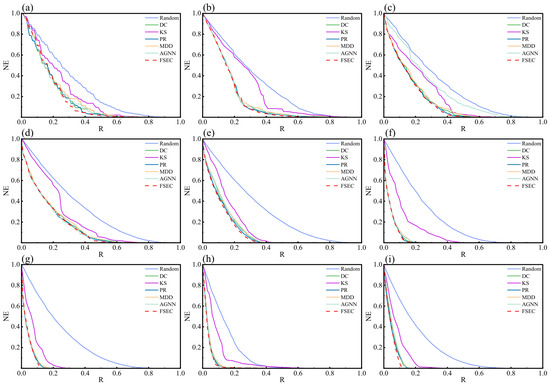
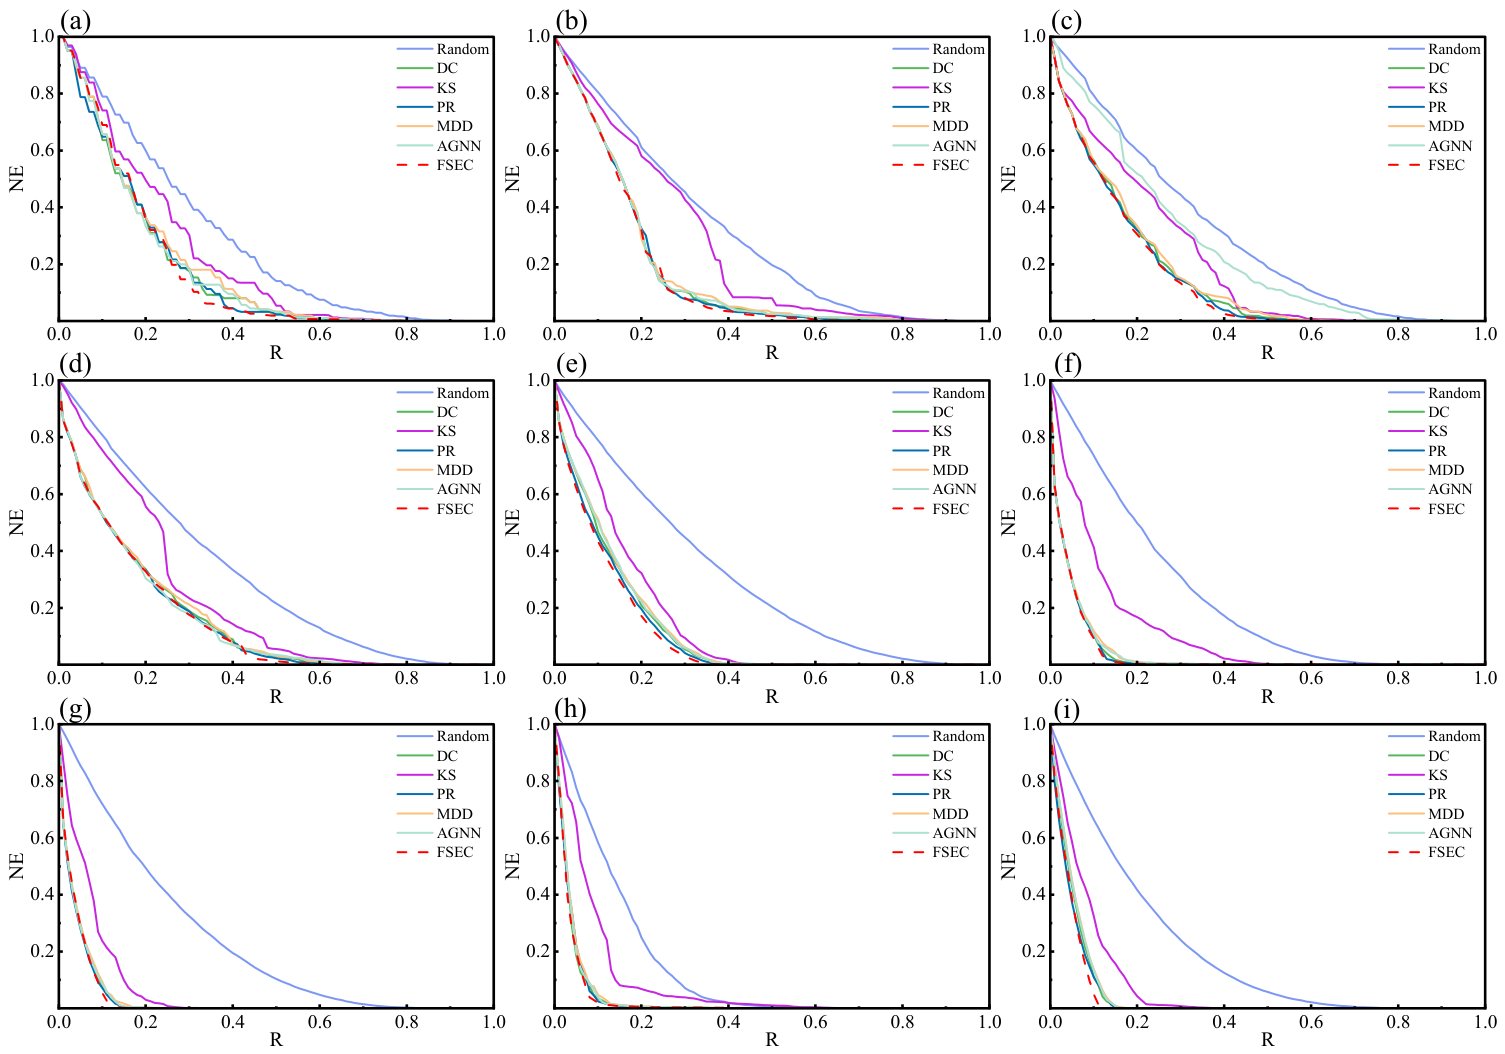
Figure 4 and Table 4 present the degradation of NE under different node removal strategies in real-world networks. A lower proportion of removed nodes required to reduce NE to the threshold (NE = 0.1) signifies better performance.
Figure 4.
NE changes in real networks under different deliberate attacks: (a) Dolphins; (b) Polbooks; (c) Adjnoun; (d) Celegansneural; (e) Polblogs; (f) Cora; (g) Maayan; (h) Power; and (i) Twin.
Table 4.
The fraction of removed nodes required to reduce NE to 0.1 under different attack strategies in real-world networks.
Overall, random attacks cause the weakest degradation of NE. Among deliberate attack strategies, the KS algorithm relies on a coarse-grained shell division mechanism. It fails to precisely differentiate the importance of nodes within the same shell. Consequently, its NE degradation curve lags significantly in most networks. In contrast, the FSEC demonstrates optimal and stable capabilities in blocking information and disrupting topology across various network structures. Specific analysis regarding network heterogeneity across different fields is as follows.
In information networks, FSEC shows outstanding efficiency in blocking information flow. As shown in Table 4, FSEC requires removing only 24% and 10% of nodes in the large-scale Polblogs and Cora networks to reduce NE to 0.1 or below. This performance comprehensively outperforms other baseline algorithms. The AGNN shows a clear lack of adaptability in the Adjnoun network. Meanwhile, FSEC and PR stably maintain high accuracy.
In biological networks, various high-order algorithms exhibit similar capabilities in capturing complex biological interaction paths. AGNN slightly outperforms FSEC in the Celegansneural network with a threshold of 0.37 versus 0.38. However, FSEC maintains high consistency in the overall decline rate of the curve. FSEC and PR jointly achieve the best performance (9%) in the Maayan network.
In infrastructure networks, FSEC fully demonstrates its analytical advantage for specific physical topological structures. The Power network has an extremely large average path length. FSEC requires removing only 7% of core nodes to cause a critical failure in NE. This outperforms DC and MDD (8%). The Twin city network exhibits strong positive assortativity. In this network, the destruction threshold of FSEC (9%) is significantly lower than that of other baseline algorithms.
These experimental results fully verify the effectiveness of the FSEC algorithm. FSEC integrates fractional-order global projection with local structural entropy. This integration overcomes the limitations of baseline algorithms. FSEC can more accurately quantify and isolate the key hub structures governing the global communication distance. It demonstrates high accuracy and robustness in evaluating global efficiency across multi-domain networks.
- (3)
- Monotonicity Analysis
Table 5 quantitatively shows the monotonicity measurement results of six algorithms on nine real networks. Overall, the KS algorithm yields the lowest monotonicity scores across all tested networks. This indicates a severe lack of resolution. Many nodes are assigned to the same shell and cannot be accurately distinguished. Although the DC and MDD algorithms alleviate this issue to some extent, they remain limited by the coarse-grained nature of local integer-order properties. Therefore, they fail to achieve complete node distinction. In contrast, the PR, AGNN, and the proposed FSEC algorithms demonstrate extremely high resolution across all datasets. Analysis based on network heterogeneity is as follows.
Table 5.
Monotonicity values of different algorithms in real networks.
In information and biological networks, AGNN achieves complete ranking monotonicity. This is realized through non-linear mapping in high-dimensional feature spaces. The proposed FSEC algorithm does not rely on black-box models. However, it achieves highly competitive performance in almost all networks with scores above 0.9988. It also achieves a 100% complete node distinction in the Polbooks network.
In infrastructure networks, traditional local algorithms suffer a significant drop in resolution due to node degree homogeneity. Meanwhile, FSEC maintains an extremely high monotonicity above 0.9998. This proves that FSEC successfully breaks the constraints of discrete hierarchical division. It achieves this by coupling continuous fractional-order topological projection with local information entropy. FSEC does not rely on complex neural network training. Still, it can accurately differentiate the influence of nodes within the same shell and achieve ultra-fine-grained ranking.
- (4)
- AUC Analysis
Table 6 and Table 7 present the quantitative AUC results for the LCC and NE evolution curves across real-world networks under various node removal strategies. A smaller AUC value indicates stronger cumulative disruption to the network structure and function after removing the identified nodes. This reflects higher accuracy in node importance evaluation.
Table 6.
AUC values of LCC under different strategies in real-world networks.
Table 7.
AUC values of NE under different strategies in real-world networks.
Random attacks yield the highest AUC values across all tested real-world networks. This confirms the scale-free property in which real networks are generally robust against random failures. Among the deliberate attack baselines, the proposed FSEC method demonstrates a stable and significant advantage in node importance evaluation.
In Table 6, FSEC achieves the lowest AUC values in most datasets. This is particularly evident in highly heterogeneous infrastructure networks. The cumulative disruption efficiency of FSEC significantly outperforms the DC and KS algorithms. It also surpasses algorithms like PR that capture global path information. FSEC also maintains an advantage in locating key nodes for topological connectivity when compared to the AGNN model, which utilizes complex feature representation learning. FSEC (0.0924) falls slightly behind PR (0.0907) only in LCC performance on the Cora network. However, its overall performance consistency remains optimal.
In Table 7, the advantage of FSEC is further validated in NE. The FSEC minimizes the area under the NE curve across all tested networks. This demonstrates that integrating fractional-order diffusion dynamics with local structural entropy allows FSEC to extract deep topological features beyond traditional discrete metrics. It can accurately locate the key bridging nodes that maintain network connectivity. Furthermore, it identifies the critical hubs governing global shortest-path communication. Consequently, FSEC exhibits superior and universal prediction accuracy in dynamic failure propagation scenarios.
- (5)
- SIR Experiment
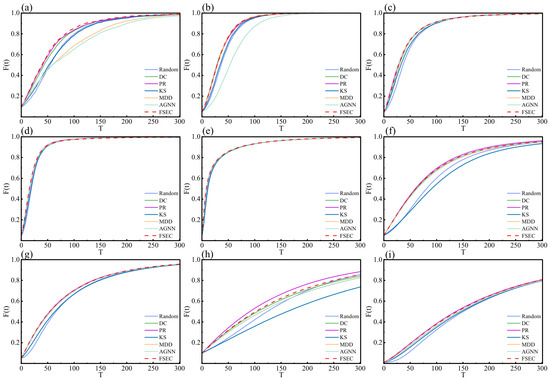
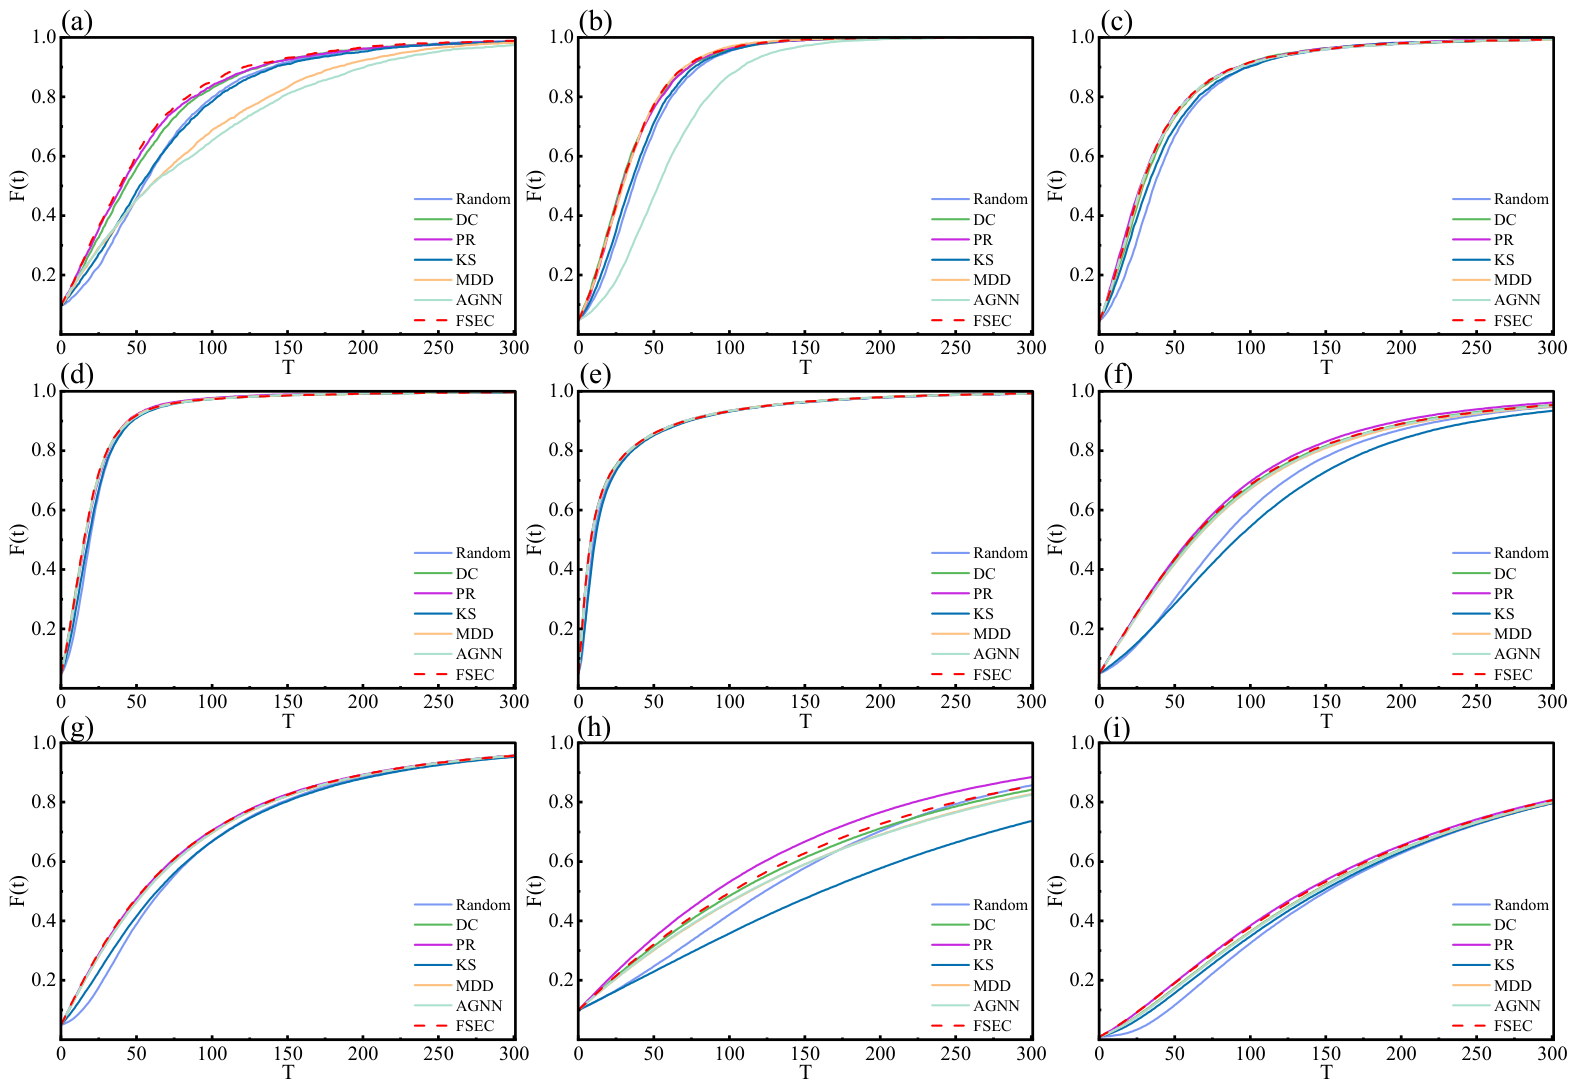
Figure 5 shows the dynamic spreading efficiency of key nodes identified by different centrality algorithms under the SIR model in nine real-world networks. The experiment sets the time step to 300, the infection rate to 0.01, and the recovery rate to 0. The results are averaged over 50 independent runs. To accommodate the topological scale and structural heterogeneity of each network, the proportions of initial infected nodes are set differently. The top 10% of nodes are selected for the Dolphins and Power networks. The top 1% of nodes are selected for the Twin network. The top 5% of nodes are selected for the remaining networks. The vertical axis F(t) represents the cumulative proportion of infected nodes over time t. This metric directly reflects the global spreading capability of the initial node set.
Figure 5.
Changes in SIR metrics in real-world networks under different strategies: (a) Dolphins; (b) Polbooks; (c) Adjnoun; (d) Celegansneural; (e) Polblogs; (f) Cora; (g) Maayan; (h) Power; and (i) Twin.
As shown in Figure 5, the proposed FSEC algorithm efficiently drives the spreading process across all types of networks. Its F(t) curve exhibits the largest upward slope in the early evolutionary stage. It is also the first to reach the steady-state maximum. This indicates that FSEC accurately locates the core node set with the highest dynamic spreading influence in the network.
In information networks, the spreading advantage of FSEC is particularly obvious. As shown in Figure 5a–c, the seed nodes of FSEC rapidly expand the infection scope in the initial stage for the Dolphins, Polbooks, and Adjnoun networks. They also significantly widen the gap with baseline algorithms, such as KS and AGNN. The F(t) curve of AGNN lags significantly in these medium-sized networks. This reflects that its capture of local connectivity features may not be as sensitive as the dynamics-based FSEC. In the larger Polblogs and Cora networks, FSEC shows a similar optimal evolutionary trend to traditional algorithms like DC and PR.
In biological networks, the networks have high connectivity density and relatively short average path lengths. Therefore, the spreading process easily reaches saturation in the early stage. Under such structures, the F(t) curves of various deliberate attack strategies are highly convergent. However, FSEC still maintains a slight leading advantage. This proves its stable recognition ability for core nodes within high-density local modules.
In infrastructure networks, the universality of FSEC is further verified. The Power network features a very large network diameter and long paths. The physical isolation between nodes poses a significant obstacle to spreading evolution. The diffusion efficiency of KS and random strategies drops sharply. FSEC effectively identifies cross-regional long-range structural bridging nodes. However, its performance is slightly lower than the PR algorithm. In the Twin city network, which exhibits positive assortativity, only a minimal seed node proportion of 1% is used. FSEC is again slightly lower than the PR algorithm here.
In summary, the SIR simulation results further confirm the conclusions of the static robustness analysis. The FSEC algorithm integrates fractional-order diffusion dynamics and local structural features. It can accurately dismantle the network skeleton in static topological destruction. Moreover, it can effectively identify the key source nodes driving global state mutations in dynamic failure and information evolution scenarios.
4.3.2. Experimental Results of Network Models
- (1)
- LCC Results Analysis
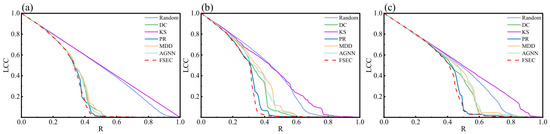
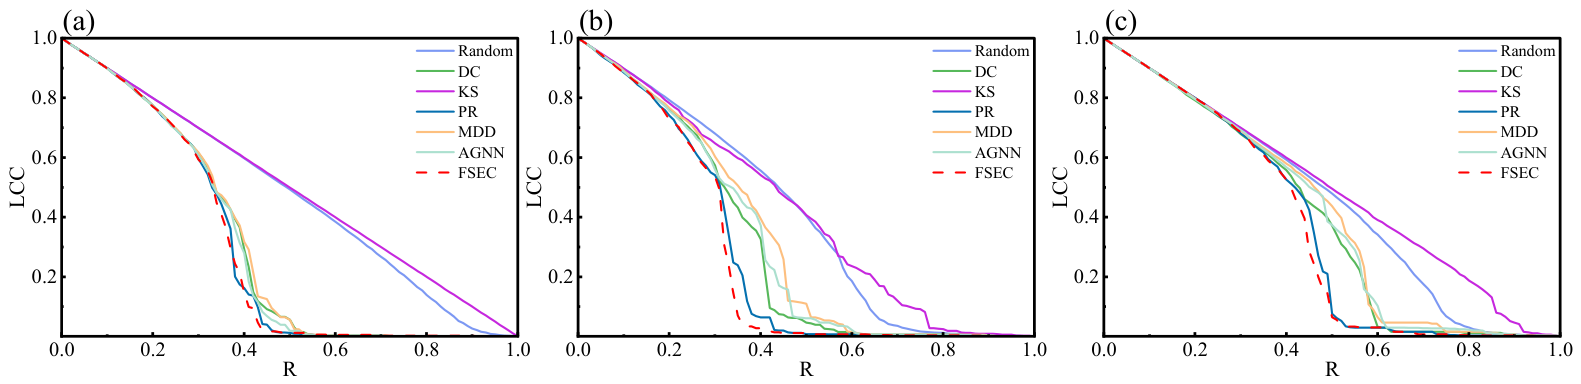
Figure 6 and Table 8 demonstrate the destructive impact of node removal sequences guided by different centrality algorithms on the LCC in three classic artificial network models. In the BA network (Figure 6a) with scale-free characteristics and significant degree heterogeneity, the FSEC, PR, and DC algorithms can rapidly destroy the macroscopic network connectivity. However, the LCC curve of KS and random attacks shows a slow, almost linear decline. This indicates it completely fails in heterogeneous networks, producing only effects similar to random attacks. In WS (Figure 6b) and NW (Figure 6c) small-world networks with high local clustering and short characteristic path lengths, the advantage of the FSEC algorithm is further amplified. In the WS network, the FSEC curve exhibits the steepest decline during the initial node removal phase. That is, removing only 35% of the nodes decreases the LCC to below 0.1. This performance surpasses both PR (0.38) and AGNN (0.47). In the NW network, both FSEC and PR achieve the optimal threshold of 0.50. These results demonstrate the effectiveness of the FSEC algorithm. By utilizing fractional-order continuous spreading dynamics, FSEC overcomes the limited local scope of traditional metrics in small-world models. Consequently, the algorithm accurately identifies the core bridging nodes required to maintain global structural connectivity.
Figure 6.
LCC changes in artificial network models under different deliberate attacks: (a) BA; (b) WS; and (c) NW.
Table 8.
The fraction of removed nodes required to reduce LCC to 0.1 under different attack strategies in artificial networks.
- (2)
- NE Results Analysis
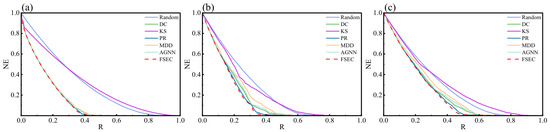
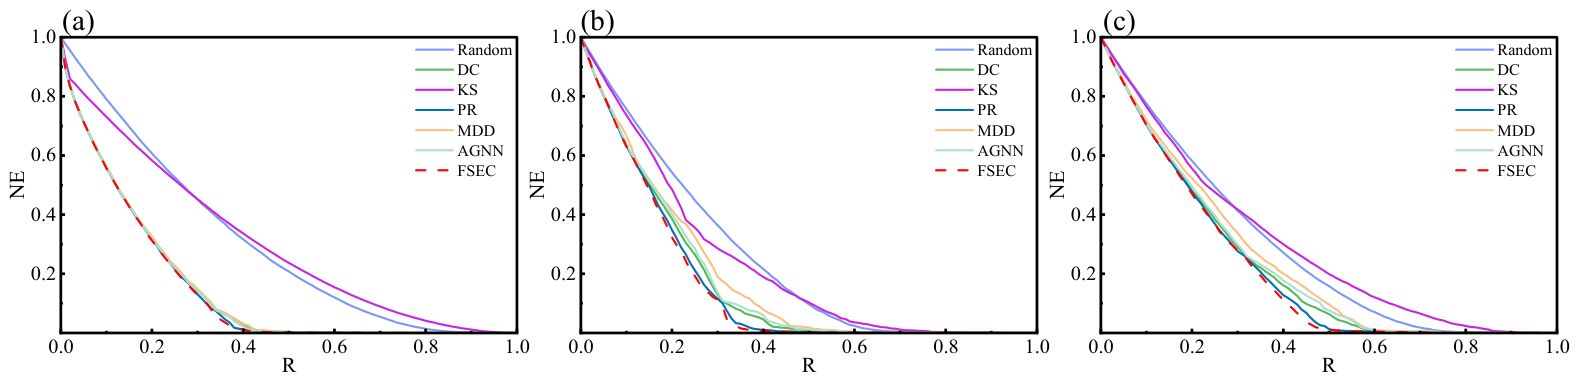
Figure 7 and Table 9 evaluate how the removed node sequence destroys the global information exchange efficiency. Highly consistent with the LCC decline trend, the FSEC algorithm makes the NE curve converge to zero at the fastest speed in all three artificial networks. Especially in WS and NW networks with strong topological homogeneity, removing high-scoring nodes identified by FSEC can most likely cut off the shortest global paths. This forces internal network communication to reroute significantly. As a result, FSEC requires removing only 31% and 41% of the nodes to cause a rapid degradation in global transmission efficiency.
Figure 7.
NE changes in artificial network models under different deliberate attacks: (a) BA; (b) WS; and (c) NW.
Table 9.
The fraction of removed nodes required to reduce NE to 0.1 under different attack strategies in artificial networks.
- (3)
- Monotonicity
Table 10 quantitatively compares the resolution performance of each algorithm under three topological evolution mechanisms. Experimental data reveals that the monotonicity of the KS algorithm plummets to a very low 0.0100 in the BA network. This means the vast majority of nodes are grouped into a few discrete shells, completely losing the ability to distinguish nodes. Even for the MDD algorithm, which introduces a degree compensation mechanism, its upper limit of monotonicity only hovers around 0.89. Meanwhile, the proposed FSEC and AGNN achieve monotonicity of 1 in BA, WS, and NW networks. This fully proves that the deep coupling mechanism of the continuous fractional-order propagation influence factor with local structural information entropy can theoretically eliminate the degradation and overlap of node evaluation scores. This achieves a strict ultra-fine-grained ranking.
Table 10.
Monotonicity values of different algorithms in network models.
- (4)
- AUC Analysis
Table 11 and Table 12 quantitatively evaluate the AUC for various algorithms. These tables show the disruption of the LCC and NE across three classic artificial network models.
Table 11.
AUC values of LCC for different strategies in network models.
Table 12.
AUC values of NE for different strategies in network models.
The BA network features a strongly heterogeneous degree distribution. In this network, the FSEC algorithm achieves the minimum AUC values for both LCC (0.2943) and NE (0.1435). This performance surpasses the effective PR algorithm. It also outperforms the local property-based DC algorithm and the AGNN. In contrast, the KS algorithm yields a higher AUC value than random attacks in the BA network. This result demonstrates the severe methodological limitations of discrete stratification based purely on core and periphery structures when processing networks with extreme degree heterogeneity.
The WS and NW networks exhibit high clustering characteristics. FSEC maintains a clear advantage in these networks. Small-world networks are highly interconnected internally. Their global connectivity depends heavily on a few topological shortcuts. FSEC achieves the optimal AUC convergence due to its continuous fractional order structure capturing capability. For example, the LCC AUC in the WS network drops to 0.2597. Compared with baseline algorithms like PR and AGNN, FSEC more accurately targets the sparse bridge nodes that maintain long-range communication. This highlights its high precision evaluation capability in environments combining network homogeneity and small world characteristics.
- (5)
- SIR Experiment
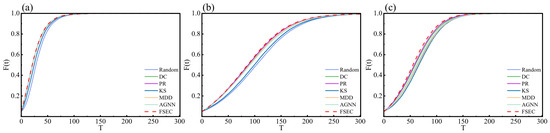
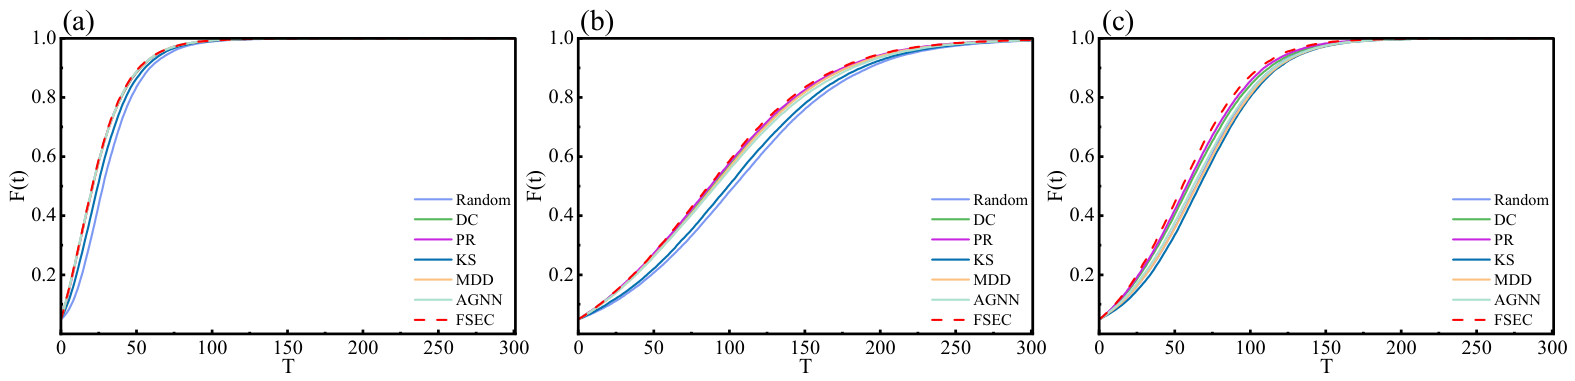
Figure 8 illustrates the dynamic spreading performance of nodes identified by different algorithms under the SIR model across three typical artificial networks.
Figure 8.
Changes in SIR metrics in networks models under different strategies: (a) BA; (b) WS; and (c) NW.
The BA network (Figure 8a) exhibits strong degree heterogeneity. Its network connectivity relies primarily on a few core hubs. Therefore, the overall spreading process reaches saturation quickly. Under this structure, the F(t) curve of the FSEC algorithm still shows the steepest upward slope during the early stages. This indicates that in highly polarized topologies, FSEC effectively identifies core nodes with large degrees. Furthermore, it accurately captures their true global driving force during dynamic evolution. This capability allows the cumulative infection scale to reach its steady-state maximum most rapidly.
The WS and NW small-world networks feature both high local clustering and short characteristic path lengths. In these networks, the spreading advantage of the FSEC algorithm is further amplified. Global interactions in such networks rely heavily on sparse long-range rewired edges. Conventional discrete metrics are often restricted by dense local modules, leading to biased evaluations. The initial seed nodes selected by FSEC significantly outperform baseline algorithms like PR and AGNN during the early spreading stages. Both the spreading rate and the final infection scale maintain an absolute lead.
4.3.3. Parameter Sensitivity Analysis
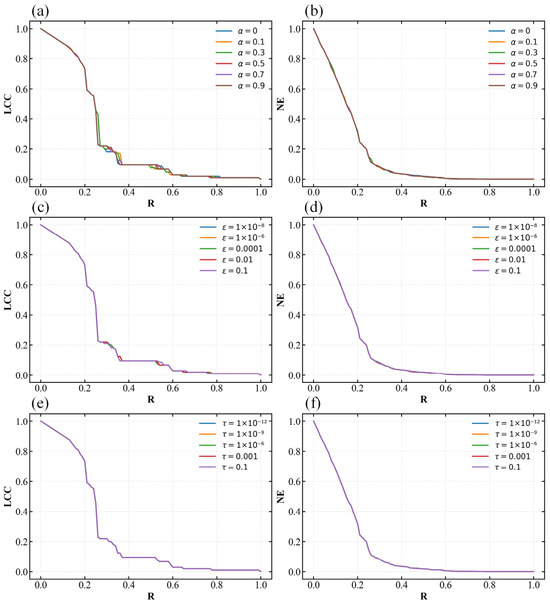
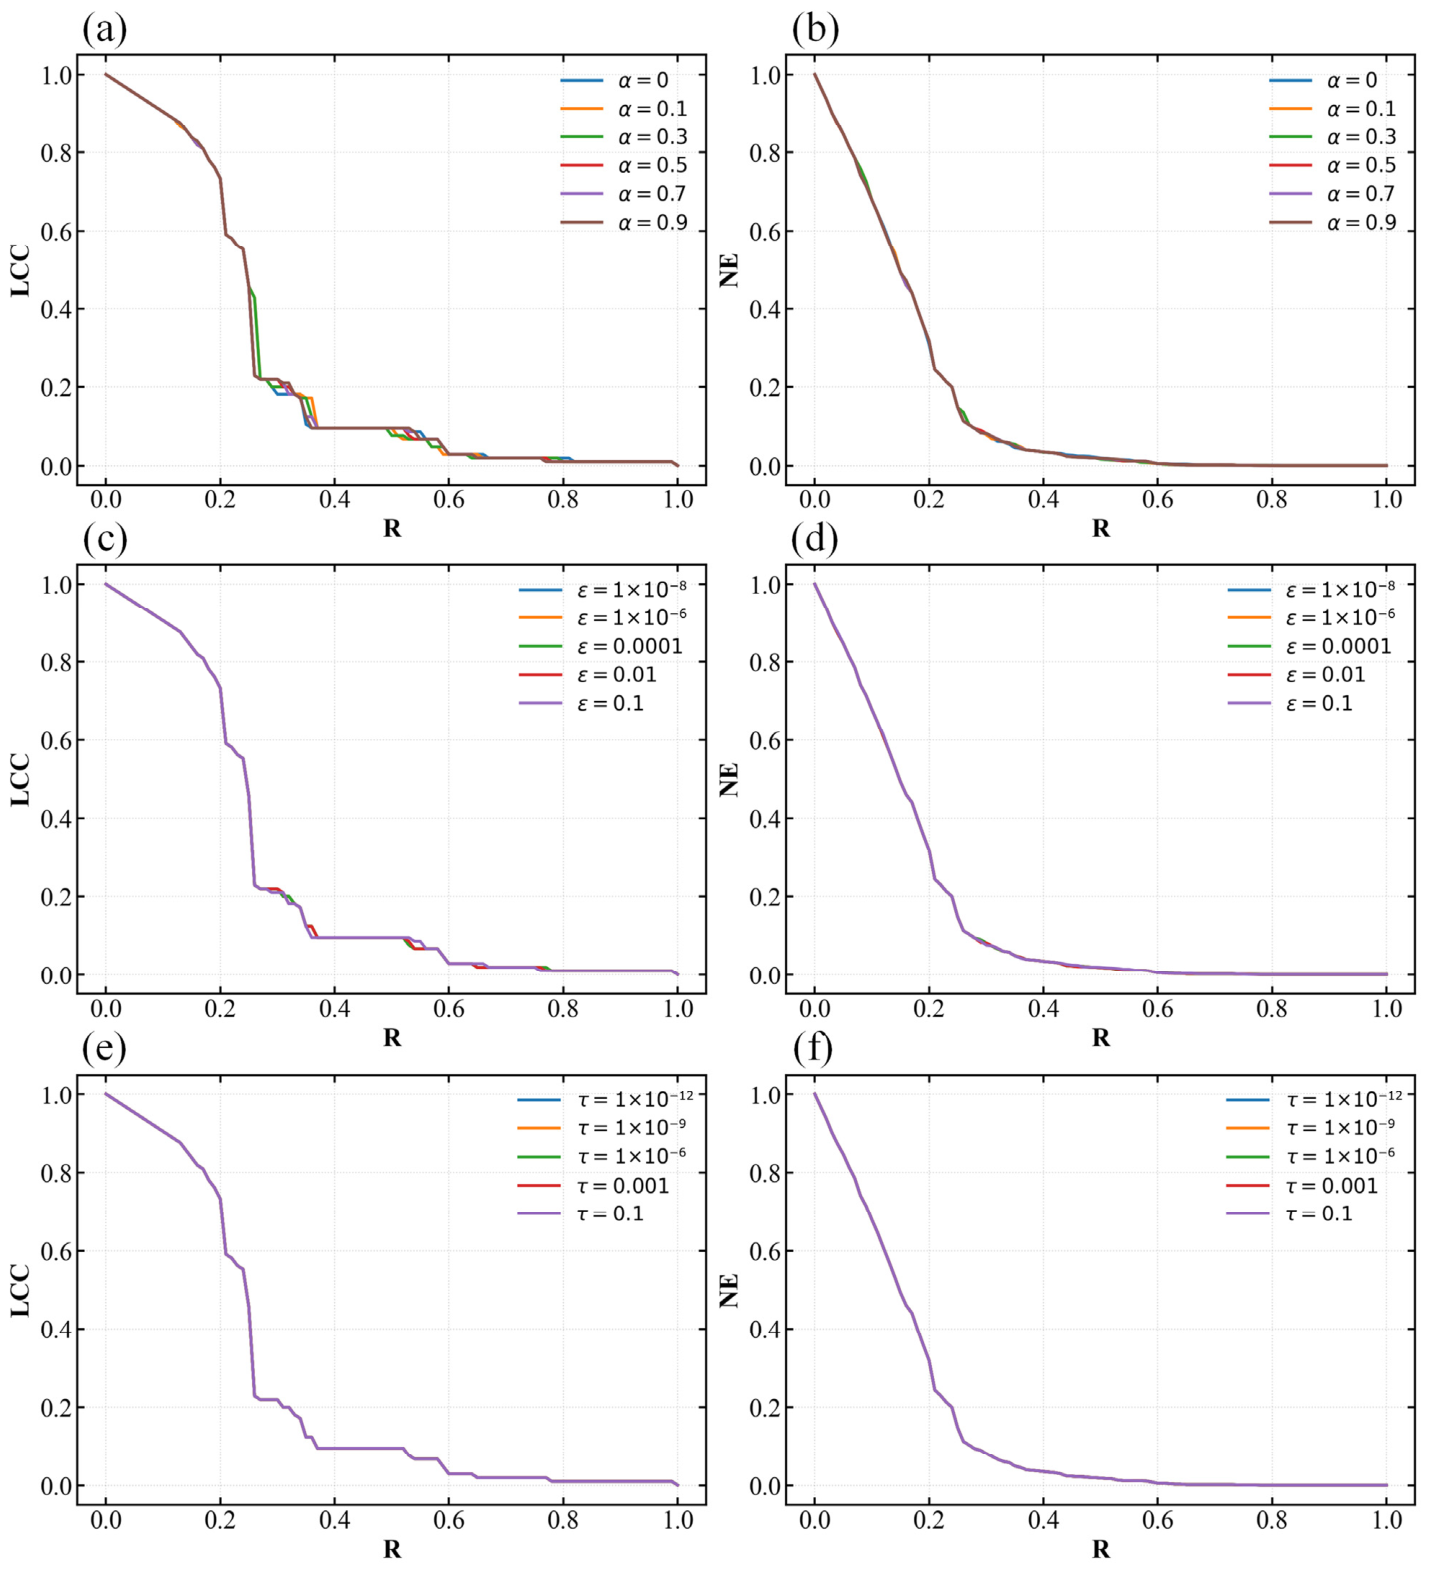
This section conducts sensitivity analysis of the three core parameters in the FSEC method on the Polbooks dataset. These parameters include the fractional-order index α, the numerical stability term ε, and the anti-overflow term τ. The experiment adopts the control variable method. When testing the sensitivity of a single parameter, the other two parameters remain fixed at their baseline values. We set α = 0.5, ε = 10−6, and τ = 10−9.
In the simulations of deliberate attacks, the sensitivity of macroscopic statistical metrics to parameter fluctuations directly affects the generalization ability of the algorithm in practical deployment. Figure 9 illustrates the evolution trajectories of LCC and NE as the node removal ratio R increases. The figure shows that the LCC and NE decline curves under different parameters are highly overlapped, regardless of how α, ε, or τ change within their respective domains.
Figure 9.
Experimental results of different parameter sensitivities: (a) LCC under different α; (b) NE under different α; (c) LCC under different ε; (d) NE under different ε; (e) LCC under different τ; and (f) NE under different τ.
This phenomenon indicates that the FSEC method possesses strong robustness at the macroscopic level. Complex networks generally exhibit significant heterogeneity and the rich-club phenomenon. The local information entropy module in the FSEC algorithm can stably locate the absolute top core hub nodes. This means that the sets of removed critical nodes are highly consistent in the early stage of the attack sequence. This consistency guarantees the certainty of the overall network collapse trajectory. This characteristic enables the algorithm to output stable and reliable node importance evaluation results in practical engineering applications without the need for high-cost parameter tuning.
Furthermore, the basic overlap of the curves verifies the mathematical independence of ε and τ. They only provide underlying mathematical protection. Specifically, they prevent limit value overflow during eigendecomposition and prevent the denominator in probability normalization from approaching zero. They do not cause substantial interference to the relative importance probability distribution of nodes. This verifies the rationality of fixing them at 10−6 and 10−9.
Table 13 lists the monotonicity metrics under different parameter combinations to further evaluate the microscopic impact of parameter changes on the ranking discrimination of the algorithm. This indicates that the algorithm eliminates identical ranking scores on the Polbooks dataset. Combined with the robustness analysis, the FSEC method robustly identifies core hubs at the macroscopic level and exhibits extremely high-ranking resolution at the microscopic level. Even with significant shifts in hyperparameters, the algorithm can still break local symmetry. It assigns a strictly distinguishable global importance score to each node in the network. This confirms its reliability in precise node localization.
Table 13.
Monotonicity experiments.
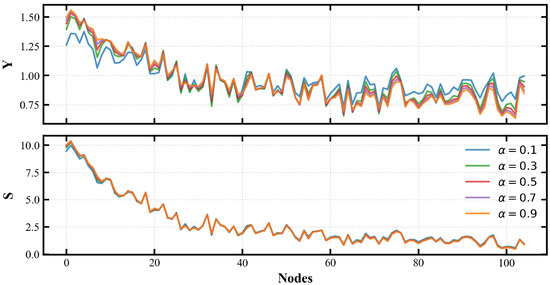
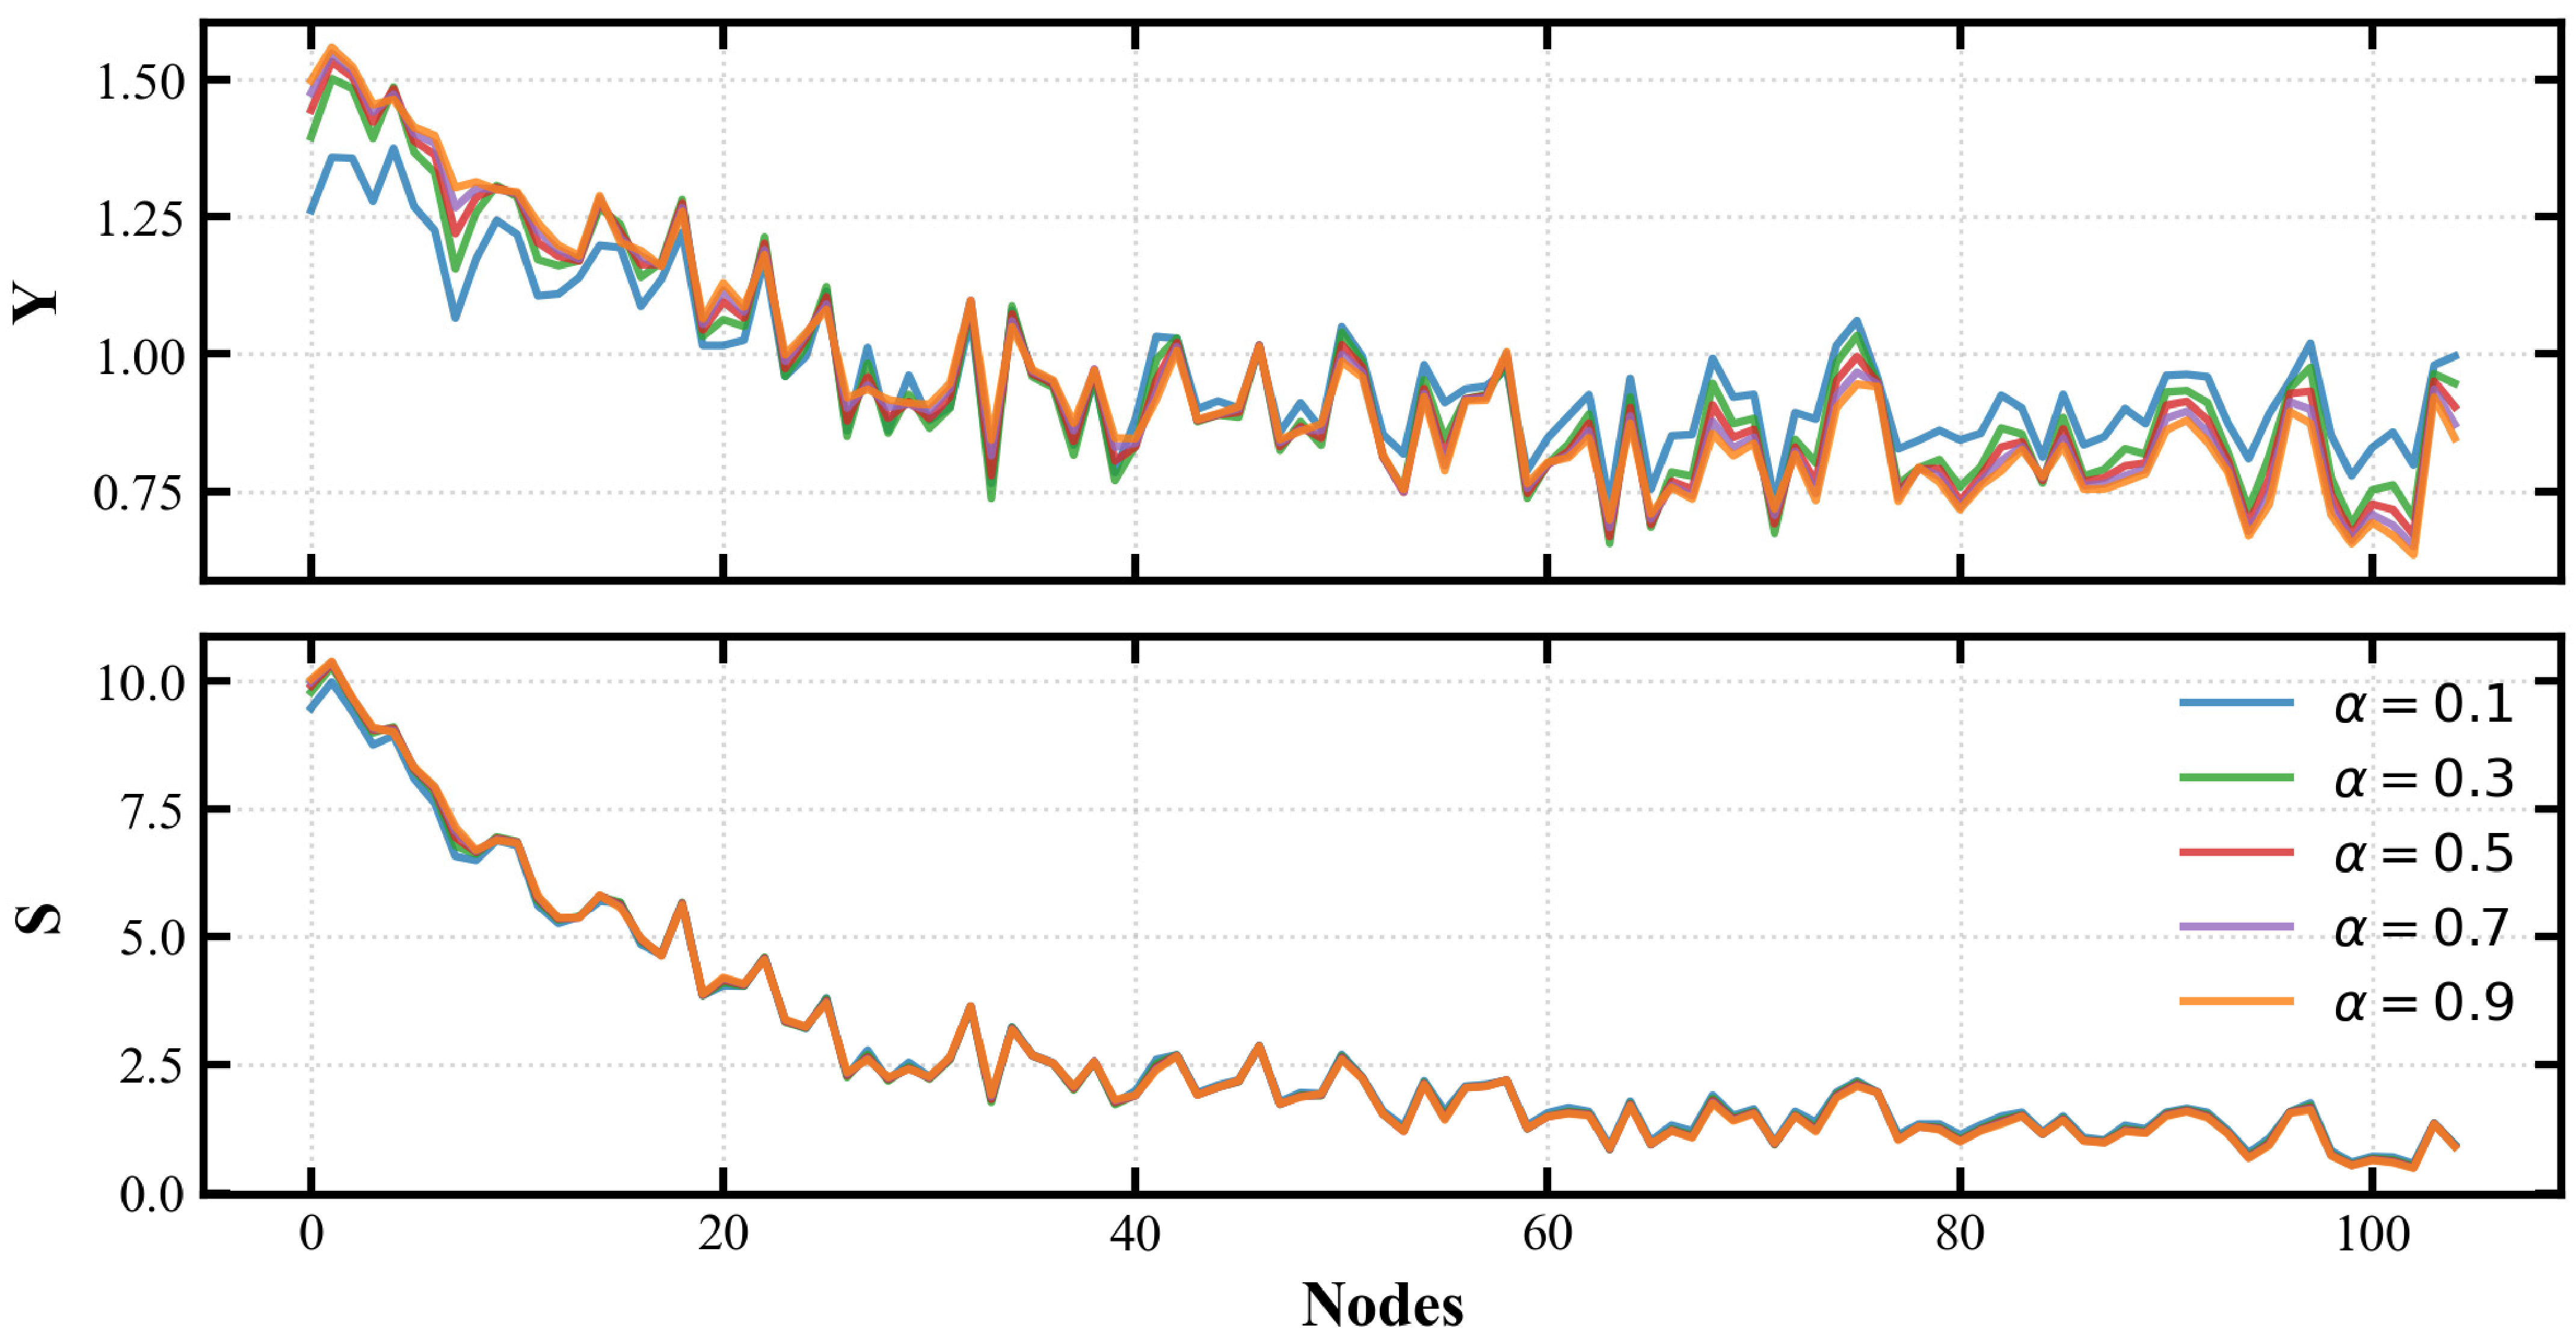
This paper analyzes the intermediate calculation states of the algorithm at a microscopic level to further reveal the internal mechanism of the fractional-order index α in mining network topological information. Figure 10 shows the distribution evolution of the node fractional-order spreading influence factor Y and the final information entropy score S under different α values.
Figure 10.
Effects of different fractional-order indices on the Polbooks dataset.
As seen in Figure 10, the FSEC algorithm internally achieves a decoupling of multi-scale dimensions. In the fractional-order spreading stage, the node influence factor Y under the same conditions shows significant differentiation and oscillation as the α value adjusts. This proves that the fractional-order operator effectively breaks the node state degeneracy caused by local connection similarity. Through the dynamic perception of topological connectivity via α, the long-tail nodes with identical local degrees undergo high-resolution reconstruction and reordering in the global energy distribution. In the information entropy aggregation stage, the final score sequence S achieves smooth convergence across parameters after probability normalization and logarithmic operations. The local entropy aggregation acts as a non-linear filter and stabilizer. It preserves the fine ranking differences in marginal nodes caused by α variations to improve resolution. Simultaneously, it mathematically reduces the absolute deviation of energy fluctuations macroscopically to consolidate the ranking of core hub nodes.
4.4. Discussion
Experimental results indicate that the FSEC algorithm achieves nearly absolute monotonic ranking across datasets with varying assortativity. From the perspective of topological dynamics, the monotonicity of traditional discrete metrics is often severely restricted by degree correlation. For instance, in disassortative networks where numerous low-degree nodes attach to a few core nodes, the symmetry of such local star structures easily triggers topological degeneracy, assigning identical discrete evaluation values to large batches of nodes.
The FSEC algorithm utilizes a fractional-order operator to perform spectral smooth mapping on the symmetric normalized adjacency matrix. This transforms traditional discrete topological hops into continuous high-dimensional orthogonal space projections. Global spectral decomposition possesses specific algebraic properties. Due to these properties, nodes can obtain unique high-order influence factor priors within the continuous real-number domain. This holds true even in networks with highly symmetric local topologies or strong degree correlations. The process relies on minor asymmetries within the global structure. It fundamentally eliminates the structural degeneracy caused by assortative or disassortative characteristics. Local information entropy then amplifies this microstructural asymmetry. This coupled architecture integrates global continuous feature projection and local non-linear entropy amplification. As a result, the final FSEC scores of nodes are no longer restricted to a finite set of integer values. Therefore, this coupled framework ensures the injectivity of topological feature mapping at the analytical level. This applies regardless of the overall assortative tendency or evolutionary mechanism of the network. Theoretically, this guarantees that the algorithm maintains strict ranking resolution and robust monotonicity across different network structural characteristics.
While the FSEC method demonstrates superiority in evaluating node importance, this study has certain theoretical limitations. First, the fractional-order hyperparameter α directly determines the penetration scale of global topological features. This relates to parameter sensitivity and adaptability. Currently, the selection of α relies on predefined hyperparameter traversal. It lacks an analytical and adaptive selection mechanism based on the underlying attributes of different networks. Second, the current FSEC theoretical framework is restricted to undirected, unweighted, and static networks. Asymmetric information flows and heterogeneous interaction strengths exist widely in the real world. The adjacency matrices of directed weighted networks are typically asymmetric. Consequently, orthogonal eigenvalue decomposition cannot be applied directly. This invalidates the current real-domain spectral mapping mechanism.
Future work will introduce the Chebyshev polynomial approximation spectral method to overcome the scalability limitations of large-scale networks. This approach converts eigendecomposition into sparse matrix iterations. It reduces the time complexity to a linear level and enables applications in massive networks. The fractional-order propagation framework can also be extended to more complex network topologies. For directed weighted networks, we can construct a magnetic Laplacian operator to achieve asymmetric spectral decomposition. For multi-layer coupled networks, we plan to extend the spectral mapping mechanism directly to the supra-adjacency matrix. This will provide substantial theoretical proof of concept for the continuous propagation of high-order features across layers.
5. Conclusions
To address the inherent defects of topological information discretization and low-ranking resolution in evaluating node importance within complex networks, this paper proposes the fractional-order spreading entropy centrality (FSEC) method. By introducing spectral decomposition and fractional matrix theory into topological analysis, FSEC successfully constructs a continuous-space topological spreading operator. This breaks the hop limits of traditional integer-order neighborhood expansion. It also achieves a global multi-scale smooth mapping of node influence. Meanwhile, by coupling local structural information entropy, the method accurately quantifies the asymmetric control of nodes within their local neighborhoods from an information-theoretic perspective.
Systematic simulations verify the superiority of FSEC across three dimensions: static robustness, dynamic spreading, and ranking resolution. Under static deliberate attacks, FSEC disrupts the LCC of both real and artificial networks fastest with minimal node removal cost. It also causes a rapid collapse in NE. Furthermore, its AUC is minimized across various heterogeneous and homogeneous networks. This demonstrates a highly accurate identification of critical nodes. In dynamic spreading scenarios, SIR-based experiments indicate that the core node sets identified by FSEC achieve the maximum infection scale on most datasets. This proves its excellent predictive capability in dynamic failure and information spreading processes. The monotonicity metric of FSEC is slightly lower than that of the AGNN algorithm across different network topologies. However, it outperforms all other baseline methods. Overall, the FSEC algorithm effectively identifies core nodes in most networks.
Future research will explore an optimal adaptive selection mechanism for the fractional-order hyperparameter. We also plan to introduce approximate spectral methods to reduce the time complexity to a linear level. This will overcome the computational bottlenecks associated with ultra-large-scale networks. Additionally, the proposed spectral mapping framework exhibits high scalability. It can be extended to magnetic Laplacian operators or supra-adjacency matrices. This extension will provide theoretical support for identifying critical nodes in directed weighted networks and multilayer coupled networks.
Author Contributions
Conceptualization, K.H., S.C., X.Z. and W.L.; investigation, K.H., S.C., P.L. and W.L.; methodology, K.H., X.Z. and W.L.; software, K.H.; validation, K.H., S.C.; data curation, K.H. and P.L.; writing—original draft preparation, K.H.; writing—review and editing, K.H. and W.L.; visualization, K.H.; supervision, W.L.; project administration, W.L.; funding acquisition, W.L. All authors have read and agreed to the published version of the manuscript.
Funding
This work was supported by the Department of Science and Technology of Hubei Province, China (2024BAB067); the CHUTIAN Talent Program Special Fund for Innovation and Entrepreneurship Teams of Hubei Province, China; the Fundamental Research Funds for the Central Universities, China (104972025YJS0119); and the Doctoral Student Program of the Young S&T Talents Cultivation Project, CAST.
Data Availability Statement
All datasets used in this research are open source: https://github.com/hkzstudy/Complex-Network-Dataset (accessed on 1 May 2026). Data can be downloaded directly from: https://public.websites.umich.edu/~mejn/netdata/ (accessed on 10 March 2026); https://snap.stanford.edu/data/ (accessed on 10 March 2026); and http://konect.cc/networks/ (accessed on 1 May 2026).
Acknowledgments
We are grateful to our families, friends, and laboratory colleagues for their unwavering understanding and encouragement.
Conflicts of Interest
The authors declare no conflicts of interest.
References
- Ait Rai, K.; Machkour, M.; Antari, J. Influential Nodes Identification in Complex Networks: A Comprehensive Literature Review. Beni-Suef Univ. J. Basic Appl. Sci. 2023, 12, 18. [Google Scholar] [CrossRef] [Scilit] [PubMed]
- Ma, Y.; Yao, J.; Chen, C.; Zhang, P. Evolutionary Characteristics and Robustness Analysis of the Global Aircraft Trade Network System. Systems 2025, 13, 1016. [Google Scholar] [CrossRef] [Scilit]
- Zeng, Z.; Zhang, W.; Jin, H. A “C3-TOPSIS-Pareto” Based Model for Identifying Critical Nodes in Complex Networks. Systems 2025, 13, 138. [Google Scholar] [CrossRef] [Scilit]
- Shen, Q.; Lin, L.; Hou, T.; Song, C. Enhancing Resilience in China’s Refined Oil Product Distribution Network: A Complex Network Theory Approach with Optimization Strategies. Systems 2026, 14, 69. [Google Scholar] [CrossRef] [Scilit]
- Huang, K.; Xie, Y.; Peng, H.; Li, W. Study on Dynamic Evolution Characteristics of Wuhan Metro Network Based on Complex Network. Phys. A Stat. Mech. Its Appl. 2024, 648, 129945. [Google Scholar] [CrossRef] [Scilit]
- Wu, H.; Deng, H.; Li, J.; Wang, Y.; Yang, K. Hunting for Influential Nodes Based on Radiation Theory in Complex Networks. Chaos Solitons Fractals 2024, 188, 115487. [Google Scholar] [CrossRef] [Scilit]
- Su, C.; Wang, J.; Wang, X.; Li, Z. Robustness Analysis of Clustered Mine Cyber-Physical System Considering Node Overload and Underload under Cascading Failure. Proc. Inst. Mech. Eng. Part O J. Risk Reliab. 2026. [Google Scholar] [CrossRef] [Scilit]
- Zhong, S.; Zhang, H.; Deng, Y. Identification of Influential Nodes in Complex Networks: A Local Degree Dimension Approach. Inf. Sci. 2022, 610, 994–1009. [Google Scholar] [CrossRef] [Scilit]
- Deepthi, B.; Sivakumar, B. Towards Assessing the Importance of Individual Stations in Hydrometric Networks: Application of Complex Networks. Stoch. Environ. Res. Risk Assess. 2023, 37, 1333–1352. [Google Scholar] [CrossRef] [Scilit]
- Huang, K.; Zhang, W.; Xu, Y.; Wu, C.; Li, W. A Vulnerability Identification Method for Distribution Networks Integrating Fuzzy Local Dimension and Topological Structure. Processes 2025, 13, 2438. [Google Scholar] [CrossRef] [Scilit]
- He, Y.; Jin, Y.; Cao, J.; Sui, S.; Wang, J.; Ran, B. Identification of Key Nodes in Urban Bus-Metro Network: A NK-Shell Algorithm Based Neighborhood KS. Reliab. Eng. Syst. Saf. 2025, 264, 111448. [Google Scholar] [CrossRef] [Scilit]
- Qu, H.; Song, Y.-R.; Li, R.; Li, M.; Jiang, G.-P. Node Ranking Based on Graph Curvature and PageRank. Chin. Phys. B 2025, 34, 028901. [Google Scholar] [CrossRef] [Scilit]
- Liu, S.; Gao, H. The Structure Entropy-Based Node Importance Ranking Method for Graph Data. Entropy 2023, 25, 941. [Google Scholar] [CrossRef] [Scilit]
- Dichio, V.; De Vico Fallani, F. Statistical Models of Complex Brain Networks: A Maximum Entropy Approach. Rep. Prog. Phys. 2023, 86, 102601. [Google Scholar] [CrossRef] [Scilit]
- Angelidis, G.; Ioannidis, E.; Makris, G.; Antoniou, I.; Varsakelis, N. Competitive Conditions in Global Value Chain Networks: An Assessment Using Entropy and Network Analysis. Entropy 2020, 22, 1068. [Google Scholar] [CrossRef] [Scilit] [PubMed]
- Yu, Y.; Zhou, B.; Chen, L.; Gao, T.; Liu, J. Identifying Important Nodes in Complex Networks Based on Node Propagation Entropy. Entropy 2022, 24, 275. [Google Scholar] [CrossRef] [Scilit] [PubMed]
- Dong, C.; Xu, G.; Meng, L.; Yang, P. CPR-TOPSIS: A Novel Algorithm for Finding Influential Nodes in Complex Networks Based on Communication Probability and Relative Entropy. Phys. A Stat. Mech. Its Appl. 2022, 603, 127797. [Google Scholar] [CrossRef] [Scilit]
- Zhou, Z.; Huang, X.; Li, Z.; Jiang, W. Enhanced Key Node Identification in Complex Networks Based on Fractal Dimension and Entropy-Driven Spring Model. Entropy 2025, 27, 911. [Google Scholar] [CrossRef] [Scilit]
- Chen, W.; Li, W.; Zhang, T. Complex Network-Based Resilience Capability Assessment for a Combat System of Systems. Systems 2024, 12, 31. [Google Scholar] [CrossRef] [Scilit]
- Hou, H.; Wang, Y.; Zhai, Q.; Sun, X. Optimal Control of Stochastic Fractional Rumor Propagation Model in Activity-Driven Networks. Appl. Math. Model. 2025, 142, 115968. [Google Scholar] [CrossRef] [Scilit]
- Dhakshinamoorthy, V.; Banerjee, S. Fractional Order Mem-Elements: From Modeling to Applications: A Review. Nonlinear Dyn. 2026, 114, 503. [Google Scholar] [CrossRef] [Scilit]
- Zhang, C.; Ren, G.-J.; Chen, W.; Yu, Y.-G.; Chen, Y.-Q. A Review on Boundary Control of Fractional-Order Reaction–Diffusion Systems. Nonlinear Dyn. 2025, 113, 28617–28634. [Google Scholar] [CrossRef] [Scilit]
- Fernandez, E.; Huilcapi, V.; Birs, I.; Cajo, R. The Role of Fractional Calculus in Modern Optimization: A Survey of Algorithms, Applications, and Open Challenges. Mathematics 2025, 13, 3172. [Google Scholar] [CrossRef] [Scilit]
- Zhu, J.; Dai, F.; Zhao, F.; Guo, W. Integrating Node Importance and Network Topological Properties for Link Prediction in Complex Network. Symmetry 2023, 15, 1492. [Google Scholar] [CrossRef] [Scilit]
- Zhao, Y.; Ma, X.; Qiao, W.; Han, B.; Zhang, W. Exploring the Dynamic Characteristics of LNG Shipping Network Resilience by Integrating Complex Network and SIR Simulation: A Case of China. Ocean Eng. 2026, 343, 123431. [Google Scholar] [CrossRef] [Scilit]
- Zeng, J.; Wu, Y.; Liu, J.; He, D.; Lan, Z. Identification of Critical Nodes in Power Grid Based on Improved PageRank Algorithm and Power Flow Transfer Entropy. Electronics 2023, 13, 184. [Google Scholar] [CrossRef] [Scilit]
- Liu, W. Key Nodes Identification Method in Scale-Free Network Based on Structural Holes. IEEE Access 2025, 13, 102060–102070. [Google Scholar] [CrossRef] [Scilit]
- Li, R.; Yuan, X.; Radfar, M.; Marendy, P.; Ni, W.; O’Brien, T.J.; Casillas-Espinosa, P. Graph Signal Processing, Graph Neural Network and Graph Learning on Biological Data: A Systematic Review. IEEE Rev. Biomed. Eng. 2023, 16, 109–135. [Google Scholar] [CrossRef] [Scilit]
- Liu, Z.; Zheng, S.; Yan, Y.; Zhu, Z.; Zhao, Y. Adaptive Graph Filtering Neural Network for Graph Anomaly Detection. IEEE Trans. Netw. Sci. Eng. 2026, 13, 3274–3284. [Google Scholar] [CrossRef] [Scilit]
- Nandi, S.; Maji, G.; Dutta, A. Identifying Vital Spreaders in Multiplex Networks: Measurement of Layer Dominance and a Closeness-Based Layer Gravity Method. J. Supercomput. 2025, 81, 1253. [Google Scholar] [CrossRef] [Scilit]
- Cai, E.; Miller, B.A.; Simek, O.; Smith, C.L. UniqueRank: Identifying Important and Difficult-to-Replace Nodes in Attributed Graphs. IEEE Trans. Netw. Sci. Eng. 2026, 13, 7411–7428. [Google Scholar] [CrossRef] [Scilit]
- Liu, Y.; Guo, H.; Yan, X. Gaussian Decay Centrality: A Quantum-Inspired Method for Identifying Important Nodes in Complex Networks. Inf. Process. Manag. 2026, 63, 104366. [Google Scholar] [CrossRef] [Scilit]
- Xiong, Y.; Hu, Z.; Su, C.; Cai, S.-M.; Zhou, T. Vital Node Identification in Complex Networks Based on Autoencoder and Graph Neural Network. Appl. Soft Comput. 2024, 163, 111895. [Google Scholar] [CrossRef] [Scilit]

Disclaimer/Publisher’s Note: The statements, opinions and data contained in all publications are solely those of the individual author(s) and contributor(s) and not of MDPI and/or the editor(s). MDPI and/or the editor(s) disclaim responsibility for any injury to people or property resulting from any ideas, methods, instructions or products referred to in the content. |
© 2026 by the authors. Licensee MDPI, Basel, Switzerland. This article is an open access article distributed under the terms and conditions of the Creative Commons Attribution (CC BY) license.