


Abstract
This paper presents an initial estimate of the energy demand and charging power requirements for the initial replacement of internal combustion public transport buses by battery electric buses in Chillán and Chillán Viejo, Ñuble Region, Chile. The analysis is based on an operational baseline derived from route lengths, service frequencies, departures, and fleet data, combined with official energy and transport demand projections. A case study is conducted for the introduction of 10 battery electric buses on Line 13 of public transport, comparing 100% overnight depot charging and 80% overnight charging complemented by opportunity charging. Results show that the initial 10-bus deployment would require an installed depot charging power between 300 and 450 kW, depending on the charging strategy, with an annual delivered energy of 1149.75 MWh. Long-term scaling scenarios suggest that bus-dedicated charging infrastructure could require between 4.52 MW and 22.35 MW by 2050. Although the numerical results are specific to the case study, the main contribution of this study lies in an operationally grounded planning framework that links the sizing of pilot routes with long-term charging demand scenarios and charging infrastructure projections, providing a transferable basis for preliminary electric bus planning in other mid-size or emerging regions facing similar infrastructure constraints.
1. Introduction
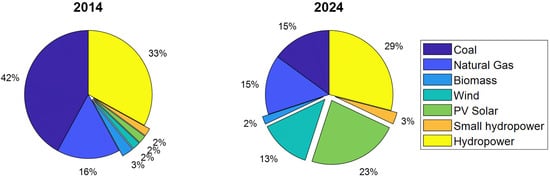
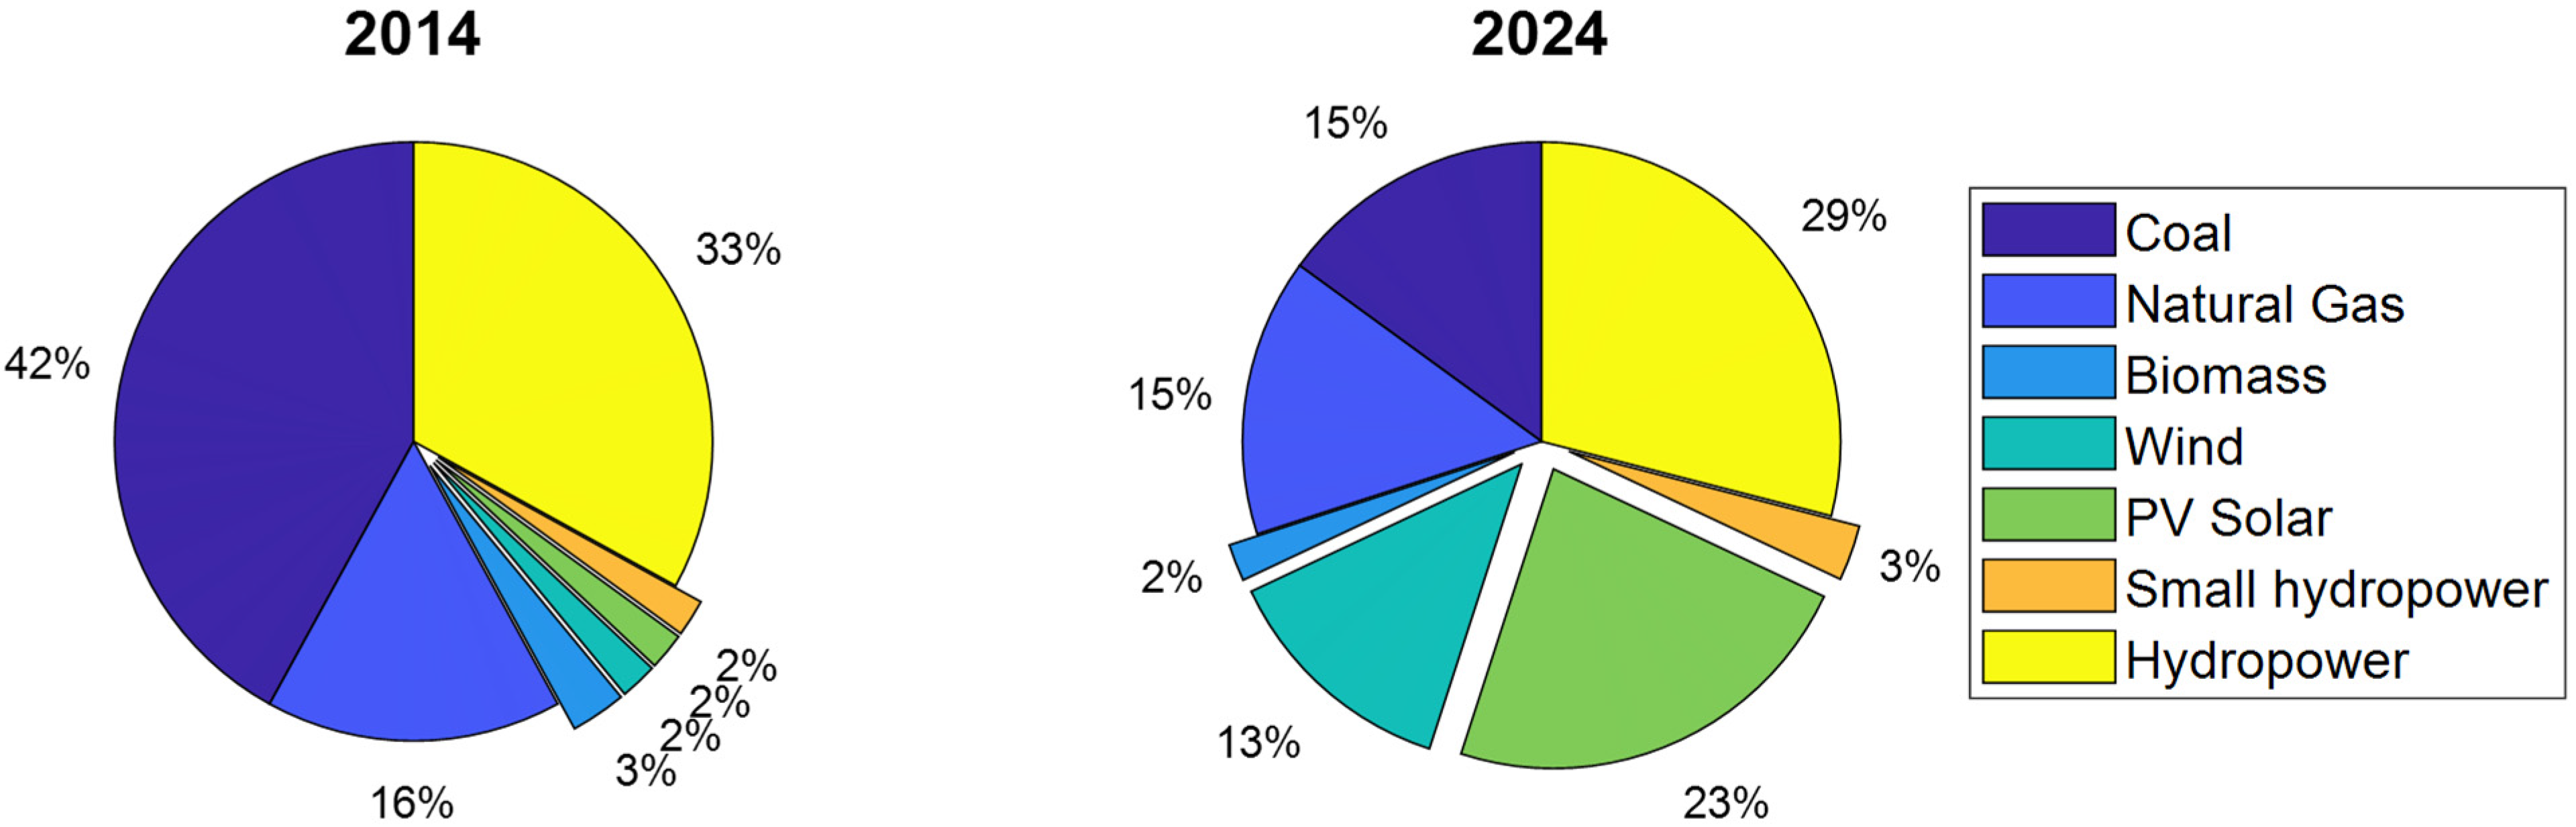
Climate change and the need to reduce greenhouse gas emissions have accelerated the global energy transition and increased the role of electrification across transport, buildings, and industry [1,2,3]. In this context, replacing fossil-fuel-dependent transport processes with electricity-based alternatives has become a central strategy for decarbonization. The electricity generation in Chile has undergone significant changes over the last decade. In 2014, the country was heavily dependent on fossil fuels, and by 2024, nearly 40% of its energy came from renewable sources (solar PV, wind, etc.), excluding hydropower, as shown in Figure 1 [4]. A change in the source of generation represents a significant step in the energy transition. This transformation creates favorable conditions for the electrification of end-use sectors. In particular, the transport sector accounts for 33.3% of total national energy consumption, of which 81% corresponds to land transport [5]. This segment still depends almost entirely on fossil fuels and is responsible for 23.6% of national CO2 emissions [6].
Figure 1.
Comparison of electricity generation in Chile between 2014 and 2024.
Electric-vehicle adoption has expanded rapidly worldwide, although with important regional differences in pace and policy support. China currently leads the global market, accounting for more than half of worldwide EV sales in 2024, and approximately one out of every ten vehicles on its roads is now electric. In Europe and the United States, policy support and regulatory measures have also sustained market growth, with electric vehicles representing around 20% and 10% of total new car sales, respectively [7].
The electric vehicle market in Latin America and the Caribbean has expanded rapidly, driven by public policies, financial incentives, and growing social and environmental awareness. In 2024, electric vehicles accounted for approximately 4% of total vehicle sales in the region, with notable progress in countries such as Brazil, Costa Rica, Uruguay, and Colombia. In the public transport sector, the regional electric bus fleet grew by approximately 33.5% in 2024 compared to 2023, with Chile, Colombia, Brazil, and Mexico standing out as the main contributors to this expansion [8].
Recent studies have shown that access to public EV charging infrastructure is not spatially neutral but instead reflects significant geographic and socioeconomic disparities [9,10]. In particular, lower-income groups and non-metropolitan areas tend to experience lower accessibility to charging infrastructure, which may slow down electrification and reinforce territorial inequities in the energy transition [9,10]. At the same time, the academic literature on electric bus deployment has emphasized that charging strategies, operational scheduling, and infrastructure sizing are strongly conditioned by route-level characteristics, charging windows, and local grid constraints [11,12,13]. Real-world and methodological studies have shown that the integration of battery electric buses depends not only on fleet replacement targets but also on the choice between depot and opportunity charging, charger utilization, the operational feasibility of route-level service, and cost-related factors affected by local operating conditions [11,12,13,14]. These geographical and operational challenges are especially relevant for regions such as Ñuble, where charging infrastructure remains limited outside major urban centers and where the conditions of mid-size cities differ from those of large metropolitan or BRT-oriented systems [9,10,11,12]. In this context, estimating charging demand and installed power requirements for electric bus deployment constitutes a necessary precursor to subsequent infrastructure siting, utility coordination, and staged implementation planning.
From the perspective of the current literature, the present study lies between two related but distinct research streams. On the one hand, infrastructure-planning studies have addressed the sizing and spatial deployment of charging stations in road networks based on vehicle characteristics, charging technology, and traffic flows [15]. On the other hand, recent research on electric bus scheduling has emphasized the importance of charging strategies, operational constraints, charge scheduling, and infrastructure availability in the performance of electric bus systems [16]. In contrast to charging-station location models or full scheduling optimization models, this work focuses on an intermediate planning layer: deriving energy-demand and charging-power requirements from a real operational baseline and using them to support preliminary infrastructure sizing for electric bus integration in a mid-size urban system.
Recent work has also explored integrated optimization frameworks for battery electric bus systems in which charging-facility planning and charging scheduling are solved simultaneously under operational constraints and time-of-use electricity tariffs, as shown in [17]. In contrast, the present study does not address a dynamic or integrated scheduling problem but rather a preliminary planning layer focused on deriving energy-demand and charging-power requirements from a real operational baseline for scenario-based infrastructure sizing.
An electrical system may have enough energy to absorb the energy demand of a highly energy-intensive process, particularly one that relies heavily on fossil fuels, such as land transportation. Replacing a city’s existing public buses with battery electric buses requires estimating the energy and charging infrastructure needed based on the route, distance, frequency, range, and number of public transport bus lines serving that city.
However, unlike more detailed route- and vehicle-simulation approaches, the present work does not explicitly model second-order physical-environment effects such as road gradients, traffic congestion, ambient temperature, auxiliary loads, or battery degradation. For example, ref. [18] combines route geometry, speed profiles, elevation profiles, and auxiliary loads in a vehicle simulation framework to assess battery requirements under alternative charging scenarios. In contrast, the energy-demand estimates developed in this paper are based on an operational baseline and nominal vehicle specifications and should therefore be interpreted as a preliminary planning estimate rather than as a detailed vehicle-dynamics simulation.
This paper presents a calculation method for estimating energy demand and the charging infrastructure required to replace the public transport bus fleet in the cities of Chillán and Chillán Viejo in the Ñuble Region, Chile. The manuscript follows a two-stage analytical structure. First, a system-wide operational baseline is established for the Chillán–Chillán Viejo public transport network. Second, the Line 13 case study is used as a pilot application of this framework for the initial deployment of 10 electric buses.
The main contributions of this work can be summarized as follows:
- (1)
- An operational baseline of the public transport system in Chillán and Chillán Viejo is constructed using route lengths, service frequencies, departures, fleet allocation, and operating cost estimates.
- (2)
- A pilot case study is developed for the introduction of 10 battery electric buses on Line 13, comparing two charging strategies: 100% overnight depot charging and 80% overnight charging complemented by opportunity charging.
- (3)
- Route-level energy-demand and charging-power requirements are derived and translated into normalized planning indicators that can be reused for infrastructure scaling.
- (4)
- Long-term projections of electric bus adoption, charging demand, and installed charging power are developed under alternative scenarios, providing a preliminary planning framework for mid-size and non-metropolitan cities facing similar infrastructure constraints.
The paper is organized as follows: Section 2 presents the electromobility context in Chile. Section 3 develops the operational baseline of the public transport system in Chillán and Chillán Viejo. Section 4 presents the charging-demand and infrastructure-sizing analysis, including the Line 13 pilot case and the long-term scenario projections. Finally, Section 5 presents the conclusions and future work.
2. Electromobility in Chile
In countries like Chile, which are importers of fossil fuels but have a surplus of renewable resources, electromobility facilitates [19] (i) reductions in the emission of greenhouse gases (GHG) and particulate matter in cities; (ii) independence from imported polluting fuels, the market for which is controlled by an oligopoly and is economically and geopolitically strategic; (iii) use of the country’s own renewable resources, promoting the internal market for energy generation, including the production of H2V; (iv) improvements in land transportation and organization of the territory to encourage shorter trips; and (v) increases in energy efficiency to 3 to 4 times better than that of internal combustion vehicles. Evidently, electromobility plays a crucial role in Chile’s energy transition and the achievement of the 2030 agenda for the fulfillment of the 17 sustainable development goals [20]; in addition, electromobility supports (i) public health and (ii) energy security.
Chile has defined essential milestones that enable the development of electromobility, such as the 2050 energy policy [21], national green hydrogen strategy [22], energy efficiency law [23], national electromobility strategy [19], climate change law [24], and storage and electromobility law [25]. With the implementation of the National Electromobility Strategy, the number of electric vehicles on the road is expected to increase significantly in the coming years. The targets set for 2035 are (i) for 100% of light and medium-sized vehicles sold to be zero-emission vehicles and (ii) for 100% of new additions to urban public transport to be zero-emission vehicles. By 2045, 100% of intercity freight and passenger transport vehicles sold will be zero-emission [19]. For the current Chilean government to accelerate electromobility development [26], this document provides a different focus: (i) charge infrastructure, (ii) education and training, (iii) road safety, (iv) regulation, and (v) public transport and decentralization.
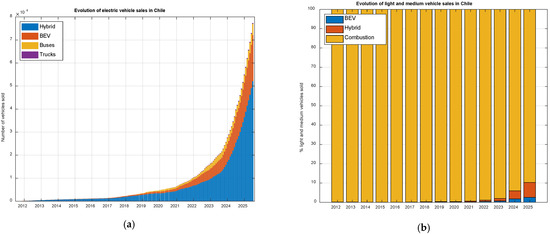
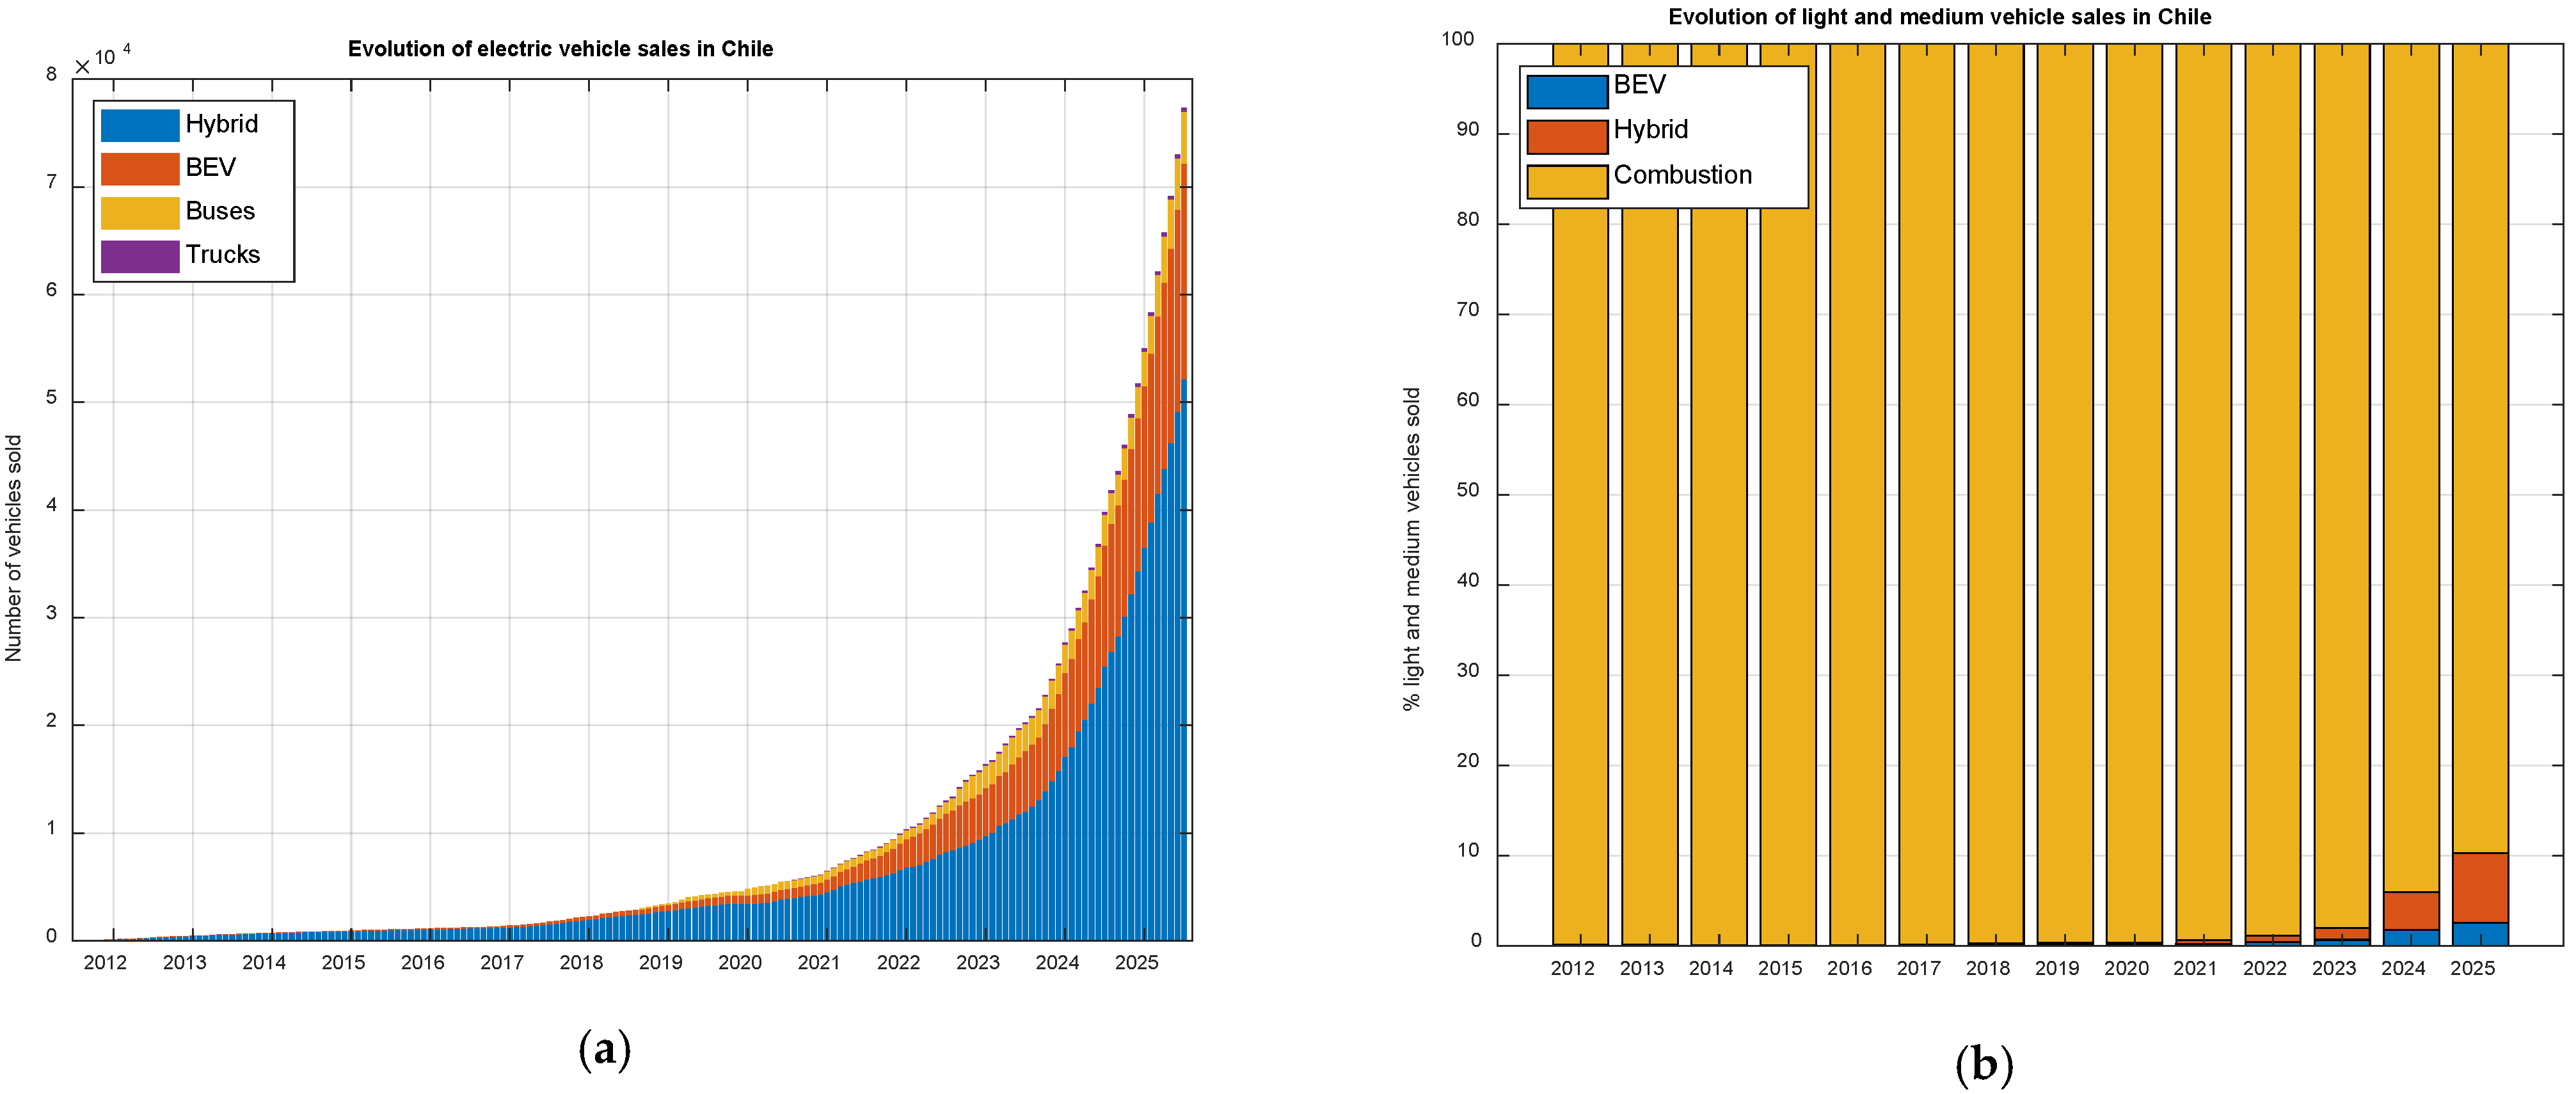
The first sales of electric vehicles in Chile occurred in 2012. Growth was relatively slow until 2021, particularly due to the increase in conventional hybrid vehicles (HEVs) and electric vehicles (BEVs). The first electric buses arrived in 2019 to serve the Chilean capital, Santiago. Figure 2a shows the overall trend in electric vehicle purchases in Chile [27]. Analyzing light and medium-sized vehicle sales, Figure 2b, for the last two years, we observe greater proportions of HEVs and BEVs, particularly in 2023, when HEVs accounted for 1.31% and BEVs for 0.64% of overall sales. In 2024, HEVs accounted for 4.18% of overall sales of light and medium vehicles, and BEVs accounted for 1.76%. In 2025, HEVs accounted for 7.71% of overall sales of light and medium vehicles, and BEVs accounted for 2.53% [27]. The new available BEVs (light and medium vehicles, buses, and trucks) require adequate charging infrastructure.
Figure 2.
(a) Evolution of electric vehicle sales in Chile between 2012 and 2025. (b) Evolution of light and medium vehicle sales in Chile between 2012 and 2025.
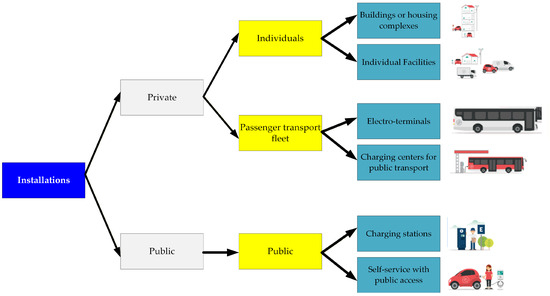
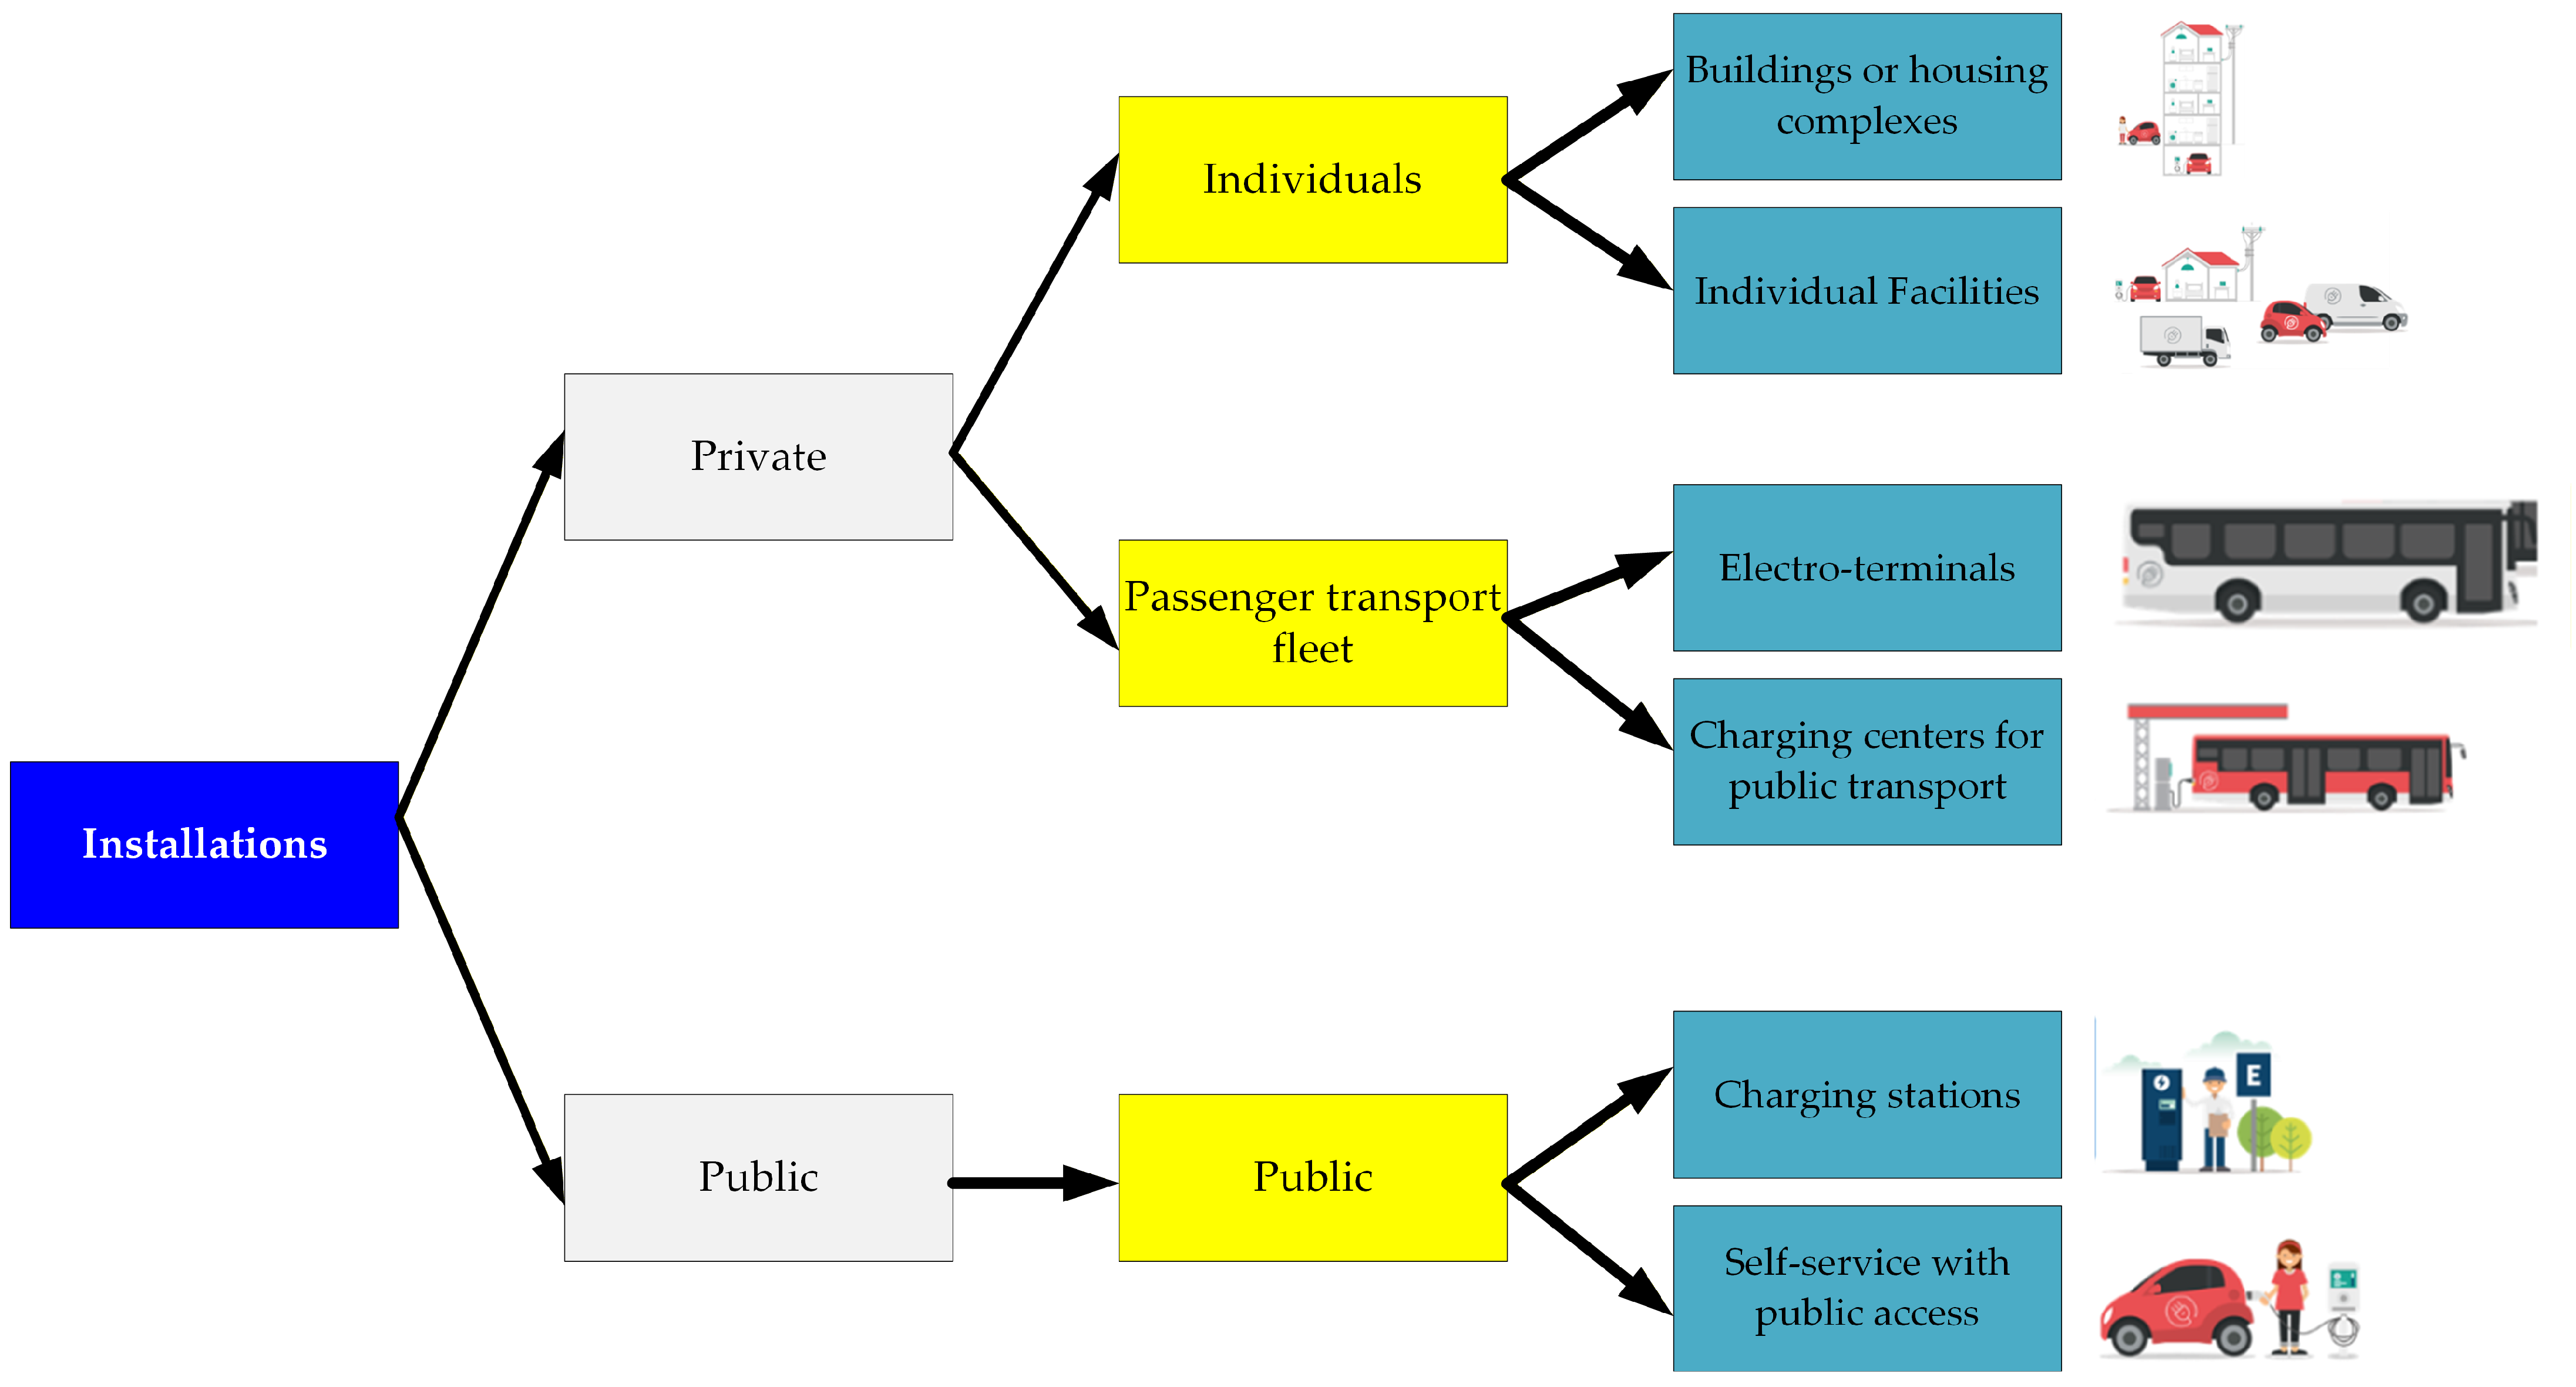
In Chile, when chargers are available for public use, they are referred to as public chargers; if they are dedicated to a group or individual, they are known as private chargers (Figure 3). Despite their distinct uses, the construction characteristics of public and private chargers are similar, but they differ in how they meet demand [28]. For public chargers, there are two options: (i) Charging service stations with appropriate infrastructure for charging electric vehicles with AC and DC electricity. These stations may have high-power rapid electric vehicle supply systems (greater than 22 kW). They are located at service stations or other facilities primarily intended for charging electric vehicles and that have at least one operator. (ii) Self-service stations with public access: these are in facilities located on public roads or national assets for public use (NAPUs), streets, parks, restaurant parking lots, hotels, malls, offices, and public parking lots (free or paid) and are intended to be used by users unfamiliar with the risks of electrical energy. There are two classes of private chargers: (i) for passenger transport fleets and (ii) for individuals. Each of these classes has two subclassifications. For the first class, the subclassifications are (a) electro-terminals (e.g., for private taxi or private bus fleets), which are service stations with charging infrastructure for fleets of electric vehicles used in public or private passenger transport and (b) charging centers for public transport, namely charging infrastructure for fleets of electric buses operating in the public transport system. For the second class, the subclassifications are (a) “buildings or housing complexes”, which are horizontal or vertical residential buildings that share electrical installations, and (b) “individual facilities”, which are single-family homes, private offices, municipal buildings, hospitals, trucking companies, electric trucks, etc. [29].
Figure 3.
Types of electric vehicle charging facilities in Chile [29].
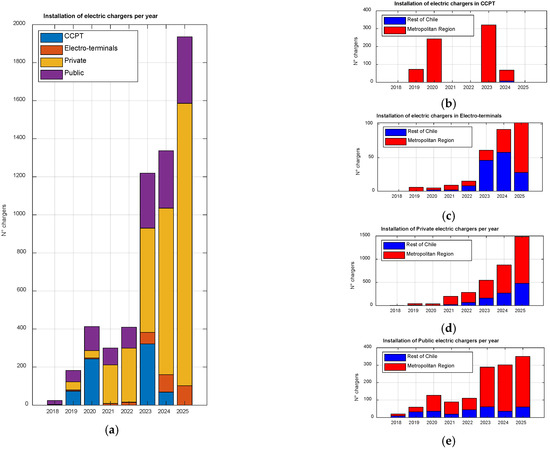
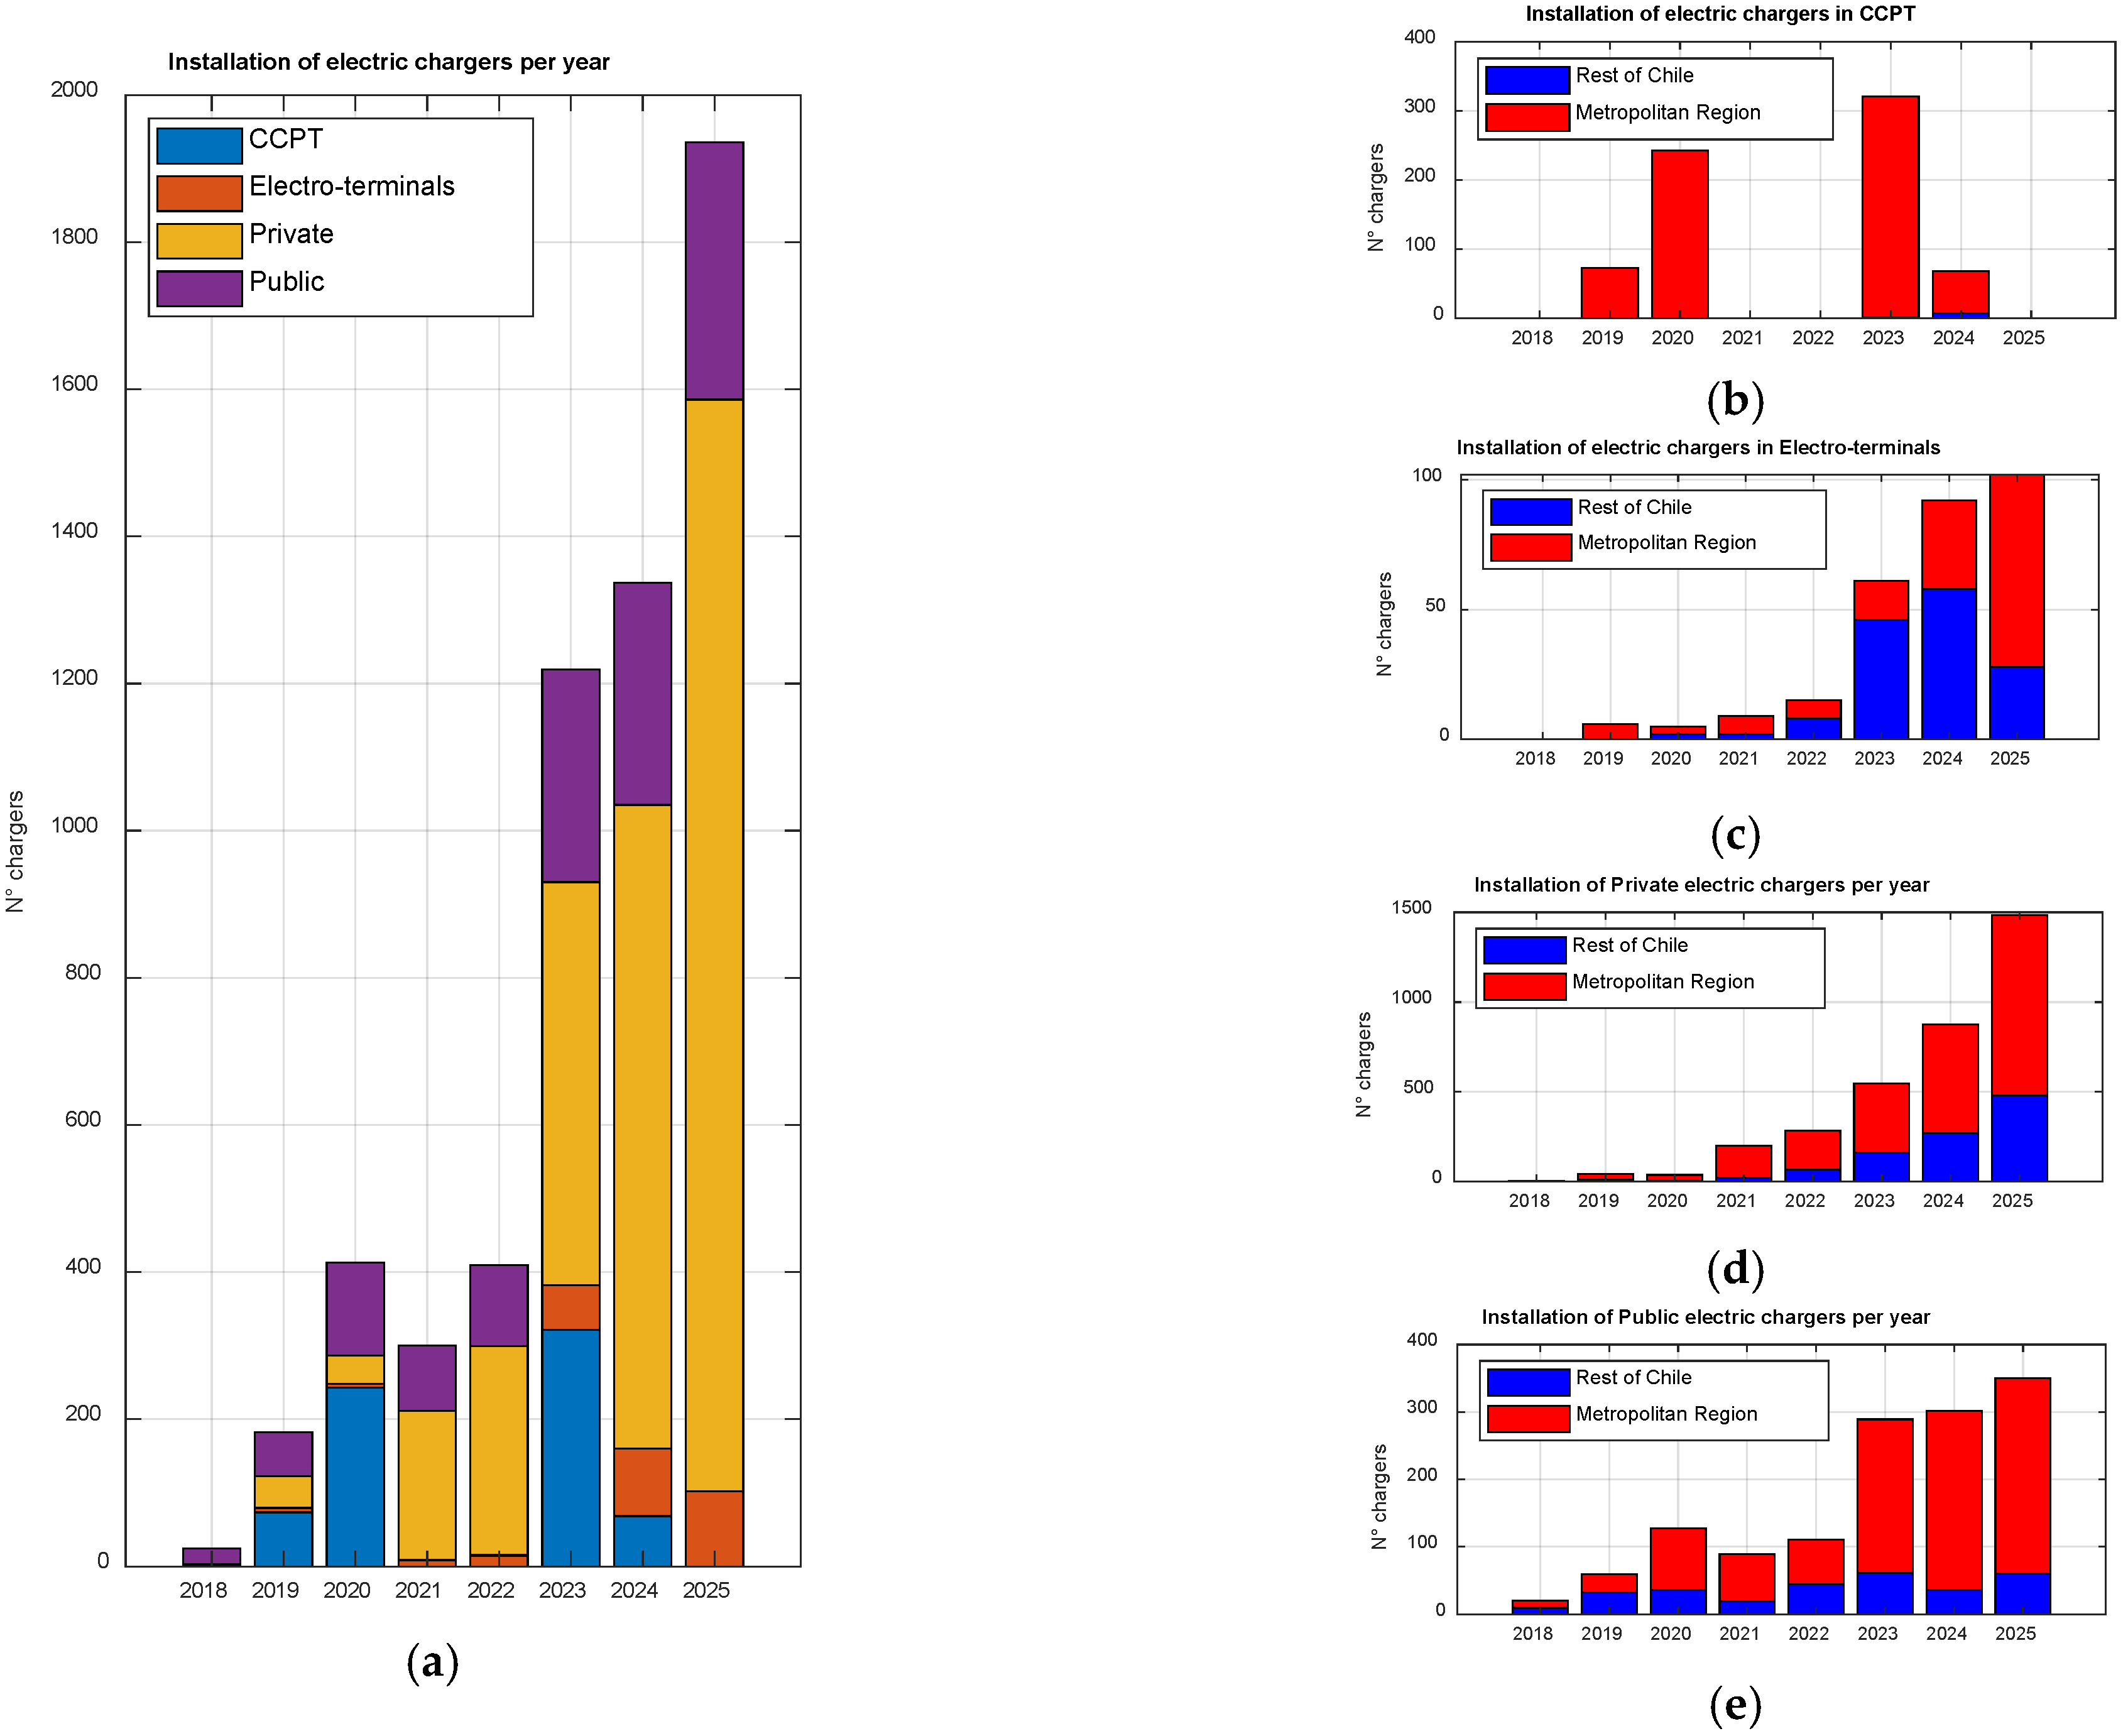
The charging infrastructure in Chile grew slowly between 2018 and 2022 and is very concentrated in the metropolitan region, particularly in the capital city, Santiago (Figure 4a). From 2023, there has been an increase in the installation of electric chargers for the following reasons: (i) the replacement of internal combustion buses with electric buses in Santiago de Chile increased with the fulfillment of participation quotas through contracts, (ii) government incentives encouraged taxi owners to transition from internal combustion taxis to electric taxis, (iii) some companies began installing public chargers at service stations along the main national highway, and (iv) some companies and individuals began to switch from internal combustion vehicles to electric vehicles to benefit from the operational advantages of electric vehicles over internal combustion vehicles. Figure 4b–d illustrate that regardless of the type of electric charger, they are most concentrated in Santiago de Chile, despite efforts to decentralize electromobility in Chile. Currently, these efforts are focused on the north of Chile, where there is an abundance of solar energy available for the generation of electrical energy through photovoltaic systems.
Figure 4.
(a) Installation of electric chargers in Chile 2018–2025; (b) distribution of electric chargers in charging centers for public transport; (c) distribution of electric chargers in Electro terminals; (d) distribution of private electric chargers; and (e) distribution of public electric chargers.
Given the above factors, the effective implementation of electromobility in public transportation, specifically through electric buses, requires an accurate projection of energy consumption based on the number of electric buses on each transport line and their trip frequency. The number of buses also determines the number of DC electric chargers (150 kW) that must be installed in new charging centers for public transportation in the cities of Chillán and Chillán Viejo in the Ñuble region. Charging requirements may necessitate nighttime charging of electric buses or partial charging during the day, which could place additional stress on the electrical grid.
3. Baseline Characterization of Public Transport in Chillán and Chillán Viejo
Public transport is an essential component of urban mobility in the city of Chillán, where it plays a key role in the daily movement of the population and in reducing traffic congestion. The urban bus network is the main mode of public transport, comprising various lines with different characteristics and demand [30]. However, the system’s operational efficiency and economic sustainability face challenges related to energy consumption, operating costs, and route planning.
In response to these challenges, Chile has established a series of national policies and strategies to promote electromobility, aligned with carbon neutrality goals. These include the National Electromobility Strategy, the 2022–2026 Energy Agenda, and the 2050 Energy Plan [19,31]. The former calls for all new light- and medium-sized vehicles to be zero-emission by 2035 and for 40% of the total vehicle fleet to be electric by 2050, while also ensuring that 100% of public transport vehicles use this technology. The 2022–2026 Energy Agenda reinforces these objectives through concrete actions to develop charging infrastructure, promote technological R&D, and train specialized human capital. Finally, the 2050 Energy Plan establishes a roadmap for achieving a fully decarbonized energy matrix, promoting the integration of renewable energy and storage technologies to ensure a clean, sustainable electricity supply for electric vehicles.
To support the energy transition, technical studies that quantify fleet performance, distances traveled, and costs per trip are essential. International experience indicates that electrification planning improves when grounded in operational baselines and structured decision frameworks. Multi-criteria approaches, for example, have been used to prioritize which routes should be electrified first, supporting early-stage decisions before detailed feasibility studies are conducted [32]. Once priority corridors are defined, real-world deployments, such as the Municipal Transport Company (EMT) in Madrid, show that charging strategy selection (depot vs. opportunity) and technology choices (e.g., automated high-power charging) directly affect operational reliability and infrastructure requirements and should therefore be evaluated jointly with cost metrics [11]. Moreover, viability assessments for Bus Rapid Transit (BRT) systems have integrated economic, environmental, and social dimensions through formal methods such as Analytic Hierarchy Process (AHP), reinforcing the importance of incorporating service quality and public health criteria alongside direct costs [12]. Complementarily, demand estimation methods based on mobility patterns and simplified energy–time formulations (e.g., charging time as a function of required energy and charger power) provide a practical basis to translate operational mileage into energy and charging needs [13]. Finally, recent Total Cost of Ownership (TCO) frameworks for commercial vehicles and buses emphasize that operational costs are highly sensitive to external conditions, further motivating the use of local operational data rather than relying solely on generic assumptions [14].
Although international experiences such as EMT Madrid and AHP-based assessments for BRT systems provide useful methodological references, their direct transfer to cities such as Chillán and Chillán Viejo requires important adjustments. First, mid-size cities operate at a smaller fleet scale and with lower demand density, which affects charger utilization, investment efficiency, and the feasibility of opportunity-charging schemes. Second, the local economic and institutional context may limit the pace of fleet renewal and infrastructure deployment compared with large metropolitan systems. Third, route characteristics, service frequencies, and depot availability differ from those of large BRT-oriented or high-density networks, meaning that charging strategies must be adapted to local operational constraints. For these reasons, the present study uses international experiences as methodological guidance while grounding the analysis in a route-level operational baseline specific to Chillán and Chillán Viejo.
This study conducts an operational and economic analysis of Chillán’s public transportation system, considering parameters such as total distance traveled, operating times, and estimated costs per trip for each line. Route lengths, operating schedules, and service frequencies were obtained from the Moovit and Red Regional platforms, while fleet size and line-level allocation were compiled from local operator records [28]. Additional operational assumptions used in the baseline calculations, such as average operating speed and representative diesel-bus efficiency, were supported by the literature [11,12,13]. The analytical sizing approach adopted in this study is consistent with previous transport and energy studies that estimate electric bus charging demand as a function of route-level operation, charging windows, charger power, and infrastructure-sizing constraints [11,12,13].
3.1. Characteristics of Chillán and Chillán Viejo Cities: Area, Population, and Economy
Chillán and Chillán Viejo are cities characterized by a predominantly flat topography with gentle slopes, which favors efficient urban mobility and makes them a suitable case study location for the implementation of electric transportation technologies. This geographic location, combined with its medium size and compact urban structure, allows for optimized operation of electric fleets and is expected to reduce the energy demand for travel.
From a demographic perspective, the Chillán–Chillán Viejo conurbation has a population of around 215,000 [33], making it the main urban and economic center of the Ñuble Region. Economically, Chillán stands out for its diversified production base, where the agricultural and forestry sectors, personal services, construction, and public administration are key drivers of activity. The region accounts for approximately 1.2% of the national GDP, with an average annual growth of 3.6% between 2013 and 2022, exceeding the national average. This economic dynamism, coupled with its favorable urban morphology, positions Chillán as a strategic environment for the development of electromobility and sustainable public transport projects [34]. While the impacts of electromobility extend across multiple sectors (e.g., transport and services), this study focuses specifically on the urban bus system, the backbone of public transport in Chillán, as a direct lever for emissions and operating-cost reductions at the city scale.
3.2. Public Transport Network and Operational Parameters
The urban public transport system in Chillán comprises a network of ten main bus lines operating with an estimated fleet of 313 vehicles, according to records from local operating companies [30]. The routes range from approximately 25 km to 55 km per complete round trip, depending on the line and the number of associated routes (Table 1). Distance and schedule information were obtained from the Moovit and Red Regional applications.
Table 1.
Summary of distance and time of public transport routes in Chillán and Chillán Viejo cities.
To characterize the baseline operation, an average operating speed vavg = 25 km/h is assumed, consistent with urban bus studies in which typical operating speeds range from 20 to 30 km/h [35]. For each line i, the travel time per complete round trip is estimated as
where di is the round-trip distance reported in Table 1, the service frequency ranges from 5 to 15 min, and the operating hours extend from approximately 6:00 a.m. to 9:00 p.m., depending on the line (Table 2).
Table 2.
Bus schedules and frequency.
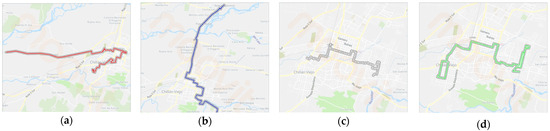
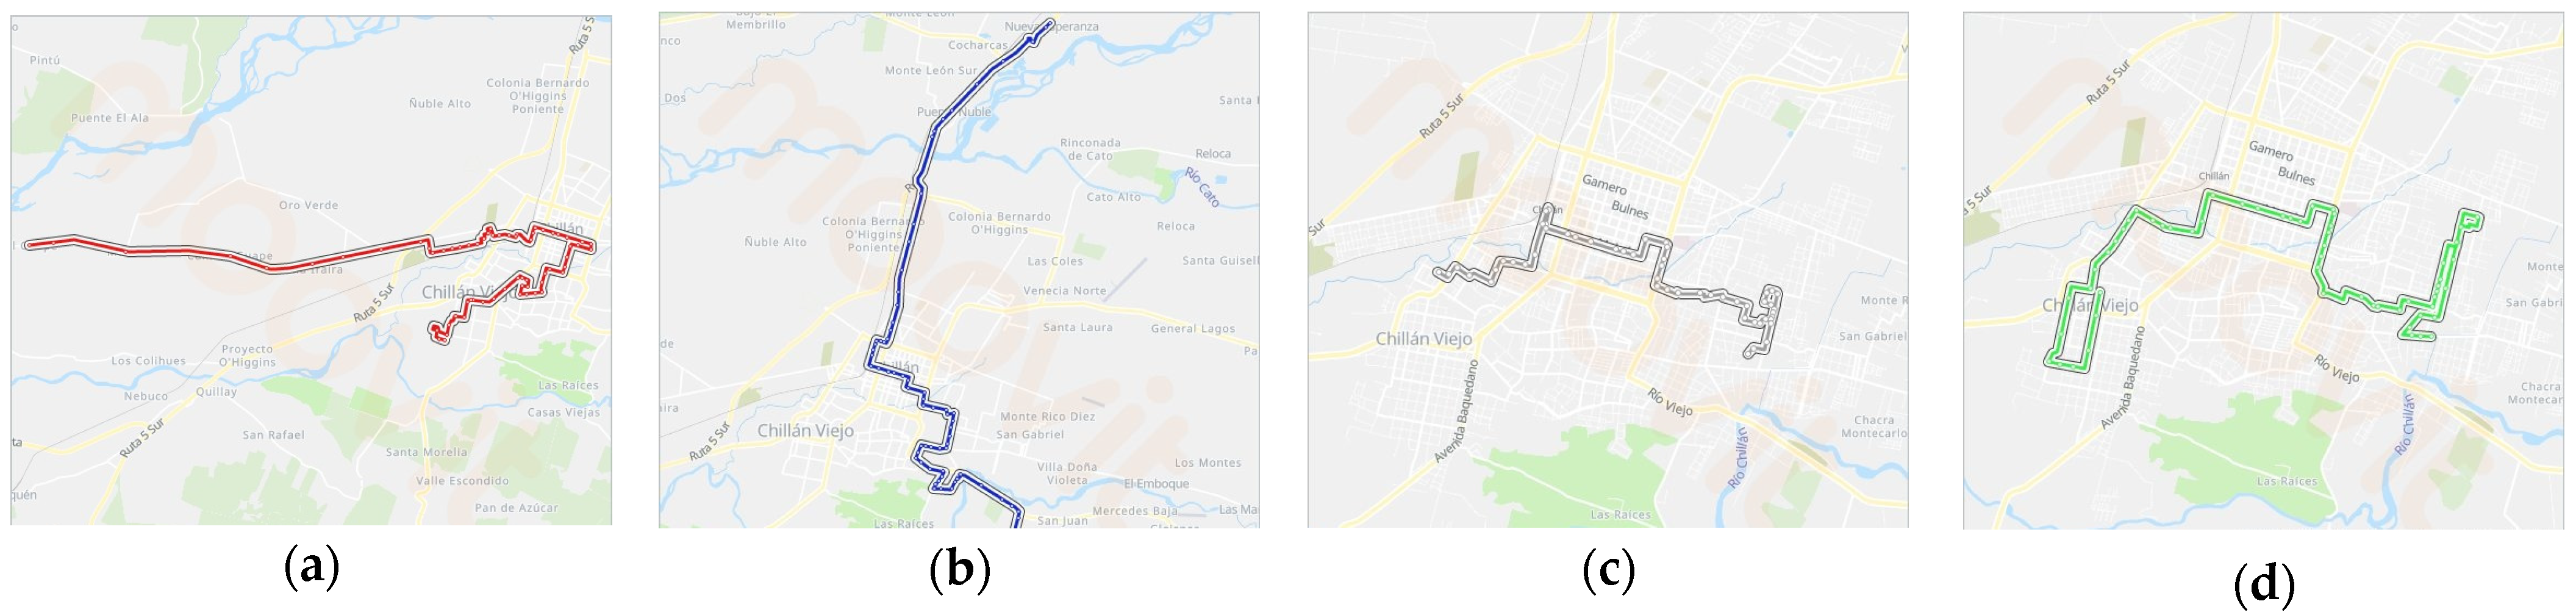
Figure 5 shows the representative routes of lines 1, 4, 6, and 8. Only one route is shown for each line, representing just one of the bus trips (R1) and not the total route.
Figure 5.
Routes of bus lines 1 (a), 4 (b), 6 (c), and 8 (d).
These routes illustrate the two extremes: the shortest line (c), which covers the entire urban center of the city of Chillán, and the longest line (b), which reaches towns located a considerable distance from the city center.
To estimate daily service intensity, Table 3 reports the fleet assigned to each line (Nbus,i) and the corresponding total number of daily departures (Ndep,i) with the number of routes (NR). The average number of complete round trips per bus is computed as
Table 3.
Summary of departures from public transport routes in Chillán and Chillán Viejo cities.
Because complete round trips are indivisible, an integer allocation is considered by defining
where Niextra is the number of buses that must perform one additional round trip (nibase + 1) to meet the required daily departures, while the remaining Nbus,i-Niextra buses perform nibase round trips. Under this formulation, the daily vehicle-kilometers traveled (VKT) per line can be expressed as
These characteristics reflect an intensive mobility scheme, with high vehicle turnover and broad territorial coverage—conditions that are critical for evaluating the technical and economic feasibility of a future transition to electric fleets. Furthermore, it is assumed that all declared buses are operational and run their routes equitably each day.
The departures reported in Table 3 correspond to scheduled one-way trips across the route variants of each line. Equivalent service cycles per bus are estimated from the aggregated daily service demand of each line. For lines with two route variants, both directions are assumed to be operationally equivalent, whereas for lines with three route variants, the service is approximated as a closed circuit: R1 → R2 → R3 → R1.
Considering the total travel time and total mileage, baseline daily operating costs were estimated from fuel consumption. As a representative example of the local diesel fleet, one of the buses operated in Chillán is the Volkswagen 9.160 OD, equipped with a 150 L fuel tank. Since fuel efficiency depends on vehicle type, driving style, passenger load, weather conditions, and operating speed, we adopted a representative diesel bus efficiency range of 2.5–4.0 km/L and used an average value of η = 3.25 km/L for route-level cost estimation [33]. Under this assumption, the reference autonomy of the Volkswagen 9.160 OD is approximately 488 km per tank (150 × 3.25 = 487.5 km), which was used as a baseline for comparison with the electric bus operating ranges discussed in the following sections.
For each line i, the fuel consumption per round trip (Fi) is estimated as
where di is the round-trip distance of the route. To estimate the fuel cost per trip for each line, a direct fuel-price method was adopted instead of using external fleet cost benchmarks. Using the representative diesel bus efficiency assumed in this study (η = 3.25 km/L), the fuel cost per kilometer is computed as
where Pf is the diesel fuel price (per liter), obtaining a cost per kilometer of 0.327 USD/km. The fuel cost per round trip for line i is then calculated as
The resulting estimates were used to compute route-level fuel costs, which are summarized in Table 4 in both USD and CLP (using the exchange rate at the time of analysis).
Table 4.
Distance and cost per trip of the different bus lines in Chillán 1.
4. Charging Demand and Infrastructure Requirements for Electric Bus Integration
The estimated charging-time availability and infrastructure requirements for electric buses using the operational baseline derived in Section 3 are reported in this section. First, projections are presented for the growth of the electric bus fleet, the number of charging points, and installed charging capacity across multiple scenarios. Next, a case study is evaluated in which 10 electric buses are introduced into Line 13 in Chillán (Ñuble Region), enabling an initial estimate of daily energy demand under two charging strategies: (i) 100% overnight depot charging and (ii) 80% overnight charging complemented by opportunity charging. Finally, the implications of both strategies are used to derive upper and lower bounds for the power required by a charging infrastructure dedicated to electric buses.
4.1. Projections of Buses, Chargers, and Installed Power
The projections presented in this subsection are based on the Long-Term Energy Plan (PELP) [38] and a study released by the National Electricity Coordinator [39]. Four electric bus adoption scenarios are considered: one policy-driven scenario from the PELP and three additional scenarios derived from the National Electricity Coordinator study, namely optimistic, baseline, and pessimistic. In the latter source, these scenarios are defined according to the electric bus share of the total projected bus fleet in 2050, corresponding to 30%, 20%, and 10%, respectively. The analysis assumes an initial deployment of 10 electric buses in 2026, with electric buses progressively replacing internal combustion buses on a one-to-one basis. To characterize the evolution of the total bus fleet, the regional fleet is approximated by a linear growth trend derived from historical fleet data [40], yielding an average annual increase of approximately 11 buses. In parallel, the number of electric buses is projected for each scenario using an exponential adoption model:
where a is the initial number of electric buses (10 in 2026), y is the target number of electric buses, t is the time horizon (years), and b is the scenario-specific growth rate. Table 5 summarizes the resulting parameters for each scenario [38,39]. Since the electric fleet cannot exceed the total fleet, the exponential trajectories are capped once the electric share reaches 100%, after which fleet growth follows the baseline linear trend of the total bus fleet.
Table 5.
Growth rate for electric buses for different scenarios.
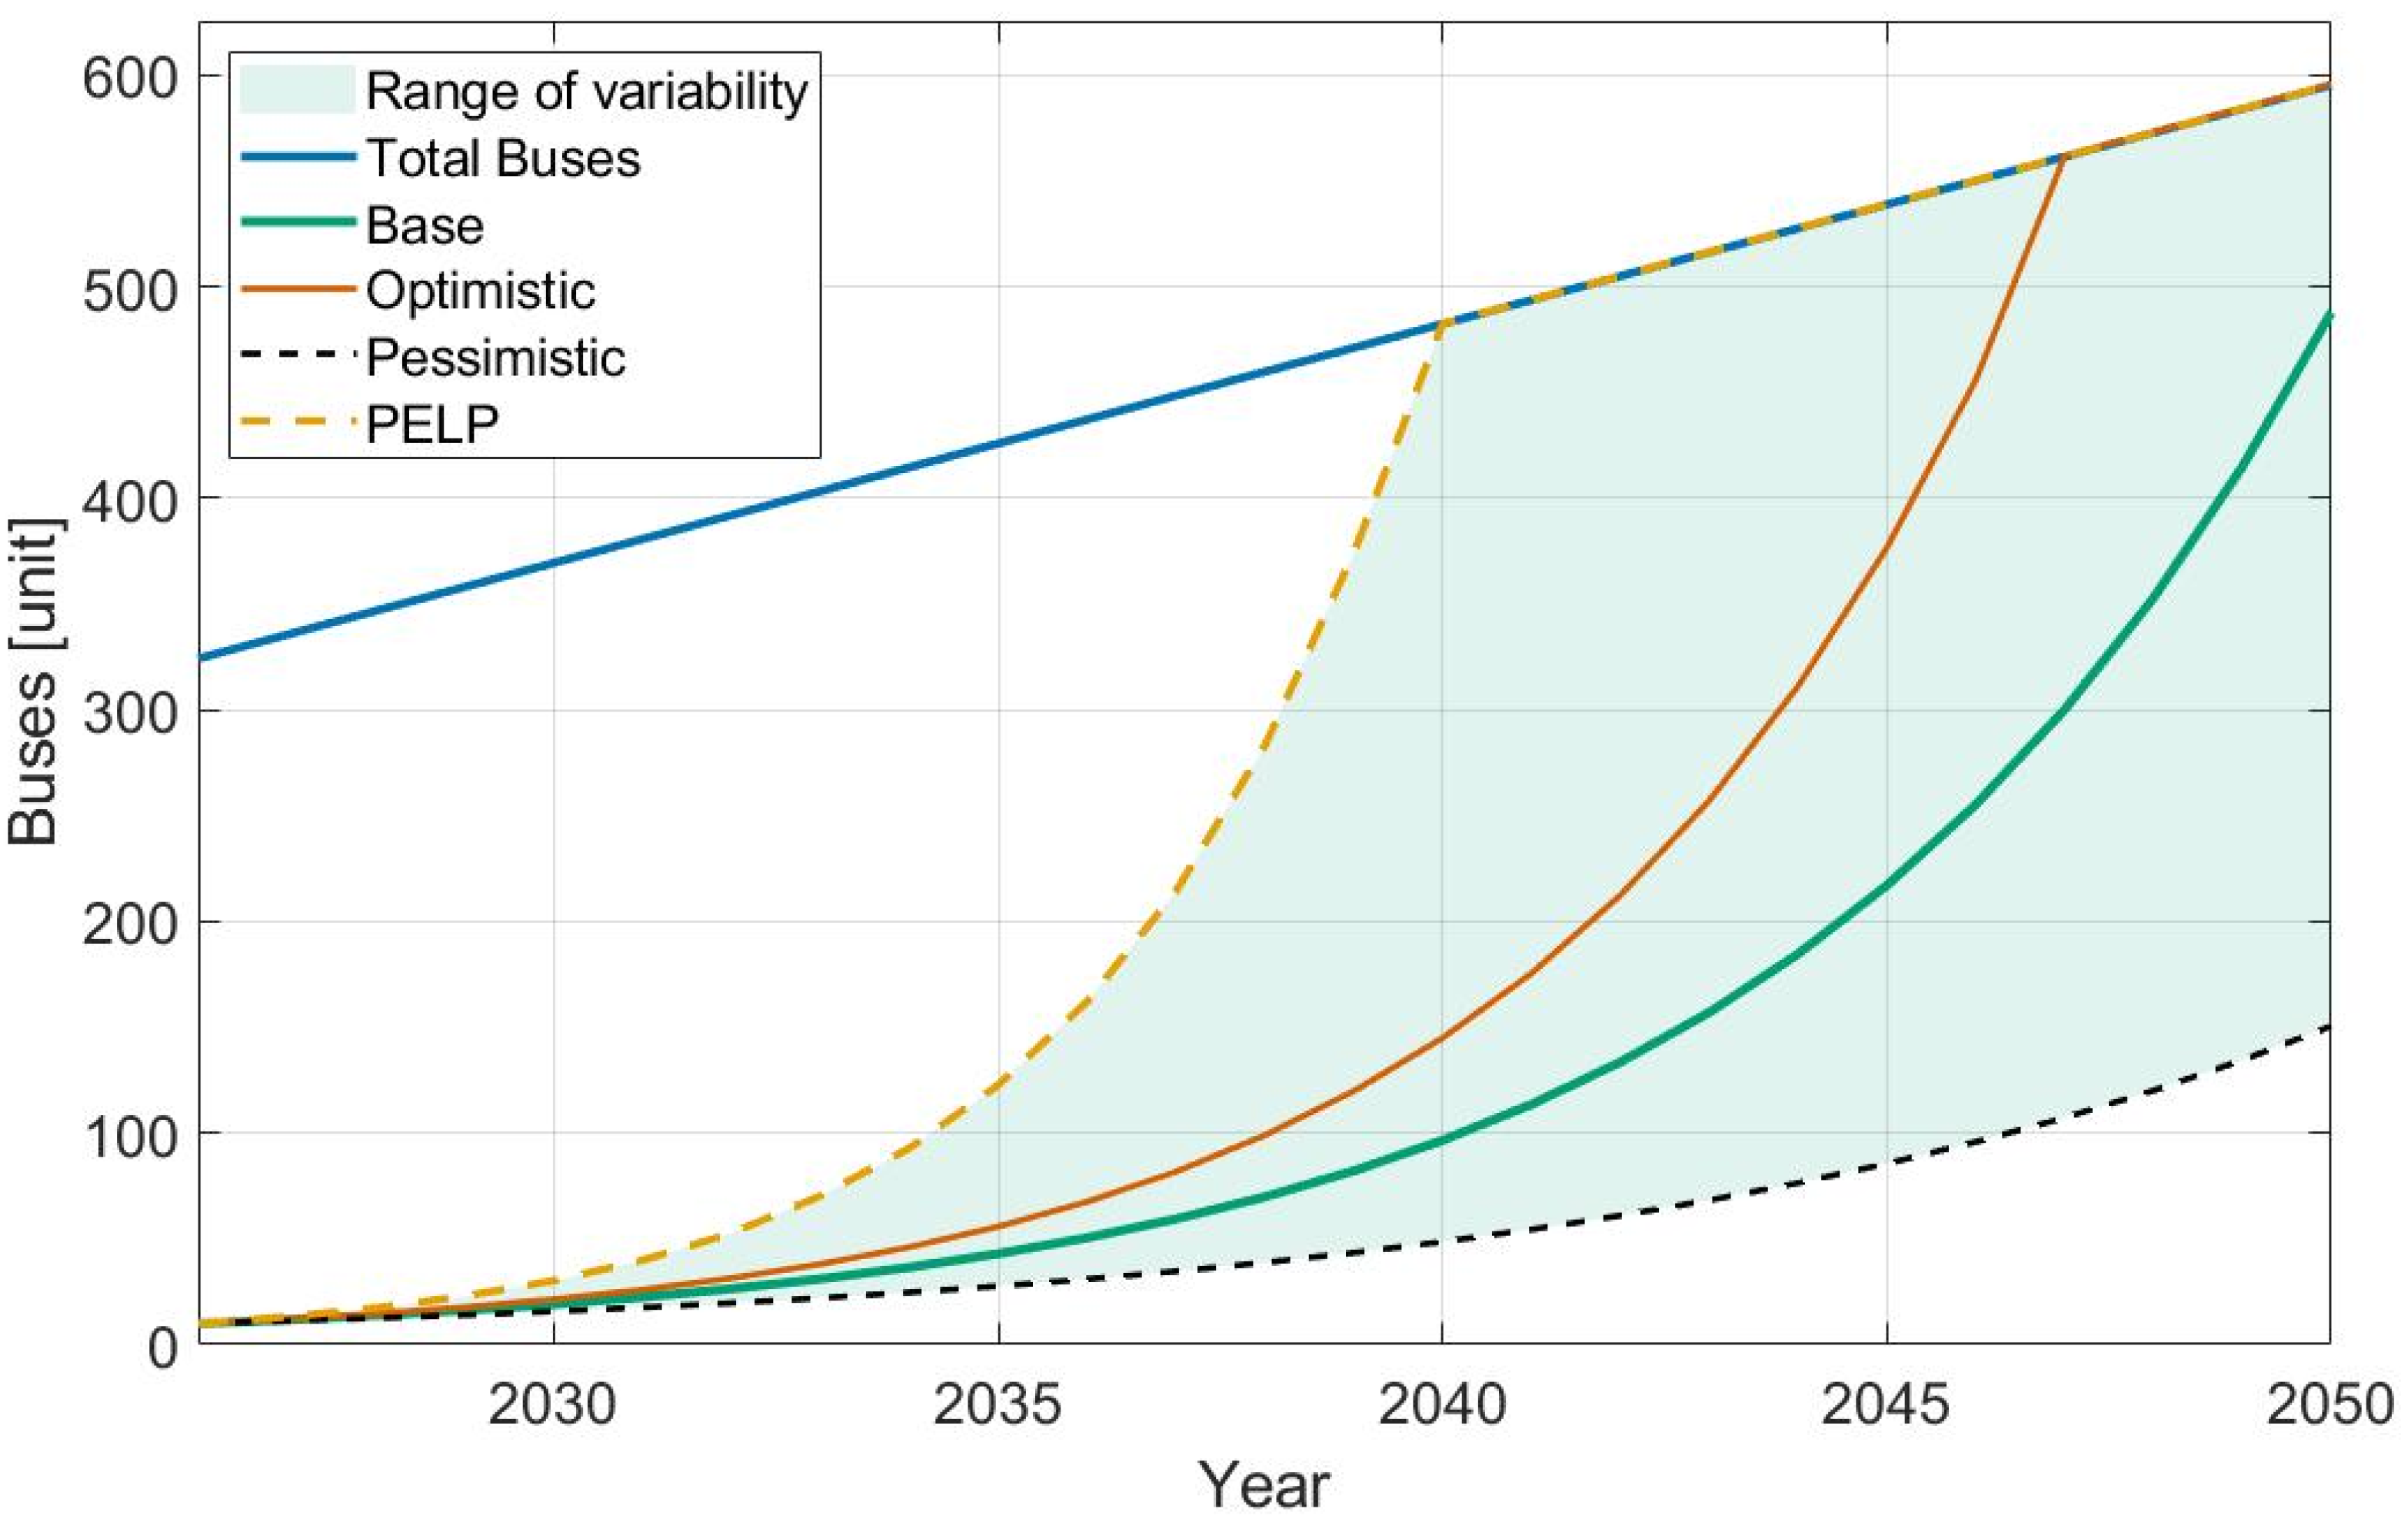
For the PELP case, the exponential growth rate b is calibrated using the long-term trajectory reported up to 2060 (i.e., t = 24 years from 2026). However, electric bus adoption is capped at the total fleet size; therefore, on the PELP trajectory, electrification reaches 100% earlier (around 2040) and remains saturated thereafter.
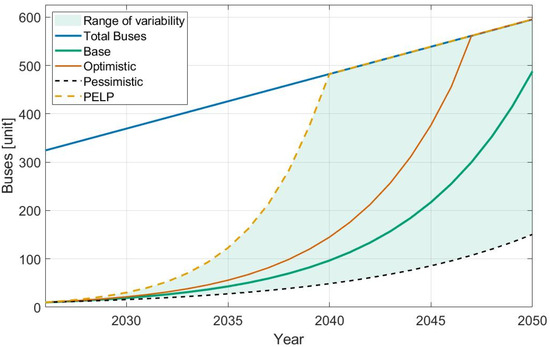
Figure 6 compares the scenario trajectories against the projected total number of buses. It is important to note that once electric buses completely replace combustion buses, their growth ceases to be exponential, as it follows the natural growth rate of the total bus fleet.
Figure 6.
Electric bus projections for different scenarios.
This figure shows that in the PELP scenario, full electrification is achieved by 2040, whereas the National Electricity Coordinator scenarios are more conservative, with full electrification delayed (e.g., reached around 2047 in the optimistic case). In the pessimistic scenario, by 2050, full adoption is far from complete, illustrating a wide range of plausible outcomes driven by policy implementation and deployment pace.
Regarding charging infrastructure, transport-sector electricity-demand scenarios from the PELP are used as a proxy to project the growth of charging points and installed charging capacity. Although the National Electricity Coordinator study provides projections for electric bus adoption, it does not provide directly comparable projections for charging-demand growth and charging infrastructure deployment in the form required for this analysis. For this reason, the PELP demand scenarios were selected for the infrastructure projection, as they provide a more complete and up-to-date basis to estimate the growth of charging points and installed capacity under the assumption that both scale proportionally with transport-sector electricity demand. Table 6 reports the transport-sector final energy demand and the electricity component for the accelerated transition, carbon neutrality, and recovery scenarios, using 2020 and 2023 values from Energía Abierta (Ministry of Energy) and the PELP target values for 2060 [38,41].
Table 6.
Transport-sector final energy and electricity consumption scenarios.
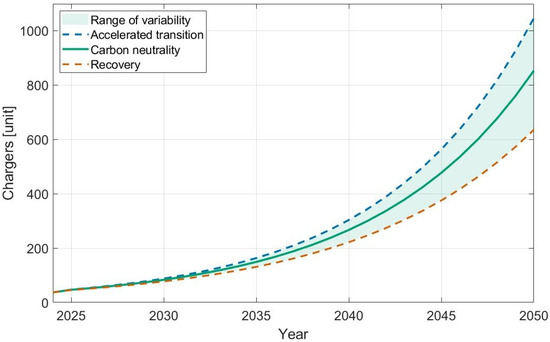
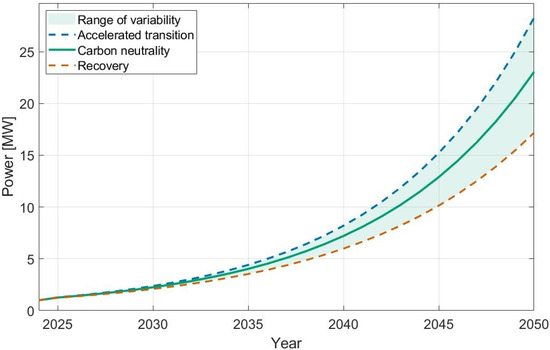
The corresponding exponential growth parameters are summarized in Table 7. It is assumed that both the number of public chargers and the installed charging capacity scale proportionally with transport-sector electricity demand; therefore, the growth rates in Table 7 are applied to project these quantities [38]. Based on these growth rates, projections are anchored to the SEC registry up to 2024 (the installed capacity for 2025 is not consistently reported) [42]. Figure 7 and Figure 8 present the projected number of chargers and installed capacity, respectively, for the considered scenarios.
Table 7.
Exponential growth parameters for transport electricity consumption scenarios.
Figure 7.
Projected number of public chargers under PELP transport electricity-demand scenarios (accelerated transition, carbon neutrality, and recovery).
Figure 8.
Projected installed charging capacity under PELP transport electricity-demand scenarios (accelerated transition, carbon neutrality, and recovery).
Under these assumptions, the projected number of chargers ranges from 634 to 1046, while installed capacity ranges from 17.2 MW to 28.3 MW by 2050 (Figure 7 and Figure 8).
The Line 13 case study presented in the following subsection is not an isolated exercise but a pilot application of the broader framework. The aggregate projections define the long-term scenario context for electric bus adoption, charger demand, and installed capacity, whereas the Line 13 analysis provides the route-level energy and charging-power reference for an initial 10-bus deployment. In this way, the corridor-level case study supports the interpretation and scaling of the broader projections shown in Figure 6, Figure 7 and Figure 8.
4.2. Case Study: 10 Electric Buses on Line 13
This subsection evaluates a case study in which 10 electric buses are introduced into Line 13 in Chillán in 2026. The following assumptions are adopted:
- Nbus = 10 electric buses are integrated into Line 13 in 2026.
- Charger rated power: Pch = 150 kW.
- The bus to be used will be the Zhong Tong Bus model, which is 10.5 m long and has a 315 kWh battery and a range of 280 km [43]. Overnight charging window: Hc = 9 h 20 min ≈ 9.33 h (first departure 7:00 a.m.; last arrival 9:37 p.m.).
The present estimate is based on nominal vehicle specifications reported by the manufacturer and on the operational baseline of the selected route. Therefore, the analysis does not explicitly model second-order physical and operating effects such as road gradient, ambient temperature, auxiliary loads, battery degradation, and other real-world factors that may affect vehicle energy consumption. In this sense, the results should be interpreted as a preliminary planning estimate rather than as a detailed vehicle-dynamics simulation. More detailed route- and vehicle-simulation approaches, such as seen in [18], explicitly incorporate speed profiles, elevation profiles, auxiliary loads, and charging availability along the route, illustrating a different methodological layer from the one addressed in the present work.
The charging levels considered in this study are used as planning scenarios rather than universal operational standards. Scenario A (100% overnight depot charging) represents a conservative upper-bound case for depot power sizing, assuming full overnight replenishment of the battery. Scenario B (80% overnight charging complemented by opportunity charging) represents a lower-bound mixed strategy intended to reduce depot power requirements while shifting part of the energy delivery to daytime charging opportunities. This comparison is consistent with the distinction between depot-oriented and opportunity-oriented charging approaches discussed in the literature and in real-world public transport implementations such as EMT Madrid [11]. In addition, similar charging regimes have been considered in the Chilean technical context, including full-capacity charging and 80–20% operating cycles with opportunity charging, as reported in the CIGRE Chile study on the impact of electric public transport development on the Chilean power system [44].
4.2.1. Scenario A: 100% Overnight Depot Charging
Overnight charging is assumed to take place during off-peak hours to reduce daytime peak demand. The total energy that a single charger can deliver during the overnight window is
Assuming a full charge per bus (from 0 to 100% for a conservative upper bound), the energy required per charging session is Ec = Ebat = 315 kWh. The number of full charging sessions that one charger can supply overnight is, therefore,
Since the number of charging sessions must be an integer, Cd = ⌊4.44⌋ = 4 full charges per charger per night.
The required installed power to charge all buses overnight fully can be expressed as
Given that chargers are installed in discrete 150 kW units, the minimum practical configuration is three chargers (total installed power Pinst = 3 × 150 = 450 kW), which provides sufficient overnight capacity for the 10-bus case study.
The daily energy demand at the terminal (assuming each bus is fully charged once per day) is
The corresponding annual energy demand is
4.2.2. Scenario B: 80% Overnight Charging + Opportunity Charging
In this scenario, buses are charged overnight up to an 80% state of charge, and the remaining energy is supplied via opportunity charging during daytime idle periods. The energy required per bus for the overnight charge is
Using the same overnight charging window (Hc ≈ 9.33 h) and charger power (Pch = 150 kW), the total energy delivered by a single charger overnight remains
The number of full overnight charging sessions per charger is therefore
The required terminal power to supply overnight charging for all buses is
Given discrete charger units, this corresponds to a minimum of two 150 kW chargers, i.e., an installed power Pinst = 300 kW for the overnight component.
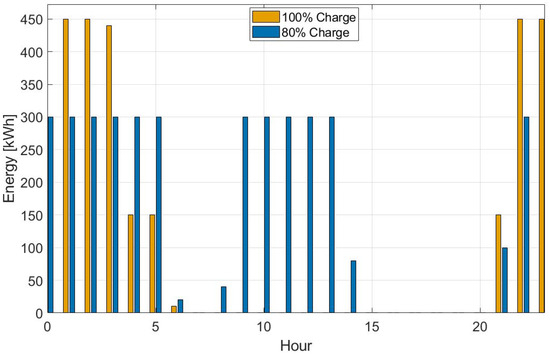
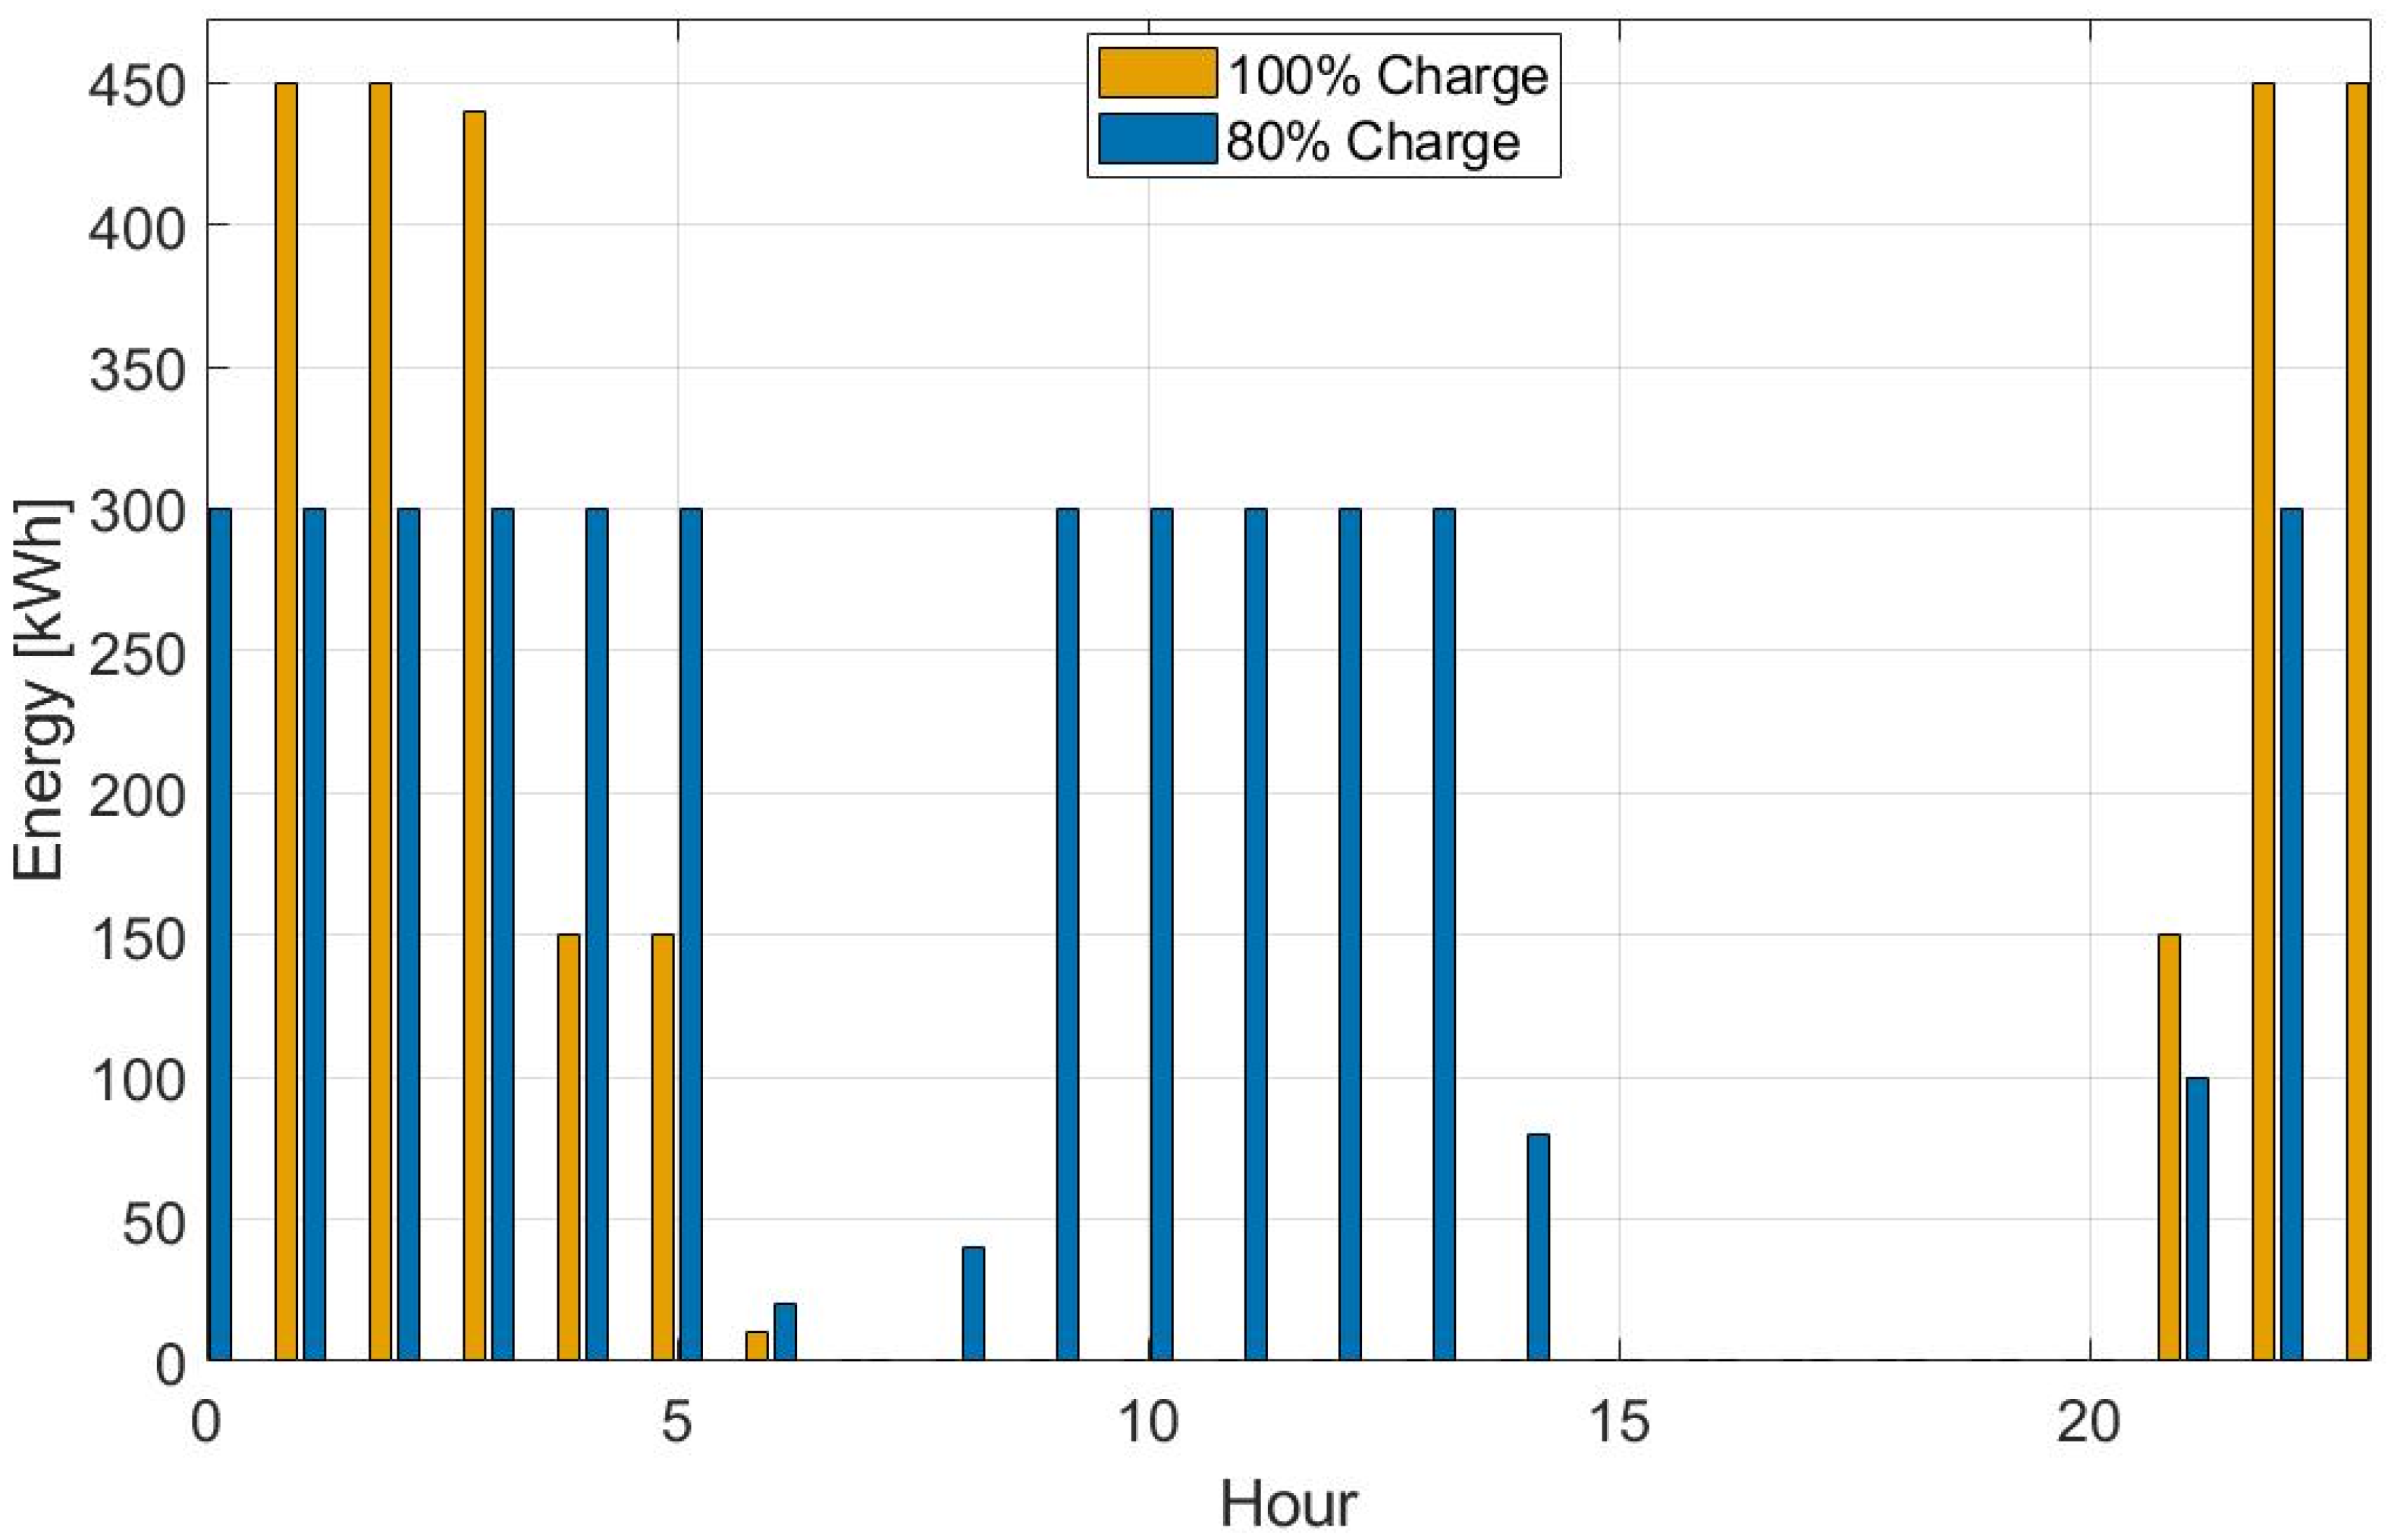
Figure 9 compares the hourly energy demand profiles of Scenario A (100% overnight charging) and Scenario B (80% overnight + opportunity charging) over a representative day. While both strategies deliver the same total daily energy to the fleet under the assumed charging targets, they differ in the temporal allocation of demand. Full overnight charging concentrates energy delivery during off-peak hours, increasing the operational buffer for daytime service. In contrast, partial overnight charging reduces the required depot power and may reduce high-SOC operation but shifts part of the energy delivery to daytime opportunity charging, which may increase daytime power demand. This approach should therefore be assessed carefully against local grid conditions. These trade-offs between depot charging and opportunity charging have been reported in real-world implementations (e.g., EMT Madrid), where infrastructure placement and charging strategy selection directly affect operational flexibility and grid-impact profiles [11]. The qualitative behavior shown in Figure 9 is therefore consistent with the state of the art, in which depot charging concentrates demand during off-peak periods, whereas mixed charging strategies shift part of the energy delivery to daytime operation in exchange for lower depot power requirements [11,44].
Figure 9.
Daily energy demand.
Although the operational context of Madrid differs substantially from that of Chillán and Chillán Viejo, this reference is used here as qualitative methodological support for the comparison between charging strategies, rather than as a directly transferable benchmark.
4.3. Comparison of Charging Strategies and Infrastructure Implications
Finally, from the case study, the equivalent installed power per bus is approximately 45 kW/bus for Scenario A (450 kW for 10 buses) and 30 kW/bus for Scenario B (300 kW for 10 buses). These bounds are used to project the installed charging power required exclusively for electric buses under the four fleet-adoption scenarios described in Section 4.1.
The two charging strategies lead to different power requirements and operational trade-offs. Scenario A (100% overnight depot charging) concentrates energy delivery during off-peak hours and yields a higher installed power in the charger stations due to charger discretization (450 kW for the 10-bus case). Scenario B (80% overnight + opportunity charging) reduces the installed depot power (300 kW for the 10-bus case) but shifts part of the energy delivery to daytime opportunity charging, which may increase daytime power demand and requires suitable dwell times and operational coordination. Similar trade-offs between depot and opportunity charging have been reported in real-world implementations (e.g., EMT Madrid), where charging strategy selection affects operational flexibility and infrastructure needs [11].
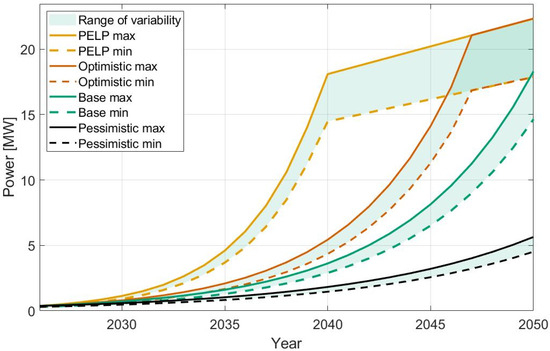
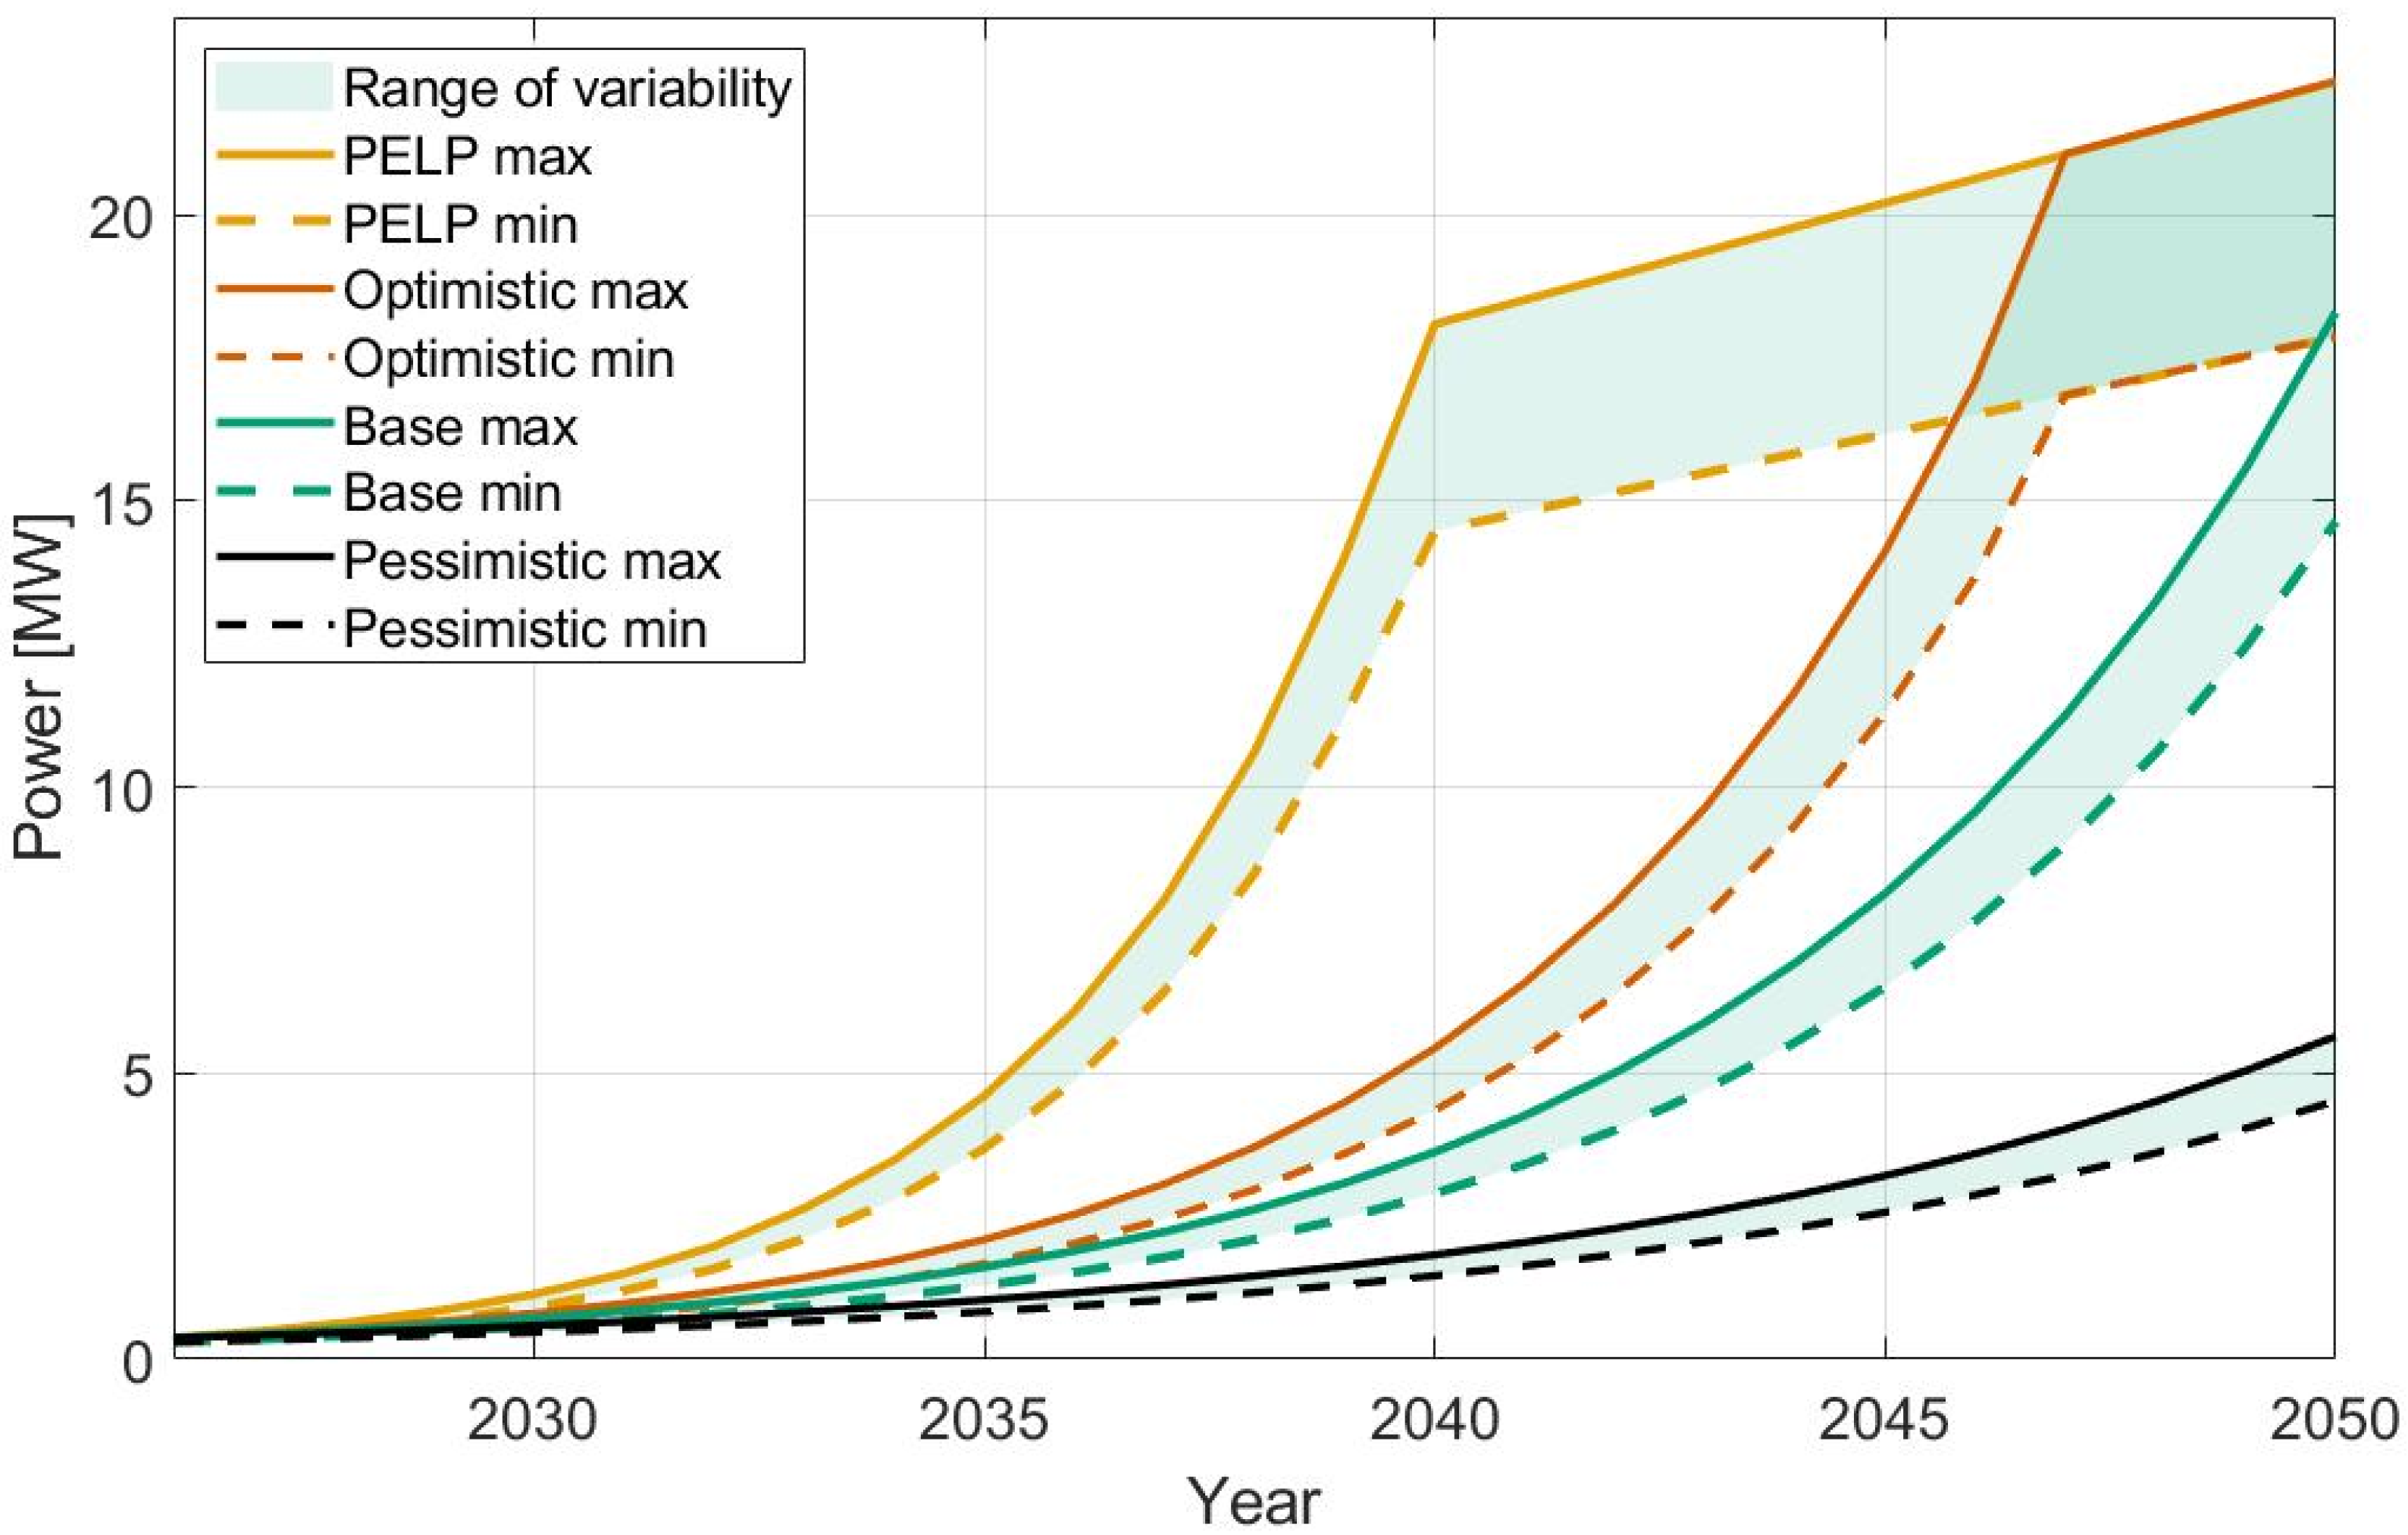
Figure 10 presents the resulting range of installed power requirements up to 2050, showing that total bus-dedicated charging power may reach approximately 22.35 MW in the most aggressive scenario and 4.52 MW in the most conservative scenario. The widening gap between the minimum and maximum curves reflects the cumulative effect of charging-strategy assumptions as fleet electrification progresses. In the early years, the difference remains limited because the number of electric buses is still relatively small, but the gap becomes more pronounced toward 2050 as larger fleet sizes amplify the impact of the per-bus charging-power envelope derived from Scenarios A and B. This result indicates that charging-strategy selection has a limited influence on infrastructure sizing in the initial deployment stage but becomes increasingly important in long-term planning, particularly under the more aggressive electrification pathways.
Figure 10.
Power projections for charging infrastructure for electric buses.
Although a full parametric sensitivity analysis is beyond the scope of this work, the two charging scenarios provide a first-order sensitivity envelope for the case study. The comparison shows that varying the overnight charging target and the reliance on opportunity charging directly affects the number of effective charging sessions, the required depot power, and the final installed capacity. This confirms that charger power, charging window, and charging strategy are key factors that must be explicitly considered in preliminary electric bus infrastructure planning.
To facilitate interpretation and reuse of these results, Table 8 summarizes the key assumptions and outputs of the Line 13 case study for both charging strategies. The table consolidates the overnight energy deliverable per charger (ETC), the number of full charging sessions achievable within the overnight window (Cd), and the resulting required and discretized installed power (Preq and Pinst). It also reports the daily and annual energy delivered to the fleet (Eday and Eyear) with normalized indicators (kWh/bus·day and kW/bus) that enable direct scaling to larger fleet-adoption scenarios.
Table 8.
Summary of key assumptions and outputs for the Line 13 case study (10 e-buses, 2026).
Beyond summarizing the case-study outputs, Table 8 highlights the practical contribution of the proposed framework by translating the comparison between depot-only and mixed charging strategies into scalable planning indicators. In particular, the normalized values reported in the table (kWh/bus·day and kW/bus) make it possible to connect route-level operational sizing with long-term infrastructure projections. This is consistent with recent literature showing that electric bus deployment depends not only on fleet-level targets but also on the interaction between charging strategy, charger utilization, and route-level operational constraints [11,12,13,14].
5. Conclusions and Future Work
This paper reports an initial estimate of the energy demand and charging power requirements for the initial replacement of an existing fleet of internal combustion engine transport buses with battery electric buses, based on the operational baseline described in Section 3 and simplified energy and time constraints, in the cities of Chillán and Chillán Viejo in the Ñuble Region, Chile.
In particular, for the Line 13 case study corridor, the initial deployment of 10 electric buses would require an installed depot charging power between 300 and 450 kW, depending on the charging strategy, with an annual delivered energy of 1149.75 MWh. Under the different scenarios of charge planted, the estimated power charging infrastructure could require between 4.52 MW and 22.35 MW by 2050.
This range should not be interpreted as a universal electric bus demand value but as a corridor-specific infrastructure-sizing envelope derived from two alternative charging strategies applied to the same operational baseline. Its relevance lies in showing that charging strategy selection can change the required installed depot power by 50% even when the delivered annual energy remains the same, which has direct implications for charger discretization, depot design, and long-term infrastructure scaling.
The results show that the number of chargers required for the first 10 years, approximately 170 until 2035, does not vary significantly across the different scenarios; this also affects the required power. Subsequently, the differences become significant, especially for 2050. Furthermore, two battery-charging scenarios for electric buses are analyzed, providing an interesting perspective by considering full or partial (80%) nighttime charging. The latter is complemented by daytime opportunity charging to achieve greater bus coverage at night. The scenario adopted will ultimately depend on the robustness of the electrical grid and on the negotiated electricity tariff.
While the framework is designed for preliminary sizing and scenario comparison, several limitations should be noted: (i) the load is modeled using a fixed nighttime window and fixed charging power without explicitly modeling scale variability or stochastic service delays; (ii) the analysis assumes that the opportunity load in Scenario B can reliably supply the remaining daily energy, which in practice depends on dwell times and operational scheduling; and (iii) grid constraints (transformer/feeder limits, voltage drop, and power quality impacts) are not explicitly modeled and must be assessed in association with electric utility at a later stage. (iv) The route-level energy estimate is based on nominal vehicle specifications and simplified operating assumptions, without explicitly accounting for gradients, ambient temperature, auxiliary loads, battery degradation, or other real-world factors that may modify actual bus energy consumption.
The framework proposed in this work is replicable at the methodological level, but not directly transferable in numerical terms. Its application to other cities requires recalibration of operational and technical inputs, including route geometry, service schedules, battery capacity, charger ratings, and local grid conditions. For this reason, the contribution of the present study lies in the planning workflow and sizing logic, while the resulting power and energy values remain case-specific.
Future work should include (i) calibration using operator GPS/GTFS data to refine cycle times, dwell times, and energy per kilometer under local conditions; (ii) integration of charger scheduling optimization and state of charge (SoC) constraints to reduce peak power while maintaining service reliability; and (iii) assessment of the grid impact and design of station infrastructure at the site level, including transformer sizing and protection requirements.
Technical roadmap: As a practical planning workflow, the proposed approach can be implemented as follows: gathering baseline data → defining the scenario → pilot sizing (station energy and power) → comparing strategies (nighttime charging only vs. mixed) → scaling to 2050 power envelopes → grid validation and implementation design.
Author Contributions
Conceptualization, E.C. and E.E.; methodology, E.C.; software, R.L.F., F.M.S. and R.L.; validation, S.E.R., J.C.H., F.M.S. and E.C.; formal analysis, E.C., E.E. and R.L.F.; investigation, E.E.; resources, G.R.; data curation, E.C. and E.E.; writing—original draft preparation, E.E., R.L.F. and G.R.; writing—review and editing, M.A., C.L.V. and S.E.R.; visualization, R.L.F., M.A. and R.L.; supervision, J.C.H. and C.L.V.; project administration, G.R.; funding acquisition, E.E. All authors have read and agreed to the published version of the manuscript.
Funding
This research was funded by GORE Ñuble under grant number FIC-R 40050692-0, “Plan de acción para adopción de la electromovilidad en Ñuble”.
Institutional Review Board Statement
Not applicable.
Informed Consent Statement
Not applicable.
Data Availability Statement
All data are available in the manuscript.
Acknowledgments
The work was supported by “Centro de Energía UCSC” and the authors also acknowledge the support provided by the Thematic Network 723RT0150 “Red para la integración a gran escala de energías renovables en sistemas electricos (RIBIERSE-CYTED)” financed by the call for Thematic Networks of the CYTED (Ibero-American Program of Science and Technology for Development) for 2022.
Conflicts of Interest
The authors declare no conflicts of interest.
References
- Global Climate Change (NASA). The Causes of Climate Change. Available online: https://climate.nasa.gov/causes/ (accessed on 29 September 2025).
- UN Environment Programme. Facts About the Climate Emergency. Available online: https://www.unep.org/explore-topics/climate-action/facts-about-climate-emergency (accessed on 29 September 2025).
- Lew, D.; Bakke, J.; Bloom, A.; Brown, P.; Caspary, J.; Clack, C.; Miller, N.; Orths, A.; Silverstein, A.; Simonelli, J.; et al. Transmission Planning for 100% Clean Electricity: Enabling Clean, Affordable, and Reliable Electricity. IEEE Power Energy Mag. 2021, 19, 56–66. [Google Scholar] [CrossRef] [Scilit]
- Coordinador Eléctrico Nacional. Available online: https://www.coordinador.cl/wp-content/uploads/2025/04/CEN-hist_gen_de_energia_por_tecnologia.xlsx (accessed on 29 September 2025).
- Comisión Nacional de Energia, Chile. Energy National Balance 2023. Available online: http://energiaabierta.cl/visualizaciones/balance-de-energia/ (accessed on 29 September 2025).
- Ministerio del Medio Ambiente. Sistema Nacional de Inventarios de Gases de Efecto Invernadero. Available online: https://snichile.mma.gob.cl/sector-energia/ (accessed on 29 September 2025).
- International Energy Agency, Global EV Outlook 2025. Available online: https://iea.blob.core.windows.net/assets/7ea38b60-3033-42a6-9589-71134f4229f4/GlobalEVOutlook2025.pdf (accessed on 6 March 2026).
- Organización Latinoamericana y Caribeña de la Energía, Libro Blanco de la Movilidad Sostenible en América Latina y el Caribe–2025. Available online: https://www.olade.org/wp-content/uploads/2025/10/Libro-Blanco-Espanol-DIGITAL-Ultima-version.pdf (accessed on 6 March 2026).
- Lou, J.; Shen, X.; Niemeier, D.A.; Hultman, N. Income and racial disparity in household publicly available electric vehicle infrastructure accessibility. Nat. Commun. 2024, 15, 5106. [Google Scholar] [CrossRef] [Scilit] [PubMed]
- Russo, S.; Spiller, B.; Wilwerding, R. Equity in Electric Vehicle Charging Infrastructure; No. 24-14; Resources for the Future: Washington, DC, USA, 2024; Available online: https://www.rff.org/documents/4589/WP_24-14.pdf (accessed on 29 September 2025).
- López, I.; Calvo, P.L.; Fernández-Sánchez, G.; Sierra, C.; Corchero, R.; Chacón, C.O.; Juan, C.D.; Rosas, D.; Burgos, F. Different Approaches for a Goal: The Electrical Bus-EMT Madrid as a Successful Case Study. Energies 2022, 15, 6107. [Google Scholar] [CrossRef] [Scilit]
- Rodrigues, G.S.; Reis, J.G.M.D.; Orynycz, O.; Tucki, K.; Machado, S.T.; Raymundo, H. A Study on the Viability of Adopting Battery Electric Vehicles in Bus Rapid Transit in Brazil Using the AHP Method. Energies 2023, 16, 4858. [Google Scholar] [CrossRef] [Scilit]
- Lazzeroni, P.; Caroleo, B.; Arnone, M.; Botta, C. A Simplified Approach to Estimate EV Charging Demand in Urban Area: An Italian Case Study. Energies 2021, 14, 6697. [Google Scholar] [CrossRef] [Scilit]
- Hu, M.; Yuan, Y.; Wang, Z.; Wang, X.; Zhang, W.; Chen, W.; Xu, C. TCO analysis of commercial vehicles considering refined temperature impacts across various provinces in China. Energy Sustain. Dev. 2025, 87, 101726. [Google Scholar] [CrossRef] [Scilit]
- Micari, S.; Polimeni, A.; Napoli, G.; Andaloro, L.; Antonucci, V. Electric vehicle charging infrastructure planning in a road network. Renew. Sustain. Energy Rev. 2017, 80, 98–108. [Google Scholar] [CrossRef] [Scilit]
- Behnia, F.; Schuelke-Leech, B.-A.; Mirhassani, M. Optimizing sustainable urban mobility: A comprehensive review of electric bus scheduling strategies and future directions. Sustain. Cities Soc. 2024, 108, 105497. [Google Scholar] [CrossRef] [Scilit]
- Shah, H.; Gadepalli, R.; Lakshay; Cats, O. Integrated charging facility planning and charging scheduling for a rural battery electric bus system. J. Public Transp. 2026, 28, 100156. [Google Scholar] [CrossRef] [Scilit]
- de Saxe, C.; Ainalis, D.; Miles, J.; Greening, P.; Gripton, A.; Thorne, C.; Cebon, D. An electric road system or big batteries: Implications for UK road freight. Transp. Eng. 2023, 14, 100210. [Google Scholar] [CrossRef] [Scilit]
- Ministerio de Energía, Chile. National Electromobility Strategy. Available online: http://biblioteca.digital.gob.cl/handle/123456789/3773 (accessed on 29 September 2025).
- Ministerio de Desarrollo Social y Familia, Chile. Chile Agenda 2030 Sustainable Development Goals. Available online: http://www.chileagenda2030.gob.cl/ (accessed on 29 September 2025).
- Ministerio de Energía, Chile. Chilean Energy Policy. Available online: https://www.energia.gob.cl/sites/default/files/energia_2050_-_politica_energetica_de_chile.pdf (accessed on 29 September 2025).
- Ministerio de Energía, Chile. National Green Hydrogen Strategy. Available online: https://energia.gob.cl/sites/default/files/national_green_hydrogen_strategy_-_chile.pdf (accessed on 29 September 2025).
- Ministerio de Energía, Chile. Energy Efficiency Law. Available online: https://bcn.cl/2nn0z (accessed on 29 September 2025).
- Ministerio del Medio Ambiente, Chile. Climate Change Law. Available online: https://bcn.cl/32l1s (accessed on 29 September 2025).
- Ministerio de Energía, Chile. Storage and Electromobility Law. Available online: https://bcn.cl/39z5u (accessed on 29 September 2025).
- Ministerio de Energía and Ministerio de Transporte y Telecomunicaciones, Chile. Hoja de Ruta Para el Avance de la Electromovilidad en Chile. Available online: https://energia.gob.cl/sites/default/files/documentos/hoja_de_ruta_para_el_avance_de_la_electromovilidad_en_chile_acciones_concretas_al_2026.pdf (accessed on 30 September 2025).
- Asociación Nacional Automotriz de Chile A.G., Chile. Informe de Ventas Vehículos cero y Bajas Emisiones Enero 2026. Available online: https://www.anac.cl/wp-content/uploads/2026/02/01-ANAC-Informe-Cero-y-Bajas-Emisiones-Enero-2026_.pdf (accessed on 18 October 2025).
- Superintendencia de Electricidad y Combustibles. Manual del Instalador. Available online: https://www.sec.cl/sitio-web/wp-content/uploads/2020/08/Manual-de-Usuario-TE6-v2-2020.pdf (accessed on 21 October 2025).
- “Sistemas de Carga”, Plataforma de Electromovilidad, Ministerio de Energía. Available online: https://energia.gob.cl/electromovilidad/sistemas-de-carga/cargadores-publicos-y-privados (accessed on 21 October 2025).
- Chillán, Chile: Your Public Transport Guide. Available online: https://moovitapp.com/index/es-419/transporte_p%C3%BAblico-Chill%C3%A1n-4069 (accessed on 7 October 2025).
- Ministry of Energy, Government of Chile, Santiago, Chile. Energy Agenda 2022–2026. May 2022. Ministerio de Energía, Chile, Agenda de Energía 2022–2026. Available online: https://energia.gob.cl/sites/default/files/documentos/agenda_energia_2022_-_2026.pdf (accessed on 21 October 2025).
- Wołek, M.; Jagiełło, A.; Wolański, M. Multi-Criteria Analysis in the Decision-Making Process on the Electrification of Public Transport in Cities in Poland: A Case Study Analysis. Energies 2021, 14, 6391. [Google Scholar] [CrossRef] [Scilit]
- National Institute of Statistics—2017 Census-Regions, Provinces and Communes. Available online: https://ine-chile.maps.arcgis.com/apps/webappviewer/index.html?id=c2155cac57d04032bf6ca5f151cddd6d (accessed on 7 October 2025).
- Economic Characterization Report: Ñuble Region and Itata Province, Production Development Corporation (CORFO)—Directorate of Territorial Analysis, Networks and Territories Management, Santiago, Chile, September 2023. Corporación de Fomento de la Producción (CORFO), Informe de Caracterización Económica Región de Ñuble y Provincia de Itata. Available online: https://dataterritorios-admin.corfo.cl/document/9f1d2182-fe78-4f61-9577-5454eff44ce4 (accessed on 7 October 2025).
- Lunar, J.L.; Gutiérrez, B.; Barea, P.; Martínez, Ó. Estudio de Costes del Transporte Discrecional de Viajeros en Autocar: Memoria y Anexos; Tool Alfa S.L.: Madrid, Spain, 2019. [Google Scholar]
- Banco Central de Chile. Indicadores Diarios. Available online: https://si3.bcentral.cl/Indicadoressiete/secure/Indicadoresdiarios.aspx (accessed on 26 February 2026).
- Bencina en Línea. Comisión Nacional de Energía. Available online: https://www.bencinaenlinea.cl/#/busqueda_estaciones (accessed on 26 February 2026).
- Ministerio de Energía (Gobierno de Chile). Planificación Energética de Largo Plazo (PELP) 2023–2027: Informe Final; Ministerio de Energía, Gobierno de Chile: Santiago, Chile, 2024.
- Coordinador Eléctrico Nacional. Apéndice II: Previsión de Demanda y Electromovilidad del SEN, Periodo 2020–2040; Coordinador Eléctrico Nacional: Santiago, Chile, 2020. [Google Scholar]
- Instituto Nacional de Estadísticas. Permiso de Circulación. Available online: http://www.ine.gob.cl/estadisticas/economia/transporte-y-comunicaciones/permiso-de-circulacion (accessed on 26 February 2026).
- Comisión Nacional de Energía, Variación del Consumo Energético—Energía Abierta. Available online: http://energiaabierta.cl/visualizaciones/consumo-por-sector-de-energia/ (accessed on 10 November 2025).
- Superintendencia de Electricidad y Combustibles, Electromovilidad. Available online: https://www.agenciase.org/category/ministerio-de-energia/superintendencia-de-electricidad-y-combustibles/ (accessed on 10 November 2025).
- Cabal Chile SpA, Catálogo General de Buses RED Eléctricos, Cabal Chile/Sistema RED—Ministerio de Transportes y Telecomunicaciones, Santiago, Chile. Transporte Cabal Chile, Catologo LCK6122EVG. Available online: https://cabaltransporte.cl/wp-content/uploads/2025/03/RED-12-V2-24-meses.pdf (accessed on 10 November 2025).
- Comité Chileno de Cigré. Impacto del Desarrollo del Transporte Público Eléctrico Sobre el Sistema Eléctrico Chileno. Informe Final, 21 May 2024. [Google Scholar]

Disclaimer/Publisher’s Note: The statements, opinions and data contained in all publications are solely those of the individual author(s) and contributor(s) and not of MDPI and/or the editor(s). MDPI and/or the editor(s) disclaim responsibility for any injury to people or property resulting from any ideas, methods, instructions or products referred to in the content. |
© 2026 by the authors. Licensee MDPI, Basel, Switzerland. This article is an open access article distributed under the terms and conditions of the Creative Commons Attribution (CC BY) license.