


Abstract
To address the lag and limited sensitivity of conventional shipping freight indicators, this study develops a news-based sentiment measure for the shipping market and examines its association with BDI dynamics. Using shipping-related news headlines from 2019 to 2025, a RoBERTa classifier fine-tuned on manually annotated data is used to quantify headline sentiment, and a daily Cumulative Sentiment Index (CSI) is constructed using an event-smoothing window with exponential decay. A higher CSI indicates more positive market sentiment, while a lower CSI reflects more negative sentiment. Empirical evidence shows that CSI exhibits pronounced responses around major market events and is closely linked to BDI behavior in event windows. In addition, an EGARCH specification augmented with CSI indicates that sentiment is significantly associated with conditional volatility, suggesting that news-based sentiment contains incremental information relevant to BDI risk dynamics. Overall, the proposed CSI provides a quantitative approach to tracking shipping market sentiment using publicly available news headlines and offers a complementary perspective to transaction-based freight indices.
1. Introduction
The rising global economic uncertainty, coupled with frequent geopolitical conflicts and public events, has led to significant volatility in the shipping market, which serves as a core pillar of international trade. Traditional shipping freight indices, such as the Baltic Dry Index (BDI), while accurately measuring market conditions based on historical transaction data, suffer from substantial lag and may fail to reflect contemporaneous shifts in market sentiment, such as changes in macroeconomic expectations or perceived risks. For instance, during the initial outbreak of the Red Sea crisis in 2023, shipping companies, concerned about potential disruptions to trade routes, swiftly adjusted vessel deployment plans, and pessimistic expectations spread rapidly across the market. Yet the BDI did not exhibit noticeable changes until after the event had unfolded, limiting its usefulness for timely risk monitoring. This discrepancy highlights the need for complementary indicators that can track sentiment and risk perceptions more promptly.
In financial economics, a growing body of evidence suggests that sentiment indices derived from news can help explain market behavior and are closely related to volatility dynamics. Tetlock et al. [1], for example, show that news sentiment contains informative content for short-horizon market movements, offering a useful reference for shipping markets where expectations can adjust quickly in response to unfolding information. Building on this line of research, this paper constructs a news-based sentiment indicator for the shipping market and examines its relationship with BDI behavior. To summarize time-varying sentiment signals in a tractable manner, sentiment scores are aggregated using a finite post-publication influence window and exponential decay, thereby allowing the impact of earlier information to diminish as new information arrives.
Specifically, sentiment signals are quantified from shipping-related news headlines using a RoBERTa-based classifier, and these signals are aggregated into a daily Cumulative Sentiment Index (CSI) via an event-smoothing structure with exponential decay. The empirical analysis focuses on two related questions: whether CSI exhibits systematic co-movement with BDI around major shipping-related events, and whether CSI is significantly associated with time-varying volatility dynamics beyond standard persistence and asymmetry effects. Accordingly, we formulate the following testable hypotheses:
H1:
Sentiment shocks captured by extreme movements in CSI are associated with systematic responses in BDI returns.
H2:
Higher levels of CSI are positively associated with increased BDI volatility, indicating that sentiment fluctuations are linked to heightened market risk.
To evaluate these hypotheses, we employ an event-study design to examine market reactions around sentiment shock events and an EGARCH-based volatility framework to assess the relationship between CSI and conditional volatility. Overall, the study contributes a news-headline-based sentiment indicator tailored to the shipping market and provides empirical evidence on its association with BDI movements and volatility dynamics, offering a quantitative complement to transaction-based freight indices.
2. Literature Review
2.1. Shipping Market Dynamics and Volatility Modeling
Existing research on shipping markets emphasizes freight rate fluctuations, nonlinear behavior, and volatility clustering, with particular attention to dry bulk shipping and the BDI as core indicators.
2.1.1. Research on the BDI and Shipping Market Dynamics
Shipping market dynamics have been widely studied with an emphasis on nonlinearity, structural change, and sensitivity to external shocks, with the BDI and dry bulk freight rates serving as core indicators. Ko [2] documents regime-dependent behavior in dry bulk freight markets, showing that volatility and adjustment mechanisms differ significantly across market states. Meng et al. [3] further reveal that shipping markets exhibit the pronounced nonlinear and asymmetric responses to geopolitical risks, particularly under extreme conditions. Riaz et al. [4] demonstrate that energy-related uncertainty generates significant and time-varying spillovers to maritime freight markets, with risk transmission intensifying during major economic and energy events. Feng and Chen [5] show that shipping market connectedness with green finance and climate risks is highly state- and frequency-dependent, becoming substantially stronger under extreme market scenarios. Chen et al. [6] provide evidence of asymmetric and time-varying cross-market risk contagion between fossil fuel and shipping markets, highlighting the role of external shocks in amplifying freight rate volatility. From a broader perspective, Mo et al. [7] review recent advances in shipping economic forecasting and note that, despite methodological progress, most studies remain heavily reliant on historical price-based variables, which may limit their effectiveness under abrupt structural changes.
2.1.2. Applications of EGARCH in Shipping Markets
Volatility modeling has long been a central topic in shipping market research, as freight rates and shipping-related assets exhibit pronounced volatility clustering and asymmetric responses to shocks. Early studies document strong dynamic interactions between freight volatility and market fundamentals, indicating that shipping markets are characterized by persistent and time-varying conditional heteroskedasticity [8]. Building on this foundation, GARCH-family models have been widely adopted to capture volatility dynamics in freight, shipping stock, and forward freight agreement markets, highlighting the importance of modeling conditional variance in shipping-related time series [9,10].
More recent research emphasizes the asymmetric and leverage effects inherent in shipping market volatility. Kim [11] explicitly applies an ARIMA–EGARCH framework to shipping-related indices and demonstrates that negative shocks exert a stronger impact on volatility than positive shocks, particularly during crisis periods. Gavriilidis et al. [12] further show that incorporating oil price shocks into GARCH-based models significantly improves volatility forecasts for tanker freight rates, reinforcing the relevance of external drivers in volatility formation. Extensions incorporating dynamic connectedness frameworks reveal that volatility spillovers between shipping and energy markets are time-varying and state-dependent, with risk transmission intensifying during turbulent periods [13]. Recent empirical evidence from tanker freight markets confirms that volatility dynamics remain highly persistent and asymmetric across shipping segments, underscoring the suitability of EGARCH-type specifications for capturing nonlinear and asymmetric risk characteristics in shipping markets [14].
2.2. Sentiment Analysis and Market Applications
Recent studies highlight the role of sentiment analysis in extracting information beyond traditional price-based indicators, especially in environments characterized by uncertainty and abrupt market changes.
2.2.1. Application of Sentiment Analysis in Market Studies
Early studies that extract sentiment from textual data commonly relied on dictionary-based approaches using predefined word lists. However, Loughran and McDonald [15] show that general-purpose sentiment dictionaries may produce substantial misclassification in financial texts due to the domain-specific language. Although domain-specific dictionaries may partially address this issue, their construction often requires substantial expert knowledge and data resources. With the development of natural language processing techniques, more studies have begun to employ machine learning-based methods for sentiment extraction.
Beyond measurement methods, a growing body of literature examines how sentiment indices influence financial market dynamics. Yousaf et al. [16] show that investor sentiment exhibits relatively weak average connectedness with financial markets but becomes a major transmitter of spillovers in the extreme upper and lower tails of return distributions, indicating that sentiment plays a critical role in periods of market stress. Focusing on global transmission mechanisms, Bei et al. [17] find that investor sentiment primarily drives short-term spillovers across financial markets and significantly magnifies the effects of capital flows and unconventional monetary policies during distress episodes, thereby accelerating the accumulation of systemic risk. Comparative evidence from the U.S. and Chinese stock markets further suggests that sentiment effects are highly dependent on institutional and behavioral characteristics, with stronger sensitivity and risk aversion observed in markets where information frictions and behavioral biases are more pronounced [18].
Beyond aggregate spillovers, sentiment has also been shown to influence expectation formation, volatility dynamics, and market predictability at the micro and applied levels. Frijns et al. [19] demonstrate that sentiment directly affects investors’ expectations and increases heterogeneity across belief groups, reinforcing nonlinear adjustment processes in asset prices. In derivatives markets, Bahloul and Dammak [20] show that sentiment indices constructed using domain-specific lexicons significantly improve short-term return predictability, highlighting the importance of tailoring sentiment measurement to market-specific language and structures. Evidence from crisis periods further indicates that negative sentiment disproportionately amplifies volatility and downside risk, even in the presence of severe exogenous shocks such as the COVID-19 pandemic [21]. Related research on online collective action emphasizes how emotional contagion and opinion leadership can accelerate information diffusion and intensify collective responses [22], offering behavioral insights into how sentiment-driven dynamics may propagate in markets characterized by strong event dependence and rapid expectation shifts.
2.2.2. Research on the Shipping Market Sentiment
Existing studies on shipping sentiment mainly extract market emotions from shipping-related textual information and examine their role in explaining and predicting freight rate dynamics. Early research constructs news-based sentiment indices for dry bulk markets and finds that shipping sentiment closely tracks major freight indices and significantly predicts future freight rates, particularly in large vessel segments such as Capesize, while sentiment shocks tend to be transitory and asymmetric, with stronger effects under extreme market conditions [23]. More recent work applies market-specific language models to construct sentiment indices across dry bulk, tanker, and container markets, showing that sentiment serves as a Granger cause of key freight indices and that language-model-based measures substantially outperform traditional lexicon-based approaches [24]. Commodity-oriented studies further document nonlinear and regime-dependent relationships between shipping sentiment and freight rates, with sentiment capturing event-driven uncertainty and exhibiting stronger predictive power under optimistic or extreme market regimes [25]. Beyond bulk shipping, sentiment indicators have also been integrated into system dynamics frameworks for container markets, where freight rates are shown to be highly sensitive to the interaction between supply, demand, and market sentiment, especially during supply chain disruptions [26].
Overall, existing shipping market studies largely rely on freight rate indices and price-based indicators, typically incorporating supply–demand conditions, macroeconomic variables, and policy factors for market monitoring and forecasting. Despite increasing model sophistication, these approaches remain limited in capturing implicit information related to policy shocks, abrupt events, and market sentiment. In contrast, text-based sentiment analysis has been widely shown in financial market research to extract forward-looking signals and complement traditional quantitative models, particularly under nonlinear dynamics and extreme market conditions. However, its application in the shipping market remains relatively underdeveloped, with existing studies mostly focusing on low-frequency sentiment measures or linear frameworks and paying limited attention to high-timeliness sentiment signals and their role in volatility amplification and latent risk transmission. Furthermore, the use of advanced techniques such as pretrained language models for measuring shipping market sentiment has yet to be systematically explored.
3. Methodology
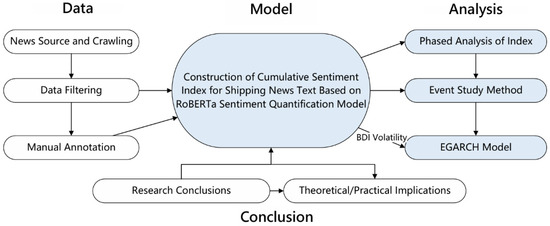
A sentiment-based framework is developed to quantify shipping news, construct a cumulative sentiment index, and examine its interaction with freight rate dynamics. The overall technical framework is illustrated in Figure 1.
Figure 1.
Technical Framework Diagram.
3.1. Theoretical Framework of Shipping News Sentiment
Shipping markets are highly sensitive to information related to global trade conditions, logistics disruptions, and geopolitical developments. As a widely disseminated information source, news not only reports objective events but also conveys interpretations of policy signals, market expectations, and perceived risks. In an industry characterized by long investment cycles, limited transparency, and strong exposure to external shocks, such information can influence market expectations before it is fully reflected in freight rate indicators such as the BDI. Consequently, shipping-related news provides an important channel through which market participants update expectations regarding freight demand, operational risks, and trade conditions.
In this study, sentiment is interpreted not merely as emotional tone but as a composite signal reflecting market expectations and risk perceptions embedded in news reports. According to media dependency theory [27], individuals and organizations rely more heavily on media information when environmental uncertainty and information asymmetry increase. This mechanism is particularly relevant in shipping markets, where freight rate dynamics are closely linked to macroeconomic conditions and geopolitical developments. Framing theory further suggests that news reporting is not neutral [28]; linguistic emphasis and narrative framing influence how market participants interpret events. Expressions such as “blockade,” “disruption,” or “supply shock” may therefore amplify perceived risk and alter expectations regarding shipping demand and operations. Empirical research also shows that media sentiment can influence financial market behavior by shaping investor expectations [1].
Sentiment signals may also diffuse across the market through behavioral mechanisms such as herding and information cascades [29]. When early responses by some market participants—often perceived as better informed—trigger observable operational or investment adjustments, other firms may imitate these actions even without complete information. Such imitation accelerates the diffusion of sentiment across heterogeneous market participants in the shipping ecosystem, strengthening collective responses and increasing the likelihood of abrupt adjustments in freight rates and volatility clustering. Similar diffusion mechanisms have also been identified in related economic contexts where information or value signals propagate across interconnected agents within supply chains [30], suggesting that sentiment signals may likewise spread among heterogeneous participants in the shipping ecosystem. Quantifying shipping news sentiment therefore provides a systematic way to capture shifts in market expectations and risk perceptions that may precede observable movements in freight returns and volatility.
3.2. Data Selection and Preprocessing
3.2.1. Approach to the Selection of Shipping News Text Data
To ensure the scientific validity and representativeness of the sentiment index, the shipping news texts in this study are selected and defined based on three criteria: text boundaries, time frame, and analysis unit.
- (1)
- Text Boundaries
As a highly globalized industry, the shipping sector generates public information primarily through specialized industry media and professional information platforms. Accordingly, this study collects shipping-related news headlines from authoritative sources, including China Shipping Network, China Waterway Network, Port Network, and Logistics Baba, which provide timely coverage of developments relevant to shipping market conditions. To ensure thematic relevance and semantic consistency, the data are filtered to retain only news directly or indirectly reflecting changes in shipping operations, market conditions, or related supply chain dynamics, while interviews, promotional content, and other non-market-oriented texts are excluded through a combination of keyword-based screening and manual verification.
- (2)
- Time Frame
The study period is set from 2019 to early 2025. This time frame not only encompasses significant events that led to dramatic changes in global trade and shipping structures, such as the COVID-19 pandemic and the Red Sea crisis, but also limits the impact of changes in news websites’ own development on the quantity of reports and narrative frameworks. By constructing a dataset of news headlines during this period, which includes multiple major market shocks, the sentiment index is better equipped to reflect the true evolution of shipping public opinion, thereby enhancing its timeliness and representativeness.
- (3)
- Analysis Unit
Consistent with existing research in shipping sentiment analysis (e.g., Bai et al. [23]), news headlines are chosen as the unit of analysis in this study. On the one hand, as a highly condensed form of news content, headlines summarize key information and often reflect the main stance or emphasis of the news agency, thereby capturing the core sentiment conveyed by the event. On the other hand, headlines are concise and contain fewer irrelevant words than full news articles, which facilitates the extraction of salient textual features through natural language processing algorithms while reducing noise from lengthy contextual narratives. Although headlines may occasionally simplify complex events and introduce potential bias in sentiment interpretation, they remain an efficient textual unit for capturing timely market signals.
3.2.2. Manual Annotation Method for Sentiment Bias in News Headlines
Accurately annotating the sentiment bias in news headlines is crucial for training the sentiment quantification model. Given the abundance of industry-specific terminology and complex semantic structures in shipping news, general sentiment lexicons and unsupervised learning methods are often insufficient for effectively identifying the market signals embedded in the headlines. To address this, a rigorous manual annotation process is adopted to ensure the accuracy and industry consistency of the labels, providing high-quality training data for subsequent modeling.
- (1)
- Annotation Targets and Classification System
This study focuses on the sentiment bias reflected in news headlines, categorizing them based on their potential impact on the shipping market. The dataset is divided into three categories: (i) Positive: Reflects information that signals a positive market outlook, such as price increases, improved supply–demand conditions, smooth port operations, or favorable policies that boost industry confidence. (ii) Negative: Involves content that indicates negative market impacts, such as falling prices, port congestion, rising shipping costs, supply chain disruptions, or geopolitical risks. (iii) Neutral: Represents information with no clear market sentiment, such as neutral announcements, technical adjustments, or data releases. To clarify the annotation criteria, Table 1 provides several example headlines, their sentiment categories, and the rationale for each classification.
Table 1.
Examples of Sentiment Category Determination and Rationale.
- (2)
- Annotation Procedure
To ensure label consistency and accuracy, a team of three researchers with experience in shipping economics was organized for the annotation task. A “dual-annotator + one reviewer” mechanism was adopted. The specific process is as follows: (i) Pre-training and Annotation Guidelines: Before formal annotation, the team members were trained on shipping terminology and typical sentiment expression cases, and a detailed annotation manual was created. (ii) Initial Annotation: Two annotators independently labeled the same batch of headlines and recorded their sentiment labels. (iii) Consistency Check and Review: If the annotations were consistent, they were accepted as the final labels. In case of discrepancies, a third annotator made the final decision to ensure accurate sentiment reflection. (iv) Iterative Optimization: During the annotation process, ambiguous or difficult-to-classify samples were continuously reviewed and feedback was provided to refine the annotation guidelines and improve overall consistency. Random sampling was employed to ensure balanced coverage across time, platforms, and categories, thus avoiding selection bias.
- (3)
- Quality Control and Consistency Evaluation
To assess the reliability of the annotation results, Cohen’s Kappa coefficient is employed to evaluate inter-annotator agreement during the labeling process. In an initial pilot annotation of 200 samples, the agreement between two annotators reaches 0.84, indicating a high level of consistency in sentiment classification. As the annotation guidelines are refined and representative cases accumulate, the average Kappa value for the full dataset remains above 0.80, ensuring the stability and reusability of the sentiment labels.
3.3. Model and Index Construction Methods
3.3.1. Headline-Level Sentiment Scoring Model
RoBERTa is a Transformer-encoder language model. In this study, it serves as a contextual feature extractor for headline-level sentiment classification. Its core operation is self-attention, which assigns context-dependent weights to tokens. Given query (Q), key (K), and value (V) projections, the scaled dot-product attention is defined as:
RoBERTa is pre-trained with masked language modeling (MLM) using dynamic masking and does not include the next sentence prediction (NSP) task. For downstream sentiment classification, the final-layer representation of the [CLS] token is mapped to class probabilities via:
where denotes the predicted probability vector over negative, neutral, and positive classes, and is the final-layer embedding of the [CLS] token. A continuous headline-level sentiment score is then obtained by a linear mapping of , which is subsequently used for CSI construction.
Specifically, the headline-level sentiment score is defined through a linear polarity mapping that assigns weights , , and to the positive, neutral, and negative classes, respectively:
where , , and denote the predicted probabilities of the positive, neutral, and negative classes. This transformation yields a continuous sentiment measure in , which is subsequently used as the headline-level input in the construction of CSI.
3.3.2. Construction of the Cumulative Sentiment Index
Market sentiment in the shipping industry is rarely driven by a single piece of information. Instead, it emerges from the accumulation of multiple news signals that gradually shape market expectations over time. To capture this dynamic information aggregation process, this study constructs the CSI that summarizes the sentiment signals contained in shipping-related news headlines.
Each news headline is evaluated using a trained sentiment classification model, which assigns a sentiment score to headline . Rather than treating each news item as an isolated observation, the CSI aggregates these sentiment signals across time while allowing their influence to decay as new information arrives. This structure reflects how market attention evolves in practice: recently released information tends to exert a stronger influence on market perceptions, whereas older information gradually loses relevance as subsequent developments emerge.
Formally, the CSI is defined as a time-aggregated sentiment measure in which the contribution of each news item is distributed across a finite influence period following its publication. The daily value of the index is calculated as:
where denotes the target date, represents the sentiment score assigned to news item , and is the publication date of that item. The parameter specifies the length of the influence window during which a news item contributes to the index, while controls the rate at which the influence of past information decays over time.
Parameter values are calibrated to reflect the characteristics of the shipping market. The influence window of each news item is restricted to 7 consecutive days following publication, reflecting the empirical observation that news-driven sentiment effects in shipping markets are typically most pronounced within one week and diminish thereafter as market attention wanes.
The decay parameter is set to λ = 0.1, under which sentiment influence declines to approximately one-third of its initial magnitude after ten days. During model calibration, alternative specifications of both the event window length and the decay parameter were evaluated. The forecasting performance remains quantitatively similar across reasonable parameter choices, and the main empirical conclusions are unaffected. We therefore adopt this specification as a parsimonious and economically consistent benchmark.
3.3.3. EGARCH Model Mechanism and Extensions
In both shipping and financial markets, price volatility often exhibits two well-documented stylized facts: volatility clustering and leverage effects. Volatility clustering refers to the tendency for periods of high volatility to be followed by further high volatility, while tranquil periods are followed by relatively small fluctuations. Leverage effects describe the asymmetric response of volatility to shocks, where negative news tends to generate a larger increase in market volatility than positive news of the same magnitude. To capture these empirical features in the BDI market, an Exponential Generalized Autoregressive Conditional Heteroskedasticity (EGARCH) framework is adopted.
In an EGARCH model, the dynamic evolution of volatility is characterized by a logarithmic conditional variance equation. Specifically, the EGARCH(1,1) specification is written as:
where denotes the conditional variance, measures volatility persistence, captures the magnitude effect of standardized shocks, and reflects asymmetry in the response of volatility to positive and negative innovations. A negative indicates the presence of a leverage effect. The centering term is distribution-dependent and ensures that the shock component has zero mean under the assumed innovation distribution.
To examine whether shipping news sentiment contributes to volatility formation, the variance equation is augmented by incorporating the sentiment index:
where denotes the weighted lagged sentiment index constructed from the cumulative sentiment series. The lag structure is determined based on the results of the Granger causality tests, which identify the statistically significant transmission horizon of sentiment to market volatility. The weighted combination therefore reflects the lag periods exhibiting significant predictive effects, allowing for delayed information diffusion and gradual market adjustment. The coefficient measures the marginal effect of sentiment on conditional volatility. A significantly positive indicates that stronger sentiment signals are associated with higher conditional variance, implying that news-based sentiment contributes to market risk dynamics. The model is estimated under a skewed Student-t distribution to accommodate excess kurtosis and asymmetry commonly observed in shipping market return series.
4. Sentiment Model and Index Construction
Shipping news headlines and the BDI data are processed to construct the sentiment measurement framework. A RoBERTa-based classifier is employed to extract sentiment signals from news headlines, and these signals are aggregated into the CSI that captures the temporal evolution of shipping market sentiment.
4.1. Data Preprocessing
This study combines shipping news headlines with freight market data to investigate the relationship between media sentiment and shipping market dynamics. Two types of data are used in the empirical analysis: shipping news headlines and the BDI.
The BDI serves as a widely recognized benchmark for conditions in the global dry bulk shipping market. Compiled and published by the Baltic Exchange in London, the index reflects daily freight rate movements for major bulk commodities such as iron ore, coal, and grain, which are closely linked to global trade activity and industrial demand. The sample period spans from November 2019 to January 2025, covering several major episodes of market volatility, including the COVID-19 pandemic, the Suez Canal blockage, and disruptions in the Red Sea shipping routes. Since the BDI is released only on working days, linear interpolation is applied to construct a continuous daily time series. After aligning the interpolated BDI series with the news dataset, the final sample consists of 1888 daily observations.
Shipping news headlines are collected from several major maritime information platforms and financial news sources that regularly report developments in global shipping markets. After removing duplicate records and filtering irrelevant content, a total of 20,656 shipping-related news headlines are retained. To preserve the temporal structure of the dataset and avoid information leakage, the headline data used for sentiment modeling are partitioned strictly according to chronological order. Specifically, the dataset is divided into training and testing subsets using an 80–20 split, where earlier observations are used for model training while the most recent observations are reserved for testing. This time-ordered partition ensures that the evaluation results are based on out-of-sample predictions, providing a realistic assessment of the model’s ability to extract sentiment signals from newly arriving news.
4.2. Model Specification and Evaluation
The RoBERTa tokenizer is used to perform subword tokenization on the news headlines, with a maximum sequence length of 128 tokens. Sequences exceeding this length are truncated, while shorter sequences are padded with the [PAD] token to maintain consistent batch input. For model construction, the RoBERTa-based-Chinese pre-trained model from HuggingFace’s Transformers library is adopted. Two fully connected layers together with a dropout layer are added to the output layer for the classification task to mitigate overfitting. The model is trained using the AdamW optimizer and cross-entropy loss, with early stopping and learning-rate scheduling applied to improve training stability.
The classification results indicate that 52.08% of the headlines are predicted as positive sentiment, 45.88% as negative sentiment, and 2.04% as neutral sentiment. The relatively small proportion of neutral labels reflects the nature of shipping news reporting, which often focuses on developments with clear market implications, such as freight rate changes, supply disruptions, and geopolitical events affecting shipping routes. Given this distribution, model performance is evaluated using Weighted-F1, Macro-F1, and Accuracy, which provide complementary measures of classification performance under potential class imbalance. All evaluation metrics are computed on the out-of-sample test set, ensuring that the reported results reflect the model’s ability to generalize to newly arriving news data. The comparative performance of the models is reported in Table 2.
Table 2.
Performance comparison of sentiment quantification models.
As reported in Table 2, the benchmark models achieve progressively improved performance in the sentiment classification task. Traditional text representation approaches such as Word2Vec-MLP and FastText provide a basic baseline for sentiment identification, while sequence-based architectures including TextCNN and BiLSTM improve performance by capturing contextual and sequential patterns in the news headlines. Pretrained language models further enhance the extraction of semantic information from shipping-related texts. Among the evaluated models, RoBERTa achieves the highest scores across all evaluation metrics. This result suggests that contextual language representations are particularly effective for identifying sentiment signals in shipping news, which subsequently serve as inputs for the construction of the sentiment index.
4.3. Cumulative Sentiment Index Analysis
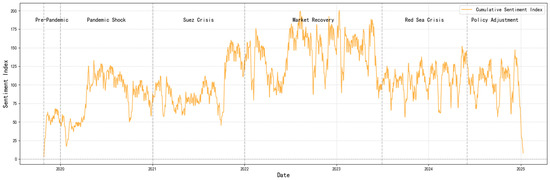
The CSI constructed from shipping news headlines is illustrated in Figure 2, which depicts the evolution of market sentiment over the sample period. The index exhibits noticeable fluctuations around major developments in the shipping market, indicating that shipping-related news sentiment responds sensitively to changes in the global trade and transportation environment.
Figure 2.
Shipping news cumulative sentiment index trend.
To further examine the statistical characteristics of the sentiment index, descriptive statistics are calculated across several periods defined according to major developments in the shipping market. These periods broadly correspond to key stages including the pre-pandemic period, the COVID-19 disruption phase, the Suez Canal blockage episode, the post-pandemic market recovery, and the Red Sea shipping crisis. The descriptive statistics of the CSI across these phases are reported in Table 3.
Table 3.
Descriptive statistics of the cumulative sentiment index across market phases.
Table 3 reports the descriptive statistics of the CSI across different market phases. The results reveal clear stage-dependent variations in shipping-related news sentiment. During the Pre-COVID-19 period, the CSI remains at relatively low levels with limited variability, reflecting a comparatively stable market environment. Following the outbreak of COVID-19, the average CSI increases substantially, indicating intensified media attention and stronger sentiment responses to disruptions in global trade and logistics networks. Sentiment levels continue to rise during the Suez Canal shock and reach their highest values during the post-pandemic recovery phase, consistent with the rebound in global freight demand and increased market activity.
In subsequent periods, the CSI remains elevated but exhibits noticeable adjustments as new geopolitical and economic developments emerge. The Red Sea crisis is associated with persistently high sentiment levels, reflecting heightened market sensitivity to maritime security risks and shipping route disruptions. In the most recent adjustment phase, the CSI shows a moderate decline together with reduced dispersion, suggesting that market sentiment has gradually stabilized as the shipping industry adapts to evolving trade conditions. Overall, these descriptive patterns indicate that shipping news sentiment responds systematically to major events affecting global shipping markets, supporting the use of the CSI in the subsequent empirical analysis.
5. Results
The empirical analysis tests the relationship between sentiment shocks and BDI dynamics. Event study methods and an EGARCH framework are used to evaluate the effects of sentiment on freight returns and volatility.
5.1. Event Study of Sentiment Shocks and BDI Responses
5.1.1. Event Identification and Empirical Design
To further investigate the dynamic relationship between the CSI and the BDI, this study adopts an event study approach to quantify the short-term impact of sentiment shocks on the shipping market. Following the general framework of Tetlock et al. [1], sentiment shock events are identified based on the distribution of the CSI.
In terms of event definition, the daily values of the CSI are used to identify sentiment shocks. Following the standard quantile-based approach in the event study literature, a positive sentiment shock is defined as a trading day when the CSI exceeds the upper -th quantile of its empirical distribution, while a negative sentiment shock corresponds to trading days when the CSI falls below the lower -th quantile. According to this classification rule, the sample contains 112 positive sentiment shock events and 110 negative sentiment shock events.
For the event window design, considering that the shipping market may exhibit delayed responses to sentiment shocks, symmetric event windows are constructed around the event day. Specifically, event windows of ±7, ±14, and ±30 days are considered in order to capture short-term and medium-term market reactions to sentiment shocks.
The daily logarithmic return of the BDI is used as the return measure. To evaluate the market response to sentiment shocks, the cumulative return (CR) within the event window is calculated by aggregating the daily logarithmic returns around the event day. Formally, the cumulative return over the event window is defined as
where denotes the logarithmic return of the BDI on day . This cumulative measure captures the overall adjustment of BDI returns surrounding the identified sentiment shock events.
5.1.2. Event Study Results and Economic Interpretation
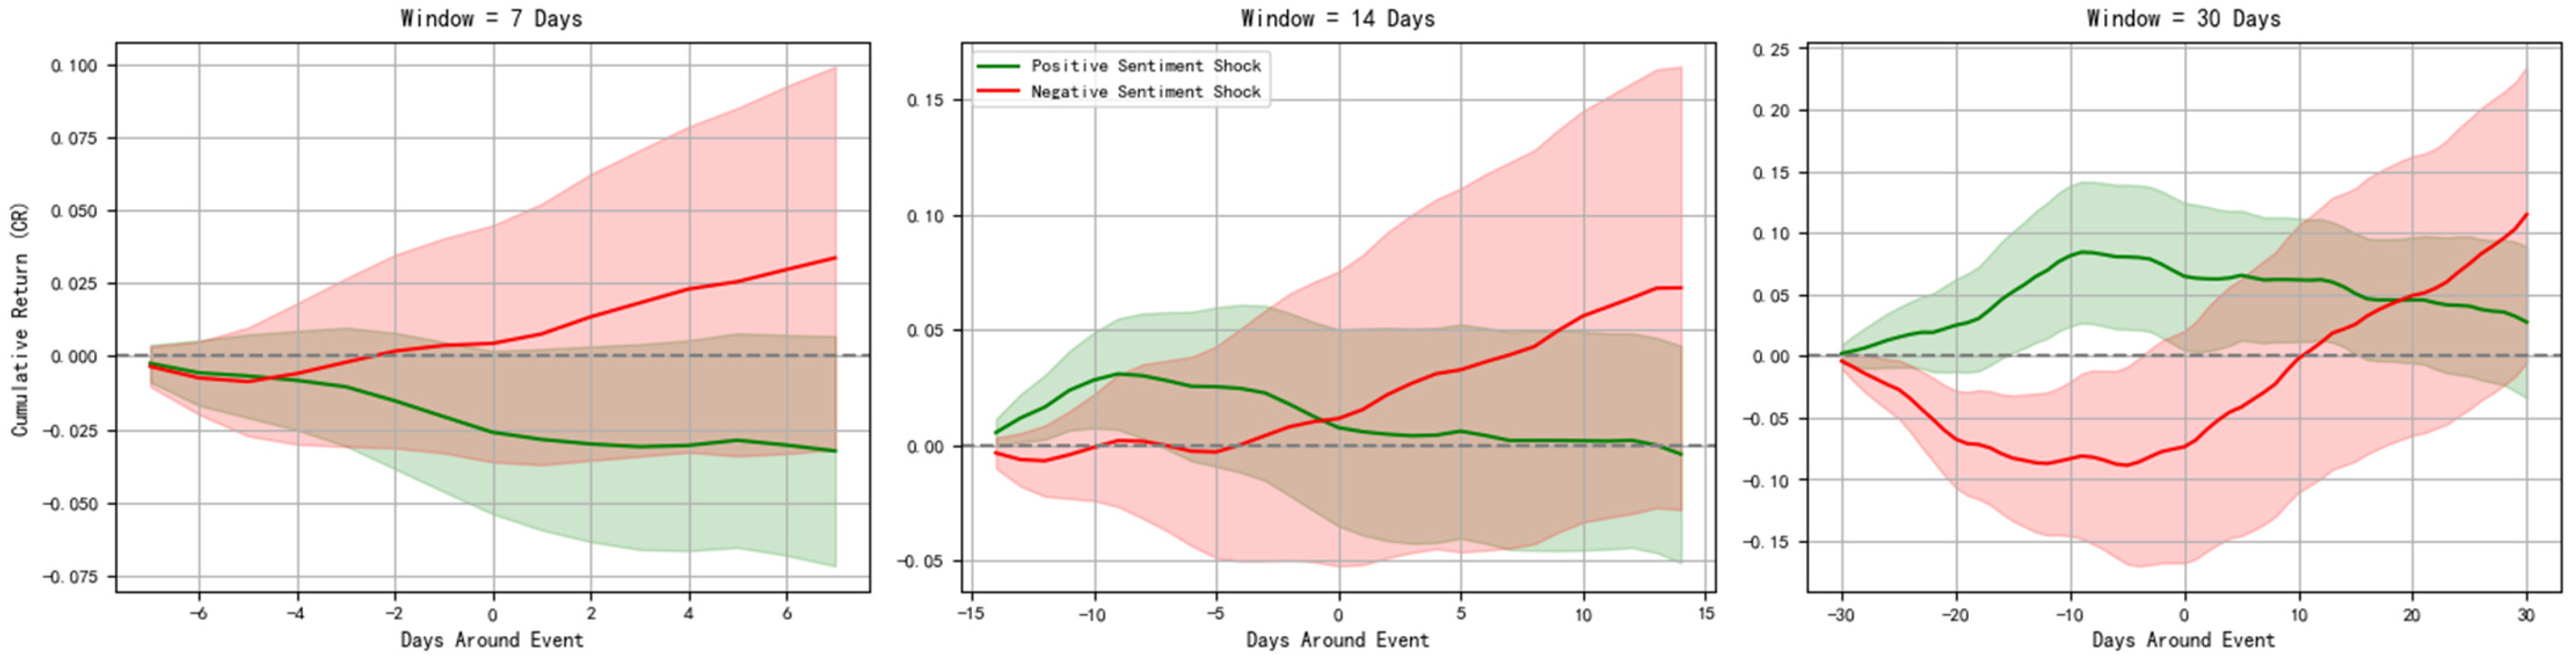
The cumulative return paths of BDI returns are examined around the identified sentiment shock days to characterize the market response within the event windows. Under the baseline threshold (), the evolution of cumulative returns is reported in Figure 3 for different event windows.
Figure 3.
Event study results under the baseline threshold ().
The results show systematic differences between positive and negative sentiment shocks: positive shocks are associated with relatively mild movements, whereas negative shocks are followed by larger and more persistent declines in cumulative returns. This divergence becomes more pronounced as the event window expands, suggesting that sentiment effects may accumulate over time. Overall, the baseline event-study evidence supports H1 by showing that extreme sentiment movements are accompanied by systematic adjustments in BDI returns.
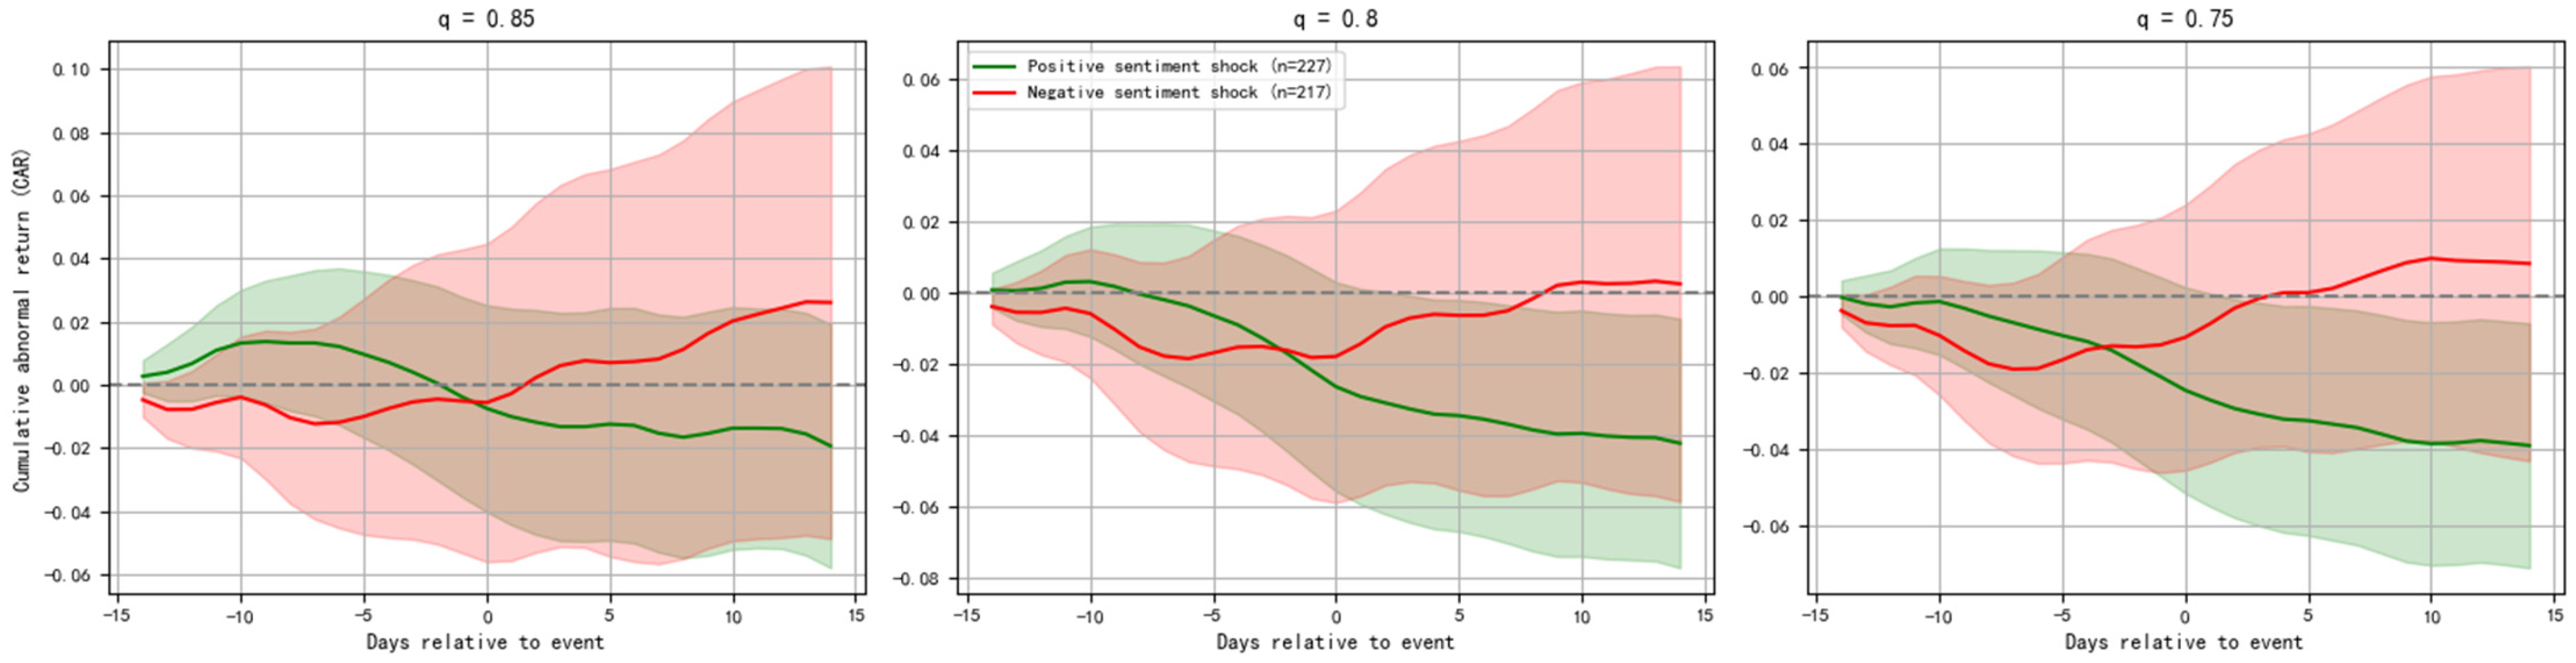
As a robustness check, sentiment shocks are re-identified using alternative quantile thresholds (q = 85%, 80%, and 75%) while keeping the event window fixed at ±14 days. The corresponding CR dynamics are presented in Figure 4. The results show that the overall response patterns remain consistent across different threshold definitions. In particular, negative sentiment shocks continue to generate stronger and more persistent market responses than positive shocks, and the divergence between the two responses becomes more evident after the event date. Although the magnitude of the responses varies slightly across thresholds, the overall shape and direction of the CR dynamics remain stable. These findings indicate that the observed return–response patterns are robust to alternative definitions of sentiment shock events.
Figure 4.
Robustness test using alternative sentiment thresholds (q = 85%, 80%, and 75%) under a fixed ±14-day event window.
From a practical perspective, the event-study results indicate that news-based sentiment signals can complement traditional freight indices in monitoring short-term freight market conditions. In particular, the pronounced response to negative sentiment shocks implies that adverse news coverage is associated with rapid adjustments in market expectations regarding freight demand and shipping activity. This pattern is consistent with the information-sensitive nature of shipping markets, where expectations about trade conditions, logistics disruptions, and macroeconomic developments are gradually incorporated into freight rate dynamics.
Moreover, the asymmetric response between positive and negative sentiment shocks highlights the importance of monitoring downside information in freight markets. Negative news appears to transmit more strongly into market adjustments, suggesting that market participants may react more sensitively to signals of potential demand weakness or operational disruptions. Incorporating sentiment-based indicators into analytical frameworks may therefore help analysts and industry participants better interpret market signals and identify periods of heightened uncertainty. In this sense, sentiment measures can serve as a useful supplementary tool for understanding short-term fluctuations and expectation dynamics in global shipping markets.
5.2. EGARCH Analysis of the Sentiment Index and BDI Volatility
5.2.1. EGARCH Model Specification and Estimation
The EGARCH(1,1) model is estimated using the daily log return of the BDI as the dependent variable. Market sentiment is measured by the CSI. To allow for delayed sentiment transmission from news to market risk, the conditional variance equation is augmented with a lagged sentiment regressor , constructed from past CSI values.
The lag structure is informed by Granger causality tests between CSI and BDI returns. The results show no statistically significant association at lag 1, whereas statistically significant lead–lag relationships emerge from lag 2 onward and remain pronounced over medium and longer horizons, with sustained significance observed particularly within the 16–28 lag range. To summarize these transmission horizons parsimoniously while avoiding an excessive number of lag terms, three representative significant lags (17, 20, and 28) are selected to construct . A simple decreasing weighting scheme is adopted to place greater emphasis on the horizon where the transmission is most economically relevant while retaining information from adjacent significant lags. Specifically,
Parameters are estimated by maximum likelihood under a skewed Student-t innovation distribution, which is adopted to accommodate the skewness and heavy tails in BDI returns and provides the best overall fit among alternative distributions considered. All variables are aligned by trading dates, and observations with missing values are excluded to ensure a consistent estimation sample. Standard post-estimation diagnostics indicate an adequate fit. The ARCH-LM test on the residuals of the extended model yields a statistic of 12.36 (p = 0.196), suggesting no remaining conditional heteroskedasticity. Residual autocorrelations are not statistically significant across conventional lag orders based on ACF/PACF checks, indicating that the standardized residuals are approximately serially uncorrelated. The corresponding estimation results are reported in Table 4 for specifications with and without the sentiment term.
Table 4.
Comparison of EGARCH(1,1)-SKEWT model parameter estimation results.
From the benchmark specification, the estimated volatility dynamics exhibit the standard stylized facts commonly observed in market data. The persistence parameter is highly significant, indicating strong volatility persistence in BDI returns. The magnitude parameter is significantly positive, suggesting that conditional volatility responds to the size of past shocks. The asymmetry parameter is significantly negative, implying that negative shocks generate a larger increase in volatility than positive shocks of the same magnitude, consistent with a leverage-type effect in the shipping market. The innovation distribution parameters and are also statistically significant, supporting heavy tails and skewness in the return innovations and confirming that the skewed Student-t specification is appropriate.
After incorporating the CSI-based sentiment regressor, the extended model shows an improved overall fit based on information criteria, and the sentiment coefficient is positive and statistically significant at the 5% level. In economic terms, an increase in CSI is associated with a rise of 0.1455 in the log conditional variance of BDI returns, corresponding to an approximate 15.68% increase in conditional volatility. This provides support for H2 that higher CSI is associated with higher conditional volatility in the BDI. Substantively, the result indicates that news-based sentiment is closely linked to the time variation in shipping market risk: when sentiment signals intensify, the conditional volatility of freight-rate returns tends to be higher, reflecting a market environment characterized by greater uncertainty and more pronounced risk re-assessment.
5.2.2. Robustness Checks
To examine whether the estimated relationship between shipping sentiment and market volatility is sensitive to alternative specifications, two robustness checks are conducted.
First, to address the concern that the sentiment index may partly capture variations in news intensity rather than sentiment orientation itself, a news volume control variable is introduced into the variance equation. The variable measures the daily number of shipping-related headlines and serves as a proxy for information arrival intensity. The variance equation is therefore extended by including both the sentiment index and the news volume variable :
Second, robustness is examined with respect to the lag specification of the sentiment variable. Instead of the weighted lag combination used in the baseline specification, alternative lag structures are considered, including a short-horizon average of recent CSI values and a single representative lag. The alternative sentiment variables are defined as:
The estimation results for the sentiment coefficient under alternative specifications are summarized in Table 5.
Table 5.
Robustness checks for the sentiment effect in the EGARCH model.
As reported in Table 5, the sentiment coefficient remains positive and statistically significant across all specifications, with magnitudes broadly comparable to that of the baseline model. When the news volume variable is included, the sentiment coefficient decreases slightly but remains statistically significant, indicating that the sentiment index retains explanatory power beyond variations in news intensity. The moderate improvement in AIC after controlling for news volume does not materially alter the main findings. Results under alternative lag specifications are also consistent with the baseline model, confirming that the relationship between shipping sentiment and BDI volatility is robust.
5.2.3. Economic Interpretation
The empirical results indicate that CSI is positively associated with conditional volatility in BDI returns, suggesting that sentiment extracted from shipping-related news reflects fluctuations in market risk perceptions. In the shipping market, information related to trade demand, route stability, or logistical disruptions is rapidly incorporated into expectations about freight rates. News coverage therefore serves as an important channel through which market participants update their assessments of freight market risk.
One possible explanation is that shifts in sentiment increase heterogeneity in market expectations. When news signals convey stronger optimism or pessimism regarding shipping conditions, market participants may revise chartering strategies, route allocation decisions, and freight rate expectations. While such revisions do not necessarily change the average level of freight rates immediately, they can increase the dispersion of expectations, thereby intensifying short-term volatility as new information is gradually incorporated into prices.
The persistence and asymmetry observed in the volatility process further reflect structural characteristics of the shipping market. Negative shocks, such as geopolitical tensions, trade disruptions, or logistical bottlenecks, tend to generate stronger volatility responses than positive developments. This pattern is consistent with the asymmetric volatility effect captured by the EGARCH specification. Overall, these findings suggest that news-based sentiment indicators contain economically meaningful information about fluctuations in shipping market risk and can provide complementary signals for monitoring changes in freight market conditions alongside traditional price-based indicators.
6. Conclusions
This study develops a news-based sentiment indicator for the shipping market by combining manually annotated Chinese shipping news headlines with a RoBERTa-based sentiment classification model. By aggregating headline-level sentiment through an event-smoothing framework with exponential decay, the Cumulative Sentiment Index (CSI) captures the dynamic evolution of market expectations reflected in shipping-related news. Empirical results support the proposed hypotheses. The event-study analysis shows that extreme sentiment shocks are associated with systematic adjustments in BDI returns, with negative sentiment shocks producing stronger and more persistent responses than positive ones. In addition, the EGARCH estimation indicates that the CSI is positively and significantly associated with the conditional volatility of BDI returns, suggesting that sentiment signals embedded in news coverage contain incremental information about fluctuations in shipping market risk.
While the findings provide useful insights, several aspects of the study could be further improved. The sentiment index is constructed from shipping news headlines collected from a limited set of industry platforms, which may not fully represent the broader information environment of the shipping market; future research could therefore expand the data sources to include a wider range of media outlets and related domains to enhance the comprehensiveness of sentiment measurement; moreover, the empirical analysis mainly focuses on identifying the relationship between sentiment shocks and market dynamics rather than evaluating predictive performance. Future studies could incorporate forecasting frameworks to further assess the predictive value of news-based sentiment indicators. Overall, the results suggest that news-based sentiment measures can provide a useful complementary perspective for understanding information-driven fluctuations in the shipping market.
Author Contributions
Conceptualization, L.Q.; methodology, L.Q. and N.H.; software, L.Q. and N.H.; validation, L.Q.; data preprocessing and manual annotation, L.Q., N.H. and Y.H.; data curation, L.Q., N.H. and Y.H.; writing—original draft preparation, N.H. and Y.H.; writing—review and editing, L.Q.; visualization, N.H. and Y.H.; supervision, L.Q.; project administration, L.Q.; funding acquisition, L.Q. All authors have read and agreed to the published version of the manuscript.
Funding
This research was funded by the National Social Science Fund of China, grant number 25BGJ073.
Data Availability Statement
The original contributions presented in this study are included in the article. Further inquiries can be directed to the corresponding author.
Conflicts of Interest
The authors declare no conflicts of interest.
References
- Tetlock, P.C. Giving Content to Investor Sentiment: The Role of Media in the Stock Market. J. Financ. 2007, 62, 1139–1168. [Google Scholar] [CrossRef] [Scilit]
- Ko, B.-W. A mixed-regime model for dry bulk freight market. Asian J. Shipp. Logist. 2010, 26, 185–204. [Google Scholar] [CrossRef] [Scilit]
- Meng, B.; Chen, S.; Dong, J. Nonlinear risk dynamics and strategic management: Insights for LNG shipping policy and practice. Transp. Policy 2025, 173, 103752. [Google Scholar] [CrossRef] [Scilit]
- Riaz, A.; Ahmed, S.; Nilu, T.Y.; Shahbaz, M. Spillover dynamics between maritime energy transportation and energy-related uncertainty. Reg. Stud. Mar. Sci. 2026, 93, 104703. [Google Scholar] [CrossRef] [Scilit]
- Feng, A.; Chen, Y. Quantile time–frequency connectedness between green finance and shipping markets: The role of climate transition and physical risks. Int. Rev. Econ. Financ. 2025, 104, 104704. [Google Scholar] [CrossRef] [Scilit]
- Chen, S.; Meng, B.; Lv, L. Cross-market risk contagion and portfolio diversification: A novel dynamic connectedness framework for fossil fuel and shipping markets. Transp. Res. Part E 2025, 204, 104443. [Google Scholar] [CrossRef] [Scilit]
- Mo, J.; Gao, R.; Yuen, K.F.; Suganthan, P.N. Shipping economic forecasting: Recent developments, applications, and future directions. Transp. Rev. 2025, 45, 897–923. [Google Scholar] [CrossRef] [Scilit]
- Xu, J.J.; Yip, T.L.; Marlow, P.B. The dynamics between freight volatility and fleet size growth in dry bulk shipping markets. Transp. Res. Part E 2011, 47, 983–991. [Google Scholar] [CrossRef] [Scilit]
- Ruslan, S.M.M.; Mokhtar, K. Stock market volatility on shipping stock prices: GARCH models approach. J. Econ. Asymmetries 2021, 24, e00232. [Google Scholar] [CrossRef] [Scilit]
- Alizadeh, A.H. Trading volume and volatility in the shipping forward freight market. Transp. Res. Part E 2013, 49, 250–265. [Google Scholar] [CrossRef] [Scilit]
- Kim, C.B. Leverage effect of HRCI volatility and the volatility impact on Korean export container volume before and after the global financial crisis: Application of ARIMA–EGARCH and GIRF. Asian J. Shipp. Logist. 2018, 34, 227–233. [Google Scholar] [CrossRef] [Scilit]
- Gavriilidis, K.; Kambouroudis, D.S.; Tsakou, K.; Tsouknidis, D.A. Volatility forecasting across tanker freight rates: The role of oil price shocks. Transp. Res. Part E 2018, 118, 376–391. [Google Scholar] [CrossRef] [Scilit]
- Maitra, D.; Chandra, S.; Dash, S.R. Liner shipping industry and oil price volatility: Dynamic connectedness and portfolio diversification. Transp. Res. Part E 2020, 138, 101962. [Google Scholar] [CrossRef] [Scilit]
- Ajith, P.J.; Raju, T.B.; Gupta, R.; Kulshrestha, N. Volatility in tanker freight markets. Case Stud. Transp. Policy 2023, 12, 100993. [Google Scholar] [CrossRef] [Scilit]
- Loughran, T.; McDonald, B. When Is a Liability Not a Liability? Textual Analysis, Dictionaries, and 10-Ks. J. Financ. 2011, 66, 35–65. [Google Scholar] [CrossRef] [Scilit]
- Yousaf, I.; Youssef, M.; Goodell, J.W. Quantile connectedness between sentiment and financial markets: Evidence from the S&P 500 Twitter sentiment index. Int. Rev. Financ. Anal. 2022, 83, 102322. [Google Scholar] [CrossRef] [Scilit]
- Bei, Z.; Cui, L.; Zhou, Y. Liquidity, sentiment, and global spillover across financial markets. J. Int. Money Financ. 2026, 161, 103494. [Google Scholar] [CrossRef] [Scilit]
- Zhang, Y.; Li, Y.; Wang, W. Comparative analysis of investor sentiment and attention in the U.S. and Chinese stock markets: Implications for financial stability. Int. Rev. Financ. Anal. 2026, 109, 104751. [Google Scholar] [CrossRef] [Scilit]
- Frijns, B.; Huynh, T.; Zwinkels, R.C.J. Expectation formation in financial markets: Heterogeneity and sentiment. J. Econ. Dyn. Control 2025, 177, 105133. [Google Scholar] [CrossRef] [Scilit]
- Bahloul, W.; Dammak, W. Online investor sentiment in the financial futures markets. Res. Int. Bus. Financ. 2025, 75, 102708. [Google Scholar] [CrossRef] [Scilit]
- Bai, C.; Duan, Y.; Fan, X.; Tang, S. Financial market sentiment and stock return during the COVID-19 pandemic. Financ. Res. Lett. 2023, 54, 103709. [Google Scholar] [CrossRef] [Scilit]
- Li, S.; Hao, J.; Chai, Y.; Liu, Y.; Feng, T.; Zhu, X. Emotional contagion mechanism and response strategy simulation of corporate crises from the perspective of online collective action. Systems 2026, 14, 1. [Google Scholar] [CrossRef] [Scilit]
- Bai, X.; Lam, J.S.L.; Jakher, A. Shipping sentiment and the dry bulk shipping freight market: New evidence from newspaper coverage. Transp. Res. Part E 2021, 155, 102490. [Google Scholar] [CrossRef] [Scilit]
- Sui, C.; Wang, S.; Zheng, W. Sentiment as a shipping market predictor: Testing market-specific language models. Transp. Res. Part E 2024, 189, 103651. [Google Scholar] [CrossRef] [Scilit]
- Gong, Y.; Peng, Y.; Xu, L.; Chen, K.; Shi, W. Shipping news sentiment as a predictor of iron ore freight rates: Hybrid evidence from lexicon-based analysis and threshold autoregression modelling. Transp. Policy 2025, 169, 178–190. [Google Scholar] [CrossRef] [Scilit]
- Jeon, J.; Iris, Ç.; Hong, S.; Lyons, A. Box rates unveiled: Predictive analytics for ocean freight rates with system dynamics and text mining under supply chain disruptions. Int. J. Prod. Econ. 2025, 286, 109669. [Google Scholar] [CrossRef] [Scilit]
- Ball-Rokeach, S.J.; DeFleur, M.L. A dependency model of mass-media effects. Commun. Res. 1976, 3, 3–21. [Google Scholar] [CrossRef] [Scilit]
- Entman, R.M. Framing: Toward clarification of a fractured paradigm. J. Commun. 1993, 43, 51–58. [Google Scholar] [CrossRef] [Scilit]
- Bikhchandani, S.; Hirshleifer, D.; Welch, I. A theory of fads, fashion, custom, and cultural change as informational cascades. J. Polit. Econ. 1992, 100, 992–1026. [Google Scholar] [CrossRef] [Scilit]
- He, J.; Yang, Q.; Zhao, Y. Research on the diffusion effects of data value in supply chains. J. Asian Econ. 2025, 101, 102064. [Google Scholar] [CrossRef] [Scilit]

Disclaimer/Publisher’s Note: The statements, opinions and data contained in all publications are solely those of the individual author(s) and contributor(s) and not of MDPI and/or the editor(s). MDPI and/or the editor(s) disclaim responsibility for any injury to people or property resulting from any ideas, methods, instructions or products referred to in the content. |
© 2026 by the authors. Licensee MDPI, Basel, Switzerland. This article is an open access article distributed under the terms and conditions of the Creative Commons Attribution (CC BY) license.