


Highlights
Please indicate how your work links to systems science via your contributions to systems practice, theory, and/or methodology.
- Simulation-supported teaching is evaluated as a bounded socio-technical instructional system.
- A three-level evaluation method links system outputs, within-system relationships, and diagnostic evidence for redesign.
What are the main findings and/or the implications of the main findings?
- The simulation-supported configuration showed higher post-instruction knowledge and scenario-based analytical performance than the conventional configuration.
- Interacting-behavior identification emerged as the clearest candidate for targeted redesign.
Abstract
Simulation platforms are often evaluated as isolated teaching tools, although classroom outcomes reflect coordinated technical and instructional elements. This study evaluated a research-team-developed CARLA–SUMO platform as part of a bounded socio-technical instructional system for teaching ramp-merging and weaving analysis. A class-level controlled quasi-experiment involved 174 undergraduates from four intact classes, with 87 students in each instructional configuration. The evaluation combined configuration-level comparisons of formal knowledge, scenario-based analytical performance, and learning-experience profiles; within-system relational analyses in the simulation-supported group; and scenario- and question-level diagnostics. The simulation-supported configuration showed higher post-instruction knowledge () and scenario-based analytical performance (), together with descriptively more positive learning-experience profiles. Perceived learning support was positively associated with cognitive engagement and with learning satisfaction and behavioral intention, while cognitive engagement provided the clearest positive information about scenario performance. Question-level diagnostics identified interacting-behavior identification in Scenario 2 as the clearest candidate for targeted redesign because it combined relatively low absolute performance with a small between-configuration difference. These findings illustrate a three-level approach linking system outputs, within-system relationships, and assessment-informed redesign.
1. Introduction
Transportation engineering education increasingly requires students to reason about traffic systems whose behavior emerges from interactions among infrastructure, traffic demand, vehicles, and human decisions. Ramp-merging and freeway-weaving areas are representative examples: traffic states evolve through coupled changes in gap availability, speed coordination, lane-changing behavior, spatial competition, and responses among multiple vehicles [1,2,3]. Learning these processes therefore involves more than recalling concepts such as gap acceptance or traffic conflict. Students need to identify relevant cues, trace interactions over time, explain how local actions contribute to conflict development, and evaluate possible interventions. These requirements reflect the system-level reasoning expected in engineering education [4,5] and are becoming more important as transportation curricula address increasingly digital, connected, and intelligent systems. Recent discussions of undergraduate transportation education have highlighted the limited curricular space traditionally allocated to the field and the need for stronger preparation in emerging transportation technologies, while work on intelligent transportation systems education has similarly emphasized the integration of contemporary tools, virtual environments, simulation, and practice-oriented learning [6,7,8].
A persistent instructional difficulty is that these dynamic relationships are commonly introduced through lectures, equations, diagrams, and static cases. Such representations remain necessary for establishing fundamental concepts, but they provide limited access to the temporal coupling through which traffic interactions develop. A merging or weaving conflict is not produced by a single vehicle or isolated decision; it unfolds through mutually dependent trajectory, speed, and gap adjustments. Simulation can make these processes observable and controllable, allowing students to inspect evolving traffic states, compare alternative conditions, and revisit interactions from different perspectives. The educational question, however, is not simply whether simulation can represent a traffic process more realistically, but whether that representation is organized into an instructional system that helps students interpret what they observe and translate it into engineering reasoning.
1.1. Simulation-Supported Learning in Transportation and Engineering Education
Transportation education has a substantial, although fragmented, history of using simulation and interactive modeling. Early studies introduced simulation into transportation systems analysis and planning courses to move students beyond formula application toward interpretation, judgment, and problem solving [9,10,11]. An analytic review of transportation engineering instructional practices subsequently found considerable experimentation with simulation, visualization, and active learning, but also identified an evidence base dominated by individual institutions, limited cross-study accumulation, and frequent reliance on post-instruction assessment rather than stronger comparative designs [12]. Thus, the field established the pedagogical potential of simulation relatively early, while rigorous and integrated evaluation developed less consistently.
Recent transportation-specific studies show that this direction remains active. Liu et al. incorporated computer-based virtual simulation into a traffic-system simulation course, while Zhu et al. organized traffic-engineering learning around an integrated signal-design activity combining engineering design, programming, and immersive representation [13,14]. These studies illustrate a shift from software demonstration toward active and practice-oriented instructional arrangements. At the same time, their evidence remains largely based on individual course implementations and reported achievement or learner feedback, leaving a need for more structured evaluations that distinguish different learning outputs and clarify what part of the instructional arrangement is being evaluated.
The broader engineering-education literature reinforces this point. Meta-analytic evidence generally supports simulation and virtual laboratories as useful learning resources. Chernikova et al. reported positive effects of simulation-based learning on knowledge and complex skills [15], and more recent meta-analyses have reported positive overall effects of virtual laboratories and virtual reality on engineering outcomes and practical skills [16,17]. However, these effects are highly heterogeneous across disciplines, tasks, technologies, and instructional approaches. Yang et al., for example, found stronger practical-skill outcomes when virtual-reality activities were integrated with conventional instruction rather than treated as an isolated replacement [17]. A recent systematic review of experimental research in engineering education likewise showed that virtual and immersive technologies are implemented through diverse pedagogical designs, with active and experiential learning playing an important role [18].
The evidence is therefore not well summarized by the simple proposition that greater immersion or more advanced simulation produces better learning. Richer immersive environments have been found to increase presence while reducing learning and increasing cognitive load [19], and greater immersion does not consistently produce superior training performance [20]. Conversely, interactive and immersive environments can support engagement and learning when appropriately structured, with instructional scaffolding also shaping learning outcomes and learner behavior in simulation environments [21,22,23]. Taken together, these findings suggest that simulation can expand what learners observe and manipulate, but technological richness alone does not determine learning outcomes. How the technology is organized instructionally remains central.
1.2. A Socio-Technical Systems Perspective on Simulation-Supported Instruction
This distinction motivates a systems perspective. A system derives its behavior from relationships among its elements rather than from isolated components [24]. Socio-technical systems theory extends this principle to arrangements in which technical resources, people, tasks, organizational practices, and environmental conditions operate together [25]. In education, related work argues against separating pedagogy from technology because the instructional meaning of a technology depends on how it is embedded in goals, activities, roles, and institutional practice [26]. Constructive alignment similarly emphasizes coordination among intended outcomes, learning activities, and assessment [27].
Recent engineering-education research further supports this perspective. A scoping review of sociotechnical thinking in engineering education highlighted the roles of learner characteristics, disciplinary culture, prior knowledge, and the organization of technical and social dimensions [28]. Research on technology-supported learning likewise emphasizes relationships among technological features, pedagogy, and learners’ cognitive processes rather than treating technology as an independent educational input [29]. These perspectives support a basic methodological principle for the present study: outcomes observed after a technology has been embedded in classroom practice should not automatically be attributed to the software alone.
For simulation-supported transportation instruction, the platform, instructional activities, instructor guidance, learner participation, and assessment operate as parts of a coordinated configuration. When these elements change together, the empirical unit of comparison is the instructional configuration as a whole. Estimating the independent contribution of the platform would require its functions to be manipulated or measured separately; without such separation, a software-only interpretation risks attributing to the technical artifact outcomes that arise from the broader instructional system.
1.3. Learning Processes, Experience, and Scenario-Based Performance
A systems evaluation also requires different educational indicators to remain conceptually distinct. Simulation studies commonly assess knowledge, performance, engagement, realism or presence, satisfaction, and technology acceptance, but these measures are not interchangeable. Greater realism often improves perceived presence or user experience without necessarily improving knowledge or task performance [19,30]. Likewise, learner engagement and demonstrated performance do not always change in parallel [20,31]. Participant-reported experience should therefore complement rather than substitute for objective or performance-based outcomes.
Perceived learning support (PLS) represents students’ perceptions of whether the instructional configuration supports their understanding of traffic-conflict mechanisms, vehicle interactions, and connections between theoretical knowledge and traffic situations. PLS is therefore treated as an instructional-perception indicator rather than as an objective learning outcome.
Perceived realism and interactivity (PRI) represent the perceived representational quality of the learning environment: whether the target situation is credibly represented and whether learners can inspect or act on that representation. Research on immersive and interactive learning indicates that these features can influence presence, attention, and learner experience, but their educational consequences depend on how interaction is aligned with the learning activity [23,30]. PRI is therefore treated as an experiential indicator rather than a direct proxy for learning effectiveness.
Cognitive engagement (CE) represents a learner-process indicator. Models of immersive learning position cognitive and affective processes between technological features and observable outcomes [32], while empirical studies have associated cognitive engagement with performance in simulation-supported environments [33,34]. Li et al. further showed that task-focused and resource-management engagement patterns were associated with stronger task performance than more receptive patterns [34]. CE is therefore examined as an observed system indicator rather than as evidence of a causal mediating mechanism.
Learning satisfaction and behavioral intention (LSBI) are treated as an acceptance-oriented output rather than as evidence of objective learning. Satisfaction has been associated with intentions to continue using simulation-based learning environments and with expectations, perceived value, motivation, and perceived learning experience [35]. Recent multi-institution evidence similarly indicates that satisfaction reflects learner, course, technical, interaction, and presence-related factors [36]. LSBI therefore characterizes acceptance of the instructional configuration while remaining analytically distinct from demonstrated knowledge or performance.
This distinction also motivates the inclusion of scenario-based analytical performance. Knowledge tests can establish whether students recognize relevant concepts and principles, whereas engineering competence also requires their application under contextual constraints. Authentic-assessment research has shown that computer-supported engineering tasks can reveal decision processes not captured by conventional assessments [37], while recent computer-based authentic assessment further illustrates how complex simulated tasks can expose patterns of engineering reasoning and task organization [38]. In transportation engineering, scenario tasks can therefore examine whether students can locate conflicts, identify interacting vehicles, connect observable cues with conflict mechanisms, and transfer those principles to related traffic situations.
Aggregate performance alone, however, provides limited guidance for instructional redesign. Process-level evaluation and log-data analysis have shown that overall outcomes can conceal variation in how learners engage with simulation-supported tasks [31,39]. A small between-configuration difference does not necessarily indicate poor performance, and low absolute performance can remain an instructional concern even when the simulation-supported configuration shows a positive comparative difference. Scenario- and question-level diagnosis should therefore consider absolute performance together with between-configuration contrasts. Such diagnostics identify candidate areas for subsequent instructional modification rather than demonstrated system defects.
1.4. Research Gaps, Study Contributions, and Research Questions
Three gaps follow from this literature. First, transportation-specific simulation education has a long history and recent studies demonstrate renewed interest in virtual simulation and integrated engineering activities [12,13,14], but much of the direct evidence remains based on individual course cases, post-instruction responses, or limited sets of outcomes. Classroom evaluations that distinguish formal knowledge, applied scenario performance, and learner-reported experience remain comparatively limited.
Second, realism, interactivity, engagement, satisfaction, knowledge, and applied performance represent different parts of the learning system and need not change in the same direction [19,34,36]. Evaluating simulation through a single claim of “effectiveness” therefore provides limited information about how an implemented instructional configuration functions. A more informative evaluation should distinguish these outputs and examine theoretically relevant relationships among selected indicators without assuming a causal path.
Third, assessment is commonly used to compare overall instructional outcomes but less often to identify what should be redesigned next. Authentic and scenario-based assessments can capture forms of engineering reasoning different from those represented by conventional tests [37,38], while aggregate scores can conceal variation across scenarios and reasoning tasks. System improvement therefore requires diagnostic evidence that considers both absolute performance and between-configuration differences.
These gaps are particularly relevant to contemporary transportation education, where increasingly advanced simulation technologies are entering curricula but their technical capability does not itself establish educational value [7,8,13,14]. The more consequential question is how such technology performs after being embedded within a coordinated instructional arrangement and how assessment evidence can inform subsequent redesign.
To address these issues, the present study evaluates a research-team-developed CARLA–SUMO platform after its integration into an undergraduate transportation engineering course. Rather than treating the software as an isolated intervention, the study defines a bounded socio-technical instructional system comprising technical resources, instructional organization, learner processes, and assessment and feedback. A class-level controlled quasi-experiment involving 174 students in four intact classes is examined through three complementary evaluation levels: configuration-level comparison, within-system relational analysis, and scenario- and question-level diagnosis for subsequent redesign.
The study contributes a systems-oriented evaluation structure that keeps formal knowledge, scenario-based analytical performance, and learning-experience indicators analytically distinct while connecting overall instructional outputs, selected within-system relationships, and assessment-informed redesign. The diagnostic level further extends evaluation beyond whether one configuration performs better overall by identifying where subsequent instructional refinement may be warranted.
Accordingly, the study addresses the following research questions:
RQ1.
What configuration-level outcome pattern is observed across formal knowledge, scenario-based analytical performance, and learning-experience profiles under conventional and simulation-supported instruction?
RQ2.
What within-system relationships are observed among instructional perceptions, learner processes, and learning outcomes within the simulation-supported configuration?
RQ3.
What redesign priorities are suggested by scenario- and question-level diagnostic patterns that jointly consider absolute performance and between-configuration contrasts?
2. Methodology
2.1. System Definition and Evaluation Framework
The focal system in this study was the classroom instructional arrangement used to teach the analysis of traffic conflicts in ramp-merging and weaving situations. The empirical study began after the research team had developed the CARLA–SUMO platform and configured it for classroom use. Its system boundary extended from the introduction of the learning objectives and the assessment of students’ initial characteristics to the immediate post-instruction evaluation of knowledge, scenario-based analytical performance, and learning experience. The surrounding environment included the course curriculum, classroom organization, instructor expertise, and institutional teaching resources, while students’ prior learning and simulation-related experience were treated as learner inputs at system entry. Long-term retention, professional transfer, and the implementation and evaluation of a subsequent redesign iteration were outside the scope of the present study.
Within this boundary, conventional and simulation-supported teaching were treated as two alternative instructional configurations. The conventional configuration relied on instructor explanation, slides, diagrams, static traffic cases, and classroom discussion. The simulation-supported configuration combined dynamic traffic representation, controllable scenarios, structured analytical tasks, teacher guidance, guided observation, individual learner operation, discussion, and debriefing. The unit of comparison was therefore the instructional configuration as a whole rather than the simulation platform in isolation. Because several technical and instructional elements changed simultaneously, the observed group differences cannot be attributed to CARLA–SUMO or to any single platform function independently.
The simulation-supported configuration was conceptualized as comprising four interrelated elements: technical resources, instructional organization, learner processes, and assessment and feedback. Technical resources provided the co-simulation environment, scenario control, interactive representation, and data recording. Instructional organization connected these resources to course objectives through scenario selection, teacher prompts, guided observation, discussion, and debriefing. Learner processes included prior knowledge, interest, and relevant experience as inputs, together with attention, cognitive engagement, interpretation, and knowledge construction during instruction. Assessment captured formal knowledge, scenario-based analytical performance, and participant-reported indicators of the learning process and instructional acceptance. Their relationships are summarized in Figure 1.
Figure 1.
Socio-technical instructional system boundary and three-level evaluation framework. The dashed feedback path represents proposed assessment-informed feedback for a subsequent redesign iteration rather than an empirically tested closed loop.
The framework also distinguishes implemented system features from participant-level indicators. Platform control, teacher guidance, and classroom discussion were components of the instructional design, but their separate effects were not directly measured. PLS, PRI, CE, post-instruction knowledge, scenario performance, and LSBI were used as observable indicators of selected system dimensions. The relational analysis therefore examined associations among these indicators rather than estimating the independent causal effect of every system component.
The evaluation was conducted at three complementary levels. First, configuration-level analysis compared knowledge, scenario-based performance, and learning-experience profiles across the two instructional configurations. Second, within-system analysis examined relationships among technical perceptions, instructional support, learner processes, and learning outputs within the simulation-supported group. Third, scenario- and task-question-level diagnostics integrated absolute performance with between-configuration contrasts to identify candidate priorities for subsequent instructional redesign. This structure connects system performance, internal relationships, and assessment-informed feedback while avoiding claims of a complete causal mechanism or an empirically closed feedback loop.
2.2. Study Design and Participants
A class-level controlled quasi-experimental design with a pre-test–intervention–post-test structure was used to compare the two instructional configurations. Participants came from four intact undergraduate classes within the same transportation engineering course. Existing course scheduling and classroom organization precluded the reassignment of individual students across classes. Two classes received the conventional configuration, and two received the simulation-supported configuration. Because individual students were not randomized and the allocation of the four classes was not documented as random, the study was treated as a class-level quasi-experiment rather than a fully randomized trial. Participants completed baseline assessments before instruction and immediate post-instruction assessments after their respective teaching sessions.
The study included 174 undergraduate students, with 87 receiving the conventional configuration and 87 receiving the simulation-supported configuration. Each class met for two 45-min periods per week over eight weeks, yielding 16 scheduled class periods (720 min) per class. All four classes were taught by the same instructor, addressed the same learning objectives and core content, and were conducted within this common schedule. The course content focused on traffic conflicts and vehicle interactions in ramp-merging and weaving situations. The principal difference between the configurations concerned how this content was represented and how the associated learning activities were organized, as described in the following subsections. These common conditions helped limit variation related to the instructor, topic coverage, and scheduled instructional time. However, because each configuration comprised only two intact classes, unmeasured class-level differences could not be separated fully from configuration differences.
Before instruction, participants provided information on gender, driver’s license status, driving experience, frequent prior exposure to driving-related games or simulation software, prior coursework in transportation engineering or traffic safety, and initial interest in the course content. Participants additionally completed a knowledge pre-test. These variables were collected to characterize the sample and examine observed baseline differences rather than as primary learning outcomes. All participants confirmed that they were at least 18 years old and provided informed consent before taking part. The study was reviewed and approved by the School of Modern Posts, School of Intelligent Transportation, Nanjing University of Posts and Telecommunications, before data collection. Participation was voluntary and did not affect course grades, and all participant data were analyzed and reported in anonymized or aggregated form.
2.3. Instructional System Configurations
The two instructional configurations addressed the same transportation engineering content but organized its representation and classroom enactment differently. Both configurations combined instructional materials, instructor guidance, learner activity, and classroom discussion. They differed primarily in how traffic interactions were represented, controlled, and incorporated into the analytical activities.
2.3.1. Conventional Instructional Configuration
The conventional configuration followed an instructor-led classroom format. Core concepts related to ramp merging, weaving sections, vehicle interaction, and traffic conflict formation were introduced through instructor explanation, slides, roadway diagrams, and six static traffic cases corresponding to the six scenario cases used in the simulation-supported configuration. Representative examples were used to explain how gap availability, speed coordination, lane-changing demand, and path competition contributed to the development of traffic conflicts.
Students examined the presented materials, responded to analytical questions, and participated in classroom discussion. They were asked to identify relevant vehicles and conflict locations, interpret the relationships represented in the cases, and explain the processes leading to the described traffic conditions. Temporal sequences of vehicle interaction were represented through diagrams, case descriptions, and instructor explanation rather than through continuously evolving traffic scenes.
2.3.2. Simulation-Supported Instructional Configuration
The simulation-supported configuration addressed the same concepts through six dynamic and controllable traffic scenario cases embedded in guided analytical activities. The scenarios represented lane changes, speed adjustments, limited gap availability, path competition, and conflict development under different traffic conditions. These representations allowed students to observe how local vehicle actions and surrounding traffic conditions jointly shaped the evolution of a traffic situation. The instructional focus and principal conditions of the six matched cases are summarized in Appendix A Table A1.
For each of the six instructional cases, the instructor introduced the learning objective and analytical focus, directed attention toward relevant vehicles and interaction cues, and prompted students to identify conflicts and explain the underlying processes. Students first examined the evolving scenario through guided observation and then operated it through their individual client workstations. Every student completed hands-on operation of all six scenarios. Classroom discussion and debriefing connected the observed traffic processes with the corresponding engineering concepts and analytical principles.
The simulation component was therefore embedded in an instructor-guided sequence rather than used as a stand-alone visual demonstration. Dynamic representation, scenario selection, structured analytical tasks, instructor prompts, guided observation, learner operation, discussion, and debriefing were organized as parts of the same instructional configuration. Across the simulation-supported instructional sessions, approximately one fifth of the available instructional time was devoted to instructor demonstration, three fifths to student operation, and one fifth to classroom discussion and debriefing.
2.3.3. Consistency Across Configurations
All four classes were taught by the same instructor, addressed the same learning objectives and core topics, and were conducted within the same scheduled class duration. The six instructional cases were matched one-to-one across configurations in traffic situation, conceptual focus, and analytical task; they differed in whether the case was represented statically or through a dynamic and controllable scenario. The brief platform orientation provided to the simulation-supported classes formed part of the scheduled duration and did not increase their total contact time. The same knowledge and scenario-based assessments were administered to all participants in the same sequence, followed by the learning-experience questionnaire corresponding to the assigned configuration.
The configurations differed in the form of traffic representation, the controllability of the presented situations, the opportunities for learner interaction, and the enactment of the analytical activities. These differences were interpreted jointly in the configuration-level analyses.
2.4. Technical Platform and Instructional Implementation
The technical subsystem used in the simulation-supported configuration was designed and developed by the research team for classroom use and then deployed in the participating course. It integrated CARLA version 0.9.14 and SUMO version 1.18.0 in a classroom-oriented co-simulation platform: CARLA provided the three-dimensional driving environment and ego-vehicle control, while SUMO generated background traffic and interaction vehicles. Their integration enabled ramp-merging and weaving scenarios to combine a controllable focal vehicle with parameterized surrounding traffic, allowing vehicle interactions and conflict development to be represented dynamically. The present study therefore examined the classroom deployment and educational evaluation stage of the platform lifecycle rather than the software as an isolated artifact.
Instructional cases were organized through a scenario library. Each case was linked to a traffic situation, an instructional focus, and a corresponding analytical task. Before a scenario was launched, the setup interface allowed the user to specify the initial viewpoint, weather, simulation time, vehicle type, traffic density, and data-recording location. These functions enabled the instructor to select cases and configure the traffic conditions required for a particular teaching activity.
The platform adopted a role-based client–server structure comprising one server host and an individual client workstation for each student. The server host supported scenario loading, traffic generation, and simulation control, while the student-side clients provided every participant with direct access for guided observation and hands-on scenario operation. The main console integrated classroom demonstration, student practice, data recording and replay, and system control. Students primarily operated the scenarios using a keyboard and mouse at their individual client workstations. A simulator workstation equipped with a steering wheel and pedals was also used, with all students taking turns to operate it. The same scenario organization was retained across instructor demonstration and learner practice.
Figure 2 summarizes the architecture that connected instructor-side control, the scenario library and parameter configuration, the CARLA–SUMO co-simulation engine, student-side access, and the teaching interface.
Figure 2.
Architecture and instructional use of the research-team-developed CARLA–SUMO platform. Platform-generated records supported replay, discussion, and debriefing; formal learning outcomes were collected separately through the knowledge tests, scenario-based tasks, and questionnaires.
Data generated during scenario operation could be recorded and replayed to support classroom discussion and post-activity debriefing. These records served an instructional review function and were not included as participant-level learning outcomes in the present analysis. Figure 3 complements the architecture diagram by presenting the main interfaces and the classroom deployment.
Figure 3.
Technical platform and classroom implementation of the simulation-supported instructional configuration. (a) Login and role access. (b) Main function console. (c) Scenario library. (d) Simulation setup interface. (e) Instructor-side CARLA–SUMO co-simulation. (f) Classroom deployment. (g) Learner driving view.
2.5. Experimental Procedure
The experiment followed a common sequence from baseline assessment to immediate post-instruction evaluation. After the pre-test, the two simulation-supported classes received a brief platform orientation at the beginning of their scheduled instructional sessions. The orientation covered role access, scenario entry, and basic operating controls. It formed part of the same scheduled class duration and did not increase the total contact time for the simulation-supported configuration. Table 1 summarizes the complete procedure.
Table 1.
Sequence of the class-level quasi-experimental teaching procedure.
The post-instruction assessments were administered in the same order in all four classes. The knowledge post-test and rubric-scored scenario tasks preceded the learning-experience questionnaire so that performance-based outcomes were recorded before participants completed self-reported evaluations of the instructional configuration.
2.6. Measures
All research instruments were administered in Chinese. Complete English-language translations of the instruments, together with the answer keys and scoring criteria used in the study, are consolidated in Appendix A.
2.6.1. Learner and Contextual Inputs
The participant background form recorded gender, driver’s license status, actual driving experience, frequent prior exposure to driving-related games or simulation software, prior coursework in transportation engineering or traffic safety, and initial interest in the course content. Driving experience was recorded using four categories: none, 0–2 years, 2–5 years, and more than 5 years. Frequent prior exposure to driving-related games or simulation software and prior transportation-related coursework were recorded as binary indicators. Initial interest was measured using a five-category item coded from 0 to 4, with higher scores indicating greater initial interest.
Participant type was also recorded in the background form. However, all participants were undergraduate students, so this variable showed no analytical variation and was not retained in the subsequent analyses. The remaining background variables were used to characterize the learner context, examine observed baseline differences between the two instructional configurations, and where theoretically relevant, serve as contextual covariates. The complete background form is provided in Appendix A.2.
2.6.2. Formal Knowledge Assessment
Formal knowledge was assessed using a pre-test and a post-test covering ramp merging, weaving sections, acceptable gaps, speed coordination, multi-vehicle interaction, traffic-conflict formation, and the application of these concepts to related traffic situations. The pre-test contained five multiple-choice questions and two true/false questions, each worth one point, together with one rubric-scored short-answer question worth three points. The maximum pre-test score was therefore 10 points.
The post-test contained eight multiple-choice questions and four true/false questions, each worth one point, together with three rubric-scored short-answer questions worth three, three, and two points, respectively. The maximum post-test score was 20 points. The two assessments covered overlapping core content but were not designed as parallel forms. The pre-test emphasized baseline recognition and a brief explanation of ramp-merging, weaving, gap availability, speed coordination, and conflict mechanisms, whereas the post-test sampled these same domains more broadly and included additional mechanism comparison and knowledge-transfer demands. A test blueprint mapping the items to their principal content domains, cognitive demands, and score contributions is provided in Appendix A.5. Objective items were scored using predefined answer keys, while the short-answer questions were scored using criteria based on the identification and explanation of relevant traffic-engineering concepts and conflict-formation mechanisms.
Because the pre-test and post-test had different maximum scores, their raw totals were converted to score ratios:
where and denote the raw pre-test and post-test scores, and denote the corresponding score ratios, and denotes the change in score ratio from pre-test to post-test. The pre-test ratio represented baseline knowledge, while the post-test ratio represented immediate post-instruction knowledge performance. The score-ratio change was retained as a supplementary indicator of within-participant change.
Converting the two totals to a common 0–1 range accounted for their different maximum scores but did not establish that the tests were psychometrically parallel, because they differed in length and item composition. Baseline-adjusted post-test performance was therefore treated as the primary formal knowledge outcome, with score-ratio change used as a supplementary outcome. The complete English-language test items, answer keys, and scoring criteria are provided in Appendix A.5.
2.6.3. Scenario-Based Analytical Assessment
Scenario-based analytical performance was assessed using three written tasks that required students to organize relevant traffic cues, explain vehicle interactions, and apply traffic-conflict concepts. Scenario 1 addressed conflict identification in a ramp-merging situation. Its four components assessed conflict-type identification, identification and explanation of the critical conflict location, analysis of contributing factors, and proposal of an appropriate improvement measure. The respective maximum scores were 2, 3, 3, and 2 points.
Scenario 2 addressed multi-vehicle interaction in a weaving section. Its four components assessed recognition of the scenario’s additional complexity, identification of the interacting vehicle behaviors, explanation of how traffic density affected conflict development, and judgment of the most important influencing factor. These components were scored on 2-, 3-, 3-, and 2-point scales, respectively.
Scenario 3 examined the application of conflict-formation principles to a closely spaced entrance–exit situation. Its four components assessed recognition and explanation of mechanisms shared with weaving sections, identification of indicators of increased conflict risk, comparison with a standard ramp-merging situation, and identification of an appropriate instructional focus. These components were scored on 3-, 3-, 2-, and 2-point scales, respectively.
Each scenario contributed a maximum of 10 points, producing an overall maximum score of 30. Responses were evaluated using predefined question-level rubrics that specified the mechanism-related elements required for partial and full credit. The three scenario totals and the overall score were used as applied learning outcomes. The 12 scenario-task question scores were additionally retained for the scenario- and task-question-level diagnostic analysis. The complete task prompts and question-level scoring rubrics are provided in Appendix A.4.
One trained rater scored all scenario-task responses. To assess inter-rater reliability, a class-stratified random subset of 52 response sets was selected, with 13 participants randomly sampled from each of the four classes. This subset represented 29.9% of the full sample. A second trained rater independently scored the selected responses while blinded to class membership, instructional configuration, and the scores assigned by the first rater. Inter-rater reliability was evaluated separately for each scenario total and for the overall 30-point score using two-way random-effects, absolute-agreement, single-measure intraclass correlation coefficients (ICC(2,1)). As shown in Table 2, all four point estimates indicated good inter-rater agreement according to the interpretive guidelines of Koo and Li [40], although the confidence intervals for Scenario 2 and the overall score extended slightly into the moderate-agreement range.
Table 2.
Inter-rater reliability of the scenario-based analytical performance scores.
2.6.4. Learning-Experience and Acceptance Indicators
Learning-experience and acceptance indicators were collected using two configuration-specific versions of a questionnaire developed for the present study. The initial item pool contained 26 items and was constructed around the course objectives, instructional activities, and four intended dimensions. The items were reviewed for content relevance by 12 faculty members with expertise in transportation engineering. Before the main study, the questionnaire was pilot-tested with 29 participants. Based on the pilot results and item-level review, six items showing weak correspondence with the intended dimensions or unsuitable wording were removed before formal data collection. The resulting questionnaire contained 20 items, with five items retained for each of the four intended dimensions.
PLS represented students’ perceptions of whether the instructional configuration supported their understanding of traffic-conflict mechanisms, vehicle interactions, and connections between theoretical knowledge and traffic situations. CE covered self-reported attention, active thinking, participation in discussion, learning interest, and effort invested in understanding vehicle interactions. PRI represented the perceived representational quality of the learning environment, combining contextual realism with the interactive and dynamic presentation of vehicle interactions. These attributes were considered jointly because both concern the extent to which the instructional representation made evolving traffic processes observable, interpretable, and experientially accessible to learners.
LSBI was treated as an acceptance-oriented output of the instructional configuration rather than as a direct measure of subsequent behavior. Its five items jointly captured satisfaction with the teaching approach, perceived practical value, willingness to participate in similar activities in other courses, perceived improvement in the overall learning experience, and willingness to recommend the approach to other students. The composite therefore represented students’ overall acceptance of the instructional configuration, including both evaluative satisfaction and stated intention toward future use.
The two questionnaire versions retained the same dimensional organization and conceptually corresponding item positions, but their wording referred to the instructional configuration experienced by each group. The simulation-supported version referred to the simulation system, dynamic scenarios, interactive activities, and post-simulation debriefing, whereas the conventional version referred to classroom instruction, diagrams, static cases, discussion, and post-instruction review. Several items in the simulation-supported form also made explicit comparisons with conventional instruction, while the corresponding conventional-form items used absolute evaluations. The resulting composite scores were therefore treated as conceptually aligned learning-experience profiles rather than as measurement-invariant versions of an identical scale [41]. Construct validity and internal consistency were therefore evaluated separately for the two questionnaire versions. Both complete questionnaire versions are provided in Appendix A.3.
2.7. Analytical Strategy
The analytical strategy followed the three evaluation levels defined in Section 2.1. Configuration-level analyses and scenario- and task-question-level diagnostic analyses used the full sample () to address RQ1 and RQ3, respectively. Within-system relational analyses used the 87 participants in the simulation-supported configuration to address RQ2. The final dataset contained complete records for all variables used in these analyses; therefore, no imputation was required.
Before analysis, the participant-level records were screened for duplicate identifiers, missing values, out-of-range responses, and inconsistencies between item scores and derived totals. Means and standard deviations (SDs) were used to summarize approximately continuous score variables, while frequencies and percentages were used for categorical variables. Medians and interquartile ranges were used for the five-category initial-interest item and were additionally examined for markedly asymmetric score distributions.
All analyses were conducted using Python version 3.9.13. Regression-based inference used HC3 heteroskedasticity-consistent standard errors. Bootstrap confidence intervals were estimated using the percentile method with 5000 resamples. For configuration-level and diagnostic between-configuration comparisons, participant records were resampled separately within the conventional and simulation-supported configurations, preserving 87 participants per configuration in each resample. For within-system sensitivity analyses, records were resampled separately within the two simulation-supported classes, preserving their respective sample sizes of 43 and 44. All statistical tests were two-sided, with a nominal significance level of . Uncertainty was reported using 95% confidence intervals, and interpretation emphasized the magnitude, direction, and precision of estimated differences and associations rather than statistical significance alone.
Construct validity of the learning-experience questionnaire was examined separately within the conventional and simulation-supported configurations because the two forms used configuration-specific wording and were not assumed to be measurement-invariant. Given the ordinal five-category item responses, exploratory factor analysis was based on polychoric correlation matrices. Sampling adequacy was evaluated using the Kaiser–Meyer–Olkin (KMO) statistic and Bartlett’s test of sphericity. The number of factors was examined using parallel analysis and the Kaiser criterion. Principal-axis factoring with oblimin rotation was then used to estimate the correlated factor structure. Factor interpretation considered primary loadings, cross-loadings, communalities, and correspondence with the four intended dimensions. Convergent validity was assessed using average variance extracted (AVE) and composite reliability (CR), and discriminant validity was examined by comparing the square root of each construct’s AVE with the corresponding inter-factor correlations. Internal consistency was additionally evaluated using Cronbach’s alpha.
2.7.1. Configuration-Level Analysis
Baseline characteristics were summarized separately for the conventional and simulation-supported configurations. The pre-test score ratio was compared using a Welch independent-samples t-test, and the five-category initial-interest item was examined using the Mann–Whitney U test. Categorical variables were examined using Pearson’s chi-square test or an exact test when expected cell frequencies were small. These comparisons were used to describe observed baseline differences and were not treated as evidence that the intact classes were statistically equivalent. Standardized mean differences, rank-biserial correlations, or Cramer’s V, as appropriate, were also examined to describe the magnitude of baseline imbalance.
The primary formal-knowledge analysis used the post-test score ratio as the dependent variable in a baseline-adjusted linear model containing instructional configuration and the pre-test score ratio. The configuration-by-pre-test interaction was examined as a diagnostic of the homogeneity-of-slopes assumption. If the interaction indicated meaningful nonparallel slopes, conditional configuration differences were reported rather than a single common adjusted difference. The unadjusted post-test difference and the between-configuration difference in score-ratio change () were reported as complementary results. Because the pre-test and post-test differed in length and item composition and were not psychometrically parallel, score-ratio change was interpreted as a supplementary outcome rather than as the primary estimate of learning.
Overall scenario-based analytical performance was compared between configurations using the 30-point total score. A complementary adjusted model included instructional configuration, the pre-test score ratio, and initial interest, all of which were measured before instruction. Post-instruction knowledge was not included as a covariate in this configuration–comparison model because it was measured after instruction and could lie downstream of the instructional configuration. For the knowledge and overall scenario outcomes, unadjusted group means, raw mean differences, and Cohen’s d values were reported. Confidence intervals for the raw mean differences and Cohen’s d values were obtained from 5000 percentile bootstrap resamples conducted separately within the two instructional configurations. Positive differences were defined as favoring the simulation-supported configuration.
The four questionnaire composites were summarized separately by instructional configuration on their original 0–4 scales. Internal consistency was evaluated using Cronbach’s alpha separately within each configuration. Between-configuration differences in PLS, CE, PRI, and LSBI were described using means, standard deviations, raw mean differences, and Cohen’s d. The 95% confidence intervals for the raw and standardized differences were estimated from 5000 percentile bootstrap resamples conducted separately within each instructional configuration. Because the two questionnaire forms used configuration-specific wording and measurement invariance was not established, these contrasts were interpreted as descriptive comparisons of learning-experience profiles rather than as inferential comparisons of strictly equivalent scale scores.
One post-test item explicitly referred to the type of instructional activity that could support understanding of traffic-conflict mechanisms. To examine whether the formal-knowledge comparison depended on this item, the post-test score ratio was recalculated after excluding it and rescaling the remaining 19 available points to a 0–1 range. The baseline-adjusted knowledge analysis was then repeated using this alternative score.
Because driving experience and gender showed the largest observed baseline imbalances, the primary knowledge and overall scenario-performance models were repeated with driving experience (four categories) and gender entered separately and jointly as sensitivity covariates.
Instructional configuration was implemented at the level of four intact classes, with two classes receiving each configuration. Because four clusters were insufficient for dependable cluster-robust or multilevel variance estimation, participant-level inferential results were not interpreted as if individual randomization had occurred. Class-specific outcome summaries and the consistency of the observed direction across the two classes within each configuration were therefore examined as a descriptive sensitivity check. This check could indicate whether a configuration contrast was disproportionately influenced by one class, but it could not eliminate class-level confounding. Accordingly, the participant-level confidence intervals and p-values should be interpreted as conditional on the four observed classes and may not capture the full uncertainty associated with class-level assignment and between-class variation.
2.7.2. Within-System Relational Analysis
RQ2 was examined only within the simulation-supported configuration (), thereby avoiding the assumption that the two configuration-specific questionnaire forms were measurement-invariant. Pearson correlations were first used to describe the bivariate relationships among PLS, PRI, CE, post-instruction knowledge, overall scenario performance, and LSBI. Confidence intervals for the Pearson correlation coefficients were calculated using Fisher’s z transformation. Spearman correlations were examined as a rank-based sensitivity check.
Three prespecified multivariable linear regressions represented the relationships shown in the within-system component of the evaluation framework:
Here, and denote the pre-test and post-test score ratios, respectively. distinguishes the two simulation-supported classes, and represents frequent prior exposure to driving-related games or simulation software. The first model examined whether PLS and PRI were associated with CE after accounting for initial interest and class membership. The second examined the conditional associations of CE and post-instruction knowledge with scenario performance after accounting for baseline knowledge, prior simulation-related exposure, and class membership. The third examined the associations of PLS, PRI, CE, and post-instruction knowledge with LSBI after accounting for class membership.
For each regression, unstandardized coefficients, standardized coefficients, and 95% confidence intervals were reported. HC3-based confidence intervals provided the primary coefficient inference. Class-stratified percentile bootstrap confidence intervals based on 5000 resamples were examined as a sensitivity analysis. Linearity and residual patterns were inspected graphically, and variance inflation factors were used to assess excessive overlap among predictors. Observations with unusually large Cook’s distance, leverage, or studentized residuals were examined through influence sensitivity analyses. Such observations were not removed from the primary analysis solely because they exceeded a diagnostic guideline.
All variables in the relational analysis were observed composite scores. The regressions therefore estimated conditional associations among selected system indicators rather than latent-variable relationships or the independent causal effects of individual system components. Because PLS, PRI, CE, and LSBI were measured at the same post-instruction occasion, their temporal ordering was not empirically established. The regression system was not interpreted as a causal path model, and no causal mediation effect was estimated.
2.7.3. Scenario- and Task-Question-Level Diagnostic Analysis
RQ3 used between-configuration contrasts for the three scenario totals and the 12 rubric-scored task questions. Because the maximum available score differed across questions, each question score was also expressed as a proportion of its available score for descriptive comparison. Raw mean differences and Cohen’s d values were calculated as simulation-supported minus conventional, such that positive values indicated higher performance under the simulation-supported configuration. Corresponding 95% confidence intervals were estimated from 5000 percentile bootstrap resamples conducted separately within each instructional configuration. Two-sided Welch independent-samples t-tests were used to obtain the unadjusted p-values for the scenario- and question-level comparisons.
Multiplicity was addressed using the Holm procedure separately for the family of three scenario-level tests and the family of 12 question-level tests. Holm-adjusted p-values were reported as supplementary statistical information. Diagnostic interpretation used two complementary dimensions: (1) the normalized score level within the simulation-supported configuration as an indicator of absolute performance and (2) the magnitude and uncertainty of the between-configuration standardized difference as an indicator of comparative performance. No single numerical cutoff was used to classify an output as weak. Outputs combining comparatively low absolute performance with a small or uncertain between-configuration difference were given the strongest priority for subsequent redesign. Comparatively low absolute performance accompanied by a larger positive configuration difference was interpreted as a remaining learning challenge despite a stronger relative result under simulation-supported instruction, whereas a small configuration difference accompanied by moderate or relatively high absolute performance was interpreted as limited comparative separation rather than evidence of poor performance. All resulting redesign implications were treated as assessment-informed and provisional rather than as evidence of confirmed system defects.
3. Results and Discussion
3.1. Baseline Characteristics and System Context
The 174 participants were drawn from four intact undergraduate classes. The two classes receiving the conventional configuration included 45 and 42 participants, respectively, whereas the two simulation-supported classes included 43 and 44 participants, respectively. Class sizes were therefore closely balanced within and between the two instructional configurations. All 174 participants had complete records for the baseline variables and were included in the baseline analysis.
Table 3 summarizes the observed learner and contextual inputs. Initial interest had a median of 2 in both configurations. The Mann–Whitney test provided little evidence of a between-configuration difference in its distribution (, , ). The mean pre-test ratio was 0.485 (SD = 0.189) in the conventional configuration and 0.505 (SD = 0.193) in the simulation-supported configuration. The corresponding difference was 0.0195 (95% CI [−0.0377, 0.0768]), , , and .
Table 3.
Baseline characteristics by instructional configuration.
None of the observed baseline comparisons reached the nominal significance threshold. Driving-experience composition showed the largest observed imbalance (), followed by gender composition (); the remaining effect-size estimates were small. The absence of statistically significant baseline differences was not interpreted as evidence of baseline equivalence or as eliminating possible class-level confounding.
3.2. Configuration-Level Learning Outcomes
The configuration-level analysis addressed RQ1 by examining formal knowledge, scenario-based analytical performance, and learning-experience profiles as complementary outputs of the two instructional configurations.
3.2.1. Formal Knowledge Outcomes
The mean post-test ratio was 0.503 (SD = 0.249) in the conventional configuration and 0.610 (SD = 0.254) in the simulation-supported configuration. The unadjusted mean difference was 0.107, corresponding to . The score-ratio change was also higher in the simulation-supported configuration, with means of 0.105 (SD = 0.243) and 0.018 (SD = 0.205), respectively. Because the pre-test and post-test differed in length and item composition, this change score was interpreted as a supplementary indicator rather than as the primary knowledge outcome. Table 4 summarizes the configuration-level performance outcomes.
Table 4.
Configuration-level knowledge and scenario-based outcomes.
In the primary baseline-adjusted model, the simulation-supported configuration remained positively associated with the post-test ratio after accounting for the pre-test ratio (, 95% CI [0.028, 0.160], ). The pre-test ratio was also positively associated with post-test performance (, 95% CI [0.504, 0.846], ). The model explained 29.6% of the variance in post-test ratios (adjusted ).
The configuration-by-pre-test interaction was not clearly supported (, 95% CI [−0.554, 0.139], ), providing no indication that the configuration contrast depended strongly on initial knowledge within the observed range. Removing Post-test Item 7 and rescaling the remaining 19 points produced a similar adjusted configuration coefficient (, 95% CI [0.032, 0.163], ). The knowledge result was therefore not dependent on the instructionally explicit wording of that item.
The adjusted configuration coefficient also remained positive when driving experience was added as a four-category covariate, when gender was added, and when both were added jointly. Across these sensitivity models, the coefficient ranged from 0.077 to 0.088, and each corresponding confidence interval excluded zero. The observed knowledge contrast was therefore reduced slightly, but not eliminated, after accounting for the largest baseline imbalances.
3.2.2. Scenario-Based Analytical Performance
The mean overall scenario score was 11.632 (SD = 4.796) in the conventional configuration and 15.540 (SD = 5.182) in the simulation-supported configuration. The raw difference was 3.908 points on the 30-point assessment, corresponding to . This standardized contrast was larger than the corresponding contrast in post-instruction knowledge.
After adjustment for the pre-test ratio and initial interest, the configuration coefficient remained positive (, 95% CI [2.304, 5.050], ). Both the pre-test ratio (, 95% CI [5.709, 13.303], ) and initial interest (, 95% CI [0.332, 1.653], ) were positively associated with scenario performance. The adjusted model explained 30.8% of the variance in overall scenario scores (adjusted ).
Adding driving experience, gender, or both to the adjusted model produced configuration coefficients ranging from 3.701 to 3.799 points, all with . The configuration contrast was therefore not explained by the observed differences in these baseline characteristics.
Class-specific descriptive statistics are reported in Table 5. Pre-test performance was broadly overlapping across the four classes. Both simulation-supported classes had higher mean post-test ratios and scenario-based analytical performance than either conventional class. This directional consistency indicates that the aggregate configuration differences were not driven solely by one class. However, with only four intact classes, these descriptive patterns cannot separate configuration differences from unmeasured class-level influences and should not be interpreted as a substitute for cluster-level inference.
Table 5.
Class-specific descriptive statistics for the primary learning outcomes.
3.2.3. Learning-Experience Profiles
Before the learning-experience profiles were compared, the intended factor structure was evaluated separately for the two questionnaire versions. The data were suitable for factor analysis in both configurations: the KMO values were 0.914 for the conventional version and 0.933 for the simulation-supported version, and Bartlett’s tests of sphericity were significant in both cases (). Parallel analysis and the Kaiser criterion both supported retention of four factors in each configuration.
The construct validity and reliability results for both questionnaire versions are summarized in Table 6. The rotated solutions were consistent with the intended PLS, CE, PRI, and LSBI structure. Primary loadings ranged from 0.681 to 0.791 in the conventional configuration and from 0.693 to 0.794 in the simulation-supported configuration. The largest absolute cross-loadings were 0.103 and 0.109, respectively, and all 20 items loaded most strongly on their intended factors. AVE values ranged from 0.522 to 0.550 in the conventional configuration and from 0.546 to 0.559 in the simulation-supported configuration, while CR values ranged from 0.845 to 0.859 and from 0.857 to 0.864, respectively. In both versions, the square root of each construct’s AVE exceeded its correlations with the other factors, supporting the empirical distinction among the four intended dimensions. The complete rotated factor-loading matrices are provided in Appendix B.
Table 6.
Construct validity and reliability of the learning-experience questionnaire.
Participants in the simulation-supported configuration reported numerically higher scores on all four learning-experience dimensions (Table 7). The largest standardized profile contrast was observed for PRI (), followed by LSBI (), PLS (), and CE ().
Table 7.
Configuration-specific learning-experience profiles.
The configuration-specific internal-consistency estimates ranged from 0.691 to 0.778. Seven of the eight coefficients exceeded 0.70, while the conventional PRI coefficient was marginally below this value (). The four composites therefore showed generally acceptable internal consistency within each configuration. Nevertheless, because the questionnaire forms used configuration-specific wording and measurement invariance was not established, the between-configuration contrasts were retained as descriptive learning-experience profiles.
Taken together, the configuration-level results showed a differentiated output pattern: the simulation-supported configuration had a smaller standardized contrast in formal knowledge, a larger contrast in scenario-based analytical performance, and a consistently higher participant-reported learning-experience profile. This pattern characterizes the performance of the coordinated instructional configuration across multiple output domains; it does not isolate the independent effect of the simulation platform or any other individual system component.
3.3. Within-System Relationships in the Simulation-Supported Configuration
The within-system analysis included all 87 participants in the simulation-supported configuration. Figure 4 presents the bivariate relationships among the six focal indicators. PLS and PRI were positively correlated with CE, with (95% CI [0.115, 0.496], ) and (95% CI [0.068, 0.459], ), respectively. CE and post-instruction knowledge were both positively correlated with scenario-based analytical performance, with (95% CI [0.240, 0.586], ) and (95% CI [0.219, 0.572], ), respectively.
Figure 4.
Pearson correlations among the six focal indicators within the simulation-supported configuration (). PLS, PRI, CE, and LSBI are 0–4 composite scores; post-instruction knowledge is a 0–1 score ratio; scenario-based analytical performance is scored from 0 to 30. The correlations are descriptive within-system associations and do not establish temporal or causal relationships.
PLS was also positively correlated with LSBI (, 95% CI [0.061, 0.453], ), whereas the bivariate correlations of PRI, CE, and post-instruction knowledge with LSBI were smaller and their confidence intervals included zero. Scenario performance was positively correlated with LSBI (, 95% CI [0.122, 0.501], ). Spearman sensitivity correlations retained the direction of all 15 Pearson correlations, and the largest absolute difference between the corresponding coefficients was 0.051.
The three prespecified regression models are summarized in Table 8. The largest variance inflation factor across the models was 1.33, providing no indication that coefficient interpretation was materially affected by overlap among the included predictors. No observations were removed from the primary analyses. Model-specific results and the corresponding sensitivity checks are reported below.
Table 8.
Within-system HC3 regression models for the simulation-supported configuration.
3.3.1. Conditional Associations with Cognitive Engagement
The cognitive-engagement model explained 15.6% of the observed variance (adjusted ). After initial interest and class membership were held constant, PLS had a positive conditional association with CE (, , HC3 95% CI [0.021, 0.382], ). The corresponding class-stratified bootstrap interval was also positive [0.026, 0.369].
The coefficient for PRI was positive but estimated less precisely (, , HC3 95% CI [−0.024, 0.465], ; bootstrap 95% CI [−0.020, 0.446]). Neither initial interest nor class membership showed a clearly estimated conditional association with CE. Single-case deletion checks preserved the positive directions of both the PLS and PRI coefficients. However, the PLS interval sometimes included zero after influential observations were excluded. Its relationship with CE was therefore interpreted as positive but sensitivity-qualified rather than uniformly stable across all diagnostic specifications.
3.3.2. Conditional Associations with Scenario-Based Analytical Performance
The scenario-performance model explained 39.2% of the observed variance (adjusted ). CE showed the clearest positive conditional association with scenario performance (, , HC3 95% CI [0.967, 4.559], ). Its class-stratified bootstrap interval was also positive [1.124, 4.570], and the coefficient remained positive and clearly estimated across the single-case deletion checks.
Post-instruction knowledge also had a positive coefficient, but its primary HC3 interval narrowly included zero (, , HC3 95% CI [−0.150, 7.887], ). The corresponding bootstrap interval was slightly above zero [0.095, 7.935]. Because the two inferential procedures differed only near the zero boundary, post-instruction knowledge was interpreted as showing a positive but imprecisely estimated conditional association with scenario performance. The coefficient for pre-instruction knowledge was also positive but imprecisely estimated.
Frequent prior exposure to driving-related games or simulation software (, , HC3 95% CI [0.656, 4.511], ) and membership in simulation-supported Class 2 (, , HC3 95% CI [0.217, 3.910], ) were associated with higher scenario scores after the other model variables were held constant. These results indicate that learner experience and classroom context contributed additional information about scenario performance beyond the focal post-instruction indicators. Residual inspection did not reveal a marked systematic pattern, although several observations had relatively large scenario-model residuals; these observations were retained in the primary analysis.
3.3.3. Conditional Associations with Satisfaction and Behavioral Intention
The LSBI model explained 12.1% of the observed variance (adjusted ). PLS had a positive conditional association with LSBI (, , HC3 95% CI [0.024, 0.460], ), and its class-stratified bootstrap interval was also positive [0.029, 0.443]. The positive direction was retained in the single-case deletion checks, although the confidence interval sometimes included zero after influential observations were excluded. This association was therefore interpreted as positive but sensitivity-qualified.
By contrast, the conditional coefficients for PRI (, ), CE (, ), and post-instruction knowledge (, ) were small or imprecisely estimated, with all corresponding HC3 and bootstrap intervals including zero. The Class 2 coefficient was positive, but its interval also included zero. Within the specified model, PLS therefore provided the clearest positive information about LSBI, whereas CE and formal knowledge did not show clearly estimated independent relationships with this output.
Across the three models, CE showed the most consistent conditional relationship with scenario-based analytical performance. Post-instruction knowledge provided additional positive but less precise information about that output, while the PLS relationships with CE and LSBI were positive but somewhat sensitive to influential observations. These findings describe relationships among observed indicators within the implemented simulation-supported configuration and do not establish causal pathways among system components.
3.4. Scenario- and Question-Level Diagnostics for Instructional Redesign
The diagnostic analysis used the full sample () to examine how the configuration-level difference in the overall 30-point scenario score was distributed across individual scenarios and scenario-task questions. The overall standardized difference reported in Section 3.2 () was used as a descriptive reference rather than as a cutoff for classifying particular outputs.
3.4.1. Scenario-Level Diagnostic Pattern
As shown in Table 9, the simulation-supported configuration had higher mean scores in all three scenarios, although the magnitudes of the differences varied. Scenario 3 produced the largest scenario-specific difference (, 95% CI [0.422, 1.049], Holm-adjusted ), followed by Scenario 1 (, 95% CI [0.394, 1.018], Holm-adjusted ). Scenario 2 showed a smaller positive difference (, 95% CI [0.030, 0.618], Holm-adjusted ).
Table 9.
Scenario-level diagnostic comparisons by instructional configuration.
The simulation-supported mean for Scenario 2 was 5.080, close to the corresponding means for Scenario 1 (5.207) and Scenario 3 (5.253). Its smaller difference partly reflected the higher conventional-configuration mean for Scenario 2 (4.379) than for Scenario 1 (3.655) or Scenario 3 (3.598). Scenario 2 therefore showed the weakest comparative contrast, but its absolute simulation-supported performance was similar to that observed for Scenarios 1 and 3. The smaller between-configuration difference was therefore not treated by itself as evidence of a scenario-level performance weakness or as sufficient grounds for redesign priority.
3.4.2. Question-Level Diagnostic Pattern and Candidate Redesign Priorities
The question-level results showed a similarly heterogeneous pattern (Table 10 and Figure 5). Seven of the 12 question-level comparisons retained Holm-adjusted p-values below 0.05. The largest standardized differences were observed for transferred-mechanism recognition and explanation in Scenario 3 (), conflict-type identification in Scenario 1 (), instructional-focus identification in Scenario 3 (), and improvement-measure proposal in Scenario 1 (). Contributing-factor analysis in Scenario 1 (), conflict-source comparison in Scenario 3 (), and conflict-risk indicator identification in Scenario 3 () also retained Holm-adjusted p-values below 0.05.
Table 10.
Ranked question-level diagnostic comparisons.
Figure 5.
Ranked question-level standardized differences in scenario-based analytical performance. Points represent Cohen’s d, and horizontal bars show 95% percentile bootstrap confidence intervals. The dashed vertical line indicates the overall scenario-score difference () as a descriptive reference. Positive values favor the simulation-supported configuration. The effect-size ranking represents the comparative dimension of the diagnostic analysis; redesign priorities were determined jointly with the normalized absolute-performance levels reported in Table 10.
The two smallest between-configuration differences occurred within Scenario 2: complexity recognition (S2–1; , 95% CI [−0.190, 0.394], Holm-adjusted ) and interacting-behavior identification (S2–2; , 95% CI [−0.120, 0.479], Holm-adjusted ). However, their absolute performance levels led to different diagnostic interpretations. S2–2 had a simulation-supported mean proportion of 0.460, the lowest among the 12 task questions, and therefore combined relatively low absolute performance with a small comparative difference. It was consequently identified as the clearest candidate redesign priority. By contrast, the simulation-supported proportion for S2–1 was 0.511, which was not unusually low relative to the other questions. Its small effect size therefore indicated limited between-configuration separation rather than a confirmed performance weakness.
The joint diagnostic also identified two different secondary patterns. Critical-location identification and explanation in Scenario 1 (S1–2; simulation-supported proportion = 0.498, ) and conflict-risk indicator identification in Scenario 3 (S3–2; proportion = 0.487, ) showed comparatively low absolute performance despite larger positive between-configuration differences. These outputs therefore represent remaining reasoning challenges for both instructional configurations rather than evidence that simulation-supported instruction provided little comparative benefit.
Accordingly, the primary redesign emphasis is placed on helping students trace the inward and outward movements of multiple vehicles and connect simultaneous lane changes, path competition, and limited gaps to conflict development. Candidate modifications include more explicit trajectory highlighting, structured cue prompts, pause-and-replay comparisons, and debriefing questions focused on the sequence of interacting vehicle behaviors. Complexity recognition in Scenario 2 remains useful as a comparative diagnostic because of its small between-configuration difference, while critical-location explanation in Scenario 1 and conflict-risk indicator identification in Scenario 3 provide secondary targets for strengthening absolute task performance.
The configuration-level pattern is consistent with evidence that simulation can support knowledge and complex skills while effects vary across instructional designs and forms of learner support [15]. The larger contrast in scenario-based performance than in formal knowledge also accords with process- and outcome-based findings that applied performance and conventional knowledge measures need not change to the same extent [31]. The within-system results further align with models that place cognitive engagement between immersive features and learning outcomes, although the present cross-sectional regressions did not test mediation [32]. The question-level heterogeneity adds a diagnostic perspective by locating reasoning demands that may benefit from targeted redesign.
3.5. Implications for Engineering Learning Systems
The findings yield five implications for the design and evaluation of simulation-supported engineering learning systems.
- Evaluate the instructional configuration rather than the technical platform alone. The research-team-developed platform supplied the technical resources, but the observed differences characterize the coordinated instructional configuration comprising dynamic scenarios, instructor guidance, learner operation, structured tasks, discussion, and debriefing. The present design cannot isolate the contribution of CARLA–SUMO or any individual platform function. This interpretation is consistent with the socio-technical view that system outcomes arise from the organization of technical and social elements rather than from technology in isolation [25,26].
- Convert technical affordances into learning support through instructional organization. PLS was positively associated with CE and LSBI, while CE provided the clearest positive information about scenario-based performance. PRI showed a less precisely estimated conditional relationship with CE. Realism and interactivity should therefore be connected to attention-guiding prompts, structured analytical tasks, and concept-focused debriefing rather than treated as self-sufficient instructional properties. This emphasizes alignment among system capabilities, learning activities, and assessment requirements [27].
- Use hierarchical diagnostics to support targeted rather than system-wide redesign. The overall scenario-score difference was comparatively large (), but the question-level diagnostic pattern was heterogeneous. Interacting-behavior identification in Scenario 2 combined the lowest absolute performance with a small between-configuration difference and therefore emerged as the clearest candidate for targeted redesign. Complexity recognition in the same scenario showed a small comparative difference without unusually low absolute performance, while critical-location explanation in Scenario 1 and conflict-risk indicator identification in Scenario 3 showed comparatively low absolute performance despite larger positive configuration differences. This pattern supports targeted rather than system-wide redesign.
- Treat learner experience and classroom context as system inputs. Prior simulation-related exposure and class membership provided additional information about scenario performance. Although the class-specific descriptive pattern favored both simulation-supported classes, the remaining contextual variation suggests that implementation should include standardized orientation, equivalent hands-on opportunities, common instructor protocols, and documentation of implementation fidelity. Introductory practice or adaptive scaffolding may also be appropriate for learners with limited prior simulation experience.
- Extend development and deployment into an empirically tested redesign cycle. The present work covered platform development, classroom deployment, and immediate multi-output evaluation. Knowledge tests, scenario-based tasks, and learning-experience indicators generated candidate redesign priorities, but the feedback loop was not empirically closed. Future iterations should implement the proposed modifications, specify the outputs expected to improve, and evaluate whether targeted gains occur without weakening other outputs. Process logs, replay records, and delayed assessments could extend evaluation to learning processes, retention, and transfer.
Together, these implications provide a transferable development-to-evaluation structure based on explicit system boundaries, coordinated technical and instructional elements, learner and contextual inputs, heterogeneous outputs, and assessment-informed redesign. The contribution is therefore an approach to developing, deploying, and evaluating simulation-supported engineering learning systems rather than a platform-specific claim about CARLA–SUMO [4,5].
3.6. Limitations
Several limitations should be acknowledged. First, instructional configuration was implemented at the class level using only four intact classes, with two classes per configuration. This design leaves potential class-level confounding and limits generalizability. Because the number of clusters was too small for dependable cluster-robust or multilevel variance estimation, the participant-level confidence intervals and p-values may not reflect the full uncertainty associated with class-level assignment. The class-specific summaries therefore serve only as a descriptive sensitivity check and do not eliminate this limitation. Second, the pre-test and post-test covered overlapping core content but differed in length, item composition, and cognitive demand and were not psychometrically parallel forms. Although the test blueprint documents their content coverage, the score-ratio change should not be interpreted as a scale-equated measure of learning gain. Baseline-adjusted post-test performance was therefore used as the primary formal-knowledge outcome, with score-ratio change retained only as supplementary information. Third, the study assessed only immediate outcomes in ramp-merging and weaving contexts, without examining long-term retention or professional transfer. Fourth, although separate construct-validity analyses supported the intended four-dimensional structure within both questionnaire versions, measurement invariance was not established across the configuration-specific forms. Their between-configuration differences therefore remain descriptive profile contrasts rather than comparisons of strictly equivalent latent measures. The cross-sectional within-system analysis () also constrains causal interpretation. Finally, neither the platform’s independent software-engineering performance nor the effectiveness of the proposed redesign priorities was evaluated.
4. Conclusions
This study placed a research-team-developed CARLA–SUMO platform within a bounded socio-technical instructional system and evaluated its classroom deployment rather than treating the software as an isolated technical tool. Compared with the conventional configuration, the simulation-supported configuration showed a positive standardized difference in post-instruction formal knowledge () and a larger difference in scenario-based analytical performance (). Learning-experience profiles were also descriptively more positive, although these comparisons remain qualified by the configuration-specific questionnaire wording and the absence of established measurement invariance.
Within the simulation-supported configuration, PLS was positively associated with CE and LSBI, while CE provided the clearest positive information about scenario-based performance. The association between post-instruction knowledge and scenario performance was positive but imprecisely estimated. These relationships describe selected within-system associations and should not be interpreted as confirmed causal pathways.
The joint diagnostic analysis identified interacting-behavior identification in Scenario 2 as the clearest candidate for targeted redesign because it combined relatively low absolute performance with a small between-configuration difference. Complexity recognition in the same scenario showed limited between-configuration separation without unusually low absolute performance, while critical-location explanation in Scenario 1 and conflict-risk indicator identification in Scenario 3 represented secondary targets based on comparatively low absolute performance. Overall, the study provides a three-level evaluation approach linking configuration-level outputs, within-system relationships, and assessment-informed redesign. Future research should implement and evaluate the proposed modifications and examine retention and transfer across additional courses and institutions.
Author Contributions
Conceptualization, Y.S. and Y.X.; methodology, Y.S.; software, Y.S.; validation, Y.S. and Y.X.; formal analysis, Y.S.; investigation, Y.S. and X.Z.; resources, Y.S.; data curation, Y.S. and Y.Z.; writing—original draft preparation, Y.S.; writing—review and editing, Y.X., Z.Y. and X.Z.; visualization, Y.S.; supervision, Z.Y.; project administration, Z.Y.; funding acquisition, Z.Y. All authors have read and agreed to the published version of the manuscript.
Funding
This study was supported by the Teaching Reform Research Project of Nanjing University of Posts and Telecommunications (JG10426JX36), the Natural Science Research Start-up Foundation of Recruiting Talents of Nanjing University of Posts and Telecommunications (NY225088), the National Key R&D Program of China (2022YFB4300300), the National Natural Science Foundation of China (52202410), and the Fundamental Research Funds for the Central Universities (2242026K30041).
Institutional Review Board Statement
This study was reviewed and approved by the School of Modern Posts, School of Intelligent Transportation, Nanjing University of Posts and Telecommunications, acting as the institutional review body for this low-risk educational research project (approval date: 15 August 2025). The approval was granted before data collection. The study was carried out in accordance with the relevant institutional requirements and guidelines for educational research involving student participants. All data were analyzed and reported in anonymized or aggregated form.
Informed Consent Statement
Informed consent to participate was obtained from all individual participants included in the study. All participants confirmed that they were 18 years of age or older. Consent to publish anonymized and aggregated research findings was obtained from all individual participants included in the study.
Data Availability Statement
Complete English-language translations of the research instruments, answer keys, and scoring rubrics are provided in Appendix A. The de-identified analysis dataset and executable Python analysis scripts are available from the corresponding author upon reasonable request, subject to institutional and participant-privacy requirements.
Conflicts of Interest
The authors declare no conflicts of interest.
Appendix A. Research Instruments and Scoring Materials
This appendix consolidates the six-case instructional specification and the English-language translations of the research instruments used in the controlled teaching experiment, including the participant background information form, both learning-experience questionnaires, the scenario-based analysis tasks and scoring rubrics, the complete knowledge pre-test and post-test with their answer keys and scoring criteria, and the informed consent form. The instruments were administered in Chinese; the English translations are provided to document their substantive content and scoring procedures.
Appendix A.1. Instructional Cases Used in Both Configurations
The six instructional cases were matched one-to-one across the two configurations. The conventional configuration represented each case through diagrams, static traffic information, and instructor explanation, whereas the simulation-supported configuration represented the same situation dynamically and allowed every student to operate it. Table A1 records the focal traffic conditions and learning objective of each case. The platform also allowed viewpoint, weather, simulation time, vehicle type, and traffic density to be configured; these interface controls were not evaluated as separate experimental factors.
Table A1.
Instructional focus and principal conditions of the six matched teaching cases.
Appendix A.2. Participant Background Information
Table A2.
Participant background information form.
Appendix A.3. Learning Experience Questionnaires
All questionnaire items used a five-point response scale and were coded from 0 to 4 for analysis: 0 = strongly disagree, 1 = disagree, 2 = neutral, 3 = agree, and 4 = strongly agree. Two configuration-specific questionnaire versions were used. The simulation-supported version was administered to participants in the simulation-supported configuration, whereas the conventional version was administered to participants in the conventional configuration. The two versions retained the same four intended dimensions and conceptually corresponding item positions, but their wording was adapted to the instructional configuration experienced by each group. Table A3 and Table A4 present the two complete English-language versions.
Table A3.
Learning-experience questionnaire: simulation-supported instruction version.
Table A4.
Learning-experience questionnaire: conventional instruction version.
Appendix A.4. Scenario-Based Analysis Tasks and Scoring Rubrics
The tasks were designed to evaluate conflict identification, multi-vehicle interaction analysis, knowledge transfer, and strategy judgment. Table A5 presents the complete English-language task prompts, and Table A6 presents the question-level scoring rubrics used by the raters.
Table A5.
Scenario-based analysis tasks.
Table A6.
Question-level scoring rubric for the scenario-based analytical tasks.
Appendix A.5. Knowledge Pre-Test and Post-Test
The knowledge pre-test and post-test assessed students’ understanding of ramp merging, weaving sections, traffic-conflict mechanisms, and knowledge transfer. The pre-test was administered before instruction to measure baseline knowledge, whereas the post-test was administered after instruction to evaluate immediate learning outcomes. Table A8 and Table A10 present the complete English-language items. The corresponding answer keys and short-answer scoring criteria follow each table.
Table A7.
Test blueprint for the knowledge pre-test and post-test.
Table A8.
Complete English-language knowledge pre-test (maximum score: 10 points).
Pre-test objective-item answer key: P1–P7 = B, B, B, A, A, False, True.
Table A9.
Scoring criteria for pre-test Item P8.
Table A10.
Complete English-language knowledge post-test (maximum score: 20 points).
Post-test objective-item answer key: T1–T12 = B, B, C, B, C, B, B, C, False, True, True, False.
Table A11.
Scoring criteria for post-test short-answer items.
Appendix A.6. Informed Consent Form
Study Title (as presented during data collection): Driving Simulation-Based Teaching Effectiveness Study in Transportation Engineering
Purpose of the Study: This study aims to evaluate the instructional effects of driving simulation-assisted teaching in a transportation engineering course, with particular attention to knowledge learning, scenario-based analytical ability, and learning experience.
Study Procedures: If you agree to participate, the study will collect data generated during the course learning process, including: (1) Basic background information; (2) Knowledge pre-test and post-test results; (3) Responses to scenario-based analysis tasks; (4) Learning experience questionnaire responses.
Voluntary Participation: Participation in this study is completely voluntary. You have the right to refuse to participate or withdraw from the study at any time. Refusal to participate or withdrawal from the study will not affect your course learning, course grades, teacher-student relationship, or any other rights.
Risks and Benefits: This study is a low-risk educational research project. It does not involve medical intervention, invasive procedures, or the collection of sensitive biological information. Participation in this study may help improve course teaching design and learning support.
Confidentiality: The research data will be used only for educational research and academic publication. All data will be anonymized during analysis and reporting. Your name, student ID, or any other personally identifiable information will not be disclosed. The research findings will be presented only in aggregated or anonymized form.
Consent to Publish: I agree that the researcher may use anonymized and aggregated research findings for academic journal articles, conference presentations, and other scholarly communications. I understand that no published content will contain information that can identify me personally.
Participant Statement: I confirm that I am 18 years of age or older and have the ability to make an independent decision about participation. I have understood the purpose of the study, the study procedures, the use of data, the confidentiality measures, and the voluntary nature of participation. I agree to participate in this study and agree that anonymized and aggregated data may be used for educational research and academic publication.
Participant Signature:____________
Date:_______/_______/_______
Principal Investigator:____________
Contact Information:____________
Appendix B. Exploratory Factor-Analysis Results
This appendix reports the complete rotated factor-loading matrices for the conventional and simulation-supported versions of the learning-experience questionnaire. Values are pattern coefficients obtained from principal-axis factoring with oblimin rotation based on polychoric correlation matrices.
Table A12.
Exploratory factor-analysis loadings for the conventional-instruction questionnaire.
Table A13.
Exploratory factor-analysis loadings for the simulation-supported questionnaire.
References
- Yuan, J.; Abdel-Aty, M.; Cai, Q.; Lee, J. Investigating drivers’ mandatory lane change behavior on the weaving section of freeway with managed lanes: A driving simulator study. Transp. Res. Part F Traffic Psychol. Behav. 2019, 62, 11–32. [Google Scholar] [CrossRef] [Scilit]
- Okuda, H.; Suzuki, T.; Harada, K.; Saigo, S.; Inoue, S. Quantitative driver acceptance modeling for merging car at highway junction and its application to the design of merging behavior control. IEEE Trans. Intell. Transp. Syst. 2021, 22, 329–340. [Google Scholar] [CrossRef] [Scilit]
- van Beinum, A.; Farah, H.; Wegman, F.; Hoogendoorn, S. Driving behaviour at motorway ramps and weaving segments based on empirical trajectory data. Transp. Res. Part C Emerg. Technol. 2018, 92, 426–441. [Google Scholar] [CrossRef] [Scilit]
- Frank, M. Engineering systems thinking and systems thinking. Syst. Eng. 2000, 3, 163–168. [Google Scholar] [CrossRef]
- Monat, J.P.; Gannon, T.F.; Amissah, M. The case for systems thinking in undergraduate engineering education. Int. J. Eng. Pedagog. 2022, 12, 50–88. [Google Scholar] [CrossRef] [Scilit]
- Pense, C.; Tektaş, M.; Kanj, H.; Ali, N. The use of virtual reality technology in intelligent transportation systems education. Sustainability 2022, 15, 300. [Google Scholar] [CrossRef] [Scilit]
- Edara, P. Reframing undergraduate transportation education in the United States. J. Transp. Eng. Part A Syst. 2025, 151, 01825002-1–01825002-3. [Google Scholar] [CrossRef] [Scilit]
- Aydin, M.M.; Dagli, E.; Cadirci, M.S. Intelligent transportation systems in civil engineering education: A case study. Proc. Inst. Civ. Eng. Transp. 2026, 1–21. [Google Scholar] [CrossRef] [Scilit]
- Chen, W.; Levinson, D.M. Effectiveness of learning transportation network growth through simulation. J. Prof. Issues Eng. Educ. Pract. 2006, 132, 29–41. [Google Scholar] [CrossRef] [Scilit][Green Version]
- Liao, C.F.; Liu, H.X.; Levinson, D.M. Simulating transportation for realistic engineering education and training: Engaging undergraduate students in transportation studies. Transp. Res. Rec. 2009, 2109, 12–21. [Google Scholar] [CrossRef] [Scilit]
- Zhu, S.; Xie, F.; Levinson, D. Enhancing transportation education through online simulation using an agent-based demand and assignment model. J. Prof. Issues Eng. Educ. Pract. 2011, 137, 38–45. [Google Scholar] [CrossRef] [Scilit]
- Hurwitz, D.S.; Sanford Bernhardt, K.L.; Turochy, R.E.; Young, R.K. Transportation engineering instructional practices: Analytic review of the literature. Transp. Res. Rec. 2015, 2480, 45–54. [Google Scholar] [CrossRef] [Scilit]
- Liu, Y.Y.; Wang, D.P.; Gu, J.; Fu, Y.F. Teaching design and implementation of traffic system simulation course based on a computer virtual reality software under the background of engineering education. Comput. Appl. Eng. Educ. 2024, 32, e22769. [Google Scholar] [CrossRef] [Scilit]
- Zhu, S.; Yuan, Y.; Peng, W.; Wu, H.; Yu, L.; Lan, Q. Integrated engineering education through design activities: A signal phase module design case study for traffic engineering course. Comput. Appl. Eng. Educ. 2024, 32, e22744. [Google Scholar] [CrossRef] [Scilit]
- Chernikova, O.; Heitzmann, N.; Stadler, M.; Holzberger, D.; Seidel, T.; Fischer, F. Simulation-based learning in higher education: A meta-analysis. Rev. Educ. Res. 2020, 90, 499–541. [Google Scholar] [CrossRef] [Scilit]
- Li, J.; Liang, W. Effectiveness of virtual laboratory in engineering education: A meta-analysis. PLoS ONE 2024, 19, e0316269. [Google Scholar] [CrossRef] [Scilit] [PubMed]
- Yang, C.; Zhang, J.; Hu, Y.; Yang, X.; Chen, M.; Shan, M.; Li, L. The impact of virtual reality on practical skills for students in science and engineering education: A meta-analysis. Int. J. STEM Educ. 2024, 11, 28. [Google Scholar] [CrossRef] [Scilit]
- Zontou, E.; Kaminaris, S.; Rangoussi, M. On the role of virtual reality in engineering education: A systematic literature review of experimental research (2011–2022). Eur. J. Eng. Educ. 2024, 49, 856–888. [Google Scholar] [CrossRef] [Scilit]
- Makransky, G.; Terkildsen, T.S.; Mayer, R.E. Adding immersive virtual reality to a science lab simulation causes more presence but less learning. Learn. Instr. 2019, 60, 225–236. [Google Scholar] [CrossRef] [Scilit]
- Grassini, S.; Laumann, K.; Rasmussen Skogstad, M. The use of virtual reality alone does not promote training performance (but sense of presence does). Front. Psychol. 2020, 11, 1743. [Google Scholar] [CrossRef] [Scilit]
- Ibáñez, M.B.; Di-Serio, Á.; Villarán-Molina, D.; Delgado-Kloos, C. Support for augmented reality simulation systems: The effects of scaffolding on learning outcomes and behavior patterns. IEEE Trans. Learn. Technol. 2016, 9, 46–56. [Google Scholar] [CrossRef] [Scilit]
- Elme, L.; Jørgensen, M.L.; Dandanell, G.; Mottelson, A.; Makransky, G. Immersive virtual reality in STEM: Is IVR an effective learning medium and does adding self-explanation after a lesson improve learning outcomes? Educ. Technol. Res. Dev. 2022, 70, 1601–1626. [Google Scholar] [CrossRef] [Scilit]
- Petersen, G.B.; Petkakis, G.; Makransky, G. A study of how immersion and interactivity drive VR learning. Comput. Educ. 2022, 179, 104429. [Google Scholar] [CrossRef] [Scilit]
- Ackoff, R.L. Towards a system of systems concepts. Manag. Sci. 1971, 17, 661–671. [Google Scholar] [CrossRef] [Scilit]
- Bostrom, R.P.; Heinen, J.S. MIS problems and failures: A socio-technical perspective. Part I: The causes. MIS Q. 1977, 1, 17–32. [Google Scholar] [CrossRef] [Scilit]
- Fawns, T. An entangled pedagogy: Looking beyond the pedagogy–technology dichotomy. Postdigital Sci. Educ. 2022, 4, 711–728. [Google Scholar] [CrossRef] [Scilit]
- Biggs, J. Enhancing teaching through constructive alignment. High. Educ. 1996, 32, 347–364. [Google Scholar] [CrossRef] [Scilit]
- Rodrigues, R.B.; Seniuk Cicek, J. A scoping literature review of sociotechnical thinking in engineering education. Eur. J. Eng. Educ. 2024, 49, 807–833. [Google Scholar] [CrossRef] [Scilit]
- Agbo, F.J.; Olaleye, S.A.; Bower, M.; Oyelere, S.S. Examining the relationships between students’ perceptions of technology, pedagogy, and cognition: The case of immersive virtual reality mini games to foster computational thinking in higher education. Smart Learn. Environ. 2023, 10, 16. [Google Scholar] [CrossRef] [Scilit]
- Goncalves, G.; Coelho, H.; Monteiro, P.; Melo, M.; Bessa, M. Systematic review of comparative studies of the impact of realism in immersive virtual experiences. ACM Comput. Surv. 2022, 55, 115. [Google Scholar] [CrossRef] [Scilit]
- Han, Y.; Yang, J.; Diao, Y.; Jin, R.; Guo, B.; Adamu, Z. Process and outcome-based evaluation between virtual reality-driven and traditional construction safety training. Adv. Eng. Inform. 2022, 52, 101634. [Google Scholar] [CrossRef] [Scilit]
- Makransky, G.; Petersen, G.B. The cognitive affective model of immersive learning (CAMIL): A theoretical research-based model of learning in immersive virtual reality. Educ. Psychol. Rev. 2021, 33, 937–958. [Google Scholar] [CrossRef] [Scilit]
- Dunmoye, I.D.; Rukangu, A.; May, D.; Das, R.P. An exploratory study of social presence and cognitive engagement association in a collaborative virtual reality learning environment. Comput. Educ. X Real. 2024, 4, 100054. [Google Scholar] [CrossRef] [Scilit]
- Li, S.; Zheng, J.; Lajoie, S.P. The relationship between cognitive engagement and students’ performance in a simulation-based training environment: An information-processing perspective. Interact. Learn. Environ. 2023, 31, 1532–1545. [Google Scholar] [CrossRef] [Scilit]
- Liao, Y.W.; Huang, Y.M.; Wang, Y.S. Factors affecting students’ continued usage intention toward business simulation games: An empirical study. J. Educ. Comput. Res. 2015, 53, 260–283. [Google Scholar] [CrossRef] [Scilit]
- Liang, Q.; Wu, H.; Yuan, Y. Exploring the improvement path of virtual simulation experiments: Based on the influencing factors and mediating effects of learning satisfaction. BMC Med. Educ. 2024, 24, 1081. [Google Scholar] [CrossRef] [Scilit]
- Koretsky, M.D.; McColley, C.J.; Gugel, J.L.; Ekstedt, T.W. Aligning classroom assessment with engineering practice: A design-based research study of a two-stage exam with authentic assessment. J. Eng. Educ. 2022, 111, 185–213. [Google Scholar] [CrossRef] [Scilit]
- Koretsky, M.D.; Pantekidis, I. Computer-based authentic assessment in engineering: A case of group practice. Comput. Educ. Open 2026, 10, 100379. [Google Scholar] [CrossRef] [Scilit]
- Schons, C.; Obersteiner, A.; Fischer, F.; Reiss, K. Toward adaptive support of pre-service teachers’ assessment competencies: Log data in a digital simulation reveal engagement modes. Learn. Instr. 2024, 94, 101979. [Google Scholar] [CrossRef] [Scilit]
- Koo, T.K.; Li, M.Y. A guideline of selecting and reporting intraclass correlation coefficients for reliability research. J. Chiropr. Med. 2016, 15, 155–163, Erratum in J. Chiropr. Med. 2017, 16, 346. https://doi.org/10.1016/j.jcm.2017.10.001. [Google Scholar] [CrossRef] [Scilit] [PubMed]
- Putnick, D.L.; Bornstein, M.H. Measurement invariance conventions and reporting: The state of the art and future directions for psychological research. Dev. Rev. 2016, 41, 71–90. [Google Scholar] [CrossRef] [Scilit]
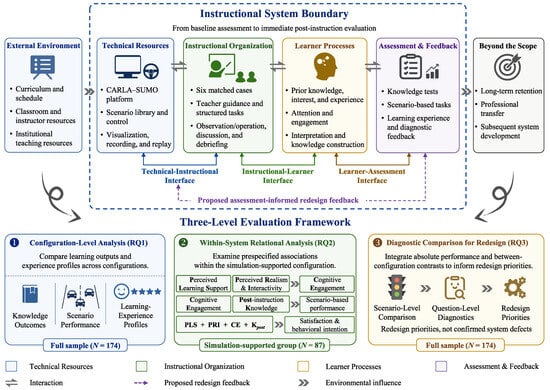
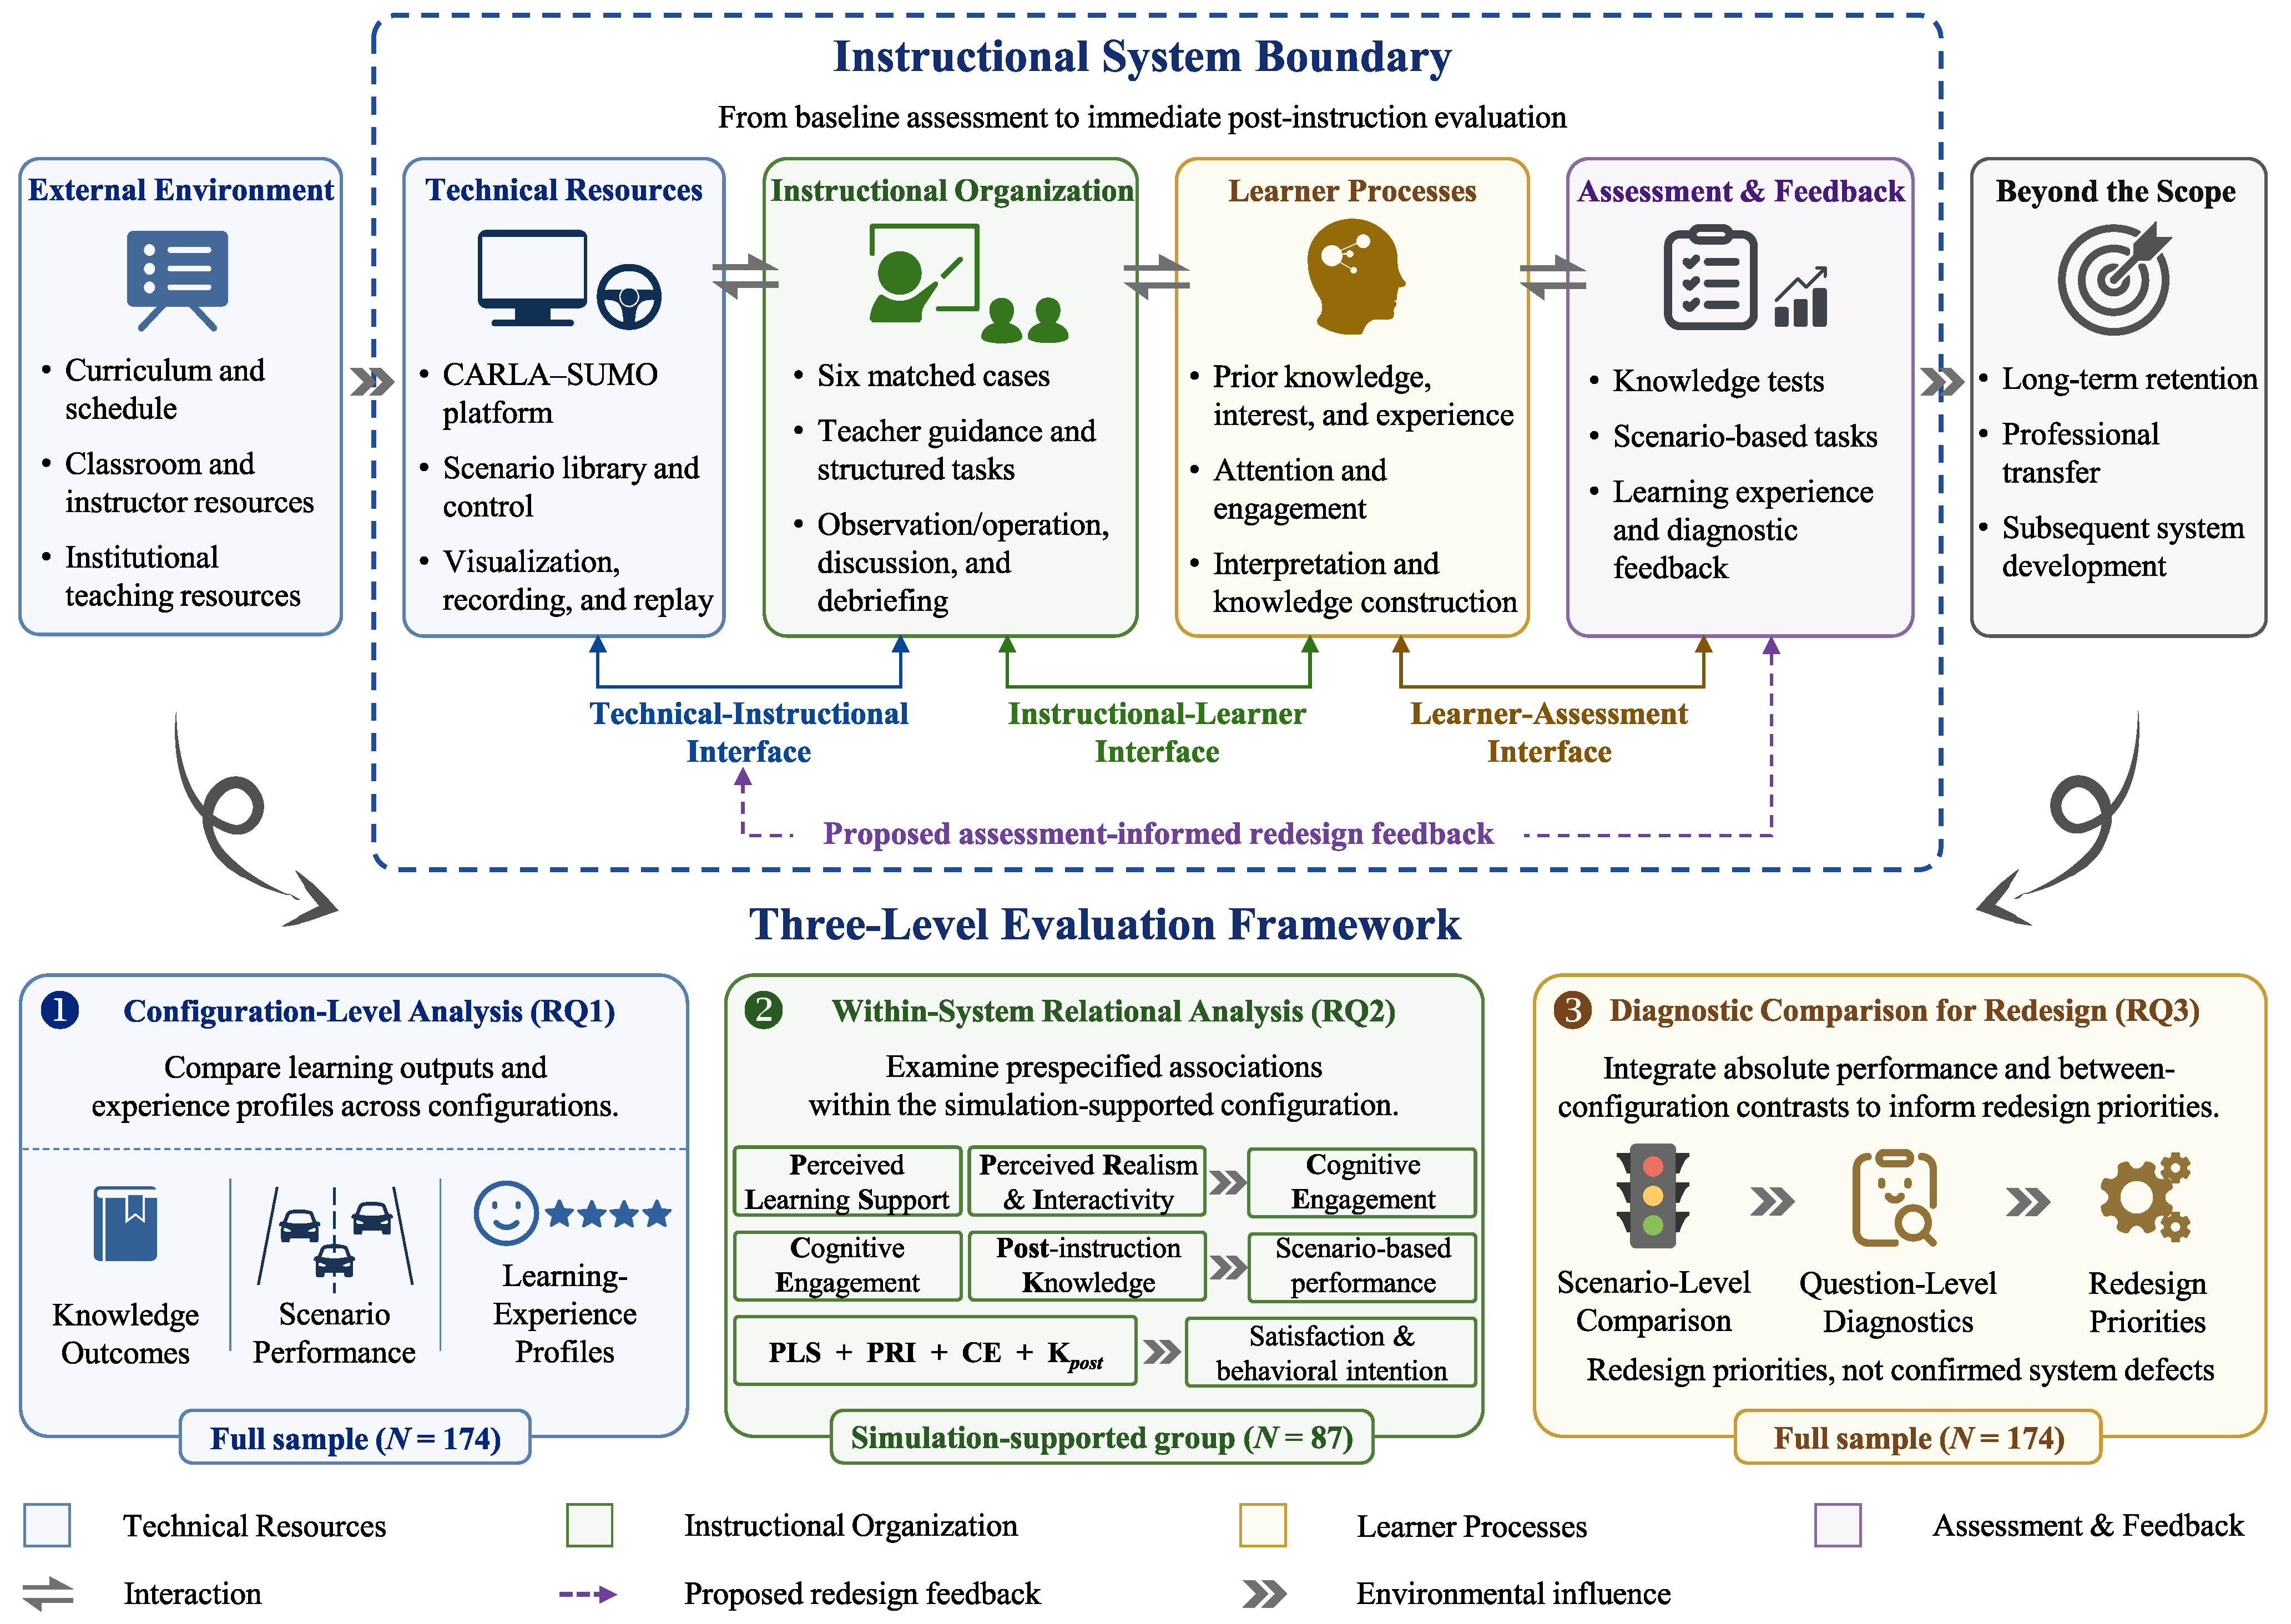
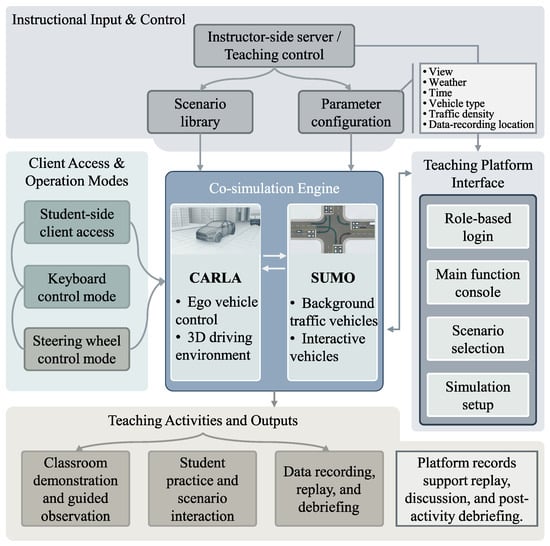
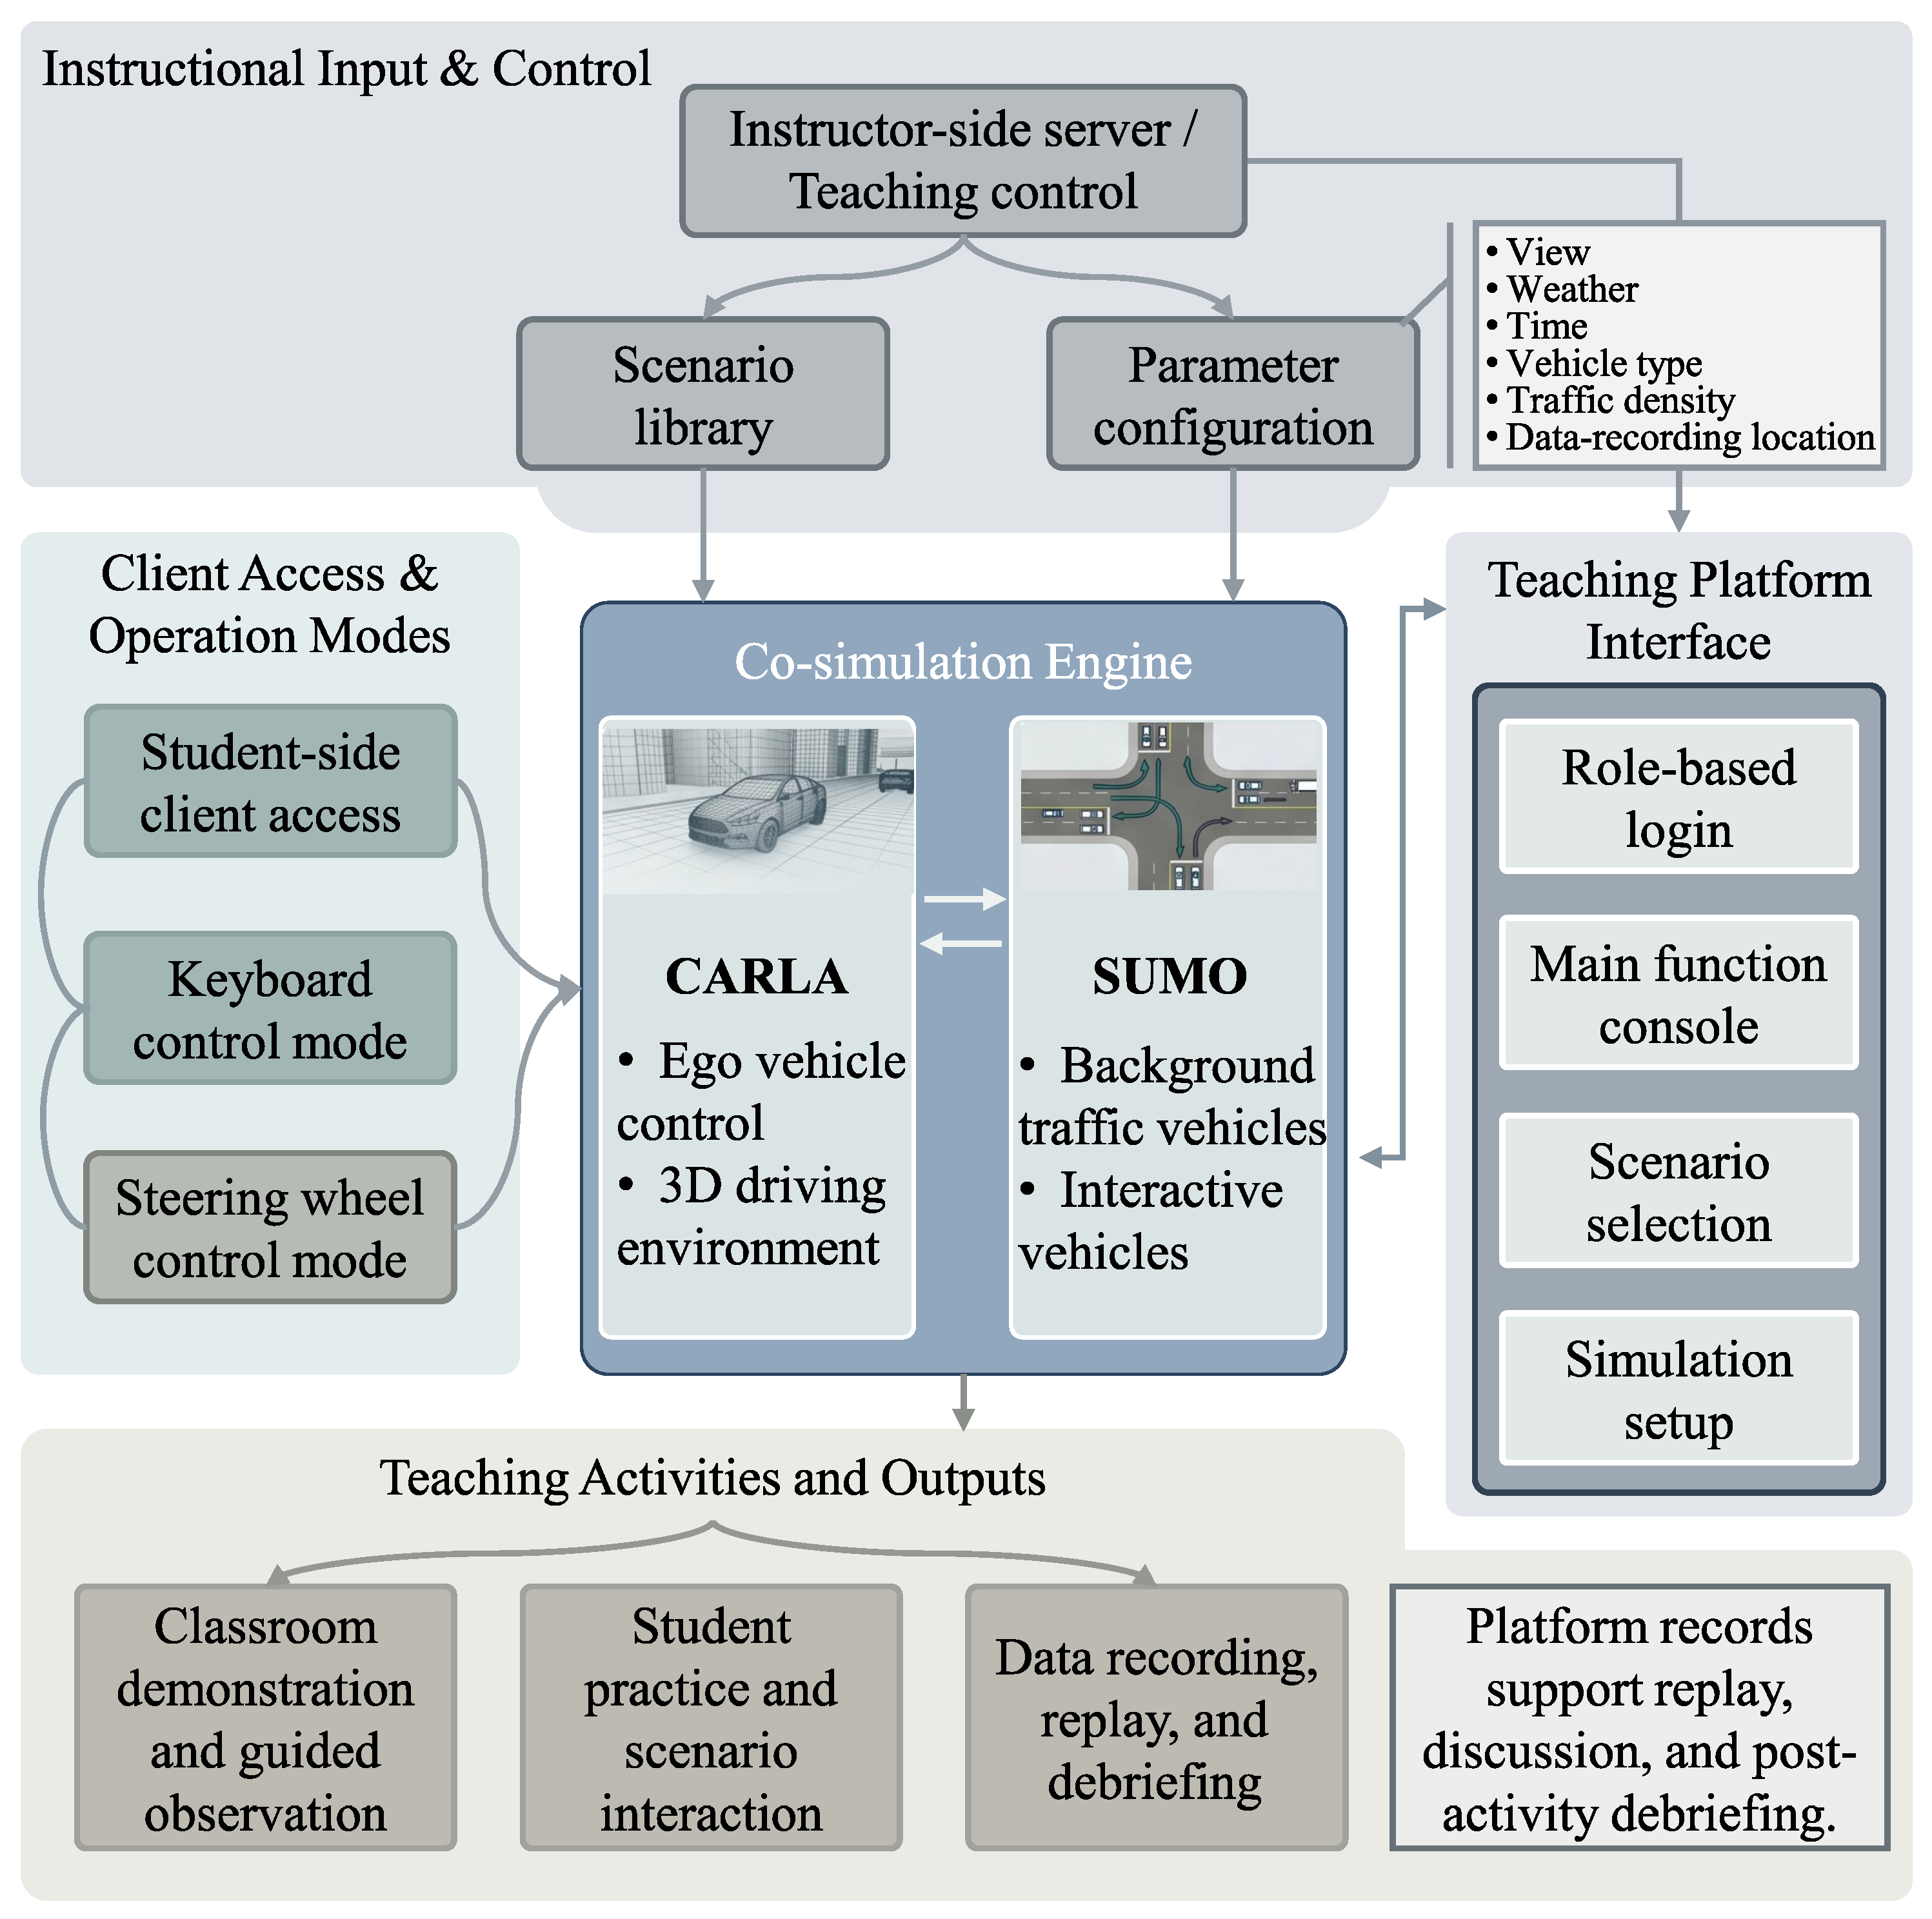
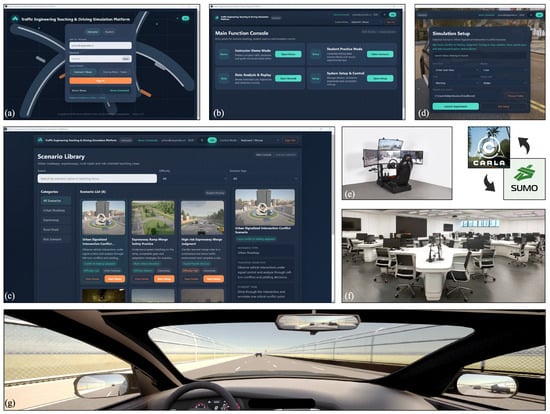
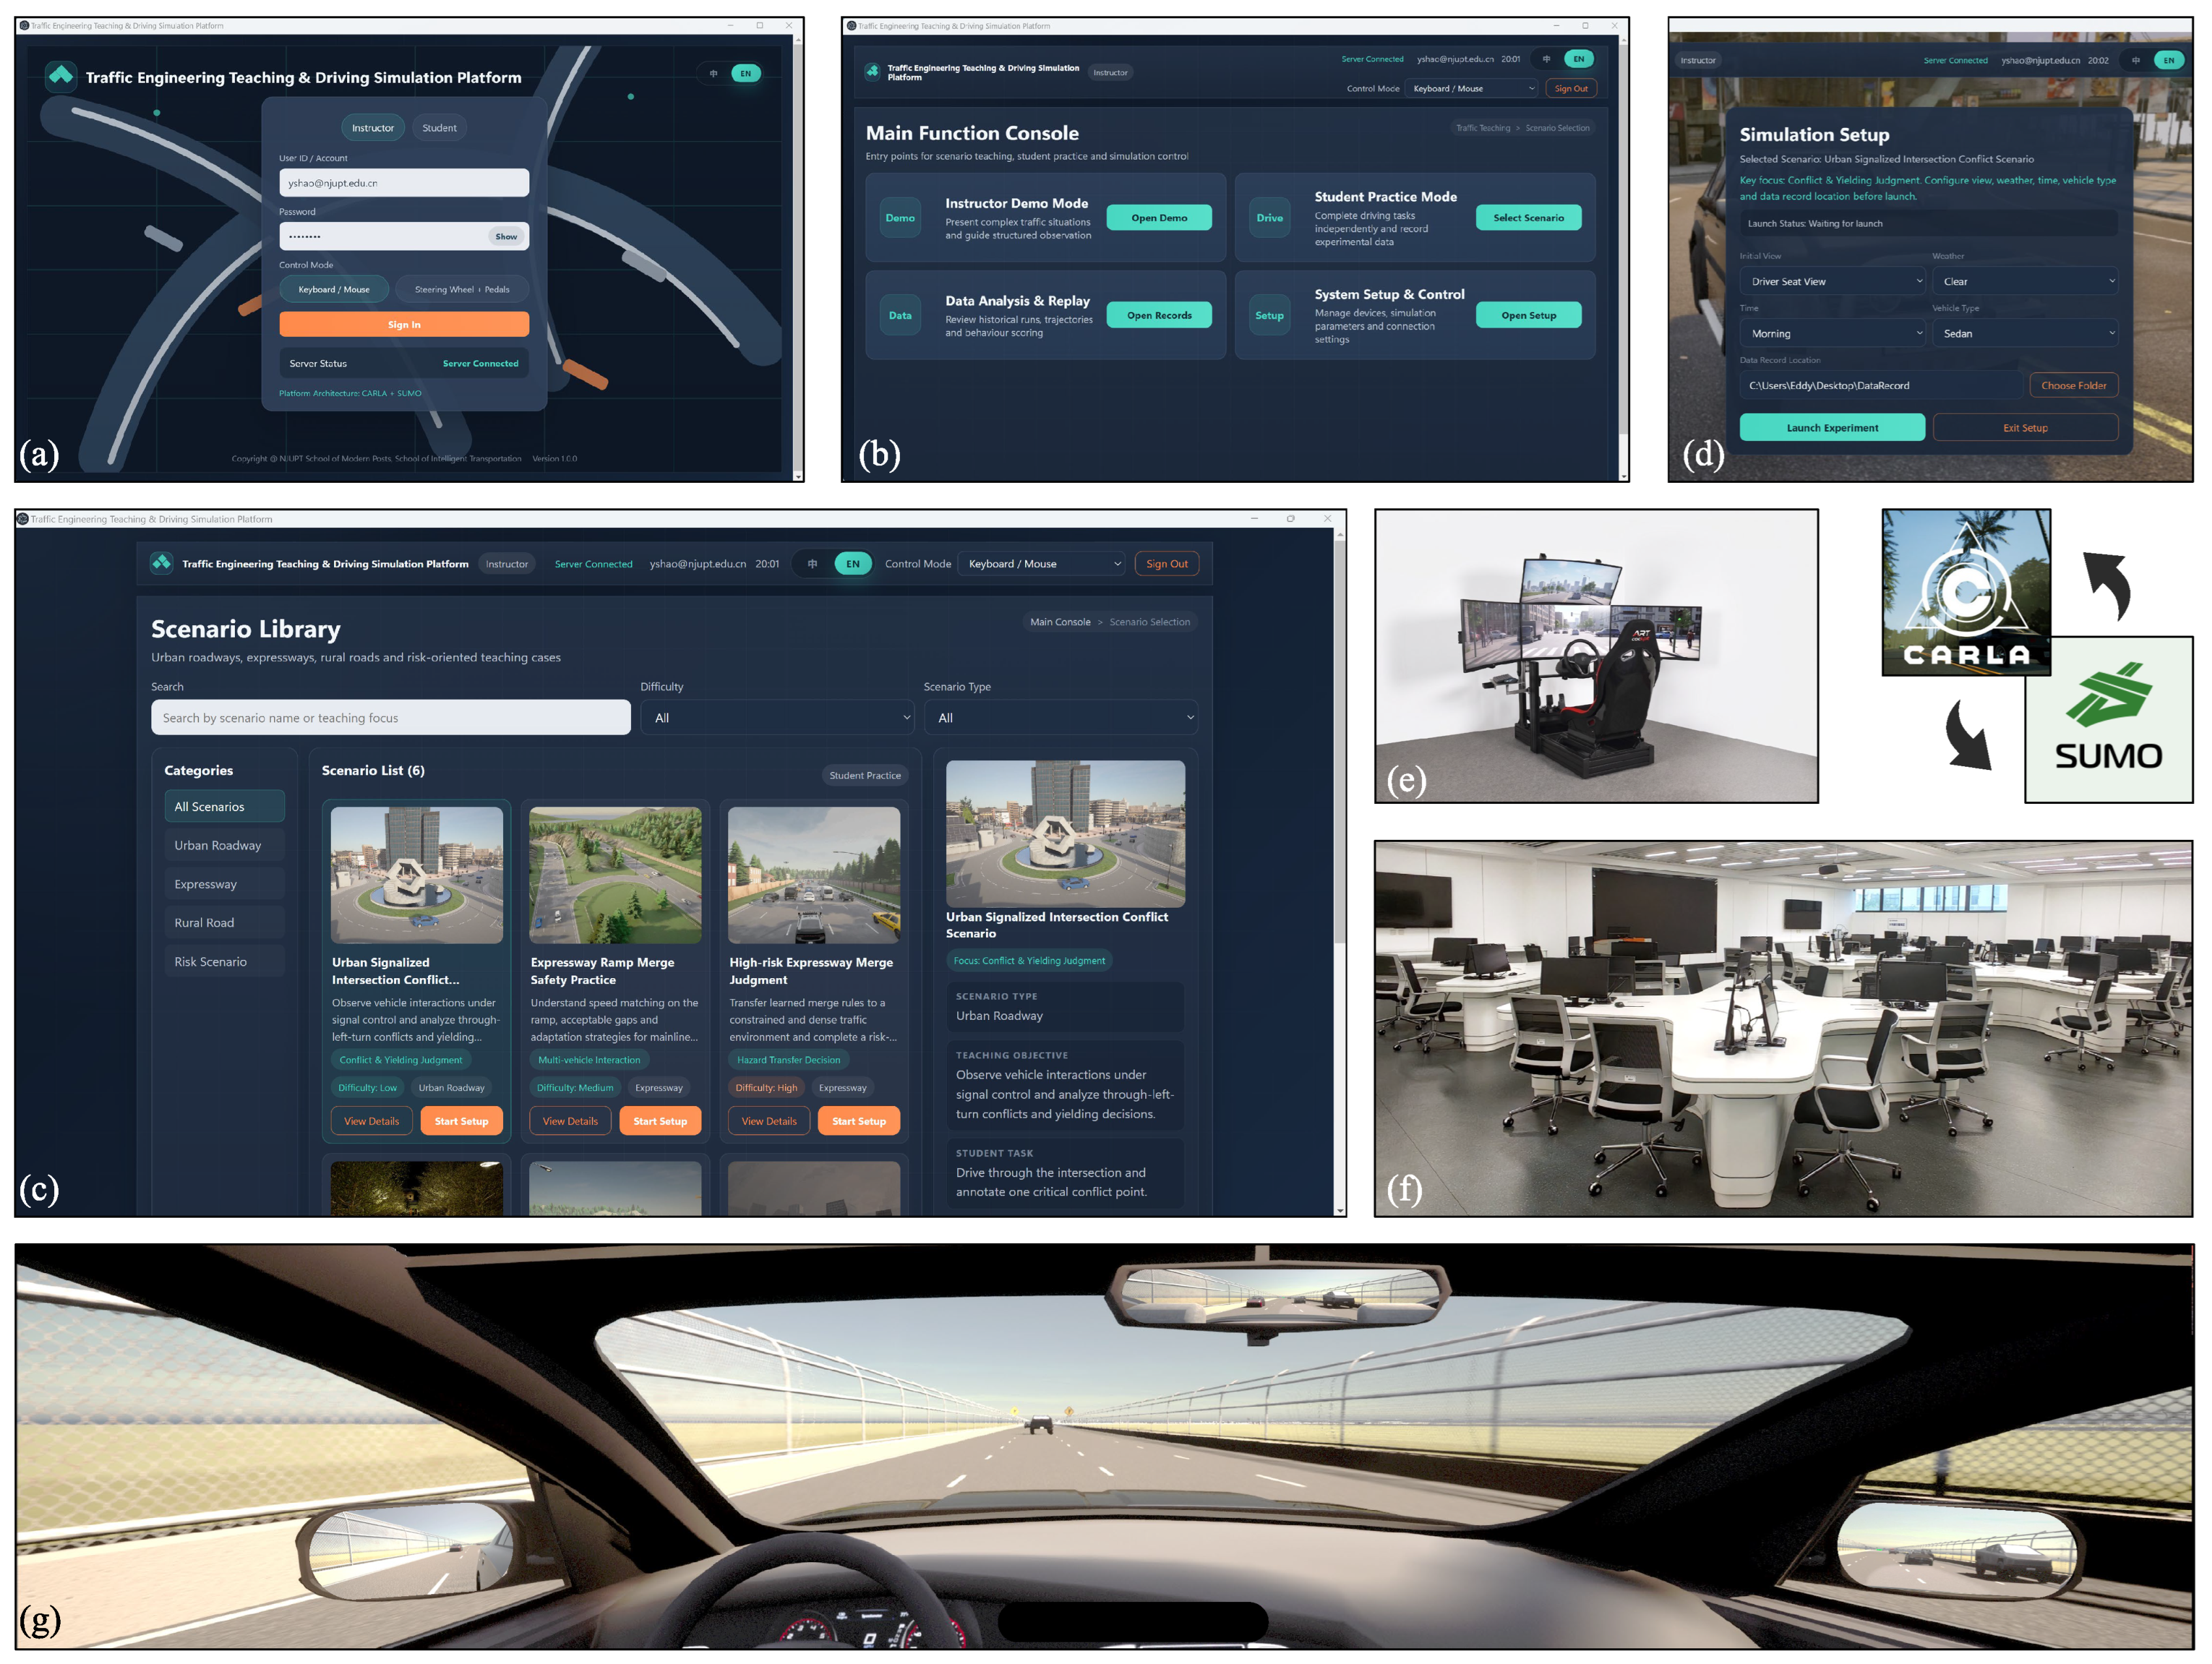
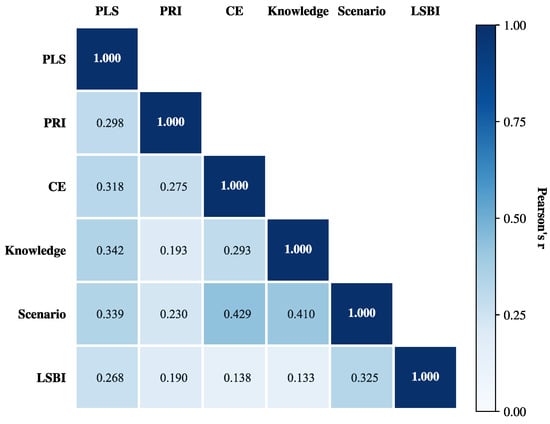
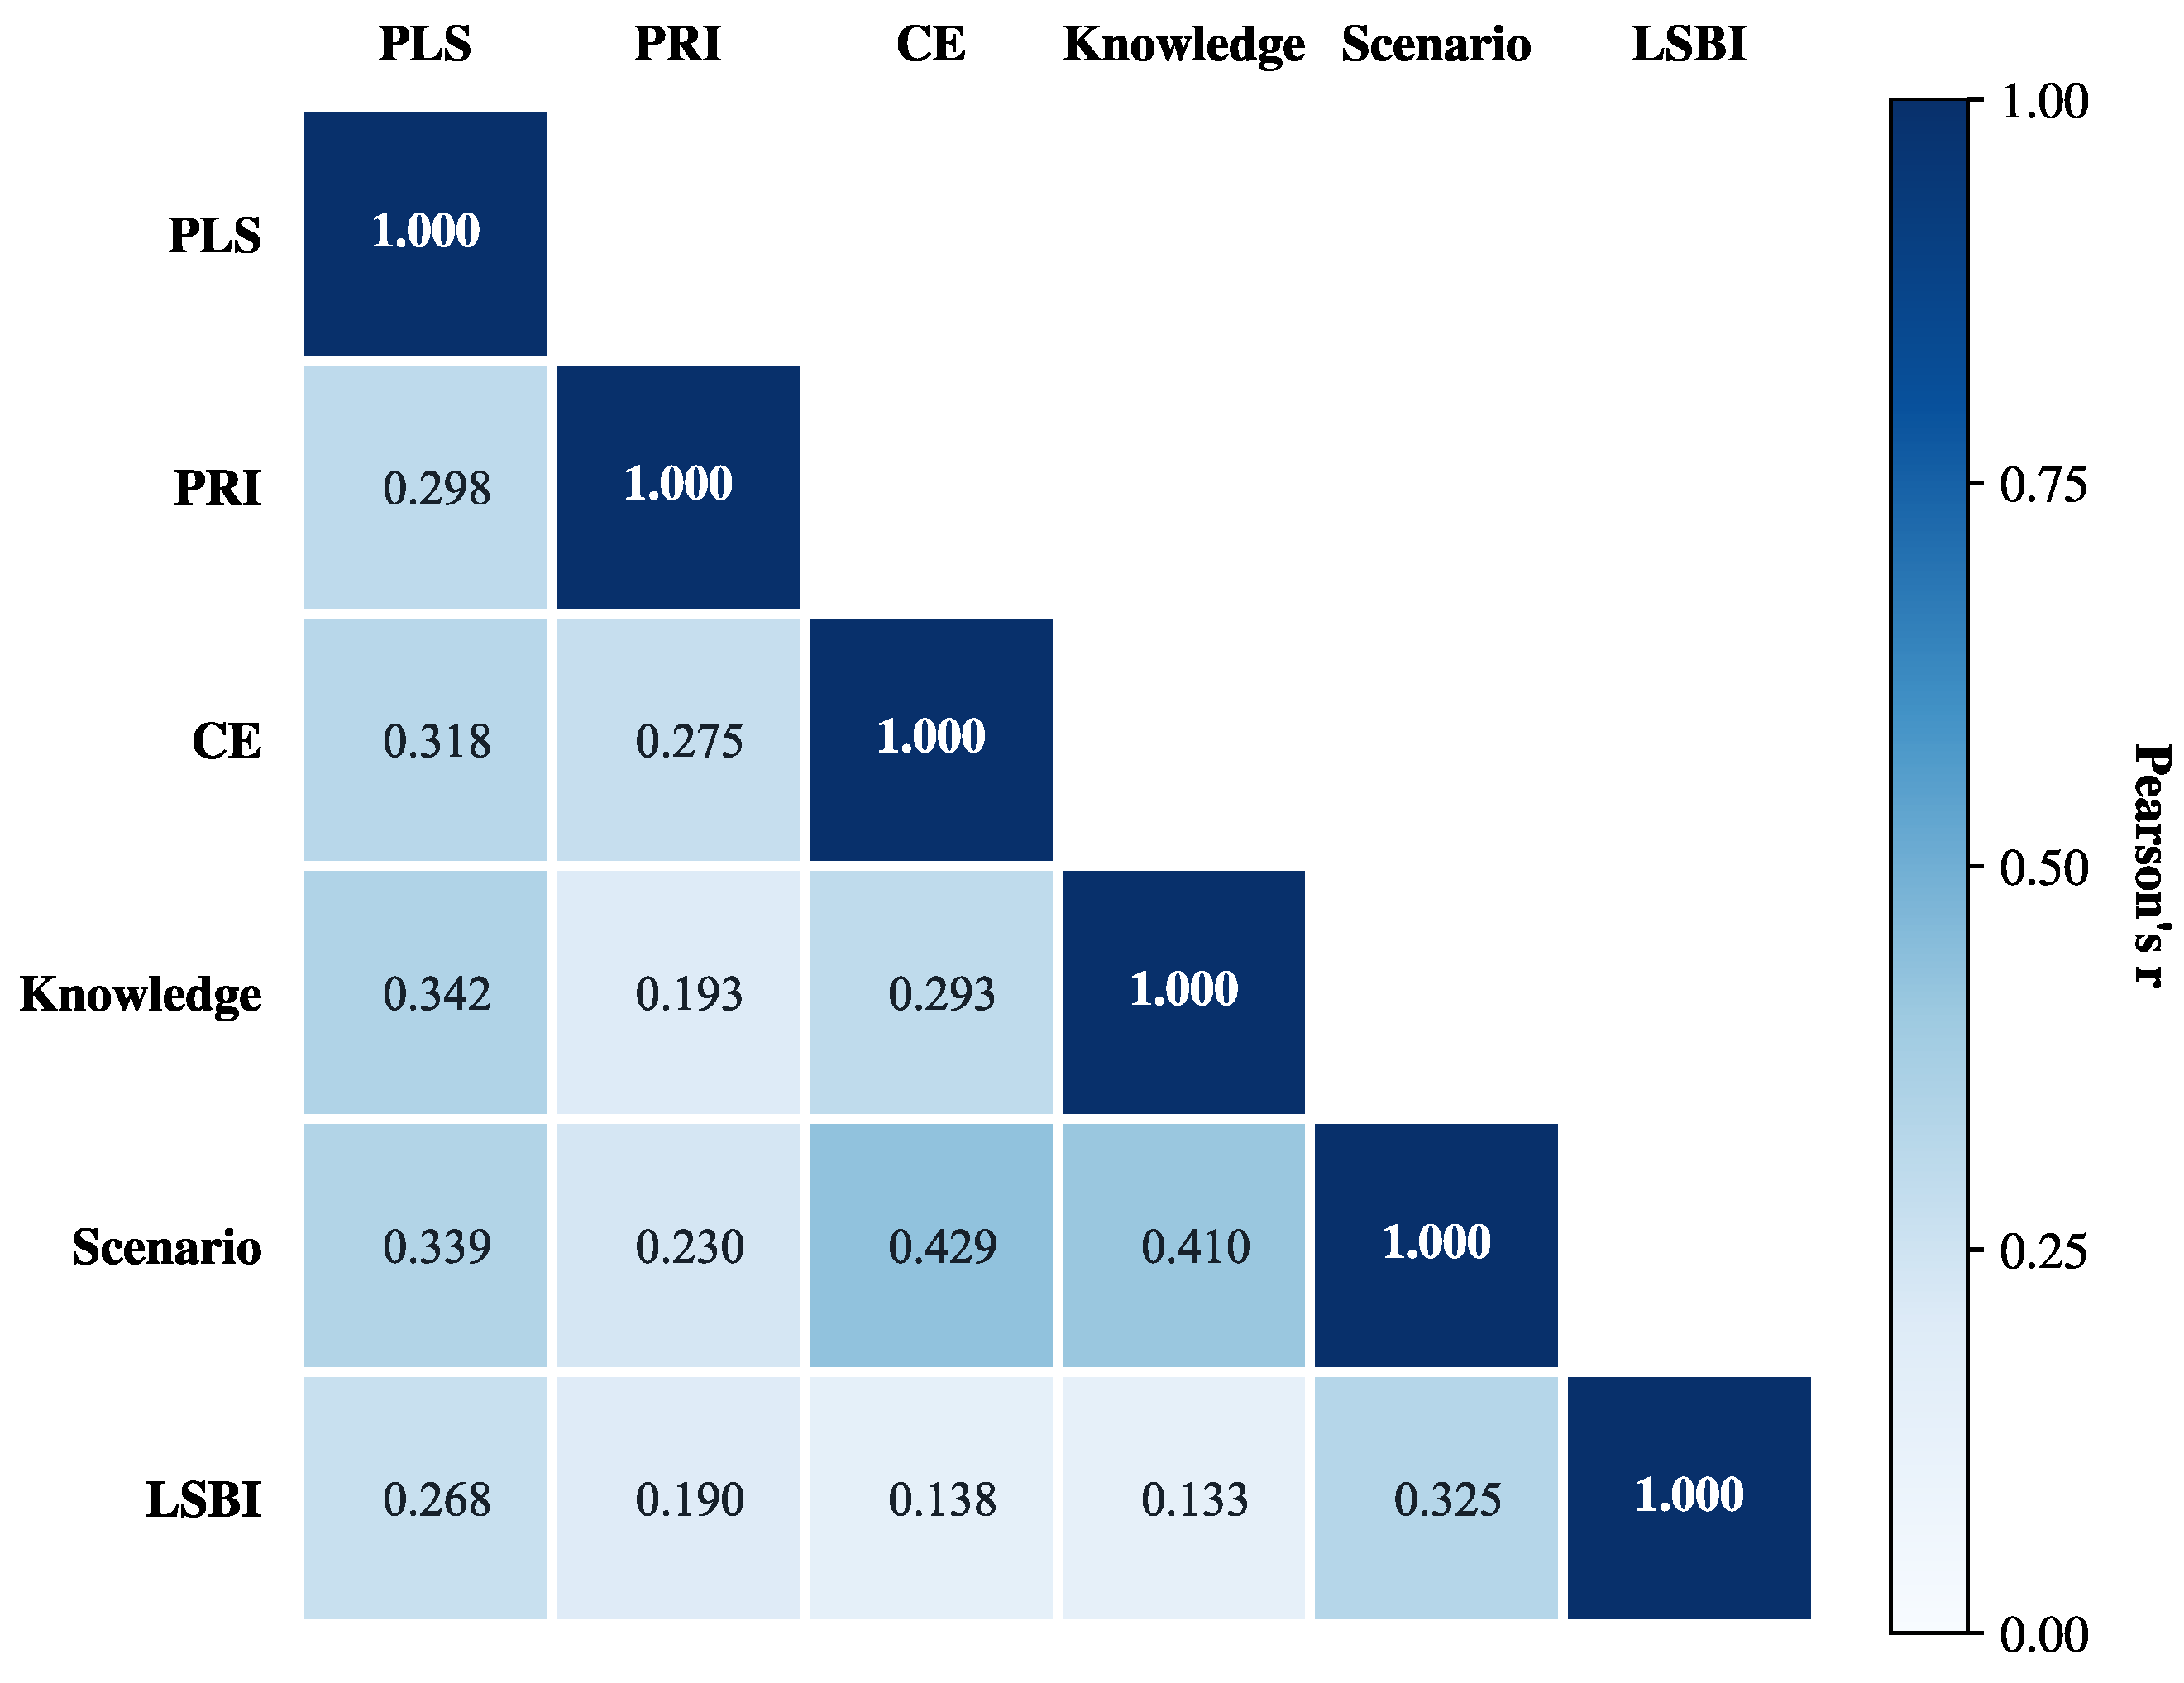
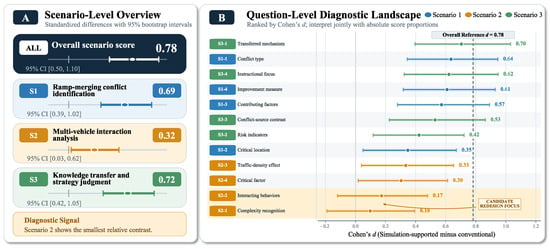
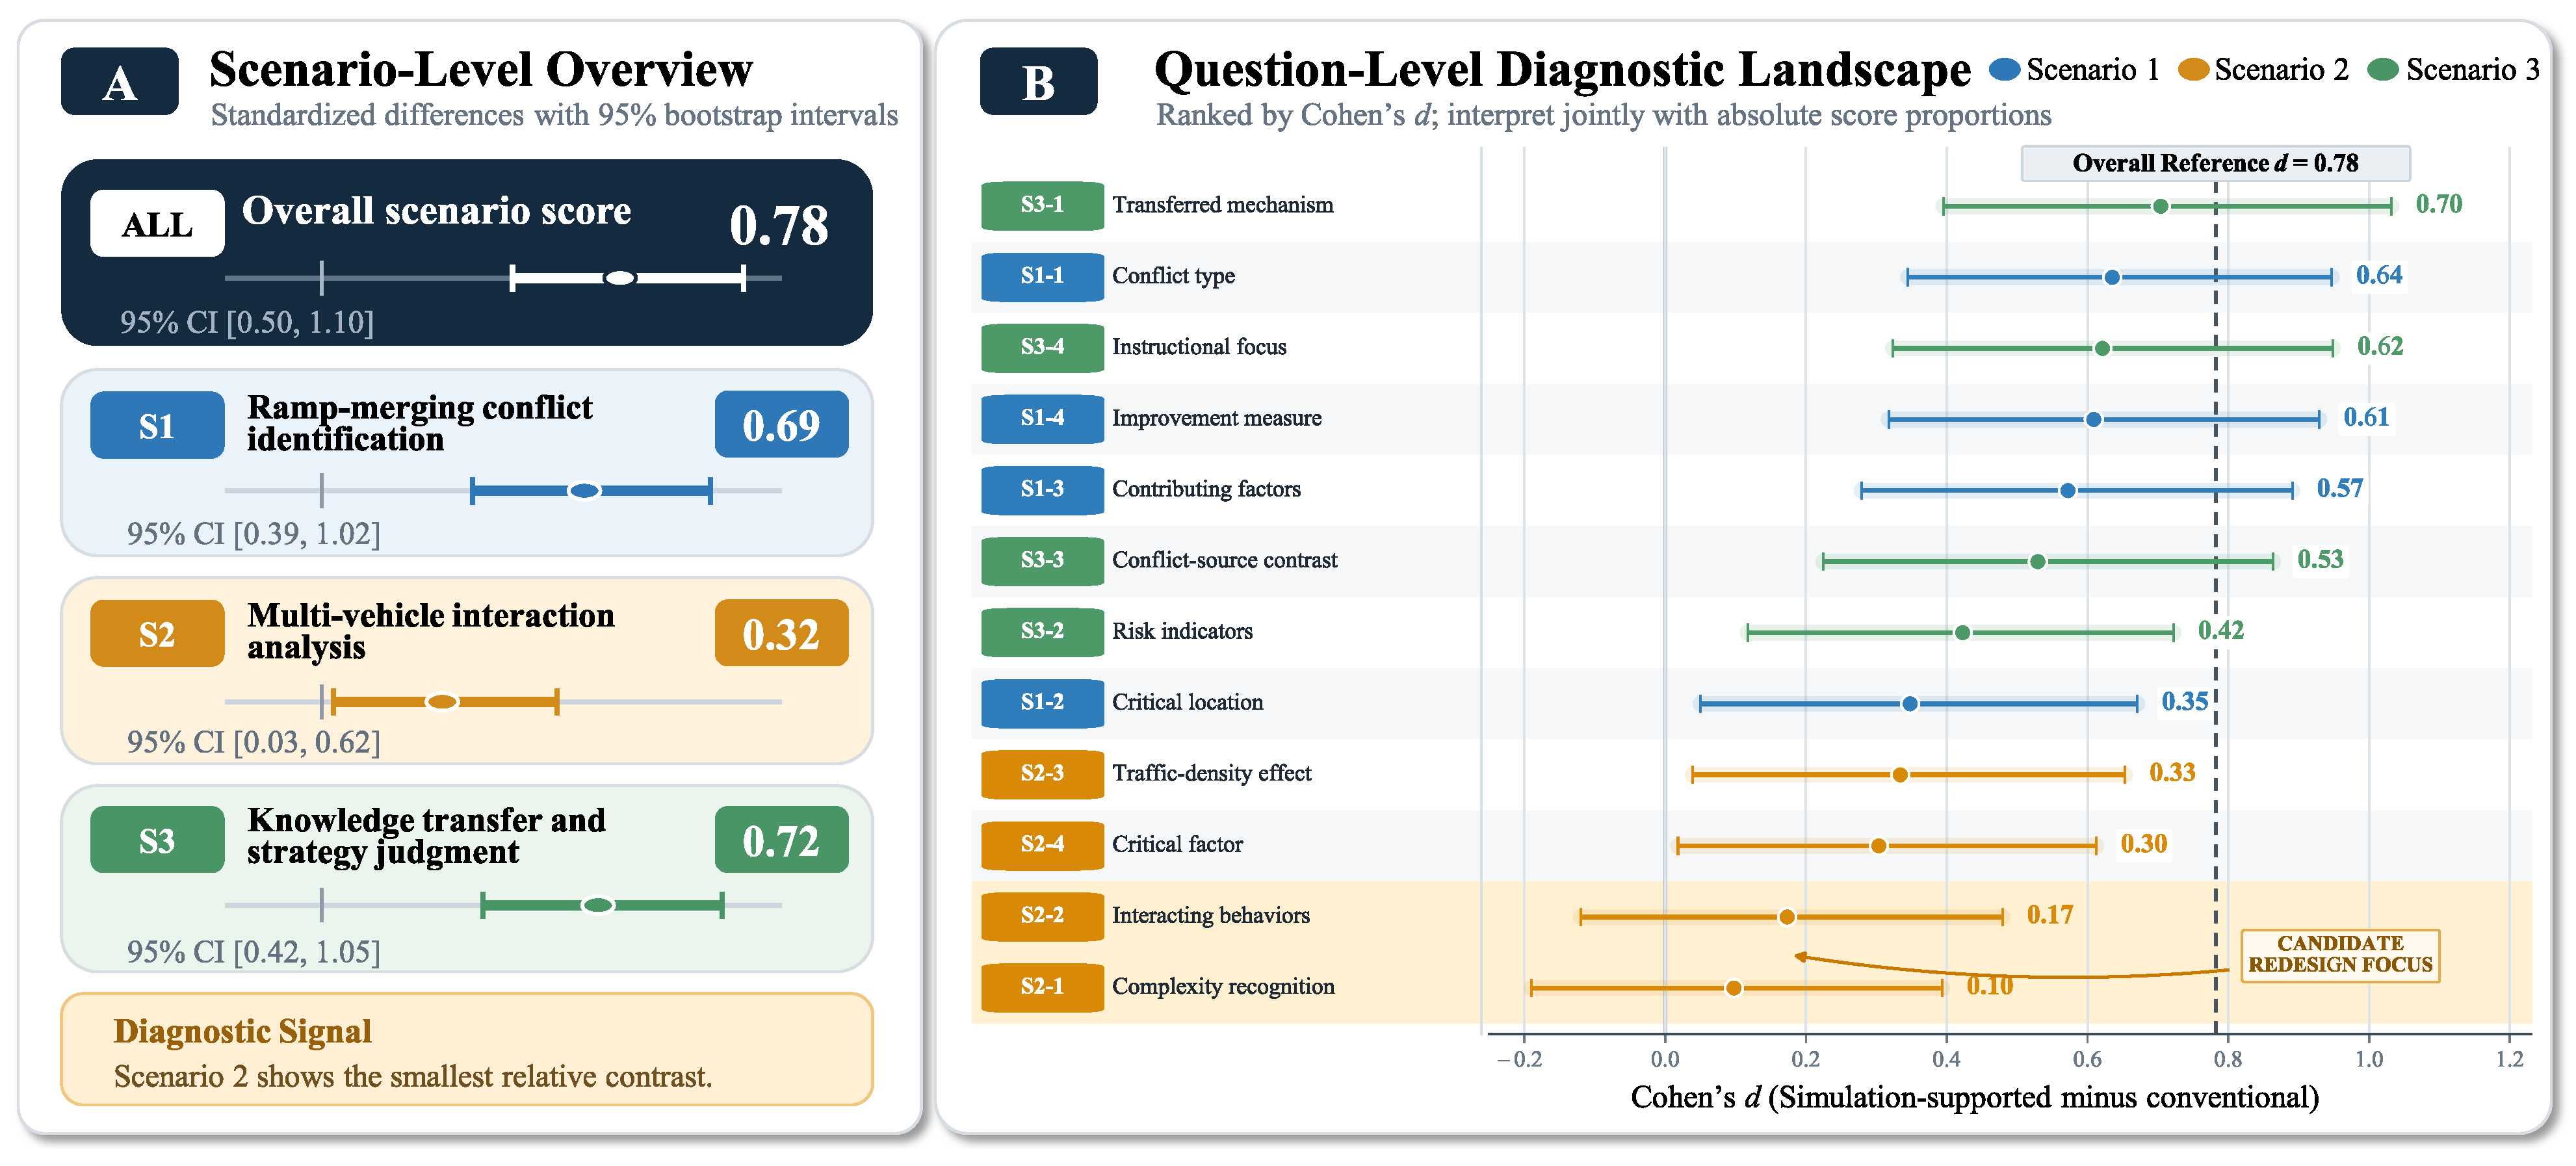

Disclaimer/Publisher’s Note: The statements, opinions and data contained in all publications are solely those of the individual author(s) and contributor(s) and not of MDPI and/or the editor(s). MDPI and/or the editor(s) disclaim responsibility for any injury to people or property resulting from any ideas, methods, instructions or products referred to in the content. |
© 2026 by the authors. Licensee MDPI, Basel, Switzerland. This article is an open access article distributed under the terms and conditions of the Creative Commons Attribution (CC BY) license.