


Abstract
We studied the evolution of complex social networks over time. The elements of the networks are users, and the connections correspond to the interactions between them. At a particular moment in time, each node of a complex network has such characteristics as its degree, as well as the total degree of its neighbors. Obviously, in the process of network growth, these characteristics are constantly changing due to the fact that new edges are attached to this node or its neighbors. In this paper, we study the dynamics of these characteristics over time for networks generated on the basis of a nonlinear preferential attachment mechanism, and we find both the asymptotics of their expected values and the characteristics of their spread around the mean. In addition, we analyze the behavior of these local characteristics for three real social networks. The applicability of the findings to actual problems in the study of social media in the digital humanities is discussed.
1. Introduction
Modeling the behavior of social, biological, and technological systems is an important task. One of the most successful approaches is the representation of a complex system in the form of numerous homogeneous elements that interact with each other. The resulting model is a complex network consisting of nodes and links (edges), and it reflects the interactions among them in a real system.
This paper is devoted to the study of the dynamics for complex networks generated on the basis of a model with a nonlinear preferential attachment mechanism. We are interested in the analysis of stochastic processes that arise during the growth of such networks, namely, ones that describe the dynamics of a node degree and the dynamics of the sum of the degree of its neighbors. All of these characteristics of a node change over time, since each newly born node in the network has a chance to join it or its neighbors in each of the subsequent iterations. These local characteristics are extremely important in the analysis of social networks. Note that in this paper, we do not limit ourselves to studying only the expected behavior of these quantities, but we also analyze the asymptotic behavior of their variances over time in order to better understand the features of their distributions. Determining the characteristics of complex networks is crucial when solving a number of practical problems [1,2,3].
In recent years, many models have emerged to describe the growth of complex networks. One of the difficulties in their creation is the need for the networks generated on their basis to have the features of real networks. These features include the presence of a power law distribution of node degrees in real networks [4,5,6,7,8,9,10]. The Barabási–Albert model [11], which uses the preferential attachment mechanism, successfully reproduces this phenomenon. However, some properties of real networks can only be modeled by adding additional mechanisms to the network generation model [12,13,14,15,16,17,18,19,20,21,22]. Another approach is the modification of the preferential attachment mechanism in such a way to allow a nonlinear dependence of the probability of attaching to a vertex on its degree. This mechanism is called nonlinear preferential attachment (NPA). In this paper, we restrict ourselves to the study of networks built on the use of this rule. Note that the analysis of such networks allows us to shed light on both the properties of real networks that use the NPA mechanism in their development and on the non-obvious limitations of the NPA model.
As networks built on this mechanism grow, the degree of each node may change depending on whether a new node joins it or not. Therefore, all local characteristics of a node are described by some stochastic processes, each subsequent state of which is determined by the current one. Such processes are called Markov processes. For networks built according to the classical Barabási–Albert model [11], the behavior of the expected value, variance, kurtosis, and asymmetry of a node degree over time were studied in [23,24], in addition to other local characteristics, such as the average degree of neighbors and their friendship index. In this paper, we extend this analysis to a model that uses the nonlinear preferential attachment mechanism.
By analyzing the evolution of real social networks over time, we discover the following unusual phenomenon: For a group of nodes that appeared almost simultaneously (in a certain short time interval), the ratio of their average degree to the variance of their degrees is actually a constant at any subsequent point in time. In other words, although the trajectories for the degrees of nodes that appeared almost simultaneously can differ greatly, the coefficient of variation of the values of the degrees of nodes in this group practically does not change in time.
In this regard, the main research question of this paper arises: What mechanisms of evolution of complex networks can explain this phenomenon that is observed in real networks? We consider the Barabási–Albert model and analytically show that the mechanisms of growth and preferential attachment used by this model are sufficient for the appearance of this phenomenon in complex networks.
Thus, in this paper, we are interested in the following research questions:
- What are the features of stochastic processes that describe the growth of the degree of a node and the growth of the sum of degrees of the neighbors of a node for networks built according to the NPA model?
- What is the asymptotic behavior of the coefficients of variation for the degree of a node and the summary degree of the neighbors of the node in networks built according to the NPA model?
- Does the behavior of these local characteristics in simulated networks correspond to their behavior in real social networks?
We answer these questions in our study by using the mean field method to find the asymptotic behavior of the quantities [25,26,27].
Note also that for networks built on the basis of the Barabási–Albert model, the authors of [28] obtained the limit distribution of node degrees, and they showed that after some scaling procedures, this stochastic process converged to a Yule process (in distribution). However, for networks using the nonlinear PA mechanism, finding the degree distributions of nodes seems to be a too difficult task. Therefore, the estimates of the node degree variance obtained in this paper shed light on additional characteristics of this distribution.
The aim of the paper is an analysis of the dynamics of node degrees during the growth of a complex network. In particular, we are interested in how greatly the characteristics of these trajectories depend on the time of node appearance.
First, we present the empirical analysis of real networks in Section 2. The trajectories of node degrees over time for a specific node may vary from those of other nodes that appear in close moments in time. Therefore, we explore the average dynamics of the degree of a group of nodes that appear in one interval of time. We find the average trajectory and its variance for all nodes in a group. The results of the analysis of such trajectories in real social networks show that the average value of the node degrees and their variance are proportional. This means that their ratio remains almost constant for the whole duration of network growth. This phenomenon is inherent in all social networks that are considered. In this study, we observe real networks, the growth of which can be fully recreated. This allows us to study the whole trajectory of the growth of the degree of each node over time.
Next, we examine whether this phenomenon exists in randomly growing networks in Section 4. We choose the Barabási–Albert model with the non-polynomial preferential attachment mechanism, since many other more complex models are based on this mechanism of attachment or modifications thereof. A brief description of the model can be found in Section 3.
We use the following method to analyze the degree trajectories of nodes that appear at some moments in time. First, we simulate network growth many times to obtain trajectories of nodes (fixed by iterations at which they appear). Then, we average these trajectories and obtain their variances for each moment in time. These experiments allow us to prove that the same phenomenon exists for random networks as well.
Our theoretical analysis (Section 4) shows that the coefficient of variation for stochastic processes that describe the dynamics of degree growth tends to be constant with the iteration growth.
The same results are obtained for the total degree of all neighbors for a node in the Barabási–Albert model with the non-polynomial preferential attachment mechanism in Section 5.
The applicability of the findings to actual problems in the study of social media in the digital humanities is discussed in Section 6.
2. Empirical Dynamic Networks
In this section, we study the dynamics of local characteristics in real networks. In order to lower the impacts from individual nodes in the network, we observe the degree and summary degree dynamics not for one node, but for a group of nodes that appear sequentially in the network. Each group contains one hundred nodes. At each iteration, the obtained values of the characteristics are averaged for the group.
2.1. Real Network Overview
We consider three real networks that were taken from online repositories (see Table 1). These networks reflect user behavior on websites where users ask questions and receive answers.
Table 1.
Dynamic network statistics.
2.2. StackOverflow Network
The StackOverflow service connects millions of software developers from all over the world. This network is represented by a bipartite graph, the nodes of which are users and questions. A user is connected to a question if this user adds the question to bookmarks. One may do this in order to have quick access to the question.
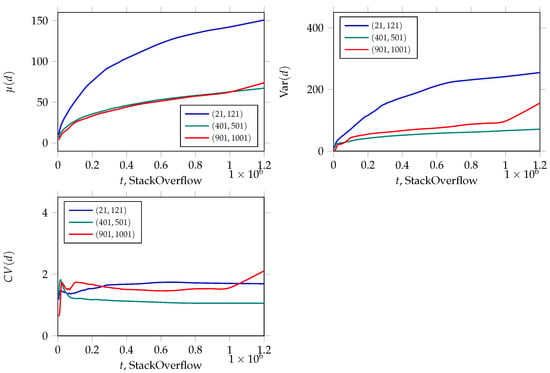
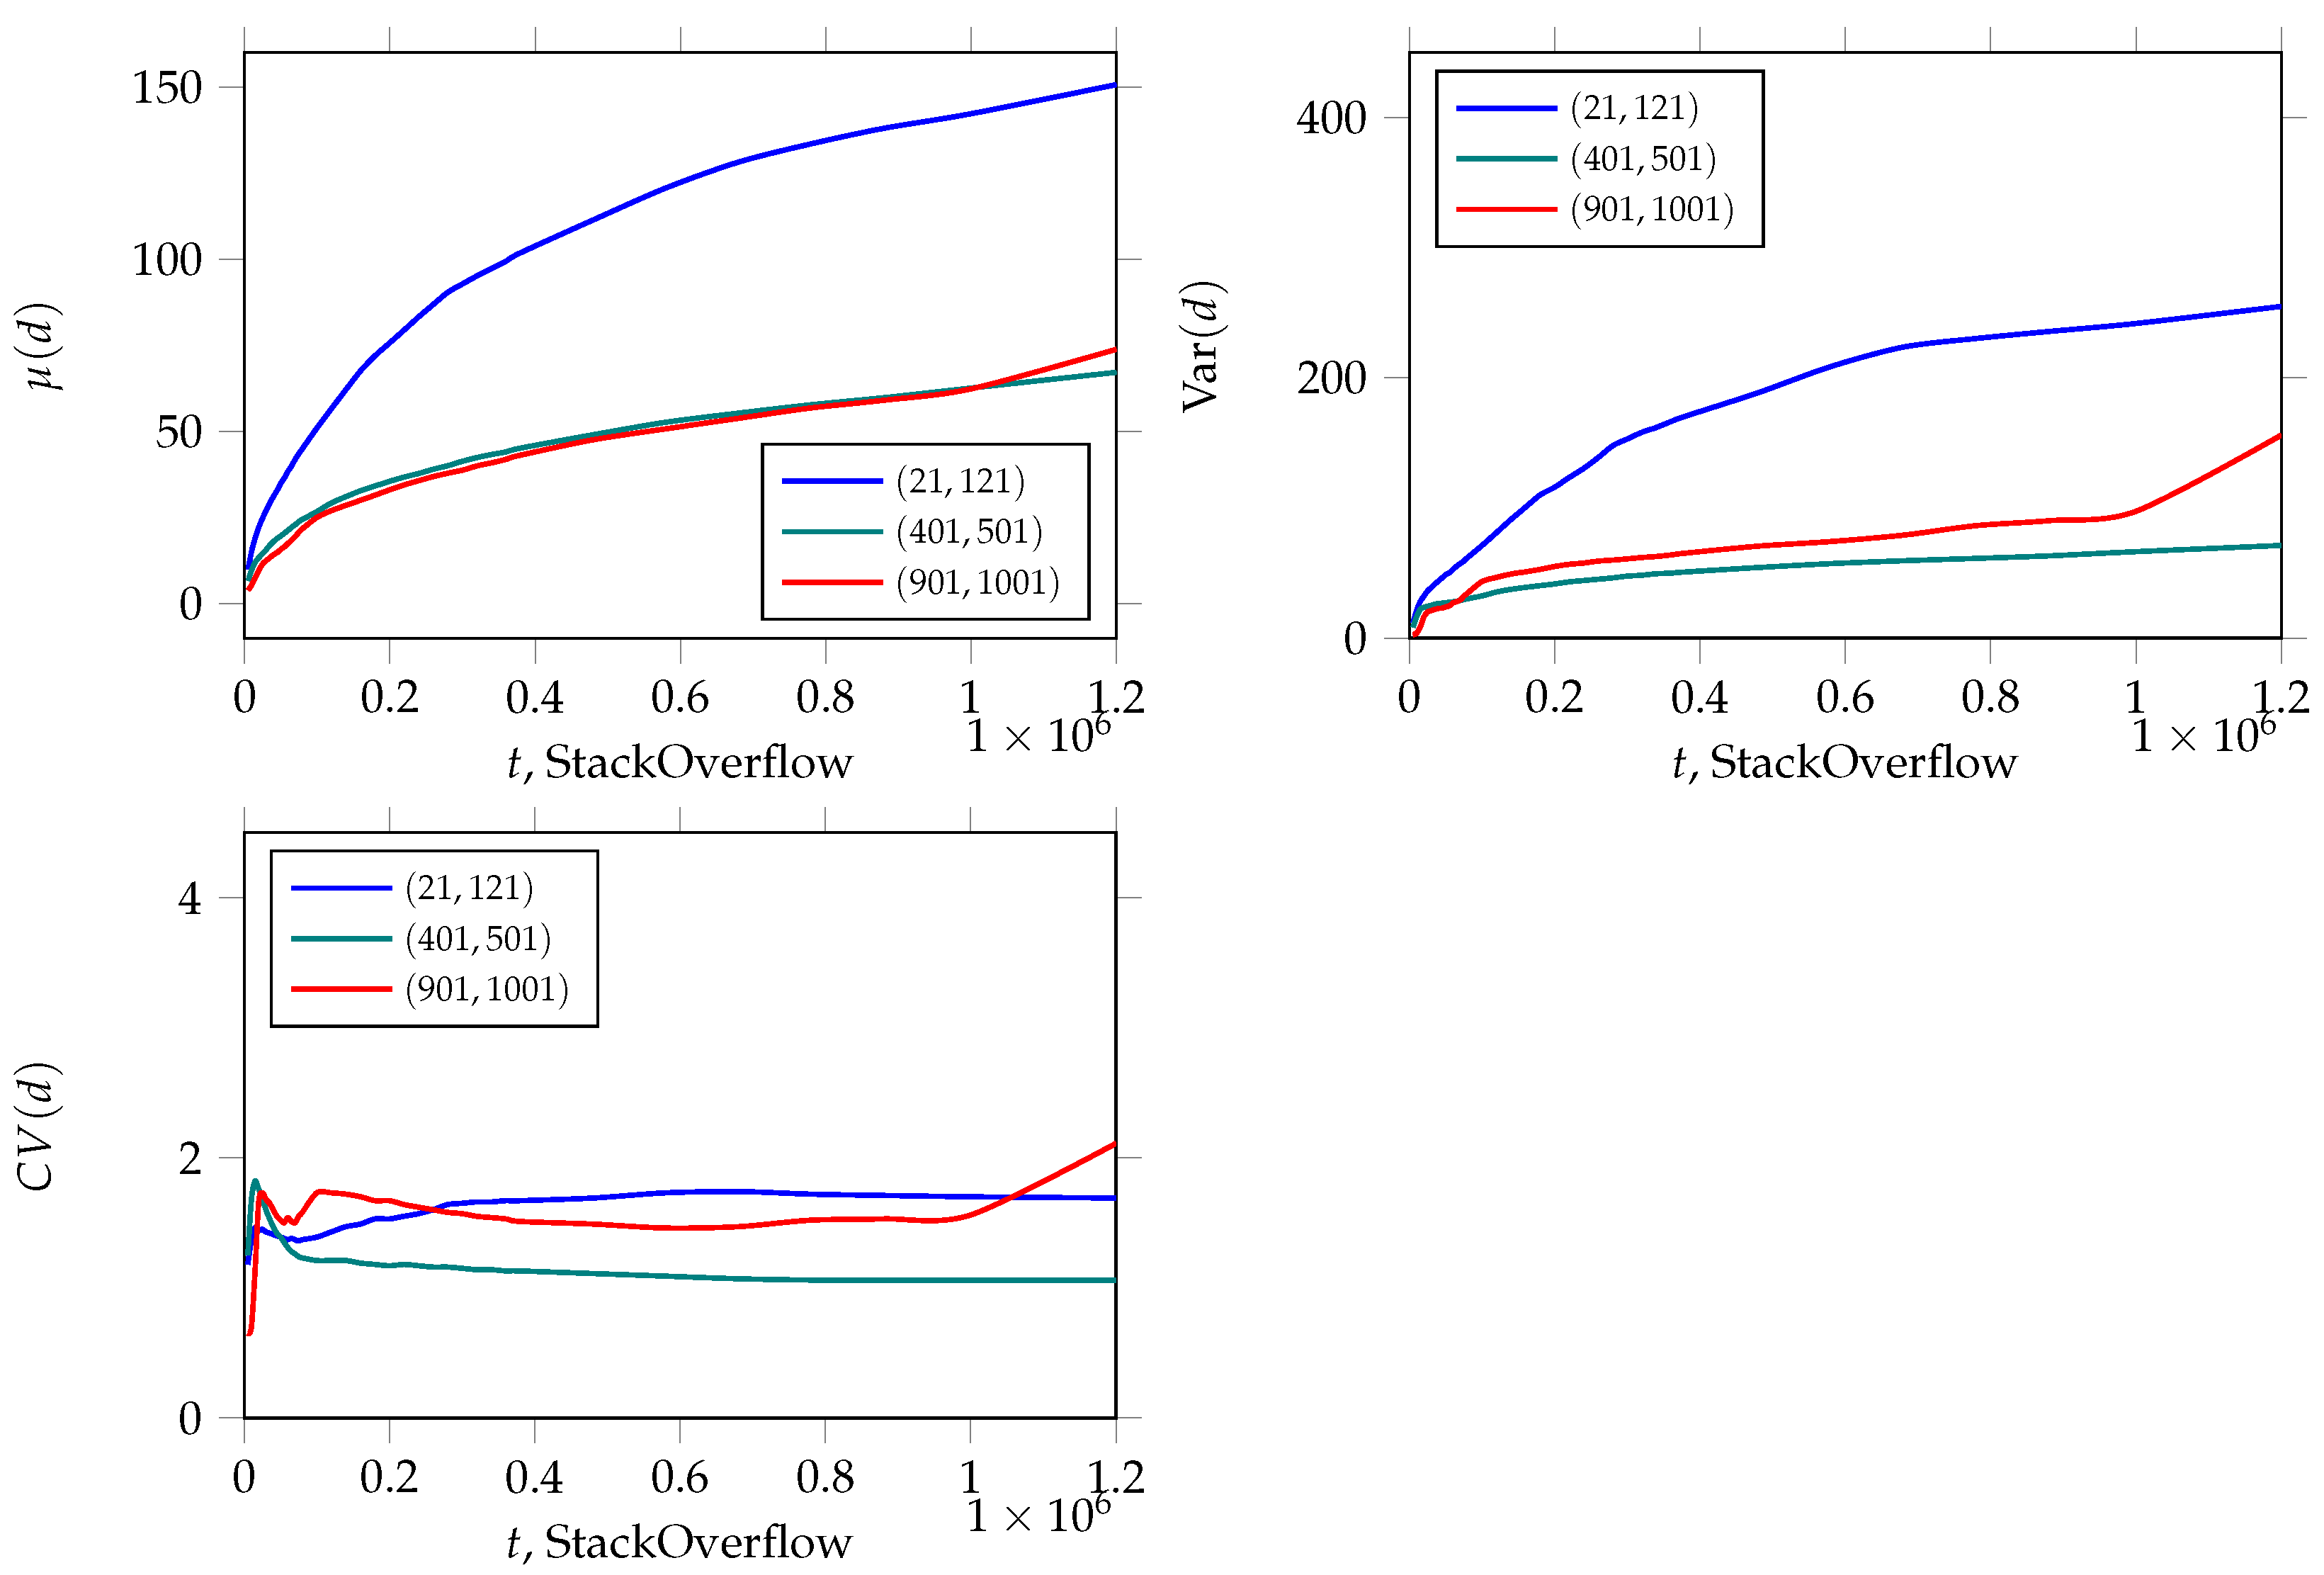
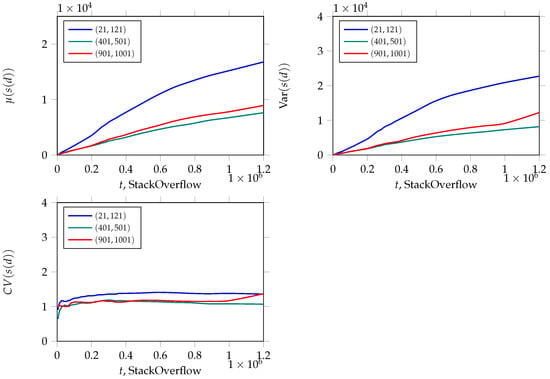
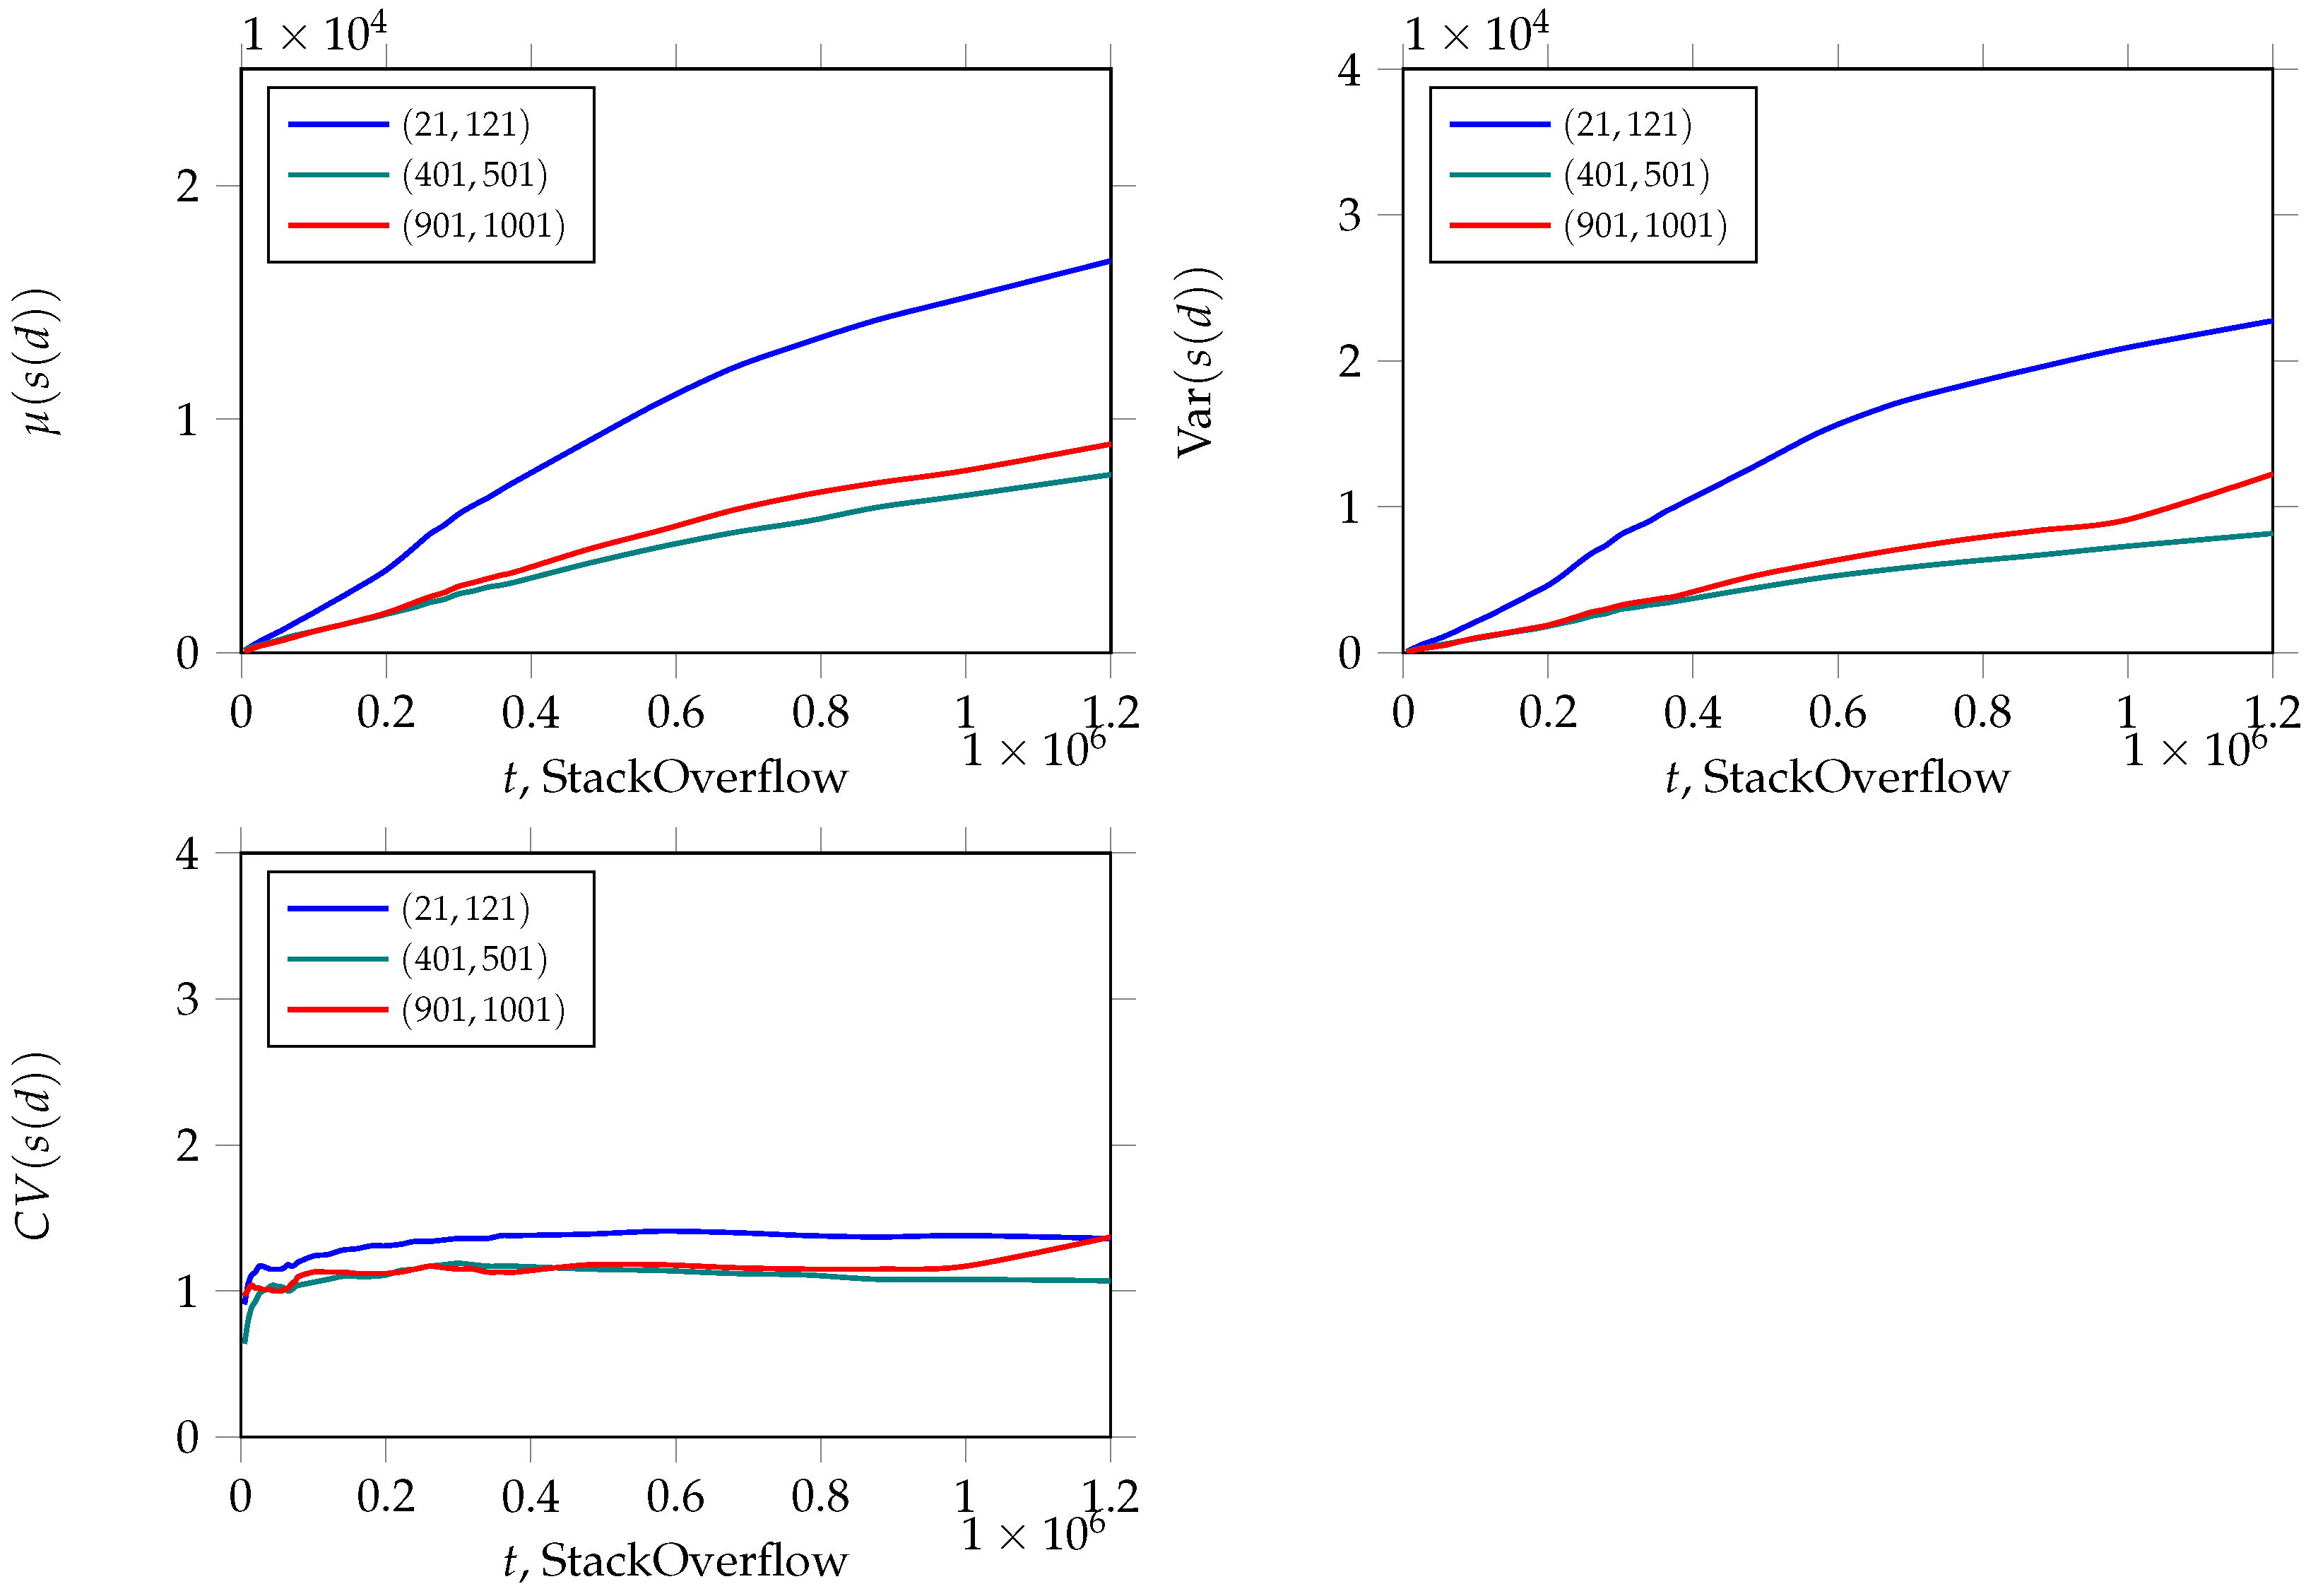
The average degree dynamics obtained for this network are shown in Figure 1. The plots of both the average degrees and variances show logarithmic growth. This network is the first one considered, and both random values follow the logarithmic law. Despite the network growth, the coefficient of variation, which is described as the ratio of the standard deviation to the mean, fluctuates around a constant as shown in Figure 2.
Figure 1.
Trajectories of the averaged degrees (top left), variances (top right), and coefficients of variation (bottom) for three groups of nodes from iterations (21, 121), (401, 501), and (901, 1001) over the growth of the network based on the data of users adding posts to their favourites on StackOverflow.
Figure 2.
Trajectories of the averaged sum of degrees (top left), variances (top right), and coefficients of variation (bottom) for three groups of nodes from iterations (21, 121), (401, 501), and (901, 1001) over the growth of the network based on the data of users adding posts to their favourites on StackOverflow.
2.3. AskUbuntu Network
AskUbuntu is a popular website for consulting on technological topics related to the Ubuntu operating system. The network data reflect user interactions on the platform. Two nodes (u and v) that represent users are connected by an edge with a time stamp t if user u has either answered or commented on the question or answer of user v at time t.
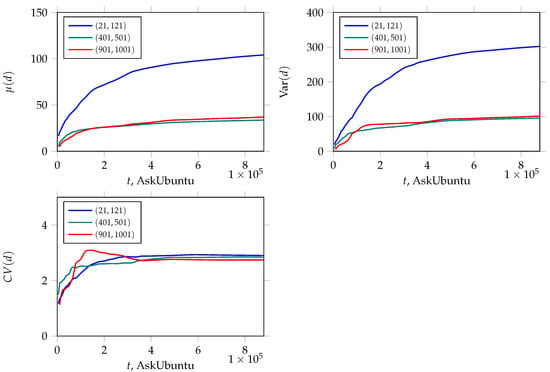
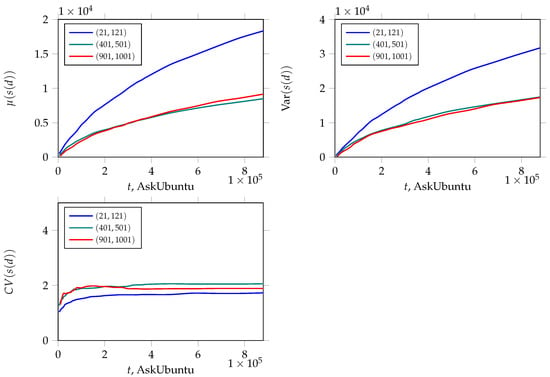
Plots of the dynamics of the average degree and its variance are presented in Figure 3. A clear logarithmic growth can be seen in the first iterations of network growth. However, for the greater part of the network’s existence, the growth remains linear for both the average degrees in the left plot and the variances in the right plot. The coefficient of variation, which is described as the ratio of the standard deviation to the mean, remains constant for the greater part of the network’s growth as can be seen in Figure 4.
Figure 3.
Trajectories of the averaged degrees (top left), variances (top right), and coefficients of variation (bottom) for three groups of nodes from iterations (21, 121), (401, 501), and (901, 1001) over the growth of the network based on the data of user interactions inside the question and answer service of AskUbuntu.
Figure 4.
Trajectories of the averaged sum of degrees (top left), variances (top right), and coefficients of variation (bottom) for three groups of nodes from iterations (21, 121), (401, 501), and (901, 1001) over the growth of the network based on the data of user interactions inside the question and answer service of AskUbuntu.
2.4. SuperUser Network
SuperUser is another popular Q&A website for technological topics. As with the previous network, the data represent user interactions on the platform. Two nodes (u and v) that represent users are connected by an edge with a time stamp t if:
- User u answers the question of user v at time t;
- User u comments on the question of user v at time t;
- User u comments on the answer of user v at time t;
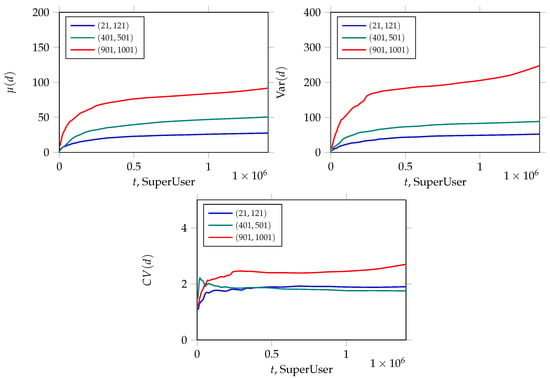
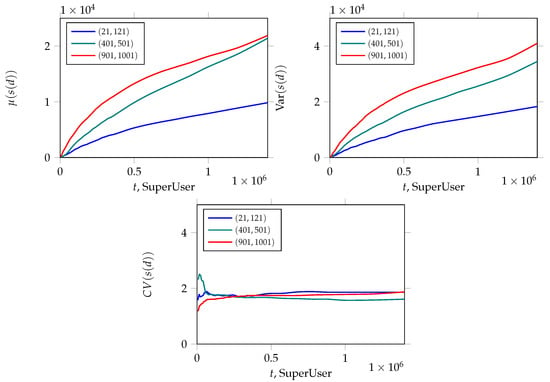
After network modeling, we acquired the node trajectories, as shown in Figure 5. It can be clearly seen that these trajectories are very reminiscent of those obtained for the AskUbuntu network (Figure 3). It should be noted that the group of nodes that appeared between iterations 400 and 500 differed significantly from the others. The increased values of the characteristics are explained by the presence of a couple of very large nodes inside this group. In Figure 6 we see that still, as in the previous empirically growing networks, the coefficient of variation fluctuated around the constant during the whole process of network growth.
Figure 5.
Trajectories of the averaged degrees (top left), variances (top right), and coefficients of variation (bottom) for three groups of nodes from iterations (21, 121), (401, 501), and (901, 1001) over the growth of the network based on the data of user interactions inside the question and answer service of SuperUser.
Figure 6.
Trajectories of the averaged sum of degrees (top left), variances (top right), and coefficients of variation (bottom) for three groups of nodes from iterations (21, 121), (401, 501), and (901, 1001) over the growth of the network based on the data of user interactions inside the question and answer service of SuperUser.
To sum everything up, in real networks, both the degree and its variance grow over time. Moreover, the coefficient of variation quickly converges to a constant. This phenomenon is observed in many social networks. Since the Barabási–Albert model usually produces networks with characteristics that are similar to those of real social networks, we observe this phenomenon in networks produced by the model.
3. Barabási–Albert Model with Nonlinear Preferential Attachment
3.1. Notations and Definitions
We use to denote a network at time t with a set of its nodes and a set of its links . We denote the degree of node at time t as . The fixed integer is a model parameter and denotes a constant number of attached links at each iteration. The quantity is another model parameter that describes the power law exponent of the dependence of the node degree on the link probability in the NPA rule.
According to the Barabási–Albert model with the NPA mechanism, the network is evolved from a previous state (at moments in time ) as follows:
- At time , is a complete graph with m nodes;
- The network adds one newly born node , i.e., ;
- m links are added to the network; they connect the newly born node with m already existing nodes; each of these links appears as the result of the application of NPA rule: We use the discrete random variable , which takes the value i with probabilityIn the case of , we add a link to the network. We make m independent random experiments.
Let the random value be such that it selects the value i if takes i in at least one of the m experiments at time .
denotes the degree of node at iteration t. denotes the sum of all neighbor degrees of node at iteration t. Then, is the average degree of all neighbors of node at time t.
The time evolution of these characteristics can be represented as non-stationary Markov processes, i.e., processes for which their random values at time moment t depend only on the network state at the previous moment. Asymptotic estimates of their expected values and variations at iteration t are found in [24,30,31]:
The aim of this paper is to investigate the asymptotic behavior of stochastic processes over time for networks generated by the NPA model. In this paper, we focus on estimating the first two moments, i.e., the expectations and variances.
3.2. The Evolution of Barabási–Albert Networks with the NPA Mechanism
It follows from the description of the iteration step in the Barabási–Albert model with the NPA mechanism that:
- If , then and , since node links to the newly born node that has degree m.
- If and , then the newly born node links to one of the neighbors of node , and we have and .
Let and be auxiliary random variables defined by
We denote
Lemma 1.
The value of satisfies and asymptotically follows
Proof.
Let us estimate from below and above. First, we should note that . Then, we get
Therefore, we have
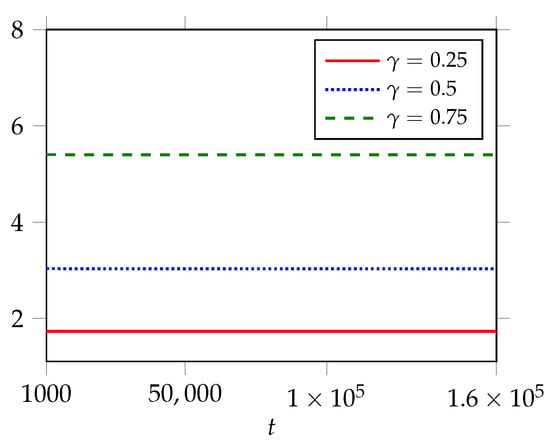
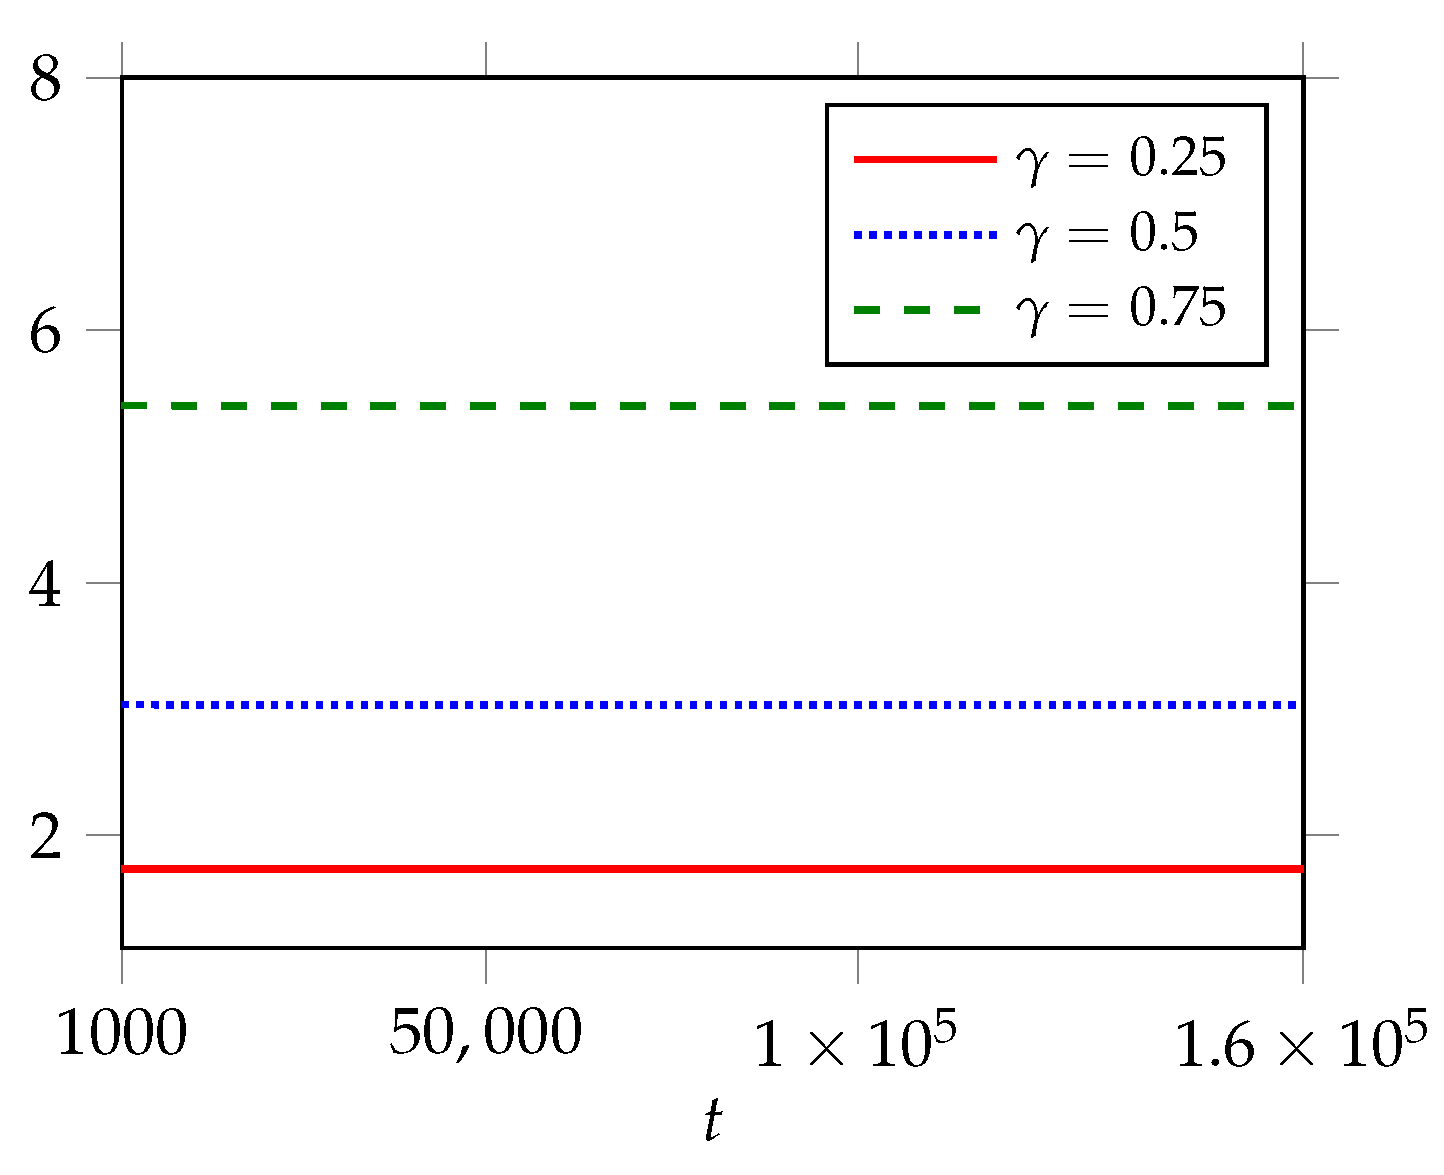
Since is bounded for every fixed and increases over , there exists , which we denote by (see Figure 7). □
Figure 7.
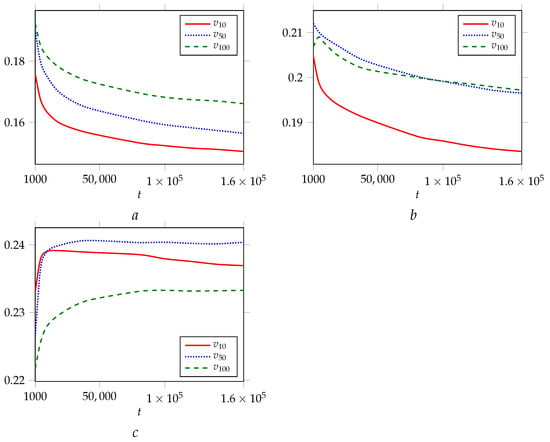
The dynamics of the ratio in BA networks with t up to 160,000 iterations. Networks are generated with and , , and .
Then, the expectations of and at iteration —conditional with respect to the current network state —are equal to
Lemma 2.
The value of is asymptotically equal to :
Proof.
By the definition of , we have as . There are a neighbor of node and an infinite subsequence such that as for all j such that and . Then, we have
□
Since we are interested in the behavior of the network characteristics for sufficiently large sizes of networks, we will use the asymptotic estimate (6) in our further reasoning.
It follows from Lemma 1 that
It follows from Lemmas 1 and 2 that
4. An Investigation into the Dynamics of the Node Degree: The Evolution of Its Expectation and Variance over Time
4.1. The Expectation of
Theorem 1.
If , then the expectation of asymptotically follows
where constant is equal to
If , then the expectation of follows
Proof.
It follows from the analysis in Section 3.2 that the difference between values of at moments and t is equal to
Using Equation (7), we get the difference equation
with the corresponding approximate differential equation (with )
from which we get its solution
where is a constant. Then, (10) follows from the initial condition .
Equation (11) is well known [11]. □
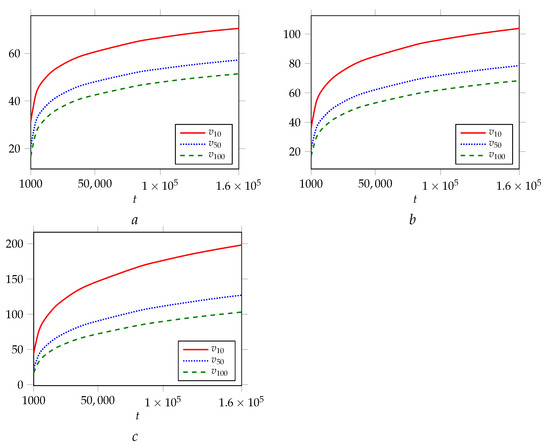
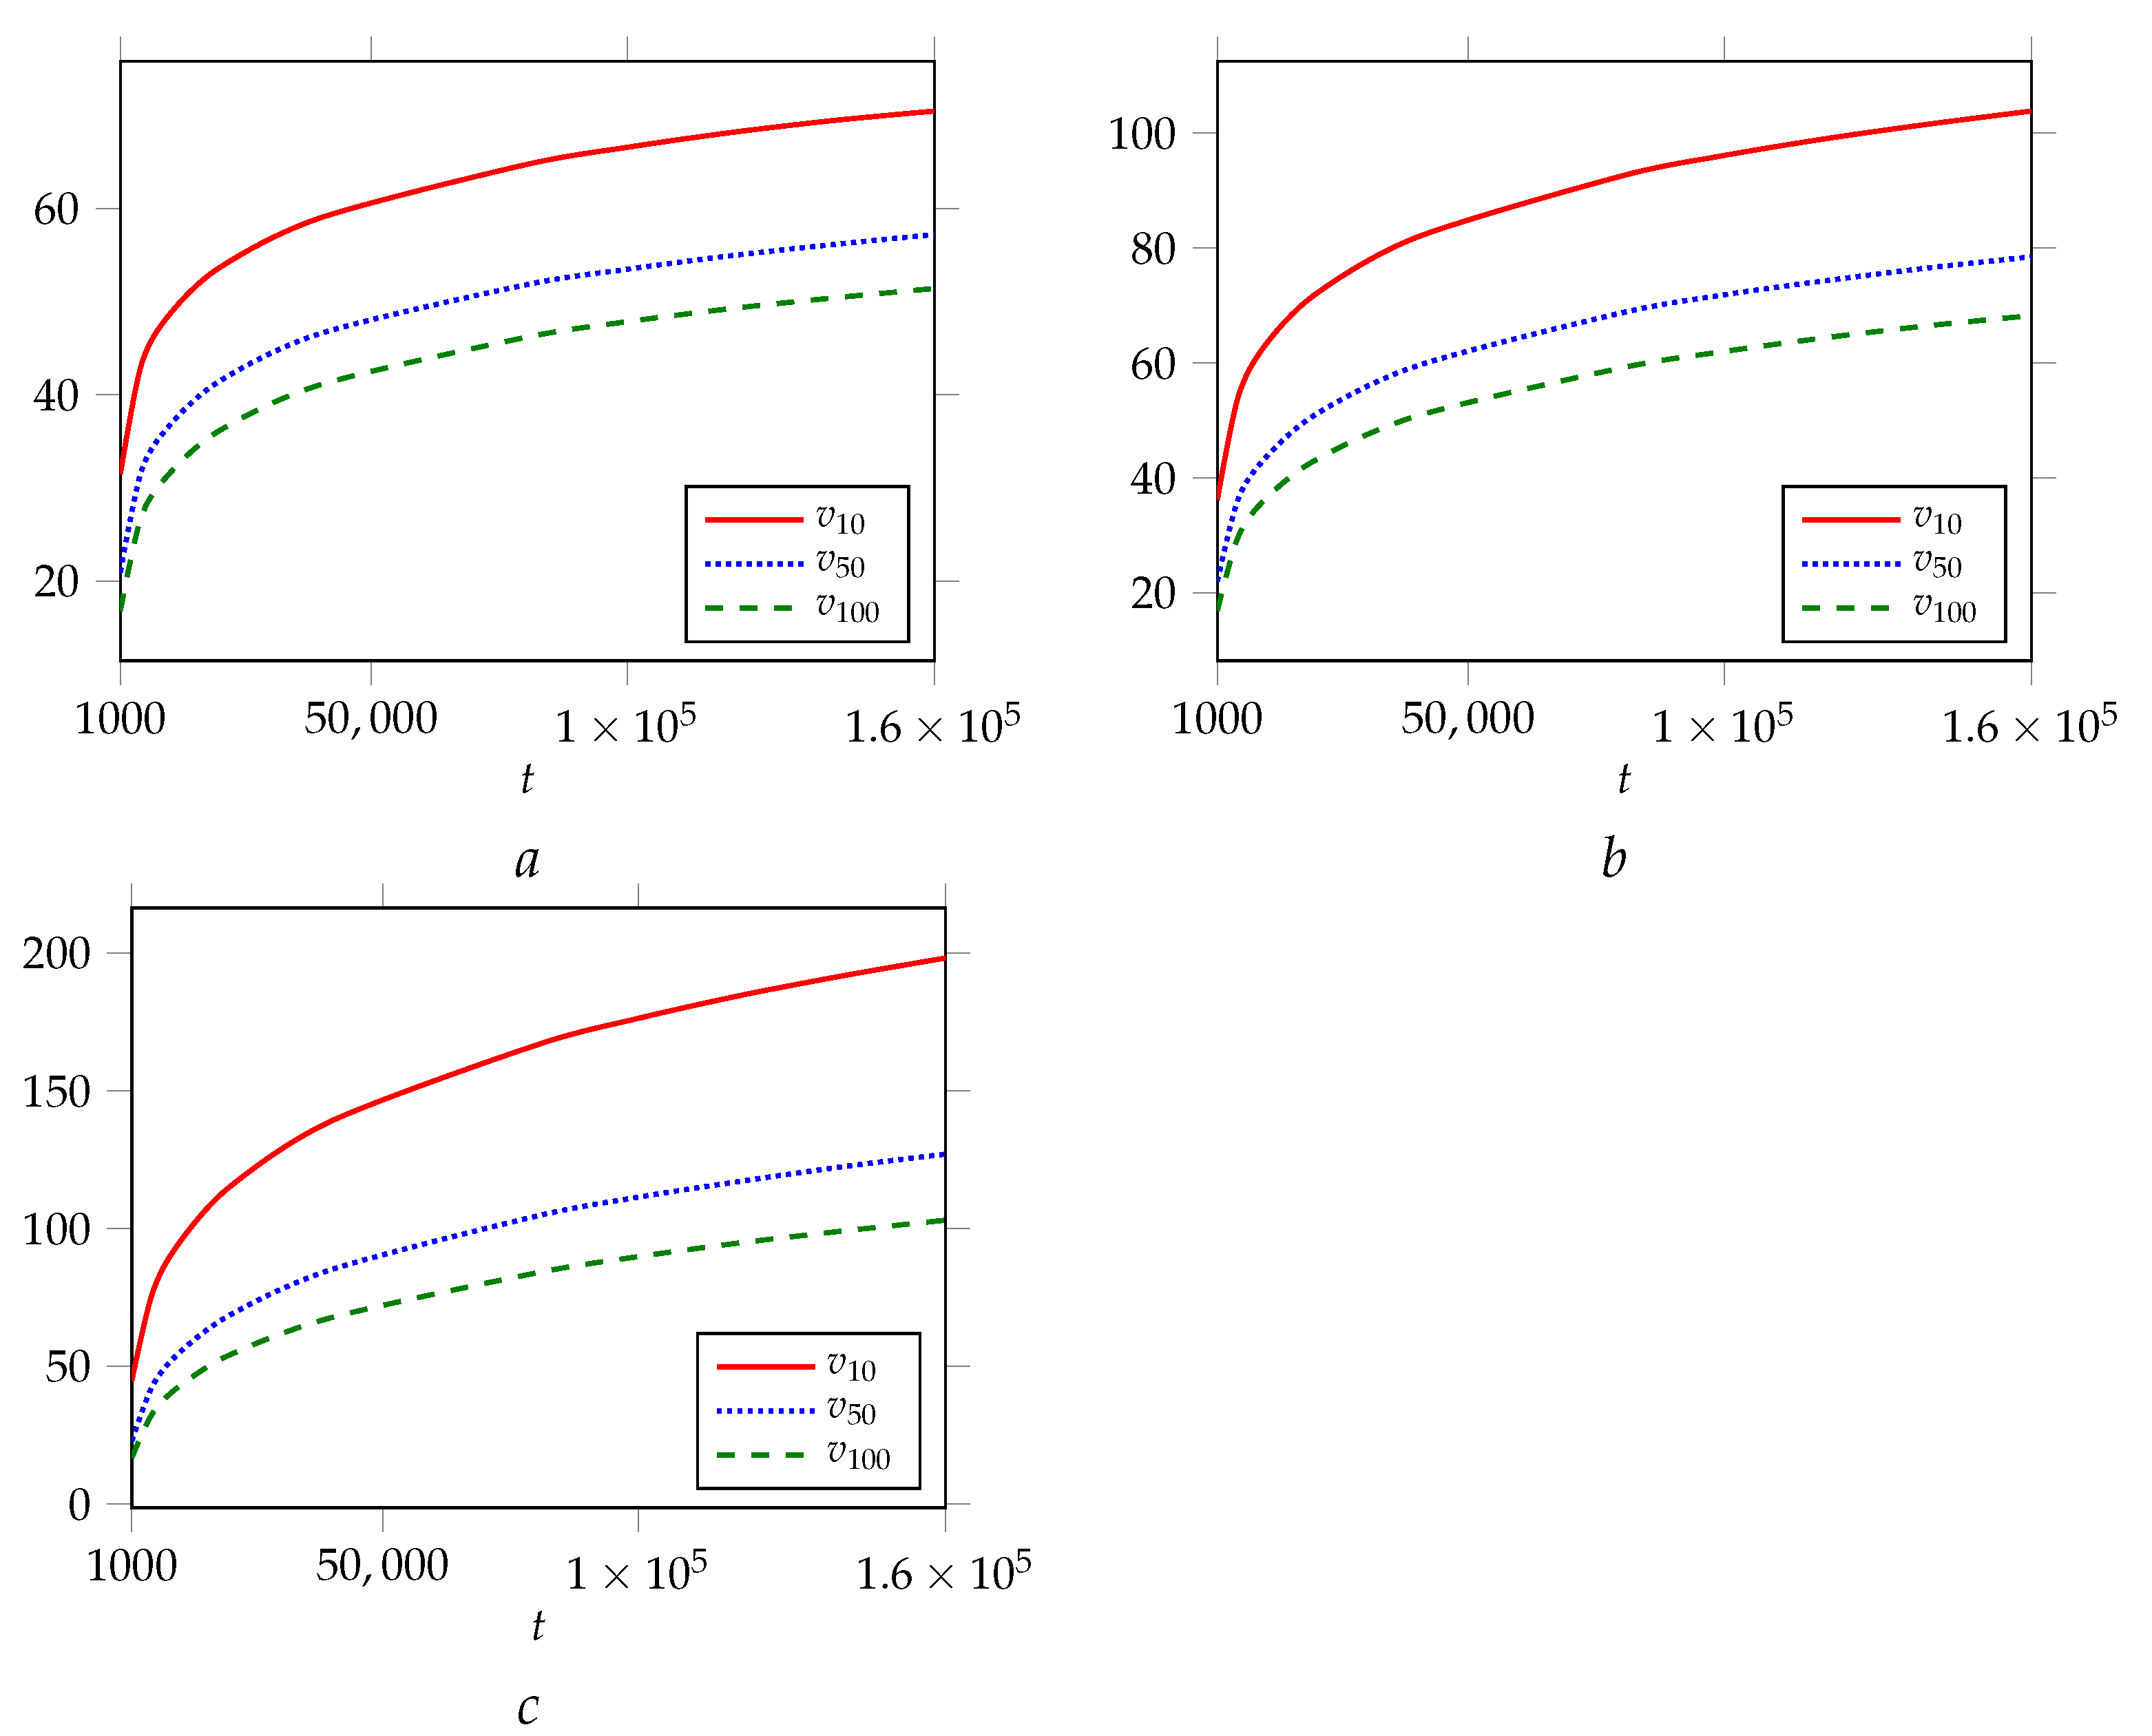
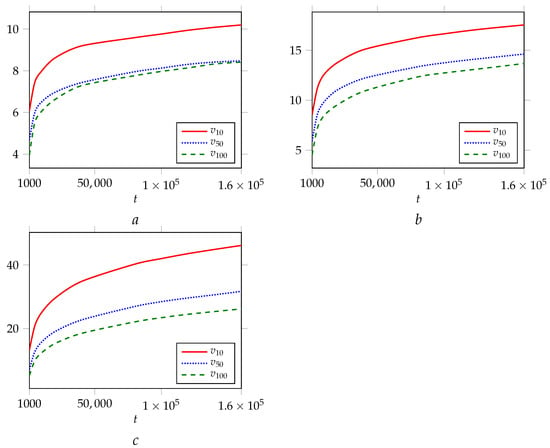
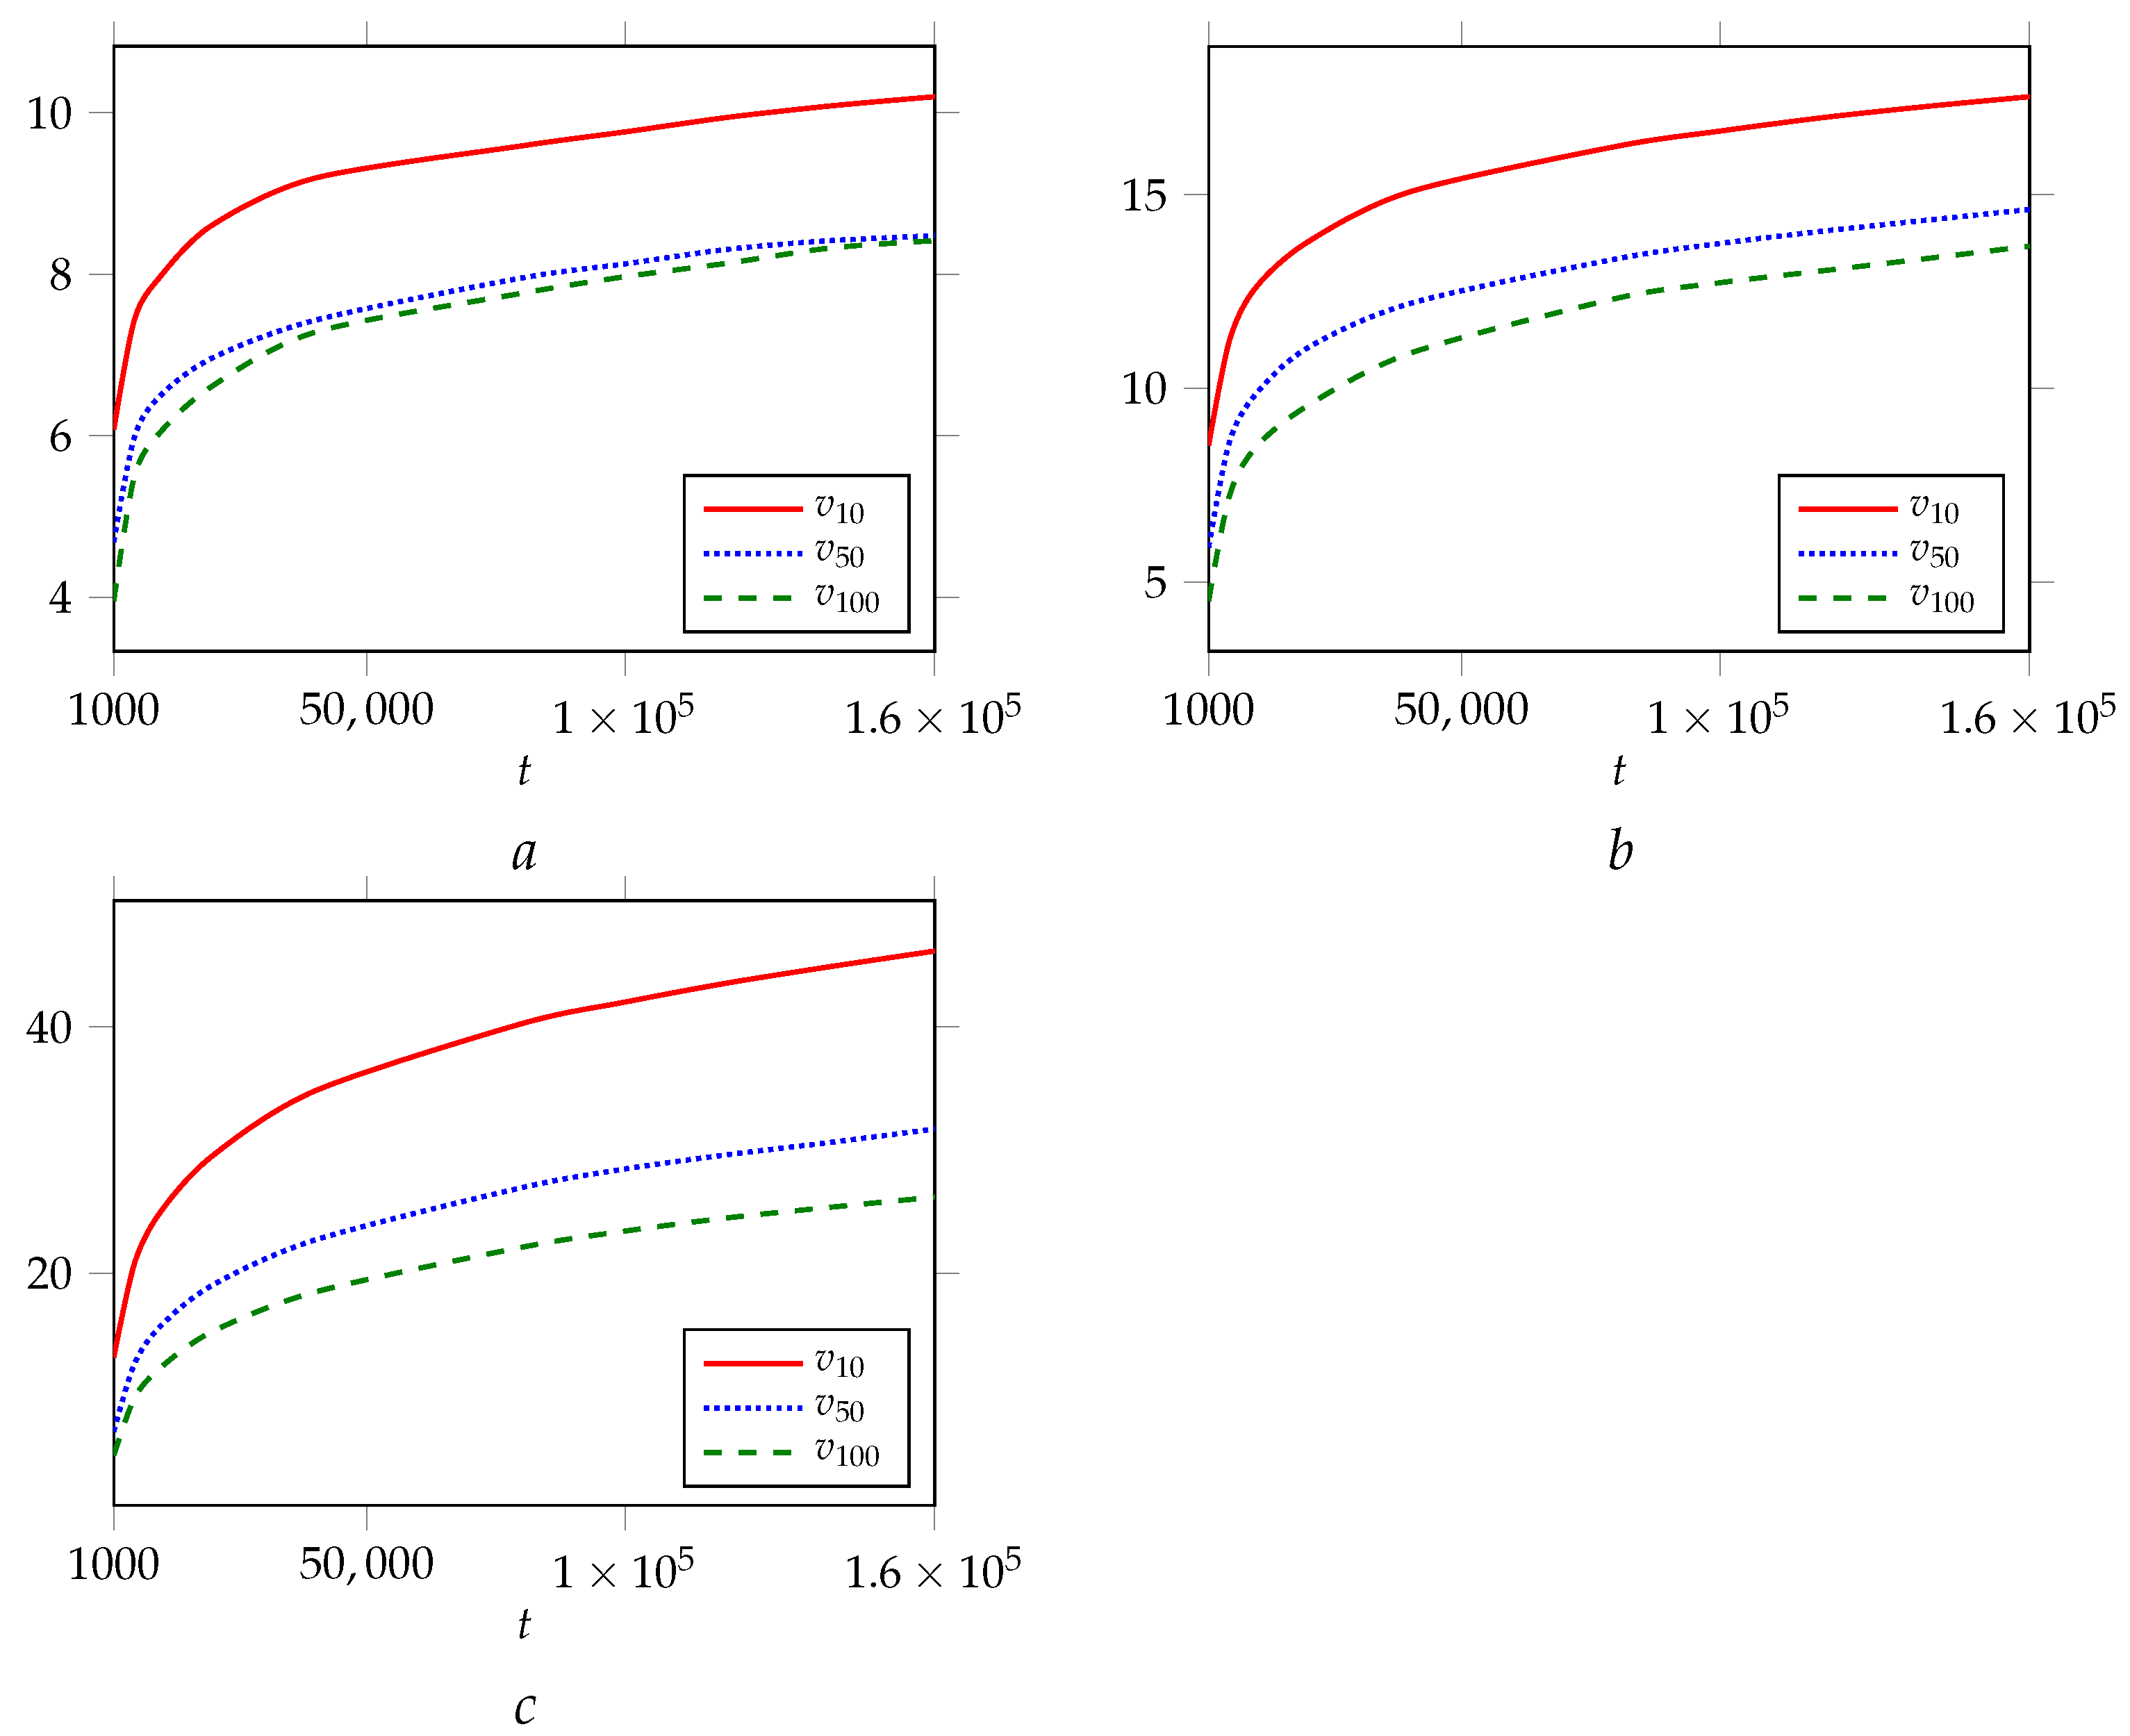
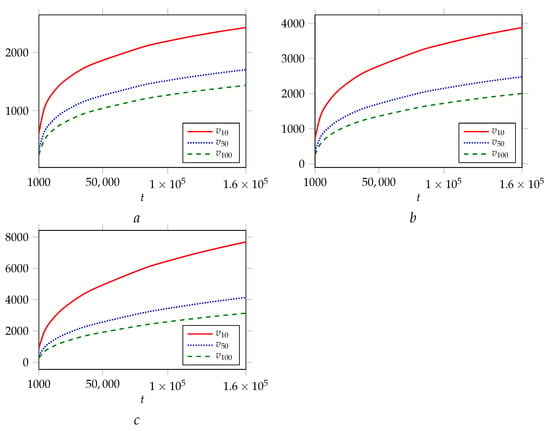
Let us now simulate the growth of NPA networks to illustrate the behavior of the mean value of : independent simulations of BA networks with the NPA mechanism were carried out, and each graph had 160,000 nodes. Then, we calculated the means of the empirical values of . We used the value of parameter and three different values of . The trajectories are shown in Figure 8.
Figure 8.
Mean value of the node degree in networks generated by the BA model with nonlinear PA for the node , , with t going up to 160,000 iterations. Networks were generated for and for the values of (a), (b), and (c).
4.2. The Variance of
Lemma 3.
Let be a constant. Then, the asymptotic behavior of the expectation of can be described as follows:
where the constant is defined in (10).
Proof.
We have
Using Equation (7), we obtain the conditional expectation of at moment :
Lemma 4.
If , then the second moment of follows:
where is a constant.
If , then the second moment of follows:
Proof.
We have
Using Equation (7), we obtain the conditional expectation of at moment :
If we denote as , substitute with , and change in the second term with its expectation by using Lemma 3, then Equation (18) can be represented by its approximate version as follows:
where is defined in Equation (10).
The solution of the equation is
where is a constant. Thus, we get (15) if we take into account the initial condition, .
Equation (16) is proved in [23]. □
Theorem 2.
If , then the variance of at moment t asymptotically follows:
where .
If , then the variance of at moment t is
Proof.
The definition of variance implies
Then, Theorem follows from Lemma 4 and Theorem 1.
The case of is proved in [23]. □
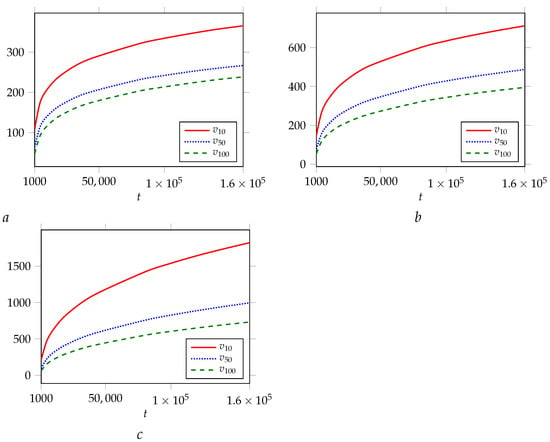
Let us now simulate the growth of NPA networks to illustrate the behavior of the standard deviation of : independent simulations were carried out for BA networks with the NPA mechanism, and each graph consisted of 160,000 nodes. Then, we calculated the square root of the means of the empirical values of over 1000 realizations. We used the parameter value of and three different values of . The trajectories are shown in Figure 9.
Figure 9.
The dynamics of the standard deviation of node degrees in networks generated by the BA model with nonlinear PA for the node , , with t going up to 160,000 iterations. The networks were generated with and the values of (a), (b), and (c).
In the case of , the standard deviation of , which is equal to , is the same order of magnitude as :
If , then the coefficient of variation is equal to
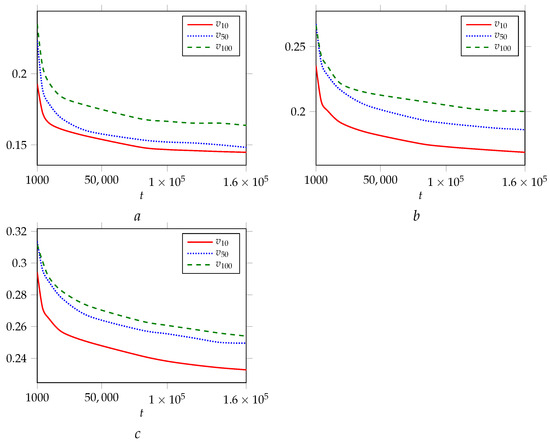
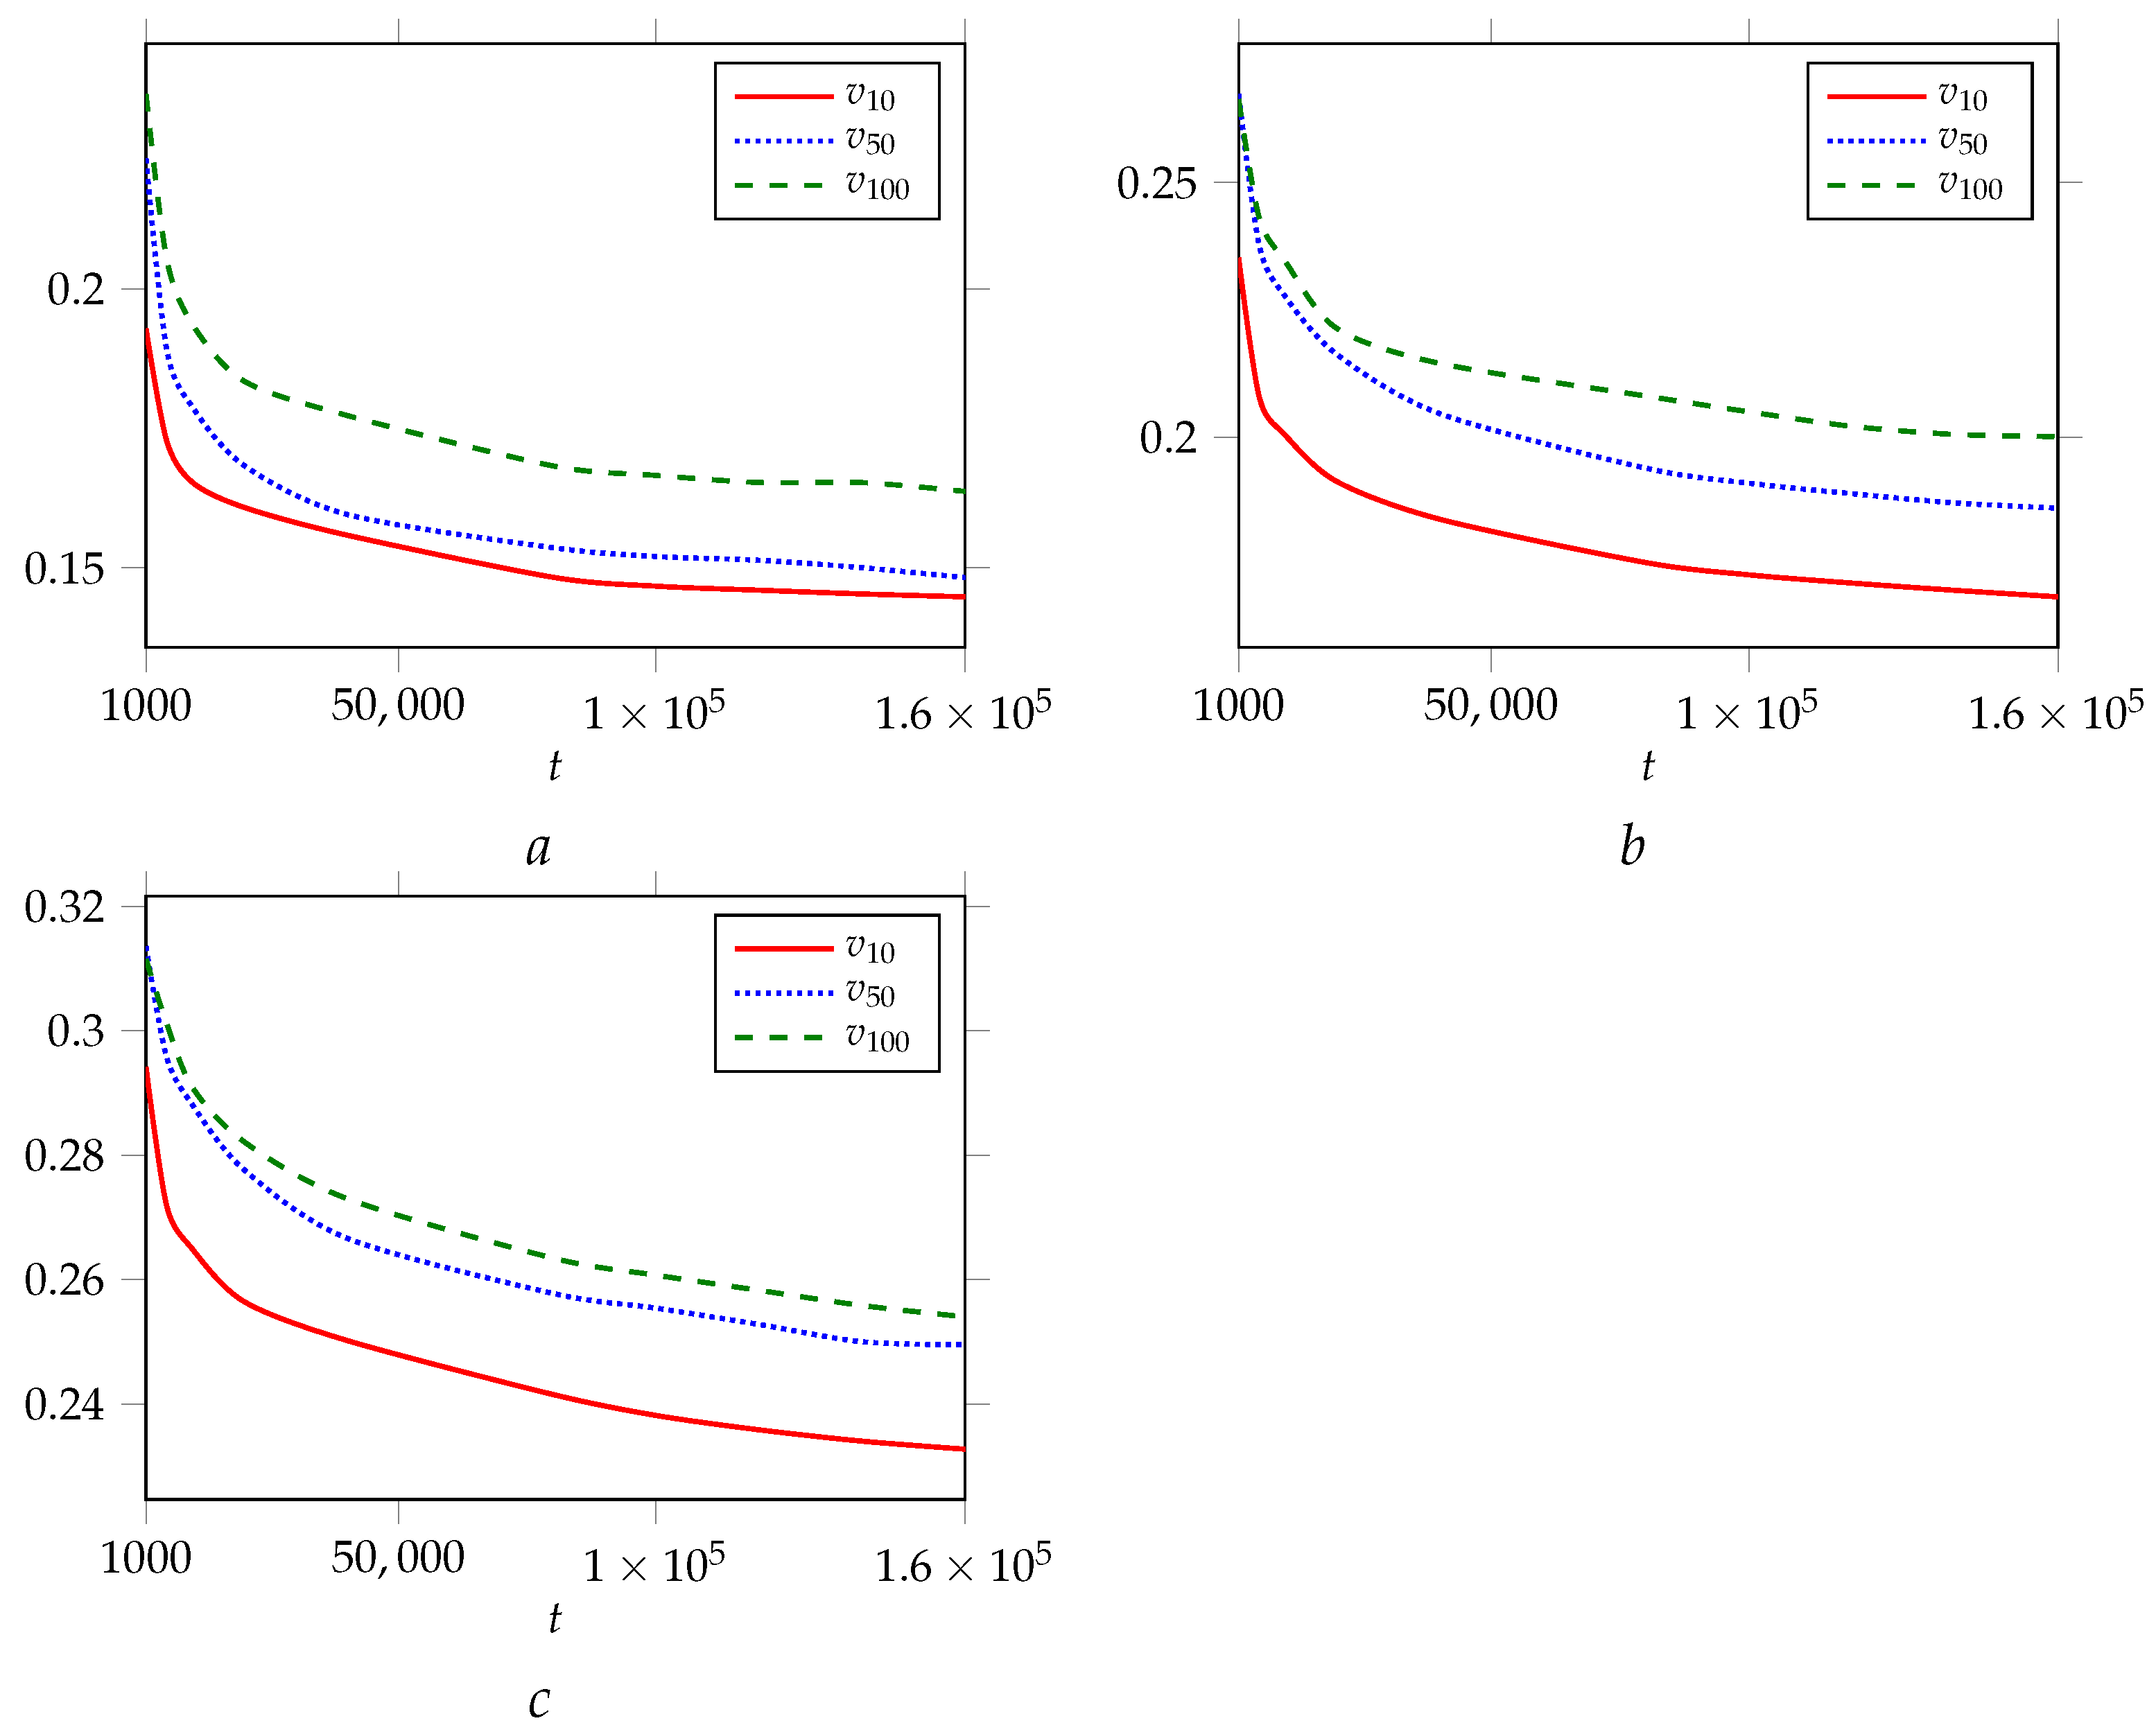
We can conclude that the distribution of is a high-variance one. The trajectories of the empirical values of the variation coefficient in the BA networks with the NPA generation mechanism are shown in Figure 10 for selected nodes of as t was iterated up to 160,000. The network in (a) was modeled with and , that in (b) was modeled with and , and that in (c) was modeled with and . The figures clearly show that the expectations and the standard deviations of are commensurate and the dynamics of their ratio tend to a constant.
Figure 10.
The dynamics of the empirical values of the variation coefficient of the node degrees in networks generated by the BA model with nonlinear PA for the node , , with t going up to 160,000 iterations. The networks were generated with and the values of (a), (b), and (c).
5. The Evolution of : Its Expectation and Variance
In this section, we study the behavior of the random variable , i.e., the sum of the degrees of the neighbors of node at moment t. Here, we find the characterizations of the stochastic process of for BA networks with the NPA mechanism.
5.1. Dynamics of the Total Degree of Node Neighbors in BA Networks with the NPA Mechanism
Theorem 3.
If , then the expectation of asymptotically follows:
where is a constant.
If , then the variance of at moment t is
Proof.
We estimate the change in the value of after one iteration , in which one newly born vertex is added to the network. The analysis in Section 3.2 gives
Then, from (7), (8), and Lemma 2, we get the difference equation:
which corresponds to the differential equation (if we denote as and substitute with ):
Using Lemma 3, we get the solution of (23) in the form of
where is a constant, and we obtain the theorem.
In the case of , the expectation of this random variable was obtained in [30] (for ) and [24] (for arbitrary m):
□
To exhibit the results, we carried out independent repetitions; in each of them, the BA graph was simulated for 160,000 iterations with and three different values of . Then, the empirical values of were obtained. The results are presented in Figure 11, which depicts the trajectories of averaged over 1000 independent simulations. The empirical behavior of followed the prediction of Equation (20).
Figure 11.
Dynamics of the sum of the neighbors’ degrees in BA networks with the NPA generation mechanism for selected nodes , , as t grows to 25,000. The network in (a) was modeled with and , (b) was simulated with and , and (c) was simulated with and .
5.2. The Variance of
Lemma 5.
If , then the second moment of asymptotically follows:
where is a constant.
If , then the second moment of is equal to
Proof.
If we take into account the reasoning in Section 3.2, then the difference between the values of at iterations t and is
If we find the conditional expectation at moment t, then we can get
Using the mean field approach, it can be proved that
where is a constant.
By using Equations (20) and (28), passing to the mathematical expectation of both sides, and making the substitution for convenience, we get the following approximate differential equation:
Then, f asymptotically follows:
where is a constant.
The case of was considered in [23]. Thus, we get the lemma. □
Theorem 4.
If , then the variance of asymptotically follows:
If , then the variance of is
Proof.
Since , the statement is the consequence of Theorem 3 and Lemma 5. □
To exhibit the results, we carried out independent repetitions; in each of them, the BA graph was simulated for 160,000 iterations with and three different values of . Then, the empirical values of were obtained. The results are presented in Figure 12, which depicts the trajectories of the standard deviations of averaged over 1000 independent simulations.
Figure 12.
Trajectories of empirical values for in BA networks with the NPA mechanism for selected nodes as t was iterated up to 160,000. The network in (a) was modeled with and , that in (b) was modeled with and , and that in (c) was modeled with and .
In the case of , the standard deviation of , which is equal to , tends to infinity with the same rate as :
If , then the coefficient of variation tends to a constant as well:
The trajectories of the empirical values of the variation coefficient for in BA networks with the NPA generation mechanism are shown in Figure 13 for selected nodes as t is iterated up to 160,000. The network in (a) was modeled with and , that in (b) was modeled with and , and that in (c) was modeled with and . The figures clearly show that the expectations and the standard deviations of are commensurate and the dynamics of their ratio tend to a constant.
Figure 13.
Trajectories of empirical values for the variation coefficient of in BA networks with the NPA mechanism for selected nodes as t iterates up to 160,000. The network in (a) was modeled with and , that in (b) was modeled with and , and that in (c) was modeled with and .
6. Conclusions and Discussion
In this paper, we investigated the dynamics of some local characteristics in complex social networks over time. At a particular moment of a network’s evolution, every vertex can be characterized by its degree, as well as the total degree of its neighbors, among other attributes. As networks evolve, these qualities are adjusted as new links are attached to a vertex or its neighbors. We analyzed the evolution of these qualities over time in three real social networks. This empirical evidence showed that in real networks, the ratio of the average degree of neighbors to the variance remains at an almost constant value for groups of nodes that appear in sequential iterations.
Then, we studied the presence of this phenomenon in networks generated on the basis of the nonlinear preferential attachment mechanism. We proved that the asymptotics of their expected values and the characteristics of their spread around the mean are of the same magnitude. Therefore, we found out that the mechanism of preferential attachment explains the phenomenon that is seen in real networks.
The obtained conclusions are heuristic for the digital humanities—first of all, for its directions, with a concentration on the mechanisms of popularity of social media content. The algorithms of the most popular mass social networks are not transparent to researchers, although the political and marketing agenda of the last decade has increasingly demonstrated their manageability and controllability. If the principle of distribution of popularity is justified as a mathematical regularity, it becomes possible to “calibrate” an observed situation and demarcate situations of “natural” and “controlled” content popularity.
The second perspective is related to the study of social media agendas, which are usually considered in analogy with media agendas, where the structuring of the content of an agenda is usually interpreted as a competition of expected and extraordinary events and is enhanced by various forms of institutional censorship. These findings are significant for the understanding of the influence of a node’s activity on the popularity of the content that it produces.
The third perspective is related to the study of digital historical memory. In memory studies, the question of if historical knowledge is a background for the media environment, is present in certain quantities in the agenda in any period, or competes with any other content for popularity and is updated when the subject matter of the agenda allows remains unresolved.
Author Contributions
Conceptualization, S.S. and S.M.; methodology, S.S.; software, S.M. and A.G.; validation, S.S., S.M. and A.G.; formal analysis, S.M.; writing—original draft preparation, S.S. and S.M.; writing—review and editing, S.M. and S.T.; visualization, S.M. and A.G.; supervision, S.S.; data preparation, A.G.; discussion, S.T. All authors have read and agreed to the published version of the manuscript.
Funding
This work was supported by the Russian Science Foundation, project 22-18-00153.
Data Availability Statement
Not applicable.
Conflicts of Interest
The authors declare no conflict of interest. The funders had no role in the design of the study; in the collection, analyses, or interpretation of data; in the writing of the manuscript; or in the decision to publish the results.
Abbreviations
The following abbreviations are used in this manuscript:
| BA | Barabási–Albert |
| PA | Preferential attachment |
| NPA | Nonlinear preferential attachment |
References
- Ye, H.; Sun, X.C.; Lu, Z.M.; Jiang, X.; Zhao, K.; Nie, T. Interest Point Detection Using a Composite Index of Complex Networks. J. Inf. Hiding Multimed. Signal Process. 2018, 9, 265–273. [Google Scholar]
- Guo, X.L.; Lu, Z.M. Urban Road Network and Taxi Network Modeling Based on Complex Network Theory. J. Inf. Hiding Multimed. Signal Process. 2016, 7, 558–568. [Google Scholar]
- Chen, X.; Lu, Z.M. Protection on Complex Networks with Geometric and Scale-Free Properties. J. Inf. Hiding Multimed. Signal Process. 2016, 7, 569–575. [Google Scholar]
- Faloutsos, M.; Faloutsos, P.; Faloutsos, C. On Power-Law Relationships of the Internet Topology. SIGCOMM Comput. Commun. Rev. 1999, 29, 251–262. [Google Scholar] [CrossRef] [Scilit]
- Kleinberg, J.M.; Kumar, R.; Raghavan, P.; Rajagopalan, S.; Tomkins, A.S. The Web as a Graph: Measurements, Models, and Methods. In Proceedings of the Computing and Combinatorics; Asano, T., Imai, H., Lee, D.T., Nakano, S.i., Tokuyama, T., Eds.; Springer: Berlin/Heidelberg, Germany, 1999; pp. 1–17. [Google Scholar] [CrossRef] [Scilit]
- Clauset, A.; Shalizi, C.R.; Newman, M.E.J. Power-Law Distributions in Empirical Data. SIAM Rev. 2009, 51, 661–703. [Google Scholar] [CrossRef] [Scilit]
- De Solla Price, D. Networks of scientific papers. Science 1976, 149, 292–306. [Google Scholar]
- Klaus, A.; Yu, S.; Plenz, D. Statistical Analyses Support Power Law Distributions Found in Neuronal Avalanches. PLoS ONE 2011, 6, e19779. [Google Scholar] [CrossRef] [Scilit]
- Newman, M.E.J. The Structure and Function of Complex Networks. SIAM Rev. 2003, 45, 167–256. [Google Scholar] [CrossRef] [Scilit]
- Albert, R.; Barabási, A.L. Statistical mechanics of complex networks. Rev. Mod. Phys. 2002, 74, 47–97. [Google Scholar] [CrossRef] [Scilit]
- Barabási, A.L.; Albert, R. Emergence of Scaling in Random Networks. Science 1999, 286, 509–512. [Google Scholar] [CrossRef] [Scilit]
- Dorogovtsev, S.N.; Mendes, J.F.F.; Samukhin, A.N. Structure of growing networks with preferential linking. Phys. Rev. Lett. 2000, 85, 4633–4636. [Google Scholar] [CrossRef] [Scilit] [PubMed]
- Krapivsky, P.L.; Redner, S. Organization of growing random networks. Phys. Rev. E 2001, 63, 066123. [Google Scholar] [CrossRef] [Scilit]
- Krapivsky, P.L.; Redner, S.; Leyvraz, F. Connectivity of growing random networks. Phys. Rev. Lett. 2000, 85, 4629–4632. [Google Scholar] [CrossRef] [Scilit] [PubMed]
- Sidorov, S.; Mironov, S. Growth network models with random number of attached links. Phys. Stat. Mech. Its Appl. 2021, 576, 126041. [Google Scholar] [CrossRef] [Scilit]
- Tsiotas, D. Detecting differences in the topology of scale-free networks grown under time-dynamic topological fitness. Sci. Rep. 2020, 10, 10630. [Google Scholar] [CrossRef] [Scilit]
- Pal, S.; Makowski, A.M. Asymptotic Degree Distributions in Large (Homogeneous) Random Networks: A Little Theory and a Counterexample. IEEE Trans. Netw. Sci. Eng. 2020, 7, 1531–1544. [Google Scholar] [CrossRef] [Scilit]
- Rak, R.; Rak, E. The fractional preferential attachment scale-free network model. Entropy 2020, 22, 509. [Google Scholar] [CrossRef] [Scilit]
- Cinardi, N.; Rapisarda, A.; Tsallis, C. A generalised model for asymptotically-scale-free geographical networks. J. Stat. Mech. Theory Exp. 2020, 2020, 043404. [Google Scholar] [CrossRef] [Scilit]
- Shang, K.K.; Yang, B.; Moore, J.M.; Ji, Q.; Small, M. Growing networks with communities: A distributive link model. Chaos 2020, 30, 041101. [Google Scholar] [CrossRef] [Scilit]
- Bertotti, M.L.; Modanese, G. The configuration model for Barabasi-Albert networks. Appl. Netw. Sci. 2019, 4, 32. [Google Scholar] [CrossRef] [Scilit]
- Pachon, A.; Sacerdote, L.; Yang, S. Scale-free behavior of networks with the copresence of preferential and uniform attachment rules. Phys. D Nonlinear Phenom. 2018, 371, 1–12. [Google Scholar] [CrossRef] [Scilit]
- Sidorov, S.; Mironov, S.; Agafonova, N.; Kadomtsev, D. Temporal Behavior of Local Characteristics in Complex Networks with Preferential Attachment-Based Growth. Symmetry 2021, 13, 1567. [Google Scholar] [CrossRef] [Scilit]
- Sidorov, S.P.; Mironov, S.V.; Grigoriev, A.A. Friendship paradox in growth networks: Analytical and empirical analysis. Appl. Netw. Sci. 2021, 6, 35. [Google Scholar] [CrossRef] [Scilit]
- Barabási, A.; Albert, R.; Jeong, H. Mean-field theory for scale-free random networks. Phys. A Stat. Mech. Its Appl. 1999, 272, 173–187. [Google Scholar] [CrossRef] [Scilit]
- Kadanoff, L. More is the Same; Phase Transitions and Mean Field Theories. J. Stat. Phys. 2009, 137, 777–797. [Google Scholar] [CrossRef] [Scilit]
- Parr, T.; Sajid, N.; Friston, K.J. Modules or Mean-Fields? Entropy 2020, 22, 552. [Google Scholar] [CrossRef] [Scilit]
- Pachon, A.; Polito, F.; Sacerdote, L. On the continuous-time limit of the Barabási-Albert random graph. Appl. Math. Comput. 2020, 378, 125177. [Google Scholar] [CrossRef] [Scilit]
- Paranjape, A.; Benson, A.R.; Leskovec, J. Motifs in Temporal Networks. In Proceedings of the Tenth ACM International Conference on Web Search and Data Mining, New York, NY, USA, 6–10 February 2017. [Google Scholar] [CrossRef] [Scilit]
- Sidorov, S.; Mironov, S.; Malinskii, I.; Kadomtsev, D. Local Degree Asymmetry for Preferential Attachment Model. Stud. Comput. Intell. 2021, 944, 450–461. [Google Scholar] [CrossRef] [Scilit]
- Sidorov, S.; Mironov, S.; Tyshkevich, S. Surprising Behavior of the Average Degree for a Node’s Neighbors in Growth Networks. In Proceedings of the Complex Networks & Their Applications X; Benito, R.M., Cherifi, C., Cherifi, H., Moro, E., Rocha, L.M., Sales-Pardo, M., Eds.; Springer: Cham, Switzerland, 2022; pp. 463–474. [Google Scholar]

Publisher’s Note: MDPI stays neutral with regard to jurisdictional claims in published maps and institutional affiliations. |
© 2022 by the authors. Licensee MDPI, Basel, Switzerland. This article is an open access article distributed under the terms and conditions of the Creative Commons Attribution (CC BY) license (https://creativecommons.org/licenses/by/4.0/).