


Simple Summary
Modern medicine increasingly analyzes thousands of small chemicals in the human body to detect diseases. However, making sense of this massive data using standard artificial intelligence often feels like using a “black box,” where computers provide medical predictions without explaining their reasoning. This review explores a new approach called interpretable machine learning, which forces computers to show their work. We discuss how these transparent computers models help scientists confidently identify specific chemical warning signs for complex illnesses, such as cancer and brain disorders. Furthermore, these transparent tools help researchers understand the actual biological causes of diseases and prevent biased medical results based on a patient’s age or gender. Ultimately, by bridging the gap between computer predictions and human understanding, transparent artificial intelligence will help doctors diagnose diseases earlier, discover safer drugs, and provide truly personalized healthcare for everyone.
Abstract
While metabolomics captures the dynamic chemical landscape of biological systems, its inherent high dimensionality and complexity pose significant analytical hurdles. Interpretable Machine Learning (IML) is revolutionizing the field by moving beyond traditional feature selection to extract biologically meaningful insights alongside robust predictions. This review systematically examines IML’s application in metabolomic biomarker discovery. We highlight how interpretation frameworks decode the key metabolites driving model decisions, transforming opaque “black-box” algorithms into testable mechanistic hypotheses. By evaluating cutting-edge studies across various pathologies, we illustrate IML’s pivotal role in disease subtyping, early diagnosis, treatment prediction, and mitigating demographic disparities. Although challenges in data generalizability persist, IML remains an indispensable bridge between computational prediction and biological understanding, ultimately advancing precision medicine.
1. Introduction
Metabolomics represents the functional endpoint of the omics cascade and is pivotal for biomarker discovery [1]. However, clinical translation is impeded by the inherent high dimensionality (n ≪ p) of metabolomic datasets [2]. Conventional linear models, such as PCA and PLS-DA, frequently fail to capture complex non-linear biological interactions [3,4]. Furthermore, standard feature selection often prioritizes correlated surrogates over causal drivers [5]. Consequently, this reliance on correlation yields spurious biomarkers lacking mechanistic plausibility, thereby compromising reproducibility and external validation [5,6].
To address these complexity challenges, Machine Learning (ML) algorithms—such as Random Forests (RF), Support Vector Machines (SVM), and Deep Learning (DL)—have been increasingly adopted for their superior predictive performance and ability to model non-linear metabolic landscapes [7,8]. Despite their high accuracy, complex ML models often operate as “black boxes”, where the internal logic driving predictions remains opaque [6]. In the biomedical domain, a “black box” is problematic; clinicians and biologists require not only an accurate prediction (e.g., disease diagnosis) but also an understanding of why a specific decision was made [6,9]. The lack of transparency hinders the discovery of underlying biological mechanisms and raises concerns regarding trust and safety in clinical decision-support systems [10]. Consequently, there is an urgent need to shift from purely predictive modeling to explainable frameworks that bridge the gap between computational power and biological interpretation [11].
IML has emerged as a pivotal framework to resolve this “accuracy–interpretability” dilemma [12]. IML methodologies generally fall into two paradigms: intrinsically interpretable models (e.g., linear regression, decision trees) and post hoc explanation methods [6]. While intrinsically interpretable models offer transparency by design, their structural simplicity often restricts their capacity to capture the stochastic and highly non-linear interactions characteristic of metabolic networks, thereby limiting predictive sensitivity. Consequently, post hoc model-agnostic methods have gained prominence as a superior strategy for metabolomics; they retain the predictive supremacy of “black-box” architectures while retroactively extracting transparent insights [12]. Crucially, moving beyond traditional feature selection that merely outputs a static ranking of variable importance (e.g., VIP scores), these post hoc techniques—exemplified by SHapley Additive exPlanations (SHAP)—provide granular, multidimensional biological insights. They enable the quantification of directionality (positive vs. negative impact), the visualization of non-linear dose–response relationships, and the identification of synergistic interactions between metabolic pathways [13]. Furthermore, by offering local interpretability, explaining predictions for individual samples, these methods facilitate the transition from population-level biomarker lists to patient-specific mechanisms required for precision medicine [11], an objective that, in the current scenario, is most effectively achieved through the integration of federated learning frameworks.
To clarify the computational inputs, metabolomic features vary by analytical approach. Targeted metabolomics typically utilizes quantified concentrations of known metabolites (e.g., amino acids or lipids). Conversely, untargeted metabolomics yields a vastly higher-dimensional feature space of instrumental variables, such as peak intensities, mass-to-charge ratios (m/z), and retention times (RT) in Mass Spectrometry (MS), or chemical shifts (ppm) in NMR. Finally, these features are frequently concatenated with clinical metadata (e.g., age, BMI) to form the complete feature matrix for IML training.
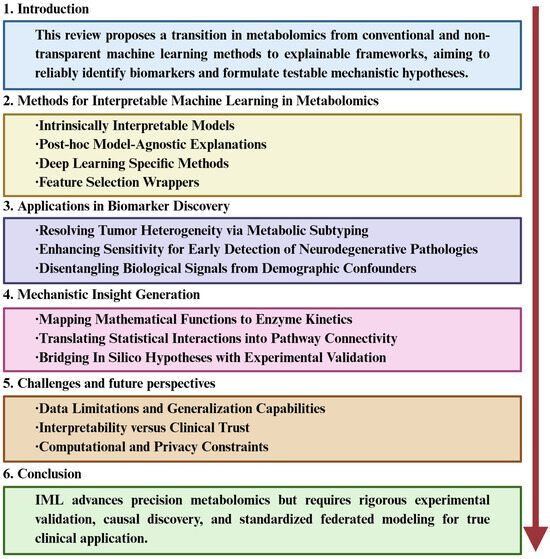
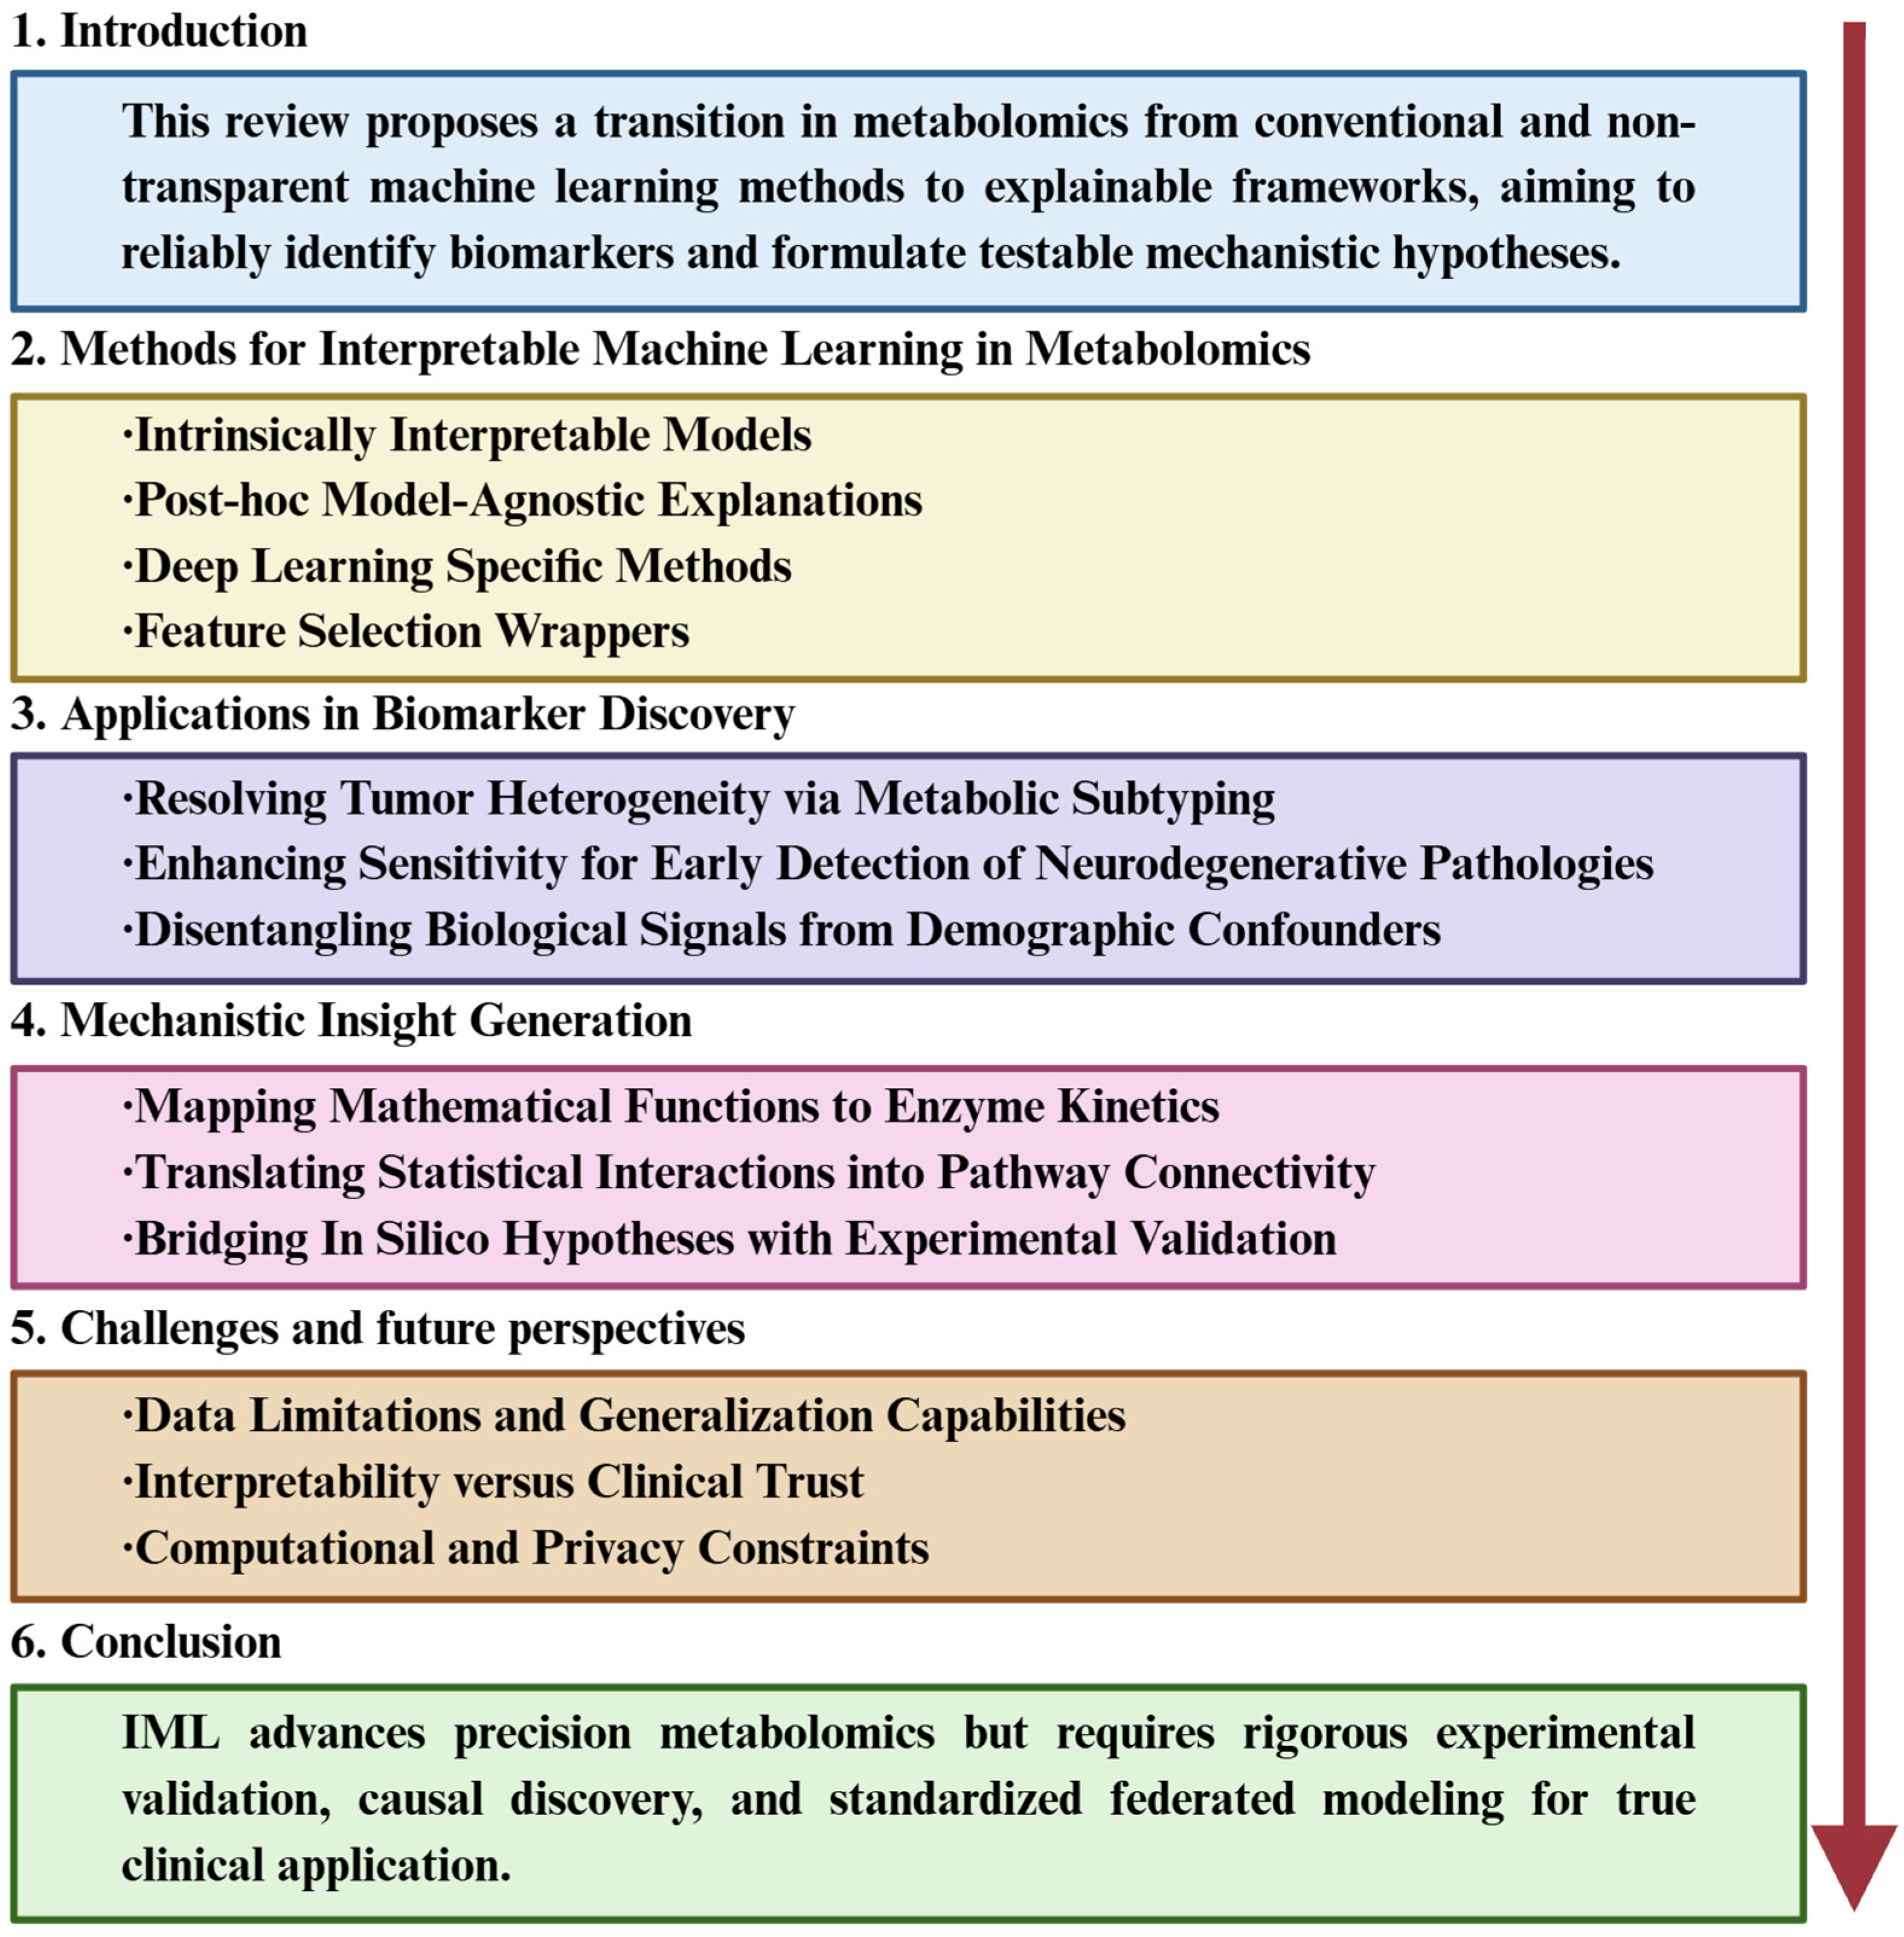
The primary objective of this review is to systematically examine the application of IML in metabolomics, advocating for a paradigm shift “beyond feature selection”. We aim to demonstrate how IML tools can be leveraged to not only identify robust biomarkers but also generate testable mechanistic hypotheses. The organizational framework of this review is presented in Figure 1. The remainder of this article is organized as follows: Section 2 details key IML methodologies for metabolomic data; Section 3 reviews cutting-edge applications in disease contexts, including tumor subtyping, early neurodegenerative detection, and confounder disentanglement; Section 4 discusses mechanistic insight generation from model explanations; and finally, Section 5 and Section 6 address current challenges and future directions for integrating IML into causal, multi-omics-driven precision medicine workflows.
Figure 1.
An overview of the organizational framework of this review. This framework first introduces the shift from conventional to explainable machine learning in metabolomics, outlines key interpretable methods, and details their applications in biomarker discovery and mechanistic insight generation. It then discusses current challenges and future directions, concluding with the role of IML in advancing transparent, clinically relevant research.
2. Methods for Interpretable Machine Learning in Metabolomics
The inherent complexity and high dimensionality of metabolomics data necessitate analytical approaches that offer transparency alongside predictive accuracy [1,2]. IML provides a diverse toolkit to address this challenge, ranging from models with intrinsic transparency to post hoc techniques that elucidate opaque “black-box” algorithms [14,15]. This section categorizes these methodologies into four distinct classes: intrinsically interpretable models, post hoc model-agnostic explanations, specialized methods for deep learning, and feature selection wrappers [4,15,16].
2.1. Intrinsically Interpretable Models
Intrinsically interpretable models, characterized by parsimonious architectures where internal parameters directly quantify feature importance, remain the foundational tools of metabolomic analysis [14]. Partial Least Squares-Discriminant Analysis (PLS-DA) is widely considered the gold standard [3], employing Variable Importance in Projection (VIP) scores to identify discriminatory biomarkers; however, it is limited by linearity assumptions and a propensity for overfitting if not rigorously validated [1]. Similarly, regularized regression offers direct interpretability via coefficients (β), with Elastic Net (L1 + L2) often outperforming Lasso (L1) in metabolomics due to its superior handling of high multicollinearity [17,18]. Regarding non-linear approaches, single decision trees provide intuitive visualizations of decision paths via Gini impurity reduction, though they typically suffer from instability and lower predictive accuracy compared to ensemble methods [19]. Finally, Generalized Additive Models (GAMs) extend linear frameworks to capture complex biological patterns—such as U-shaped dose–response curves—through shape functions without compromising additive interpretability [20,21].
2.2. Post Hoc Model-Agnostic Explanations
To interpret complex “black-box” algorithms such as Random Forests, XGBoost, and SVMs, post hoc model-agnostic methods have become the standard in modern IML [15]. Among these, SHAP (SHapley Additive exPlanations) represents the state-of-the-art framework. Grounded in cooperative game theory, SHAP treats biological features as “players” in a coalition to fairly distribute the “payout” (the model’s prediction). By computing the average marginal contribution of a metabolite across all possible feature combinations, SHAP guarantees mathematical consistency and offers versatile insights—aggregating local SHAP values yields global importance rankings, while dependence plots reveal non-linear interactions between metabolites [11,20]. For local interpretability, LIME (Local Interpretable Model-agnostic Explanations) operates on the premise of local linearity. It approximates the decision boundary of a complex model by generating a synthetic dataset via random perturbation of a specific sample’s features. A simple, interpretable surrogate model (e.g., weighted linear regression) is then trained on this perturbed data to explain the individual prediction, although this reliance on random sampling can lead to instability in explanation consistency [6].
Beyond specific attribution frameworks, evaluating global feature behavior is critical. Permutation Feature Importance (PFI) provides a model-independent metric by measuring the degradation in predictive performance (e.g., accuracy or R2) after randomly shuffling the values of a single feature. While computationally efficient, PFI is susceptible to bias in metabolomics datasets characterized by high multicollinearity, as shuffling can create biologically impossible feature combinations [2]. Consequently, for visualizing marginal effects, Accumulated Local Effects (ALE) plots are often preferred over Partial Dependence Plots (PDP). Unlike PDPs, which assume feature independence, ALE calculates changes in prediction based on the conditional distribution of features, thereby robustly accounting for the confounding influence of co-regulated metabolic clusters [21].
2.3. Deep Learning Specific Methods
The integration of deep learning architectures—including DNNs, CNNs, and LSTMs—into metabolomics necessitates specialized attribution methods relying on gradients or backpropagation [22]. Layer-wise Relevance Propagation (LRP) facilitates this by retro-propagating relevance scores to identify key input features, such as specific spectral peaks [23]. Concurrently, Integrated Gradients (IG) mitigates the issue of gradient saturation by accumulating gradients relative to a baseline; this approach satisfies the axiom of completeness, thereby offering superior reliability compared to simple saliency maps [15,24]. Furthermore, for advanced architectures like Transformers and Graph Neural Networks (GNNs), attention mechanisms provide intrinsic interpretability by explicitly quantifying the weight assigned to specific metabolites or pathway nodes during the decision-making process [25,26].
2.4. Feature Selection Wrappers
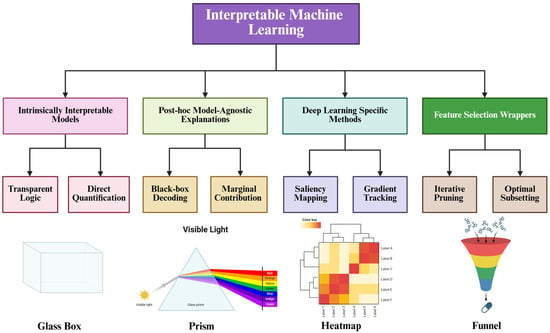
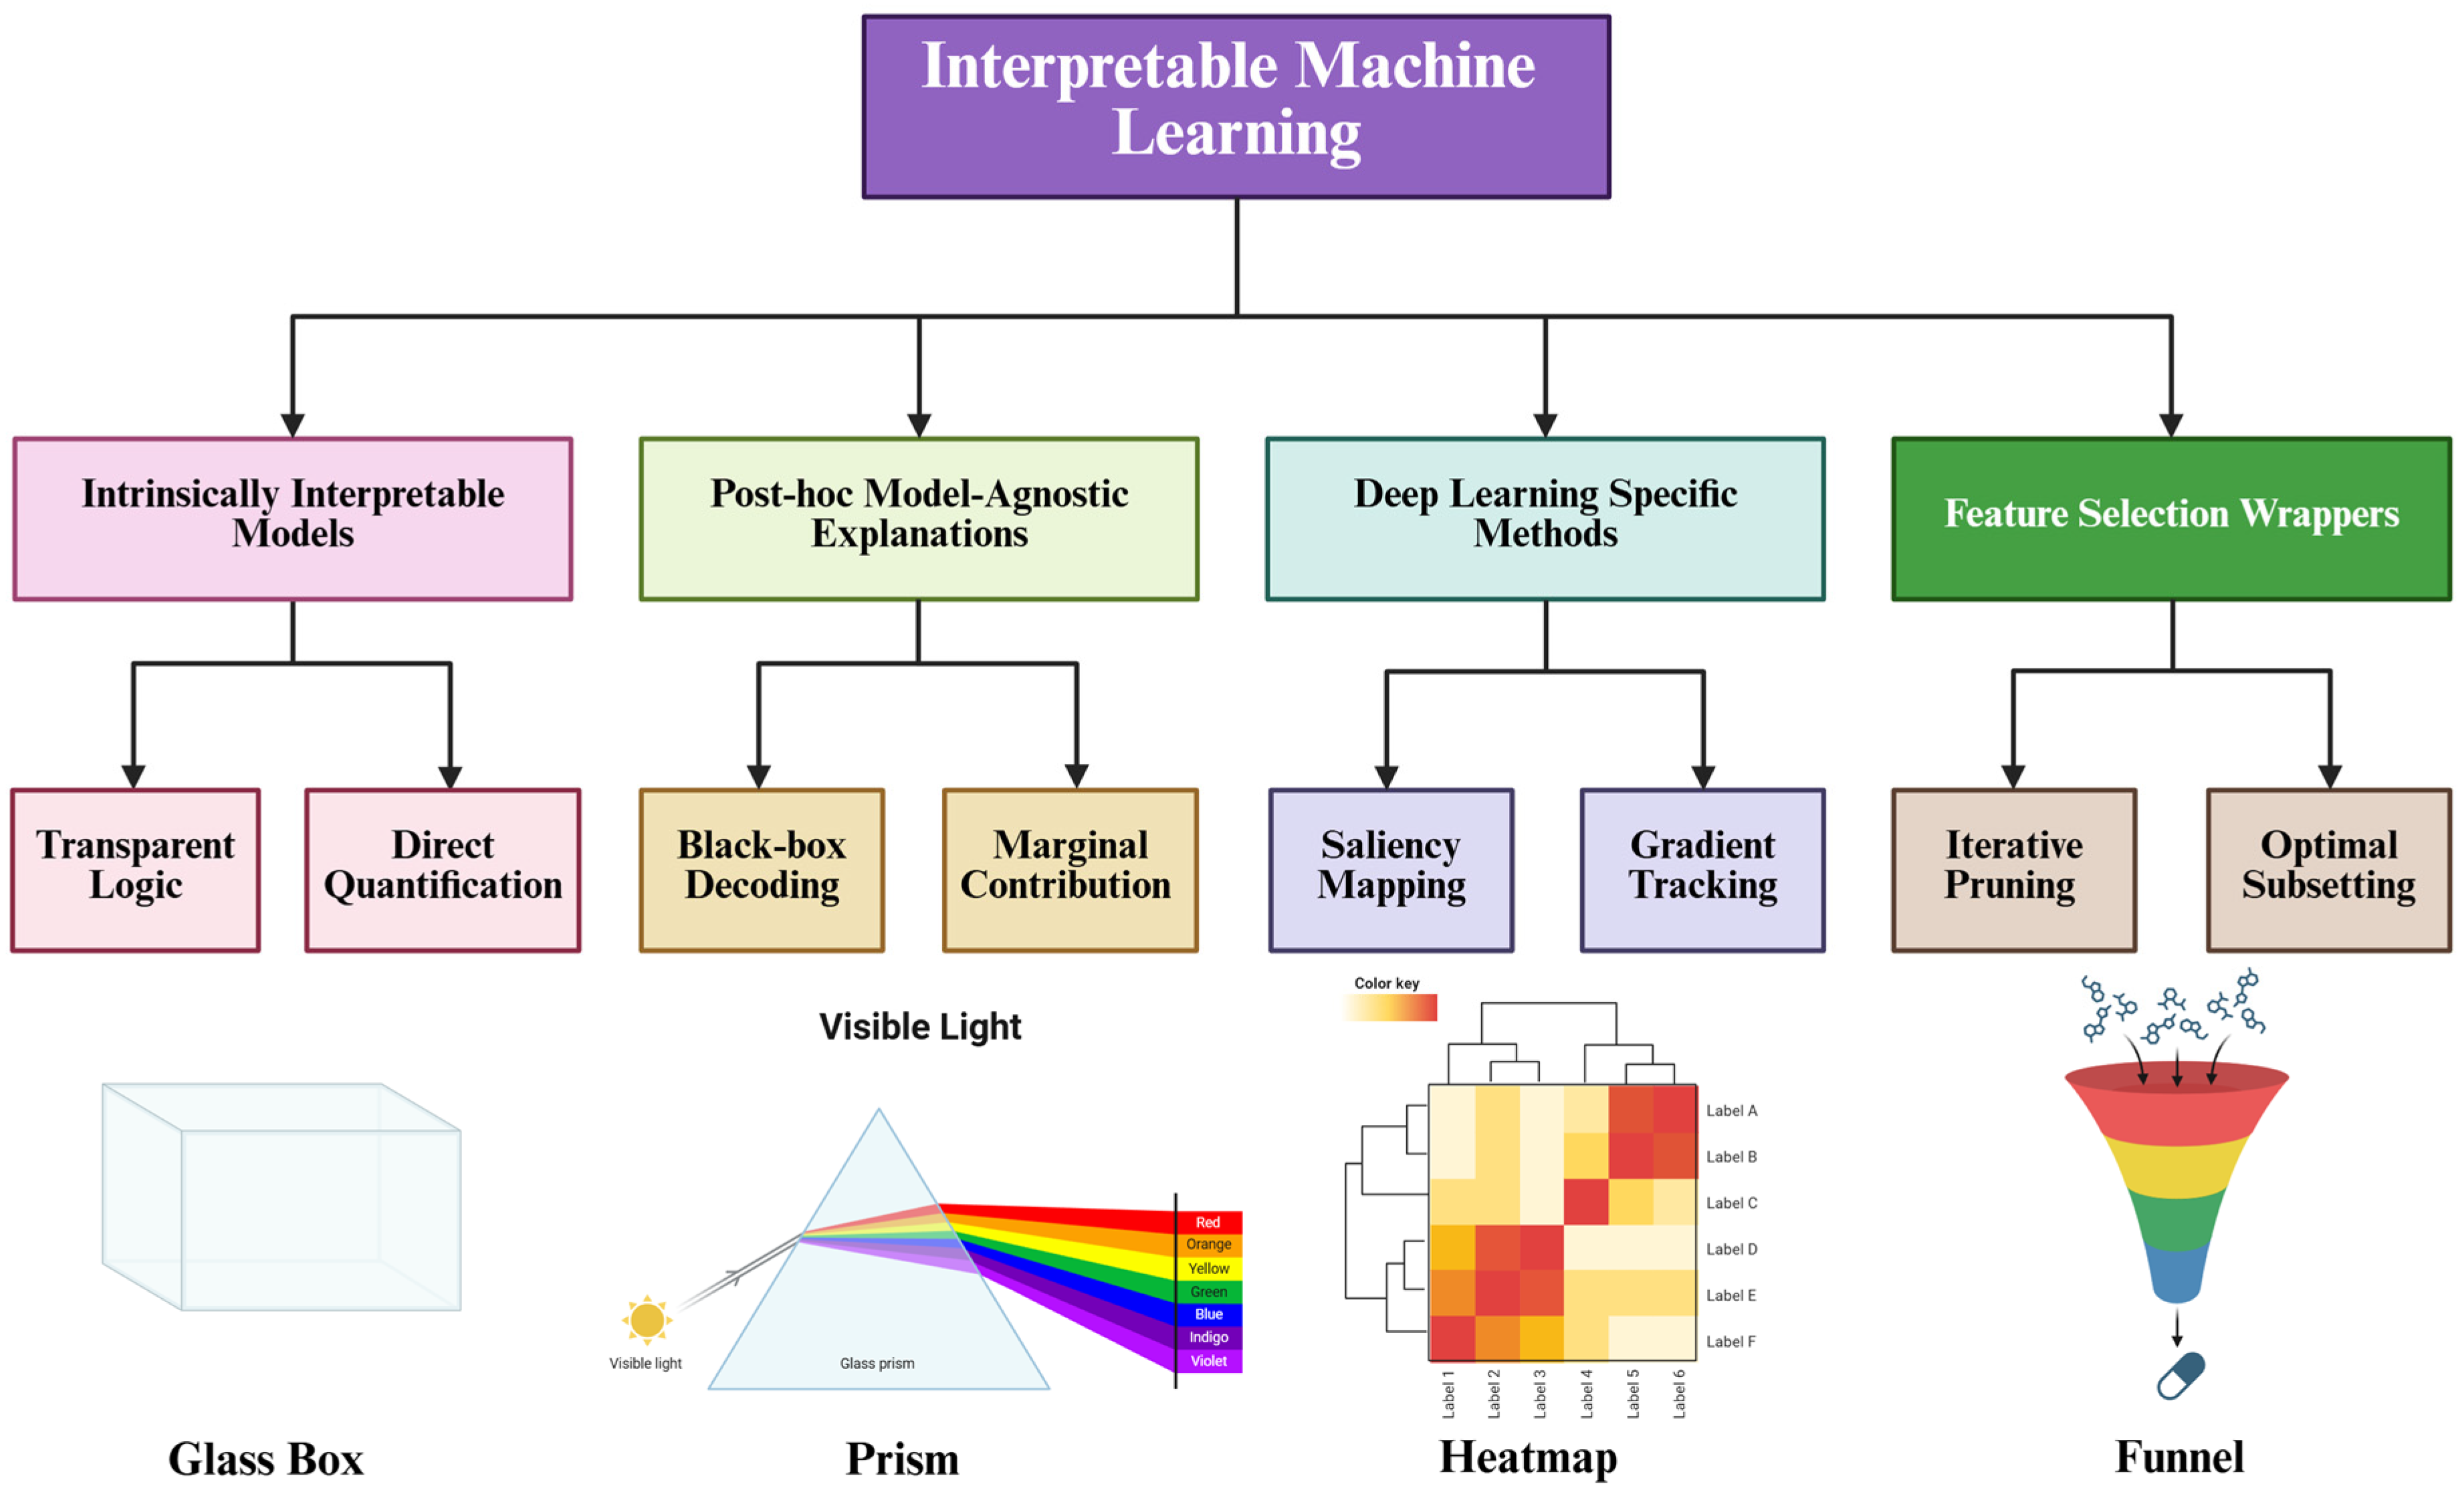
Distinct from explanatory frameworks, wrapper methods are critical for identifying robust biomarker signatures through the rigorous evaluation of feature subsets. The Boruta algorithm, utilizing a Random Forest architecture, functions as an “all-relevant” feature selection method by comparing original features against randomized “shadow features” [27]. This approach is particularly valuable in metabolomics for preserving redundant yet biologically significant metabolites, such as co-regulated pathway members, thus facilitating comprehensive pathway analysis [28]. Conversely, Recursive Feature Elimination (RFE) employs an iterative process to prune the least informative features based on model weights. By isolating a “minimal-optimal” subset, RFE is ideally suited for developing clinical diagnostic panels where maximizing predictive performance with a concise biomarker panel is paramount [4,29]. Figure 2 illustrates the taxonomy and conceptual mechanisms of IML methods in metabolomics. Table 1 presents a comparison of interpretable machine learning methods in metabolomics.
Figure 2.
Taxonomy and conceptual mechanisms of IML methods in metabolomics. The upper panel illustrates a hierarchical classification of IML methodologies, categorizing them into four distinct classes: intrinsically interpretable models, post hoc model-agnostic explanations, deep learning-specific methods, and feature selection wrappers. The lower panel employs visual metaphors to elucidate the core operating principles of each category: (1) Glass Box: Represents intrinsically interpretable models, symbolizing architectures where the internal decision logic is fully transparent and parameters (e.g., coefficients) are directly accessible. (2) Prism: Symbolizes post hoc model-agnostic explanations (e.g., SHAP), which act to decompose a complex “black-box” prediction (white light) into individual marginal feature contributions (spectral colors). (3) Heatmap: Depicts deep learning-specific methods, utilizing gradient-based saliency or attention mechanisms to visualize relevant input features as “hotspots” within the network. (4) Funnel: Illustrates feature selection wrappers, visualizing the iterative filtration process that distills a large set of noisy metabolites into a concise, minimal-optimal biomarker subset.
Table 1.
Comparison of interpretable machine learning methods in metabolomics.
3. Applications in Biomarker Discovery
In this section, we examine how IML bridges the gap between predictive opacity and clinical translation by transforming black-box outputs into biological hypotheses [14,46]. Specifically, we review its applications in elucidating metabolic heterogeneity for disease subtyping, enhancing sensitivity in early neurodegenerative detection, and disentangling biological signals from demographic confounders to ensure robust diagnostics [47].
3.1. Resolving Tumor Heterogeneity via Metabolic Subtyping
Cancer is not a monolithic disease but a heterogeneous spectrum of molecular pathologies [48]. Yet, conventional biomarker discovery often relies on reductionist case–control designs that treat populations as homogenous, masking critical subgroup-specific variations [49]. For instance, although the “Warburg effect” is a hallmark, metabolic reprogramming is highly context-dependent [50]; distinct subtypes may preferentially utilize glutaminolysis, fatty acid oxidation, or de novo lipid synthesis depending on oncogenic drivers (e.g., MYC vs. KRAS) and the microenvironment [51]. Consequently, failing to resolve this heterogeneity yields non-specific biomarkers, hindering personalized therapy and contributing to high clinical trial failure rates [52].
IML frameworks facilitate the transition from binary classification to sophisticated metabolic subtyping by elucidating the distinct feature dependencies that drive cluster formation [53]. Unlike traditional unsupervised clustering methods that rely solely on mathematical distance, IML-guided approaches—such as SHAP-enhanced clustering—explicitly identify the specific metabolic drivers characterizing each subtype [54]. To illustrate, XGBoost models coupled with SHAP analysis mechanistically differentiate breast cancer subtypes by visualizing lipid specificities. Rather than merely associating elevated phosphatidylcholines (PCs) with malignancy, SHAP summary plots explicitly reveal that PCs with longer acyl-chains and higher polyunsaturation yield high positive SHAP values, strongly driving the model output toward a Triple-Negative Breast Cancer (TNBC) prediction [55,56]. Conversely, shorter, saturated PCs exhibit negative SHAP values, favoring Luminal A diagnoses. This deep feature-level resolution clearly proves IML decodes complex lipidomic heterogeneity far beyond the limited capabilities of standard receptor status evaluations [48,56].
Crucially, IML facilitates the identification of context-specific biomarkers via interaction analysis, thereby capturing features—such as succinate in SDH-deficient tumors—that standard linear models frequently discard due to low global significance [56,57]. By utilizing algorithms like TreeExplainer to compute SHAP interaction values, researchers can quantify non-linear dependencies where the contribution of one metabolic feature is contingent upon another [11]. This approach enables the progression from single-marker hypotheses to “multi-hit” models; for instance, in colorectal cancer, IML has revealed that the predictive efficacy of plasma amino acids is modulated by the gut microbiome profile [58]. Ultimately, identifying these high-interaction pairs facilitates the construction of dynamic network models that reflect the plasticity of tumor metabolism, guiding the development of subtype-specific inhibitors that target specific vulnerabilities within the metabolic machinery [59].
3.2. Enhancing Sensitivity for Early Detection of Neurodegenerative Pathologies
Early detection of Alzheimer’s disease (AD) and Mild Cognitive Impairment (MCI) remains a formidable challenge in clinical metabolomics [60]. Peripheral metabolic signals in early neurodegeneration are typically subtle, non-linear, and obscured by homeostasis and the blood–brain barrier [61,62]. Conventional linear models, such as PLS-DA, often lack the sensitivity to distinguish these attenuated signals from biological noise [60]. As prodromal pathology involves complex network dysregulation rather than simple linear separation, these traditional methods frequently suffer from high false-negative rates, delaying diagnosis until irreversible neuronal damage occurs [60,63].
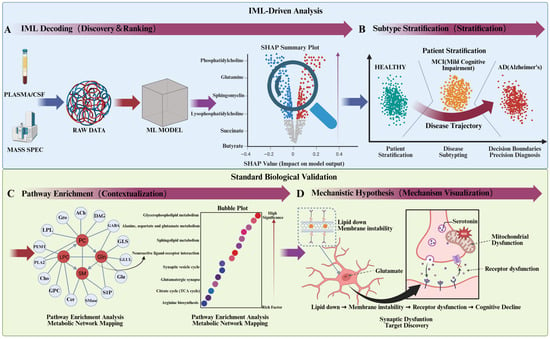
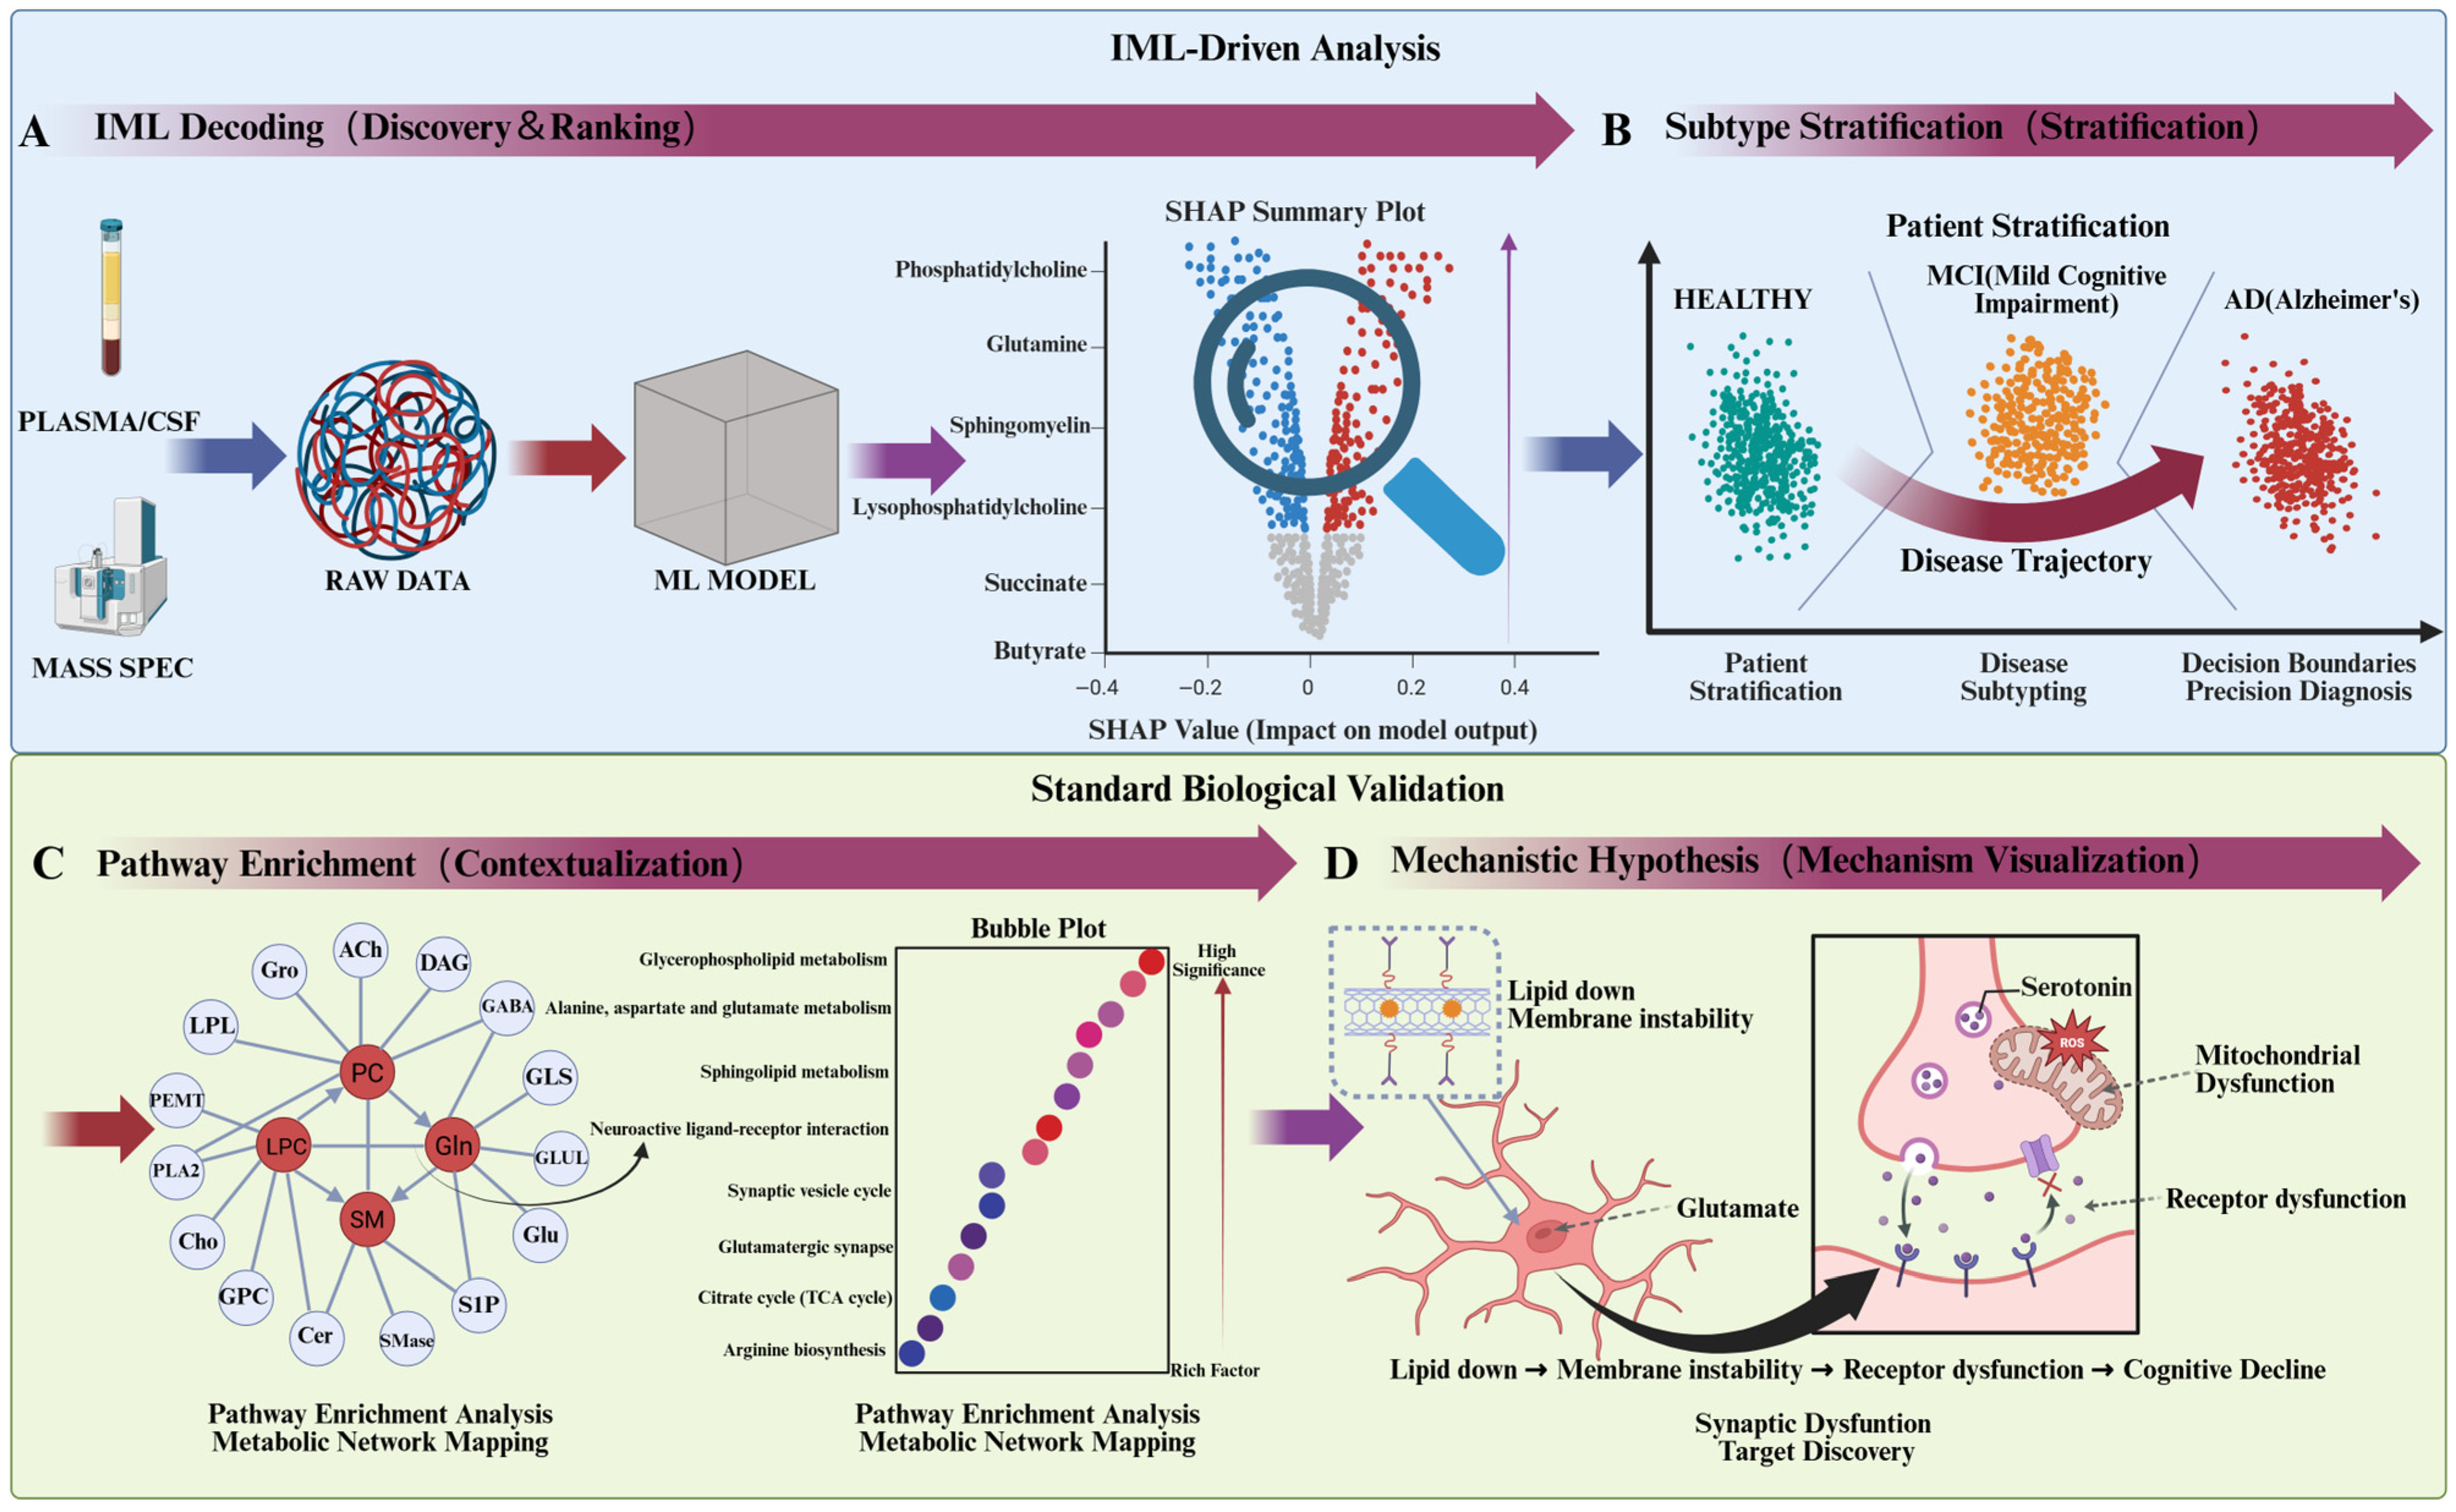
IML empowers the detection of subtle metabolic signatures by modeling complex, non-linear interactions that elude conventional linear methods. While algorithms such as Random Forests, Support Vector Machines, and Deep Neural Networks exhibit superior capacity for handling high-dimensional metabolomic data, their utility in Alzheimer’s research is contingent upon interpretability. Advanced attribution techniques, such as Layer-wise Relevance Propagation (LRP) and Integrated Gradients, address this by projecting model decision logic back onto the input metabolome, thereby highlighting specific drivers of MCI such as kynurenine pathway alterations, distinct bile acid profiles, or lipid peroxidation products [61]. For instance, deep learning models can identify non-linear ratios between phosphatidylcholines (PC) and lysophosphatidylcholines (LPC) [63]; whereas univariate statistics often fail to detect differences in these lipids individually, IML reveals that their discordance is a key predictor of membrane instability in early neurodegeneration [63,64]. Ultimately, by defining such “combinatorial biomarkers,” IML provides a roadmap for targeted assays that prioritize pathway dysregulation over static metabolite abundance [65,66]. A comprehensive illustration of this IML-driven framework, demonstrating the progression from identifying raw metabolic signatures to generating testable mechanistic insights for Alzheimer’s disease, is presented in Figure 3.
Figure 3.
Integrated IML and biological validation workflow for biomarker discovery in Alzheimer’s disease (AD). (A) IML Decoding: High-dimensional plasma/CSF metabolomic data are processed via machine learning. Post hoc SHAP analysis prioritizes top biological drivers (e.g., PC, Gln, SM, LPC) based on their impact on model output. (B) Subtype Stratification: Utilizing these metabolic signatures, the model stratifies subjects into Healthy, Mild Cognitive Impairment (MCI), and AD clusters, defining precise diagnostic boundaries and continuous disease trajectories. (C) Pathway Enrichment: Key metabolites are mapped into an interaction network (left) revealing enzymatic relationships (e.g., PLA2, GLUL). A corresponding bubble plot (right) highlights significantly dysregulated pathways, prominently including glycerophospholipid/sphingolipid metabolism and glutamate signaling. (D) Mechanistic Hypothesis: IML insights are translated into a synaptic-level mechanism, linking metabolic alterations (e.g., lipid depletion) to downstream pathologies like mitochondrial ROS accumulation, altered neurotransmitter dynamics, and receptor dysfunction, ultimately precipitating cognitive decline.
Beyond identifying correlations, IML is instrumental in validating the mechanistic plausibility of peripheral biomarkers for central nervous system disorders [20], notably within gut–brain axis research linking microbiota-derived metabolites—such as short-chain fatty acids—to AD cognitive scores [67,68]. By utilizing SHAP dependence plots, researchers can delineate precise, non-linear concentration-risk profiles [41]; unlike linear correlation coefficients, these visualizations reveal complex threshold effects and biphasic (U-shaped) curves, indicating where metabolites transition from protective to deleterious levels [43]. This granularity is essential for distinguishing secondary compensatory responses from primary pathological drivers [69,70]. Consequently, by visualizing these decision boundaries, IML confirms the biological validity of identified biomarkers, facilitating the development of sensitive, mechanistically grounded blood-based screening tools [20,63].
3.3. Disentangling Biological Signals from Demographic Confounders
A pervasive challenge in biomarker discovery is the influence of confounding variables, as the human metabolome is acutely sensitive to non-disease phenotypic factors, including age, biological sex, BMI, and ethnicity [71]. In many datasets, putative disease biomarkers function merely as proxies for these demographic variances [72], precipitating the “Right for the Wrong Reasons” phenomenon [73]. For instance, algorithmic training on demographically unbalanced cohorts may result in models that predict age or ancestral background rather than pathological mechanisms [73,74]. Ultimately, this yields biomarkers that lack generalizability across diverse populations, thereby exacerbating health disparities and compromising diagnostic efficacy for underrepresented groups [75,76].
IML provides sophisticated frameworks to disentangle confounding effects and isolate genuine disease-associated signals. Visualization techniques, such as SHAP Dependence Plots and Accumulated Local Effects (ALE), facilitate the assessment of metabolite-outcome relationships while strictly controlling for covariates. This approach is particularly vital for mitigating racial disparities; by quantifying interaction effects between demographic variables and metabolite abundance, IML validates biomarker robustness across diverse ethnic groups [47]. Crucially, identifying features where predictive value relies on ancestral background—manifested as divergent risk function slopes in SHAP interaction analyses—allows researchers to detect and mitigate potential population specificity or algorithmic bias [11,47].
To systematically address these disparities, stratified interpretability analyses—such as Cohort-SHAP—can be employed to calculate feature importance across specific demographic strata [11,77]. This approach facilitates the identification of “invariant biomarkers” that maintain consistent predictive contributions regardless of race or gender, thereby isolating core biological pathologies [77], while simultaneously quantifying baseline shifts to inform population-adjusted clinical reference ranges [11]. Furthermore, while adversarial de-biasing strategies prevent models from predicting protected attributes [78,79], IML is not a permanent solution. A more attractive approach is federated modeling, which advances “Precision Health Equity” [78] by collaboratively training diagnostic algorithms across decentralized, diverse cohorts to permanently prevent the clinical deployment of biased AI tools. To illustrate the translational impact of these methodologies, Table 2 summarizes how diverse IML architectures extract disease-specific signatures, transcending traditional statistical limitations. These examples highlight how techniques like SHAP distill complex biological interactions into concise, cost-effective diagnostic panels, moving beyond static lists to elucidate phenomena like non-linear neuroinflammation responses and metabolic subtyping in oncology.
Table 2.
Selected case studies demonstrating IML-driven insights in metabolomic biomarker discovery.
4. Mechanistic Insight Generation
Moving beyond the identification of diagnostic markers, the ultimate goal of metabolomics is to decode the etiology of disease. Although conventional feature selection identifies predictive metabolites, it fails to elucidate underlying biological interactions, necessitating a shift from static scalar metrics to the granular characterization of phenotypic trajectories [4,15]. IML frameworks address this limitation by employing sophisticated visualization tools—including Partial Dependence Plots, Accumulated Local Effects, and SHAP dependence plots—to reconstruct complex, non-linear metabolic topographies [11]. By delineating critical biological phenomena such as saturation points and hormetic responses that elude linear models, these techniques transform abstract algorithmic outputs into testable biochemical hypotheses, thereby elevating metabolomics from a descriptive task to a mechanistically driven discipline [22].
4.1. Mapping Mathematical Functions to Enzyme Kinetics
The inherent non-linearity of biological systems imposes severe constraints on traditional statistical methods, such as t-tests and logistic regression, which rely on assumptions of unbounded monotonicity [4]. Fundamentally, biological networks ensure metabolic flux is governed by enzymatic saturation, allosteric regulation, and feedback inhibition, resulting in complex, non-linear dose–response curves [48]. IML frameworks transcend these limitations by uncovering these dynamics without prior assumptions, mapping mathematical topographies directly to biological phenomena. Specifically, a frequent non-linear pattern elucidated by IML is the “saturation curve,” where metabolite risk contributions plateau beyond a specific threshold, mirroring Michaelis–Menten kinetics [87]. Crucially, data-driven IML architectures autonomously identify such biological “ceiling effects,” explicitly modeling the saturation of SGLT2 transporters in diabetes, where disease risk reliably stabilizes once precise physiological limits are breached [50,88]. Identifying these Vmax plateaus is critical for distinguishing rate-limiting steps from linear metabolic phases, thereby guiding targeted therapeutic strategies and generating hypotheses validatable through flux balance analysis [87,89].
Beyond saturation, linear models frequently fail to capture homeostasis, specifically the biphasic “Goldilocks effect” where metabolites exert protective functions within physiological ranges but become deleterious at extremes [90]. IML frameworks surmount this by revealing non-linear U-shaped relationships via SHAP dependence plots, where protective troughs are flanked by pathological deviations representing deficiency or toxicity. By mapping these inflection points, researchers can quantify precise homeostatic boundaries, such as those distinguishing malnutrition from lipotoxicity [91], thereby defining outcome-based reference intervals critical for characterizing diseases of metabolic dysregulation [11,92]. Closely related to homeostasis is hormesis, a biphasic dose–response phenomenon effectively elucidated by visualization tools like ALE plots [93,94].
These tools can distinguish protective Nrf2 pathway activation at low xenobiotic concentrations from cytotoxicity at high levels. Furthermore, IML detects biological “tipping points”—step-function discontinuities corresponding to phase transitions like mitochondrial collapse or inflammasome activation [95]. By pinpointing these thresholds, researchers can generate precise hypotheses regarding regulatory breakpoints to guide targeted experimental validation [95,96].
4.2. Translating Statistical Interactions into Pathway Connectivity
In contrast to the reductionist framework treating metabolites as orthogonal entities, biological systems are intrinsically interconnected, where phenotypes manifest as emergent properties of complex network perturbations [97,98]. While conventional linear models frequently discard these dependencies to mitigate multicollinearity, IML frameworks explicitly interrogate them to elucidate functional relationships [4]. By quantifying statistical interactions, wherein the predictive efficacy of one feature is modulated by another, researchers can reconstruct molecular crosstalk, mapping computational dependencies directly to physical pathway connectivity [11,15]. To elucidate these complex dependencies, IML transcends “Main Effects” by quantifying “Interaction Effects” via metrics like SHAP Interaction Values [11]. Biologically, these values serve as statistical signatures of biochemical synergy, antagonism, or dependency [15], allowing for the construction of “co-dependency networks” that delineate functional modules [15,22].
Biologically, strong statistical interactions often reflect upstream-downstream relationships, offering granular insights into metabolic flux dynamics that elude aggregate enrichment analyses [92]. For instance, within glycolysis, synergistic interactions between glucose and pyruvate typically indicate hyper-metabolic states (e.g., the Warburg effect), whereas discordant profiles signal rate-limiting bottlenecks or enzymatic inhibition [48,89]. By mapping these dependencies to canonical databases such as KEGG, IML frameworks facilitate the inference of reaction stoichiometry solely through the detection of deviations from expected substrate-product equilibria. Furthermore, metabolic homeostasis is contingent upon rigorous crosstalk between competing pathways. For instance, IML captures the Randle Cycle as a distinct negative interaction between plasma free fatty acids and glycolytic intermediates, modeling context-dependent pathogenicity [99,100]. Similarly, interactions between branched-chain amino acids and acylcarnitines serve as digital fingerprints for the interplay between protein catabolism and mitochondrial β-oxidation stress [101].
The elucidation of these interactions necessitates a paradigm shift from single-biomarker hypotheses to “multi-hit” models, particularly within complex pathologies where biological redundancy compromises the specificity of isolated metabolites. IML interaction analyses resolve this by identifying high-fidelity combinatorial biomarkers, such as the glutamine-glutamate ratio indicative of glutaminase activity, thereby capturing context-specific phenomena like synthetic lethality [102,103]. This approach aligns metabolomics with Network Medicine, reconceptualizing disease as the topological breakdown of functional modules rather than discrete node defects [104]. By reconstructing the dynamic architecture of metabolic networks, IML yields actionable mechanistic insights, suggesting that therapeutic strategies should target the uncoupling of pathological interactions or the restoration of regulatory feedback loops [59]. To facilitate the translation of these computational observations into biological hypotheses, Table 3 provides a systematic guide for decoding common IML visual patterns and their potential mechanistic correlates.
4.3. Bridging In Silico Hypotheses with Experimental Validation
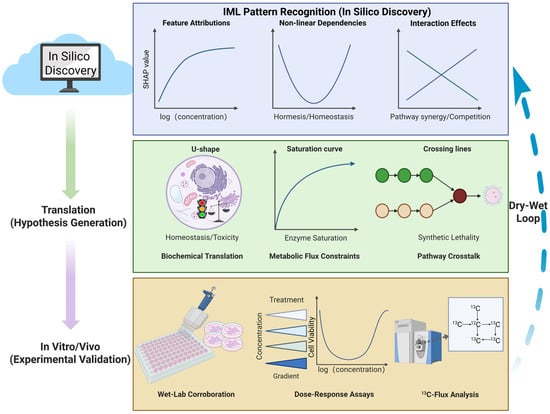
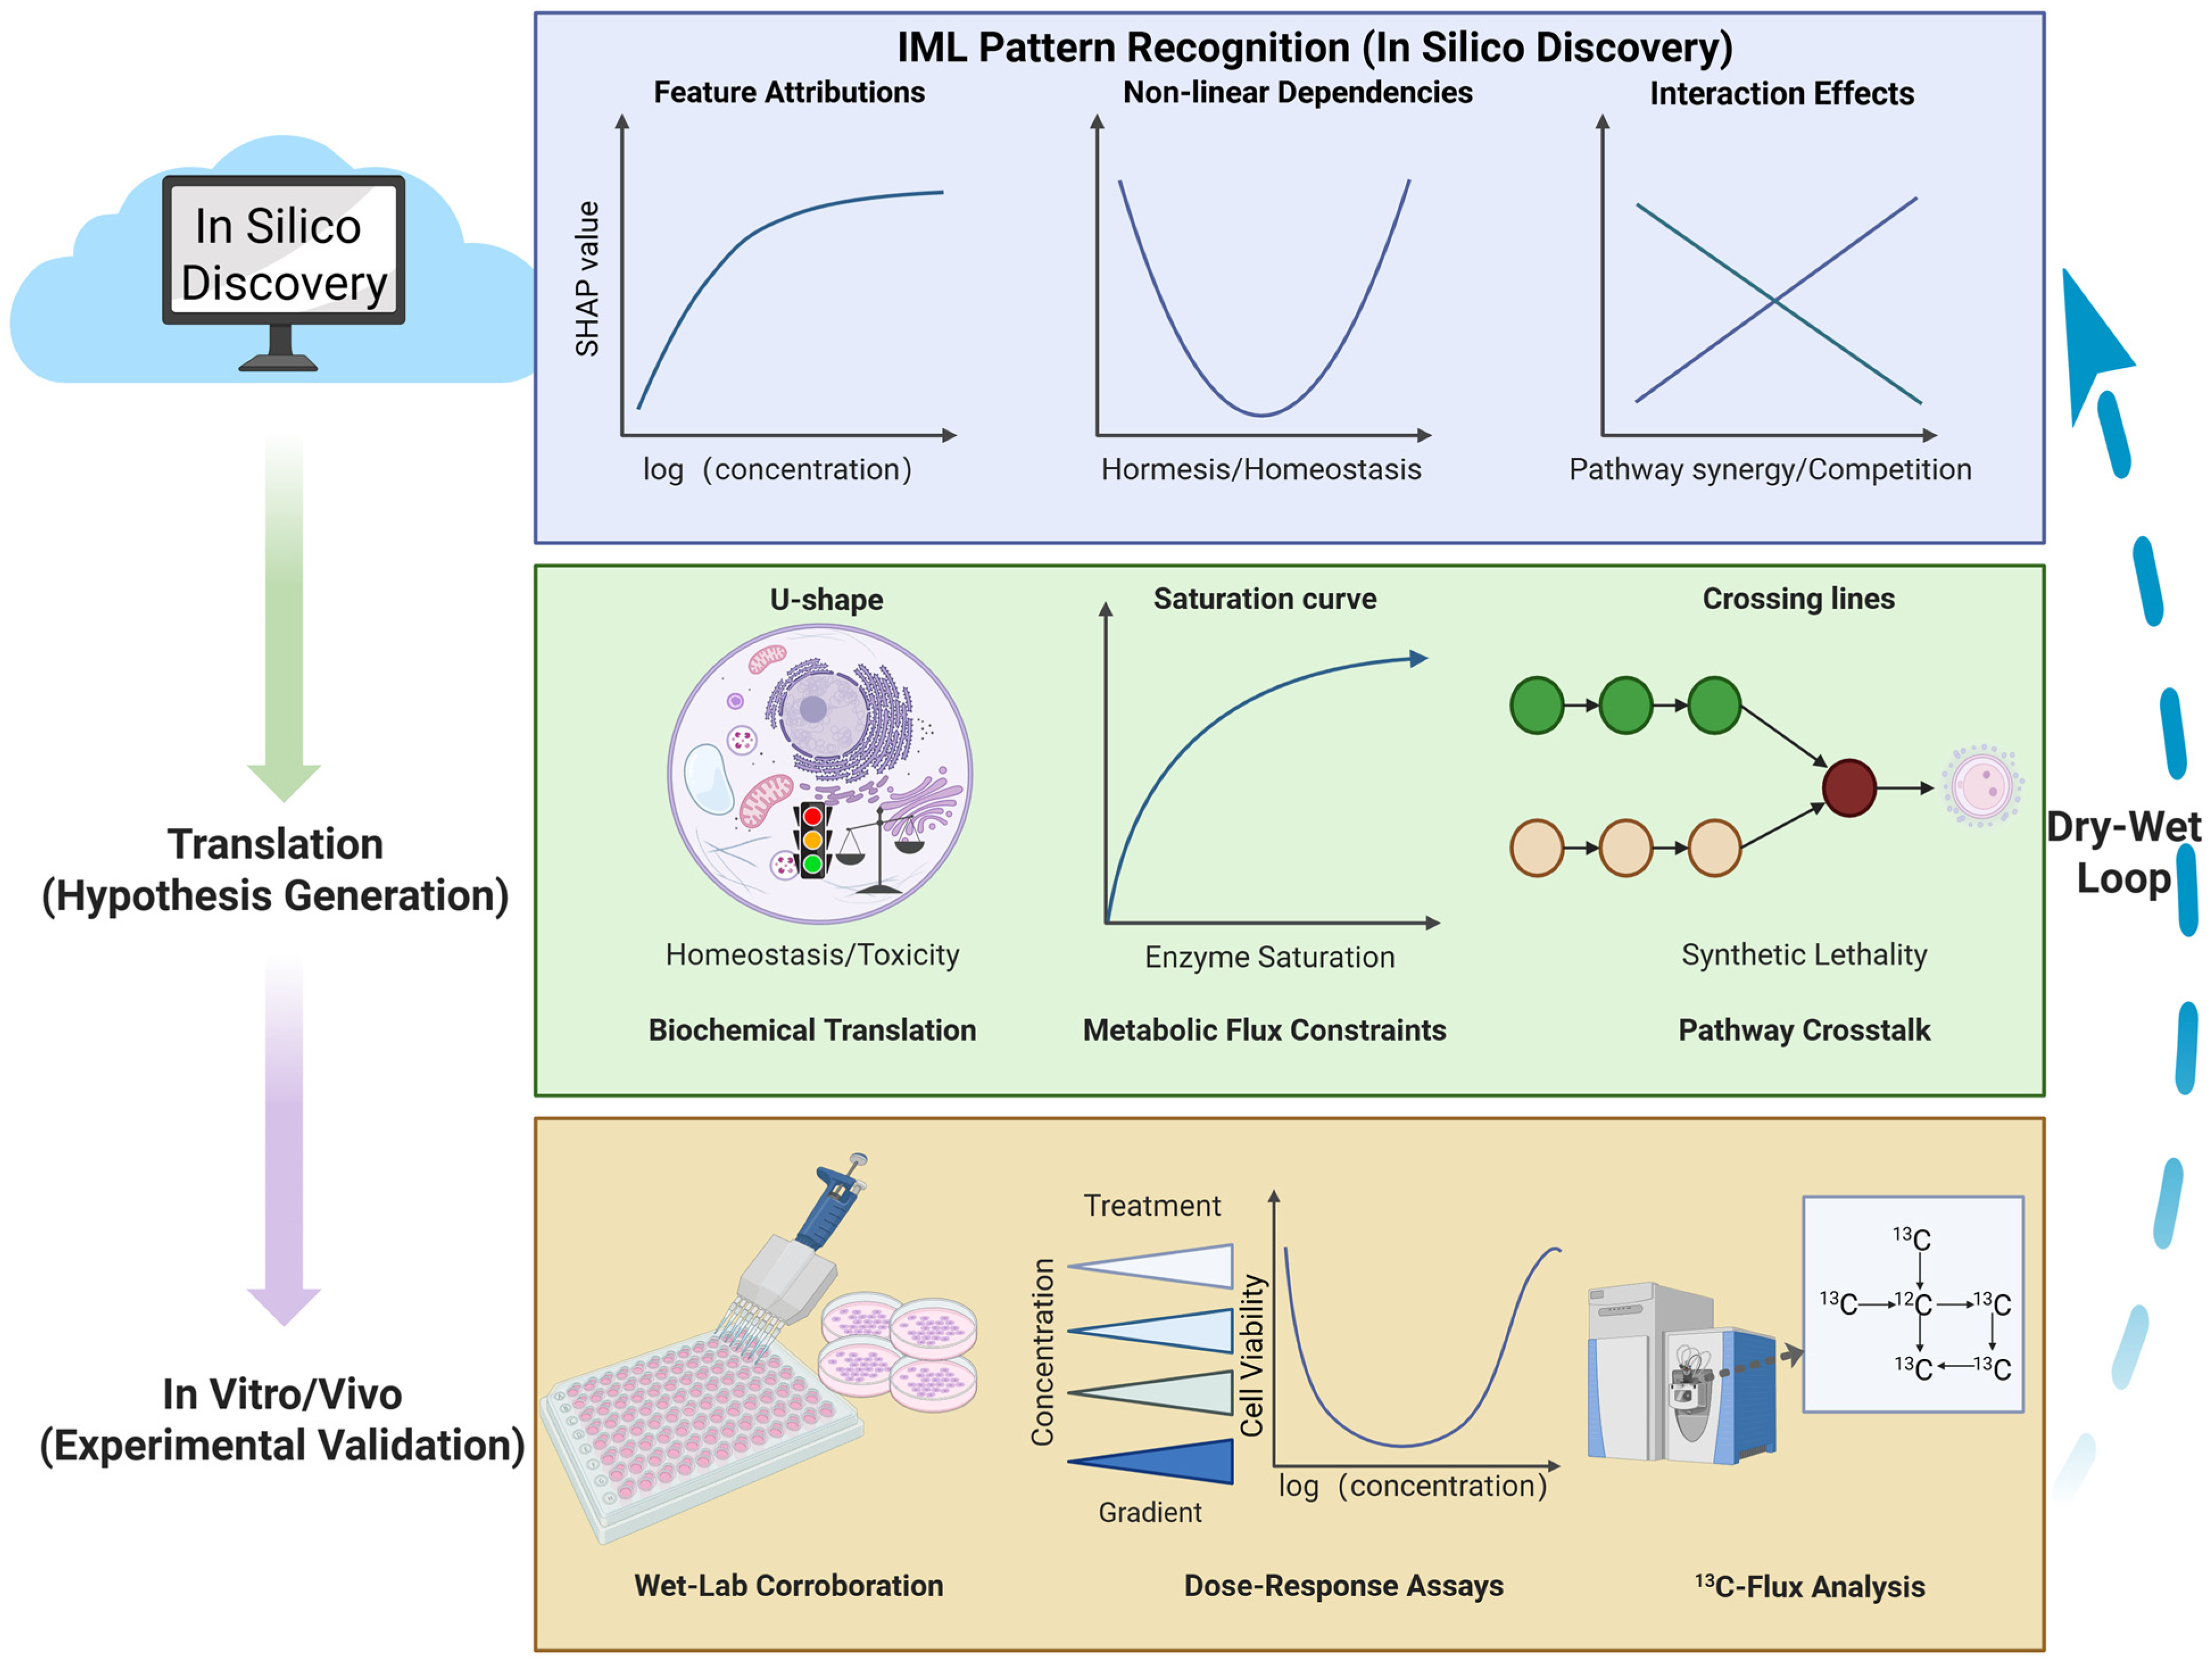
The translational utility of computational metabolomics is predicated not merely on predictive metrics but fundamentally on the biological validity of the elucidated mechanisms [57]. Given that feature attributions derived from IML tools remain inherently correlative [6], transitioning from in silico hypotheses to bona fide discovery requires rigorous in vitro and in vivo corroboration [105]. This necessitates an iterative “Dry-Wet Loop” workflow, wherein computationally identified metabolic vulnerabilities are systematically interrogated using orthogonal wet-lab techniques. Figure 4 illustrates this translational workflow, demonstrating how abstract statistical patterns derived from IML (such as U-shaped curves or interaction effects) are translated into mechanistic hypotheses and subsequently verified through rigorous experimental assays like metabolic flux analysis.
Figure 4.
The “Dry-Wet” Loop framework: Bridging in silico IML patterns with experimental validation. The workflow is organized into three hierarchical tiers illustrating the translational pipeline: (Top) In Silico Discovery: IML algorithms identify abstract statistical patterns from high-dimensional metabolomics data, such as logarithmic saturation curves, non-linear hormetic (U-shaped) dependencies, and high-order interaction effects. (Middle) Hypothesis Generation: These mathematical topologies are translated into testable biochemical mechanisms. For instance, U-shaped patterns are mapped to mitochondrial homeostasis (balancing deficiency vs. toxicity), saturation curves to enzymatic kinetic limits, and crossing interactions to pathway crosstalk (e.g., synthetic lethality). (Bottom) Experimental Validation: Computational hypotheses are rigorously tested using orthogonal wet-lab techniques. High-throughput dose–response assays corroborate non-linear biological phenotypes, while stable isotope tracing (13C-Flux Analysis) confirms metabolic pathway alterations. The Dry-Wet Loop (right arrow) signifies the iterative refinement of computational models based on experimental ground truths.
A paramount application of this workflow is the validation of context-specific “synthetic lethal” interactions—such as those driving chemotherapy resistance—that frequently elude linear modeling [106]. Through SHAP interaction analysis, researchers have elucidated critical non-linear dependencies, such as the link between glutamine availability and SCD1 activity, predicting that tumor survival is contingent upon a simultaneous “multi-hit” mechanism [107,108]. Guided by these insights, targeted 13C-Metabolic Flux Analysis confirmed that resistant subtypes uniquely divert glutamine-derived carbon toward de novo lipogenesis to preserve membrane fluidity [109], converting statistical interactions into actionable therapeutic strategies [110].
Table 3.
Decoding IML patterns: Translating computational features into biological mechanisms and validation strategies.
Similarly, verifying the non-linear thresholds identified by IML—such as U-shaped hormetic relationships—requires rigorous dose–response experimentation [114,115]. By employing in vitro models treated with concentration gradients, researchers have confirmed biphasic physiological responses, validating that non-linearities captured by SHAP analysis represent authentic mechanisms rather than algorithmic overfitting [116,117,118]. Ultimately, bridging the divide between prediction and reality requires a diverse toolkit. Techniques such as stable isotope tracing distinguishes active flux from static accumulation [110,112], while genetic perturbations (CRISPR/Cas9) and proteomic analysis corroborate functional dependencies and enzyme status [119,120]. Integrating these orthogonal approaches with IML catalyzes a fundamental paradigm shift from “black-box” prediction to “white-box” discovery, ensuring that identified metabolic signatures are biologically authentic [92].
5. Challenges and Future Perspectives
5.1. Data Limitations and Generalization Capabilities
The primary impediment to robust IML in metabolomics is not merely dimensionality (n ≪ p), but the profound lack of standardized, multi-center datasets comparable to genomics’ TCGA. Current IML models are predominantly trained on single-center cohorts, making them highly susceptible to batch effects and instrument-specific noise (e.g., LC-MS drift) rather than capturing true biological signals. A critical analysis reveals that models achieving >90% accuracy in internal validation frequently fail in external cohorts due to “shortcut learning,” where the algorithm latches onto non-biological artifacts (e.g., sample processing time) instead of disease pathology. Furthermore, the scarcity of longitudinal metabolomic data limits the ability of IML to capture dynamic disease trajectories. To ensure clinical utility, future research must pivot towards Harmonization-First approaches, prioritizing the construction of large-scale, diverse metabolic atlases. Rigorous external validation across heterogeneous populations and distinct mass spectrometry platforms is non-negotiable to prove that IML-derived biomarkers are biological facts, not statistical artifacts.
5.2. Interpretability Versus Clinical Trust
A fundamental paradox in current metabolomics IML is the “Multicollinearity Trap.” Biological metabolites function in tightly regulated pathways, inherently violating the feature independence assumptions of perturbation-based methods like SHAP and LIME. Consequently, these tools often suffer from attribution instability, arbitrarily splitting importance scores among co-regulated metabolites. This results in explanations that are mathematically convenient but biologically misleading—highlighting a “passenger” metabolite simply because it correlates with a “driver.” This gap between statistical importance and mechanistic causality severely erodes clinical trust; clinicians cannot rely on a “black box” that flags a metabolite without a clear, causal pathway context. Future directions must integrate Causal Structure Learning directly into IML frameworks. By constraining interpretation methods with prior biological knowledge (e.g., KEGG pathway topology), we can transition from identifying “correlated surrogates” to pinpointing causal mechanisms, thereby generating explanations that align with physiological reality.
5.3. Computational and Privacy Constraints
While identifying pairwise interactions is feasible, deciphering high-order metabolic interactions (e.g., three-way synergy between lipids, glucose, and insulin) is computationally prohibitive in high-dimensional spaces. Calculating exact Shapley interaction indices for thousands of features is NP-hard, forcing researchers to rely on approximation algorithms that may compromise the precision of mechanistic insights. Moreover, metabolic profiles act as unique “molecular fingerprints,” raising significant privacy concerns that restrict the sharing of raw data required to train robust deep learning models. To overcome these barriers, cutting-edge technologies like Swarm Learning (SL) offer a transformative solution. Unlike standard federated approaches, SL employs blockchain technology to collaboratively train IML models across institutions without a central coordinator or sharing raw patient spectra, thoroughly circumventing privacy silos. Simultaneously, integrating Retrieval-Augmented Generation (RAG) with LLMs serves as a concrete solution for interpretation. By anchoring high-dimensional interaction tensors directly to real-time biomedical literature and KEGG databases, RAG-enabled LLMs can automatically translate complex mathematical outputs into coherent, biologically actionable narratives, significantly reducing the cognitive load on researchers.
Beyond the currently applied algorithms, the future of precision metabolomics lies in adapting cutting-edge ML architectures that have revolutionized other domains but remain largely untested on metabolomic data. For instance, Self-Supervised Learning (SSL) and Foundation Models, which excel in natural language processing and genomics, hold immense untapped potential for untargeted metabolomics. These models could leverage vast amounts of unannotated spectral data to learn universal metabolic representations before fine-tuning for specific clinical tasks, thereby mitigating the bottleneck of metabolite annotation. Furthermore, Physics-Informed Neural Networks (PINNs), which embed known differential equations into the loss function, could be adapted into ‘Biochemical-Informed Neural Networks.’ By hardcoding known stoichiometric constraints and enzyme kinetics directly into the ML architecture, these untested methods could guarantee that model outputs strictly obey biological laws, offering a definitive leap from correlative IML to inherently mechanistic AI.
6. Conclusions
The integration of IML transforms metabolomics from opaque modeling toward transparent biological discovery, capturing complex, non-linear metabolic interactions. While IML successfully elucidates challenges like tumor heterogeneity, its attributions currently remain correlative. Thus, a rigorous “Dry-Wet Loop” is essential for mechanistic validation. To realize IML’s full clinical potential, future research must address specific technical pathways. Establishing standardized evaluation metrics is imperative to ensure cross-study reproducibility. The field must transcend correlation by integrating IML with causal discovery algorithms (e.g., Bayesian networks) to uncover true biological causality. Developing privacy-preserving federated modeling is vital to safely scale IML across diverse, global multi-omics cohorts. By advancing these frontiers, IML will become a foundational driver of precision metabolomics, translating high-dimensional data into robust, clinically actionable insights.
Author Contributions
Conceptualization, H.B., Y.Y. and Y.W.; methodology, H.B.; validation, Y.W.; formal analysis, H.B.; investigation, Y.R., H.B. and J.W.; data curation, Y.R.; writing—original draft preparation, H.B.; writing—review and editing, Y.Y. and Y.W.; supervision, Y.Y. and Y.W.; project administration, Y.Y. and Y.W.; funding acquisition, Y.W. and J.W. All authors have read and agreed to the published version of the manuscript.
Funding
This research was funded by the Open Funds for Shaanxi Provincial Key Laboratory of Infection and Immune Diseases (No. 2025KFMSA-3) and the Startup Foundation for Doctors of Yan’an University (No. YDBK2024-91 and No. YDZKBK2025-06).
Institutional Review Board Statement
Not applicable.
Informed Consent Statement
Not applicable.
Data Availability Statement
No new data were created or analyzed in this study. Data sharing is not applicable.
Conflicts of Interest
The authors declare no conflicts of interest.
References
- Murcia-Mejía, M.; Canela-Capdevila, M.; García-Pablo, R.; Jiménez-Franco, A.; Jiménez-Aguilar, J.M.; Badía, J.; Benavides-Villarreal, R.; Acosta, J.C.; Arguís, M.; Onoiu, A.-I. Combining Metabolomics and Machine Learning to Identify Diagnostic and Prognostic Biomarkers in Patients with Non-Small Cell Lung Cancer Pre-and Post-Radiation Therapy. Biomolecules 2024, 14, 898. [Google Scholar] [CrossRef] [Scilit] [PubMed]
- Qiu, S.; Guo, J.; Zhang, Z.; Liang, H.; You, H.; Hu, Y.; Liu, G.; Wang, Y. MetaboLM: A Metabolomic Language Model for Multi-Disease Early Prediction and Risk Stratification. Nat. Commun. 2025, 16, 11272. [Google Scholar] [CrossRef] [Scilit] [PubMed]
- Labory, J.; Njomgue-Fotso, E.; Bottini, S. Benchmarking Feature Selection and Feature Extraction Methods to Improve the Performances of Machine-Learning Algorithms for Patient Classification Using Metabolomics Biomedical Data. Comput. Struct. Biotechnol. J. 2024, 23, 1274–1287. [Google Scholar] [CrossRef] [Scilit] [PubMed]
- Schildcrout, R.; Smith, K.; Bhowmick, R.; Lu, Y.; Menon, S.; Kapadia, M.; Kurtz, E.; Coffeen-Vandeven, A.; Nelakuditi, S.; Chandrasekaran, S. Recon8D: A Metabolic Regulome Network from Oct-Omics and Machine Learning. bioRxiv 2024. preprint. [Google Scholar] [CrossRef] [Scilit]
- Cochran, D.; Noureldein, M.; Bezdekova, D.; Schram, A.; Howard, R.; Powers, R. A Reproducibility Crisis for Clinical Metabolomics Studies. TrAC Trends Anal. Chem. 2024, 180, 117918. [Google Scholar] [CrossRef] [Scilit]
- Shahnazari, P.; Kavousi, K.; Khorshid, H.R.K.; Goliaei, B.; Salek, R.M. Unlocking Precision Diagnostics: A Multimodal Framework Integrating Metabolomics with Advanced Machine Learning Techniques. bioRxiv 2025. preprint. [Google Scholar] [CrossRef] [Scilit]
- Alseekh, S.; Aharoni, A.; Brotman, Y.; Contrepois, K.; D’Auria, J.; Ewald, J.; Ewald, J.C.; Fraser, P.D.; Giavalisco, P.; Hall, R.D. Mass Spectrometry-Based Metabolomics: A Guide for Annotation, Quantification and Best Reporting Practices. Nat. Methods 2021, 18, 747–756. [Google Scholar] [CrossRef] [Scilit]
- Onwuka, S.; Bravo-Merodio, L.; Gkoutos, G.V.; Acharjee, A. Explainable AI-Prioritized Plasma and Fecal Metabolites in Inflammatory Bowel Disease and Their Dietary Associations. iScience 2024, 27, 110298. [Google Scholar] [CrossRef] [Scilit]
- Kim, K.-H.; Yoo, M.; Choi, M.Y.; Yoo, B.C. A Practical Roadmap for Clinical Translation of Metabolic Biomarkers: A Review. Int. J. Mol. Sci. 2026, 27, 2030. [Google Scholar] [CrossRef] [Scilit]
- Sekaran, K.; Zayed, H. Identification of Novel Hypertension Biomarkers Using Explainable AI and Metabolomics. Metabolomics 2024, 20, 124. [Google Scholar] [CrossRef] [Scilit]
- Lundberg, S.M.; Erion, G.; Chen, H.; DeGrave, A.; Prutkin, J.M.; Nair, B.; Katz, R.; Himmelfarb, J.; Bansal, N.; Lee, S.-I. From Local Explanations to Global Understanding with Explainable AI for Trees. Nat. Mach. Intell. 2020, 2, 56–67. [Google Scholar] [CrossRef] [Scilit] [PubMed]
- Xu, C.; Zhang, S.; Sun, B.; Yu, Z.; Liu, H. Machine Learning Identifies PYGM as a Macrophage Polarization–Linked Metabolic Biomarker in Rectal Cancer Prognosis. Front. Immunol. 2025, 16, 1639303. [Google Scholar] [CrossRef] [Scilit] [PubMed]
- Tolooshams, B.; Matias, S.; Wu, H.; Temereanca, S.; Uchida, N.; Murthy, V.N.; Masset, P.; Ba, D. Interpretable Deep Learning for Deconvolutional Analysis of Neural Signals. Neuron 2025, 113, 1151–1168. [Google Scholar] [CrossRef] [Scilit] [PubMed]
- Murdoch, W.J.; Singh, C.; Kumbier, K.; Abbasi-Asl, R.; Yu, B. Definitions, Methods, and Applications in Interpretable Machine Learning. Proc. Natl. Acad. Sci. USA 2019, 116, 22071–22080. [Google Scholar] [CrossRef] [Scilit] [PubMed]
- Hassija, V.; Chamola, V.; Mahapatra, A.; Singal, A.; Goel, D.; Huang, K.; Scardapane, S.; Spinelli, I.; Mahmud, M.; Hussain, A. Interpreting Black-Box Models: A Review on Explainable Artificial Intelligence. Cogn. Comput. 2024, 16, 45–74. [Google Scholar] [CrossRef] [Scilit]
- Wu, D.-N.; Jen, J.; Fajiculay, E.; Hsu, M.-F.; Chang, M.-C.; Yeh, J.-C.; Sargsyan, K.; Kupcinskas, J.; Skieceviciene, J.; Steponaitiene, R. PanMETAI-a High Performance Tabular Foundation Model for Accurate Pancreatic Cancer Diagnosis via NMR Metabolomics. Nat. Commun. 2026, 17, 1595. [Google Scholar] [CrossRef] [Scilit]
- Zhang, M.; Liu, X.; Chu, W.; Zhang, H.; Wang, Y. OmniCLIC: A Unified Omics Contrastive Learning Framework for Effective Integration and Classification of Multiomics Data. J. Chem. Inf. Model. 2025, 65, 12592–12607. [Google Scholar] [CrossRef] [Scilit]
- Singh, V. Current Advancements in Untargeted Metabolomics Analysis and Testing Driven by Machine Learning: Prospects for Artificial Intelligence in Patient-Centric Healthcare Transformation. Appl. Biochem. Biotechnol. 2026, 198, 709–751. [Google Scholar] [CrossRef] [Scilit]
- Sartori, F.; Codicè, F.; Caranzano, I.; Rollo, C.; Birolo, G.; Fariselli, P.; Pancotti, C. A Comprehensive Review of Deep Learning Applications with Multi-Omics Data in Cancer Research. Genes 2025, 16, 648. [Google Scholar] [CrossRef] [Scilit]
- Wang, F.; Liang, Y.; Wang, Q.-W. Interpretable Machine Learning-Driven Biomarker Identification and Validation for Alzheimer’s Disease. Sci. Rep. 2024, 14, 30770. [Google Scholar] [CrossRef] [Scilit]
- Apley, D.W.; Zhu, J. Visualizing the Effects of Predictor Variables in Black Box Supervised Learning Models. J. R. Stat. Soc. Ser. B Stat. Methodol. 2020, 82, 1059–1086. [Google Scholar] [CrossRef] [Scilit]
- Bilbao, A.; Munoz, N.; Kim, J.; Orton, D.J.; Gao, Y.; Poorey, K.; Pomraning, K.R.; Weitz, K.; Burnet, M.; Nicora, C.D. PeakDecoder Enables Machine Learning-Based Metabolite Annotation and Accurate Profiling in Multidimensional Mass Spectrometry Measurements. Nat. Commun. 2023, 14, 2461. [Google Scholar] [CrossRef] [Scilit]
- Houssein, E.H.; Gamal, A.M.; Younis, E.M.G.; Mohamed, E. Explainable Artificial Intelligence for Medical Imaging Systems Using Deep Learning: A Comprehensive Review. Clust. Comput. 2025, 28, 469. [Google Scholar] [CrossRef] [Scilit]
- Lin, M.; Guo, J.; Gu, Z.; Tang, W.; Tao, H.; You, S.; Jia, D.; Sun, Y.; Jia, P. Machine Learning and Multi-Omics Integration: Advancing Cardiovascular Translational Research and Clinical Practice. J. Transl. Med. 2025, 23, 388. [Google Scholar] [CrossRef] [Scilit] [PubMed]
- Wang, T.; Shao, W.; Huang, Z.; Tang, H.; Zhang, J.; Ding, Z.; Huang, K. MOGONET Integrates Multi-Omics Data Using Graph Convolutional Networks Allowing Patient Classification and Biomarker Identification. Nat. Commun. 2021, 12, 3445. [Google Scholar] [CrossRef] [Scilit] [PubMed]
- Chereda, H.; Bleckmann, A.; Menck, K.; Perera-Bel, J.; Stegmaier, P.; Auer, F.; Kramer, F.; Leha, A.; Beißbarth, T. Explaining Decisions of Graph Convolutional Neural Networks: Patient-Specific Molecular Subnetworks Responsible for Metastasis Prediction in Breast Cancer. Genome Med. 2021, 13, 42. [Google Scholar] [CrossRef] [Scilit] [PubMed]
- Degenhardt, F.; Seifert, S.; Szymczak, S. Evaluation of Variable Selection Methods for Random Forests and Omics Data Sets. Brief. Bioinform. 2019, 20, 492–503. [Google Scholar]
- Himdiat, E.; Haince, J.-F.; Bux, R.A.; Huang, G.; Tappia, P.S.; Ramjiawan, B.; Vaida, M. Translational Impact of Machine Learning-Driven Predictive Modeling with Pathway-Based Plasma Metabolomic Biomarkers for Lung Cancer Detection. Front. Oncol. 2026, 15, 1718863. [Google Scholar] [CrossRef] [Scilit]
- Bahl, A.; Hellack, B.; Balas, M.; Dinischiotu, A.; Wiemann, M.; Brinkmann, J.; Luch, A.; Renard, B.Y.; Haase, A. Recursive Feature Elimination in Random Forest Classification Supports Nanomaterial Grouping. NanoImpact 2019, 15, 100179. [Google Scholar] [CrossRef] [Scilit]
- Li, X.; Zhao, X.; Zhang, R.; Zhuang, X. Harnessing Serum VOCs and Machine Learning for the Early Detection of MAFLD. Front. Endocrinol. 2025, 16, 1691853. [Google Scholar] [CrossRef] [Scilit]
- Leiherer, A.; Muendlein, A.; Mink, S.; Mader, A.; Saely, C.H.; Festa, A.; Fraunberger, P.; Drexel, H. Machine Learning Approach to Metabolomic Data Predicts Type 2 Diabetes Mellitus Incidence. Int. J. Mol. Sci. 2024, 25, 5331. [Google Scholar] [CrossRef] [Scilit] [PubMed]
- Arslan, A.K.; Yagin, F.H.; Algarni, A.; Karaaslan, E.; Al-Hashem, F.; Ardigò, L.P. Enhancing Type 2 Diabetes Mellitus Prediction by Integrating Metabolomics and Tree-Based Boosting Approaches. Front. Endocrinol. 2024, 15, 1444282. [Google Scholar] [CrossRef] [Scilit] [PubMed]
- Takahashi, Y.; Ueki, M.; Yamada, M.; Tamiya, G.; Motoike, I.N.; Saigusa, D.; Sakurai, M.; Nagami, F.; Ogishima, S.; Koshiba, S. Improved Metabolomic Data-Based Prediction of Depressive Symptoms Using Nonlinear Machine Learning with Feature Selection. Transl. Psychiatry 2020, 10, 157. [Google Scholar] [CrossRef] [Scilit] [PubMed]
- Liu, W.; Ma, J.; Zhang, J.; Cao, J.; Hu, X.; Huang, Y.; Wang, R.; Wu, J.; Di, W.; Qian, K.; et al. Identification and Validation of Serum Metabolite Biomarkers for Endometrial Cancer Diagnosis. EMBO Mol. Med. 2024, 16, 988–1003. [Google Scholar] [CrossRef] [Scilit]
- Yu, C.-S.; Lin, Y.-J.; Lin, C.-H.; Wang, S.-T.; Lin, S.-Y.; Lin, S.H.; Wu, J.L.; Chang, S.-S. Predicting Metabolic Syndrome with Machine Learning Models Using a Decision Tree Algorithm: Retrospective Cohort Study. JMIR Med. Inform. 2020, 8, e17110. [Google Scholar] [CrossRef] [Scilit]
- González-Domínguez, R.; Castellano-Escuder, P.; Carmona, F.; Lefèvre-Arbogast, S.; Low, D.Y.; Du Preez, A.; Ruigrok, S.R.; Manach, C.; Urpi-Sarda, M.; Korosi, A.; et al. Food and Microbiota Metabolites Associate with Cognitive Decline in Older Subjects: A 12-Year Prospective Study. Mol. Nutr. Food Res. 2021, 65, 2100606. [Google Scholar] [CrossRef] [Scilit]
- Colicino, E.; Ferrari, F.; Cowell, W.; Niedzwiecki, M.M.; Pedretti, N.F.; Joshi, A.; Wright, R.O.; Wright, R.J. Non-Linear and Non-Additive Associations between the Pregnancy Metabolome and Birthweight. Environ. Int. 2021, 156, 106750. [Google Scholar] [CrossRef] [Scilit]
- Palatnik de Sousa, I.; Maria Bernardes Rebuzzi Vellasco, M.; Costa da Silva, E. Local Interpretable Model-Agnostic Explanations for Classification of Lymph Node Metastases. Sensors 2019, 19, 2969. [Google Scholar] [CrossRef] [Scilit]
- Clarós, A.; Ciudin, A.; Muria, J.; Llull, L.; Mola, J.À.; Pons, M.; Castán, J.; Cruz, J.C.; Simó, R. A Model Based on Artificial Intelligence for the Prediction, Prevention and Patient-Centred Approach for Non-Communicable Diseases Related to Metabolic Syndrome. Eur. J. Public Health 2025, 35, 642–649. [Google Scholar] [CrossRef] [Scilit]
- Davis, S.; Zhang, J.; Lee, I.; Rezaei, M.; Greiner, R.; McAlister, F.A.; Padwal, R. Effective Hospital Readmission Prediction Models Using Machine-Learned Features. BMC Health Serv. Res. 2022, 22, 1415. [Google Scholar] [CrossRef] [Scilit]
- Bifarin, O.O.; Fernández, F.M. Automated Machine Learning and Explainable AI (AutoML-XAI) for Metabolomics: Improving Cancer Diagnostics. J. Am. Soc. Mass Spectrom. 2024, 35, 1089–1100. [Google Scholar] [CrossRef] [Scilit]
- Schwalbe, G.; Finzel, B. A Comprehensive Taxonomy for Explainable Artificial Intelligence: A Systematic Survey of Surveys on Methods and Concepts. Data Min. Knowl. Discov. 2024, 38, 3043–3101. [Google Scholar] [CrossRef] [Scilit]
- Kant, S.; Deepika; Roy, S. Artificial Intelligence in Drug Discovery and Development: Transforming Challenges into Opportunities. Discov. Pharm. Sci. 2025, 1, 7. [Google Scholar] [CrossRef] [Scilit]
- Huber, F.; Van Der Burg, S.; Van Der Hooft, J.J.J.; Ridder, L. MS2DeepScore: A Novel Deep Learning Similarity Measure to Compare Tandem Mass Spectra. J. Cheminform. 2021, 13, 84. [Google Scholar] [CrossRef] [Scilit] [PubMed]
- Zhou, J.; Martí-Gómez, C.; Petti, S.; McCandlish, D.M. Learning Sequence-Function Relationships with Scalable, Interpretable Gaussian Processes. bioRxiv 2025. preprint. [Google Scholar] [CrossRef] [Scilit] [PubMed]
- Budhkar, A.; Song, Q.; Su, J.; Zhang, X. Demystifying the Black Box: A Survey on Explainable Artificial Intelligence (XAI) in Bioinformatics. Comput. Struct. Biotechnol. J. 2025, 27, 346–359. [Google Scholar] [CrossRef] [Scilit] [PubMed]
- Ichikawa, K.; Boulicault, M.; Thinius, A.; DiMarco, M.; Murchland, A.R.; Maldonado, B.; Higgins, A.S.; Richardson, S.S. Sex in the Medical Machine: How Algorithms Can Entrench Bioessentialism in Precision Medicine. Big Data Soc. 2025, 12, 20539517251381674. [Google Scholar] [CrossRef] [Scilit]
- Yan, S.; Zhang, X.; Xu, T.; Wang, X.; Tian, F.; Fan, W.; Zhan, Y.; Cai, L.; Xing, Y. Integrated Multiomics Analysis and Advanced Machine Learning Techniques to Refine Molecular Subtypes, Stratify Prognosis, Characterize Tumor Microenvironment, and Identify Distinct Sensitivity Patterns to Frontline Therapies in Lung Squamous Cell Carcinoma. J. Big Data 2026, 13, 22. [Google Scholar] [CrossRef] [Scilit]
- Wolde, T.; Bhardwaj, V.; Pandey, V. Current Bioinformatics Tools in Precision Oncology. MedComm 2025, 6, e70243. [Google Scholar] [CrossRef] [Scilit]
- MacDonald, W.J.; Purcell, C.; Pinho-Schwermann, M.; Stubbs, N.M.; Srinivasan, P.R.; El-Deiry, W.S. Heterogeneity in Cancer. Cancers 2025, 17, 441. [Google Scholar] [CrossRef] [Scilit]
- Lin, L.; Lapi, F.; Galuzzi, B.G.; Vanoni, M.; Alberghina, L.; Damiani, C. Mechanistically Informed Machine Learning Links Non-Canonical TCA Cycle Activity to Warburg Metabolism and Hallmarks of Malignancy. PLoS Comput. Biol. 2025, 21, e1013384. [Google Scholar] [CrossRef] [Scilit] [PubMed]
- Liu, X.; Ren, B.; Fang, Y.; Ren, J.; Wang, X.; Gu, M.; Zhou, F.; Xiao, R.; Luo, X.; You, L.; et al. Comprehensive Analysis of Bulk and Single-Cell Transcriptomic Data Reveals a Novel Signature Associated with Endoplasmic Reticulum Stress, Lipid Metabolism, and Liver Metastasis in Pancreatic Cancer. J. Transl. Med. 2024, 22, 393. [Google Scholar] [CrossRef] [Scilit] [PubMed]
- Hassan, A.M.; Naeem, S.M.; Eldosoky, M.A.A.; Mabrouk, M.S. Multi-Omics-Based Machine Learning for the Subtype Classification of Breast Cancer. Arab. J. Sci. Eng. 2025, 50, 1339–1352. [Google Scholar] [CrossRef] [Scilit]
- Liang, M.; Huang, X.; Zhu, J.; Bao, J.; Chen, C.-L.; Wang, X.; Lou, Y.; Pan, Y.; Dai, Y. A Machine Learning-Based Glycolysis and Fatty Acid Metabolism-Related Prognostic Signature Is Constructed and Identified ACSL5 as a Novel Marker Inhibiting the Proliferation of Breast Cancer. Comput. Biol. Chem. 2025, 119, 108507. [Google Scholar] [CrossRef] [Scilit]
- Li, S.; Yuan, H.; Li, L.; Li, Q.; Lin, P.; Li, K. Oxidative Stress and Reprogramming of Lipid Metabolism in Cancers. Antioxidants 2025, 14, 201. [Google Scholar] [CrossRef] [Scilit]
- Arumalla, K.K.; Haince, J.-F.; Bux, R.A.; Huang, G.; Tappia, P.S.; Ramjiawan, B.; Ford, W.R.; Vaida, M. Metabolomics-Based Machine Learning Models Accurately Predict Breast Cancer Estrogen Receptor Status. Int. J. Mol. Sci. 2024, 25, 13029. [Google Scholar] [CrossRef] [Scilit]
- Ng, E.S.; Nanjala, R.; Jostins-Dean, L.; Barrett, J.C.; Todd, J.A.; Luo, Y. Improving Population-Scale Disease Prediction through Multi-Omics Integration. medRxiv 2025. preprint. [Google Scholar] [CrossRef] [Scilit]
- Chen, F.; Dai, X.; Zhou, C.-C.; Li, K.; Zhang, Y.; Lou, X.-Y.; Zhu, Y.-M.; Sun, Y.-L.; Peng, B.-X.; Cui, W. Integrated Analysis of the Faecal Metagenome and Serum Metabolome Reveals the Role of Gut Microbiome-Associated Metabolites in the Detection of Colorectal Cancer and Adenoma. Gut 2022, 71, 1315–1325. [Google Scholar] [CrossRef] [Scilit]
- Choudhury, S.; Toumpe, I.; Gabouj, O.; Behler, J.S.; Hatzimanikatis, V.; Miskovic, L. Generative Approaches to Kinetic Parameter Inference in Metabolic Networks via Latent Space Exploration. bioRxiv 2025. preprint. [Google Scholar] [CrossRef] [Scilit]
- Stamate, D.; Kim, M.; Proitsi, P.; Westwood, S.; Baird, A.; Nevado-Holgado, A.; Hye, A.; Bos, I.; Vos, S.J.B.; Vandenberghe, R.; et al. A Metabolite-based Machine Learning Approach to Diagnose Alzheimer-type Dementia in Blood: Results from the European Medical Information Framework for Alzheimer Disease Biomarker Discovery Cohort. Alzheimer’s Dement. Transl. Res. Clin. Interv. 2019, 5, 933–938. [Google Scholar] [CrossRef] [Scilit]
- Chuah, J. Utilizing Machine Learning to Identify Gut Metabolites Associated with Alzheimer’s Disease. Innov. Aging 2025, 9, igaf122.1617. [Google Scholar] [CrossRef] [Scilit]
- Falasca, N.W.; Ferretti, A.; Granzotto, A.; Sensi, S.L.; Franciotti, R. Alzheimer’s Disease Neuroimaging Initiative (ADNI). Machine Learning Models of Alzheimer’s Disease Spectrum Using Blood Tests. Alzheimer’s Dement. Diagn. Assess. Dis. Monit. 2025, 17, e70228. [Google Scholar] [CrossRef] [Scilit]
- Ullah, W.; Dai, Q.; Zulqarnain, R.M.; Fiidow, M.A. Explainable Artificial Intelligence for Early Alzheimer’s Diagnosis Using Enhanced Grey Relational Features and Multimodal Data. Sci. Rep. 2026. [Google Scholar] [CrossRef] [Scilit]
- Pacoova Dal Maschio, V.; Roveta, F.; Bonino, L.; Boschi, S.; Rainero, I.; Rubino, E. The Role of Blood-Based Biomarkers in Transforming Alzheimer’s Disease Research and Clinical Management: A Review. Int. J. Mol. Sci. 2025, 26, 8564. [Google Scholar] [CrossRef] [Scilit]
- Son, S.J.; Wu, X.; Roh, H.W.; Cho, Y.H.; Hong, S.; Nam, Y.J.; Hong, C.H.; Park, S. Distinct Gut Microbiota Profiles and Network Properties in Older Korean Individuals with Subjective Cognitive Decline, Mild Cognitive Impairment, and Alzheimer’s Disease. Alzheimer’s Res. Ther. 2025, 17, 187. [Google Scholar] [CrossRef] [Scilit] [PubMed]
- Butler, K.; Feng, G.; Djuric, P. Higher-Order Feature Attribution: Bridging Statistics, Explainable AI, and Topological Signal Processing. arXiv 2026, arXiv:2510.06165. [Google Scholar]
- Ambeskovic, M.; Hopkins, G.; Hoover, T.; Joseph, J.T.; Montina, T.; Metz, G.A. Metabolomic Signatures of Alzheimer’s Disease Indicate Brain Region-Specific Neurodegenerative Progression. Int. J. Mol. Sci. 2023, 24, 14769. [Google Scholar] [CrossRef] [Scilit] [PubMed]
- Rout, M.; Fiehn, O.; Sanghera, D.K. Circulating Lipidome Underpins Gender Differences in the Pathogenesis of Type 2 Diabetes. J. Lipid Res. 2025, 66, 100816. [Google Scholar] [CrossRef] [Scilit]
- Navarro, S.L.; Nagana Gowda, G.A.; Bettcher, L.F.; Pepin, R.; Nguyen, N.; Ellenberger, M.; Zheng, C.; Tinker, L.F.; Prentice, R.L.; Huang, Y. Demographic, Health and Lifestyle Factors Associated with the Metabolome in Older Women. Metabolites 2023, 13, 514. [Google Scholar] [CrossRef] [Scilit]
- Lim, J.; Kim, S.; Moon, S.-M. Shortcut Features as Top Eigenfunctions of NTK: A Linear Neural Network Case and More. arXiv 2026, arXiv:2602.03066. [Google Scholar] [CrossRef] [Scilit]
- Mahmood, U.; Shrestha, R.; Bates, D.D.; Mannelli, L.; Corrias, G.; Erdi, Y.E.; Kanan, C. Detecting Spurious Correlations with Sanity Tests for Artificial Intelligence Guided Radiology Systems. Front. Digit. Health 2021, 3, 671015. [Google Scholar] [CrossRef] [Scilit]
- Franklin, G.; Stephens, R.; Piracha, M.; Tiosano, S.; Lehouillier, F.; Koppel, R.; Elkin, P.L. The Sociodemographic Biases in Machine Learning Algorithms: A Biomedical Informatics Perspective. Life 2024, 14, 652. [Google Scholar] [CrossRef] [Scilit]
- Otokiti, A.U.; Shih, H.; Williams, K.S. Gender and Racial Bias Unveiled: Clinical Artificial Intelligence (AI) and Machine Learning (ML) Algorithms Are Fanning the Flames of Inequity. Oxf. Open Digit. Health 2025, 3, oqaf027. [Google Scholar] [CrossRef] [Scilit] [PubMed]
- Johnson, K.B.; Horn, I.B.; Horvitz, E. Pursuing Equity with Artificial Intelligence in Health Care. JAMA Health Forum 2025, 6, e245031. [Google Scholar] [CrossRef] [Scilit] [PubMed]
- Koçak, B.; Ponsiglione, A.; Stanzione, A.; Bluethgen, C.; Santinha, J.; Ugga, L.; Huisman, M.; Klontzas, M.E.; Cannella, R.; Cuocolo, R. Bias in Artificial Intelligence for Medical Imaging: Fundamentals, Detection, Avoidance, Mitigation, Challenges, Ethics, and Prospects. Diagn. Interv. Radiol. 2024, 31, 75–88. [Google Scholar] [CrossRef] [Scilit] [PubMed]
- Gao, Y.; Hao, J.; Zhou, B. FairREAD: Re-Fusing Demographic Attributes after Disentanglement for Fair Medical Image Classification. Med. Image Anal. 2025, 107, 103858. [Google Scholar] [CrossRef] [Scilit]
- Ong, A.Y.; Rosen, K.L.; Sui, M.; Kvedar, J.C. “Doing No Harm” in the Digital Age: Navigating Tradeoffs and Operational Considerations for Privacy-Preserving Deep Learning in Medicine. npj Digit. Med. 2026, 9, 207. [Google Scholar] [CrossRef] [Scilit]
- Zallar, L.J.; Dupont, M.B. Brain and Blood Biomarkers of Major Depressive Disorder: A Systematic Review. JAMA Psychiatry 2026. preprint. [Google Scholar] [CrossRef] [Scilit]
- Wu, M.; Li, G.; Li, Y.; Chen, K.; Xu, M.; Li, D.; Xu, C.; Shen, M.; Li, W.; Cao, J. Multi-Omics Analyses Inform Mechanisms of Immunotherapy Response in Pancreatic Cancer. Front. Immunol. 2025, 16, 1673098. [Google Scholar] [CrossRef] [Scilit]
- Castañé, H.; Iftimie, S.; Baiges-Gaya, G.; Rodríguez-Tomàs, E.; Jiménez-Franco, A.; López-Azcona, A.F.; Garrido, P.; Castro, A.; Camps, J.; Joven, J. Machine Learning and Semi-Targeted Lipidomics Identify Distinct Serum Lipid Signatures in Hospitalized COVID-19-Positive and COVID-19-Negative Patients. Metabolism 2022, 131, 155197. [Google Scholar] [CrossRef] [Scilit]
- Baron, C.; Mehanna, P.; Daneault, C.; Hausermann, L.; Busseuil, D.; Tardif, J.-C.; Dupuis, J.; Des Rosiers, C.; Ruiz, M.; Hussin, J.G. Insights into Heart Failure Metabolite Markers through Explainable Machine Learning. Comput. Struct. Biotechnol. J. 2025, 27, 1012–1022. [Google Scholar] [CrossRef] [Scilit]
- Hu, J.-R.; Myint, L.; Levey, A.S.; Coresh, J.; Inker, L.A.; Grams, M.E.; Guallar, E.; Hansen, K.D.; Rhee, E.P.; Shafi, T. A Metabolomics Approach Identified Toxins Associated with Uremic Symptoms in Advanced Chronic Kidney Disease. Kidney Int. 2022, 101, 369–378. [Google Scholar] [CrossRef] [Scilit] [PubMed]
- Diniz, B.; Tian, Q. Biomarker Insights into Brain Health, Aging, and Healthspan. Innov. Aging 2025, 9, igaf122.2082. [Google Scholar] [CrossRef] [Scilit]
- Ji, M.; Jo, Y.; Choi, S.J.; Kim, S.M.; Kim, K.K.; Oh, B.-C.; Ryu, D.; Paik, M.-J.; Lee, D.H. Plasma Metabolomics and Machine Learning-Driven Novel Diagnostic Signature for Non-Alcoholic Steatohepatitis. Biomedicines 2022, 10, 1669. [Google Scholar] [CrossRef] [Scilit]
- Liu, W.; Hu, X.; Bao, Z.; Li, Y.; Zhang, J.; Yang, S.; Huang, Y.; Wang, R.; Wu, J.; Xu, X. Serum Metabolic Fingerprints Encode Functional Biomarkers for Ovarian Cancer Diagnosis: A Large-Scale Cohort Study. eBioMedicine 2025, 115, 105706. [Google Scholar] [CrossRef] [Scilit]
- Ji, Q.; Gao, L.; Liu, H.; Chen, X.; Fu, B.; Lin, Y.; Wang, F. Early Prediction of Gestational Diabetes Mellitus Using Machine Learning-Integrated Metabolomic and Clinical Features. Front. Endocrinol. 2025, 16, 1687146. [Google Scholar] [CrossRef] [Scilit]
- Bekiaris, P.S.; Klamt, S. Automatic Construction of Metabolic Models with Enzyme Constraints. BMC Bioinform. 2020, 21, 19. [Google Scholar] [CrossRef] [Scilit]
- Billing, A.M.; Kim, Y.C.; Gullaksen, S.; Schrage, B.; Raabe, J.; Hutzfeldt, A.; Demir, F.; Kovalenko, E.; Lassé, M.; Dugourd, A.; et al. Metabolic Communication by SGLT2 Inhibition. Circulation 2024, 149, 860–884. [Google Scholar] [CrossRef] [Scilit] [PubMed]
- Turanli, B.; Gulfidan, G.; Aydogan, O.O.; Kula, C.; Selvaraj, G.; Arga, K.Y. Genome-Scale Metabolic Models in Translational Medicine: The Current Status and Potential of Machine Learning in Improving the Effectiveness of the Models. Mol. Omics 2024, 20, 234–247. [Google Scholar] [CrossRef] [Scilit] [PubMed]
- Sies, H. Oxidative Eustress: The Physiological Role of Oxidants. Sci. China Life Sci. 2023, 66, 1947–1948. [Google Scholar] [CrossRef] [Scilit]
- Wang, H.; Poulain, S.; Cao, W.; Arakawa, H.; Kim, S.H.; Kato, Y.; Nishikawa, M.; Sakai, Y.; Leclerc, E. Palmitic Acid Induced the Onset of Lipotoxicity in a HepaSH-on-Chip Model with Raised of H2O2 and IL-6, and Altered P38/MAPK & JAK/STAT Pathways. Toxicology 2025, 520, 154345. [Google Scholar]
- Schmidt, J.C.; Dougherty, B.V.; Beger, R.D.; Jones, D.P.; Schmidt, M.A.; Mattes, W.B. Metabolomics as a Truly Translational Tool for Precision Medicine. Int. J. Toxicol. 2021, 40, 413–426. [Google Scholar] [CrossRef] [Scilit]
- Lin, F.; Gong, Z.; Wang, C.; Zhang, T.; Tian, Y.; Jiang, Y.; Dai, J.; Guo, C.; Yu, X.; Yang, X.; et al. Breaking Bad Molecules: Are MLLMs Ready for Structure-Level Molecular Detoxification? arXiv 2026, arXiv:2506.10912. [Google Scholar]
- Wan, Y.; Liu, J.; Mai, Y.; Hong, Y.; Jia, Z.; Tian, G.; Liu, Y.; Liang, H.; Liu, J. Current Advances and Future Trends of Hormesis in Disease. npj Aging 2024, 10, 26. [Google Scholar] [CrossRef] [Scilit] [PubMed]
- Xiong, J.; Zhu, X.; Guo, Y.; Tang, H.; Dong, C.; Wang, B.; Liu, M.; Li, Z.; Tu, Y. Multi-Omic Underpinnings of Heterogeneous Aging across Multiple Organ Systems. Cell Genom. 2025, 5, 101032. [Google Scholar] [CrossRef] [Scilit] [PubMed]
- Singh, V.; Ubaid, S.; Kashif, M.; Singh, T.; Singh, G.; Pahwa, R.; Singh, A. Role of Inflammasomes in Cancer Immunity: Mechanisms and Therapeutic Potential. J. Exp. Clin. Cancer Res. 2025, 44, 109. [Google Scholar] [CrossRef] [Scilit] [PubMed]
- Zhang, H.; Zeng, X.; Yin, Y.; Zhu, Z.-J. Knowledge and Data-Driven Two-Layer Networking for Accurate Metabolite Annotation in Untargeted Metabolomics. Nat. Commun. 2025, 16, 8118. [Google Scholar] [CrossRef] [Scilit]
- Sharma, M.; Singh, A. Systems Biology for Metabolic Disorder and Disease. In Systems Biology Approaches: Prevention, Diagnosis, and Understanding Mechanisms of Complex Diseases; Joshi, S., Ray, R.R., Nag, M., Lahiri, D., Eds.; Springer Nature: Singapore, 2024; pp. 71–91. [Google Scholar]
- Palmer, B.F.; Clegg, D.J. Metabolic Flexibility and Its Impact on Health Outcomes. Mayo Clin. Proc. 2022, 97, 761–776. [Google Scholar] [CrossRef] [Scilit]
- Perveen, S.; Shahbaz, M.; Keshavjee, K.; Guergachi, A. Metabolic Syndrome and Development of Diabetes Mellitus: Predictive Modeling Based on Machine Learning Techniques. IEEE Access 2018, 7, 1365–1375. [Google Scholar] [CrossRef] [Scilit]
- Libert, D.M.; Nowacki, A.S.; Natowicz, M.R. Metabolomic Analysis of Obesity, Metabolic Syndrome, and Type 2 Diabetes: Amino Acid and Acylcarnitine Levels Change along a Spectrum of Metabolic Wellness. PeerJ 2018, 6, e5410. [Google Scholar] [CrossRef] [Scilit]
- Zhang, M.; Chen, C.; Zhang, H.; Long, T.; Wang, T.; Ding, N.; Long, R.; Wu, H.; Ma, Z.; Cheng, Z. SIRT6 Promotes Intrahepatic Cholangiocarcinoma Development by Reprogramming Glutamine Metabolism via Enhanced GLUL. Gut 2025. [Google Scholar] [CrossRef] [Scilit]
- Altucci, L.; Badimon, L.; Balligand, J.-L.; Baumbach, J.; Catapano, A.L.; Cheng, F.; DeMeo, D.; Gupta, R.; Hacker, M.; Liu, Y.-Y.; et al. Artificial Intelligence and Network Medicine: Path to Precision Medicine. NEJM AI 2025, 2. [Google Scholar] [CrossRef] [Scilit] [PubMed]
- Apaolaza, I.; San José-Enériz, E.; Valcarcel, L.V.; Agirre, X.; Prosper, F.; Planes, F.J. A Network-Based Approach to Integrate Nutrient Microenvironment in the Prediction of Synthetic Lethality in Cancer Metabolism. PLoS Comput. Biol. 2022, 18, e1009395. [Google Scholar] [CrossRef] [Scilit] [PubMed]
- Sillé, F.C.; Prasse, C.; Luechtefeld, T.; Hartung, T. AI Redefines Mass Spectrometry Chemicals Identification: Retention Time Prediction in Metabolomics and for a Human Exposome Project. Front. Public Health 2025, 13, 1687056. [Google Scholar] [CrossRef] [Scilit] [PubMed]
- Chen, X.; Cai, R.; Huang, Z.; Li, Z.; Zheng, J.; Wu, M. Interpretable High-Order Knowledge Graph Neural Network for Predicting Synthetic Lethality in Human Cancers. Brief. Bioinform. 2025, 26, bbaf142. [Google Scholar] [CrossRef] [Scilit]
- Zhang, J.; Zou, S.; Fang, L. Metabolic Reprogramming in Colorectal Cancer: Regulatory Networks and Therapy. Cell Biosci. 2023, 13, 25. [Google Scholar] [CrossRef] [Scilit]
- Liu, Q.; Zhu, J.; Abulizi, G.; Hasim, A. Metabolism and Spatial Transcription Resolved Heterogeneity of Glutamine Metabolism in Cervical Carcinoma. BMC Cancer 2024, 24, 1504. [Google Scholar] [CrossRef] [Scilit]
- Mangeon, L.; Le Balch, R.; Mantha, O.L.; Guimaraes-carneiro, C.; Pinault, M.; Hankard, R.; De Luca, A.; Tea, I. Simultaneous Quantification and Natural 13C Abundance of Fatty Acids in Breast Cancer Tissues and Serum by GC-C-IRMS for Tumor Characterization. Talanta Open 2025, 12, 100573. [Google Scholar] [CrossRef] [Scilit]
- Lee, J.-Y.; Kim, W.K.; Bae, K.-H.; Lee, S.C.; Lee, E.-W. Lipid Metabolism and Ferroptosis. Biology 2021, 10, 184. [Google Scholar] [CrossRef] [Scilit]
- Liu, H.; Wang, J.; He, T.; Becker, S.; Zhang, G.; Li, D.; Ma, X. Butyrate: A Double-Edged Sword Health? Adv. Nutr. 2018, 9, 21–29. [Google Scholar] [CrossRef] [Scilit]
- Bury, T.M.; Sujith, R.I.; Pavithran, I.; Scheffer, M.; Lenton, T.M.; Anand, M.; Bauch, C.T. Deep Learning for Early Warning Signals of Tipping Points. Proc. Natl. Acad. Sci. USA 2021, 118, e2106140118. [Google Scholar] [CrossRef] [Scilit] [PubMed]
- Cheng, Z.; Lu, Y.-F.; He, Y.-X.; Wei, W.; Xie, Y.-X.; Lv, T.-S.; Wei, Y.; Lou, Y.; Yu, J.-Y.; Zhou, X.-Q. Integrated Serum Metabolomics Reveal Molecular Mechanism of Xietu Hemu Prescription on Metabolic Dysfunction-Associated Steatotic Liver Disease-Related Obesity. World J. Hepatol. 2025, 17, 113660. [Google Scholar] [CrossRef] [Scilit] [PubMed]
- Tu, J.; Zhang, J.; Chen, G. Higher Dietary Butyrate Intake Is Associated with Better Cognitive Function in Older Adults: Evidence from a Cross-Sectional Study. Front. Aging Neurosci. 2025, 17, 1522498. [Google Scholar] [CrossRef] [Scilit] [PubMed]
- Chandra, S.; Vassar, R.J. Gut Microbiome-derived Metabolites in Alzheimer’s Disease: Regulation of Immunity and Potential for Therapeutics. Immunol. Rev. 2024, 327, 33–42. [Google Scholar] [CrossRef] [Scilit]
- Bayazid, A.B.; Jang, Y.A.; Kim, Y.M.; Kim, J.G.; Lim, B.O. Neuroprotective Effects of Sodium Butyrate through Suppressing Neuroinflammation and Modulating Antioxidant Enzymes. Neurochem. Res. 2021, 46, 2348–2358. [Google Scholar] [CrossRef] [Scilit]
- Xu, Y.; Peng, S.; Cao, X.; Qian, S.; Shen, S.; Luo, J.; Zhang, X.; Sun, H.; Shen, W.L.; Jia, W. High Doses of Butyrate Induce a Reversible Body Temperature Drop through Transient Proton Leak in Mitochondria of Brain Neurons. Life Sci. 2021, 278, 119614. [Google Scholar] [CrossRef] [Scilit]
- Liu, S.; Liu, X.; Locasale, J.W. Quantitation of Metabolic Activity from Isotope Tracing Data Using Automated Methodology. Nat. Metab. 2024, 6, 2207–2209. [Google Scholar] [CrossRef] [Scilit]
- Shi, M.; Wang, C.; Ji, J.; Cai, Q.; Zhao, Q.; Xi, W.; Zhang, J. CRISPR/Cas9-Mediated Knockout of SGLT1 Inhibits Proliferation and Alters Metabolism of Gastric Cancer Cells. Cell. Signal. 2022, 90, 110192. [Google Scholar] [CrossRef] [Scilit]
- Chia, S.; Seow, J.J.W.; da Silva, R.P.; Suphavilai, C.; Shirgaonkar, N.; Murata-Hori, M.; Zhang, X.; Yong, E.Y.; Pan, J.; Thangavelu, M.T. CAN-Scan: A Multi-Omic Phenotype-Driven Precision Oncology Platform Identifies Prognostic Biomarkers of Therapy Response for Colorectal Cancer. Cell Rep. Med. 2025, 6, 102053. [Google Scholar] [CrossRef] [Scilit]

Disclaimer/Publisher’s Note: The statements, opinions and data contained in all publications are solely those of the individual author(s) and contributor(s) and not of MDPI and/or the editor(s). MDPI and/or the editor(s) disclaim responsibility for any injury to people or property resulting from any ideas, methods, instructions or products referred to in the content. |
© 2026 by the authors. Licensee MDPI, Basel, Switzerland. This article is an open access article distributed under the terms and conditions of the Creative Commons Attribution (CC BY) license.