


Simple Summary
Heating food ingredients can produce complex materials whose effects on human cells remain incompletely understood. We heated a mixture of the amino acid lysine and the fatty acid palmitic acid, characterized the water-dispersible material recovered, and examined its effects on human bone marrow-derived stem cells. The recovered material contained nanoscale structures and reduced a laboratory measure of cellular metabolic activity as exposure concentration and duration increased. Exposed cells also showed changes in shape, nuclear appearance, cell-cycle patterns, and the expression of genes associated with cellular stress and inflammation. A matched precursor preparation that omitted the high-temperature heating step did not significantly reduce metabolic activity. These findings show that the recovered heated preparation has biological activity under the tested laboratory conditions. This controlled model may help compare products formed during food-related heating reactions and prioritize further safety studies. Additional research is needed to determine whether similar effects occur after eating foods.
Abstract
The cellular effects of amino acid–fatty acid thermal reaction products remain incompletely characterized. We recovered a water-dispersible fraction after dry heating lysine and palmitic acid (200 °C, 20 min). We characterized the fraction, operationally termed lysine–palmitic acid-derived carbonaceous nanostructures (LP-CNSs), by microscopy, light scattering, spectroscopy, diffraction, and thermal analysis. Cellular effects were evaluated in human bone marrow-derived mesenchymal stem cells. The fraction exhibited excitation-dependent fluorescence, and X-ray diffraction indicated predominantly amorphous organization. Transmission electron microscopy showed nanoscale structures (mean diameter, 12.53 ± 7.69 nm), whereas the aqueous Z-average hydrodynamic diameter was 80.86 nm. Exposure reduced metabolic activity measured by the 3-(4,5-dimethylthiazol-2-yl)-2,5-diphenyltetrazolium bromide (MTT) assay, with fitted half-maximal inhibitory concentrations (IC50) of 152.70 and 90.91 µg/mL after 24 and 48 h, respectively. A matched precursor control prepared without the 200 °C step did not significantly reduce MTT metabolic activity. Exposed cells showed altered nuclear morphology, a larger sub-G1 fraction, and concentration-specific cell-cycle redistribution. Qualitative changes in JC-1 (J-aggregate-forming cationic dye) staining at 100 µg/mL were consistent with mitochondrial depolarization. Reverse-transcription quantitative polymerase chain reaction (PCR) revealed changes in SOD1, CAT, TP53, TNF, and IL1B mRNA levels. These injury-associated and transcriptional responses do not independently establish mitochondrial dysfunction or activation of inflammatory pathways. The findings support comparative toxicological evaluation of amino acid–fatty acid reaction products.
1. Introduction
Thermal processing improves food safety, sensory quality, digestibility, and shelf life. It also promotes dehydration, oxidation, condensation, polymerization, and molecular rearrangement [1,2]. In protein- and lipid-rich foods, amino groups react with lipid-derived carbonyls and oxidized intermediates, linking Maillard chemistry with lipid and protein oxidation [1,2,3,4,5]. These pathways may generate cross-linked, colloidal, or nanoscale products with physicochemical and biological properties that differ from those of their precursors.
Carbon dots and related carbonaceous nanostructures have been identified as unintended products in grilled fish, roasted salmon, fried breadcrumbs, toasted shrimp, roasted small yellow croaker, and thermally processed Spirulina [6,7,8,9,10,11]. Their morphology, aqueous dispersibility, ultraviolet absorption, fluorescence, and oxygen- or nitrogen-containing functionalities vary with precursor composition, heating conditions, purification, and dispersion medium [12,13,14]. Research has expanded from detection and optical characterization to gastrointestinal behavior, biomolecular interactions, cellular uptake, biodistribution, oxidative stress, mitochondrial responses, and effects on gut microbiota. These findings underscore the importance of integrating physicochemical characterization with biological evaluation [10,12,13,15,16].
Whole-food studies establish the occurrence of thermally generated nanoscale products, but the complexity of food matrices complicates attribution to specific precursor combinations. Defined model systems include carbohydrate–amino acid mixtures [12] and heated starch–myristic acid preparations evaluated in THP-1 cells [17]. More recently, glycine–stearic acid-derived preparations were examined in human mesenchymal stem cells [18], and oleic acid–histidine and oleic acid–glutamine reaction products were investigated in THP-1-derived macrophages [19]. Building on these models, the present study integrates a matched lysine–palmitic acid precursor control prepared without the 200 °C step for MTT analysis with complementary assessments of cellular and nuclear injury, sub-G1/cell-cycle distribution, and reverse-transcription quantitative PCR (RT-qPCR) analysis of SOD1, CAT, TP53, TNF, and IL1B in human bone marrow-derived mesenchymal stem cells (hBM-MSCs).
Lysine and palmitic acid provide a chemically tractable binary model. Lysine contains α- and ε-amino groups and is susceptible to carbonyl-mediated modification and heat-induced loss of nutritional availability [20]. Palmitic acid is abundant in foods and biological lipid pools [21]. Fatty acid–lysine salts can self-assemble, and N-palmitoyl lysine has been synthesized using catalysts and solvents [22,23]. These preparation routes differ from direct dry heating of the free precursors. Direct dry heating therefore offers a defined amino acid–fatty acid model for examining the formation of water-dispersible nanoscale products.
The effects of nanoscale materials depend on their size, aggregation, functional groups, and biomolecular interactions in the exposure medium [24]. hBM-MSCs provide a non-tumor cell model in which metabolic, nuclear, mitochondrial, and cell-cycle responses can be evaluated together. Previous studies have used mesenchymal and other human cells to investigate carbonaceous, metal-oxide, and food-associated nanoscale materials [25,26,27,28,29,30]. Here, hBM-MSCs serve as a comparative model of cellular toxicity. This in vitro model neither reproduces gastrointestinal exposure nor establishes transport of the recovered material to bone marrow.
We hypothesized that a water-dispersible fraction recovered from dry-heated lysine and palmitic acid would reduce hBM-MSC metabolic activity and produce accompanying signs of cellular injury. We prepared and characterized lysine–palmitic acid-derived carbonaceous nanostructures (LP-CNSs) and compared their metabolic effects with those of a matched precursor preparation lacking the 200 °C dry-heating step. We also examined nuclear morphology, mitochondrial staining, DNA-content distribution, and the expression of SOD1, CAT, TP53, TNF, and IL1B. Our aim was to define the cellular response profile of this thermal fraction while distinguishing observed injury endpoints from mechanistic interpretations requiring independent validation.
2. Materials and Methods
2.1. Materials and Reagents
L-Lysine and palmitic acid were purchased from Alpha Chemika (Mumbai, India). Dimethyl sulfoxide (DMSO), 3-(4,5-dimethylthiazol-2-yl)-2,5-diphenyltetrazolium bromide (MTT), acridine orange (AO), ethidium bromide (EB), Hoechst 33342, propidium iodide (PI), and JC-1 were purchased from Sigma-Aldrich (St. Louis, MO, USA). Dulbecco’s modified Eagle medium (DMEM), fetal bovine serum (FBS), phosphate-buffered saline (PBS), penicillin–streptomycin, and trypsin–ethylenediaminetetraacetic acid (trypsin–EDTA) were purchased from Invitrogen (Carlsbad, CA, USA). QuantiTect Primer Assays, RNase A, the FastLane Cell cDNA Kit, and the QuantiFast SYBR Green PCR Kit were obtained from QIAGEN (Hilden, Germany). Unless otherwise specified, deionized water was used to prepare all aqueous dispersions and solutions.
2.2. Preparation and Enrichment of the Lysine–Palmitic Acid Thermal Fraction
LP-CNSs were generated by dry heating an equimolar lysine–palmitic acid precursor mixture. Palmitic acid (5.00 g, 19.50 mmol) and L-lysine (2.85 g, 19.50 mmol) were combined at a 1:1 molar ratio and dispersed in 50 mL of deionized water. The mixture was stirred at 600 rpm and 60 °C for 1 h and then probe-sonicated for 5 min at 40% amplitude. Sonication was performed using a VCX 750 ultrasonic processor (Sonics & Materials, Inc., Newtown, CT, USA; 20 kHz; maximum rated output, 750 W).
The suspension was transferred to polytetrafluoroethylene-coated dishes and placed in a forced-air convection oven (UF55, Memmert GmbH + Co. KG, Schwabach, Germany). The temperature was gradually increased to 80 °C to remove water. Once the water had evaporated completely, the oven temperature was increased to 200 °C. The dried precursor mixture was maintained at 200 °C for 20 min after the oven reached the target temperature.
After dry heating, the product was cooled to room temperature and resuspended in 50 mL of deionized water. Insoluble material and large aggregates were removed by centrifugation at 10,000 rpm (approximately 9390× g) for 10 min using a Z 32 HK centrifuge (HERMLE Labortechnik GmbH, Wehingen, Germany) equipped with a 6 × 50 mL rotor (Z326-0650-HS). The supernatant was passed through a 0.22-µm hydrophilic polyethersulfone (PES) syringe filter (Millex-GP, 33 mm, Merck Millipore Ltd., Carrigtwohill, Co. Cork, Ireland) to recover the water-dispersible fraction.
The filtrate was dialyzed against 1 L of distilled water for 24 h at room temperature using a regenerated-cellulose membrane with a molecular-weight cutoff (MWCO) of 3500 Da (Spectra/Por, Repligen Corporation, Waltham, MA, USA). The external dialysis water was replaced three times to facilitate the removal of low-molecular-weight soluble reaction products. The dialyzed dispersion was freeze-dried for 72 h using a FreeZone 2.5 Plus freeze dryer (Labconco Corporation, Kansas City, MO, USA) at a collector temperature of approximately −80 °C.
Gravimetric mass recovery was calculated as the mass of the final freeze-dried fraction divided by the total initial precursor mass (7.85 g: 5.00 g of palmitic acid and 2.85 g of L-lysine) and multiplied by 100. The three independent preparation batches yielded 0.712, 0.865, and 0.924 g of freeze-dried material. The mean recovered mass was 0.834 ± 0.109 g, corresponding to a mass recovery of 10.62 ± 1.39% (mean ± SD, n = 3).
This recovery represents the entire thermal fraction. These data quantify between-batch variation in mass recovery but do not establish equivalent chemical compositions or particle-size distributions across batches. The recovered material was used for physicochemical characterization and cellular experiments.
Throughout this study, the term LP-CNSs denotes the heterogeneous, water-dispersible thermal fraction recovered after dry heating the lysine–palmitic acid precursor system, followed by centrifugation, 0.22-µm filtration, dialysis, and freeze-drying. This operational designation identifies the tested preparation without implying chemical homogeneity or an exclusively particulate composition. Nominal exposure concentrations refer to the mass of the recovered freeze-dried fraction.
2.3. Physicochemical Characterization of LP-CNSs
2.3.1. Transmission Electron Microscopy and Dynamic Light Scattering
The morphology and dry-state particle-size distribution of LP-CNSs were examined by transmission electron microscopy (TEM; JEM-1400 Flash, JEOL, Tokyo, Japan) at an accelerating voltage of 100 kV. LP-CNSs were ultrasonically dispersed in deionized water, deposited onto carbon-coated copper grids, air-dried, and imaged. Particle sizes were determined by measuring 153 individual nanostructures across at least three representative TEM micrographs from a single preparation, using ImageJ software (version 1.48v; National Institutes of Health, Bethesda, MD, USA).
The hydrodynamic diameter and polydispersity index (PDI) were measured at 25 °C by dynamic light scattering (DLS; Zetasizer Nano ZS90, Malvern Instruments, Malvern, UK). LP-CNSs were dispersed in deionized water at 0.4 mg/mL and sonicated for 5 min. One dispersion was prepared for DLS and measured three times immediately after preparation. Hydrodynamic size was reported as the Z-average diameter together with the corresponding PDI. These measurements provided baseline information on hydrodynamic size and polydispersity in water to complement the TEM observations.
2.3.2. Optical and Fourier-Transform Infrared Spectroscopic Characterization
Ultraviolet–visible–near-infrared (UV–Vis–NIR) absorption spectra were recorded over 200–800 nm using a Cary 5000 spectrophotometer (Agilent Technologies, Santa Clara, CA, USA). Fluorescence emission spectra were recorded at excitation wavelengths of 290–490 nm using a Cary Eclipse fluorescence spectrophotometer (Agilent Technologies).
The functional-group profiles of LP-CNSs and the corresponding untreated precursors were examined by Fourier-transform infrared (FTIR) spectroscopy using a Cary 630 spectrometer (Agilent Technologies). Spectra were acquired over 4000–650 cm−1 using four sample scans and four background scans at a spectral resolution of 16 cm−1. The major absorption regions and overall spectral profiles were compared qualitatively across preparations.
2.3.3. Raman Spectroscopy, X-Ray Diffraction, and Thermogravimetric Analysis
Raman spectra of dried LP-CNSs were acquired using an NRS-4500 laser Raman spectrometer (JASCO Corporation, Tokyo, Japan) with a 532 nm excitation laser operated at 1.6 mW. Spectra were collected over 100–3000 cm−1 with an exposure time of 10 s and three accumulations per measurement. Spectral peaks were fitted, and their integrated areas were analyzed using Spectra Manager Ver. 2 (JASCO Corporation, Tokyo, Japan). The fitted features centered at 1342.82 and 1678.17 cm−1 were used to calculate the integrated-area ratio A1343/A1678.
X-ray diffraction (XRD) patterns were obtained using a DMAX 2100 diffractometer (Rigaku Corporation, Tokyo, Japan) with Cu Kα radiation (λ = 0.154056 nm). The instrument was operated at 40 kV and 30 mA. Data were collected over a 2θ range of 5–60° with a step size of 0.02° and a scan rate of 2°/min.
Thermogravimetric analysis (TGA) and derivative thermogravimetric (DTG) analysis were performed using a TGA Q500 system (TA Instruments, New Castle, DE, USA). Samples were heated from 28 to 500 °C at 10 °C/min under nitrogen. The balance and sample purge-flow rates were 40.0 and 60.0 mL/min, respectively.
2.4. Cell Culture and Preparation of Exposure Dispersions
Normal human bone marrow-derived mesenchymal stem cells (hBM-MSCs; PCS-500-012) were obtained from the American Type Culture Collection (ATCC, Manassas, VA, USA). Cells were cultured in DMEM supplemented with 10% (v/v) FBS, 100 U/mL penicillin, and 100 µg/mL streptomycin at 37 °C in a humidified atmosphere containing 5% CO2. The medium was replaced every 2–3 days. Cells were passaged using 0.25% trypsin–EDTA at 70–80% confluence. Cells at passages 3–6 were used in all experiments.
Immediately before exposure, freeze-dried LP-CNSs were dispersed in the sterile culture medium described above at the required concentrations and sonicated for 5 min. The freshly prepared dispersions were used immediately under aseptic conditions.
2.5. MTT Assay of Cellular Metabolic Activity
The effects of LP-CNS exposure on cellular metabolic activity were evaluated using the MTT assay [31]. hBM-MSCs were seeded in 96-well plates at 1 × 10⁴ cells/well and allowed to attach for 24 h. Cells were then exposed to 0 (medium alone; untreated control), 25, 50, 100, 200, or 400 µg/mL LP-CNSs for 24 or 48 h. Corresponding cell-free wells were included for blank correction.
A matched lysine–palmitic acid precursor control was prepared as described in Section 2.2, with the 200 °C dry-heating step omitted. The unheated preparation underwent the same centrifugation, 0.22-µm hydrophilic PES filtration, dialysis through a 3500-Da MWCO membrane, and freeze-drying procedures as the heated preparation. For both preparations, nominal concentrations were calculated from the mass of recovered freeze-dried material per unit volume of culture medium. The preparations were evaluated in parallel.
At the end of each exposure period, 20 µL of MTT solution (5 mg/mL in PBS) was added to each well, followed by incubation for 4 h at 37 °C. The medium was removed, and the formazan crystals were dissolved in 200 µL of DMSO. Absorbance was measured at 570 nm with a reference wavelength of 630 nm using a microplate reader (BioTek, Winooski, VT, USA). Absorbance was blank-corrected using the corresponding cell-free wells and normalized to the untreated control as follows:
Here, OD denotes optical density, and the blank terms refer to the corresponding cell-free wells. The assay was conducted in three independent biological experiments with technical replicate wells for each condition.
2.6. Bright-Field Morphological Examination
hBM-MSCs were seeded in 24-well plates at 5 × 10⁴ cells/well and allowed to attach for 24 h. Cells were then exposed to 0, 50, or 100 µg/mL LP-CNSs for 24 h. Morphology was examined using an Axiovert 40 CFL inverted microscope (Carl Zeiss, Oberkochen, Germany) equipped with an AxioCam digital camera. At least three randomly selected fields per condition were examined using matched image-acquisition settings. Cell shape, spreading, confluence, rounding, and detachment were evaluated qualitatively.
2.7. Acridine Orange/Ethidium Bromide Staining
Cell-death-associated morphological changes were evaluated by acridine orange/ethidium bromide (AO/EB) double staining as previously described [32]. hBM-MSCs were seeded in 24-well plates at 5 × 10⁴ cells/well, allowed to attach for 24 h, and exposed to 0, 50, or 100 µg/mL LP-CNSs for a further 24 h. Cells were then incubated for 5 min at room temperature with a staining solution containing 100 µg/mL of each dye in PBS. Stained cells were examined immediately using an Axiovert 40 CFL fluorescence microscope.
Cells showing uniformly green nuclei were classified as viable. Bright-green nuclei with condensed chromatin were considered consistent with early apoptotic morphology. Orange-red nuclei with condensed or fragmented chromatin were interpreted as showing late apoptotic morphology, whereas orange-red nuclei with an intact nuclear structure were considered consistent with necrotic morphology.
2.8. Hoechst 33342 Nuclear Staining
Nuclear morphology was further examined using Hoechst 33342 staining [33]. After exposure to 0, 50, or 100 µg/mL LP-CNSs for 24 h, hBM-MSCs were washed with PBS and incubated with 1 µg/mL Hoechst 33342 for 15 min at room temperature in the dark. Cells were washed again with PBS and examined under ultraviolet illumination using an Axiovert 40 CFL fluorescence microscope. Nuclear condensation, shrinkage, and fragmentation were evaluated as morphological indicators of treatment-associated nuclear damage.
2.9. Assessment of Mitochondrial Membrane Potential
Changes in mitochondrial membrane potential (ΔΨm) were assessed using JC-1 staining [34,35]. hBM-MSCs were seeded in 24-well plates at 5 × 10⁴ cells/well and exposed to 0, 50, or 100 µg/mL LP-CNSs for 24 h. Cells were incubated with 10 µg/mL JC-1 for 20 min at 37 °C in the dark, washed with PBS, and examined immediately by fluorescence microscopy using matched acquisition settings.
Predominantly red-orange fluorescence from JC-1 aggregates was considered consistent with preserved mitochondrial polarization, whereas increased green fluorescence from JC-1 monomers was considered consistent with depolarization. Changes in these fluorescence patterns were assessed qualitatively from the microscopy images.
2.10. Cell-Cycle Distribution and Sub-G1 Analysis
Cell-cycle distribution and sub-G1 accumulation were assessed by propidium iodide flow cytometry [36]. hBM-MSCs were seeded in 6-well plates at 1 × 10⁵ cells/well and allowed to attach for 24 h. Cells were then exposed to 0, 50, or 100 µg/mL LP-CNSs for 24 h, harvested by trypsinization, and washed with PBS. The harvested cells were fixed in ice-cold 70% (v/v) ethanol at 4 °C for at least 16 h. Fixed cells were washed and incubated with 50 µg/mL propidium iodide and 100 µg/mL RNase A for 15 min at 37 °C in the dark.
Samples were analyzed using a CytoFLEX flow cytometer (Beckman Coulter, Brea, CA, USA), with excitation at 488 nm and fluorescence detection through a 610/20-nm filter. At least 10,000 singlet events were acquired per sample after doublet exclusion. CytExpert software (version 2.6; Beckman Coulter, Brea, CA, USA) was used to determine the percentages of cells in the sub-G1 (APOP), G0/G1, S, and G2/M populations. All percentages were calculated relative to the total gated singlet population. Sub-G1 events were included in the denominator when calculating the G0/G1, S, and G2/M fractions. Three independent biological experiments were performed.
2.11. RT-qPCR Analysis
Expression of selected genes associated with oxidative stress, apoptosis, and inflammation was assessed by reverse-transcription quantitative PCR (RT-qPCR). After exposure to 0, 50, or 100 µg/mL LP-CNSs for 24 h, hBM-MSCs were lysed and cDNA was synthesized using the FastLane Cell cDNA Kit (QIAGEN, Hilden, Germany), following the manufacturer’s instructions.
Quantitative PCR was performed using the QuantiFast SYBR Green PCR Kit and QuantiTect Primer Assays (QIAGEN) on an ABI 7500 Fast Real-Time PCR System (Applied Biosystems, Foster City, CA, USA). Thermal cycling comprised initial activation at 95 °C for 5 min, followed by 40 cycles of denaturation at 95 °C for 10 s and combined annealing/extension at 60 °C for 30 s. The target genes were SOD1, CAT, TP53, TNF, and IL1B. GAPDH was used as the sole endogenous reference gene for normalization across treatment groups.
Assay information is provided in Table S1. Relative expression was calculated using the 2−ΔΔCt method, with the untreated control as the calibrator [37]. Three independent cellular experiments were performed, and each sample was analyzed in technical triplicate.
2.12. Statistical Analysis
Statistical analyses were performed using GraphPad Prism version 10.6.1 (GraphPad Software, Boston, MA, USA). Data are presented as mean ± standard deviation (SD) from three independent cellular experiments (n = 3), all conducted using material from a single LP-CNS preparation batch. Technical triplicates were included within each experiment where applicable.
Statistical significance was assessed by one-way analysis of variance (ANOVA), followed by Dunnett’s multiple-comparisons test against the corresponding untreated control. MTT data were analyzed separately for each exposure duration. Each cell-cycle population was also analyzed separately. RT-qPCR comparisons were performed on ΔCt values, whereas relative expression is presented as 2−ΔΔCt fold change. A value of p < 0.05 was considered statistically significant.
Half-maximal inhibitory concentrations (IC50) and 95% confidence intervals were estimated separately for each exposure duration by unweighted nonlinear regression. A sigmoidal concentration–response model was fitted to the individual biological experiment-level responses at each concentration. The upper asymptote was fixed at 100%, corresponding to activity normalized to the untreated control. The lower asymptote was fixed at 0%, representing a theoretical minimum of the blank-corrected response. These constraints were applied at both exposure durations, with IC50 and Hill slope as the two fitted parameters. Fixing the lower asymptote at 0% was a modeling assumption; a lower plateau was not established experimentally within the tested concentration range. Each fit used 18 observations, three at each of six concentrations including the untreated control. The 95% confidence intervals describe uncertainty in the pooled IC50 estimate under these constraints.
3. Results
3.1. Physicochemical Characteristics of LP-CNSs
3.1.1. Morphology and Particle Size in Dry and Aqueous States
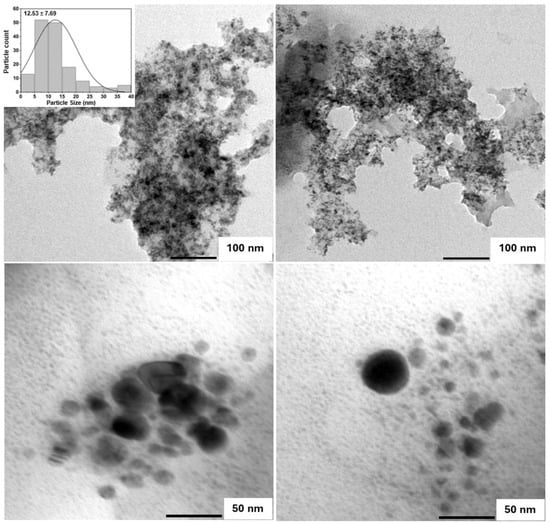
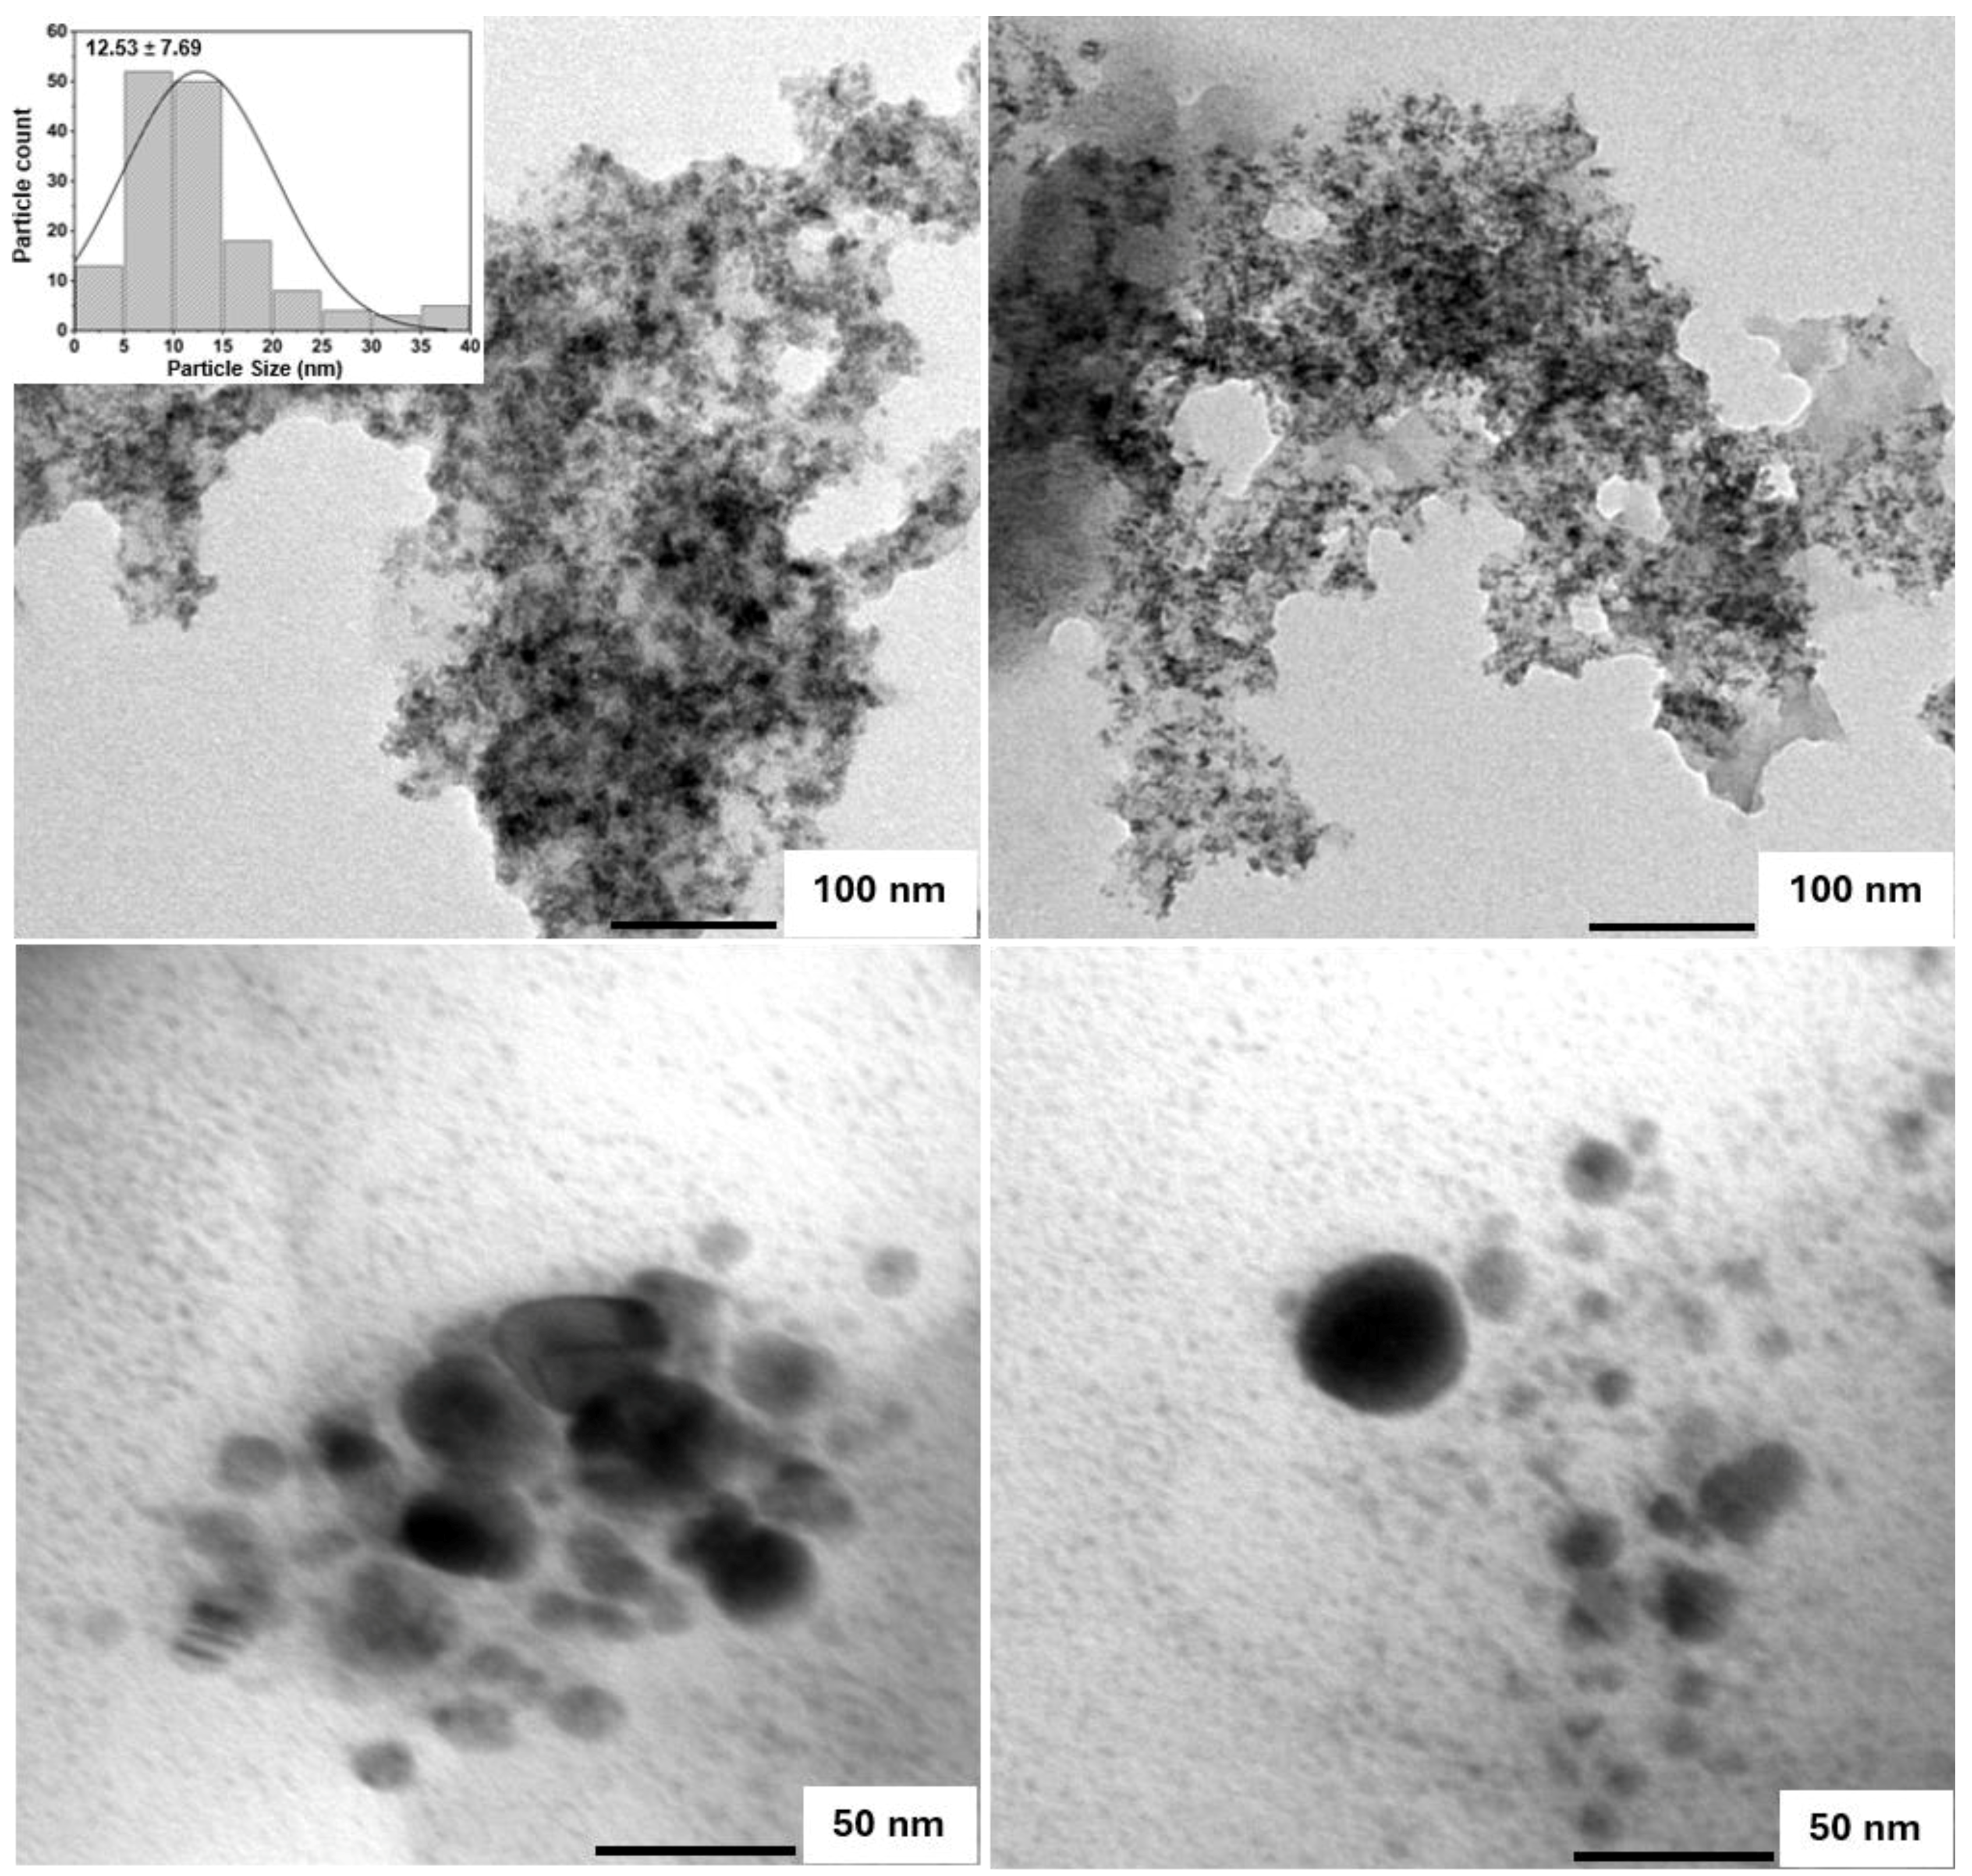
TEM revealed predominantly quasi-spherical structures with distinguishable particle boundaries (Figure 1). Analysis of 153 particles yielded a diameter range of 1.44–38.63 nm, a mean of 12.53 ± 7.69 nm, and a median of 10.32 nm. These measurements describe the nanoscale dimensions and dry-state size variation in the imaged structures.
Figure 1.
Representative transmission electron microscopy (TEM) images and TEM-derived particle-size distribution of lysine–palmitic acid-derived carbonaceous nanostructures (LP-CNSs). The distribution was obtained from 153 particles with a mean diameter of 12.53 ± 7.69 nm (mean ± standard deviation, SD). Scale bars represent 100 nm in the upper panels and 50 nm in the lower panels.
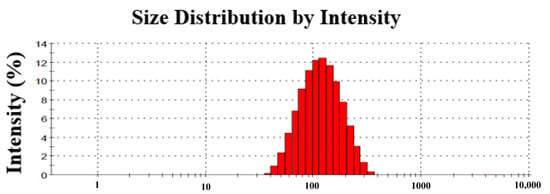
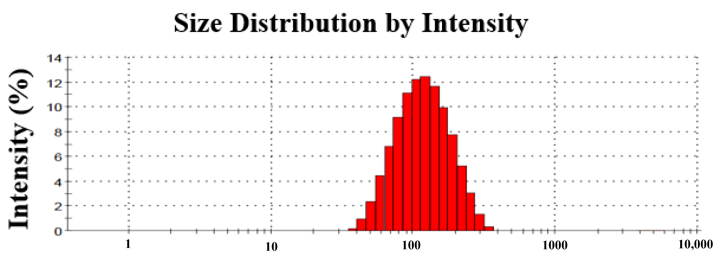
In deionized water at 0.4 mg/mL, LP-CNSs had a Z-average hydrodynamic diameter of 80.86 nm and a PDI of 0.240 (Figure 2).
Figure 2.
Intensity-weighted dynamic light scattering (DLS) size distribution of LP-CNSs dispersed in deionized water at 0.4 mg/mL and measured at 25 °C. The Z-average hydrodynamic diameter was 80.86 nm, and the polydispersity index was 0.240.
3.1.2. Absorption and Fluorescence Properties
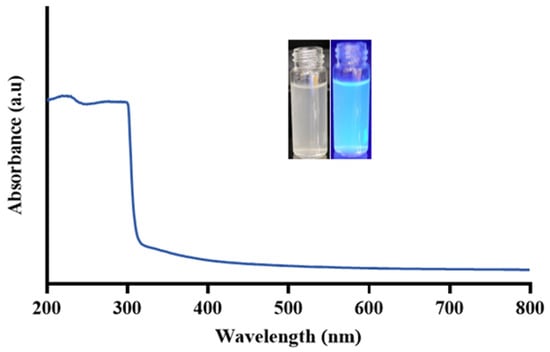
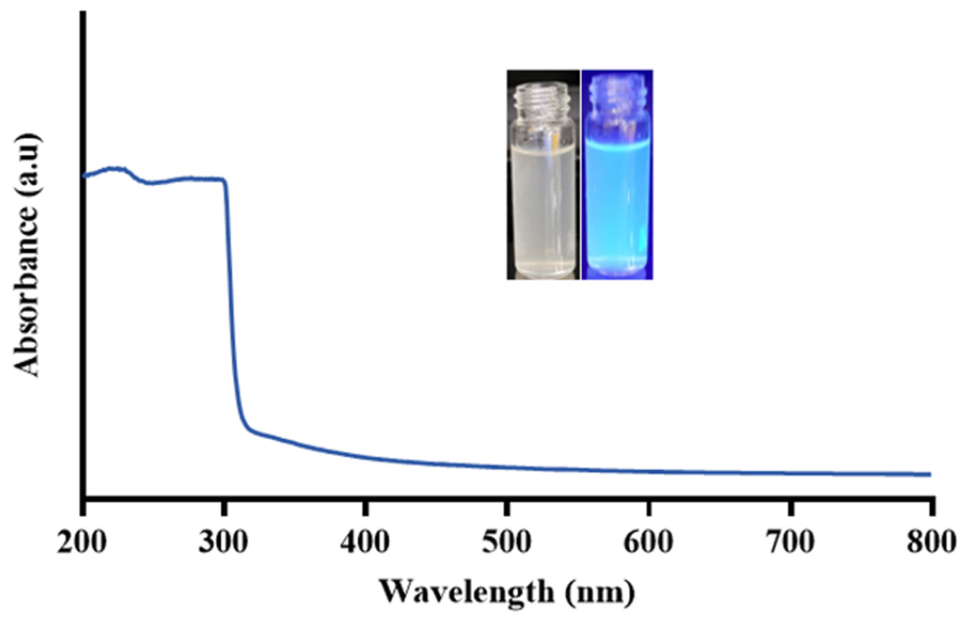
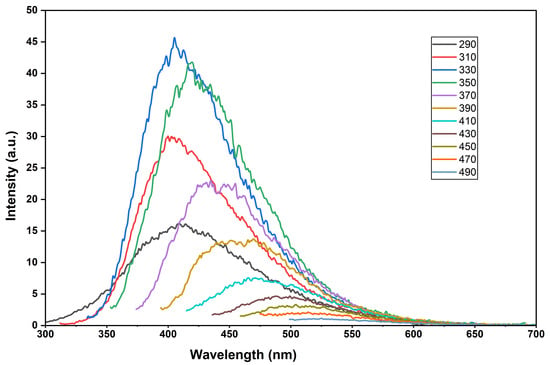
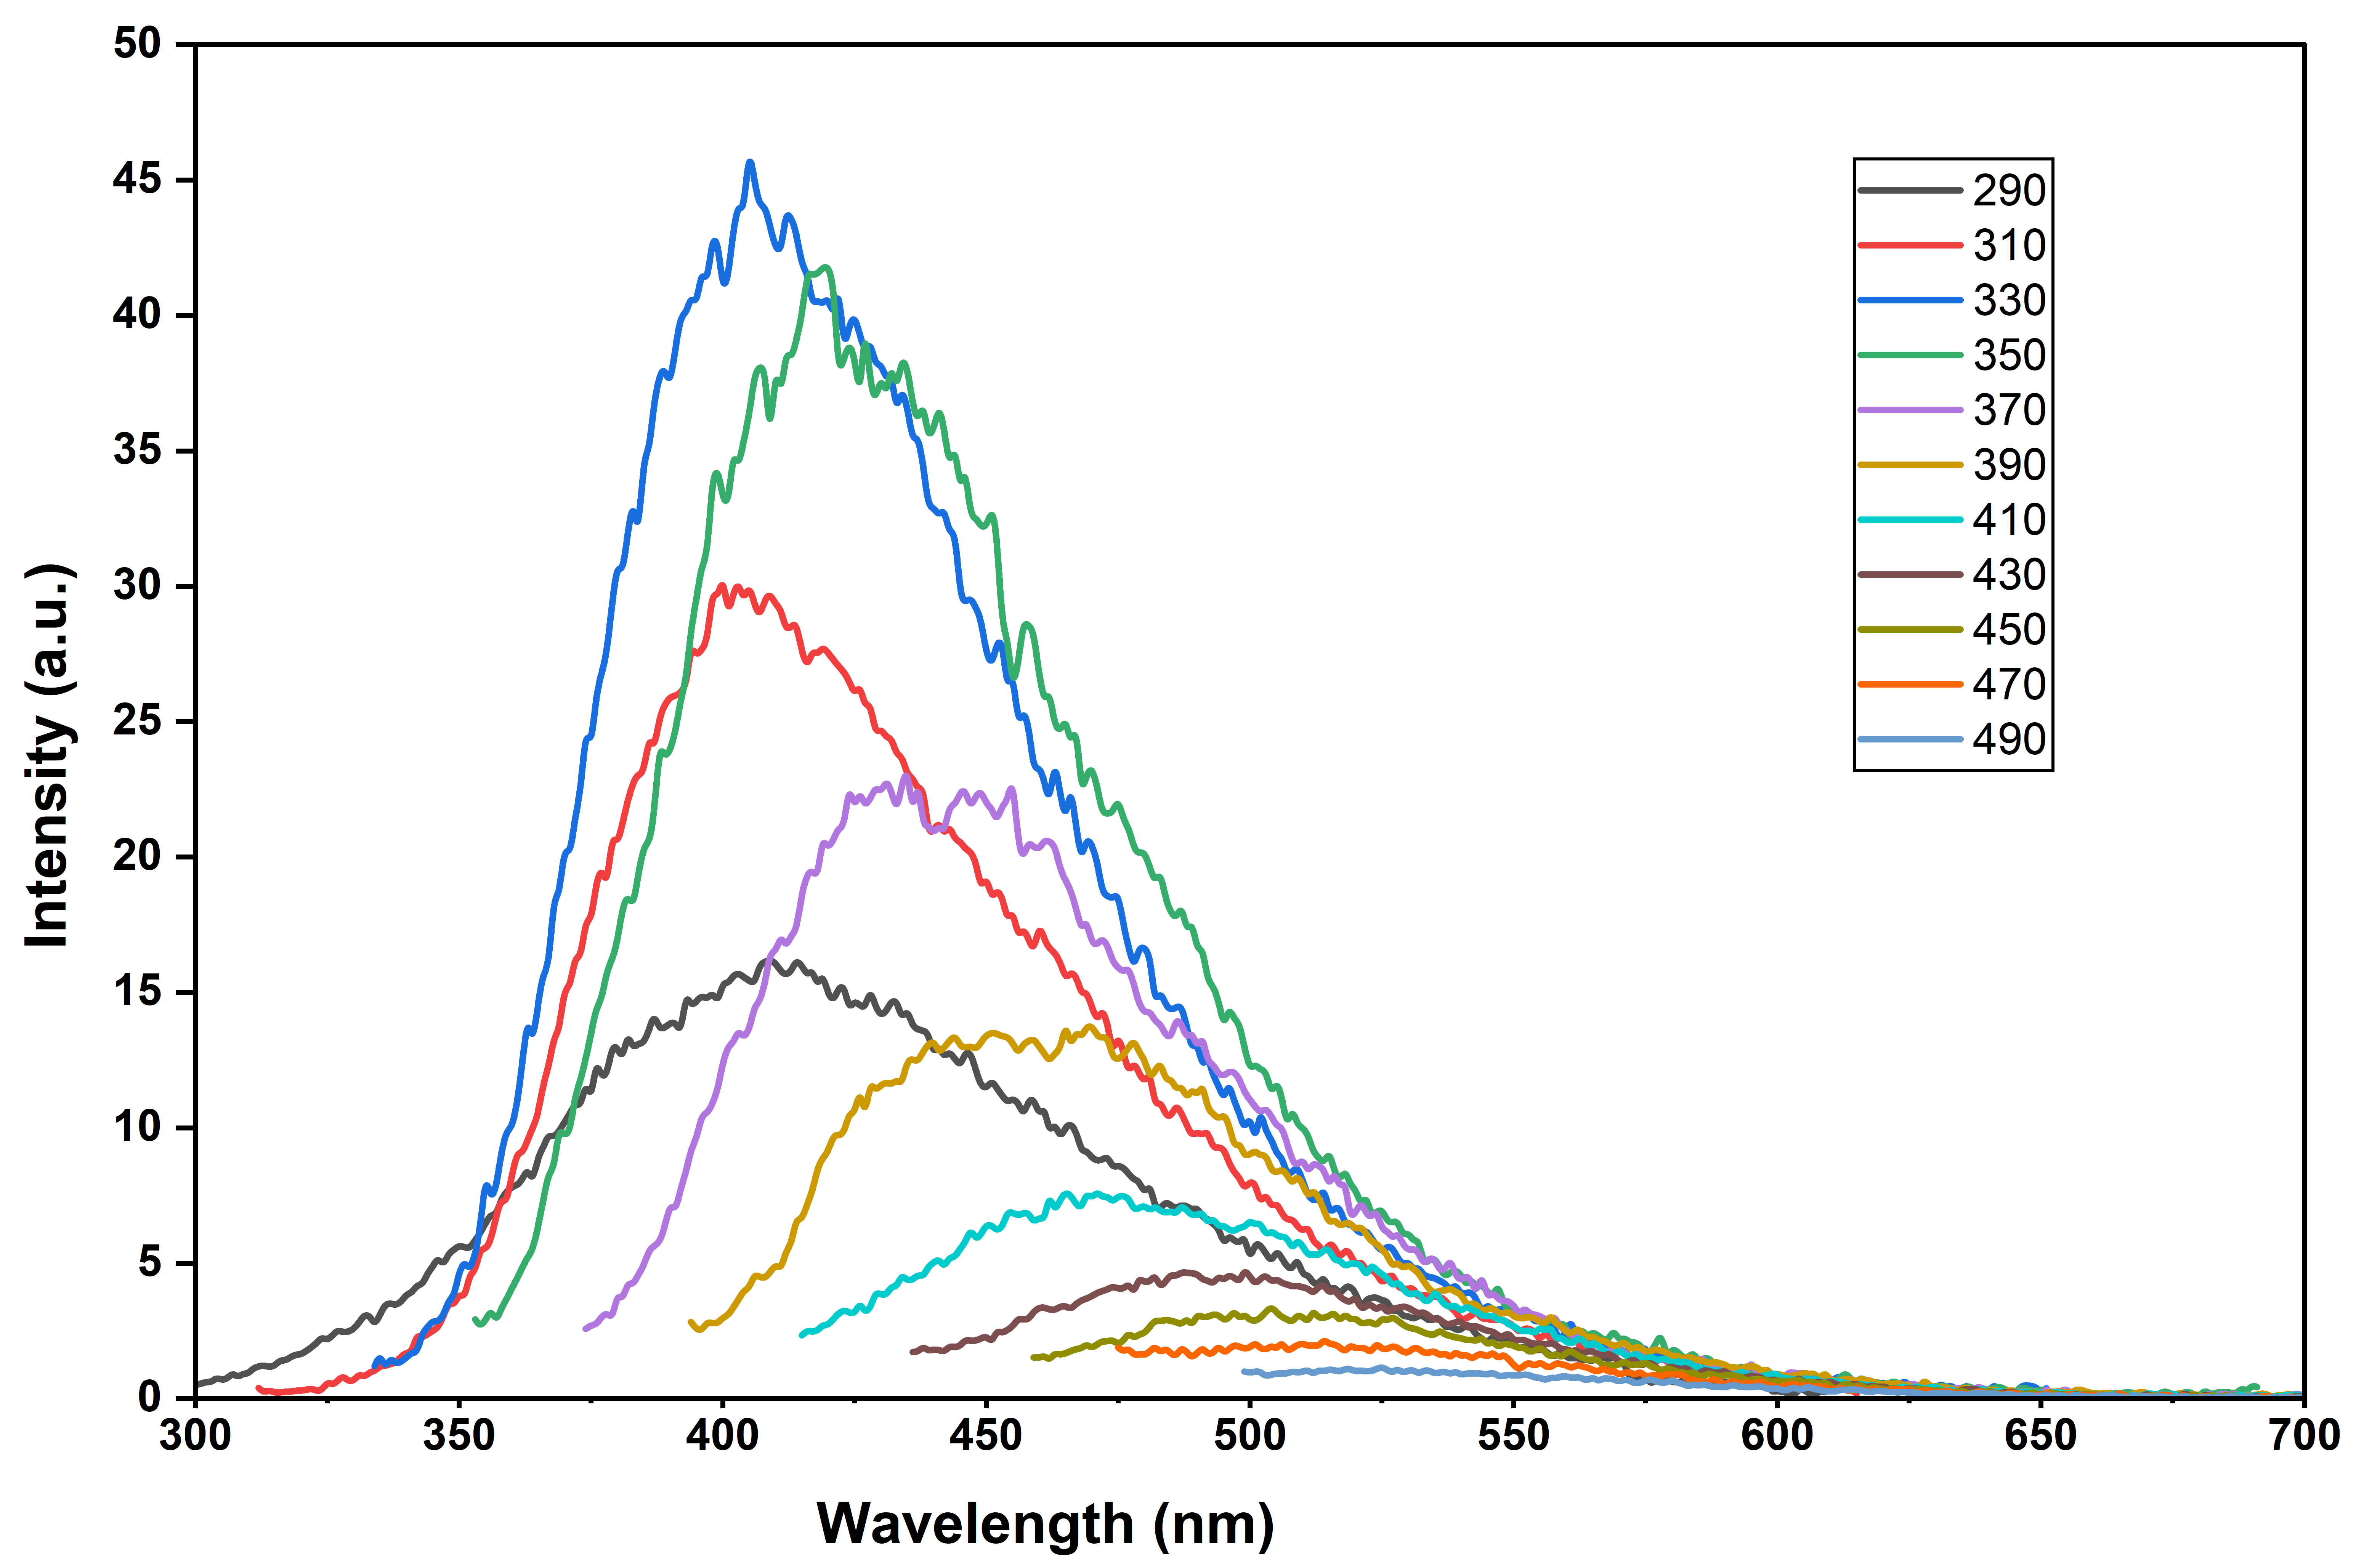
LP-CNSs showed strong, broad absorption at 200–300 nm, followed by a marked decrease beyond approximately 300 nm and a tail extending to 800 nm (Figure 3). Fluorescence emission depended on the excitation wavelength over the investigated range of 290–490 nm (Figure 4). The maximum recorded emission intensity was approximately 46.3 arbitrary units at an excitation wavelength of approximately 330 nm, with an emission maximum near 405 nm. The emission maximum shifted progressively toward longer wavelengths as the excitation wavelength increased.
Figure 3.
Ultraviolet–visible–near-infrared (UV–Vis–NIR) absorption spectrum of LP-CNSs. The inset shows the aqueous dispersion under visible light (left) and ultraviolet illumination at 365 nm (right).
Figure 4.
Excitation-dependent fluorescence emission spectra of LP-CNSs recorded at excitation wavelengths of 290–490 nm.
3.1.3. Functional Groups and Precursor Transformation
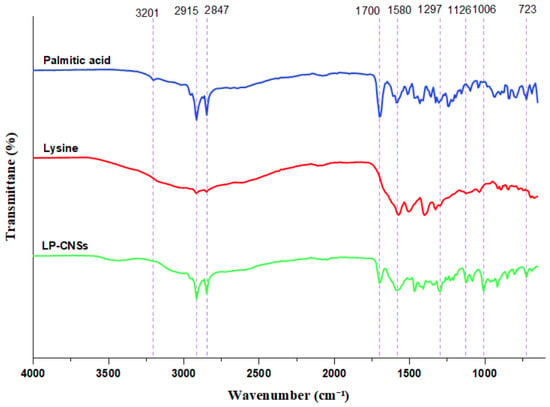
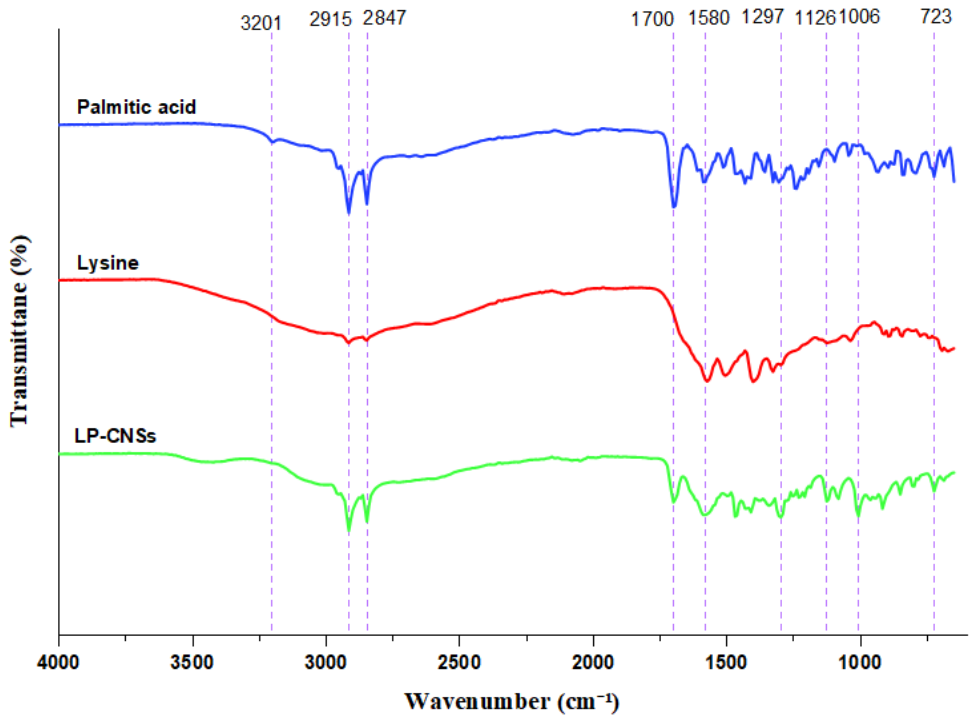
The FTIR profiles of LP-CNSs differed from those of untreated palmitic acid and L-lysine (Figure 5). Palmitic acid showed prominent aliphatic C–H stretching bands, whereas lysine exhibited a distinct pattern of features associated with polar groups and the fingerprint region. LP-CNSs retained strong aliphatic bands at approximately 2915 and 2848 cm−1 and a carbonyl-region band near 1700 cm−1. The LP-CNS spectrum also showed a feature near 1580 cm−1 and bands at approximately 1469, 1297, 1126, 1006, and 723 cm−1.
Figure 5.
Fourier-transform infrared (FTIR) spectra of untreated palmitic acid, untreated L-lysine, and thermally generated LP-CNSs. Spectra are vertically offset for clarity.
3.1.4. Predominantly Amorphous Organization
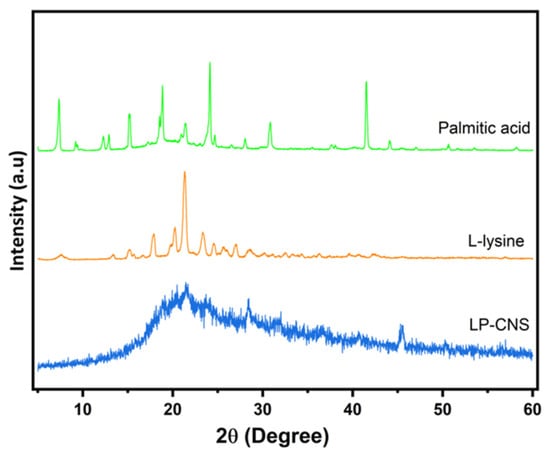
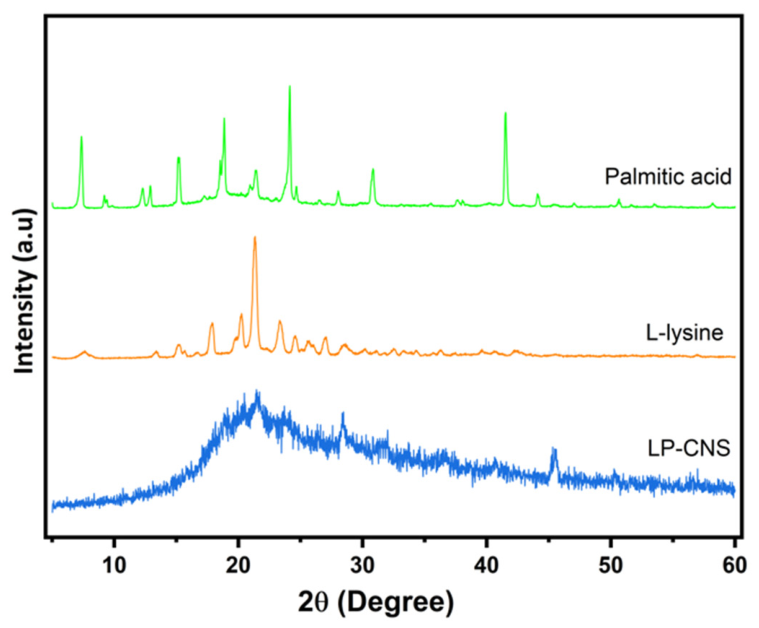
The untreated precursors exhibited multiple sharp diffraction peaks. In contrast, LP-CNSs showed diffuse scattering over the measured 5–60° 2θ range, with a broad feature near 21.5° 2θ (Figure 6). Prominent precursor reflections were not evident in the recovered material. This profile is consistent with predominantly amorphous organization and reduced long-range order relative to the crystalline starting compounds.
Figure 6.
X-ray diffraction (XRD) patterns of untreated palmitic acid, untreated L-lysine, and thermally generated LP-CNSs.
3.1.5. Thermal Decomposition Profile
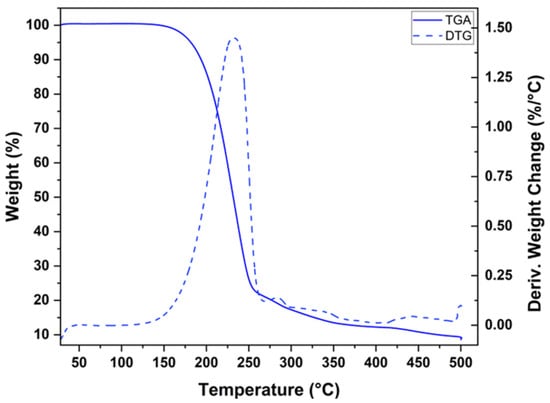
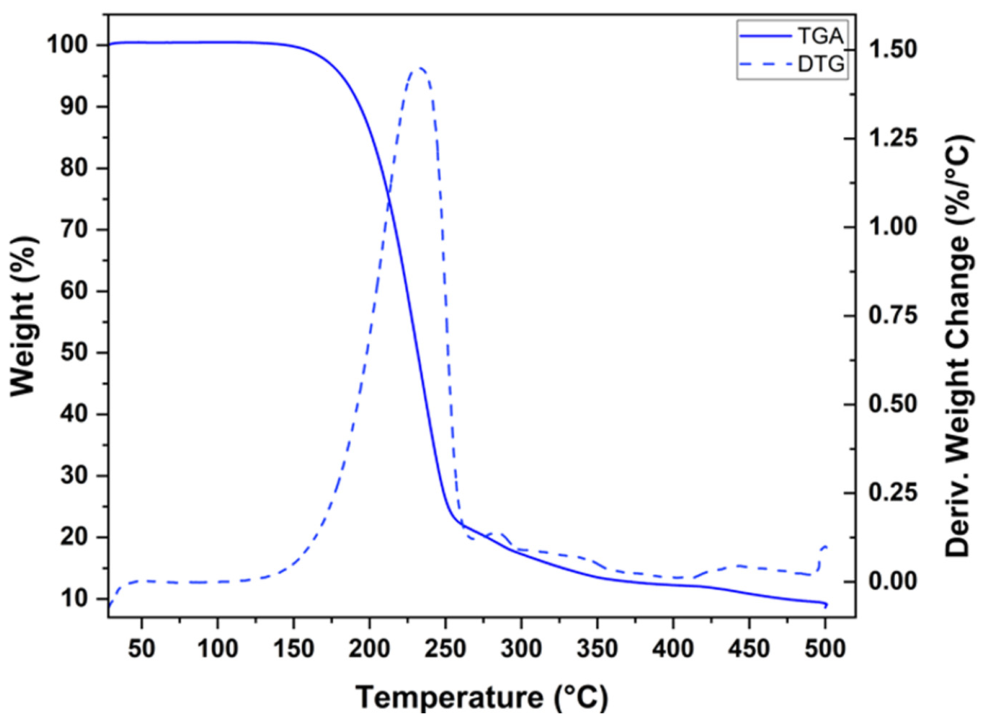
Under nitrogen, LP-CNSs lost approximately 90.74% of their mass, leaving a residue of 9.26% at 500 °C (Figure 7). Mass losses in the four temperature intervals were 0.21% at 28–150 °C, 73.83% at 150–260 °C, 13.73% at 260–400 °C, and 2.97% at 400–500 °C. The main decomposition event occurred between 150 and 260 °C, with the DTG maximum at approximately 232.6 °C.
Figure 7.
Thermogravimetric analysis (TGA) and derivative thermogravimetric (DTG) profiles of LP-CNSs under nitrogen.
3.1.6. Raman Spectral Features
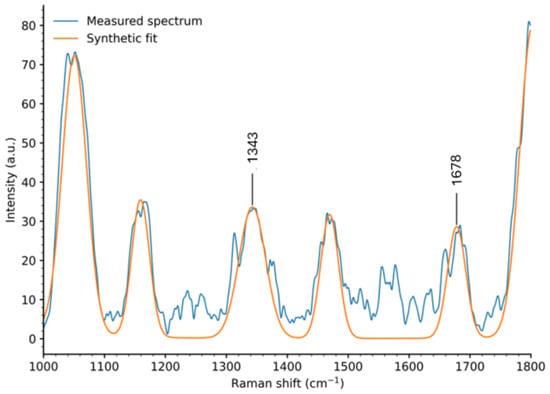
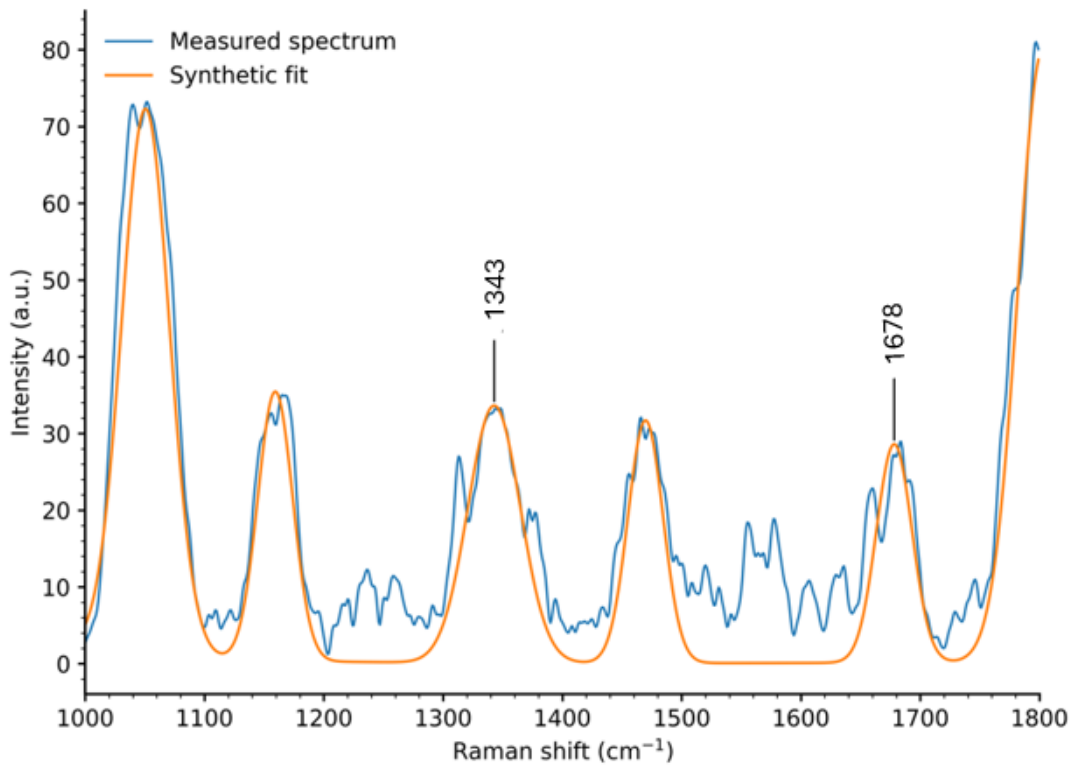
Raman spectroscopy resolved fingerprint-region features at 1342.82, 1469.69, and 1678.17 cm−1 (Figure 8). The integrated-area ratio of the fitted features near 1343 and 1678 cm−1 was 1.73 (A1343/A1678). This empirical ratio reflects their relative integrated intensities under the stated measurement and fitting conditions. Additional features occurred at 2648.17, 2762.66, and 2907.96 cm−1. The full spectrum is presented in Figure S1.
Figure 8.
Raman spectrum of LP-CNSs showing the principal fitted vibrational features. The integrated-area ratio of the fitted features near 1343 and 1678 cm−1 was 1.73 (A1343/A1678). This empirical ratio describes their relative integrated areas and is not interpreted as a conventional carbon D/G-band ratio.
3.2. Concentration-Dependent Reduction in Cellular Metabolic Activity at 24 and 48 h
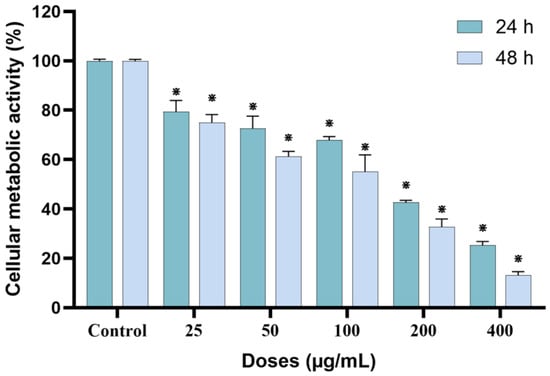
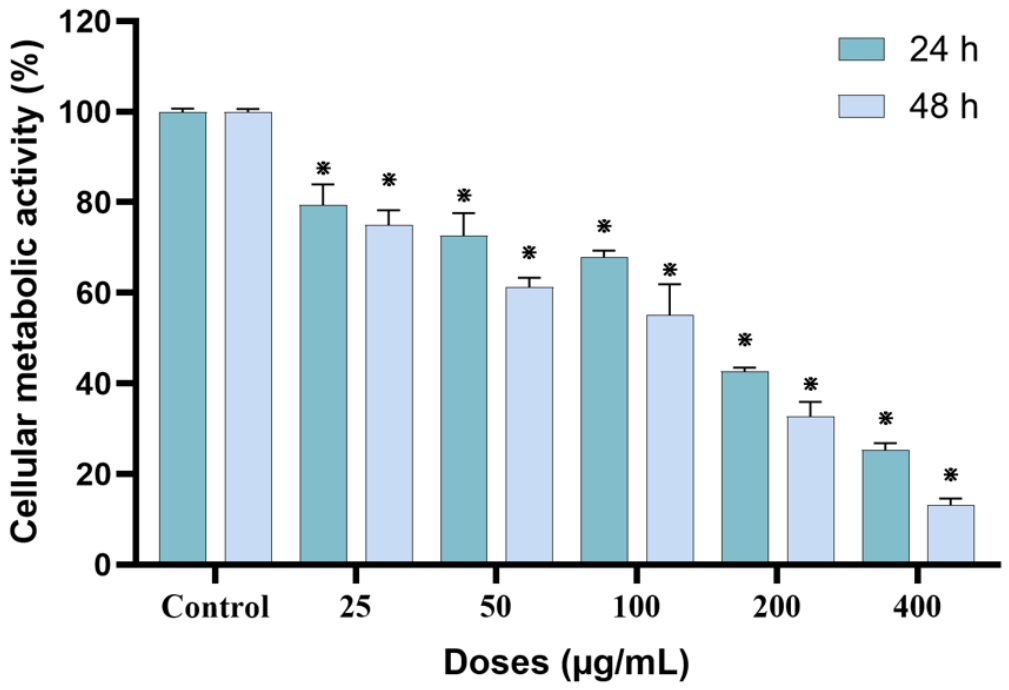
LP-CNS exposure reduced hBM-MSC metabolic activity over the tested concentration range at both exposure durations (Figure 9). Untreated-control values were 99.90 ± 0.78% at 24 h and 99.87 ± 0.76% at 48 h. At 24 h, activity decreased from 79.41 ± 4.54% at 25 µg/mL to 25.32 ± 1.49% at 400 µg/mL. The corresponding values at 48 h were 75.00 ± 3.22% and 13.20 ± 1.41%. At both time points, every tested concentration differed significantly from its corresponding untreated control (p < 0.05).
Figure 9.
Effect of LP-CNSs on MTT metabolic activity in human bone marrow-derived mesenchymal stem cells (hBM-MSCs) after 24 and 48 h of exposure. Data are presented as the mean ± SD from three independent experiments. Each exposure duration was analyzed separately using one-way ANOVA followed by Dunnett’s multiple-comparisons test against the corresponding untreated control. ⋇ p < 0.05 versus the corresponding untreated control.
The fitted IC50 was 152.70 µg/mL at 24 h (95% CI: 130.13–175.26 µg/mL; R2 = 0.961) and 90.91 µg/mL at 48 h (95% CI: 77.55–104.28 µg/mL; R2 = 0.967). The fitted IC50 was lower at 48 h than at 24 h. The precursor preparation lacking the 200 °C dry-heating step showed no statistically significant reduction in metabolic activity at the tested nominal concentrations and exposure durations (p > 0.05; Figure S2).
3.3. Cellular Injury and Mitochondrial Responses
3.3.1. Cellular and Nuclear Morphology
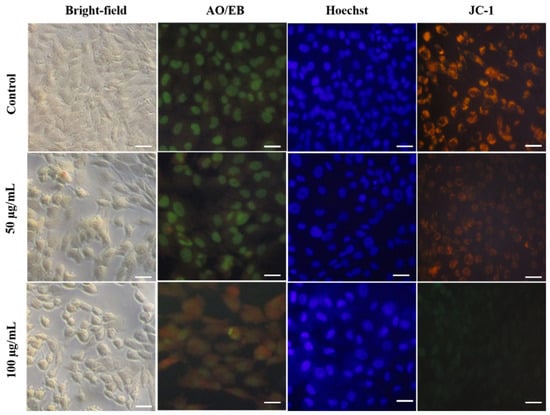
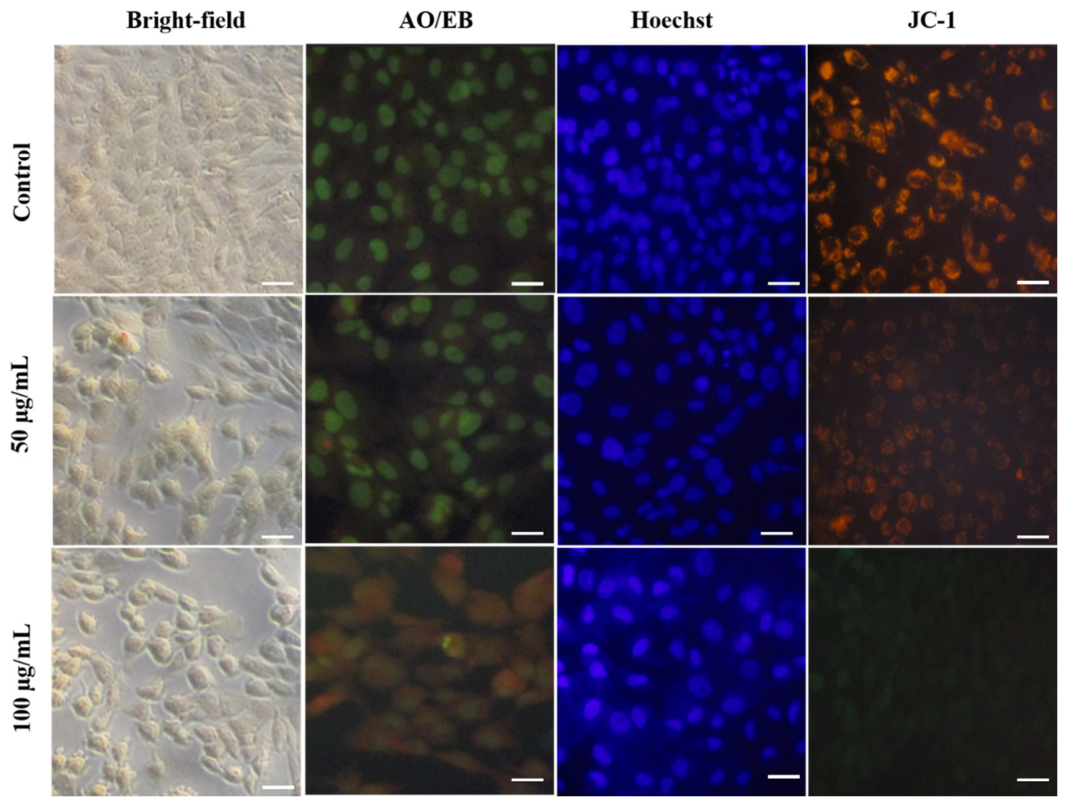
Bright-field microscopy showed concentration-associated changes in hBM-MSC morphology after 24 h (Figure 10). Control cells retained a spindle-shaped appearance with well-defined boundaries, extensive spreading, and elongated cytoplasmic processes. At 50 µg/mL, cells exhibited increased cytoplasmic granularity and were less elongated. Rounding, cytoplasmic condensation, reduced spreading, and partial detachment were more pronounced at 100 µg/mL.
Figure 10.
Representative bright-field, acridine orange/ethidium bromide (AO/EB), Hoechst 33342, and JC-1 microscopy images of hBM-MSCs exposed to 0, 50, or 100 µg/mL LP-CNSs for 24 h. Columns (left to right) show bright-field, AO/EB, Hoechst 33342, and JC-1 images; rows (top to bottom) correspond to the untreated control, 50 µg/mL, and 100 µg/mL groups. Bright-field images show reduced spreading and increased rounding relative to spindle-shaped control cells. AO/EB and Hoechst staining show nuclear condensation and fragmentation, particularly at 100 µg/mL. JC-1 fluorescence is predominantly red-orange in the control and 50 µg/mL groups, with a qualitative shift toward green at 100 µg/mL. Images are representative of three independent experiments. All images were acquired using the same objective lens and optical magnification. Each scale bar represents 100 µm.
AO/EB staining revealed corresponding changes in nuclear morphology. Control cells predominantly showed uniform green nuclear fluorescence. At 50 µg/mL, condensed bright-green nuclei were consistent with early apoptotic morphology. Orange-red nuclei with marked condensation and fragmentation were prominent at 100 µg/mL. Hoechst staining showed a similar pattern. Control nuclei exhibited diffuse blue fluorescence, whereas nuclei at 50 µg/mL showed mild condensation and more intense staining. At 100 µg/mL, nuclei were intensely stained, condensed, and fragmented (Figure 10).
3.3.2. Qualitative Changes in Mitochondrial Membrane Potential
JC-1 fluorescence patterns differed between the two LP-CNS concentrations after 24 h (Figure 10). Both control cells and cells exposed to 50 µg/mL showed predominantly red-orange fluorescence. Exposure to 100 µg/mL produced a qualitative shift toward diffuse green fluorescence.
The microscopy images show treatment-associated changes in cellular and nuclear morphology and JC-1 fluorescence. These patterns were assessed qualitatively, without image-based quantification.
3.4. Cell-Cycle Redistribution and Sub-G1 Accumulation
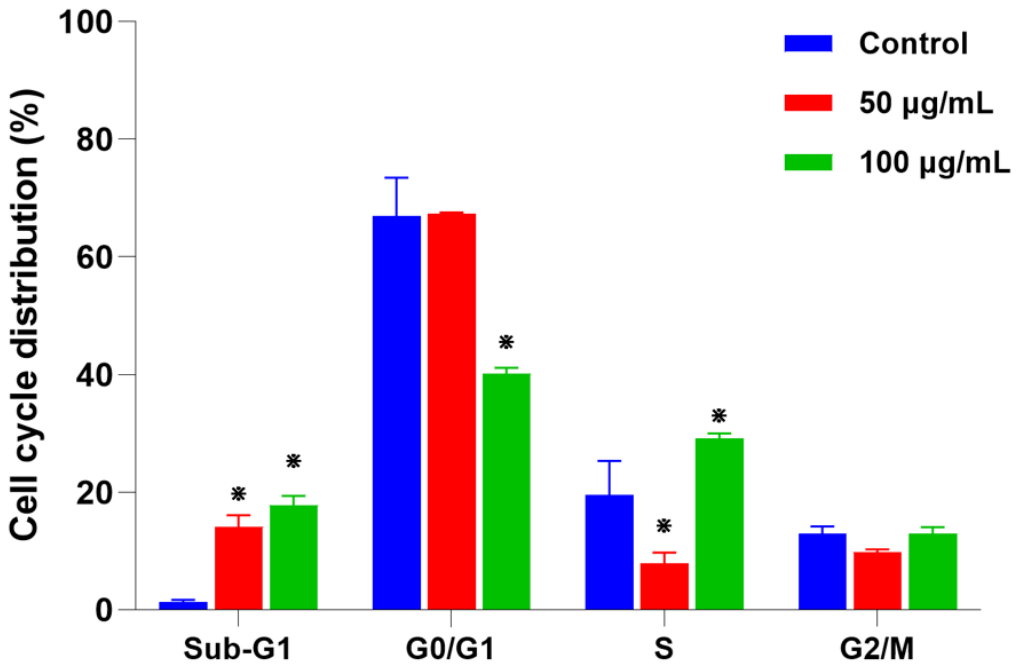
Flow cytometry revealed changes in DNA-content distribution after 24 h of LP-CNS exposure (Figure 11). In control cells, the sub-G1 (APOP), G0/G1, S, and G2/M fractions were 1.37 ± 0.28%, 66.88 ± 6.58%, 19.57 ± 5.74%, and 12.18 ± 1.06%, respectively.
Figure 11.
Effect of LP-CNSs on hBM-MSC cell-cycle distribution after 24 h of exposure to 0, 50, or 100 µg/mL. Bars and error bars show the mean ± SD percentages of cells in the sub-G1, G0/G1, S, and G2/M populations from three independent experiments (n = 3). Each population was analyzed separately using one-way ANOVA followed by two-sided Dunnett’s multiple-comparisons test against the untreated control. ⋇ p < 0.05 versus the untreated control.
The sub-G1 fraction increased significantly to 14.14 ± 1.92% at 50 µg/mL and 17.78 ± 1.55% at 100 µg/mL (p < 0.05 versus control). At 50 µg/mL, the G0/G1 and G2/M fractions were 67.34 ± 0.21% and 10.62 ± 0.33%, respectively. Neither differed significantly from the control (p > 0.05). The S-phase fraction decreased significantly to 7.90 ± 1.78% (p < 0.05).
At 100 µg/mL, the G0/G1 fraction decreased to 40.15 ± 0.96%, whereas the S-phase fraction increased to 29.06 ± 0.89%. Both changes were significant relative to the control (p < 0.05). The G2/M fraction was 13.02 ± 1.76% and did not differ significantly from the control (p > 0.05). Thus, both concentrations increased the sub-G1 fraction, but the patterns of redistribution among the other cell-cycle populations differed.
3.5. Transcriptional Responses Associated with Cellular Stress and Inflammation
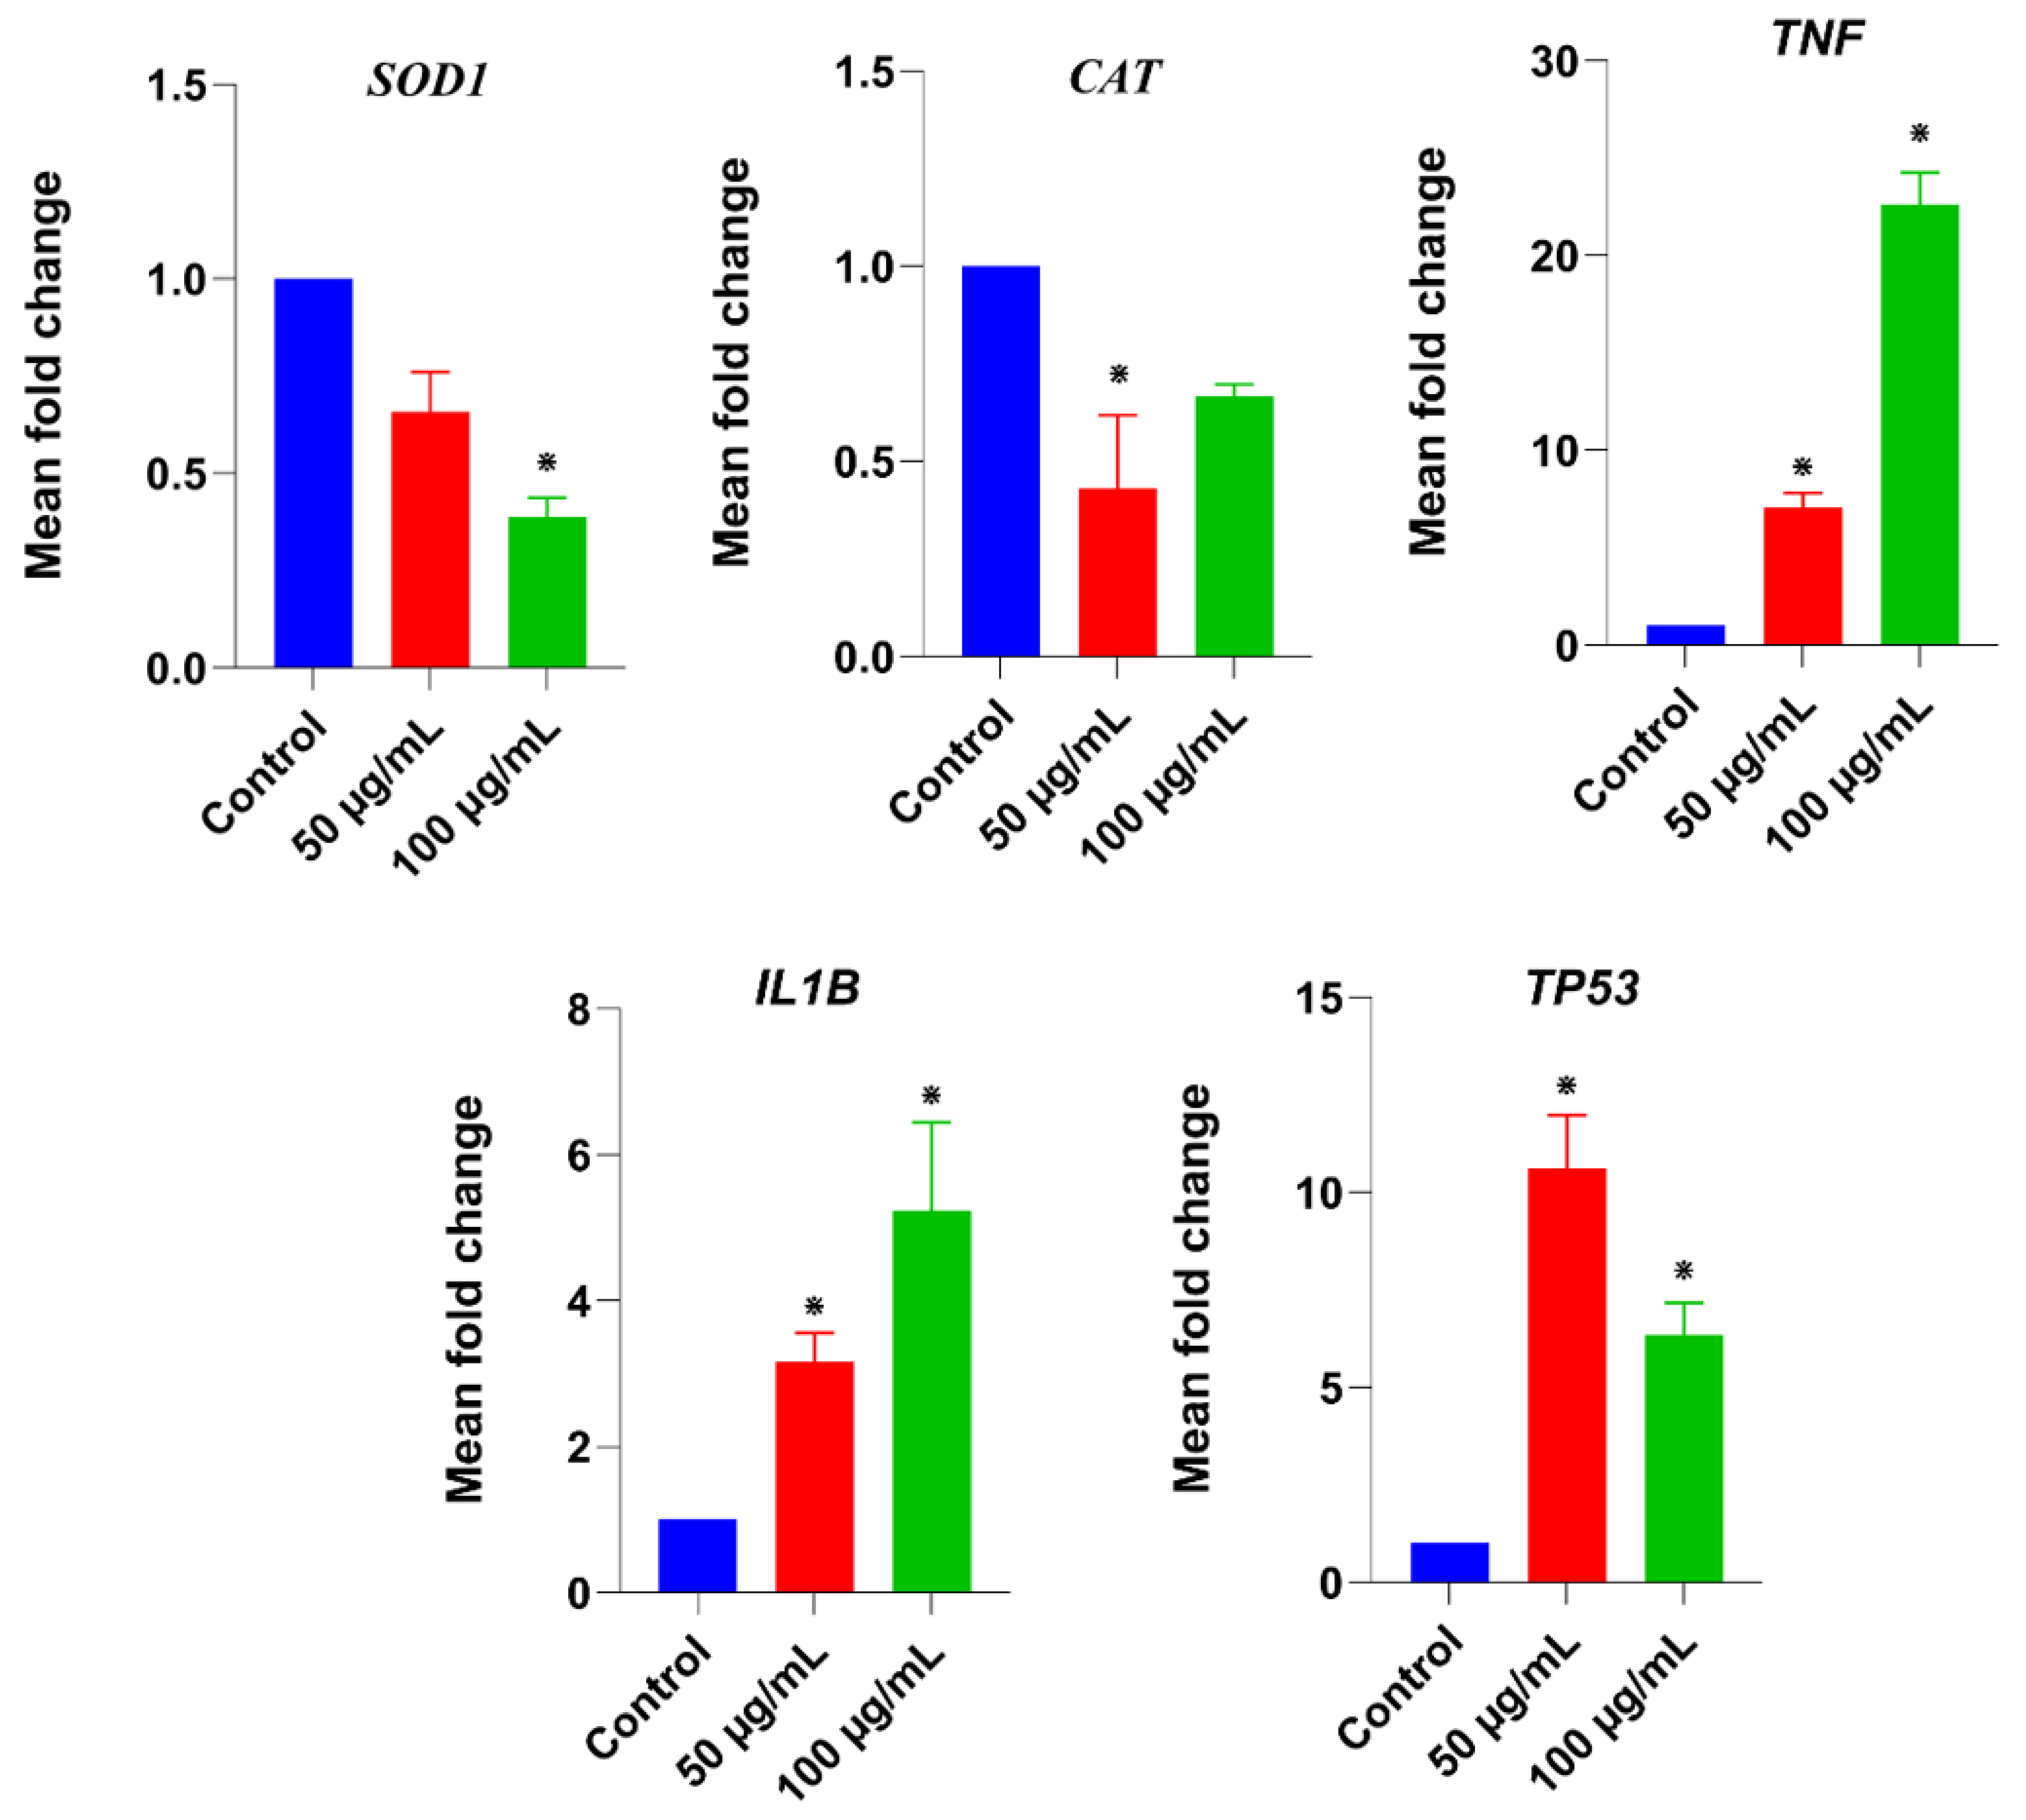
RT-qPCR revealed gene-specific transcriptional responses after 24 h of LP-CNS exposure (Figure 12). Expression was normalized to GAPDH and reported relative to the untreated control. Relative SOD1 expression was 0.66 ± 0.10-fold at 50 µg/mL and 0.39 ± 0.05-fold at 100 µg/mL. Only the reduction at 100 µg/mL was significant (p < 0.05). Relative CAT expression was 0.43 ± 0.19-fold and 0.67 ± 0.03-fold at 50 and 100 µg/mL, respectively. Only the reduction at 50 µg/mL was significant (p < 0.05).
Figure 12.
Relative SOD1, CAT, TP53, TNF, and IL1B mRNA expression in hBM-MSCs after 24 h of exposure to 0, 50, or 100 µg/mL LP-CNSs. Expression was normalized to GAPDH and calculated relative to the untreated control using the 2−ΔΔCt method. Data are presented as the mean ± SD from three independent experiments. Statistical comparisons were performed on ΔCt values using one-way ANOVA followed by Dunnett’s multiple-comparisons test against the untreated control. ⋇ p < 0.05 versus the untreated control.
Relative TP53 expression increased to 10.61 ± 1.37-fold at 50 µg/mL and 6.36 ± 0.81-fold at 100 µg/mL. Both increases were significant relative to the control (p < 0.05).
Relative TNF expression increased to 7.04 ± 0.76-fold and 22.61 ± 1.64-fold at 50 and 100 µg/mL, respectively. Relative IL1B expression increased to 3.16 ± 0.40-fold and 5.24 ± 1.20-fold at the same concentrations. All four increases were significant relative to the control (p < 0.05). For both genes, the mean fold change was greater at 100 µg/mL than at 50 µg/mL.
4. Discussion
4.1. Physicochemical Features of the Recovered Thermal Fraction
TEM and DLS characterize complementary aspects of the recovered fraction: projected dimensions after drying and hydrodynamic behavior in aqueous dispersion, respectively. Hydration, particle association, and the disproportionate contribution of larger scatterers to DLS may explain why the hydrodynamic diameter exceeds the TEM-derived diameter [38,39]. The difference does not necessarily indicate inconsistency between the two measurements.
Excitation-dependent emission is consistent with heterogeneous emissive environments in the recovered preparation. Similar optical behavior has been reported for carbon dots isolated from roasted Spanish mackerel, whose fluorescence varied with roasting duration [40]. Although fluorescence can support comparisons among thermal products, it cannot independently identify their chemical composition.
The retained aliphatic bands and features associated with polar groups indicate substantial organic functionality. The band near 1580 cm−1 lies within a region associated with N–H bending and amide-related vibrations [41]. A single band cannot establish a unique bonding assignment in this complex fraction. Moreover, fatty acid–lysine dispersions can self-assemble under other preparation conditions [22]. The altered FTIR profile is therefore consistent with processing-related chemical and organizational changes. The 16 cm−1 spectral resolution also limits the separation of closely spaced or overlapping bands. The findings support qualitative comparison of the overall functional-group profiles, while specific bonding assignments, including possible amide-related contributions, remain tentative.
The broad XRD profile indicates limited long-range order, as reported for other food-derived carbonaceous preparations [40]. TEM showed nanoscale structures in dried specimens. The XRD and FTIR profiles of the recovered fraction differed from those of the precursors. Similar nanoscale features and predominantly amorphous characteristics were reported for the glycine–stearic acid-derived preparation [18]. These similarities do not demonstrate equivalence in chemical composition or biological activity between the two precursor systems.
The dominant mass loss at 150–260 °C (73.83%) and the residue at 500 °C under nitrogen (9.26%) are consistent with an organic-rich preparation containing substantial thermally labile constituents. These bulk measurements neither identify individual constituents nor quantify the proportion of carbonaceous nanoparticles. A pronounced intermediate-temperature mass loss was also reported for the fraction recovered from heated starch–myristic acid [17].
The Raman feature near 1343 cm−1 overlaps a region associated with disorder-related carbon vibrations. Features near 1470 and 2908 cm−1 are compatible with aliphatic contributions [42,43], whereas the 1678 cm−1 feature may include carbonyl-, amide-, or conjugation-related contributions. The available data do not justify assigning the features near 1343 and 1678 cm−1 to conventional carbon D and G bands. The ratio A1343/A1678 is therefore retained as a descriptive spectral parameter. It is not used to quantify defect density, graphitization, or sp2/sp3 content, nor is it directly compared with conventional carbon D/G-band ratios.
4.2. Exposure-Dependent Reduction in Cellular Metabolic Activity
The concentration-associated decline in MTT metabolic activity and the lower fitted IC50 at 48 h indicate that the recovered LP-CNS preparation is biologically active under the tested conditions. The matched precursor preparation lacking the 200 °C dry-heating step showed no statistically significant reduction in MTT metabolic activity under the tested conditions (Figure S2). This comparison supports an association between thermal processing and the metabolic response. It does not distinguish effects of the nanoscale structures from those of soluble or particle-associated thermal reaction products that may remain in the fraction.
Cytotoxic responses have also been reported for heated starch–myristic acid fractions in THP-1 cells [17]. Longer roasting increased the cytotoxicity of Spanish mackerel-derived carbon dots in normal rat kidney cells [40]. The present study extends this comparative evidence to a defined lysine–palmitic acid thermal preparation.
Although cell-free blank correction was applied, optical or chemical interference with the MTT assay cannot be completely excluded. The accompanying morphological and DNA-content findings provide complementary evidence of cellular injury. Accordingly, the MTT findings are interpreted as changes in metabolic activity, not as direct measurements of cell death. Independent viability or cytotoxicity assays would strengthen their confirmation.
4.3. Nuclear, Mitochondrial, and Cell-Cycle Responses
Nuclear condensation and fragmentation observed with AO/EB and Hoechst staining support apoptosis-associated injury [32,33]. Similar morphology has been described in mesenchymal stem cells exposed to other carbonaceous nanoparticles [28]. Together with increased sub-G1 accumulation, these observations support an apoptosis-associated injury phenotype and complement the MTT findings.
At 100 µg/mL, the JC-1 fluorescence shift was consistent with mitochondrial depolarization [34,35] and coincided with more pronounced cellular and nuclear injury. At 50 µg/mL, nuclear changes and increased sub-G1 accumulation were evident, although JC-1 fluorescence remained predominantly red-orange. Food-derived carbon dots can also affect other organelles. For example, roasted-chicken-derived carbon dots induced lysosome-associated cell death in normal rat kidney and Caco-2 cells [44].
The increased hypodiploid fraction is consistent with DNA fragmentation associated with cell injury [45]. The contrasting S-phase responses distinguish the concentration-specific DNA-content profiles: the S-phase fraction decreased at 50 µg/mL but increased at 100 µg/mL, accompanied by a smaller G0/G1 fraction at the higher concentration. These single-time-point measurements describe changes in DNA-content distribution and do not independently establish arrest at a specific cell-cycle phase.
Taken together, the nuclear and DNA-content findings support apoptosis-associated cellular injury. Although the qualitative JC-1 changes are consistent with mitochondrial depolarization, neither apoptosis nor mitochondrial depolarization was independently confirmed by a complementary assay.
4.4. Transcriptional Responses and Their Cellular Context
SOD1 and CAT showed different concentration-related transcriptional patterns. TP53 expression increased at both concentrations, with a larger mean response at 50 µg/mL. These findings indicate gene-specific changes in antioxidant-related and stress-responsive transcription accompanying nuclear injury and sub-G1 accumulation.
TNF and IL1B expression increased at both concentrations, with larger mean responses at 100 µg/mL. These changes coincided with more pronounced morphological injury and the qualitative JC-1 shift at the higher concentration. Thus, the measured endpoints exhibited related but nonidentical concentration–response patterns. They characterize transcriptional responses accompanying cellular injury without independently establishing oxidative stress, activation of apoptotic pathways, or a functional inflammatory response. Measurements of reactive oxygen species (ROS), antioxidant enzyme activity, relevant proteins, and cytokine release would help clarify the functional implications.
4.5. Contribution of the Model and Study Limitations
This study extends previous amino acid–fatty acid thermal models [18,19] by combining a matched precursor control, complementary cellular injury endpoints, and RT-qPCR analysis in the lysine–palmitic acid system. The unheated precursor control provides a reference for interpreting the association between thermal processing and the MTT response. Measurements of SOD1, CAT, TP53, TNF, and IL1B characterize accompanying transcriptional responses.
Both 50 and 100 µg/mL increased sub-G1 accumulation, but the S-phase fraction decreased at 50 µg/mL and increased at 100 µg/mL relative to the untreated control. Mean TP53 expression was descriptively higher at 50 µg/mL, whereas mean TNF and IL1B expression was higher at 100 µg/mL. These distinct patterns provide a basis for further investigation of relationships among cellular injury, cell-cycle redistribution, and transcriptional responses. The larger S-phase fraction and smaller G0/G1 fraction at 100 µg/mL also differ from the G0/G1 accumulation reported for the glycine–stearic acid system [18]. Direct comparisons under matched experimental conditions are needed to determine whether these cross-study differences reflect precursor chemistry.
Several limitations should be considered. Although nanoscale structures were observed, the molecular composition of the recovered LP-CNS fraction remains unresolved. The preparation may contain heterogeneous thermal products, self-assembled structures, and nonparticulate constituents that were not fully separated by centrifugation, filtration, and dialysis. Because particulate and soluble fractions were not evaluated separately, the observed cellular effects cannot be attributed specifically to the nanoscale structures. XPS, elemental analysis, and mass spectrometry were not performed and would help clarify the chemical composition. DLS measurements were limited to deionized water immediately after preparation; hydrodynamic size, aggregation, serum interactions, and dispersion stability in DMEM containing 10% FBS during exposure remain uncharacterized. Annexin V/PI flow cytometry, caspase assays, and quantitative JC-1 analysis were not performed, and potential interference from intrinsic LP-CNS fluorescence was not independently assessed. Additional quantitative, protein-level, and functional analyses are needed to clarify the underlying mechanisms. Furthermore, GAPDH was the sole reference gene, and its stability under LP-CNS exposure was not independently validated. All cellular experiments used material from a single preparation batch. Finally, the nominal exposure concentrations were not based on dietary exposure estimates. These in vitro findings do not establish dietary exposure or human health risk. Studies using actual food matrices, gastrointestinal digestion models, and exposure-relevant conditions are needed before drawing food-safety conclusions.
5. Conclusions
Dry heating lysine and palmitic acid at 200 °C for 20 min yielded a water-dispersible, organic-rich fraction. The fraction exhibited excitation-dependent fluorescence, and its X-ray diffraction pattern indicated predominantly amorphous organization. Transmission electron microscopy revealed nanoscale structures in dried specimens of this fraction. In hBM-MSCs, the preparation reduced metabolic activity and was associated with nuclear morphological injury, increased sub-G1 accumulation, concentration-specific cell-cycle redistribution, and altered stress- and inflammation-related transcription. Qualitative JC-1 changes at 100 µg/mL were consistent with mitochondrial depolarization. A matched precursor preparation lacking the 200 °C step did not significantly reduce metabolic activity. These findings characterize cellular responses to a defined amino acid–fatty acid thermal fraction and provide a basis for comparisons across precursor systems. These responses pertain to the recovered fraction as a whole; the data neither identify its active chemical constituents nor establish a specific contribution from the nanoscale structures. Further fractionation and physicochemical characterization under exposure-relevant conditions are needed to identify the active constituents and assess the relevance of these findings to food-associated exposure.
Supplementary Materials
The following supporting information can be downloaded at: https://www.mdpi.com/article/10.3390/biology15222147/s1, Table S1, QuantiTect Primer Assays used for RT-qPCR analysis; Figure S1, Full Raman spectrum of LP-CNSs recorded over 100–3000 cm−1, showing the measured spectrum and composite fit obtained using Spectra Manager Ver. 2 (JASCO). The fitting output comprised 16 spectral components and a constant baseline term of −0.239044 a.u. The integrated areas of the fitted features at 1342.82 and 1678.17 cm−1 were 1840.83 and 1063.53, respectively, yielding an empirical area ratio (A1343/A1678) of 1.73. This ratio is not interpreted as a conventional carbon D/G-band ratio; Figure S2, Effect of the matched unheated lysine–palmitic acid precursor preparation on MTT metabolic activity in hBM-MSCs after 24 and 48 h. The precursor mixture underwent the same preparation, centrifugation, 0.22-µm filtration, dialysis (MWCO 3500 Da), and freeze-drying procedures as the heated preparation, except for the 200 °C dry-heating step. Concentrations (0–400 µg/mL) refer to the recovered freeze-dried material. Data are presented as mean ± SD from three independent biological experiments (n = 3). Statistical comparisons were performed separately for each exposure duration using one-way ANOVA followed by Dunnett’s test against the corresponding untreated control. No statistically significant reduction in metabolic activity was observed (p > 0.05).
Author Contributions
Conceptualization, V.S.P. and A.A.A.; Methodology, O.N.A., J.A. and V.S.P.; Formal Analysis, O.N.A. and V.S.P.; Investigation, O.N.A., J.A., V.S.P. and H.A.J.; Resources, A.A.A.; Data Curation, O.N.A.; Writing—Original Draft Preparation, O.N.A.; Writing—Review and Editing, J.A., V.S.P., H.A.J. and A.A.A.; Visualization, O.N.A. and V.S.P.; Supervision, A.A.A.; Project Administration, A.A.A.; Funding Acquisition, A.A.A. All authors have read and agreed to the published version of the manuscript.
Funding
This research was funded by the Ongoing Research Funding Program of King Saud University, Riyadh, Saudi Arabia, grant number ORF-2025-178.
Institutional Review Board Statement
Not applicable. The study used commercially obtained human bone marrow-derived mesenchymal stem cells (ATCC PCS-500-012). It did not involve recruitment of human participants or collection of new human tissue.
Informed Consent Statement
Not applicable.
Data Availability Statement
The original contributions presented in this study are included in the article and Supplementary Materials. Further inquiries can be directed to the corresponding author.
Acknowledgments
The authors acknowledge the Ongoing Research Funding Program at King Saud University, Riyadh, Saudi Arabia, for financial, technical, and administrative support through grant ORF-2025-178.
Conflicts of Interest
The authors declare no conflicts of interest.
References
- Troise, A.D.; Fogliano, V.; Vitaglione, P.; Berton-Carabin, C.C. Interrelated routes between the Maillard reaction and lipid oxidation in emulsion systems. J. Agric. Food Chem. 2020, 68, 12107–12115. [Google Scholar] [CrossRef] [Scilit]
- Zhuang, Y.; Dong, J.; He, X.; Wang, J.; Li, C.; Dong, L.; Zhang, Y.; Zhou, X.; Wang, H.; Yi, Y.; et al. Impact of heating temperature and fatty acid type on the formation of lipid oxidation products during thermal processing. Front. Nutr. 2022, 9, 913297. [Google Scholar] [CrossRef] [Scilit]
- Hu, B.-B.; Yin, W.-T.; Zhang, H.-B.; Zhai, Z.-Q.; Liu, H.-M.; Wang, X.-D. The interaction between lipid oxidation and the Maillard reaction model of lysine-glucose on aroma formation in fragrant sesame oil. Food Res. Int. 2024, 186, 114397. [Google Scholar] [CrossRef] [Scilit]
- Rong, Y.; Kong, F.; Li, S.F.Y.; Yu, X.; Huang, J.; Chen, Q. Comprehensive review of endogenous hazardous compounds in carbohydrate- and lipid-containing foods generated during thermal processing: Formation mechanisms, metabolism and harm, regulatory frameworks, mitigation strategies, and analytical methods. Food Chem. 2026, 510, 148635. [Google Scholar] [CrossRef] [Scilit]
- Yang, L.; Liu, H.; Liu, P.; Zhang, T.; Liu, W.; Zhang, Y.; Li, W.; Liu, Y.; Zhao, T. Unveiling the synergistic mechanism of lipid oxidation and protein glycosylation in the formation of advanced glycation end products in tilapia during thermal processing. Food Res. Int. 2026, 227, 118301. [Google Scholar] [CrossRef] [Scilit]
- Bi, J.; Li, Y.; Wang, H.; Song, Y.; Cong, S.; Li, D.; Zhou, D.; Zhu, B.-W.; Tan, M. Physicochemical properties and cytotoxicity of carbon dots in grilled fish. New J. Chem. 2017, 41, 8490–8496. [Google Scholar] [CrossRef] [Scilit]
- Huang, T.; Peng, S.; Tu, Z.; Chao, Y.; Zhan, S. The carbon dots in toasted shrimp: Structural and biological characteristics. Food Biosci. 2024, 58, 103814. [Google Scholar] [CrossRef] [Scilit]
- Qu, Y.; Zhao, S.; Ni, J.; Jiao, L.; Zhang, X.; Benjakul, S.; Liu, Z.; Chen, X.; Zhang, B. In-situ formation mechanism of endogenous fluorescent carbon dots during the roasting process of small yellow croaker (Larimichthys polyactis). Food Chem. X 2025, 25, 102187. [Google Scholar] [CrossRef] [Scilit]
- Song, Y.; Wu, Y.; Wang, H.; Liu, S.; Song, L.; Li, S.; Tan, M. Carbon quantum dots from roasted Atlantic salmon (Salmo salar L.): Formation, biodistribution and cytotoxicity. Food Chem. 2019, 293, 387–395. [Google Scholar] [CrossRef] [Scilit]
- Yang, S.; Gao, H.; Pang, S.; Gao, J.; He, J.; Wang, Y.; Cheng, D. Carbon dots from thermally processed Spirulina: Properties, biodistribution and cytotoxicity. Food Chem. 2025, 495, 146537. [Google Scholar] [CrossRef] [Scilit]
- Yin, J.; Liu, K.; Yuan, S.; Guo, Y.; Yu, H.; Cheng, Y.; Xie, Y.; Qian, H.; Yao, W. Carbon dots in breadcrumbs: Effect of frying on them and interaction with human serum albumin. Food Chem. 2023, 424, 136371. [Google Scholar] [CrossRef] [Scilit]
- Li, D.; Na, X.; Wang, H.; Xie, Y.; Cong, S.; Song, Y.; Xu, X.; Zhu, B.-W.; Tan, M. Fluorescent carbon dots derived from Maillard reaction products: Their properties, biodistribution, cytotoxicity, and antioxidant activity. J. Agric. Food Chem. 2018, 66, 1569–1575. [Google Scholar] [CrossRef] [Scilit]
- Nguyen, D.H.H.; El-Ramady, H.; Prokisch, J. Food safety aspects of carbon dots: A review. Environ. Chem. Lett. 2025, 23, 337–360. [Google Scholar] [CrossRef] [Scilit]
- Wang, H.; Su, W.; Tan, M. Endogenous fluorescence carbon dots derived from food items. Innovation 2020, 1, 100009. [Google Scholar] [CrossRef] [Scilit]
- Nguyen, D.H.H.; El-Ramady, H.; Törős, G.; Muthu, A.; Elsakhawy, T.; Abdalla, N.; Alibrahem, W.; Kharrat Helu, N.; Prokisch, J. Food-derived carbon dots: Formation, detection, and impact on gut microbiota. Foods 2025, 14, 2980. [Google Scholar] [CrossRef] [Scilit]
- Törős, G.; Prokisch, J. Maillard reaction-derived carbon nanodots: Food-origin nanomaterials with emerging functional and biomedical potential. Pharmaceutics 2025, 17, 1050. [Google Scholar] [CrossRef] [Scilit]
- Periasamy, V.S.; Athinarayanan, J.; Alshatwi, A.A. Understanding the interaction between nanomaterials originated from high-temperature processed starch/myristic acid and human monocyte cells. Foods 2024, 13, 554. [Google Scholar] [CrossRef] [Scilit]
- Alsawmahi, O.N.; Athinarayanan, J.; Periasamy, V.S.; Ab Almakhlafi, Z.; Al-Sharafa, M.M.; Alshatwi, A.A. Nanotoxicological assessment of glycine–stearic acid-derived carbonaceous nanoparticles in human mesenchymal stem cells. Chem. Afr. 2026, 9, 236. [Google Scholar] [CrossRef] [Scilit]
- Alsawmahi, O.N.; Periasamy, V.S.; Athinarayanan, J.; Althawab, S.A.; Alohali, B.M.; Alshatwi, A.A. Formation of oleic acid/histidine and oleic acid/glutamine reaction products under high-temperature and their effects on THP-1-derived macrophages. Discov. Appl. Sci. 2026, 8, 1074. [Google Scholar] [CrossRef] [Scilit]
- Erbersdobler, H.F.; Hupe, A. Determination of lysine damage and calculation of lysine bio-availability in several processed foods. Z. Ernahrungswiss. 1991, 30, 46–49. [Google Scholar] [CrossRef] [Scilit]
- Annevelink, C.E.; Sapp, P.A.; Petersen, K.S.; Shearer, G.C.; Kris-Etherton, P.M. Diet-derived and diet-related endogenously produced palmitic acid: Effects on metabolic regulation and cardiovascular disease risk. J. Clin. Lipidol. 2023, 17, 577–586. [Google Scholar] [CrossRef] [Scilit]
- Novales, B.; Riaublanc, A.; Navailles, L.; Houinsou Houssou, B.; Gaillard, C.; Nallet, F.; Douliez, J.-P. Self-assembly and foaming properties of fatty acid–lysine aqueous dispersions. Langmuir 2010, 26, 5329–5334. [Google Scholar] [CrossRef] [Scilit]
- Syukri, M.; Purba, N.R.; Hutajulu, B.R.; Alfizah, D.; Hutagalung, A.; Masyithah, Z. Synthesis N-palmitoyl lysine from palmitate acid and L-lysine used mixed solvent: Effect of temperature and reaction time. AIP Conf. Proc. 2019, 2175, 020015. [Google Scholar] [CrossRef] [Scilit]
- Monopoli, M.P.; Åberg, C.; Salvati, A.; Dawson, K.A. Biomolecular coronas provide the biological identity of nanosized materials. Nat. Nanotechnol. 2012, 7, 779–786. [Google Scholar] [CrossRef] [Scilit]
- Athinarayanan, J.; Periasamy, V.S.; Alsaif, M.A.; Al-Warthan, A.A.; Alshatwi, A.A. Presence of nanosilica (E551) in commercial food products: TNF-mediated oxidative stress and altered cell cycle progression in human lung fibroblast cells. Cell Biol. Toxicol. 2014, 30, 89–100. [Google Scholar] [CrossRef] [Scilit]
- Athinarayanan, J.; Alshatwi, A.A.; Periasamy, V.S.; Al-Warthan, A.A. Identification of nanoscale ingredients in commercial food products and their induction of mitochondrially mediated cytotoxic effects on human mesenchymal stem cells. J. Food Sci. 2015, 80, N459–N464. [Google Scholar] [CrossRef] [Scilit]
- Liu, X.; Yang, Z.; Sun, J.; Ma, T.; Hua, F.; Shen, Z. A brief review of cytotoxicity of nanoparticles on mesenchymal stem cells in regenerative medicine. Int. J. Nanomed. 2019, 14, 3875–3892. [Google Scholar] [CrossRef] [Scilit]
- Periasamy, V.S.; Athinarayanan, J.; Alfawaz, M.A.; Alshatwi, A.A. Carbon nanoparticle induced cytotoxicity in human mesenchymal stem cells through upregulation of TNF3, NFKBIA and BCL2L1 genes. Chemosphere 2016, 144, 275–284. [Google Scholar] [CrossRef] [Scilit]
- Periasamy, V.S.; Athinarayanan, J.; Alhazmi, M.; Alatiah, K.A.; Alshatwi, A.A. Fe3O4 nanoparticle redox system modulation via cell-cycle progression and gene expression in human mesenchymal stem cells. Environ. Toxicol. 2016, 31, 901–912. [Google Scholar] [CrossRef] [Scilit]
- Yan, J.; Hou, S.; Yu, Y.; Qiao, Y.; Xiao, T.; Mei, Y.; Zhang, Z.; Wang, B.; Huang, C.-C.; Lin, C.-H.; et al. The effect of surface charge on the cytotoxicity and uptake of carbon quantum dots in human umbilical cord derived mesenchymal stem cells. Colloids Surf. B Biointerfaces 2018, 171, 241–249. [Google Scholar] [CrossRef] [Scilit]
- Mosmann, T. Rapid colorimetric assay for cellular growth and survival: Application to proliferation and cytotoxicity assays. J. Immunol. Methods 1983, 65, 55–63. [Google Scholar] [CrossRef] [Scilit]
- Ribble, D.; Goldstein, N.B.; Norris, D.A.; Shellman, Y.G. A simple technique for quantifying apoptosis in 96-well plates. BMC Biotechnol. 2005, 5, 12. [Google Scholar] [CrossRef] [Scilit]
- Crowley, L.C.; Marfell, B.J.; Waterhouse, N.J. Analyzing cell death by nuclear staining with Hoechst 33342. Cold Spring Harb. Protoc. 2016, 2016, 778–781. [Google Scholar] [CrossRef] [Scilit]
- Cossarizza, A.; Baccarani-Contri, M.; Kalashnikova, G.; Franceschi, C. A new method for the cytofluorometric analysis of mitochondrial membrane potential using the J-aggregate forming lipophilic cation 5,5′,6,6′-tetrachloro-1,1′,3,3′-tetraethylbenzimidazolcarbocyanine iodide (JC-1). Biochem. Biophys. Res. Commun. 1993, 197, 40–45. [Google Scholar] [CrossRef] [Scilit]
- Smiley, S.T.; Reers, M.; Mottola-Hartshorn, C.; Lin, M.; Chen, A.; Smith, T.W.; Steele, G.D., Jr.; Chen, L.B. Intracellular heterogeneity in mitochondrial membrane potentials revealed by a J-aggregate-forming lipophilic cation JC-1. Proc. Natl. Acad. Sci. USA 1991, 88, 3671–3675. [Google Scholar] [CrossRef] [Scilit]
- Krishan, A. Rapid flow cytofluorometric analysis of mammalian cell cycle by propidium iodide staining. J. Cell Biol. 1975, 66, 188–193. [Google Scholar] [CrossRef] [Scilit]
- Livak, K.J.; Schmittgen, T.D. Analysis of relative gene expression data using real-time quantitative PCR and the 2−ΔΔCT method. Methods 2001, 25, 402–408. [Google Scholar] [CrossRef] [Scilit]
- Filippov, S.K.; Khusnutdinov, R.; Murmiliuk, A.; Inam, W.; Zakharova, L.Y.; Zhang, H.; Khutoryanskiy, V.V. Dynamic light scattering and transmission electron microscopy in drug delivery: A roadmap for correct characterization of nanoparticles and interpretation of results. Mater. Horiz. 2023, 10, 5354–5370. [Google Scholar] [CrossRef] [Scilit]
- Ito, T.; Sun, L.; Bevan, M.A.; Crooks, R.M. Comparison of nanoparticle size and electrophoretic mobility measurements using a carbon-nanotube-based Coulter counter, dynamic light scattering, transmission electron microscopy, and phase analysis light scattering. Langmuir 2004, 20, 6940–6945. [Google Scholar] [CrossRef] [Scilit]
- Cui, G.; Li, J.; Li, J.; Wang, H.; Tan, M. Physicochemical characterization, biodistribution, and bio-effects of fluorescent carbon dots from roasted Spanish mackerel. Food Front. 2023, 4, 1878–1892. [Google Scholar] [CrossRef] [Scilit]
- Barth, A. Infrared spectroscopy of proteins. Biochim. Biophys. Acta Bioenerg. 2007, 1767, 1073–1101. [Google Scholar] [CrossRef] [Scilit]
- Ferrari, A.C.; Robertson, J. Interpretation of Raman spectra of disordered and amorphous carbon. Phys. Rev. B 2000, 61, 14095–14107. [Google Scholar] [CrossRef] [Scilit]
- Qiu, J.; Hou, H.-Y.; Huyen, N.T.; Yang, I.-S.; Chen, X.-B. Raman spectroscopy and 2DCOS analysis of unsaturated fatty acid in edible vegetable oils. Appl. Sci. 2019, 9, 2807. [Google Scholar] [CrossRef] [Scilit]
- Wu, Y.; Song, X.; Wang, N.; Cong, S.; Zhao, X.; Rai, R.; Tan, M. Carbon dots from roasted chicken accumulate in lysosomes and induce lysosome-dependent cell death. Food Funct. 2020, 11, 10105–10113. [Google Scholar] [CrossRef] [Scilit]
- Riccardi, C.; Nicoletti, I. Analysis of apoptosis by propidium iodide staining and flow cytometry. Nat. Protoc. 2006, 1, 1458–1461. [Google Scholar] [CrossRef] [Scilit]
Disclaimer/Publisher’s Note: The statements, opinions and data contained in all publications are solely those of the individual author(s) and contributor(s) and not of MDPI and/or the editor(s). MDPI and/or the editor(s) disclaim responsibility for any injury to people or property resulting from any ideas, methods, instructions or products referred to in the content. |
© 2026 by the authors. Licensee MDPI, Basel, Switzerland. This article is an open access article distributed under the terms and conditions of the Creative Commons Attribution (CC BY) license.