


Simple Summary
Litchi is an economically important subtropical fruit, but the genes involved in its fruit development are not fully understood. GRAS genes play important roles in plant growth and development. In this study, we identified 55 GRAS genes in the litchi genome and classified them into 12 groups. We examined their characteristics and expression patterns during the development of the pericarp and pulp. Four genes showed pericarp-specific expression, whereas two showed pulp-specific expression. We also identified five hub genes in a gene co-expression network. Among them, LcGRAS15 was strongly co-expressed with several genes associated with fruit development. These findings provide a foundation for further studies of GRAS gene functions and may support the genetic improvement of litchi fruit quality.
Abstract
Litchi (Litchi chinensis Sonn.) is an economically important subtropical fruit tree. The GRAS gene family plays important roles in fruit development in horticultural plants. However, genome-wide identification and systematic characterization of the GRAS gene family using a high-quality litchi genome have not yet been reported. In this study, 55 LcGRAS genes were identified across 14 chromosomes and classified into 12 subfamilies. Their physicochemical properties, interspecific collinearity, Ka/Ks ratios, gene structures, and conserved motifs were analyzed. Promoter analysis revealed cis-regulatory elements associated with hormone responses, including ABRE and ERE; stress responses, including MYB- and MYC-binding sites; and growth and development. Two transcriptome datasets covering litchi pericarp and pulp development were used to characterize LcGRAS gene expression. Four pericarp-specific genes and two pulp-specific genes were identified. A co-expression network was constructed, and five hub genes were identified. Among these, LcGRAS15 was strongly co-expressed with key transcription factors, including MYB, NAC, and ARF, and fruit development-related regulators, including BBM and GAI3. This study provides a comprehensive profile of the GRAS gene family in litchi and offers a theoretical reference for the genetic improvement of litchi fruit quality.
1. Introduction
Litchi (Litchi chinensis Sonn.) belongs to Sapindaceae [1] and is a major fruit for use in subtropics, having both significant economic and culture value [2]. The ripe fruit has bright red skin and firm, creamy, translucent sweet juicy flesh, and is known as one of the Four Great Fruits of Southern China [3]. Lychee is cultivated in more than 50 countries and the litchi production of China, Thailand and Vietnam comprise the majority of the world’s output [4,5]. The cultivation of litchi has a history of more than 2000 years in China, with a great cultural and commercial value. Fruit quality and yield are the core determinants of the commercial value of litchi. Key agronomic and quality traits, including fruit size, single fruit weight, sugar and organic acid contents, and flavor profile, are progressively established and shaped throughout the entire process of fruit growth and development—from early cell division and cell expansion to the late ripening stage with secondary metabolite accumulation. Accordingly, deciphering the regulatory factors and underlying molecular mechanisms governing litchi fruit growth and development holds important practical value for molecular breeding and targeted improvement of litchi fruit quality.
Transcription factors are the group of proteins that bind to DNA and are essential for controlling the regulation of growth and development of plants and also for responding to different types of abiotic stress [6,7]. GRAS represents one of the families of transcription factors specific to plants. The members of the GRAS family usually contain 400–700 amino acids and have highly specialized N-terminal and characteristic C-terminal domains [8]. Their name is derived from the three genes that were originally identified (GAI, RGA, SCR) [9]. Recently, in using large-scale genomic sequencing data and study of the GRAS gene family, there is a significant variation between each species represented in the results. For example, 45, 70 and 82 GRAS genes can be found in a sample of Paeonia ludlowii, Ipomoea trifida, and Eucalyptus, respectively [10,11,12]. Meanwhile, there are 117 and 177 GRAS genes found in soybeans and wheat, respectively [13,14]. GRAS genes of the same subfamily have similar biological functions [15]. Previous studies have indicated that GRAS transcription factors are involved in regulating plant physiological and biochemical processes, especially those related to growth and development [16,17,18]; signal transduction [19,20,21,22]; cell division [23,24,25]; and the synthesis of compounds [26,27,28,29].
The roles of GRAS transcription factors in fruit development have recently attracted considerable attention. For instance, MaSCL8 promotes banana ripening by directly activating genes involved in ethylene biosynthesis, starch degradation, and cell wall disassembly [30]. SlGRAS4 acts as a positive regulator of fruit ripening by modulating ethylene biosynthesis and activating the ripening-promoting gene SlMADS1 in tomato [31]. Conversely, suppression of SlGRAS2 activity has been shown to decrease the weight of mature fruit [32]. Additionally, FaSCL8 is responsible for regulating the accumulation of phosphorus and sugars in strawberry fruit via regulation of the FaVPT1 gene contributing to fruit ripening [33]. Finally, VvRGL1 and RGL2 may also both be involved in the development of seedless fruit in grapes through their responses to gibberellin (GA)-mediated down regulation [34]. These studies indicate that GRAS transcription factors play a crucial role in fruit development processes such as fruit ripening.
Litchi fruit development is a complex process involving multiple stages, including peel coloration and aroma formation, and is regulated by numerous genes from diverse transcription factor families [35,36,37,38]. However, the systematic characteristics of the GRAS gene family and their roles in litchi fruit development remain unclear. In this study, genome-wide identification and bioinformatics analyses of the GRAS gene family were performed using the litchi genome. Phylogenetic relationships and physicochemical properties, chromosomal localization, collinearity analysis, and promoter cis-acting element analysis were profiled. Transcriptomic data were integrated to examine the expression profiles of GRAS genes at different stages of litchi fruit development. These results would provide a basis for further elucidating the molecular mechanisms of the GRAS gene family during litchi fruit development.
2. Materials and Methods
2.1. Identification of LcGRAS Family Members
The litchi genome data were obtained from the SapBase database (www.sapindaceae.com, published on 28 May 2024, accessed on 5 September 2025) [39]. The hidden Markov model (HMM) profile corresponding to the GRAS domain (PF03514) was retrieved from the Pfam database (http://pfam.xfam.org/, accessed on 5 September 2025) [40]. Genome-wide identification of litchi GRAS (LcGRAS) gene family members was performed using the HMM Search module implemented in TBtoolsv2.376 [41], with a stringent E-value cutoff set to 1 × 10⁻⁵ for initial candidate screening. All preliminary candidate sequences were further validated against the Pfam database to confirm the presence of the intact GRAS domain. Sequences with truncated or absent GRAS domains were discarded, and redundant isoforms were removed to generate the final non-redundant set of LcGRAS genes. Physicochemical properties of LcGRAS proteins, including amino acid count, molecular weight, theoretical isoelectric point (pI), instability index, aliphatic index, and grand average of hydropathicity (GRAVY), were calculated via the ExPASy ProtParam online server (https://web.expasy.org/protparam/, accessed on 15 September 2025) [42]. Subcellular localization prediction was conducted using the WoLF PSORT web server (https://wolfpsort.hgc.jp/, v0.2, plant-specific prediction mode, accessed on 15 September 2025) [43]. Protein secondary structure prediction was performed using the SOPMA tool hosted on the NPS@ analysis platform (https://npsa-prabi.ibcp.fr, accessed on 5 September 2025) under default parameters, and the proportions of alpha helix, extended strand, and random coil were quantified for each protein.
2.2. Multiple Sequence Comparison and Phylogenetic Analysis of the LcGRAS Gene Family
The full-length GRAS protein sequences of litchi (Litchi chinensis, LcGRAS) and longan (Dimocarpus longan, DlGRAS) were obtained from the SapBase database (www.sapindaceae.com, accessed on 5 September 2025), while those of Arabidopsis thaliana (AtGRAS) and grapevine (Vitis vinifera, VvGRAS) were downloaded from the Ensembl Plants database (https://plants.ensembl.org, release 62, accessed on 5 September 2025) [39,44]. Multiple sequence alignment was performed on all collected GRAS protein sequences using MAFFT v7.505 with the high-accuracy L-INS-i strategy, followed by alignment trimming with trimAl v1.4 under the -automated1 parameter to remove ambiguously aligned regions. The processed alignment was then imported into IQ-TREE (http://www.iqtree.org/, accessed on 5 September 2025) for maximum likelihood phylogenetic tree construction. The optimal LG+G4 amino acid substitution model was selected via the built-in ModelFinder based on the Bayesian Information Criterion (BIC), and node reliability was evaluated with 1000 ultrafast bootstrap (UFBoot) replicates and 1000 SH-like approximate likelihood ratio test (SH-aLRT) replicates [45]. The resulting phylogenetic tree was subsequently visualized and refined using the Interactive Tree Of Life (iTOL v7, https://itol.embl.de/, accessed on 5 September 2025) [46]. These four species were selected for comparative phylogenetic analysis based on their evolutionary relationships with litchi and their respective research values. D. longan is a closely related confamilial species within Sapindaceae; its inclusion enables investigation of the recent evolutionary diversification of the GRAS family accompanying lineage divergence at the family level. A. thaliana serves as the most extensively characterized dicot model organism, with well-defined GRAS subfamily classification and validated functional annotations, providing a robust reference for subfamily assignment and putative function inference of litchi GRAS members. As a representative basal core eudicot with a highly conserved ancestral genome structure free of lineage-specific whole-genome duplication events, V. vinifera was adopted to evaluate the deep evolutionary conservation and ancient expansion patterns of the GRAS family across eudicot lineages.
2.3. Gene Structure and Conserved Motif Analysis of the LcGRAS Gene Family
The full-length genomic DNA sequences, coding sequences (CDS), and untranslated region (UTR) annotations of LcGRAS genes were extracted from the SapBase database (www.sapindaceae.com, accessed on 5 September 2025) [39]. Gene structure analysis, including exon–intron organization as well as the distribution of 5′ and 3′ UTRs, was visualized using the Gene Structure Display Server (GSDS 2.0, http://gsds.gao-lab.org/index.php, accessed on 5 September 2025) [47]. The LcGRAS protein sequences were submitted to MEME (https://meme-suite.org, accessed on 5 September 2025), and the conserved motifs of LcGRAS proteins were analyzed, with the maximum number of motifs set to 10, the length of the motifs set to 6–150 amino acids, and the other parameters set to default values [48]. For promoter analysis, the 2,000 bp genomic sequence immediately upstream of the translation start codon (ATG) of each LcGRAS gene was extracted from the SapBase database (www.sapindaceae.com, accessed on 5 September 2025) [39]. Cis-acting element prediction was performed using the PlantCARE database (https://plantcare.app, accessed on 5 September 2025) [49] under the default search mode, which allows any number of motif occurrences per input sequence. All predicted cis-elements were subsequently categorized into three functional groups (hormone-responsive, stress-responsive, and development-related), and redundant or low-confidence annotations were manually filtered for downstream quantitative analysis.
2.4. Collinearity Analysis of Members of the LcGRAS Gene Family
Genome sequences and annotation files for Arabidopsis and grape were downloaded from the Ensembl Plant database (https://jun2026-plants.ensembl.org/index.html, accessed on 5 September 2025), whereas those for litchi and longan were obtained from the SapBase database (www.sapindaceae.com accessed on 5 September 2025) [39,44]. The MCScanX function in the TBtools software was used to analyze intraspecific colinearity and tandem duplication events within the litchi GRAS gene family, as well as interspecific colinearity between litchi and Arabidopsis, longan, and grape. Additionally, the TBtools software was used to calculate the nonsynonymous substitution rate (Ka), synonymous substitution rate (Ks), and the Ka/Ks ratio for duplicated and tandemly duplicated gene pairs.
2.5. Analysis of Expression Patterns of Members of the LcGRAS Gene Family
This study first analyzed the expression patterns of the LcGRAS gene family in 12 different tissues and organs (including carpopodium, aril, seed, pericarp, ovary, sterile stamens, leaf, stamens, stigma, female flower, male flower, fruitlet) based on spatiotemporal transcriptomic data from the SapBase database (www.sapindaceae.com accessed on 5 September 2025) [39]. Second, using existing publicly available data, we compiled fruit development data (pericarp and pulp) for the Huai Zhi (HZ) variety at 30, 60, 75 and 85 days after flowering and fruits of uniform shape, size, and color were selected at each developmental stage [50]. For the in-house JGHN (Jinggang Hongnuo) transcriptomic dataset, fruits were collected at five developmental stages (45, 55, 65, 75 and 85 days) from an orchard at Guangxi University, Nanning, China. At each stage, three biological replicates were collected from three independent trees. Each biological replicate consisted of eight fruits collected from different orientations of one tree. The pericarp and pulp were separated after sampling and immediately frozen in liquid nitrogen for subsequent analysis. All samples underwent transcriptomic sequencing on the DNBSEQ-T7 platform (BGI Genomics Co., Ltd., Shenzhen, China). Raw sequencing reads of HZ and JGHN transcriptome were aligned to the reference genome of Feizixiao litchi using Hisat2 (v2.2.3). Picard (v2.25.5) was applied to remove PCR duplicates, and FeatureCounts (v2.0.6) was used to calculate gene expression counts following previously reported RNA-seq workflows [51,52]. Finally, the expression levels of GRAS family genes were extracted for subsequent analysis. Genes with a mean expression value greater than 0.5 across the five developmental stages were considered expressed in the corresponding tissue [53].
The expression levels of the 55 GRAS genes across the samples were Z-score normalized and subjected to soft clustering using the Mfuzz function on the Wu Kong platform (https://wkomics.omicsolution.com/wkomics/main/, accessed on 5 July 2026). The number of clusters (c) was set to four, and the fuzzification parameter (m) was set to 1.35. The genes were assigned to four expression clusters based on the clustering results.
3. Results
3.1. Identification, Physical and Chemical Properties of LcGRAS Gene Family
Fifty-five LcGRAS gene members were identified in litchi and named LcGRAS1–LcGRAS55 based on their chromosomal locations. Analysis of the physicochemical properties of LcGRASs (Table S1) revealed that the number of amino acids ranged from a minimum of 346 to a maximum of 771. The molecular weight spanned from 38.65 kDa to 84.79 kDa. The theoretical isoelectric point ranged from 4.43 to 9.26, indicating that the LcGRAS family contains both acidic and alkaline protein members. The aliphatic indices of LcGRAS proteins varied widely, ranging from 71.26 to 118.53. The grand average of hydropathicity (GRAVY) of litchi GRAS proteins ranged from -0.592 to 0.207. Only LcGRAS13, LcGRAS35, and LcGRAS39 were hydrophobic proteins, while the remaining 52 proteins were hydrophilic. The instability index analysis indicated that, except for LcGRAS22, LcGRAS23, LcGRAS25, LcGRAS26, LcGRAS35, and LcGRAS48, the remaining 49 proteins had instability indices greater than 40, suggesting they belong to the unstable protein category. Subcellular localization predictions indicated that 29 members are likely localized to the nucleus, 16 members to the chloroplast, and the remaining 10 members to the cytoplasm.
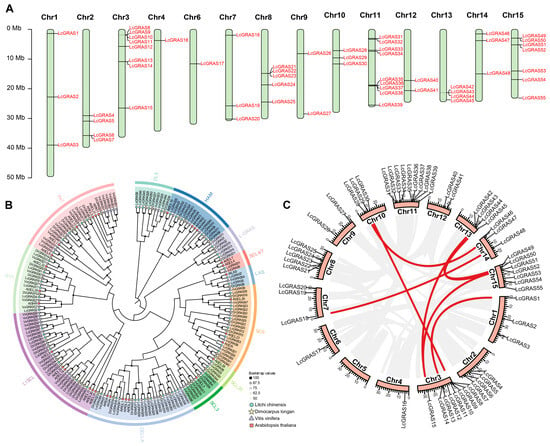
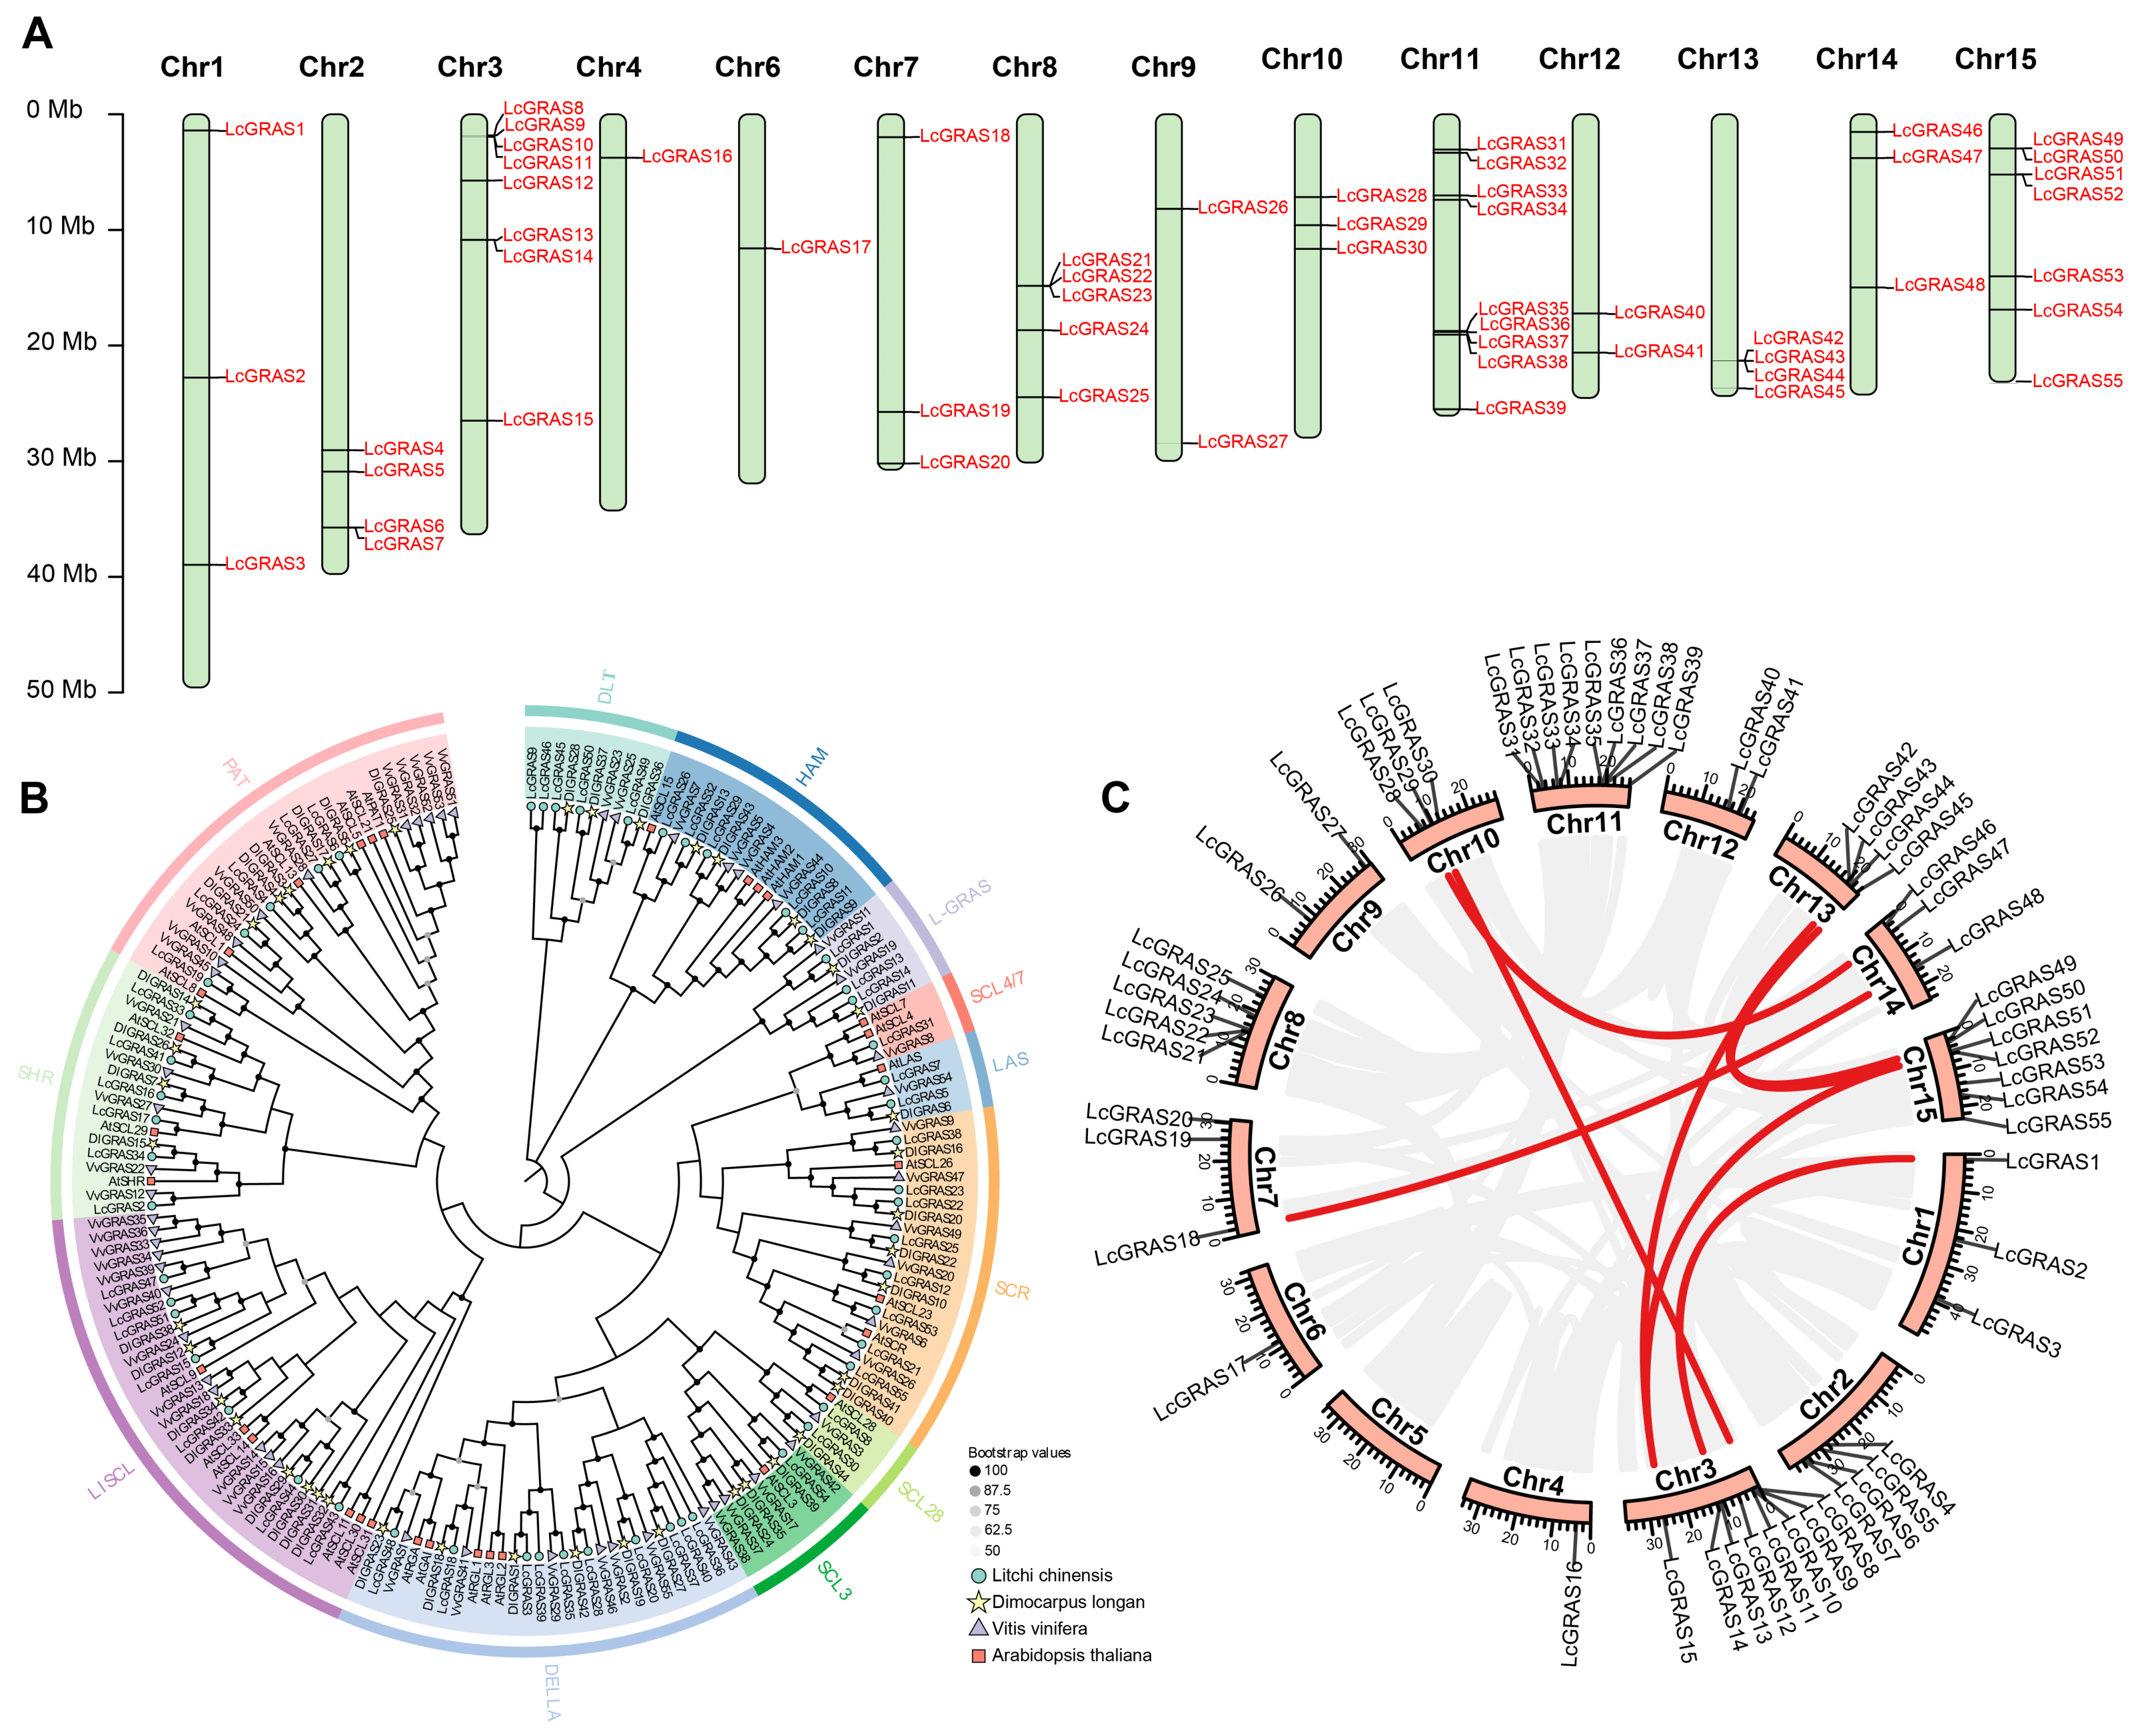
Chromosomal location analysis indicated that fifty-five LcGRAS genes were distributed across fourteen chromosomes (Chr1, Chr2, Chr3, Chr4, Chr6, Chr7, Chr8, Chr9, Chr10, Chr11, Chr12, Chr13, Chr14, and Chr15) of litchi (Figure 1A). Among these, nine LcGRAS genes were identified on Chr11, followed by eight LcGRAS genes on Chr3. In contrast, only one LcGRAS gene was identified on each of Chr4 and Chr6.
Figure 1.
Chromosomal mapping, phylogenetic analysis, and intra-species collinearity analysis of the LcGRAS gene family. (A) Chromosome distribution of the LcGRAS genes on litchi genome. (B) Phylogenetic analysis of GRAS in litchi (Lc), Arabidopsis thaliana (At), longan (Dl), grape (Vv). (C) Syntenic relationship of GRAS genes in Litchi chinensis.
To extend our understanding of the evolutionary relationships of LcGRAS genes, we constructed a phylogenetic tree using the full-length protein sequences of GRAS family members from litchi, Arabidopsis thaliana, longan, and grape. According to the classification standard for Arabidopsis GRAS genes, the fifty-five litchi GRAS proteins clustered into twelve subclades (Figure 1B): DLT, HAM, LAS, L-GRAS, SCL4/7, SCR, SCL28, SCL3, DELLA, LISCL, SHR, and PAT. Among these, the DELLA subfamily comprised the largest numbers of members, containing ten LcGRAS members (Table S2).
To better characterize the evolutionary expansion of the LcGRAS genes, we investigated duplication events of the LcGRAS gene family using MCScanX. The detection parameters were set as follows: protein sequence identity ≥ 70%, e-value ≤ 1 × 10⁻⁵, and a maximum of 10 intervening genes allowed between tandem duplicated pairs. The results showed that eight segmental duplication events involving 14 LcGRAS genes were identified (Figure 1C, Table S3). Meanwhile, re-inspection of adjacent chromosomal loci revealed candidate tandem duplication pairs, such as LcGRAS51 and LcGRAS52. Both genes encode proteins of 752 amino acids with nearly identical molecular weight and isoelectric point, which are typical signatures of tandem duplicates. This observation is consistent with previous reports of tandem duplications in the litchi and longan GRAS families, indicating that tandem duplication also contributes to the expansion of the LcGRAS family.
To investigate the natural selection constraints acting on the LcGRAS gene family during evolution, we calculated the Ka/Ks (ratio of nonsynonymous substitution rate to synonymous substitution rate) for all identified segmental duplicated gene pairs. As shown in Table S3, the Ka/Ks values of these segmental duplicated pairs ranged from 0.10 to 0.29, all of which were well below 1.
Combined with genome-wide duplication event analysis, segmental duplication serves as an important driving force for LcGRAS family expansion, while tandem duplication also participates in the expansion of partial gene loci. The Ka/Ks results further demonstrate that the LcGRAS gene family has been subject to strong purifying selection throughout its evolutionary diversification, thus preserving high sequence conservation in functional protein-coding regions.
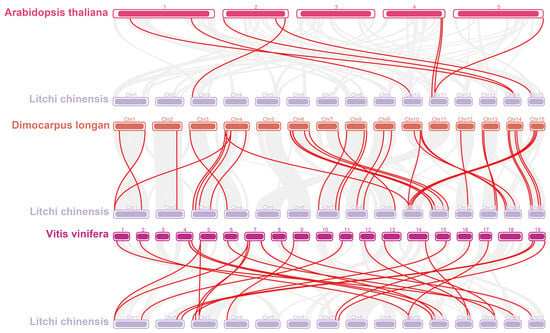
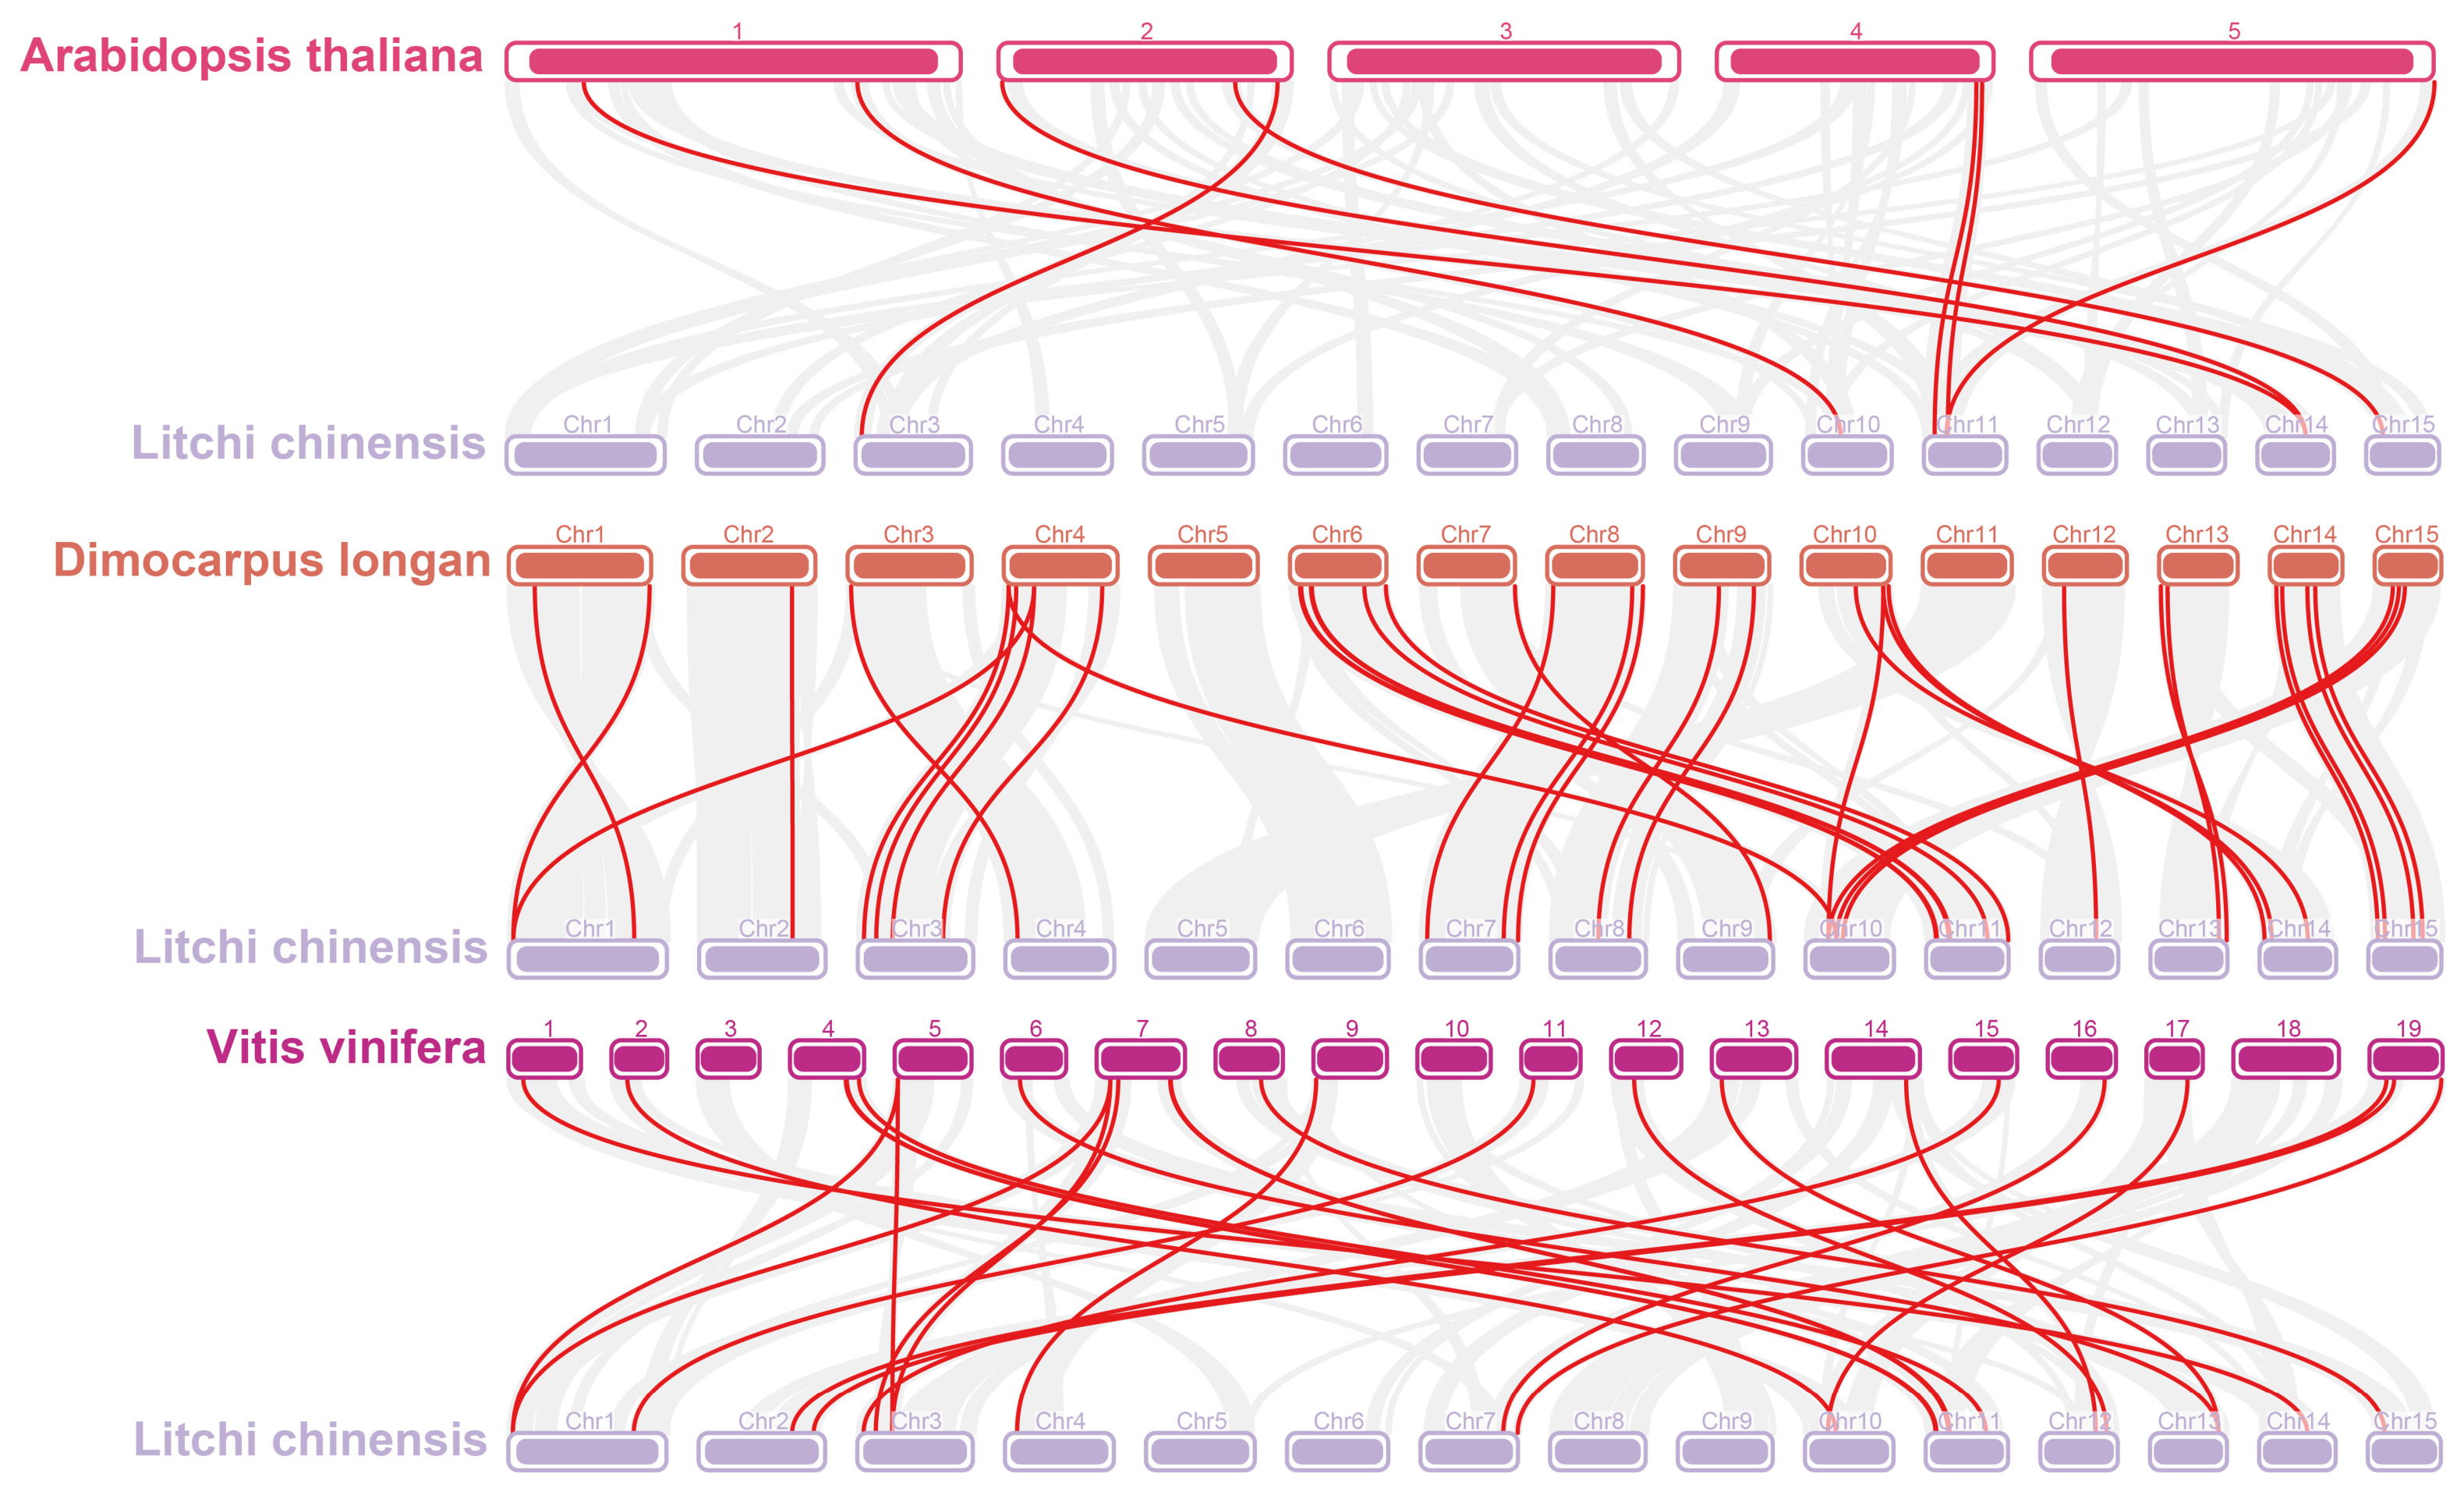
To investigate the evolutionary relationships within the LcGRAS gene family, a cross-species collinearity analysis was conducted across four representative species (four dicotyledons: Litchi chinensis, Longan chinensis, Vitis vinifera, and Arabidopsis thaliana) (Figure 2). The results indicate that litchi shares eight pairs of collinear genes with the herbaceous plant Arabidopsis thaliana and twenty-four pairs with the woody vine grapevine. Litchi exhibits thirty-four pairs of collinear genes with the woody plant longan, suggesting a closer homologous evolutionary relationship between the GRAS gene families of litchi and longan. This finding provides insights for subsequent studies on the function of the LcGRAS gene.
Figure 2.
Interspecific collinearity relationship between LcGRAS genes and GRASs from Arabidopsis thaliana, longan, grape.
3.2. Analysis of Gene Structure, Conservative Motifs, and Domains in the LcGRAS Gene Family
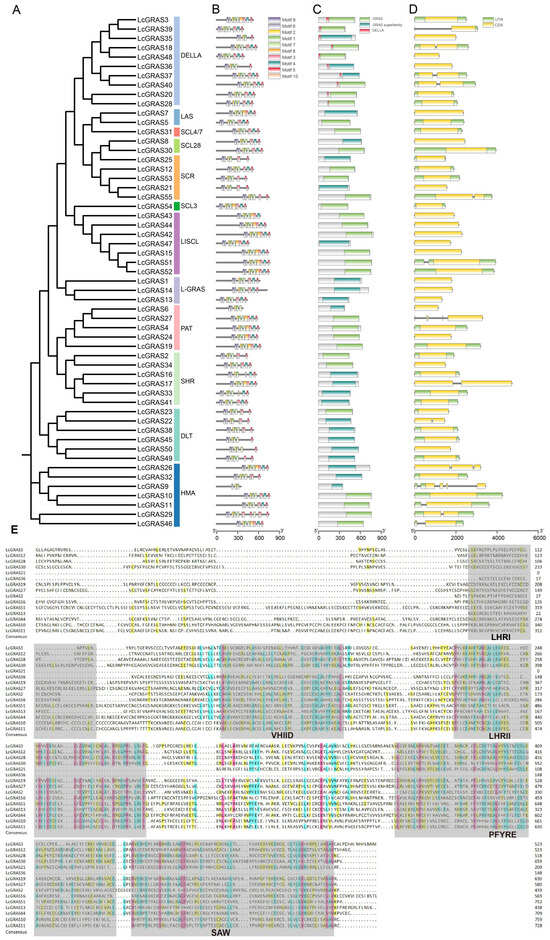
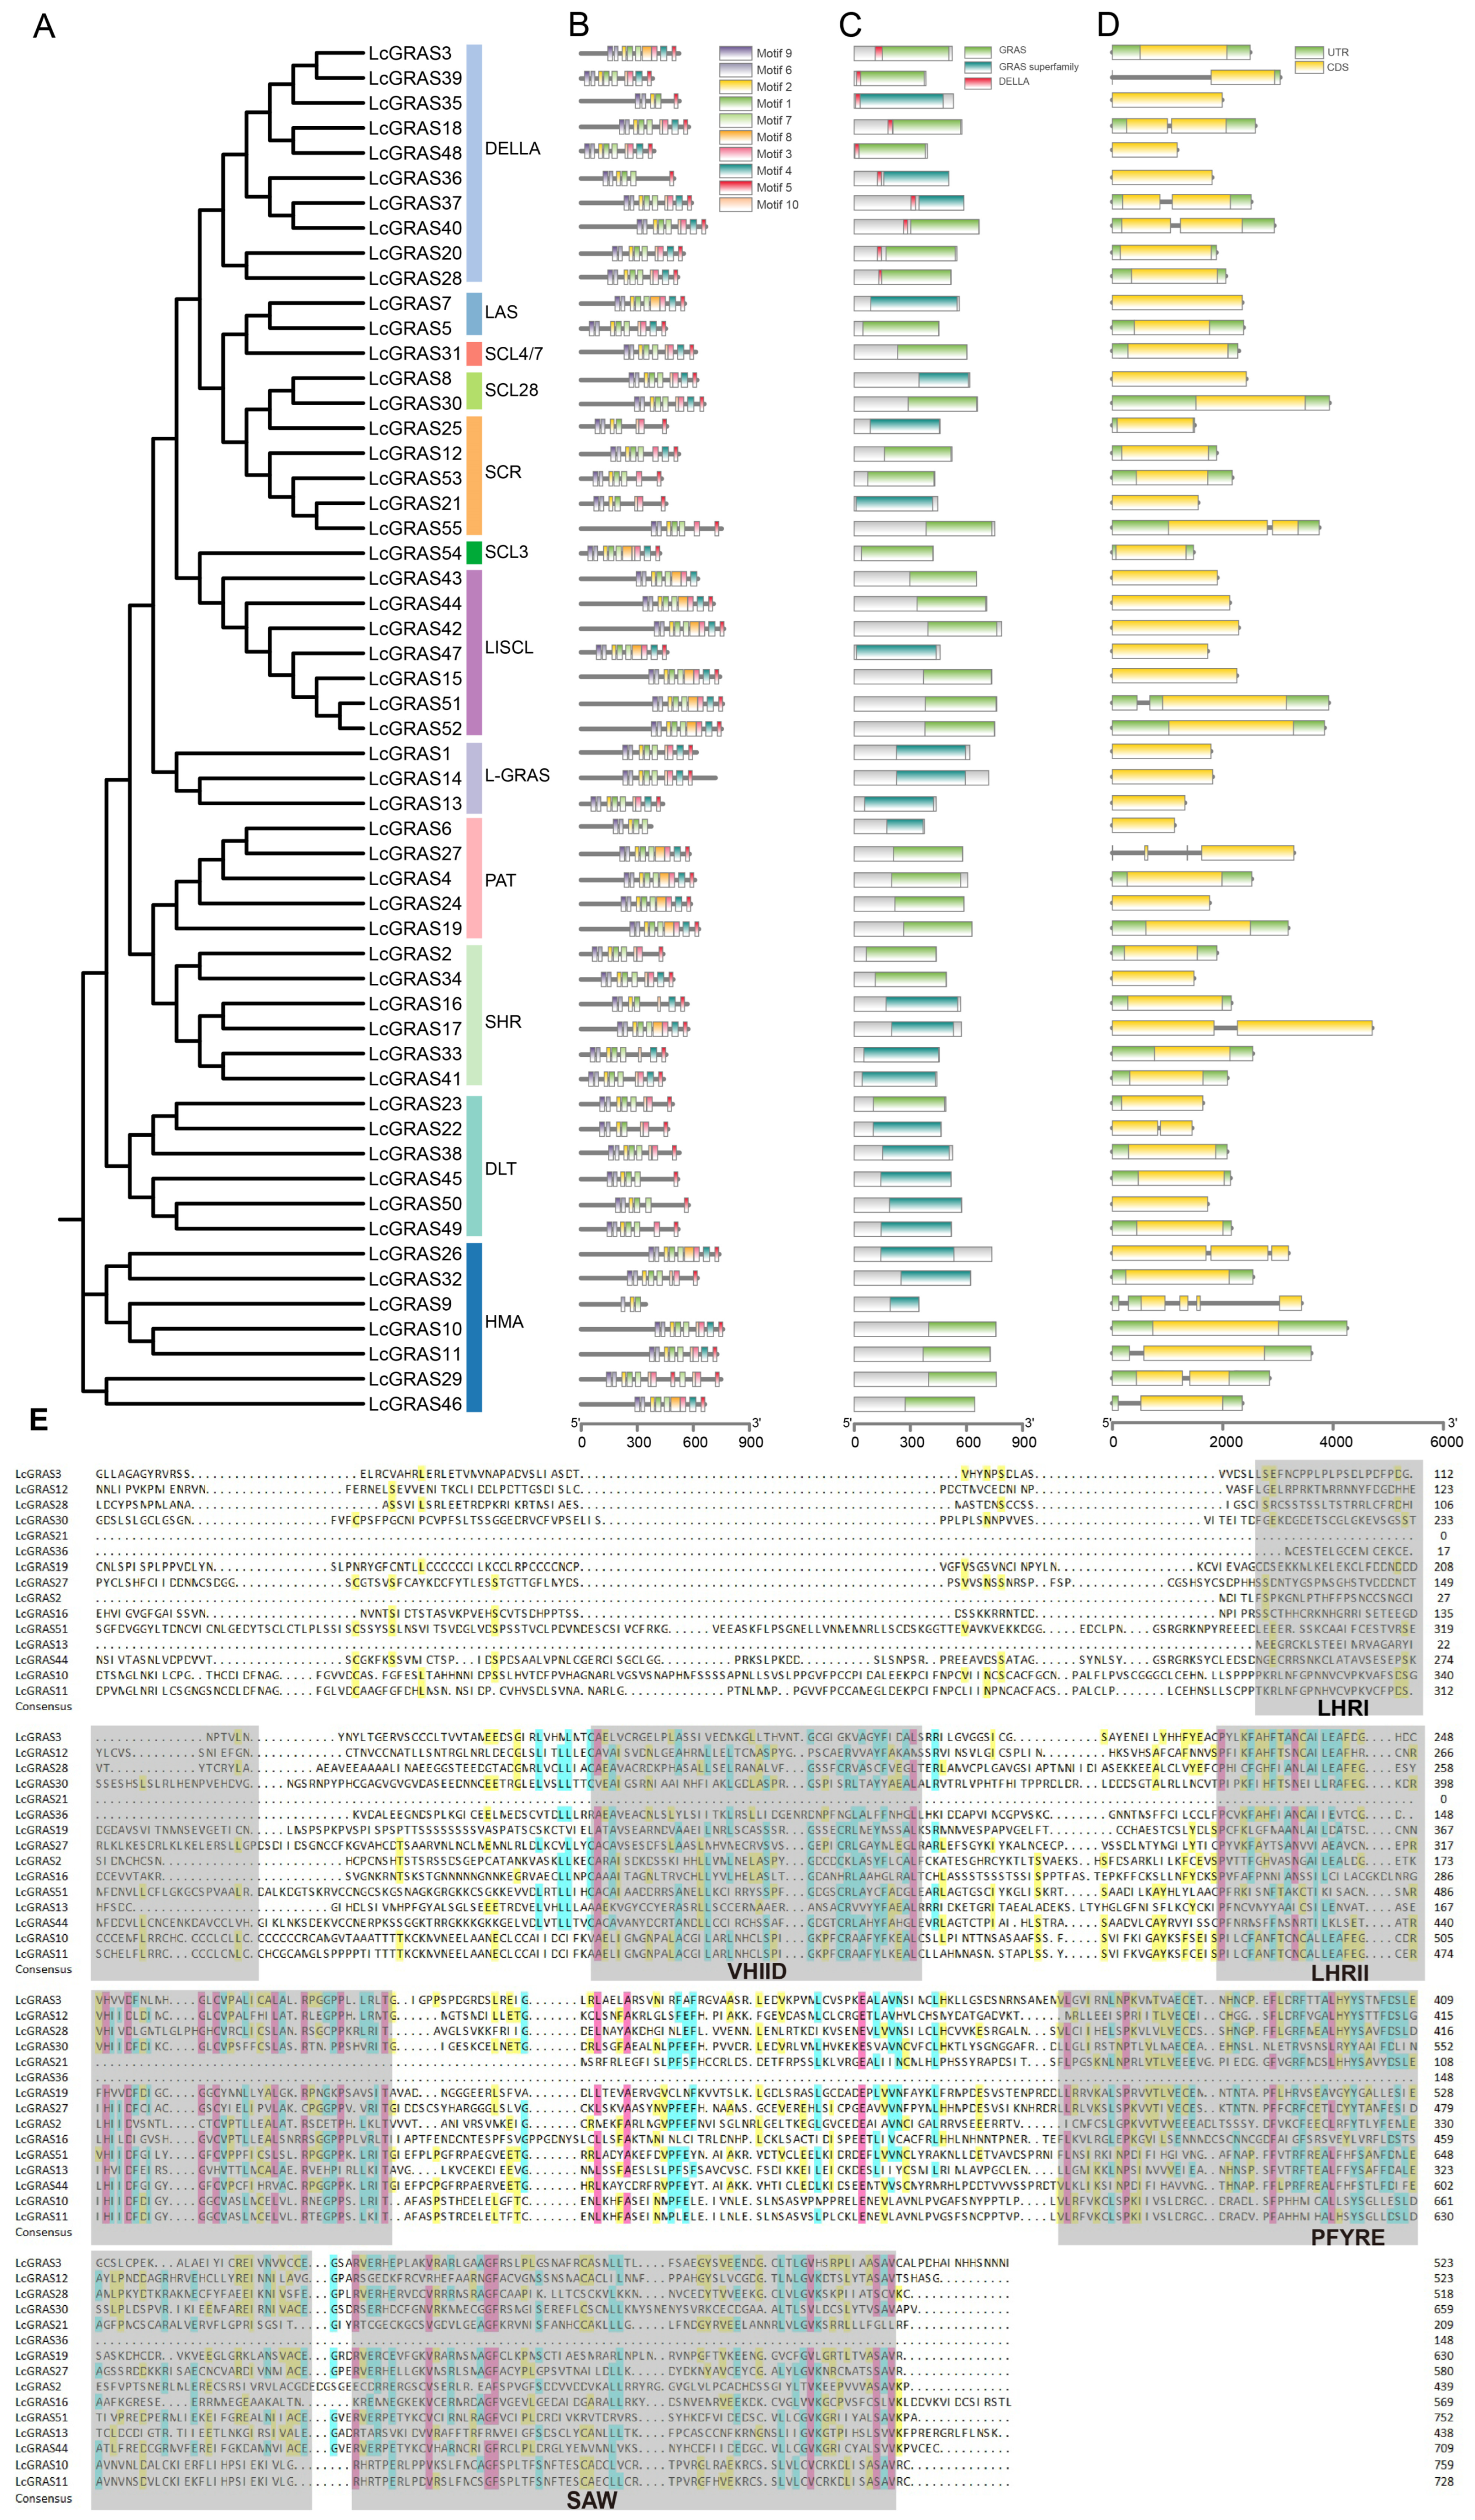
To investigate the structural conservation and evolutionary divergence of the LcGRAS family, an integrative view combining the phylogenetic tree, conserved motifs, functional domains and gene structures was constructed (Figure 3A–D).
Figure 3.
Structural and sequence characteristics of the LcGRAS family proteins. (A–D) Conserved motifs, domains, and gene structures of the LcGRAS gene family. (E) Multiple sequence alignment analysis of LcGRAS.
In total, 10 conserved motifs (Motif 1–Motif 10) were identified in LcGRAS proteins via MEME analysis (Figure 3B). Motif 2, Motif 6 and Motif 9 were present in almost all members with a conserved sequential order, representing the core conserved elements of the family. In agreement with the phylogenetic classification, members within the same subfamily generally displayed similar motif distribution patterns, whereas pronounced differences in motif composition and arrangement were found between subfamilies such as DLT and HAM. Notably, partial motif loss was observed in several individual members including LcGRAS3, LcGRAS9, LcGRAS10, LcGRAS11 and LcGRAS29, suggesting gene-specific structural differentiation during family evolution. Conserved domain analysis verified that all LcGRAS proteins harbored the canonical GRAS domain, and some members were annotated as the GRAS superfamily domain (Figure 3C). Gene structure analysis revealed that all LcGRAS genes contained coding sequences (CDSs), with genomic lengths varying from hundreds to thousands of base pairs (Figure 3D). Genes clustered in the same phylogenetic clade tended to share similar exon-intron organizations. Nevertheless, LcGRAS members with comparable motif profiles could still exhibit distinct gene structures, indicating that gene structural variations are not fully coupled with motif divergence. In addition, multiple sequence alignment analysis shows that the GRAS protein in litchi contains a large number of conserved amino acid residues (Figure 3E).
Taken together, the LcGRAS family retains a conserved core structural backbone, while subfamily-specific and gene-specific structural variations have accumulated during evolution, which may lay the structural basis for functional diversification of this transcription factor family.
3.3. Analysis of LcGRAS Gene Family Expression Levels in Different Tissues
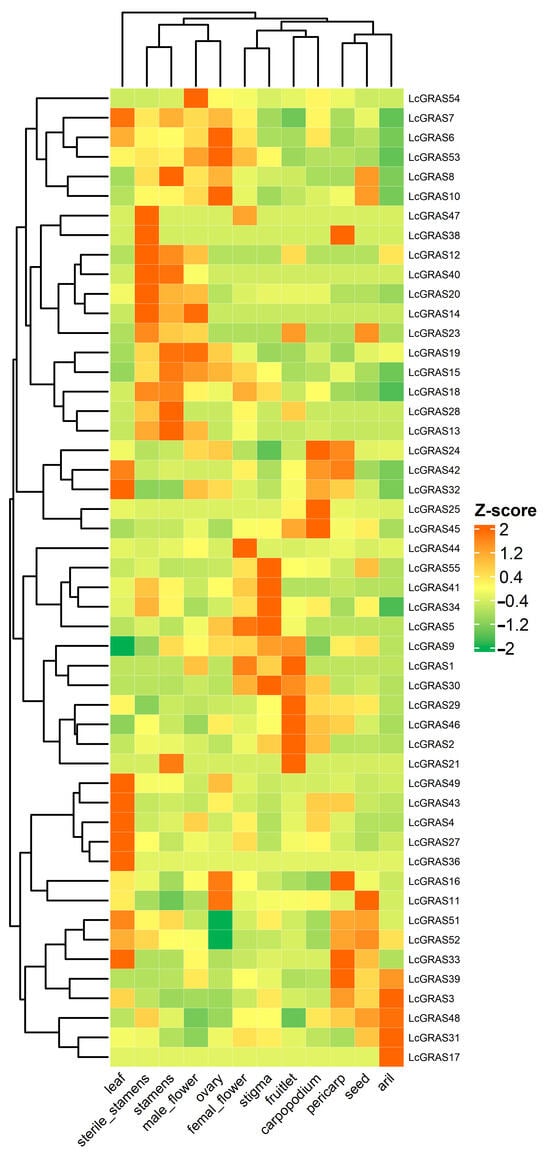
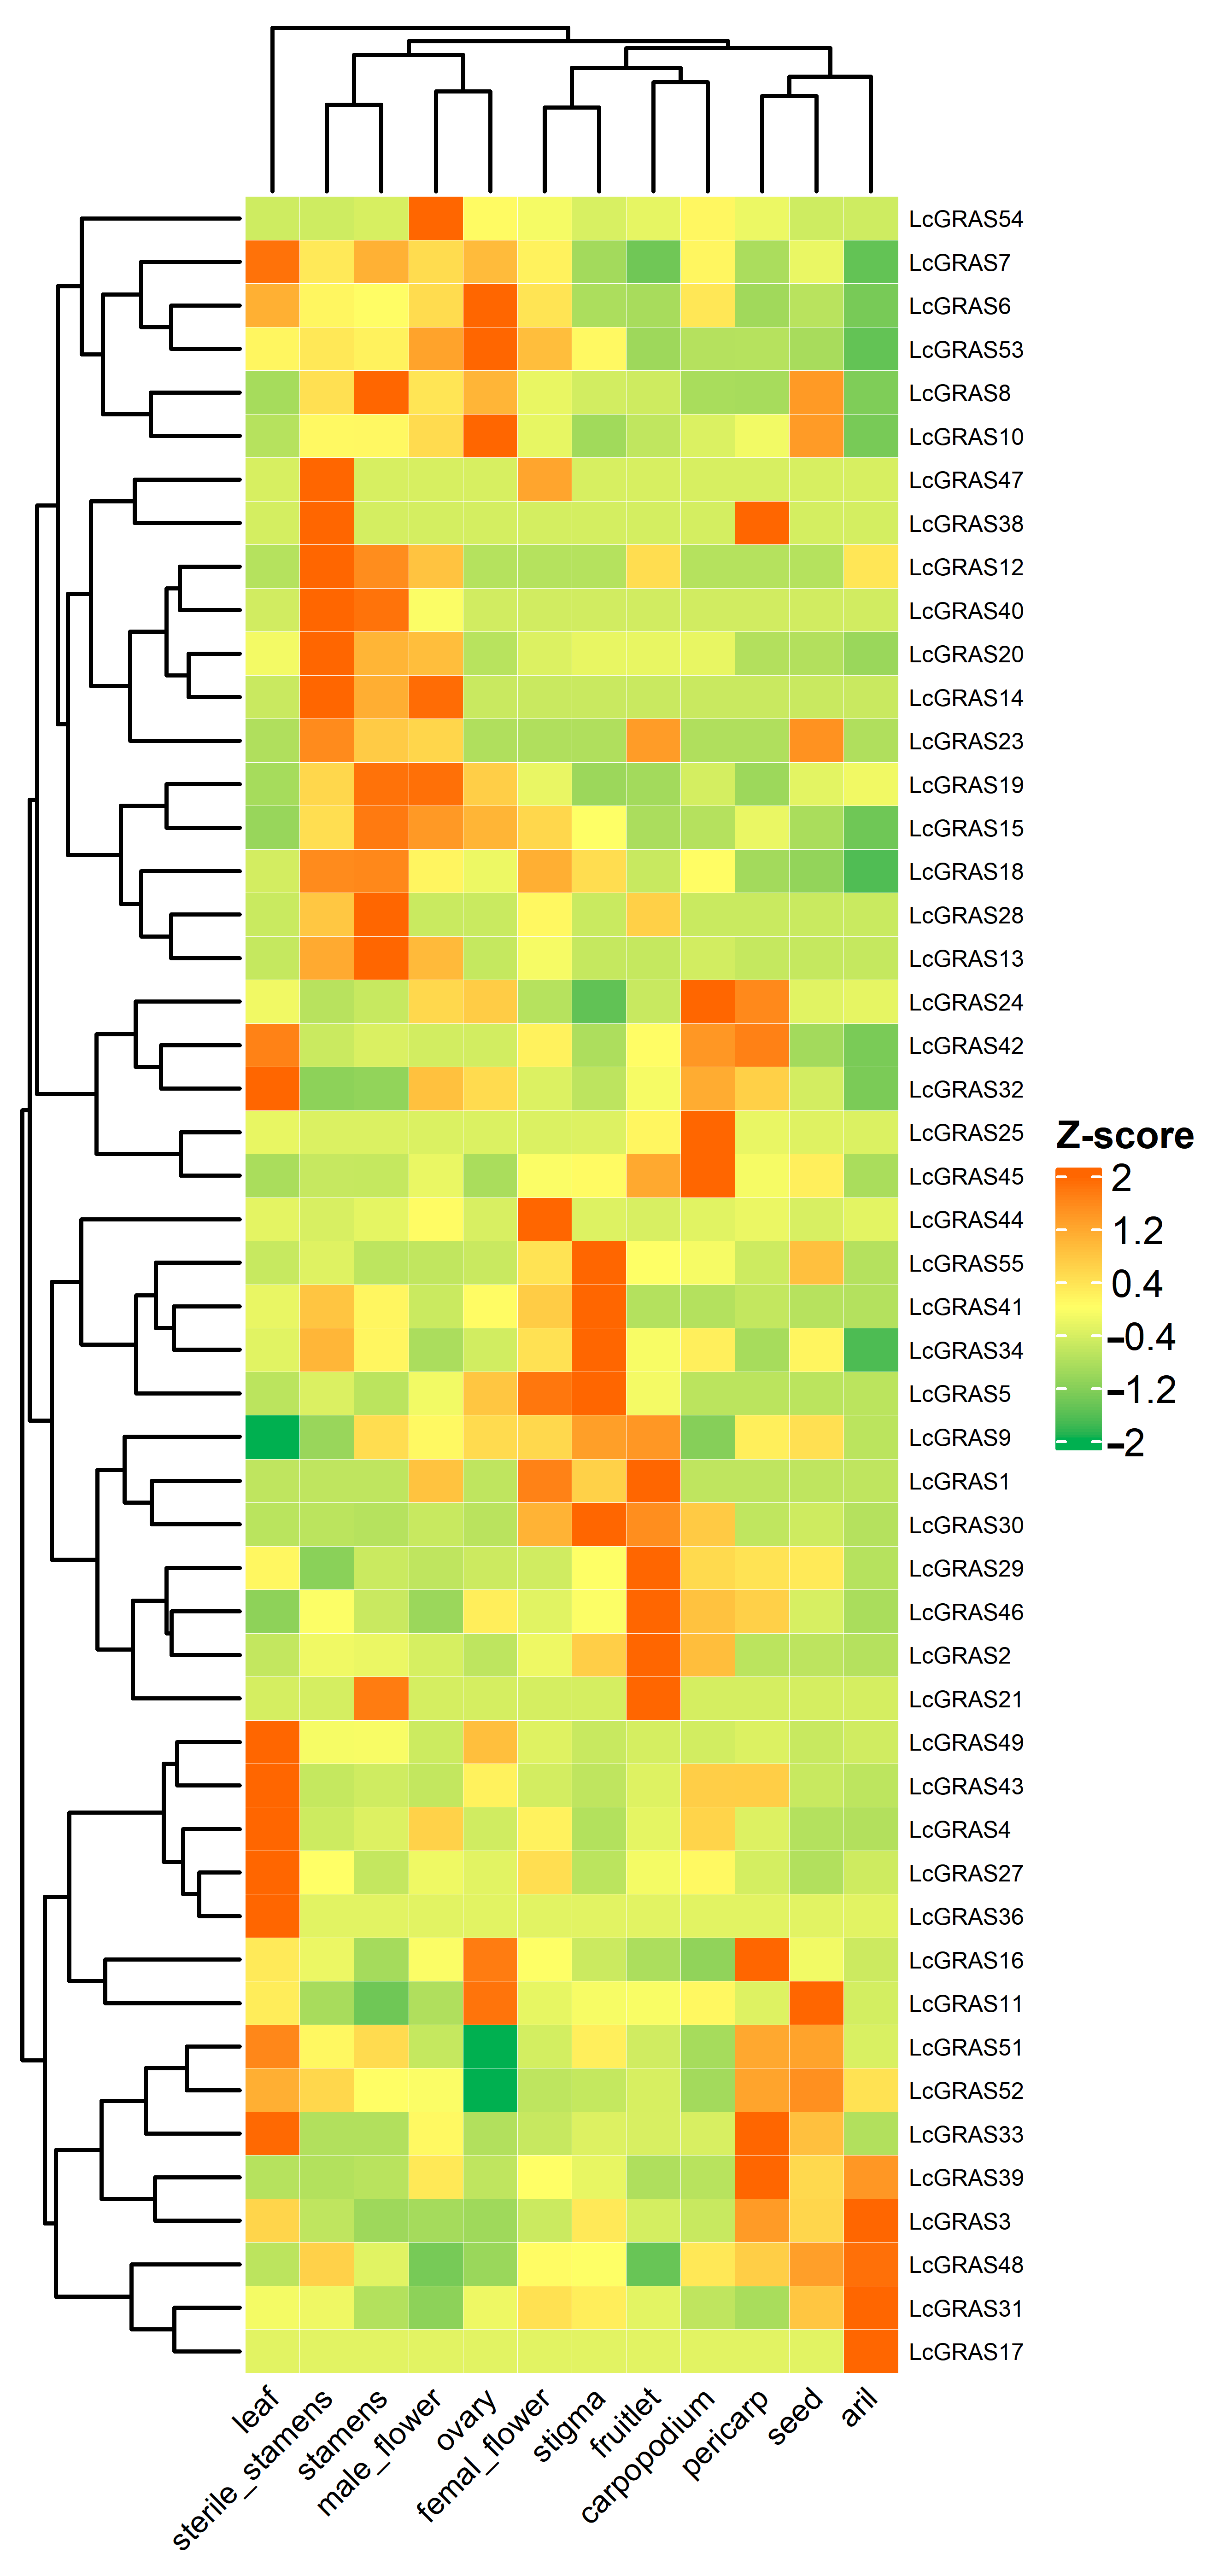
To elucidate the function of LcGRAS genes in litchi, we analyzed the spatiotemporal expression patterns of the LcGRAS gene family across different tissues using litchi transcriptomic data from the SapBase database (www.sapindaceae.com accessed on 5 September 2025). Expression levels of LcGRAS genes were examined in twelve distinct tissues (carpopodium, aril, seed, pericarp, ovary, sterile stamens, leaf, stamens, stigma, female flower, male flower, and fruitlet) (Figure 4). Results revealed that not all LcGRAS family members were expressed in every tissue, and their expression levels varied significantly across tissues. For instance, LcGRAS17 was expressed only in aril, LcGRAS36 only in leaf, LcGRAS21 only in stamens and fruitlet, LcGRAS38 only in pericarp and sterile stamens, and LcGRAS47 only in sterile stamens and female flowers. In contrast, LcGRAS22, LcGRAS26, LcGRAS35, LcGRAS37, and LcGRAS50 had an expression value of zero (undetectable) in all twelve tissues examined in this database. Furthermore, LcGRAS6, LcGRAS7, LcGRAS53, and LcGRAS54 exhibit notably distinct tissue expression patterns. Therefore, it can be inferred that different members of the litchi GRAS family may participate in regulating the growth and development process of litchi, playing specific roles at different stages.
Figure 4.
Expression profile analysis of LcGRAS genes indifferent tissues of litchi.
3.4. Analysis of LcGRAS Gene Family Expression Levels Across Different Varieties and Developmental Stages
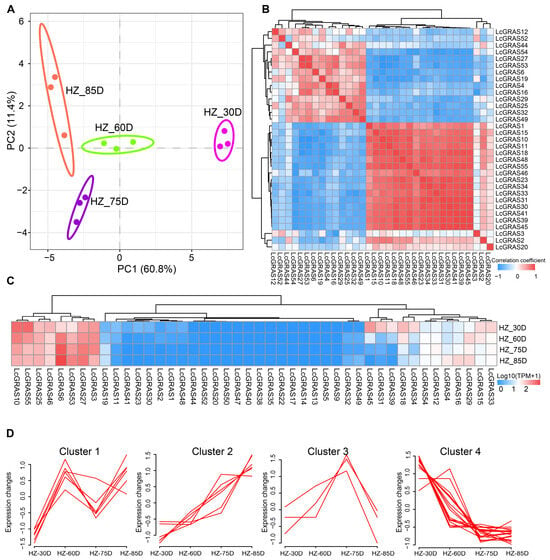
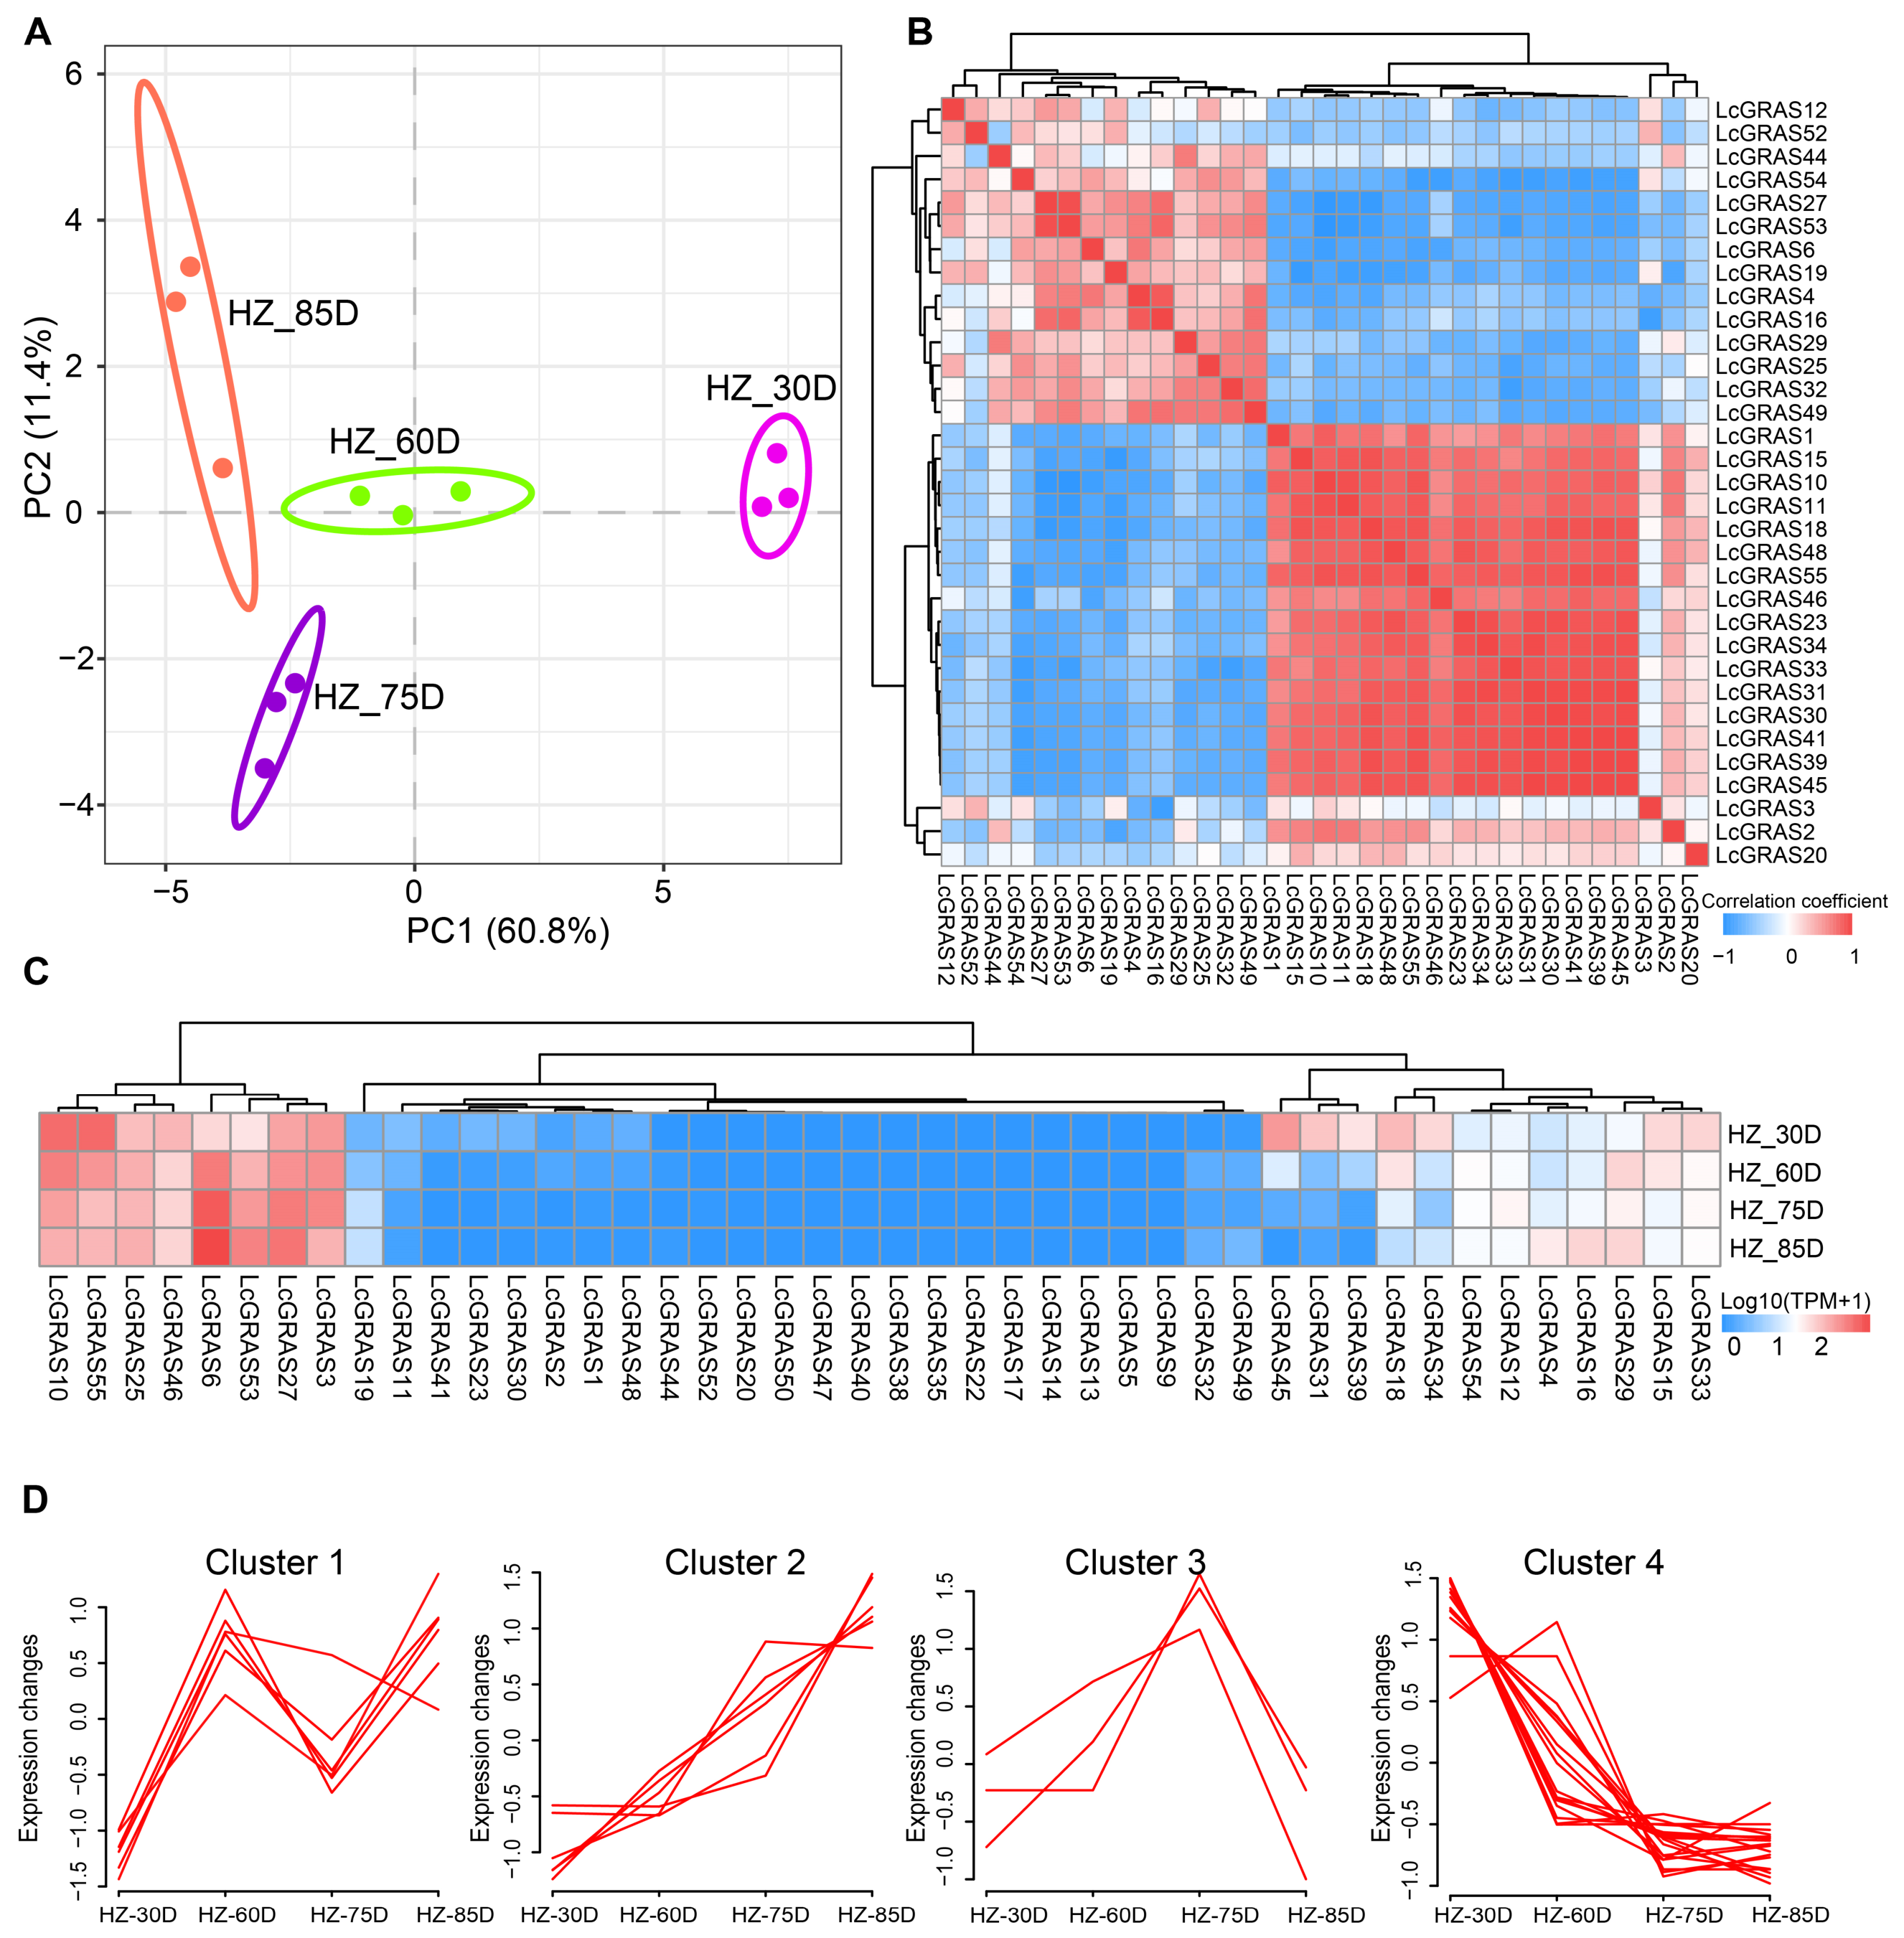
To investigate the dynamic expression regulation patterns of the GRAS gene family during litchi peel development, this study analyzed transcriptomic data from the peel of the HZ variety at four key developmental stages (30, 60, 75, and 85 days after flowering) to systematically explore the spatiotemporal expression patterns of 55 LcGRAS genes. Principal component analysis (PCA) showed that the expression profiles of LcGRAS genes separated according to pericarp developmental stage, with biological replicates from the same stage clustering closely, indicating consistent and reproducible expression data (Figure 5A). A heatmap of the LcGRAS gene co-expression network constructed based on Pearson correlation coefficients showed that the 55 LcGRAS genes could be clearly divided into two co-expression modules (Figure 5B). Genes within the same module exhibited strong positive correlations (correlation coefficients close to 1), whereas genes between the two modules showed strong negative correlations (correlation coefficients close to −1). These patterns indicate coordinated expression within modules and contrasting expression between modules. The results of hierarchical clustering analysis were highly consistent with those of PCA analysis; samples from different developmental stages clustered together first, further confirming the developmental stage specificity of LcGRAS gene expression (Figure 5C). Based on their expression profiles, the 55 LcGRAS genes were grouped into four clusters using Mfuzz. Cluster 1 genes showed their highest expression during early pericarp development (30D), followed by a progressive decline as development continued. Cluster 2 genes increased gradually in expression during pericarp maturation and reached a peak at 85D. Cluster 3 genes were most highly expressed during the rapid pericarp expansion stage (60D–75D). Cluster 4 genes exhibited a bimodal pattern, with elevated expression during both early and late developmental stages (Figure 5D).
Figure 5.
Gene expression pattern of LcGRAS during fruit development in HZ. (A) Principal component analysis. (B) Heatmap of intergenic expression correlations for LcGRAS. (C) Hierarchical clustering heatmap of LcGRAS gene expression levels across four stages of fruit development. (D) Line charts showing gene expression patterns for 4 expression clusters.
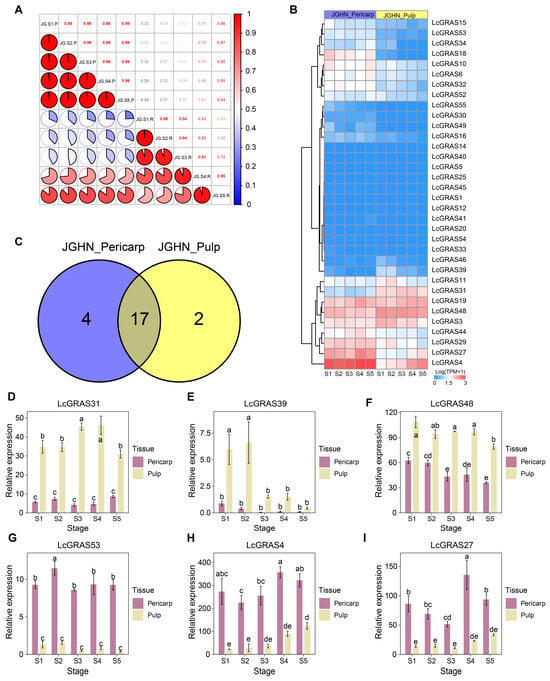
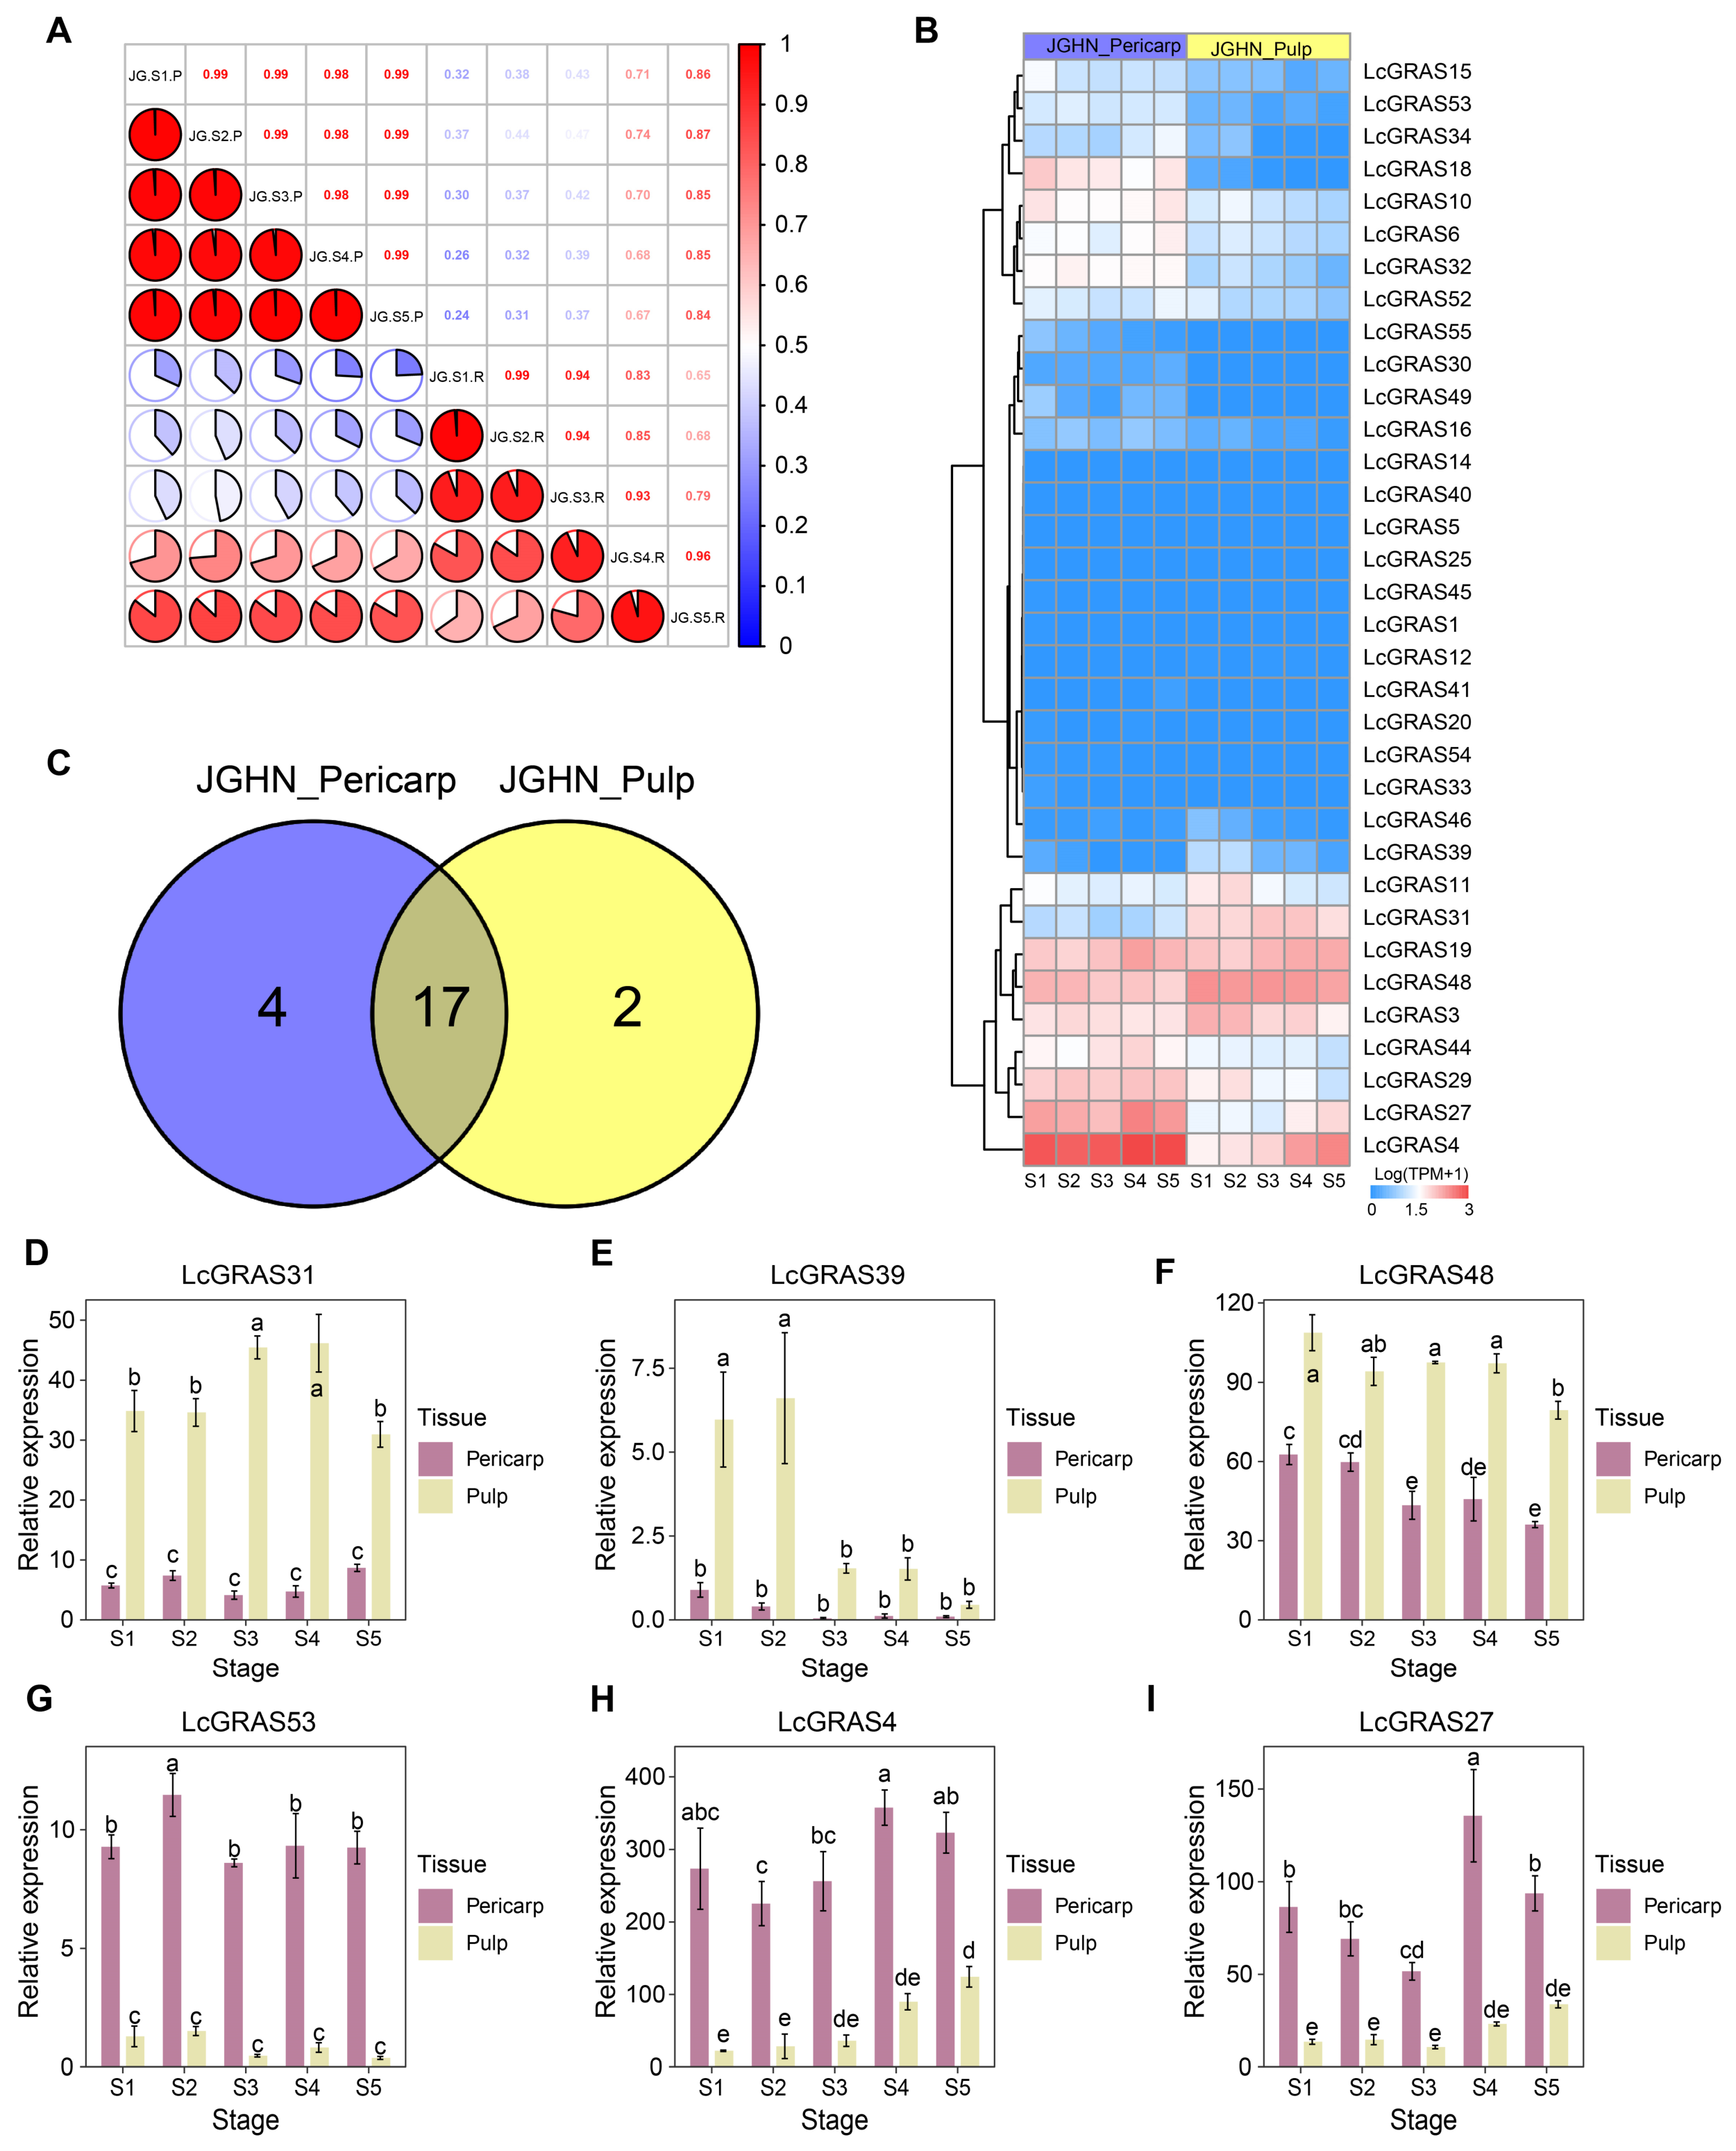
To further investigate the expression patterns of GRAS transcription factors in litchi fruit, this study used JGHN as the experimental material and performed transcriptomic sequencing on pericarp and pulp samples collected at five key stages of fruit development (S1–S5), comprehensively analyzing the tissue-specific expression patterns and dynamic regulatory characteristics of 55 LcGRAS genes. The gene-to-gene co-expression network (Figure 6A) was constructed based on the expression profiles of LcGRAS genes, revealing complex regulatory associations among family members. Multiple tightly clustered gene modules were identified in the network, within which LcGRAS genes exhibited strong positive expression correlations (correlation coefficients > 0.98), and some pairwise gene correlations even exceeded 0.99. This pattern suggests that genes within the same module may jointly participate in specific biological processes through coordinated expression regulation. Conversely, significant negative correlations were observed between genes from different modules, indicating that the LcGRAS gene family has undergone pronounced functional differentiation during long-term evolution. The heatmap of LcGRAS gene expression in the pericarp and pulp across five developmental stages (Figure 6B) clearly reveals tissue-specific and stage-specific gene expression patterns. Overall, the 55 LcGRAS genes can be classified into three major expression pattern groups: The first group of genes is highly expressed specifically in the peel and is almost not expressed in the pulp (e.g., LcGRAS15, LcGRAS53, LcGRAS34, etc.); the second group is highly expressed specifically in the flesh and has extremely low expression levels in the pericarp; the third group is expressed in both the pulp and the pericarp, but with significant differences in expression patterns. By identifying candidate genes that regulate peel and flesh traits in litchi fruit, we found 17 genes that were differentially expressed in both cases (Figure 6C). Furthermore, LcGRAS31, LcGRAS39, and LcGRAS48 were significantly more highly expressed in the pulp than in the pericarp at all developmental stages, whereas LcGRAS53, LcGRAS4, and LcGRAS27 were significantly more highly expressed in the pericarp than in the pulp at all stages (Figure 6D–I). These tissue-differentially expressed genes may be associated with tissue-specific physiological processes such as pericarp coloration and flesh enlargement; however, their specific roles require further experimental validation.
Figure 6.
Gene expression pattern of LcGRAS during fruit development in JGHN. (A) LcGRAS gene expression correlation heatmap. (B) Expression patterns of the LcGRAS gene in the pericarp and pulp. (C) Venn diagram showing the numbers of genes expressed in the pericarp, pulp, or both tissues. (D–I) Relative expression of six LcGRASs during litchi fruit development. Values are presented as mean ± SE of three biological replicates. Different letters indicate significant differences among groups according to ANOVA followed by Duncan’s multiple range test (p < 0.05).
3.5. Analysis of Potential Co-Expressed Genes Associated with the LcGRAS Gene Family
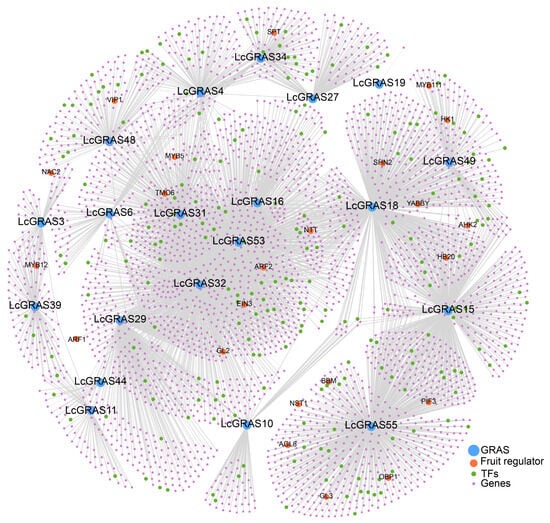
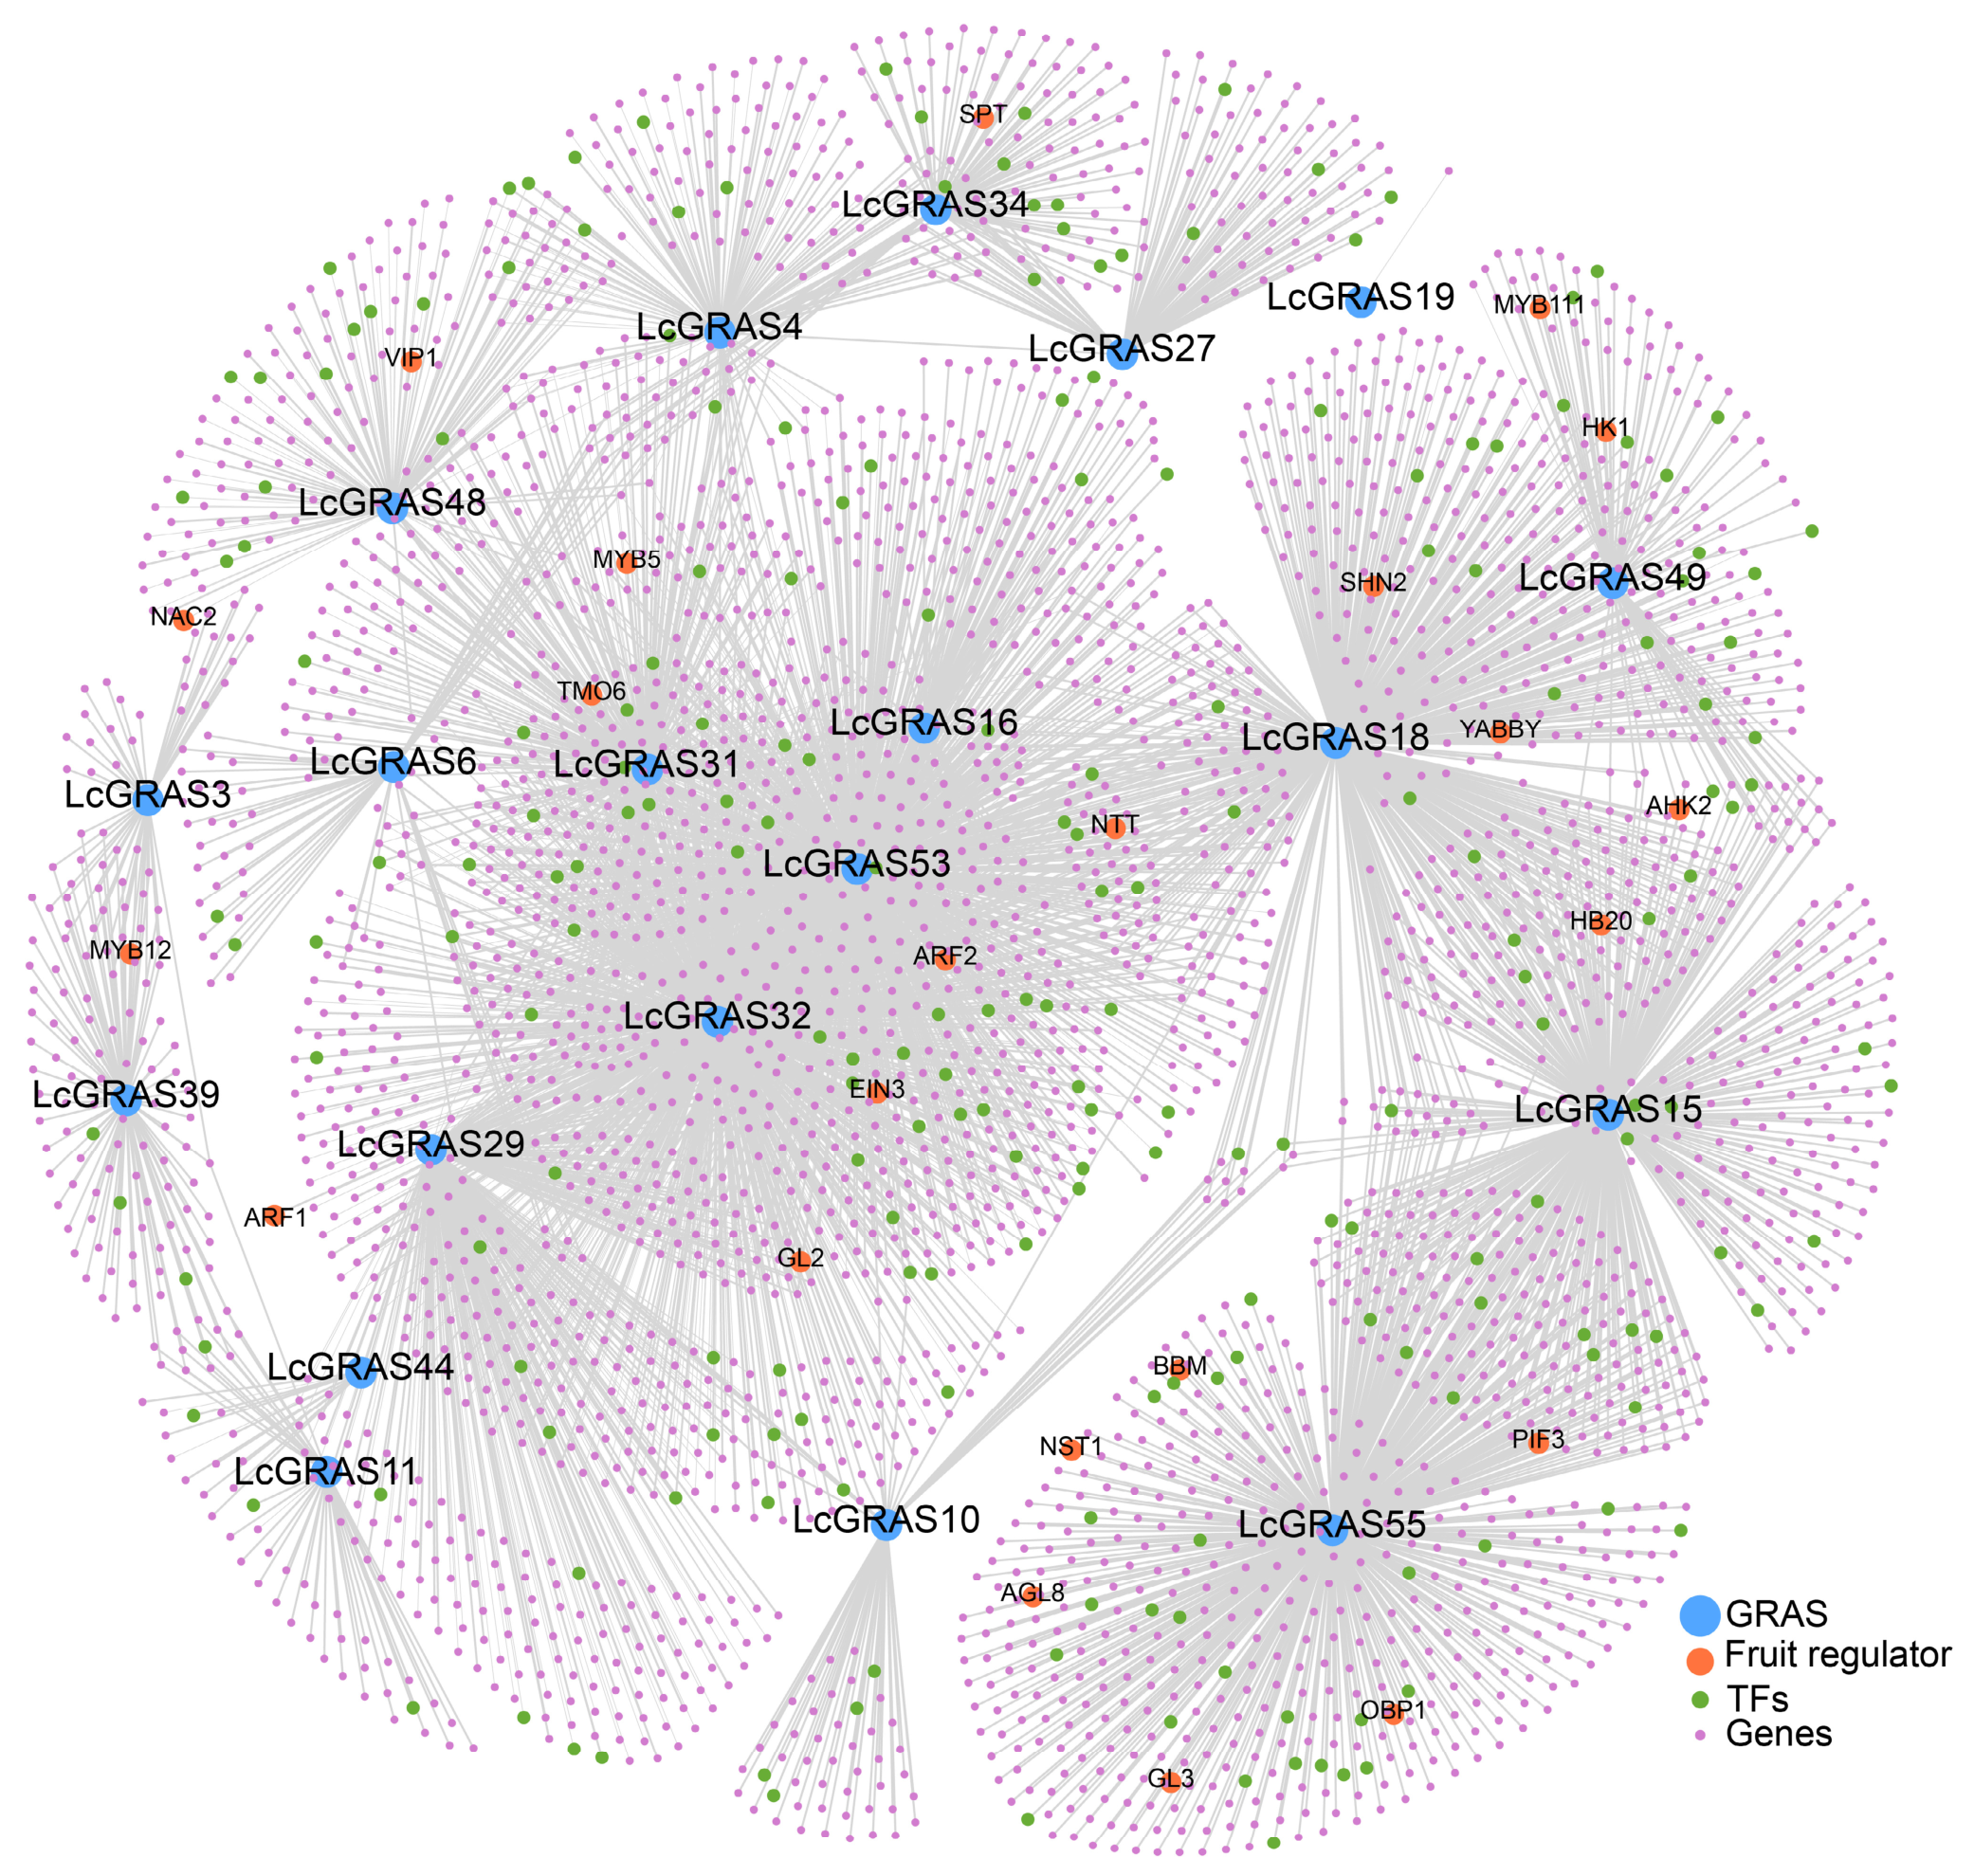
Based on transcriptomic data from the pericarp and pulp, we constructed a correlation network between LcGRAS family genes and genes annotated in the litchi genome (Figure 7). Gene pairs with an absolute correlation coefficient greater than 0.9 (|r| > 0.9) were retained for network construction. Network connectivity was calculated as the number of retained connections for each gene. The five genes with the highest connectivity values were identified as hub genes, including LcGRAS15, LcGRAS18, LcGRAS4, LcGRAS55 and LcGRAS32. Each of these hub genes was correlated with more than 100 genes, including multiple transcription factors. Furthermore, several transcription factor families were identified in the network that exhibit high co-expression with LcGRAS genes, including MYB (MYB5, MYB12, MYB111), NAC (NAC2, NST1, SHN2), ARF (ARF1, ARF2), YABBY, HB20, and GL3. Furthermore, the network identified significant co-expression relationships between the LcGRAS gene and several known key regulators of fruit development, including BBM (involved in cell division regulation), SBT (involved in proteolysis and fruit softening), PIF3 (involved in photoreception), GAI3 (involved in gibberellin signaling), and HK1 and AHK2 (involved in stress response).
Figure 7.
Correlation network of LcGRAS in fruit development in litchi.
3.6. Analysis of Cis-Acting Elements in the Promoters of the LcGRAS Gene Family
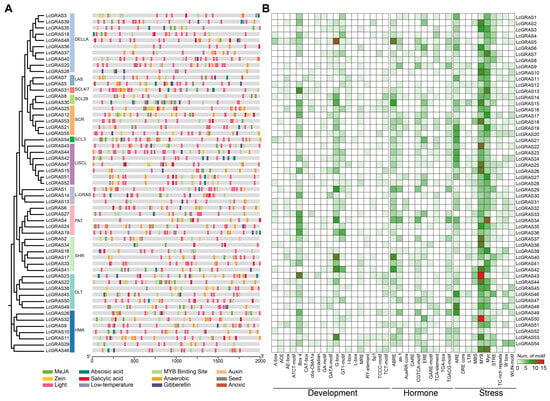
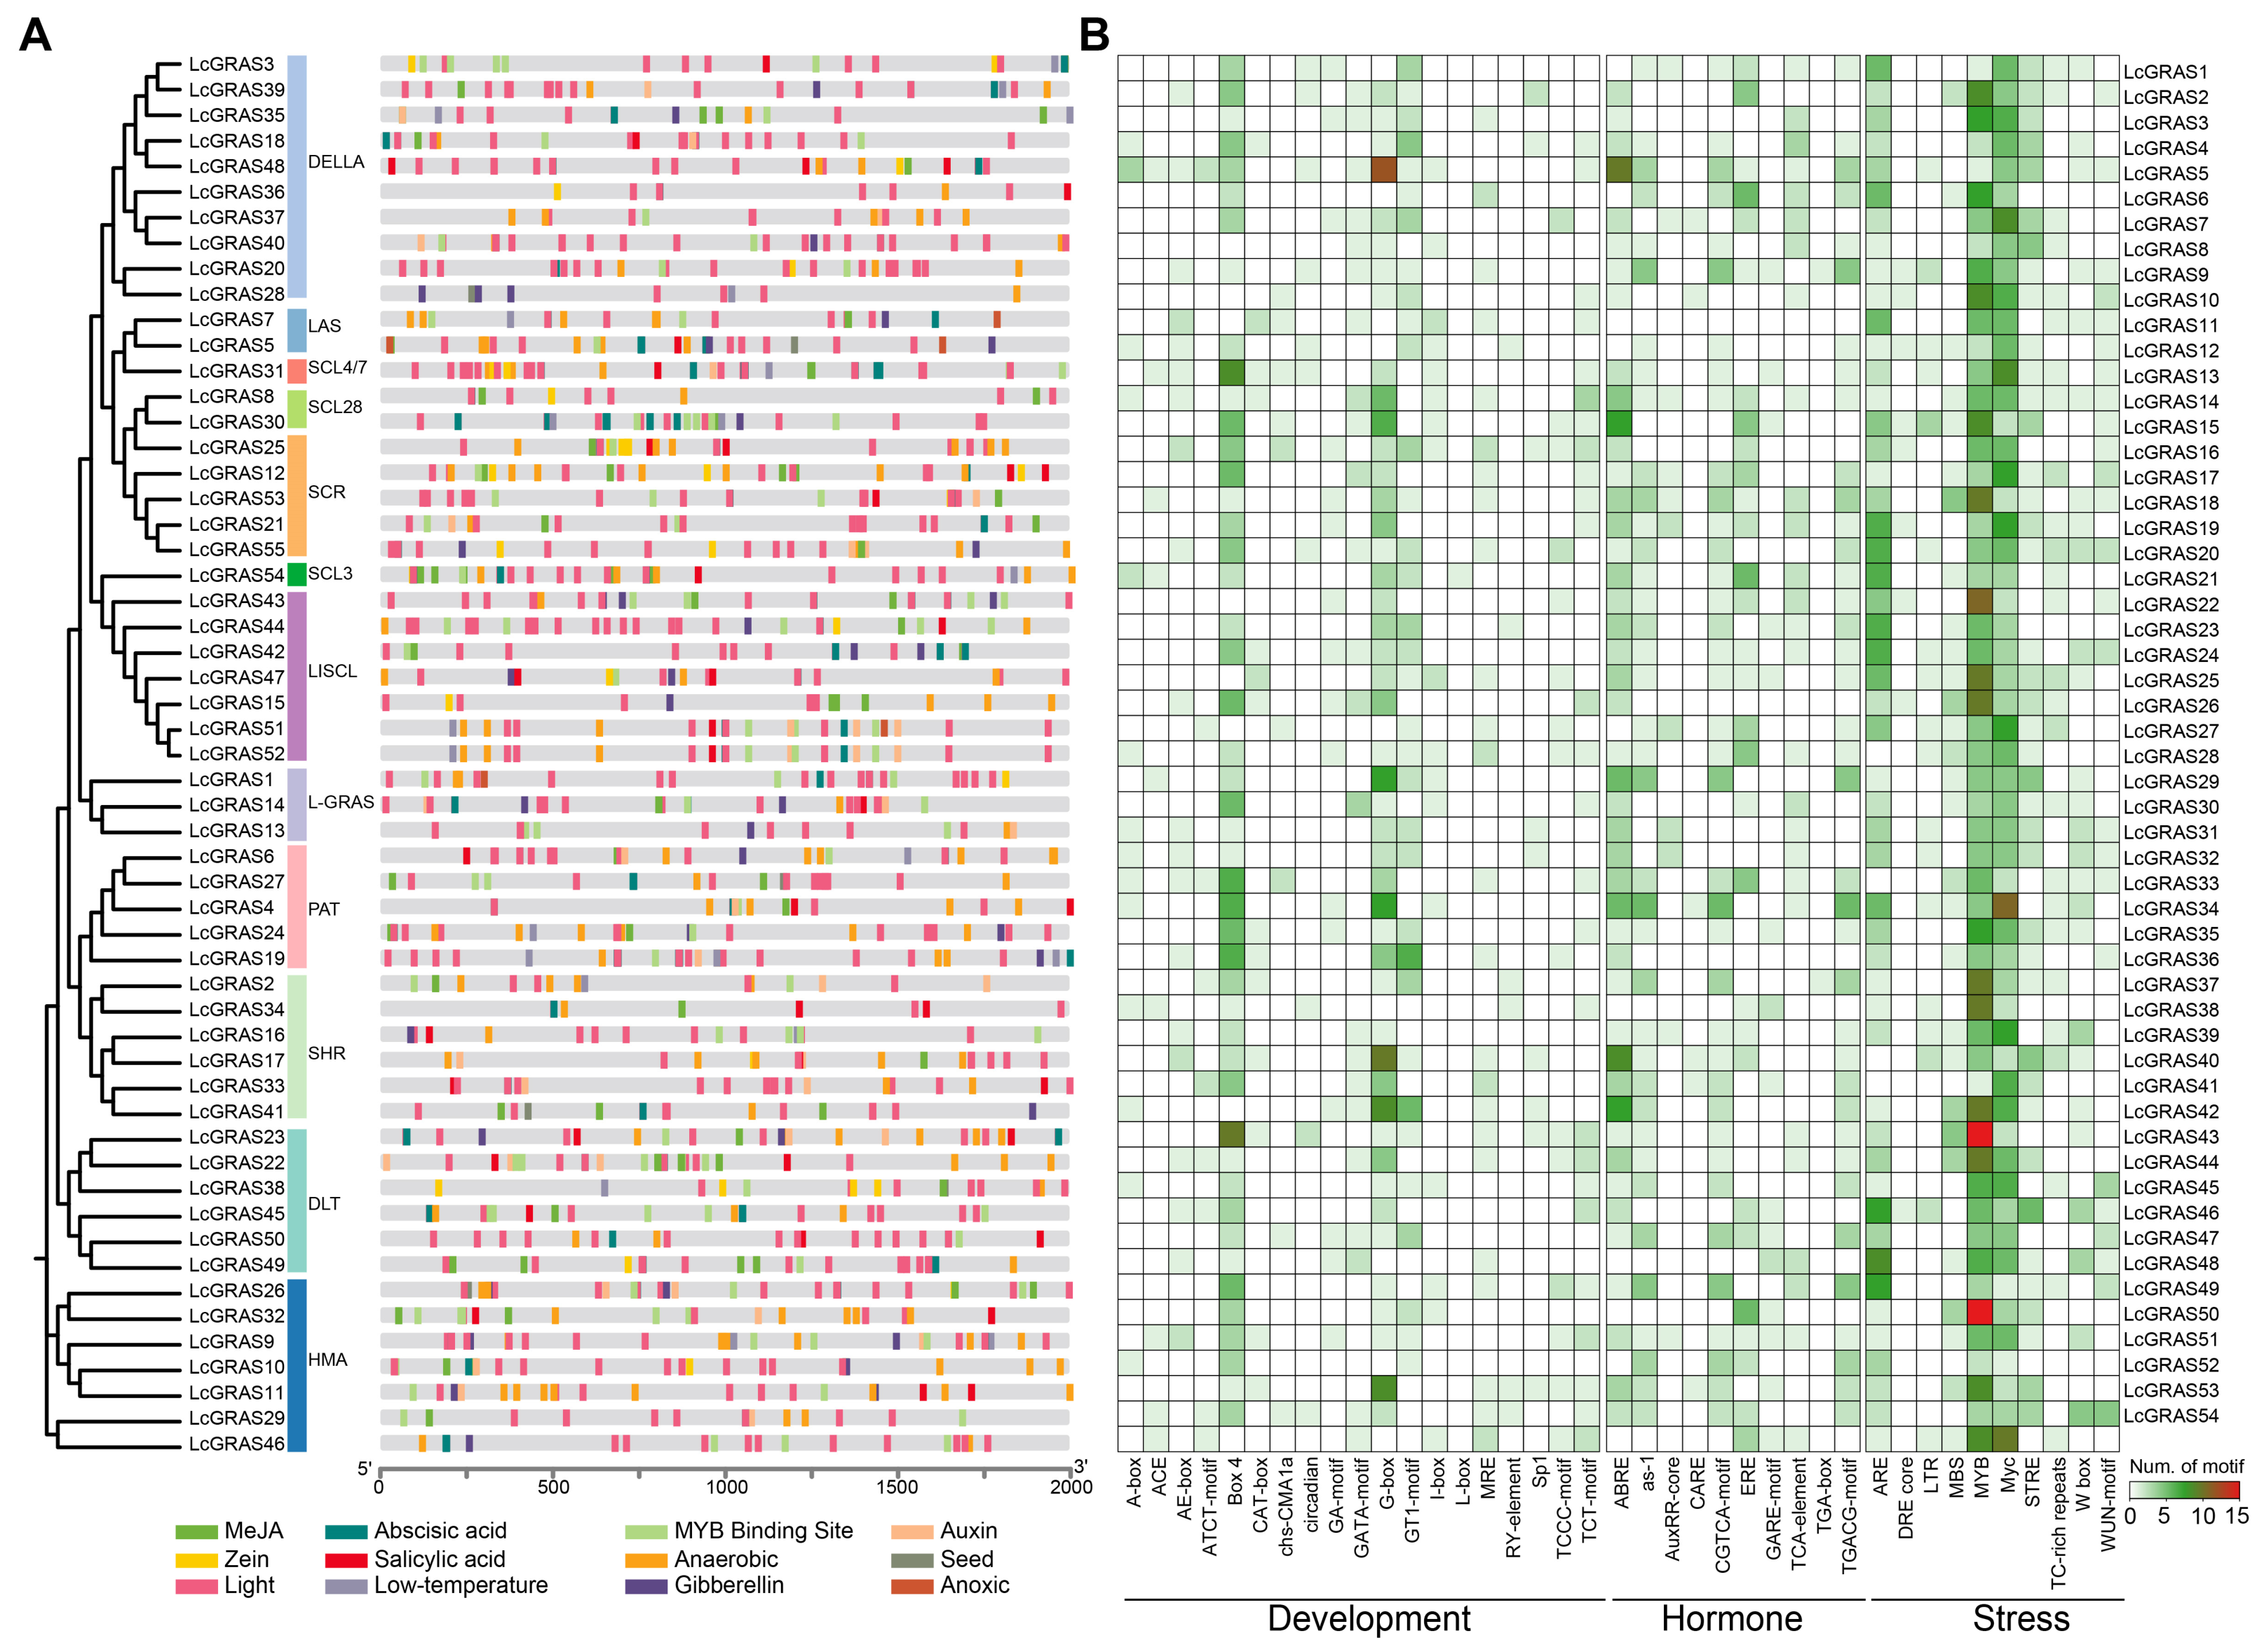
To predict the expression regulatory patterns of members of the LcGRAS gene family, we analyzed the 2000 bp promoter regions upstream of fifty-five LcGRAS genes for cis-acting elements (Figure 8A). The results show that these genes primarily contain twelve types of functional elements associated with methyl jasmonate, abscisic acid, salicylic acid, gibberellin, auxin, anaerobic induction, and low-temperature stress (Figure 8A). The presence of these cis-regulatory elements in LcGRAS genes suggests that they may play important roles in various biological processes. At the same time, the identified cis-regulatory elements were mainly classified into three categories: hormone response elements, stress response elements, and plant growth and development response elements (Figure 8B). Among these, the litchi GRAS gene family contains the greatest variety of elements related to growth and development regulation, primarily including Box4, G-box, and GT1-motif. The number of stress response elements and hormone response elements is equal. Stress response elements mainly include MYB, MYC, and ARE, while hormone response elements primarily include ABRE, TGACG-motif, and ERE. The MYB and MYC binding sites indicate that they may play a role in responses to drought and cold stress. The distribution of these diverse cis-acting elements provides important clues for a deeper understanding of the regulatory mechanisms of LcGRAS genes in litchi growth, development, and environmental adaptation.
Figure 8.
Summary of cis elements in the promoter of LcGRAS gene. (A) Position analysis of cis elements. (B) Statistical analysis of cis elements.
4. Discussion
Previous studies have shown that GRAS family transcription factors play important roles in the growth, development, and stress responses of various crops [54,55,56]. In this study, a total of 55 GRAS transcription factors were identified across the litchi genome, a number comparable to that reported for perennial woody plants such as sweet orange [57]. Compared with closely related species, the number of GRAS genes in litchi is higher than that in yellowhorn [58] but lower than that in longan [59], indicating that the GRAS gene family has undergone varying degrees of expansion and contraction during the evolutionary history of different Sapindaceae species. The isoelectric point (pI) of most LcGRAS proteins is less than 7, indicating that this family is rich in acidic amino acids, consistent with findings for most plant GRAS transcription factor families [60,61,62]. Subcellular localization predicted analysis indicated that most LcGRAS proteins are primarily localized in the nucleus, followed by the chloroplast. This finding is consistent with reports in other crop species, such as ginger and cacao [63,64].
This study explored the potential functional basis of LcGRAS gene family members through both an analysis of gene structure and analysis of conserved elements.Similar to the results obtained in coptis and ginger [60,63], the conserved motifs of LcGRAS are composed of 10 motifs total. The presence of motifs 2, 6 and 9 in most of the family members indicates that these three motifs form the core structural units required for GRAS protein function. Most members of each subfamily usually have similar gene structures and conserved protein sequences. However, the motif distributions of some proteins occasionally differ, and these outcomes match similar studies performed on the majority of plant GRAS families. [62,64].
Transcription Factor binding occurs in the area of the promoter of genes, determining gene expression through transcription factor binding and signal transduction functions. The analysis of transcription factors has yielded information regarding three types of promoter elements found in the promoter region: hormone responsive, stress responsive, and responsive to plant growth and development. The identification of promoter elements in other crop species such as Taxus, and ginger is consistent with these results [61,63]. Of the various “response elements” identified, the elements related to “growth and development responses” were the most varied; 19 distinct elements of these responses to growth and development were determined to exist (Figure 8B), which indicates to me that LcGRAS genes are likely to play an extensive role in the complex regulatory networks related to plant growth and development.
Previous studies have reported that the GRAS gene family exhibits differential expression patterns in various organs of crops, including stems, fruits, and leaves [65]. The expression analysis of the litchi transcriptome data across different tissues and organs shows that varied expression of LcGRAS gene family members occurs between the different tissues and organs investigated. An example of this is that LcGRAS36 was expressed only in leaves, whereas LcGRAS21 had tissue-specific expression within stamen and young fruit. Therefore, LcGRAS gene family members have potentially played a role in controlling growth and development in specific tissues and organs based on their spatiotemporal specificity. It is noteworthy that a previous study by Chen et al. (2021) also characterized the GRAS gene family in litchi, identifying 48 LcGRAS genes and classifying them into 14 subfamilies [66]. The discrepancy in gene number (55 vs 48) is primarily due to the use of different genome versions: the earlier study relied on an in-house assembled genome, whereas the present study used the high-quality, chromosome-level genome assembly of ‘Feizixiao’, which provides more complete gene annotations. Regarding subfamily classification, our revised maximum-likelihood tree based on a trimmed GRAS-domain alignment resolved 12 well-supported subfamilies. This differs from the 14 subfamilies reported by Chen et al. mainly in classification granularity and the naming of closely related clades, rather than in the major phylogenetic lineages; a gene-by-gene subfamily assignment for all 55 LcGRAS genes is provided in Table S2. Importantly, the previous study mainly focused on seed development and miR171 regulation, while our study provides a comprehensive transcriptomic atlas across 12 tissues and a co-expression network centered on fruit development. These complementary findings significantly expand our understanding of the GRAS gene family in litchi, particularly regarding its roles in fruit development.
The dynamic expression of LcGRAS gene during the development of fruit was illustrated by expression profiling and confirmed that these LcGRAS genes have the potential for unique regulatory functions during the ripening of fruit. The HZ fruit ripening stages displayed significant upregulation of several LcGRAS genes (including LcGRAS6, LcGRAS27 and LcGRAS53) compared with other stages of fruit development. Their expression trends resembled those of MaSCL8 in banana, which influences ethylene production [30], and FaSCL8 in strawberry, which affects phosphorus and sugar accumulation [33]. However, similar expression patterns do not necessarily indicate equivalent biological functions. These observations therefore only suggest that LcGRAS6, LcGRAS27 and LcGRAS53 may be associated with the regulatory network during fruit ripening, and their functional roles require further experimental validation. Additionally, variations in the expression of LcGRAS18, LcGRAS31, and LcGRAS44 across diverse tissues of the JGHN fruit were observed, which may reflect tissue-specific expression patterns associated with traits that develop in particular tissues of the JGHN fruit.
Although Litchi chinensis is a diploid species and does not contain allotetraploid homeologs, some GRAS genes may exhibit high sequence similarity due to allelic homology or gene duplication. Short-read RNA-seq reads that originate from shared regions of highly similar homologs or paralogs may therefore be difficult to assign uniquely, which may affect the precise estimation of transcript-specific expression levels. Full-length transcript sequencing would provide more complete transcript structures and improve the resolution of closely related transcripts. In combination with short-read RNA-seq quantification, it could facilitate the assignment of transcripts to specific homologous or paralogous loci, confirm gene models, and identify alternative transcript isoforms. These approaches should be considered in future studies [67,68].
5. Conclusions
In this study, a total of 55 GRAS genes were identified in litchi (Litchi chinensis). Their physicochemical properties were systematically analyzed. These genes are unevenly distributed across 14 chromosomes, and a high level of collinearity was observed between litchi GRAS genes and their counterparts in longan (Dimocarpus longan). Transcriptome analysis revealed that LcGRAS genes exhibited distinct expression patterns depending on tissue type and developmental stage. For example, the expression of LcGRAS members showed dynamic changes during litchi fruit development. Furthermore, co-expression network analysis identified five hub genes, including LcGRAS15, and demonstrated that they were highly co-expressed with multiple transcription factors, such as MYB, NAC, and ARF, as well as key regulators of fruit development, including BBM and GAI3. In addition, various cis-acting elements were identified in the promoters of LcGRAS genes, including elements related to hormone responses (e.g., abscisic acid), stress responses (e.g., drought and cold), and the regulation of growth and development. Overall, this study provides a theoretical foundation for further investigation of the functions of the LcGRAS gene family and its regulatory roles in litchi growth, development, and associated molecular networks.
Supplementary Materials
The following supporting information can be downloaded at: https://www.mdpi.com/article/10.3390/biology15222109/s1, Table S1. Information of the GRAS gene family in litchi. Table S2. Distribution of GRAS genes among subfamilies across species. Table S3. Ka/Ks analysis of the GRAS gene family in litchi.
Author Contributions
Conceptualization, Y.L. (Yuhao Liu) and J.C.; methodology, J.L. and Y.L. (Yunmei Li); formal analysis, J.L. and D.F.; data curation, Y.L. (Yunmei Li) and D.F.; writing—original draft, Y.L. (Yuhao Liu) and J.C.; writing—review and editing, H.Q.; H.J. and J.X.; project administration, H.J. and J.X.; funding acquisition, H.Q. and J.X. All authors have read and agreed to the published version of the manuscript.
Funding
This research was funded by the Guangxi Natural Science Foundation (2025GXNSFBA069246), the Guangxi Litchi and Longan Innovation Team of the National Modern Agricultural Industry Technology System (nycytxgxcxtd-2023-12-01) and the Innovation Project of Guangxi Graduate Education (YCSW2026080).
Institutional Review Board Statement
Not applicable.
Data Availability Statement
The original contributions presented in this study are included in the article/Supplementary Material. The transcriptomic data for HZ are available in the NCBI with accession number PRJNA883943. The transcriptomic data for JGHN have been deposited in the China National Center for Bioinformation (CNCB) under accession number PRJCA079664. Further inquiries can be directed to the corresponding author.
Conflicts of Interest
The authors declare no conflicts of interest.
Abbreviations
The following abbreviations are used in this manuscript:
| HZ | Huai Zhi |
| JGHN | Jinggang Hongnuo |
References
- Qing, H.; Zhang, S.; Mo, X.; Yi, C.; Guo, H.; Wei, J.; Wu, Z.; Xu, J.; Jia, H.; Qiu, H.; et al. Cloning and expression analysis of transcription factor LcZAT12 in litchi. S. China Fruits 2024, 53, 1–11. [Google Scholar] [CrossRef]
- Liu, T.; Chen, Y.; Song, W.; Zhang, H.; Wei, Y. Genome-Wide Identification of the Litchi BBX Gene Family and Analysis of Its Potential Role in Pericarp Coloring. Int. J. Mol. Sci. 2025, 26, 10834. [Google Scholar] [CrossRef] [Scilit] [PubMed]
- Qi, W.; Chen, H.; Luo, T.; Song, F. Development status, trend and suggestion of litchi industry in China. Guangdong Agric. Sci. 2019, 46, 132–139. [Google Scholar] [CrossRef]
- Ji, C.; Deng, Y.; Yan, B.; Wang, Y.; Chen, P. Research progress on key technologies for mechanized harvesting of litchi. Agric. Eng. 2025, 15, 9–18. [Google Scholar] [CrossRef]
- Qi, W.; Chen, H.; Li, J. Status, Trend and countermeasures of development of litchi industry in the mainland of China in 2022. Guangdong Agric. Sci. 2023, 50, 147–155. [Google Scholar] [CrossRef]
- Brodsky, S.; Jana, T.; Mittelman, K.; Chapal, M.; Kumar, D.; Carmi, M.; Barkai, N. Intrinsically disordered regions direct transcription factor in vivo binding specificity. Mol. Cell 2020, 79, 459–471. [Google Scholar] [CrossRef] [Scilit] [PubMed]
- Romani, F.; Moreno, J. Molecular mechanisms involved in functional macroevolution of plant transcription factors. New Phytol. 2021, 230, 1345–1353. [Google Scholar] [CrossRef] [Scilit] [PubMed]
- Hakoshima, T. Structural basis of the specific interactions of GRAS family proteins. FEBS Lett. 2018, 592, 489–501. [Google Scholar] [CrossRef] [Scilit] [PubMed]
- Pysh, L.; Wysocka-Diller, J.; Camilleri, C.; Bouchez, D.; Benfey, P. The GRAS gene family in Arabidopsis: Sequence characterization and basic expression analysis of the SCARECROW-LIKE genes. Plant J. 1999, 18, 111–119. [Google Scholar] [CrossRef] [Scilit] [PubMed]
- Sun, Y.; Yuan, T. Genome-wide analysis of GRAS gene family and functional identification of a putative development and maintenance of axillary meristematic tissue gene PlGRAS22 in Paeonia ludlowii. Int. J. Biol. Macromol. 2025, 297, 139879. [Google Scholar] [CrossRef] [Scilit] [PubMed]
- Chen, Y.; Zhu, P.; Wu, S.; Lu, Y.; Sun, J.; Cao, Q.; Li, Z.; Xu, T. Identification and expression analysis of GRAS transcription factors in the wild relative of sweet potato Ipomoea trifida. BMC Genom. 2019, 20, 911. [Google Scholar] [CrossRef] [Scilit] [PubMed]
- Lu, H.; Xu, J.; Li, G.; Zhong, T.; Chen, D.; Lv, J. Genome-wide identification and expression analysis of GRAS gene family in Eucalyptus grandis. BMC Plant Biol. 2024, 24, 573. [Google Scholar] [CrossRef] [Scilit] [PubMed]
- Wang, L.; Ding, X.; Gao, Y.; Yang, S. Genome-wide identification and characterization of GRAS genes in soybean (Glycine max). BMC Plant Biol. 2020, 20, 415. [Google Scholar] [CrossRef] [Scilit] [PubMed]
- Mishra, S.; Chaudhary, R.; Pandey, B.; Singh, G.; Sharma, P. Genome-wide identification and expression analysis of the GRAS gene family under abiotic stresses in wheat (Triticum aestivum L.). Sci. Rep. 2023, 13, 18705. [Google Scholar] [CrossRef] [Scilit] [PubMed]
- Greb, T.; Clarenz, O.; Schafer, E.; Muller, D.; Herrero, R.; Schmitz, G.; Theres, K. Molecular analysis of the LATERAL SUPPRESSOR gene in Arabidopsis reveals a conserved control mechanism for axillary meristem formation. Genes Dev. 2003, 17, 1175–1187. [Google Scholar] [CrossRef] [Scilit] [PubMed]
- Shen, J.; Jiang, Y.; Pan, J.; Sun, L.; Li, Q.; He, W.; Sun, P.; Zhao, B.; Zhao, H.; Ke, X.; et al. The GRAS transcription factor CsTL regulates tendril formation in cucumber. Plant Cell 2024, 36, 2818–2833. [Google Scholar] [CrossRef] [Scilit] [PubMed]
- Khan, Y.; Xiong, Z.; Zhang, H.; Liu, S.; Yaseen, T.; Hui, T. Expression and roles of GRAS gene family in plant growth, signal transduction, biotic and abiotic stress resistance and symbiosis formation-a review. Plant Biol. 2022, 24, 404–416. [Google Scholar] [CrossRef] [Scilit] [PubMed]
- Helariutta, Y.; Fukaki, H.; Wysocka-Diller, J.; Nakajima, K.; Jung, J.; Sena, G.; Hauser, M.; Benfey, P. The SHORT-ROOT gene controls radial patterning of the Arabidopsis root through radial signaling. Cell 2000, 101, 555–567. [Google Scholar] [CrossRef] [Scilit] [PubMed]
- Torres-Galea, P.; Hirtreiter, B.; Bolle, C. Two GRAS proteins, SCARECROW-LIKE21 and PHYTOCHROME A SIGNAL TRANSDUCTION1, function cooperatively in phytochrome a signal transduction. Plant Physiol. 2013, 161, 291–304. [Google Scholar] [CrossRef] [Scilit] [PubMed]
- Sun, T.; Gubler, F. Molecular mechanism of gibberellin signaling in plants. Annu. Rev. Plant Biol. 2004, 55, 197–223. [Google Scholar] [CrossRef] [Scilit] [PubMed]
- Lucas, M.; Davière, J.; Rodríguez-Falcón, M.; Pontin, M.; Iglesias-Pedraz, J.; Lorrain, S.; Fankhauser, C.; Blázquez, M.; Titarenko, E.; Prat, S. A molecular framework for light and gibberellin control of cell elongation. Nature 2008, 451, 480–484. [Google Scholar] [CrossRef] [Scilit] [PubMed]
- Feng, S.; Martinez, C.; Gusmaroli, G.; Wang, Y.; Zhou, J.; Wang, F.; Chen, L.; Yu, L.; Iglesias-Pedraz, J.; Kircher, S.; et al. Coordinated regulation of Arabidopsis thaliana development by light and gibberellins. Nature 2008, 451, 475–479. [Google Scholar] [CrossRef] [Scilit] [PubMed]
- Ishikawa, M.; Fujiwara, A.; Kosetsu, K.; Horiuchi, Y.; Kamamoto, N.; Umakawa, N.; Tamada, Y.; Zhang, L.; Matsushita, K.; Palfalvi, G.; et al. GRAS transcription factors regulate cell division planes in moss overriding the default rule. Proc. Natl. Acad. Sci. USA 2023, 120, e2210632120. [Google Scholar] [CrossRef] [Scilit] [PubMed]
- Morohashi, K.; Minami, M.; Takase, H.; Hotta, Y.; Hiratsuka, K. Isolation and characterization of a novel GRAS gene that regulates meiosis-associated gene expression. J. Biol. Chem. 2003, 278, 20865–20873. [Google Scholar] [CrossRef] [Scilit] [PubMed]
- Heo, J.; Chang, K.; Kim, I.; Lee, M.; Lee, S.; Song, S.; Lee, M.; Lim, J. Funneling of gibberellin signaling by the GRAS transcription regulator SCARECROW-LIKE 3 in the Arabidopsis root. Proc. Natl. Acad. Sci. USA 2011, 108, 2166–2171. [Google Scholar] [CrossRef] [Scilit] [PubMed]
- Li, J.; Zhou, P.; Hu, Z.; Teng, R.; Wang, Y.; Li, T.; Xiong, A.; Li, X.; Chen, X.; Zhuang, J. CsPAT1, a GRAS transcription factor, promotes lignin accumulation by antagonistic interacting with CsWRKY13 in tea plants. Plant J. 2024, 118, 1312–1326. [Google Scholar] [CrossRef] [Scilit] [PubMed]
- Weiss, D.; Ori, N. Mechanisms of cross talk between gibberellin and other hormones. Plant Physiol. 2007, 144, 1240–1246. [Google Scholar] [CrossRef] [Scilit] [PubMed]
- Zhang, Z.; Ogawa, M.; Fleet, C.; Zentella, R.; Hu, J.; Heo, J.; Lim, J.; Kamiya, Y.; Yamaguchi, S.; Sun, T. SCARECROW-LIKE 3 promotes gibberellin signaling by antagonizing master growth repressor DELLA in Arabidopsis. Proc. Natl. Acad. Sci. USA 2011, 108, 2160–2165. [Google Scholar] [CrossRef] [Scilit] [PubMed]
- Yoshida, H.; Hirano, K.; Sato, T.; Mitsuda, N.; Nomoto, M.; Maeo, K.; Koketsu, E.; Mitani, R.; Kawamura, M.; Ishiguro, S.; et al. DELLA protein functions as a transcriptional activator through the DNA binding of the indeterminate domain family proteins. Proc. Natl. Acad. Sci. USA 2014, 111, 7861–7866. [Google Scholar] [CrossRef] [Scilit] [PubMed]
- Liu, F.; Sun, X.; Sheng, O.; Dou, T.; Jian, J.; Yang, Q.; Hu, C.; Deng, G.; He, W.; Gao, H.; et al. The MaEIL9-MaZIP5-MaSCL8 module integrates MaBEL1 and synergistically modulates banana fruit ripening. J. Adv. Res. 2026, in press. [Google Scholar] [CrossRef] [Scilit] [PubMed]
- Liu, Y.; Shi, Y.; Su, D.; Lu, W.; Li, Z. SlGRAS4 accelerates fruit ripening by regulating ethylene biosynthesis genes and SlMADS1 in tomato. Hortic. Res. 2021, 8, 3. [Google Scholar] [CrossRef] [Scilit] [PubMed]
- Li, M.; Wang, X.; Li, C.; Li, H.; Zhang, J.; Ye, Z. Silencing GRAS2 reduces fruit weight in tomato. J. Integr. Plant Biol. 2018, 60, 498–513. [Google Scholar] [CrossRef] [Scilit] [PubMed]
- Zheng, Z.; Zhang, Y.; Gao, Y.; Shen, Y.; Huang, Y. GRAS family transcription factor FaSCL8 regulates FaVPT1 expression mediating phosphate accumulation and strawberry fruit ripening. Fruit Res. 2023, 3, 15. [Google Scholar] [CrossRef] [Scilit]
- Zhang, W.; Zhu, X.; Cui, T.; Jia, H.; Fang, J.; Wang, C. VvRGL genes regulate seedless fruit development by responding to GA in grapevine. Acta Bot. Boreal.-Occident. Sin. 2019, 39, 381–390. [Google Scholar] [CrossRef]
- Wu, F.; Zheng, J.; Hu, H.; Liu, H.; Xiao, Y.; Feng, J.; Hao, Y.; Chen, C.; Xia, R.; Zeng, Z. The Diversity of the DNA-Binding Landscape in the DREB/ERF Family: Focusing on Reproductive Processes in Fruit Trees With Highly Heterozygous Genome. Plant Biotechnol. J. 2026, 24, 639–658. [Google Scholar] [CrossRef] [Scilit] [PubMed]
- Hu, H.; Liu, H.; Zeng, Z.; Xiao, Y.; Mai, Y.; Zhang, Y.; Meyers, B.; Hao, Y.; Xia, R. Genetic variation in a tandemly duplicated TPS gene cluster contributes to the diversity of aroma in lychee fruit. New Phytol. 2025, 246, 2652–2665. [Google Scholar] [CrossRef] [Scilit] [PubMed]
- Hou, H.; Kong, X.; Xiao, J.; Jiang, G.; Zhu, H.; Jiang, Y.; Qu, H.; Li, T. An increase in DNA methylation contributes to anthocyanin biosynthesis in the pericarp as litchi (Litchi chinensis Sonn.) fruit ripens. J. Adv. Res. 2026, 89, 35–49. [Google Scholar] [CrossRef] [Scilit] [PubMed]
- Yue, X.; Zhang, Y.; Yang, C.; Li, J.; Rui, X.; Ding, F.; Hu, F.; Wang, X.; Ma, W.; Zhou, K. Genome-wide identification and expression analysis of carotenoid cleavage oxygenase genes in Litchi (Litchi chinensis Sonn.). BMC Plant Biol. 2022, 22, 394. [Google Scholar] [CrossRef] [Scilit] [PubMed]
- Li, J.; Chen, C.; Zeng, Z.; Wu, F.; Feng, J.; Liu, B.; Mai, Y.; Chu, X.; Wei, W.; Li, X.; et al. SapBase: A central portal for functional and comparative genomics of Sapindaceae species. J. Integr. Plant Biol. 2024, 66, 1561–1570. [Google Scholar] [CrossRef] [Scilit] [PubMed]
- Finn, R.; Coggill, P.; Eberhardt, R.; Eddy, S.; Mistry, J.; Mitchell, A.; Potter, S.; Punta, M.; Qureshi, M.; Sangrador-Vegas, A.; et al. The Pfam protein families database: Towards a more sustainable future. Nucleic Acids Res. 2016, 44, D279–D285. [Google Scholar] [CrossRef] [Scilit] [PubMed]
- Chen, C.; Chen, H.; Zhang, Y.; Thomas, H.; Frank, M.; He, Y.; Xia, R. TBtools: An integrative toolkit developed for interactive analyses of big biological data. Mol. Plant 2020, 13, 1194–1202. [Google Scholar] [CrossRef] [Scilit] [PubMed]
- Wilkins, M.; Gasteiger, E.; Bairoch, A.; Sanchez, J.; Williams, K.; Appel, R.; Hochstrasser, D. Protein identification and analysis tools in the ExPASy server. Methods Mol. Biol. 1999, 112, 531–552. [Google Scholar] [CrossRef] [Scilit] [PubMed]
- Horton, P.; Park, K.; Obayashi, T.; Fujita, N.; Harada, H.; Adams-Collier, C.; Nakai, K. WoLF PSORT: Protein localization predictor. Nucleic Acids Res. 2007, 35, W585–W587. [Google Scholar] [CrossRef] [Scilit] [PubMed]
- Dyer, S.; Austine-Orimoloye, O.; Azov, A.; Barba, M.; Barnes, I.; Barrera-Enriquez, V.; Becker, A.; Bennett, R.; Beracochea, M.; Berry, A.; et al. Ensembl 2025. Nucleic Acids Res. 2025, 53, D948–D957. [Google Scholar] [CrossRef] [Scilit] [PubMed]
- Minh, B.Q.; Schmidt, H.A.; Chernomor, O.; Schrempf, D.; Woodhams, M.D.; von Haeseler, A.; Lanfear, R. IQ-TREE 2: New Models and Efficient Methods for Phylogenetic Inference in the Genomic Era. Mol. Biol. Evol. 2020, 37, 1530–1534. [Google Scholar] [CrossRef] [Scilit] [PubMed]
- Letunic, I.; Bork, P. Interactive Tree Of Life (iTOL): An online tool for phylogenetic tree display and annotation. Bioinformatics 2007, 23, 127–128. [Google Scholar] [CrossRef] [Scilit] [PubMed]
- Hu, B.; Jin, J.; Guo, A.; Zhang, H.; Luo, J.; Gao, G. GSDS 2.0: An upgraded gene feature visualization server. Bioinformatics 2015, 31, 1296–1297. [Google Scholar] [CrossRef] [Scilit] [PubMed]
- Bailey, T.; Johnson, J.; Grant, C.; Noble, W. The MEME Suite. Nucleic Acids Res. 2015, 43, W39–W49. [Google Scholar] [CrossRef] [Scilit] [PubMed]
- Lescot, M.; Déhais, P.; Thijs, G.; Marchal, K.; Moreau, Y.; Peer, Y.; Rouzé, P.; Rombauts, S. PlantCARE, a database of plant cis-acting regulatory elements and a portal to tools for in silico analysis of promoter sequences. Nucleic Acids Res. 2002, 30, 325–327. [Google Scholar] [CrossRef] [Scilit] [PubMed]
- Zhong, R.; Wei, J.; Liu, B.; Luo, H.; Zhang, Z.; Pang, X.; Fang, F. Metabolite and Transcriptome Profiles of Proanthocyanidin Biosynthesis in the Development of Litchi Fruit. Int. J. Mol. Sci. 2023, 24, 532. [Google Scholar] [CrossRef] [Scilit] [PubMed]
- Zhang, W.; Zhang, Y.; Qiu, H.; Guo, Y.; Wan, H.; Zhang, X.; Scossa, F.; Alseekh, S.; Zhang, Q.; Wang, P.; et al. Genome assembly of wild tea tree DASZ reveals pedigree and selection history of tea varieties. Nat. Commun. 2020, 11, 3719. [Google Scholar] [CrossRef] [Scilit] [PubMed]
- Qiu, H.; Zhang, X.; Zhang, Y.; Jiang, X.; Ren, Y.; Gao, D.; Zhu, X.; Usadel, B.; Fernie, A.R.; Wen, W. Depicting the genetic and metabolic panorama of chemical diversity in the tea plant. Plant Biotechnol. J. 2024, 22, 1001–1016. [Google Scholar] [CrossRef] [Scilit] [PubMed]
- Qiu, H.; Li, Y.; Liang, J.; Liu, Y.; Li, R.; Fan, D.; Huang, W.; Chen, J.; Lin, C.; Chen, B.; et al. Physiological, transcriptomic and metabolomic analyses reveal pericarp color divergence in longan. Sci. Hortic. 2026, 364, 114943. [Google Scholar] [CrossRef] [Scilit]
- Ali, F.; Zhao, Y.; Shah, O.; Nadeem, M.; Baloch, F.; Madenova, A.; Kabylbekova, B.; Soltanbekov, S.; Liao, L.; Wang, Z. Identification and expression profiling of the GRAS gene family reveals candidate genes for enhancing abiotic stress tolerance in lentil. BMC Plant Biol. 2026, 26, 245. [Google Scholar] [CrossRef] [Scilit] [PubMed]
- Shi, H.; Yang, M.; Liu, Z.; Zhao, J.; Qi, Y.; Guo, J.; Gao, P.; Huang, F.; Liu, J.; Yu, L.; et al. Genome-wide characterization of GRAS gene family and their expression profiles under diverse biotic and abiotic stresses in Amorphophallus konjac. BMC Genom. 2025, 26, 643. [Google Scholar] [CrossRef] [Scilit] [PubMed]
- Lin, J.; Wu, J.; Zhang, D.; Cai, X.; Du, L.; Lu, L.; Liu, C.; Chen, S.; Yao, Q.; Xie, S.; et al. The GRAS gene family and its roles in pineapple (Ananas comosus L.) developmental regulation and cold tolerance. BMC Plant Biol. 2024, 24, 1204. [Google Scholar] [CrossRef] [Scilit] [PubMed]
- Zhang, H.; Mi, L.; Xu, L.; Yu, C.; Li, C.; Chen, C. Genome-wide identification, characterization, interaction network and expression profile of GRAS gene family in sweet orange (Citrus sinensis). Sci. Rep. 2019, 9, 2156. [Google Scholar] [CrossRef] [Scilit] [PubMed]
- Dai, Y.; Liu, H. Genome-wide Identification and Analysis of GRAS Gene Family in Xanthoceras sorbifolium. Mol. Plant Breed. 2025, 23, 3949–3958. [Google Scholar] [CrossRef]
- Cao, J.; Sang, X.; Liu, L.; Gou, J.; Liu, Y.; Ren, C.; Zhang, Z.; Jue, D.; Shi, S. Exploration of the GRAS family in Dimocarpus longan: Identification, characterization, expression analysis and DlGRAS24 role in flowering time. BMC Plant Biol. 2025, 25, 1389. [Google Scholar] [CrossRef] [Scilit] [PubMed]
- Wei, W.; Tan, J.; Guo, L.; Zhang, Y.; Wang, Y.; Pan, Y. Genome-Wide Identification of the GRAS Transcription Factor Family in Coptis chinensis Reveals Tissue-Specific Co-Expression with bZIP Proteins Under Light Stress. Int. J. Mol. Sci. 2026, 27, 4617. [Google Scholar] [CrossRef] [Scilit] [PubMed]
- Gao, L.; Shi, A.; Wang, M.; Tian, H.; Zhang, Y. Genome-Wide Identification and Expression Profiling of the GRAS Gene Family in Taxus cuspidate. Genes 2025, 16, 1345. [Google Scholar] [CrossRef] [Scilit] [PubMed]
- Huang, J.; Ren, H.; Cheng, F.; Teng, Y.; Zhao, X.; Yuan, Z. Comprehensive Genome-Wide Characterization of the GRAS Gene Family and Their Role in Salt Stress Tolerance in Punica granatum L. Horticulturae 2025, 11, 504. [Google Scholar] [CrossRef] [Scilit]
- Tian, S.; Wan, Y.; Jiang, D.; Gong, M.; Lin, J.; Xia, M.; Shi, C.; Xing, H.; Li, H. Genome-Wide Identification, Characterization, and Expression Analysis of GRAS Gene Family in Ginger (Zingiber officinale Roscoe). Genes 2023, 14, 96. [Google Scholar] [CrossRef] [Scilit] [PubMed]
- Hou, S.; Zhang, Q.; Chen, J.; Meng, J.; Wang, C.; Du, J.; Guo, Y. Genome-Wide Identification and Analysis of the GRAS Transcription Factor Gene Family in Theobroma cacao. Genes 2023, 14, 57. [Google Scholar] [CrossRef] [Scilit] [PubMed]
- Heckmann, A.; Lombardo, F.; Miwa, H.; Perry, J.; Bunnewell, S.; Parniske, M.; Wang, T.; Downie, J. Lotus japonicus nodulation requires two GRAS domain regulators, one of which is functionally conserved in a non-legume. Plant Physiol. 2006, 142, 1739–1750. [Google Scholar] [CrossRef] [Scilit] [PubMed]
- Chen, J.; Yan, Q.; Li, J.; Feng, L.; Zhang, Y.; Xu, J.; Xia, R.; Zeng, Z.; Liu, Y. The GRAS gene family and its roles in seed development in litchi (Litchi chinensis Sonn). BMC Plant Biol. 2021, 21, 423. [Google Scholar] [CrossRef] [Scilit] [PubMed]
- Zhang, T.; Li, J.; Tang, C.; Wu, Y.; Wu, H.; Zhu, X.; Luo, Z.; Qin, H.; Ding, L.; Zeng, Y.; et al. Nanopore direct RNA sequencing and the epitranscriptome: Advances in mapping native RNA landscapes. iMeta 2026, 5, e70136. [Google Scholar] [CrossRef] [Scilit] [PubMed]
- Deem, K.; Brisson, J. New annotations for three pea aphid genome assemblies allow comparative analyses of duplication and gene family evolution. G3 2026, 16, jkag136. [Google Scholar] [CrossRef] [Scilit] [PubMed]
Disclaimer/Publisher’s Note: The statements, opinions and data contained in all publications are solely those of the individual author(s) and contributor(s) and not of MDPI and/or the editor(s). MDPI and/or the editor(s) disclaim responsibility for any injury to people or property resulting from any ideas, methods, instructions or products referred to in the content. |
© 2026 by the authors. Licensee MDPI, Basel, Switzerland. This article is an open access article distributed under the terms and conditions of the Creative Commons Attribution (CC BY) license.