


Simple Summary
The golden snub-nosed monkey is an endangered primate, and understanding the microbes that live in different parts of its body could help us protect both the species and the broader ecosystems it inhabits. In this study, we compared the microbial communities living in the nasopharynx and rectum of these monkeys using full-length 16S rRNA amplicon sequencing and metagenomic analysis. We found that the two body sites host clearly different microbial communities. Functionally, the nasopharynx microbiome was enriched in pathways for breaking down certain amino acids and for antioxidant (glutathione) defense, while the gut microbiome specialized in processing sugars and building proteins. Notably, we detected relatively high levels of potentially disease-causing bacteria in the nasopharynx, including Helicobacter pylori and Chlamydia psittaci. These findings suggest that the nasopharynx and rectum represent distinct microbial environments in this endangered primate and highlight the nasopharynx as a possible reservoir of zoonotic pathogens, although larger studies are needed to confirm these patterns.
Abstract
Background: Understanding the nasopharyngeal (NAS) and rectal (INT) microbiomes is critical to maintain host health. However, their functional roles in shaping microbial network structure and niche differentiation remain unexplored in most animal species, especially endangered primates. Here, we compared the NAS and INT microbiomes of golden snub-nosed monkeys (Rhinopithecus roxellana) using full-length 16S rRNA amplicon sequencing and metagenomics, focusing on taxonomic composition, functional profiles (KEGG, CAZy, PHI), and microbial co-occurrence networks. Results: Our results indicate that microbial community structure and diversity (Shannon evenness) differ significantly between the two niches. Taxonomically, both sequencing approaches consistently show that, at the relative-abundance level, NAS is dominated by genera such as Dolosigranulum and Vibrio, whereas the INT is characterized by Campylobacter, Helicobacter, and Aerococcus. Notably, metagenomic analysis indicates a relatively high abundance of potential pathogens, including Helicobacter pylori and Chlamydia psittaci. LEfSe analysis shows Dolosigranulum and Campylobacter are key microbial markers for the NAS and INT niches, respectively. KEGG pathway analysis reveals that the NAS microbiome is enriched in valine/leucine/isoleucine degradation and glutathione metabolism, while the INT microbiome is enriched in amino sugar and nucleotide sugar metabolism and ribosome pathways. At the CAZy level, all 29 differentially abundant families (e.g., GH13_29, GH103, AA3_2) were enriched in the NAS. Distinct pathogen–host interaction profiles further reflect niche-specific adaptations. Exploratory Spearman-based co-occurrence networks (in which no genus–CAZy edge survived Benjamini–Hochberg (FDR) correction) linked core commensals to KEGG pathways and CAZy families (e.g., GT35, GH0). In the INT, Campylobacter and Helicobacter form high-connectivity modules associated with pathways such as those involving the two-component system and ABC transporters. Conclusions: The nasopharyngeal and rectal microbiomes in golden snub-nosed monkeys differ not only taxonomically but also functionally, exhibiting clear spatially specialized functional differentiation. Given the small sample size (n = 8), these findings provide preliminary evidence for niche-specific microbial and functional partitioning and suggest that the nasopharynx may harbor a relatively high abundance of potential zoonotic pathogens. This study provides a basis for further exploration with a larger sample size.
1. Background
The animal microbiome, the “second genome” of host organisms [1], exhibits remarkable complexity and dynamic properties that profoundly influence host nutritional metabolism [2], immune defense [3], and ecological adaptation strategies [4]. Recent breakthroughs in microbiome research have underscored its indispensable role in preserving host homeostasis and mediating environmental acclimatization, and the field has attracted great attention as a frontier of life sciences [5,6]. In particular, cross-niche microbial interactions—via metabolite signaling, immune cell trafficking, or behavioral transmission—are increasingly recognized as a key factor in understanding host health and evolutionary adaptation.
The golden snub-nosed monkey (Rhinopithecus roxellana), as a typical arboreal primate species, has a unique ecological niche and diet, and a unique multi-level selective pressure on its microbiota [7,8]. In humans and nonhuman primates, resident microorganisms form in response to environmental factors, social interactions, and cohabitation [9,10]. Moeller et al. [11] have demonstrated that the frequency of social contact is strongly associated with the exchange of microorganisms between hosts. This exchange can occur either through direct physical contact or indirectly via environmental transmission.
Currently, research on the microbiome of the golden snub-nosed monkey focuses mainly on a single ecological niche (the intestine), including analyses of microbial composition [12,13,14] and the influence of seasonally driven diets on microbiome plasticity [7], and evidence that dietary and nutrient composition drive the structural and functional reorganization of gastrointestinal microorganisms [15]. However, the compositional characteristics of microbial communities in other body sites and the potential functional complementarity among ecological niches have been overlooked.
Both the nasopharynx and the gastrointestinal tract are mucosal immune compartments that share fundamental architectural and immunological features, including a polarized epithelial barrier, a mucus layer, and mucosa-associated lymphoid tissues [16,17]. The nasopharynx, the interface between the respiratory tract and the outside body, is the first line of defense against pathogens; it can thus be viewed as a gatekeeper of respiratory health [18]. The gastrointestinal tract is the core site for nutrient absorption and microbial fermentation [19]. At both mucosal sites, epithelial cells actively participate in microbiome assembly through the secretion of antimicrobial peptides—such as defensins and regenerating islet-derived protein 3γ (REG3γ)—and mucus glycoproteins that selectively constrain microbial colonization to the luminal niche [20,21]. In addition, secretory immunoglobulin A (sIgA), the predominant antibody isotype at mucosal surfaces, coats commensal bacteria and modulates their spatial organization and community composition [22]. Importantly, these locally acting mechanisms are integrated within the common mucosal immune system, in which lymphocytes primed at one mucosal inductive site can recirculate and home to distant mucosal effector sites, thereby functionally linking immune surveillance across the respiratory and gastrointestinal compartments [17]. These shared and interconnected mucosal immune pathways suggest that the microbial communities of the nasopharynx and the gut may interact not only through metabolic product cycling but also through immune-mediated cross-talk, making their cross-niche interaction network a potentially important yet underexplored dimension of host adaptation.
This study aims to integrate full-length 16S rRNA gene and metagenomic sequencing data to systematically characterize the microbial communities of the NAS and INT in a free-ranging Rhinopithecus roxellana. We address the following issues: (i) Spatial distribution specificity: What are the compositional characteristics of the NAS microbiota in the monkeys, and how do they differ from or resemble those of the rectal microbiota? (ii) Cross-niche microbial interactions: Do the NAS and INT microbiotas form specialized interaction networks? Which taxa act as keystone species mediating cross-niche microbial associations? (iii) Functional relevance to host adaptation: how do spatially specialized microbiome configurations relate to host adaptive strategies?
2. Materials and Methods
2.1. Sample Collection
The experimental samples were collected from the Guanyinshan National Nature Reserve, Qinling Mountains, China (107°52′–108°02′ E, 33°20′–33°44′ N). Swabs from the nasopharynx and fecal samples were collected from 8 monkeys from July 2024 to May 2026. All monkeys were sourced from progeny supplementation and the field from the Rescue, Breeding and Research Center. Based on physical characteristics and dental structure, they were estimated to be between 5 and 12 years old: two sub-adult males (approximately 5–6 years old), two adult males (approximately 10–12 years old), and four adult females (approximately 6–9 years old). The two sub-adult males came from an all-male unit (bachelor group). The four females and the two adult males belonged to different family groups (one female and one male per family group). All individuals appeared healthy at the time of capture, with no visible signs of injury, nasopharynx discharge, diarrhea, or other clinical abnormalities.
All monkeys were captured by professional technicians under veterinary supervision from the Shaanxi Rare Wildlife Rescue, Breeding and Research Center, using remote drug-delivery dart guns (blowpipe). Anesthesia was induced with Zoletil® 50 (Virbac, Carros, France) (tiletamine-zolazepam) at a dose of 4 mg/kg. During anesthesia (duration approximately 30–40 min), physiological monitoring was conducted every 10 min, including heart rate (stethoscope) and respiratory rate measurements. Body temperature was maintained using a warm blanket. Upon full recovery, each individual was released at the exact site of capture. Post-release monitoring via tracking or visual observation confirmed that all individuals returned to their groups and behaved normally within 2 h. No adverse events, such as hypothermia, bradycardia, apnea, or injury, occurred during or after the procedure.
For rectal swab collection, an aseptic swab was inserted about 4 cm into the anus and rotated 3 times to ensure full contact with the rectal mucosa. As for nasopharynx swab collection, a sterile swab was carefully inserted into the nostril and gently advanced along the floor of the nasal cavity toward the nasopharynx until resistance was felt. The swab was then rotated gently to collect epithelial cells and secretions before being slowly withdrawn. All swabs collected were immediately transferred to sterile cryotubes and stored in liquid nitrogen for subsequent 16S full-length sequencing and metagenomic sequencing.
Given the limited sample size from this endangered species, each sample was processed as a single biological replicate, and no technical replicates were conducted.
2.2. Full-Length 16S rRNA Gene Sequencing
There were 16 genomic DNA samples in total (from the nasopharynx and rectal of each sampled monkey), collected using the TGuide S96 Magnetic Soil/Stool DNA Kit (Tiangen Biotech (Beijing) Co., Ltd., Beijing, China). The V1-V9 hypervariable regions of the 16S rRNA gene were amplified with primers (27F: AGRGTTTGATYNTGGCTCAG; 1492R: TASGGHTACCTTGTTASGACTT). The amplicons were quantified, and the normalized equimolar concentrations were pooled and sequenced on the PacBio Sequel II platform (Beijing Biomarker Technologies Co., Ltd., Beijing, China).
2.3. Metagenome Sequencing
According to [23], the following procedures were performed: the raw reads were quality-filtered using Fastp (v 0.23.1). Host contamination was removed by aligning reads against the host genome (Genome assembly ASM756505v1) using bowtie2 (v2.2.4), yielding clean reads. The clean reads were assembled with MEGAHIT (v1.2.1) using default parameters, and contigs shorter than 300 bp were discarded.
Coding genes were predicted from the assembled contigs using MetaGeneMark software (http://exon.gatech.edu/meta_gmhmmp.cgi, accessed on 15 May 2026, Version 3.26), with default parameters. MMseqs2 (https://github.com/soedinglab/mmseqs2, accessed on 20 May 2026, Version 17-b804f) was used to remove redundancy with a similarity threshold set to 95%, and the coverage threshold to 90%.
Taxonomic profiling of the metagenomic data was performed as follows. The predicted protein sequences were aligned against the Non-Redundant Protein Sequence Database (NR) using diamond (v0.9.29) with the following parameters: E-value ≤ 1 × 10⁻⁵, sequence identity ≥ 60% (--id 60), and query coverage ≥ 15% (--query-cover 15). For each gene, the best-scoring single match was retained (best-hit approach). Taxonomic assignments were made at each level (phylum, class, order, family, genus, species) based on the best-hit matches. Gene abundance quantification was performed by mapping clean reads to the non-redundant gene catalog using BWA (v0.7.10). Mapped reads were counted using samtools (v1.9) to obtain absolute abundance (reads per gene). Taxonomic abundance at each level (domain to species) was calculated by aggregating gene-level absolute abundance of all genes assigned to each taxon. Relative abundance was then calculated as each taxon’s summed absolute abundance divided by the total abundance of all taxa at that level within the same sample.
To obtain gene functional annotations, the protein sequences of the predicted genes were compared with functional databases using BLAST-based methods (diamond v0.9.29, E-value 1 × 10⁻⁵), including the Non-Redundant Protein Sequence Database (NR), Kyoto Encyclopedia of Genes and Genomes (KEGG), Gene Ontology (GO), and Pathogen Host Interactions Database (PHI-base) (version 4.6.1). The annotated gene abundance tables were compared with the GO and KEGG databases to obtain protein, functional, and metabolic pathway information. HMMER (v3.0) software was used to compare protein sequences of non-redundant genes with the Hidden Markov models of each family in the CAZy database, identifying all families that meet the filtering threshold, and carbohydrate-active enzymes in the genome.
2.4. Bioinformatics Analysis
The UCHIME algorithm (v8.1) was used to detect and remove chimera sequences to obtain the clean reads. Sequences with more than 97% similarity thresholds were assigned to one operational taxonomic unit (OTU) using USEARCH (v 10.0) [24], and OTUs with abundance <0.005% were filtered out. Taxonomy annotation of the OTUs was performed using the Naive Bayes classifier in QIIME2 (version 2020.6) [25] with the SILVA database [26] (release 138.1) and a confidence threshold of 70%. Meanwhile, Alpha diversity (Chao1 and Shannon) was calculated and displayed using QIIME2 and R (v3.5.2). Differences between paired groups were assessed by paired Wilcoxon signed-rank tests to account for the paired design. To examine Beta diversity (among samples), principal coordinates analysis (PCoA) and Non-Metric Multidimensional Scaling (NMDS) were performed based on binary Jaccard distances at the OTU level using QIIME2. Community dissimilarity between groups under the paired design was assessed using permutational multivariate analysis of variance (PERMANOVA) with permutation constraints at the individual block level.
To further compare bacterial communities across samples, PERMANOVA was performed using the vegan package (2.3-0) in R. Linear discriminant analysis (LDA) was coupled with effect size (LEfSe), identifying representative species. LDA was conducted from the genus to species level [27]. LDA scores ≥ 4.0 and p < 0.05 were considered signature taxa and selected for plotting and further analysis.
Differential abundance of the GO level-2 function, KEGG level-3 pathways, CAZy, and PHI annotations was assessed. For each comparison, the Wilcoxon rank-sum test was performed, and the results were corrected for multiple testing using the Benjamini–Hochberg FDR method. To explore potential microbial co-occurrence patterns within each niche, SparCC correlation analysis (1000 permutations) was performed among the top 30 most abundant genera in each group; co-occurrence networks were visualized using edges with |r| > 0.6 for descriptive purposes. Spearman’s rank correlation analysis was conducted to construct bipartite correlation networks between the top 30 genera and CAZy families/KEGG functions, and correlations with |r| ≥ 0.6 and adjusted p < 0.05 were considered statistically significant. All analyses were conducted on the BMKCloud platform (www.biocloud.net).
3. Results
3.1. Sequencing Quality and Microbial Diversity in the NAS and INT Microbiomes
Following full-length 16S rRNA amplification and sequencing, 966,597 CCS sequences of 16 swab samples were obtained. Each yielded an average of 60,412 CCS sequences (Supplementary Table S1). The dilution curve is stable, as shown in Figure S1 in the Supplementary Materials, indicating that the sequencing depth has adequately covered the majority of operational taxonomic units (OTUs), thereby verifying the completeness of microbial diversity capture and the reliability of the results. After quality control of the sequencing data, a total of 143.53 Gb of clean data was obtained. The number of reads per sample ranged from 42,538,218,210 to 82,724,588, with an average of 58,957,953 bp, and the Q30 was 94.73%. An average of 73,540 assembly contigs per sample was identified, yielding an average total assembly length of 66,239,031 bp per sample and an average contig length of approximately 900.71 bp (Supplementary Table S2). The majority of contigs ranged from 500 to 1000 bp (Supplementary Figure S2). The sequencing data quality is reliable for subsequent analysis.
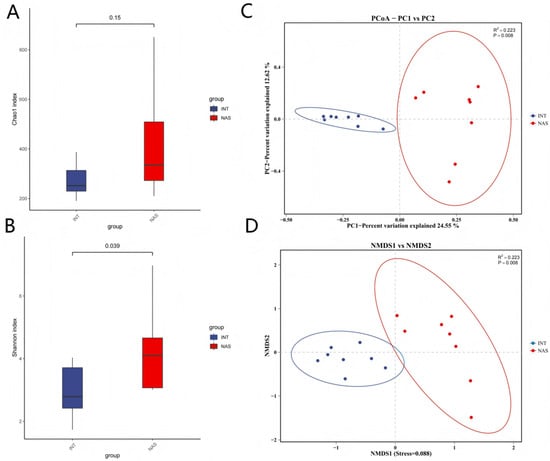
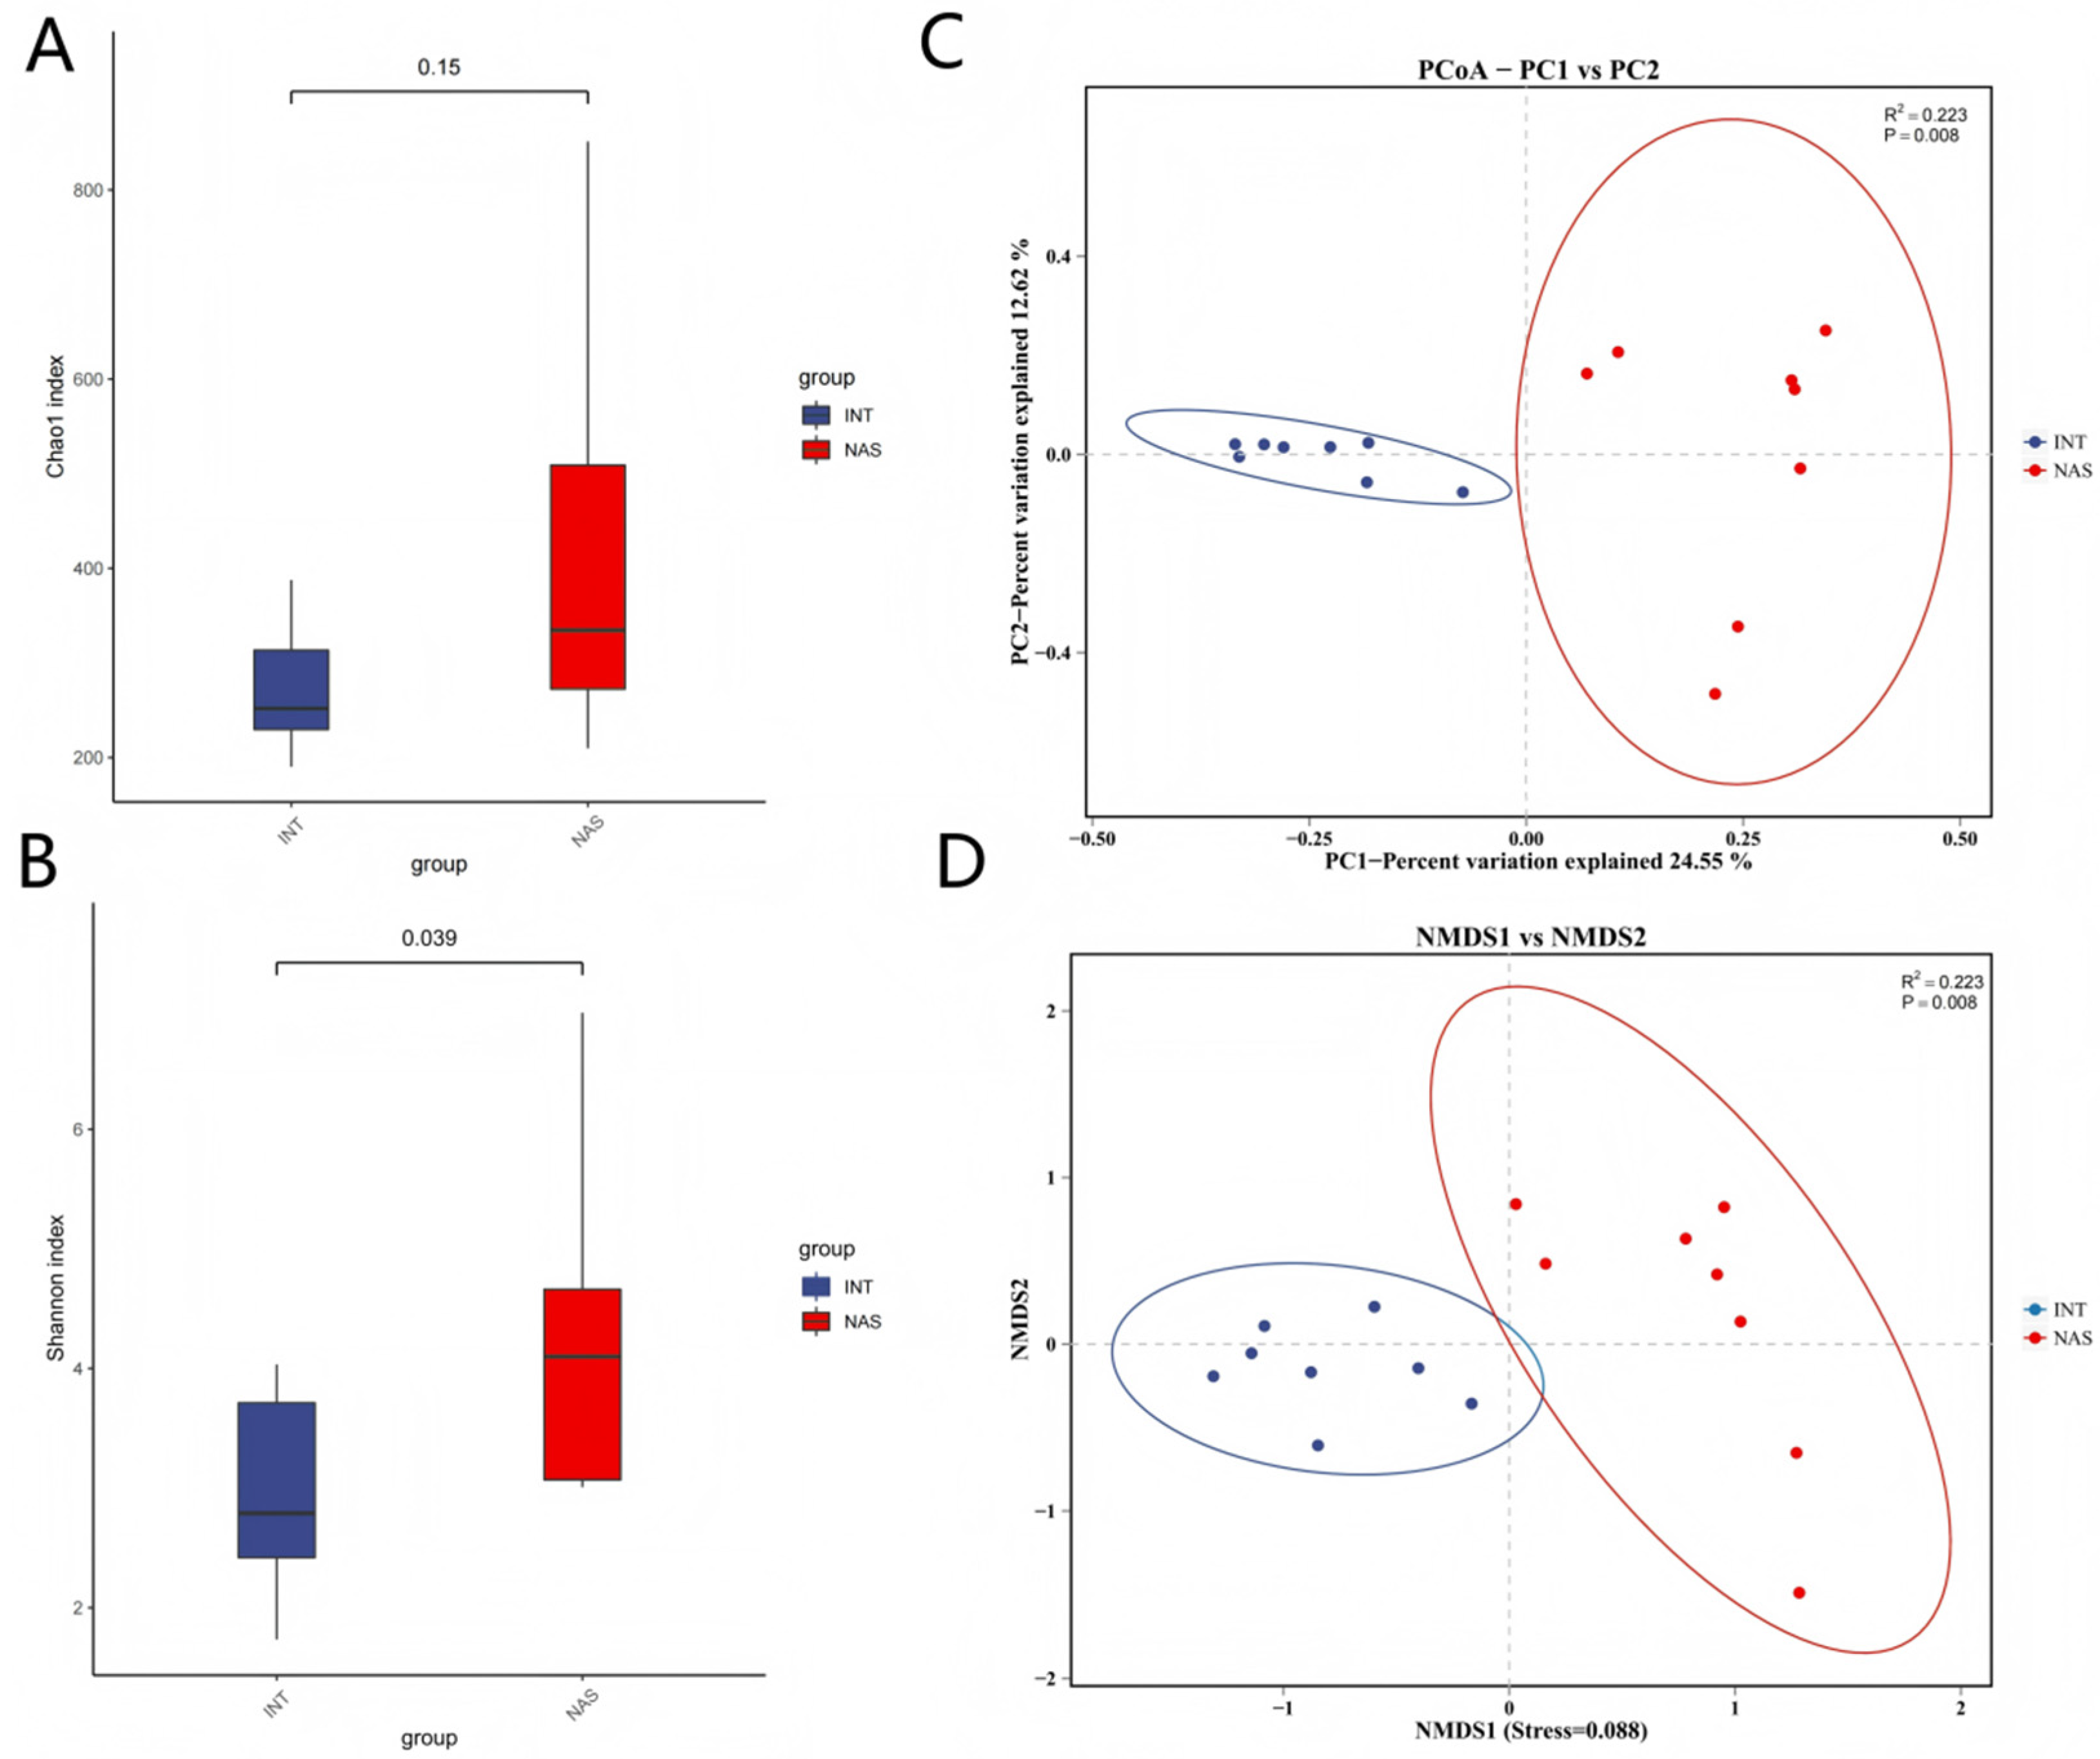
Further analysis of microbial diversity between the NAS and INT sample groups revealed that the Chao1 index, which primarily reflects the species richness of the microbial community, is slightly higher in the NAS group, although this difference was not significant (Figure 1A; p = 0.15). In contrast, the Shannon index, which mainly reflects the community evenness of the microbiota, was significantly higher in the NAS group, indicating a more evenly distributed diverse microbial community (Figure 1B; p = 0.039). For beta diversity, PCoA based on the binary Jaccard distances revealed a clear separation between the NAS and INT groups along PC1 (Figure 1C; PERMANOVA R2 = 0.223, p = 0.008). The INT samples formed a tight cluster, whereas the NAS samples exhibited greater within-group dispersion. A complementary NMDS analysis (Stress = 0.088) showed a consistent pattern of group separation (Figure 1D).
Figure 1.
Diversity profiles of the NAS and INT groups based on full-length 16S rRNA gene sequencing. (A) Chao1 index. (B) Shannon index. (C) PCoA based on binary Jaccard distances. (D) NMDS analysis (Stress = 0.088).
3.2. Microbial Community Structure and LEfSe Analysis
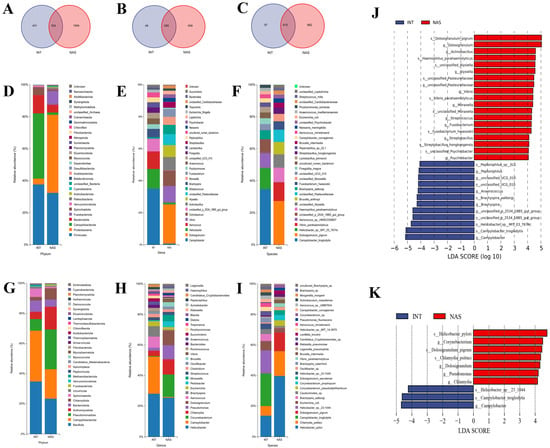
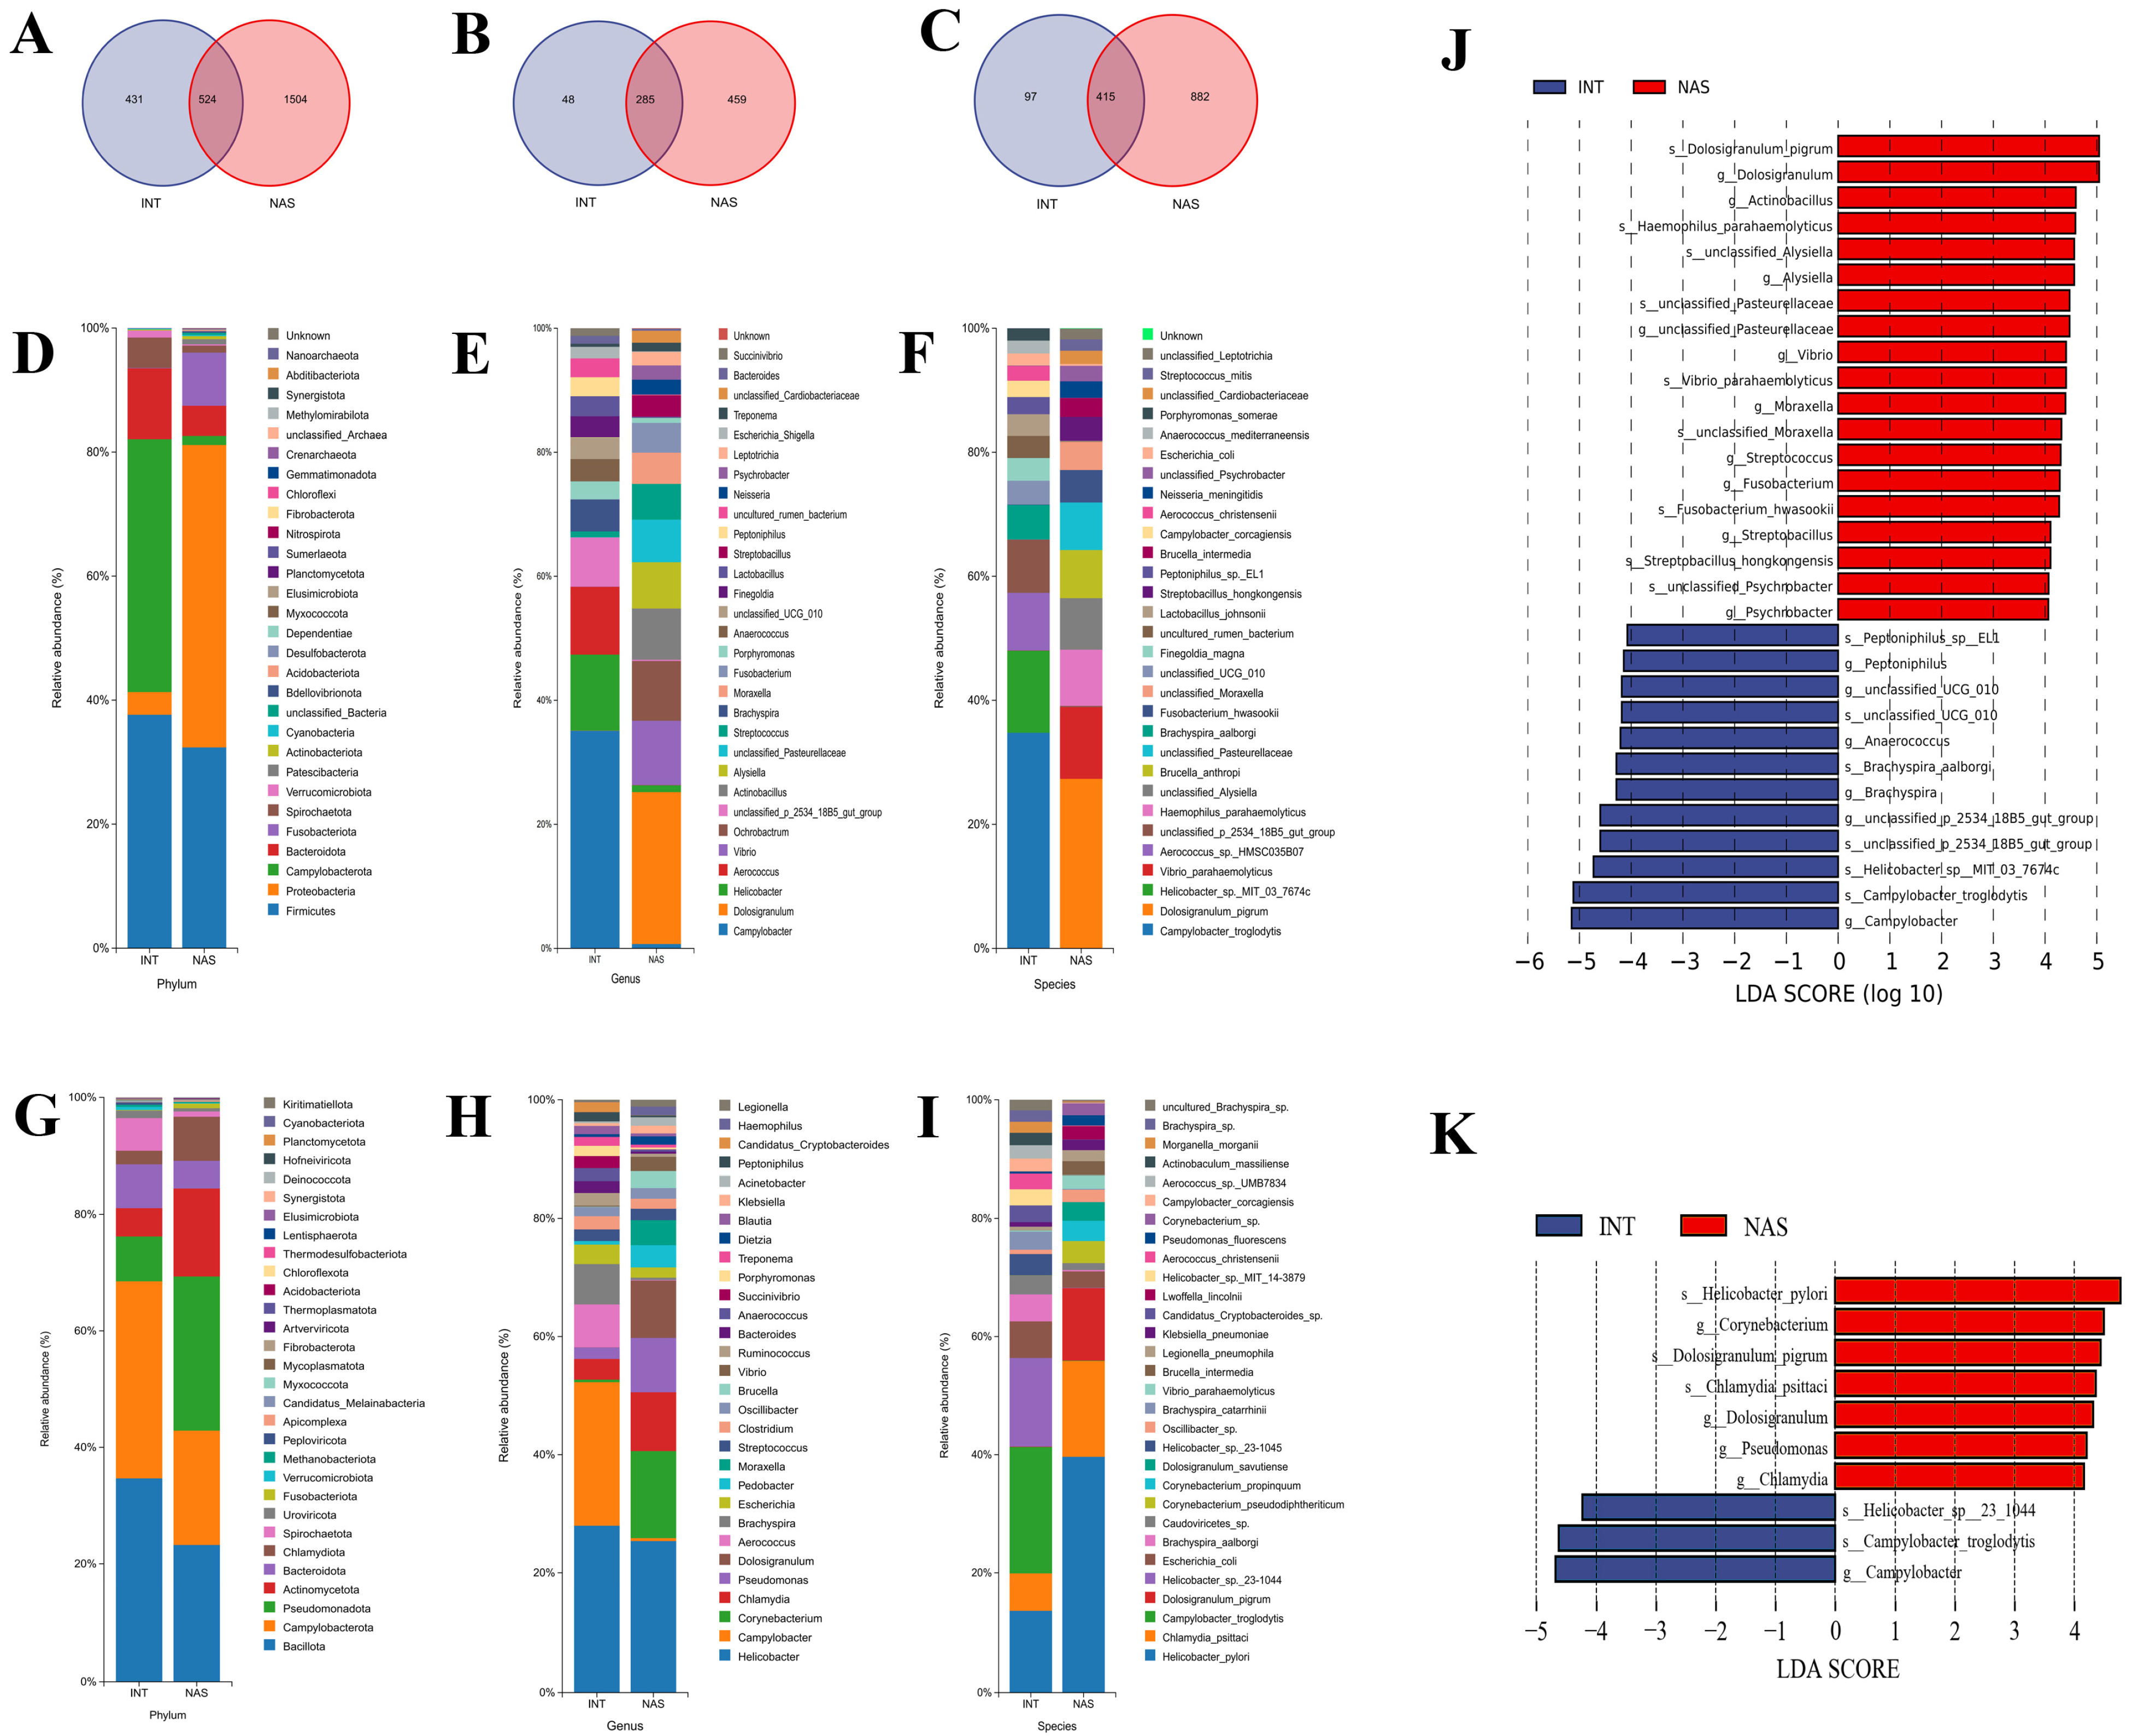
Full-length 16S rRNA sequencing revealed niche differentiation between NAS and INT microbiota in this small cohort. Among 2459 OTUs (97% similarity), NAS contained more OTUs (2028) than INT (955), with 524 shared between the two niches (Figure 2A). A core microbiota of 285 genera and 415 species coexisted with niche-specific assemblages, reflecting both conservation and adaptation across anatomical sites (Figure 2B,C).
Figure 2.
Microbiome diversity comparison between NAS and INT in golden snub-nosed monkeys, explored with full-length 16S and metagenomic sequencing. (A–C): A Venn diagram illustrates the numbers of unique and shared OTUs (A), genus (B), and species (C) between the NAS and INT microbiomes. (D–F): Stacked bar charts display relative abundance at phylum (D), genus (E), and species (F) levels, based on 16S full-length sequencing. (G–I): Stacked bar charts show microbial relative abundance at the phylum (G), genus (H), and species (I) levels, based on metagenomic sequencing. (J): LEfSe analysis of full-length 16S rRNA gene sequencing that identifies microbial biomarkers (LDA score > 4.0), distinguishing NAS (red) and INT (blue) microbiota; (K): and LEfSe analysis of metagenomic sequencing data that confirm niche-specific microbial signatures (LDA score ≥ 4.0). Note: Y-axis: Features that show a difference between groups; X-axis: Log10 of LDA score, where the LDA score threshold is 4.0. The features are sorted by LDA score. The longer the bar is, the more significant the difference level becomes.
Taxonomic profiles by 16S full-length sequencing (Figure 2D–F) and metagenomic sequencing (Figure 2G–I) show distinct microbial community structures between NAS and INT at the phylum, genus, and species levels. At the phylum level (Figure 2D,G), INT communities were dominated by Campylobacterota and Firmicutes in both datasets, whereas NAS communities were dominated by Proteobacteria and Firmicutes. At the genus level (Figure 2E,H), 16S sequencing revealed distinct dominant taxa between the two niches: the NAS group was characterized by Dolosigranulum and Vibrio (Figure 2E); the INT group was dominated by Campylobacter, Helicobacter, and Aerococcus, (Figure 2E). Of the top 30 most abundant genera, 14 were shared by the two sequencing approaches (16S and metagenomics) (Supplementary Figure S3): Dolosigranulum, Helicobacter, and Vibrio in NAS, and Helicobacter, Campylobacter, and Aerococcus in INT. The two sequencing approaches exhibited complementary detection scopes: 16S sequencing uniquely identified 16 genera, primarily comprising cultivable or common bacteria, while metagenomics uniquely classified 16 genera, including taxa undetected by 16S (such as Corynebacterium, Chlamydia, and Pseudomonas) (Supplementary Table S3).
At the species level, the two methods were largely concordant—Campylobacter troglodytis was the predominant species in INT in both datasets, and Dolosigranulum pigrum was the leading species in NAS by 16S (19.43%). Metagenomics further resolved Helicobacter pylori as the most abundant species in NAS (19.26%) and detected potential zoonotic pathogens, most notably Chlamydia psittaci (7.88%), which 16S did not recover at a comparable abundance. Overall, some species were recovered by both approaches (including Campylobacter troglodytis, Dolosigranulum pigrum, and Escherichia coli), suggesting the consistency of the two sequencing approaches (16S and metagenomics) at the species level while highlighting metagenomics’ added resolution for fastidious taxa (Figure 2F,I).
The LEfSe analysis (LDA > 4.0) identified distinct microbial biomarkers for each niche. In 16S rRNA data (Figure 2J), NAS microbiota was enriched in Dolosigranulum (D. pigrum), Actinobacillus, Haemophilus parahaemolyticus, Vibrio, Streptobacillus (S. hongkongensis), Fusobacterium (F. hwasookii), and Psychrobacter. In contrast, INT microbiota was dominated by gut-adapted taxa, including Peptoniphilus, Anaerococcus, Brachyspira aalborgi, and Campylobacter (C. troglodytis). Metagenomic analysis (Figure 2K) further identified NAS-specific biomarkers not captured by 16S sequencing, including Helicobacter pylori, Corynebacterium, Pseudomonas, and Chlamydia. Both sequencing platforms identified Campylobacter as rectal biomarkers.
3.3. Within-Niche Microbial Co-Occurrence Networks
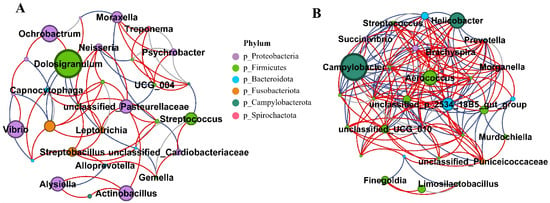
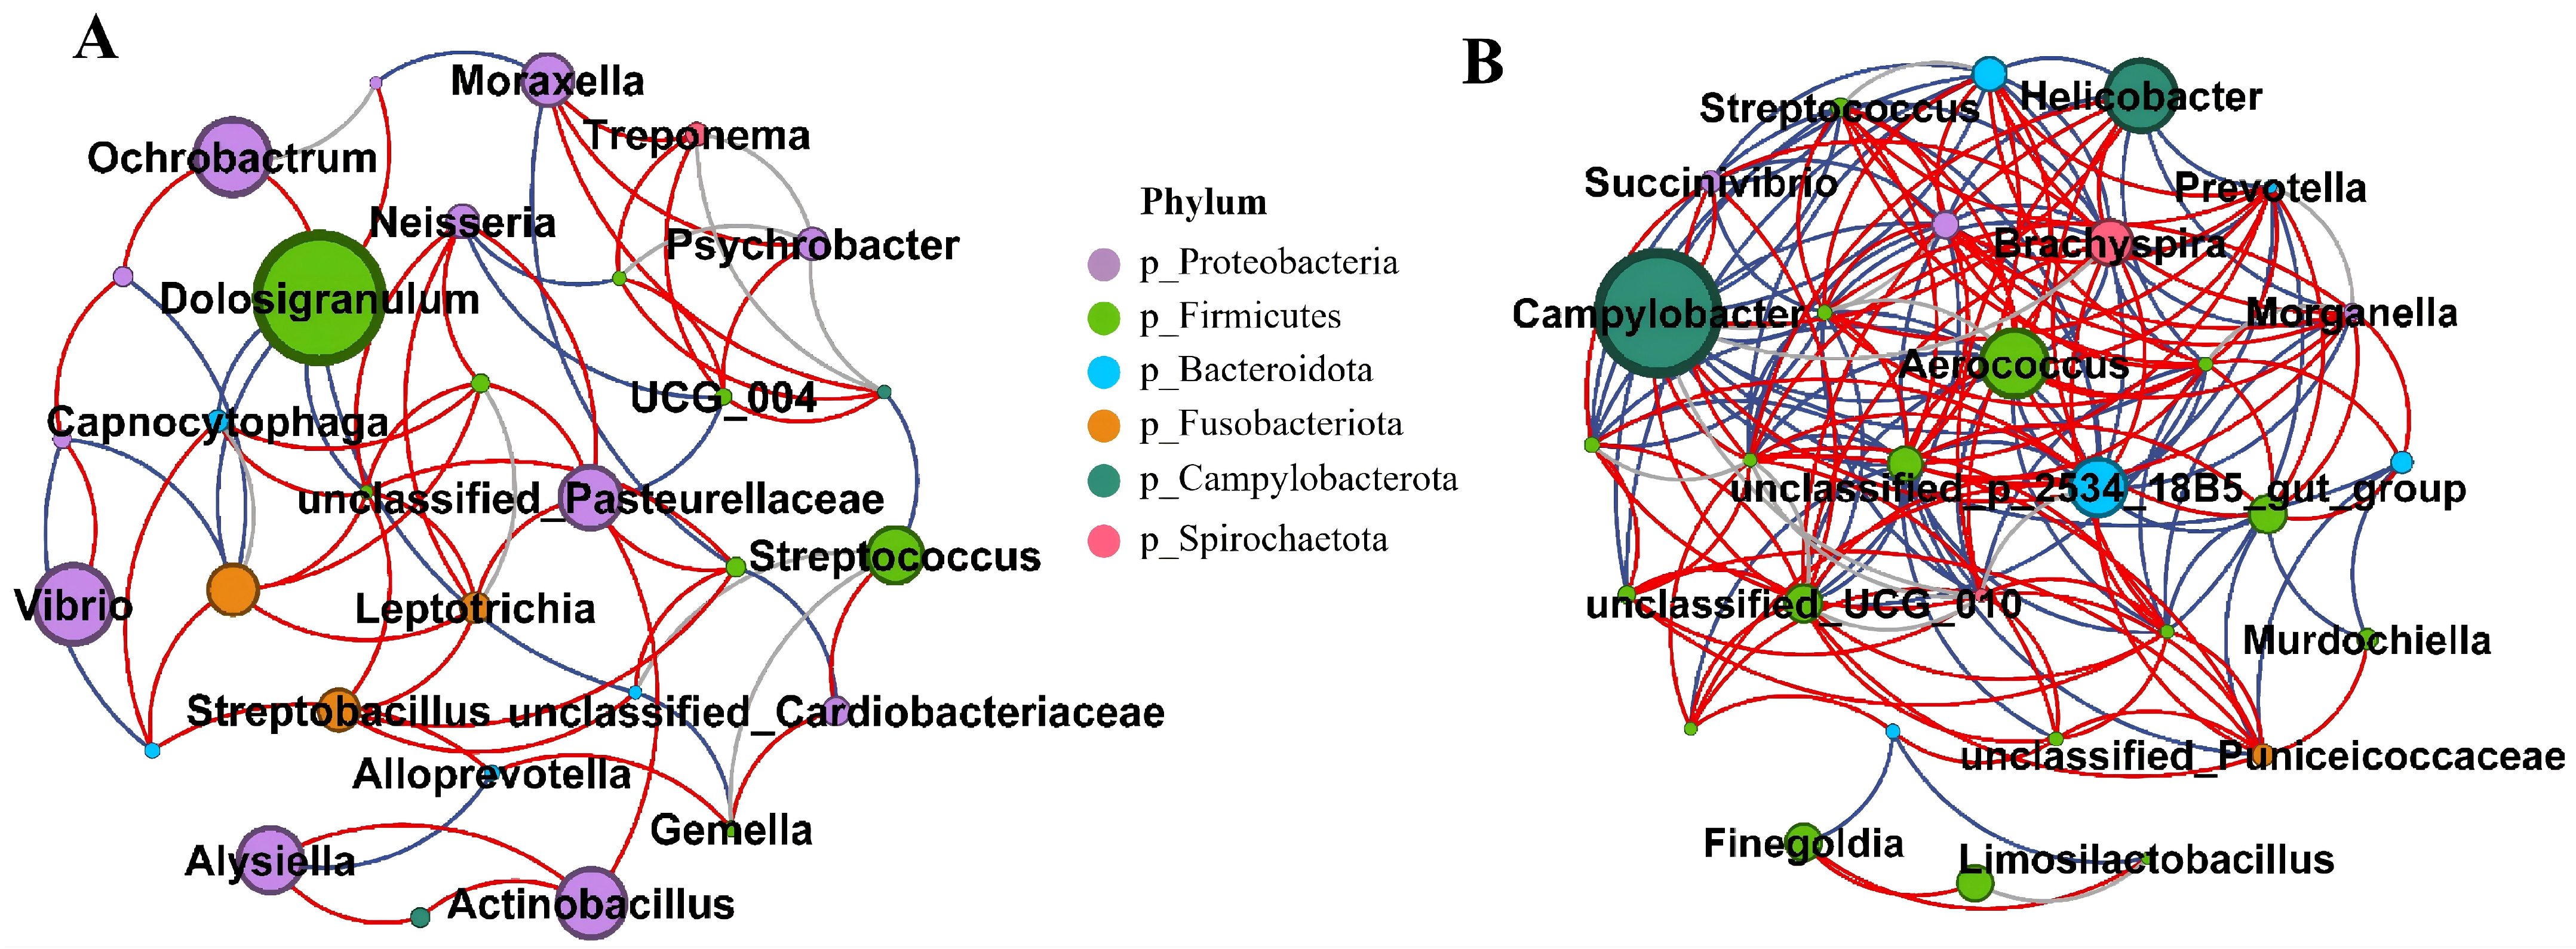
To preliminarily explore potential microbial co-occurrence patterns within each niche, SparCC correlation networks were constructed among the top 30 most abundant genera for each groups. Given the limited sample size (n = 8 per niche), the resulting networks are presented as exploratory and require experimental validation. Because correlations with |r| ≥ 0.9 are prone to be numerical artifacts of compositional structure and small sample size, at this sample size, all such edges (9 in the NAS network and 13 in the INT network; full list in Supplementary Table S4) were flagged as pseudo-correlations, shown as gray-dotted lines in the figures, and excluded from biological interpretation. After Benjamini–Hochberg correction, no correlation remained significant at q < 0.05. Our interpretation therefore focuses on moderate correlations (0.6 < |r| < 0.9) and global modular structures. These patterns are exploratory and do not imply cross-niche microbial interactions; they require validation in a larger cohort.
In the NAS network (Figure 3A, Supplementary Table S4-1), Johnsonella and Fusobacterium showed the highest connectivity (degree = 8), followed by Dolosigranulum, Veillonella, and Neisseria. Dolosigranulum was negatively associated with Capnocytophaga (r = −0.69), Bergeyella (r = −0.65), and Johnsonella (r = −0.65), and positively associated with Ochrobactrum (r = 0.70) and Aeromonas (r = 0.65). Johnsonella was positively associated with Veillonella (r = 0.88) and Capnocytophaga (r = 0.70). As for the INT network (Figure 3B, Supplementary Table S4-2), Treponema formed a tightly associated module, positively correlated with Ruminococcus (r = 0.88) and Brachyspira (r = 0.71). Negative correlations were observed between unclassified_Puniceicoccaceae and Anaerococcus (r = −0.87), as well as between Murdochiella and Bacteroides (r = −0.89).
Figure 3.
Exploratory genus-level microbial co-occurrence networks in NAS and INT microbiomes. Networks were constructed from SparCC correlations (1000 permutations) based on full-length 16S rRNA gene sequencing among the top 30 abundant genera in each group (n = 8 samples per group; edges shown for |r| > 0.6). (A): The correlation network diagram of the NAS group. (B): The correlation network diagram of the INT group. Red lines represent positive correlations with r < 0.9, blue lines show negative correlations with r < −0.9, gray lines show a relationship with |r| > 0.9; the color of nodes means different phyla of core bacterial genera, and the size of nodes indicates the abundance of each genus.
Comparisons of the two independent within-niche networks identified five genera in both niches, including Campylobacter, Treponema, Porphyromonas, Helicobacter, and Streptococcus. Porphyromonas displayed niche-dependent association patterns: it negatively correlated with Stenotrophomonas (r = −0.79) in the NAS and with Brachyspira in the INT (r = −0.74), whereas it showed positive associations with Escherichia-Shigella (r = 0.89) in the INT group.
3.4. Functional Profiling and Cross-Niche Correlation of the Microbiome
To further characterize functional divergence between the NAS and INT microbiomes, functional profiles were inferred using multiple bioinformatic pipelines. The two niches exhibited distinct, pathway-specific functional configurations.
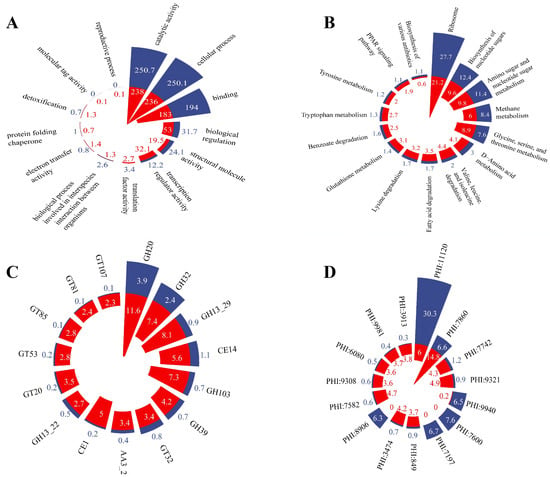
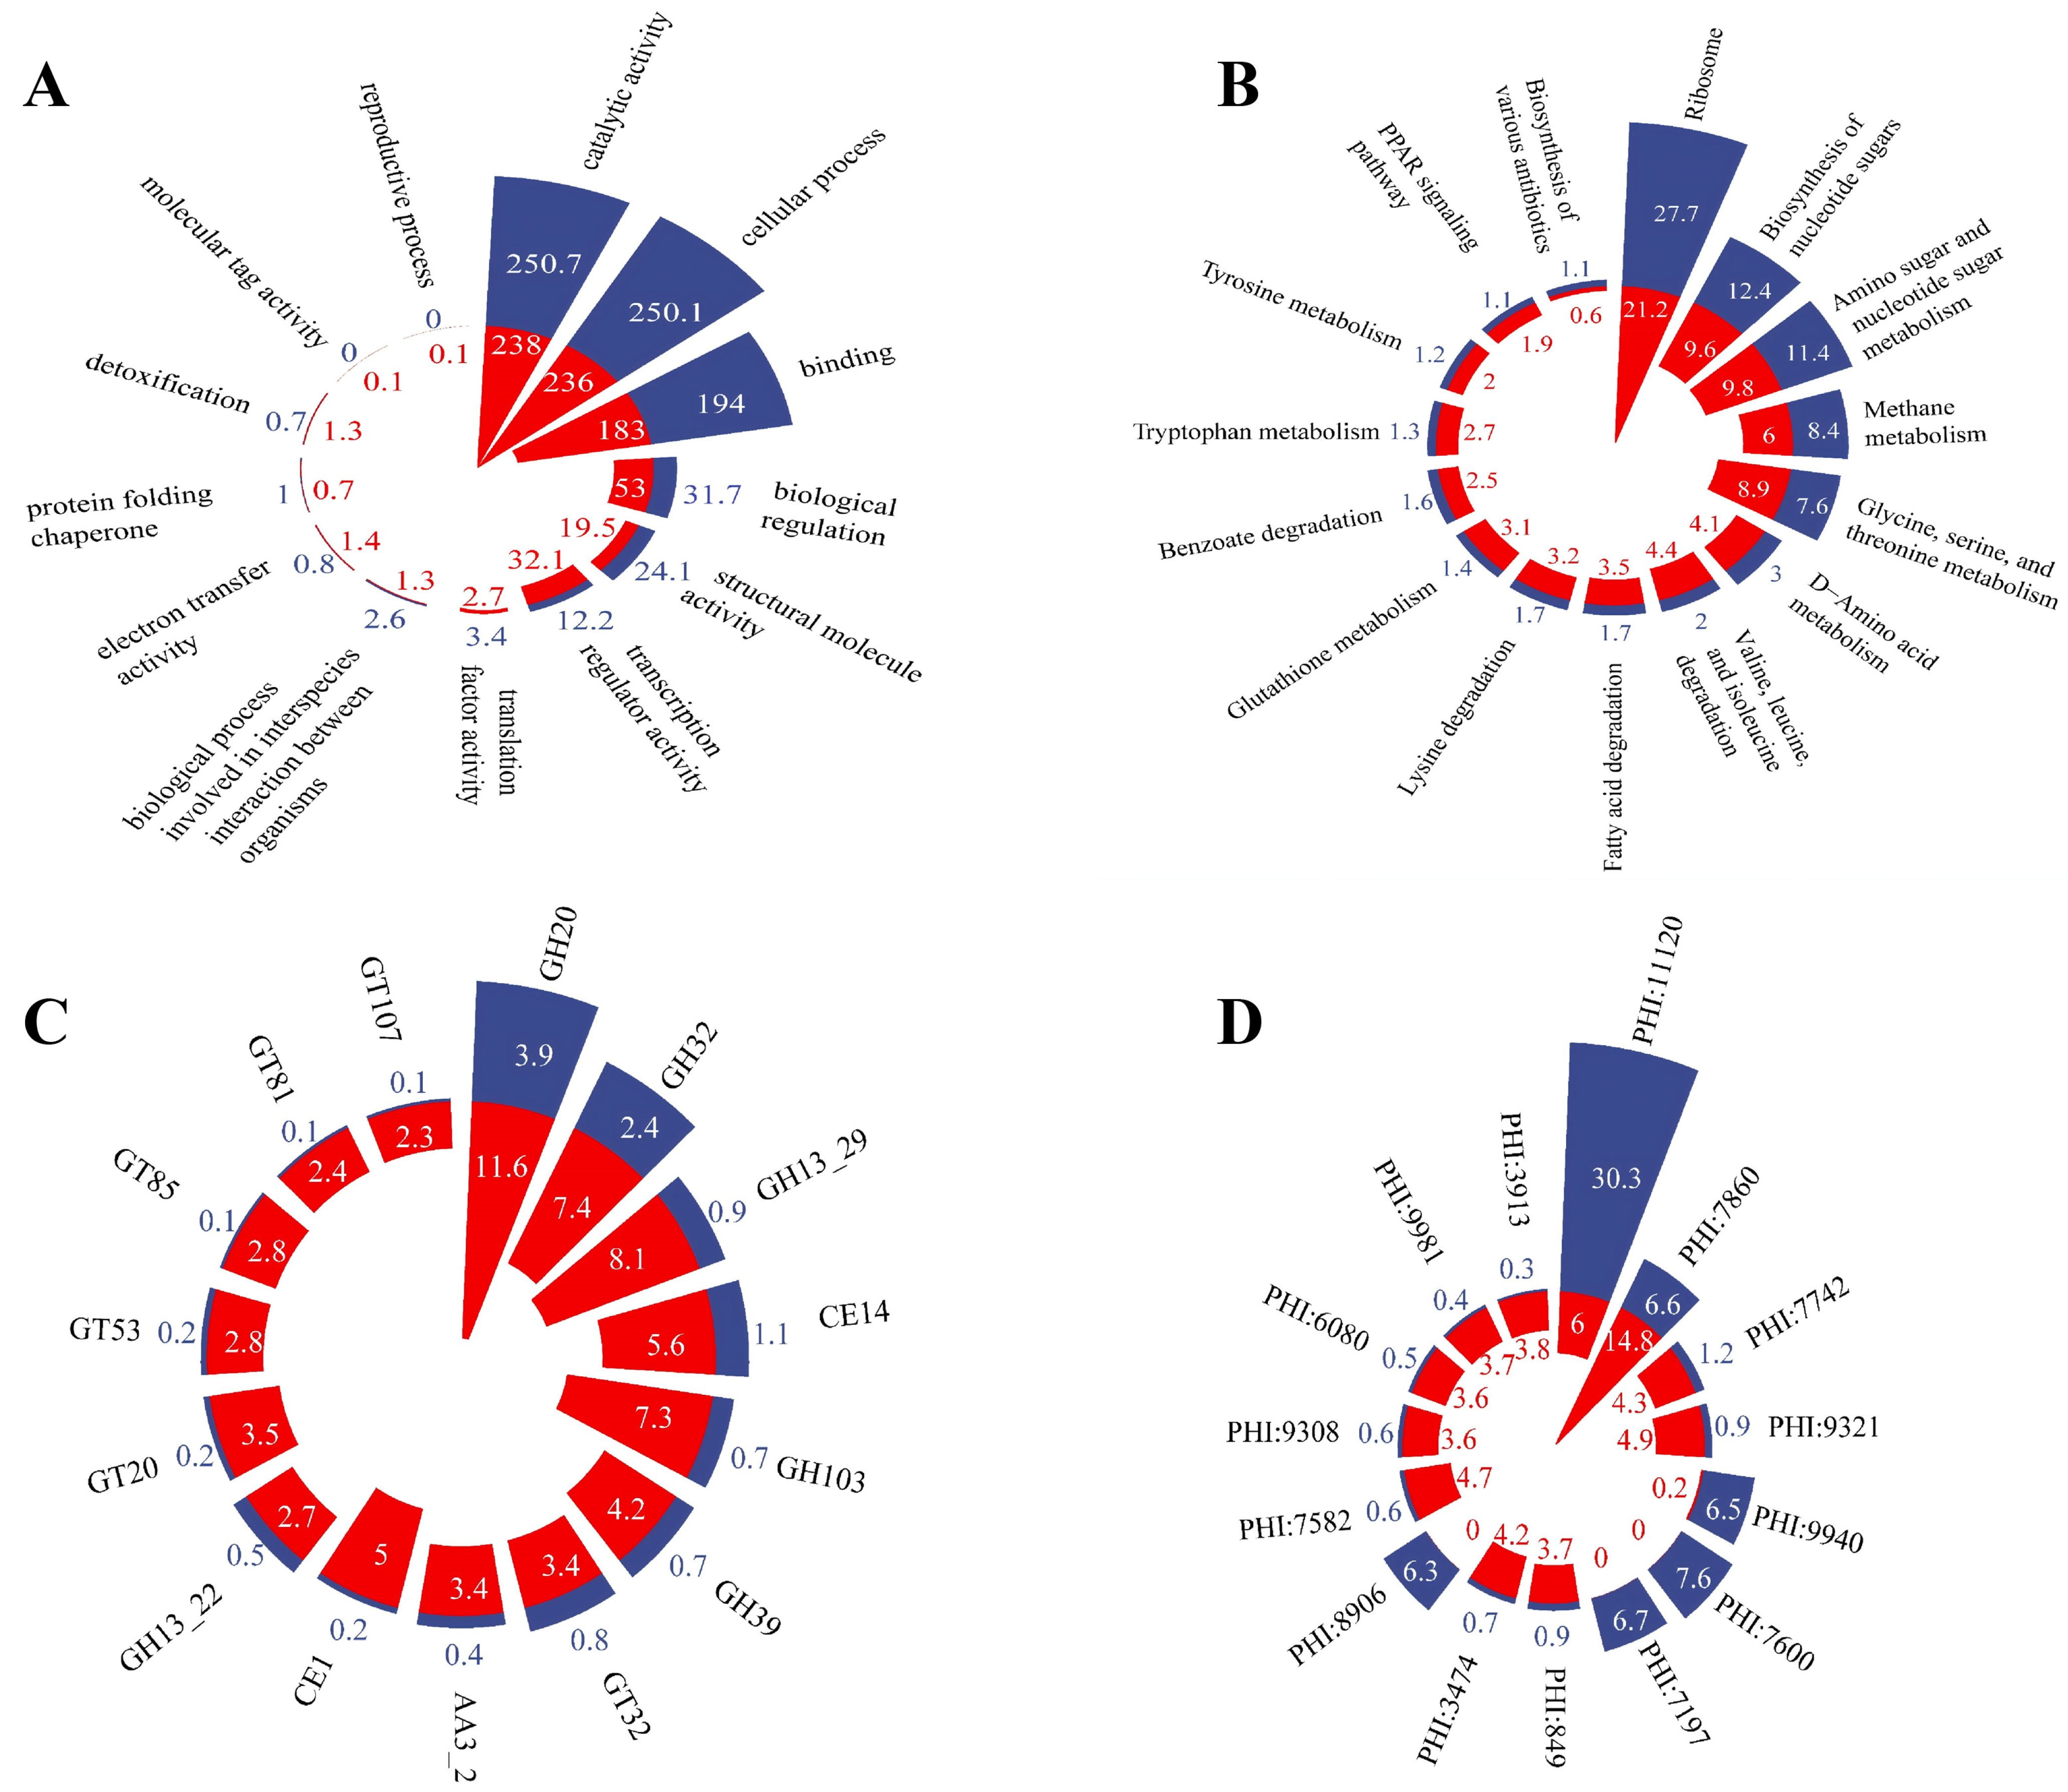
Gene Ontology (GO) analysis at the second level identified 13 functional categories that were significantly differentiated between the two microbiomes (adjusted p < 0.05). Of these, seven were enriched in the INT microbiome—including cellular process, catalytic activity, binding, structural molecule activity, protein folding chaperone, translation factor activity, and interspecies-interaction processes—whereas six were enriched in the NAS microbiome, notably, biological regulation, transcription regulator activity, detoxification, reproductive process, electron transfer activity, and molecular tag activity (Figure 4A). The KEGG level-3 pathway revealed 62 significantly differential pathways (adjusted p < 0.05). The INT-enriched pathways included ribosome, amino sugar, and nucleotide sugar metabolism; methane metabolism; and biosynthesis of various antibiotics. In contrast, the NAS microbiome was predominantly characterized by valine, leucine, and isoleucine degradation; glutathione metabolism; and fatty acid degradation (Figure 4B, Supplementary Table S5). At the CAZy family level (Figure 4C, Supplementary Table S6), 29 families showed differences (adjusted p < 0.05), and all were enriched in the NAS microbiome (e.g., GH13_29, GH103, CE14, GH39, AA3_2). Analyzed at the CAZy class level, the Auxiliary Activities (AA) class was significantly enriched in the NAS microbiome (mean relative abundance 0.94% ± 0.07% vs. 0.27% ± 0.04%; adjusted p = 0.0047). Pathogen–host interaction (PHI) functional profiles revealed site-specific enrichment patterns. Among the 134 quantified PHI categories, all showed highly significant differences in mean relative abundance between the two niches (adjusted p < 0.05), with the majority (126/134) enriched in the NAS microbiome and only eight in the INT microbiome. The INT microbiome was significantly enriched for PHI functions (e.g., PHI:11120, PHI:7600, and PHI:7197. In contrast, the NAS microbiome showed higher abundance of PHI functions (e.g., PHI:7860, PHI:7582, and PHI:3474). Notably, functions like PHI:7197 were nearly exclusive to the INT niche, with negligible detection in NAS, whereas PHI:4573, PHI:5575, PHI:7218, PHI:4667, and PHI:11189 were retained in the NAS microbiome (Figure 4D, Supplementary Table S7).
Figure 4.
Functional profiles of the NAS and INT microbiota in golden snub-nosed monkeys based on metagenomic sequencing. (A): Relative abundance of Gene Ontology (GO) functional categories at level 2. (B): Differences in abundance of KEGG-Level 3 pathways between NAS and INT. (C): Abundance comparison of CAZyme families between the NAS and INT groups. (D): Differential abundance of pathogen–host interaction (PHI) functions between the NAS and INT groups. Statistical significance is determined by the Wilcoxon rank-sum test with BH-FDR correction. Blue represents INT, and red indicates the NAS group. The top 15 abundance rankings are sorted in descending order by adjusted p-values and then by the maximum absolute differences in mean relative abundance between NA and INT microbiomes.
3.5. Correlation Network Analysis of Nasopharynx and Rectal Microbiota with KEGG Pathways and CAZy
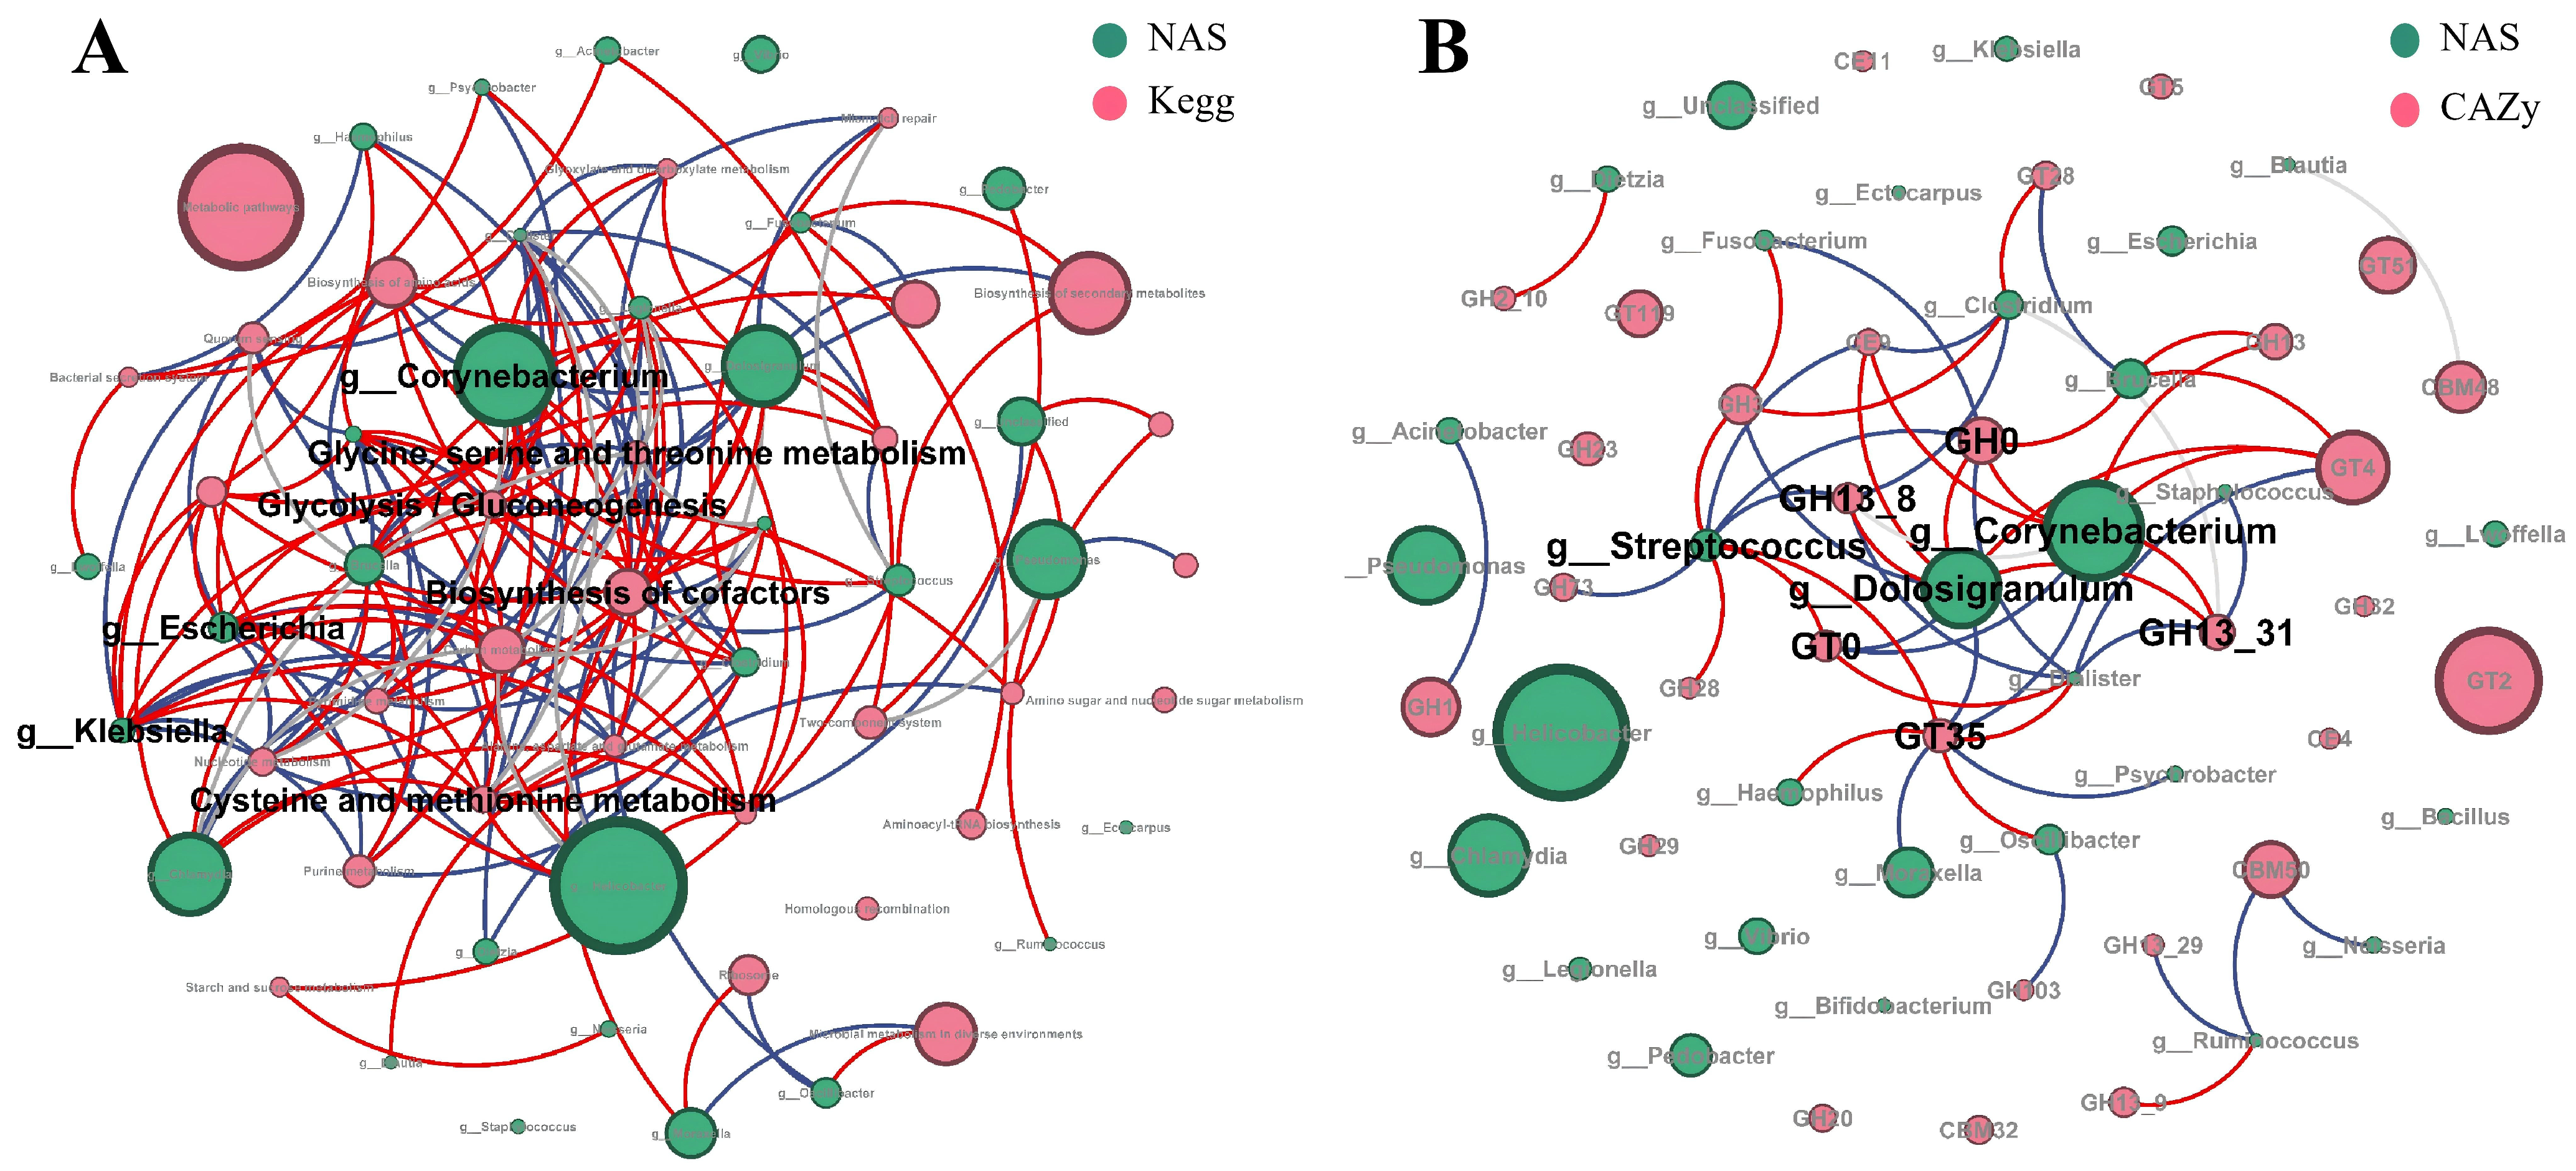
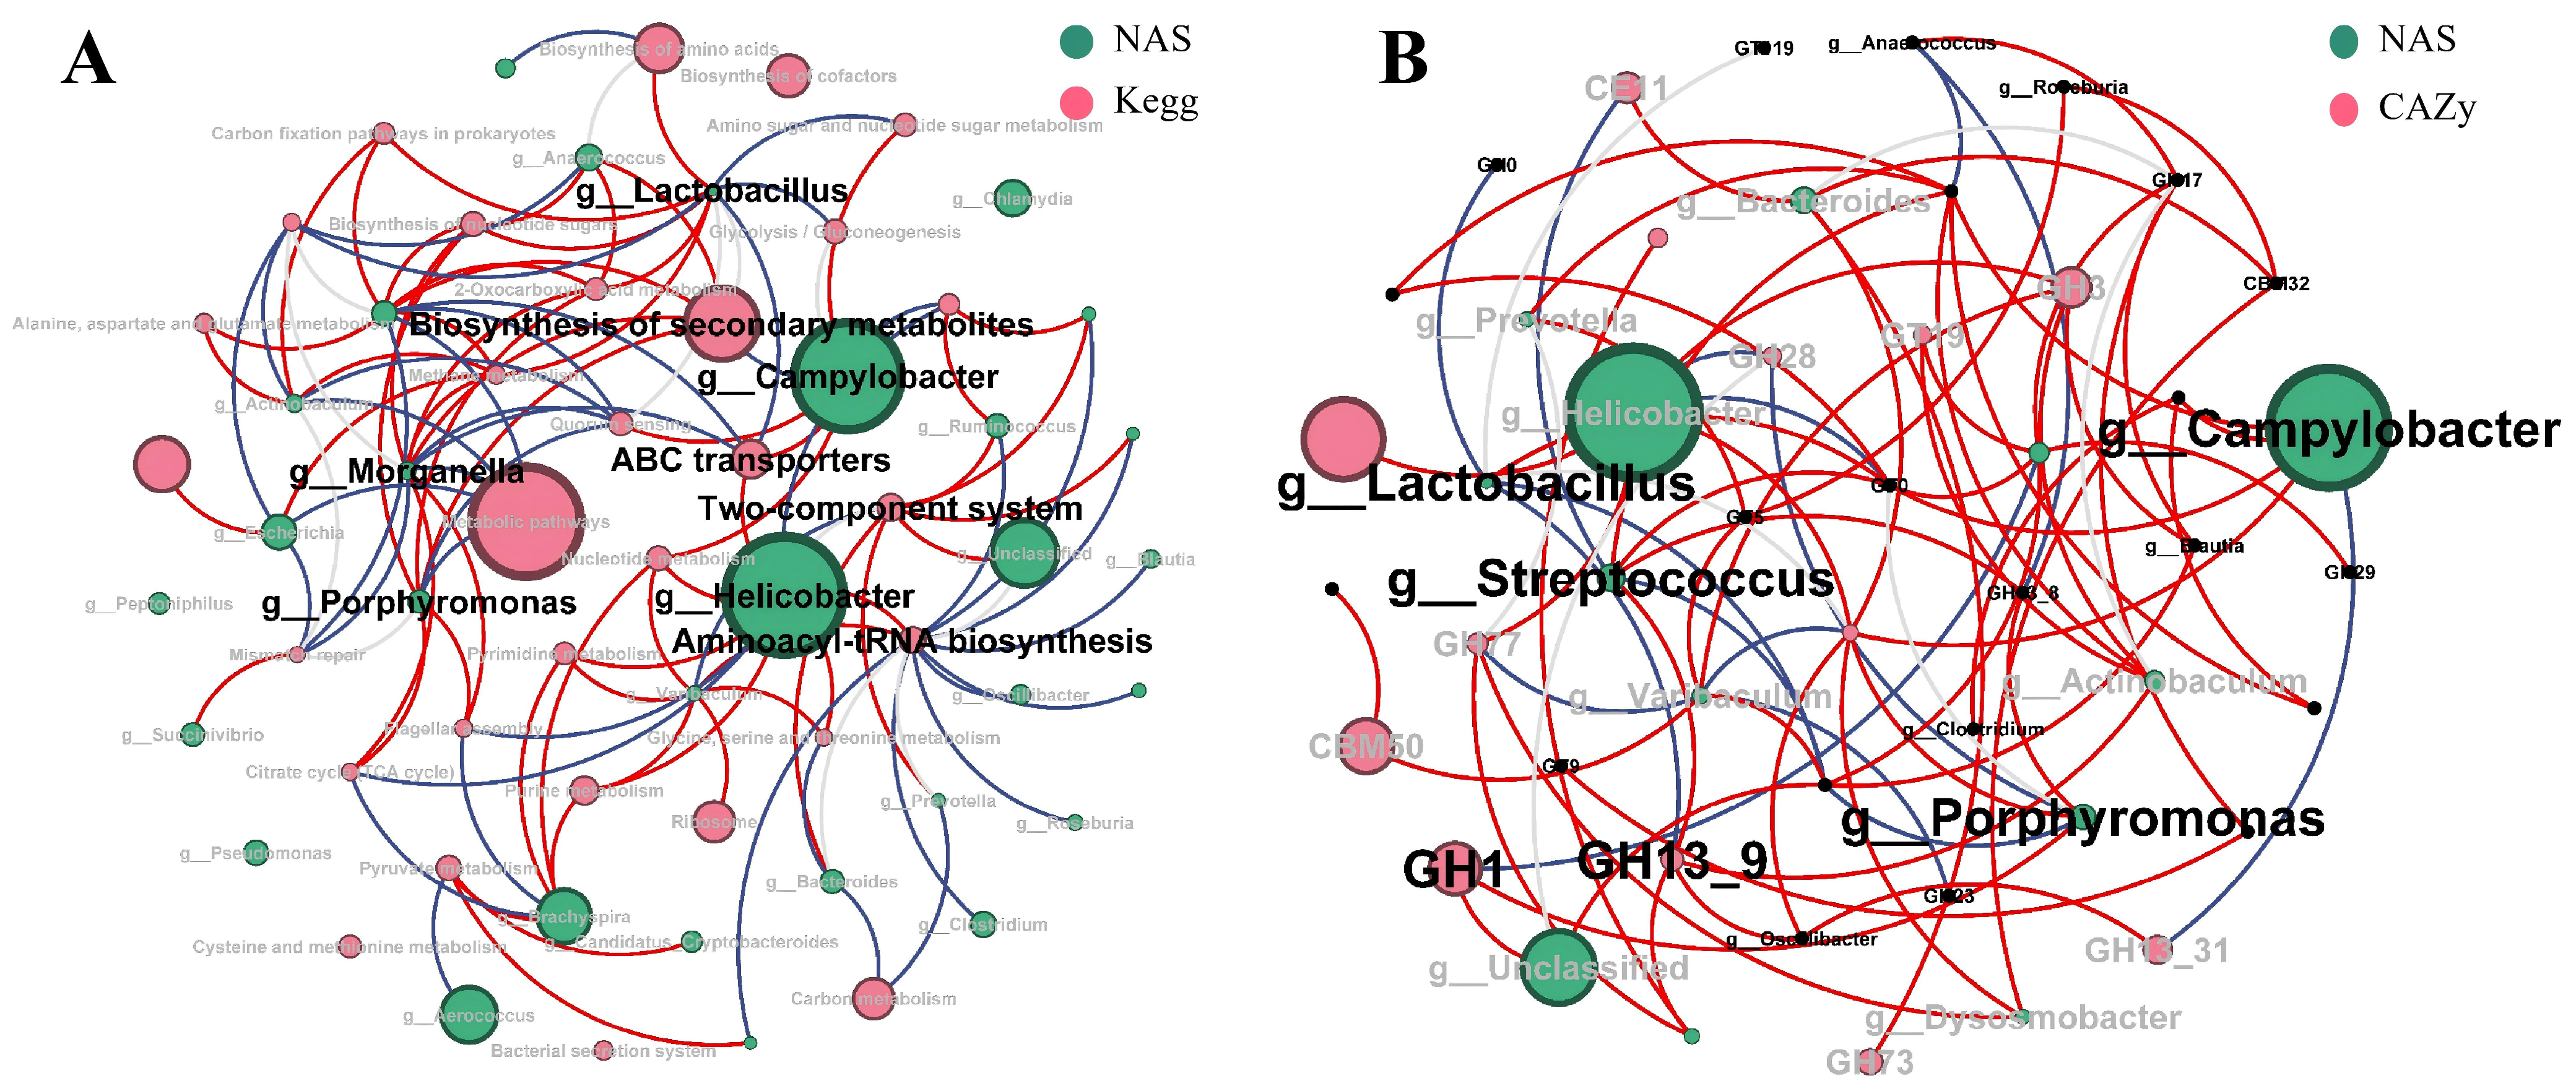
Co-occurrence networks between the top 30 genera and CAZy families/KEGG functions were constructed using Spearman’s correlation. Candidate edges were first screened at |r| ≥ 0.6 and p-raw < 0.05, followed by BH–FDR correction (qBH < 0.05). In the genus–CAZy networks, no edge remained significant after correction (minimum qBH = 0.078). In the genus–KEGG networks, 19 edges met the significance threshold; however, all of these exhibited |r| ≥ 0.9 (Figure 5, Supplementary Tables S8 and S9). Given the limited sample size (n = 8 per anatomical site), such extreme correlations are the classic signature of numerical or compositional artifacts and are therefore set aside as unstable in the following analysis. All substantive interpretations below are restricted to exploratory associations within the 0.6 ≤ |r| < 0.9 range (all q_BH > 0.05). Complete edge-level data for all networks are provided in Supplementary Tables S8-1–S9-2.
Figure 5.
Microbial-KEGG/CAZy co-occurrence networks in the NAS microbiomes. (A): Co-occurrence network of core microbes and KEGG pathways in the top 30 NAS microbiome. (B): Co-occurrence network of core microbes and CAZy families in the top 30 NAS microbiome. Red lines show a positive relationship with r < 0.9, while blue lines show a negative relationship with r > −0.9. Gray lines show a relationship with |r| > 0.9.
In the NAS genus–KEGG network (Figure 5A), the most extensively connected pathways were biosynthesis of cofactors (12 genus links), glycolysis/gluconeogenesis (12), pyrimidine metabolism (11), and biosynthesis of amino acids (10). Biosynthesis of cofactors showed a consistent negative association with most genera (e.g., Dialister r = −0.88, Helicobacter r = −0.71, Chlamydia r = −0.71, Haemophilus r = −0.76, Klebsiella r = −0.69, Bacillus r = −0.69) but positive links with Corynebacterium (r = +0.86), Dolosigranulum (r = +0.83), and Moraxella (r = +0.81). Glycolysis/gluconeogenesis was negatively associated with Dolosigranulum (r = −0.83) yet positively with Helicobacter (r = +0.81). Biosynthesis of amino acids showed an opposing pattern for Dolosigranulum (r = −0.88) versus Streptococcus (r = +0.86). Glycine, serine, and threonine metabolism appeared via links (e.g., Dolosigranulum r = −0.81, Corynebacterium r = −0.76, Clostridium r = +0.71). Across these pathways, Corynebacterium and Dolosigranulum emerged as recurring hubs, with particularly strong positive links to multiple pathways including alanine, aspartate, and glutamate metabolism. In the NAS genus–CAZy network (Figure 5B), no edge remained significant after Benjamini–Hochberg (FDR) correction; the most connected were Dolosigranulum and Streptococcus (eight CAZy-family links each) and Corynebacterium (eight links).
Similarly, in the INT genus–KEGG network (Figure 6A), the 104 exploratory edges at 0.6 ≤ |r| < 0.9 were spread across many pathways; the two with the most genus associations were aminoacyl-tRNA biosynthesis and two-component system. Aminoacyl-tRNA biosynthesis was positively associated with Dysosmobacter (r = +0.88), Pseudoflavonifractor (r = +0.83), and Ruminococcus (r = +0.79) but negatively with Varibaculum (r = −0.81) and Helicobacter (r = −0.76). The two-component system showed negative links with Bacteroides (r = −0.88), Dysosmobacter (r = −0.86), and Pseudoflavonifractor (r = −0.83) but a positive link with Varibaculum (r = +0.88). A further set of pathways each carried five exploratory edges, including ABC transporters (Campylobacter r = −0.86, Lactobacillus r = +0.83), quorum sensing, methane metabolism, metabolic pathways, and biosynthesis of nucleotide sugars. Full edge lists are in Supplementary Table S8-2. In the INT genus–CAZy network (Figure 6B), no edge survived BH–FDR correction (minimum q_BH = 0.078). Among these non-significant associations, the most highly connected genera were Helicobacter, Streptococcus, Porphyromonas, and Campylobacter.
Figure 6.
Microbial-KEGG/CAZy co-occurrence networks in INT microbiomes. (A): Co-occurrence network of core microbes and KEGG pathways in the top 30 INT microbiome. (B): Co-occurrence network of core microbes and CAZy families in the top 30 INT microbiome. Red lines show a positive relationship with r < 0.9, while blue lines show a negative relationship with r > −0.9. Gray lines show a relationship with |r| > 0.9.
4. Discussion
The nasopharynx and rectum are critical microbial habitats in mammals, harboring complex microbial communities that play essential roles in host health, nutrient metabolism, and immune regulation [3,28]. Here, we describe spatially specialized microbial and functional profiles in primate microbiomes. These findings advance our understanding of microbial ecology in Rhinopithecus roxellana and may inform health surveillance of endangered species.
4.1. Spatially Specialized Taxonomic Architecture
The nasopharyngeal (NAS) and rectal (INT) niches assembled into markedly different communities. The NAS microbiota was dominated by Proteobacteria, resembling the upper respiratory tract microbiota of children [29], swine [30], bovines [31], and ovine species [32]. Notably, Dolosigranulum pigrum was highly abundant in the NAS (19.43%) and identified as a key biomarker (LEfSe; LDA = 5.04), with a substantially higher abundance than previously reported in human children (about 5%) [29]. Recent research has shown that D. pigrum is increasingly recognized as a commensal with competitive-exclusion activity against airway pathogens in humans [33], and higher nasopharyngeal abundance has been linked to reduced pathogen acquisition in infants [34]. Its enrichment in the monkey nasopharynx may therefore reflect a colonization-resistant, health-associated assembly, although this interpretation remains to be tested.
In contrast, the INT microbiome was dominated by Campylobacterota, with Campylobacter and specifically C. troglodytis as the principal taxa. This composition markedly deviates from the conventional paradigm that primate gut microbiota are primarily dominated by Firmicutes and Bacteroidetes [8,12,35]. Although Campylobacter is conventionally regarded as a pathogenic bacterium in the intestines of humans and animals [36], Campylobacters are also commensal organisms that live in the gastrointestinal tracts of birds [37]. More importantly, C. troglodytis has been detected in asymptomatic wild chimpanzees [38], and other Campylobacter species have similarly been isolated from asymptomatic nonhuman primates, including common marmosets, lemurs, and cotton-top tamarins [39], indicating that Campylobacter carriage does not inevitably cause disease. We therefore propose a hypothesized commensal carriage model for C. troglodytis in this host, rather than a pathobiont model; this remains to be tested.
Together, the divergent NAS and INT profiles indicate that local anatomical niche shapes community assembly in Rhinopithecus roxellana, consistent with cross-body-site and cross-segment studies in humans and livestock [40,41].
4.2. Niche-Specific Predicted Potential Metabolic Differentiation
To explore whether the marked taxonomic divergence between NAS and INT is accompanied by functional differentiation, we next compared their predicted metabolic potentials based on metagenomic annotations. Metagenomic functional analysis indicated niche-differentiated metabolic potentials. In the nasopharynx (NAS), the annotated gene content was enriched in amino acid catabolic pathways, including BCAA (valine, leucine, isoleucine), glycine/serine/threonine, and tryptophan metabolism—alongside fatty acid degradation and detoxification modules (benzoate, drug metabolism-cytochrome P450). Similar capacities have been reported in other airway microbiomes: genome-resolved metagenomics of cattle nasal mucus recovered MAGs whose functional annotation revealed enrichment in amino acid and short-chain fatty acid metabolism [42], and human nasopharyngeal communities show disease-associated branched-chain amino acid metabolism [43]. In other systems, several of these annotated pathways have been linked to host-relevant processes: BCAA catabolism can interface with energy production and mTORC1 signaling [44,45]; tryptophan metabolism has been implicated in neuro-immune cross-talk in other models [46], and fatty acid degradation maintains energy homeostasis [47,48]. We emphasize that these interpretations are based solely on genomic predictions. Whether the NAS-enriched BCAA, tryptophan, and fatty acid modules actually engage these host pathways in Rhinopithecus roxellana remains untested and will require targeted metabolomic and transcriptomic validation.
By contrast, the INT microbiome was enriched in ribosome-associated pathways, amino sugar and nucleotide sugar metabolism (providing precursors for bacterial cell-wall and capsule synthesis) [49], methane metabolism (consistent with the established role of hydrogenotrophic methanogenesis in maintaining gut hydrogen homeostasis) [50,51], and the biosynthesis of various antibiotics and other secondary metabolites [52]. These patterns are consistent with prior characterizations of the gut microbiome in golden snub-nosed monkeys [7,12,35]. These pathway-level annotations describe which metabolic transformations are theoretically possible, but they do not by themselves resolve the enzymatic machinery or host interaction capacity that underpins niche colonization. To sharpen the functional picture beyond KEGG-level pathways, we therefore examined two complementary gene categories: the carbohydrate-active enzyme (CAZy) repertoire and the pathogen–host interaction (PHI) gene set.
Twenty-nine differentially abundant CAZy families were nasopharyngeal—including glycoside hydrolases (GH13_29, GH39, GH103) and a sialate O-acetylesterase (CE14) acting on host sialic-acid glycans—pointing to an airway toolkit for host-glycan foraging rather than gut-type plant-fiber degradation [53,54,55]. PHI profiling was even more asymmetric: of 134 categories, 126 were NAS-enriched against only eight intestinal, and the few INT-restricted functions—exemplified by PHI:7197—mark niche-specific gut colonization strategies [56]. We interpret the NAS bias toward PHI-factor homologs as a signature of an environmentally exposed mucosal niche where commensals maintain adhesion and immune-modulation capacities [57], not as evidence of pathobiology; as with all annotations here, these reflect inferred genetic potential rather than measured activity.
4.3. Hub Taxa and Microbial Correlation Networks (Exploratory)
As noted for the within-niche (§3.3) and genus–function (§3.5) networks, the small sample size (n = 8 per niche) means the strongest correlations are the most likely to be spurious. In our networks the largest edges reached |r| ≥ 0.9, and correlations of this magnitude are the classic signature of numerical artifacts arising from compositional structure and low statistical power rather than genuine ecological coupling [58,59]. No edge remained significant after Benjamini–Hochberg (FDR) correction (all qBH > 0.05); therefore, all patterns should be treated as exploratory and hypothesis-generating, not as evidence of ecological interaction.
In the genus-level network interactions, Treponema formed a tightly associated module with Ruminococcus (r = 0.88). This is biologically plausible because Treponema associates with plant fiber and interacts synergistically with cellulolytic bacteria such as Ruminococcus to accelerate polysaccharide breakdown [60]. Treponema is likewise enriched in nonhuman primates—e.g., it is abundant in the gut of rhesus macaques [61] and shows a lifestyle-associated distribution across chimpanzees, gorillas, and humans [62], consistent with the fiber-related microbial assembly inferred here, although direct Treponema–Ruminococcus syntrophy has, to our knowledge, been demonstrated chiefly in ruminants [60]. It echoes the treponeme-rich, plant-polysaccharide-fermenting gut microbiomes of high-fiber forager populations [63,64]. Though non-significant at n = 8, its direction is biologically plausible. The niche-dependent Porphyromonas associations were positive with Escherichia-Shigella in the INT but negative with Stenotrophomonas in the nasopharynx, which likewise echoes the emerging view that the same genus can occupy distinct interaction contexts across body sites [65,66].
In the genus–KEGG/CAZy correlation networks, Corynebacterium and Dolosigranulum emerged as the most connected hubs in the NAS functional network, mirroring the well-documented, health-associated Dolosigranulum–Corynebacterium signature of the upper-airway microbiota in infants and children [33,34]. The exploratory genus–KEGG links most often involved biosynthesis of cofactors, glycolysis, pyrimidine metabolism, and amino acid biosynthesis together with glycine, serine, and threonine metabolism. These pathways are compatible with mucin foraging at the mucosal surface: the degradation of host-secreted mucin glycans, a recognized carbon and energy source for mucosal commensals [67], could release sugars and sulphate that feed the central-energy, nucleotide, and cofactor pathways identified here.
Taken together, the patterns above are literature-consistent but statistically unsupported at n = 8; they frame clear, testable hypotheses for larger, independently sampled cohorts. Confirming these hypotheses will require metatranscriptomic or metabolomic validation of mucin foraging in the nasopharynx and of the Treponema–Ruminococcus (fiber-degrading) association/module in the rectum, together with strain-resolved tracking of Porphyromonas ecotypes across the two sites.
4.4. Zoonotic Potential and Implications for Health Surveillance
Metagenomic profiling extends beyond traditional community ecology, offering a non-invasive, culture-independent approach to monitoring the health of this endangered host. By resolving taxonomic signals from fecal and nasopharyngeal samples, the method can highlight candidate taxa for later confirmatory studies; however, read-level detection alone does not indicate active infection or established reservoir status. In the current dataset, the NAS microbiome contained potentially zoonotic or opportunistic taxa, such as Helicobacter pylori [68] and Chlamydia psittaci [69]. Notably, H. pylori has known natural reservoirs in macaques and great apes [68,70], while other zoonotic gastric and enterohepatic Helicobacter species have been documented in great apes [71], whereas C. psittaci, which is primarily avian, has been documented in diverse mammals [69,72,73], yet its detection in free-ranging golden snub-nosed monkeys remains rare. Thus, our sequence-based finding requires confirmation via targeted diagnostics (qPCR, culture) before any inference about active carriage or zoonotic risk. Meanwhile, Campylobacter was detected in the intestinal microbiome; as a genus with well-known zoonotic risk and documented occurrence in nonhuman primates [74,75], its detection in this endangered host warrants targeted surveillance. The sample size was relatively small (n = 8), and the obtained abundance data cannot be directly extrapolated to population-level prevalence. Under the “One Health” framework, this work still holds significant value: it not only serves the conservation biology of endangered primates, but also can provide early warning for new emerging zoonotic diseases at the human–wildlife interface [76,77,78].
4.5. Limitations
This study provides initial insights into the spatial distribution and functional associations of the nasopharyngeal and rectal microbiota in the golden snub-nosed monkey. However, several limitations should be noted. First, the small sample size (n = 8) limits statistical power and the stability of network analyses; some SparCC coefficients approached extreme values and were treated as artifacts. Second, the lack of temporal data precludes analysis of seasonal dynamics. Third, metagenomic functional prediction cannot distinguish actively expressed genes [79] or capture metabolite profiles [80]; multi-omics integration (e.g., metatranscriptomics, metabolomics) is needed [81]. Fourth, taxonomic and pathogen assignments used permissive thresholds (identity ≥60%, coverage ≥15%) and no extraction/sequencing negative controls or independent molecular confirmation were included; thus, pathogen-associated observations are descriptive and hypothesis-generating rather than confirmed infections, and two NAS samples had low post-host-removal read depth that reduces confidence in species-level calls. Fifth, the ecological and pathogenic significance of dominant taxa such as Campylobacter remains unclear in this endangered host.
5. Conclusions
This study reveals niche-specific microbial architectures in the nasopharynx and rectum of golden snub-nosed monkeys. The two sites differ taxonomically and in their predicted functional potential, with the NAS oriented toward catabolic/detoxification pathways and the INT toward ribosome, sugar metabolism, and biosynthesis pathways. Differentially abundant and highly connected taxa (e.g., Dolosigranulum in NAS, Campylobacter in INT) are hypothesized to contribute to spatially specialized community assembly, but these roles remain to be validated. These findings provide a foundational microbiome atlas for this endangered primate and highlight the value of multi-niche perspectives in conservation health monitoring; larger, longitudinal, and technically replicated cohorts are required to test the hypotheses raised here.
Supplementary Materials
The following supporting information can be downloaded at: https://www.mdpi.com/article/10.3390/biology15171530/s1.
Author Contributions
J.T. and H.Z. conceived and designed the study. J.T., N.L., W.Z. and H.Z. collected samples. L.S. prepared Figure 1 and Figure 2. N.L. and W.Z. prepared Figure 3 and Figure 4 and Supplementary Tables S1–S9. R.P. performed language polishing and manuscript structural revision. J.T. wrote the manuscript. H.Z. and B.L. contributed to critical revision. All authors have read and agreed to the published version of the manuscript.
Funding
This research was funded by the National Natural Science Foundation of China (32270536, 32672006, 32371563), Shaanxi Special Support Plan for High-level Talents (Shaanxi Talent Letter [2022] No.6, Shaanxi Talent Letter [2025] No.5), Special Foundation of Shaanxi Academy of Sciences, China (2024P-02, 2025k-13, 2025K-32, 2026K-32), Shaanxi Provincial Key Science and Technology Innovation Team (2026RS-CXTD-73), and Shaanxi Key Research and Development Program (2024JC-YWGCZ-05, 2024JC-YBQN-0242, 2025JC-YWGCZ-05, 2025JC-GXPT-037).
Institutional Review Board Statement
The animal experiment program was reviewed and approved by the Ethics Committee of Shaanxi Institute of Zoology (approval No. Y24D021A51, approval date 20 January 2022). The study was conducted in accordance with animal protection, animal welfare, and ethical principles, and followed relevant national regulations on the ethical welfare of experimental animals. All applicable institutional, national, and international guidelines for animal care and use were followed.
Informed Consent Statement
Not applicable.
Data Availability Statement
Full-length 16 s rRNA gene sequencing raw reads were deposited in the National Center for Biotechnology Information (NCBI) Sequence Read Archive (SRA) database (Accession Number: PRJNA1308553). Metagenomic genome sequencing data was submitted to the China National Center for Bioinformatics (CNCB), under BioProject accession number PRJCA044952.
Acknowledgments
The authors sincerely thank Hao Pan for his dedicated assistance in polishing and refining the figures in the revised version of this manuscript.
Conflicts of Interest
The authors declare no conflict of interest.
References
- McFall-Ngai, M.; Hadfield, M.G.; Bosch, T.C.; Carey, H.V.; Domazet-Lošo, T.; Douglas, A.E.; Dubilier, N.; Eberl, G.; Fukami, T.; Gilbert, S.F.; et al. Animals in a bacterial world, a new imperative for the life sciences. Proc. Natl. Acad. Sci. USA 2013, 110, 3229–3236. [Google Scholar] [CrossRef] [Scilit] [PubMed]
- Felix, S.; Fredrik, B. The gut microbiota—Masters of host development and physiology. Nat. Rev. Microbiol. 2013, 11, 227–238. [Google Scholar] [CrossRef] [Scilit] [PubMed]
- Hooper, L.V.; Littman, D.R.; Macpherson, A.J. Interactions Between the Microbiota and the Immune System. Science 2012, 336, 1268–1273. [Google Scholar] [CrossRef] [Scilit] [PubMed]
- Zhang, Z.; Xu, D.; Wang, L.; Hao, J.; Wang, J.; Zhou, X.; Wang, W.; Qiu, Q.; Huang, X.; Zhou, J.; et al. Convergent Evolution of Rumen Microbiomes in High-Altitude Mammals. Curr. Biol. 2016, 26, 1873–1879. [Google Scholar] [CrossRef] [Scilit] [PubMed]
- Wu, H. Charting The Microbial Frontier: A Comprehensive Guidebook for Advancing Microbiome Research. FEMS Microbiol. Rev. 2025, 49, fuae033. [Google Scholar] [CrossRef] [Scilit] [PubMed]
- Kim, S.; Seo, S.U.; Kweon, M.N. Gut microbiota-derived metabolites tune host homeostasis fate. Semin. Immunopathol. 2024, 46, 2. [Google Scholar] [CrossRef] [Scilit] [PubMed]
- Zhang, M.; Wang, X.; Yao, H.; Shen, Y.; Teng, Y.; Garber, P.A.; Pan, H.; Li, M. Plasticity of the gut microbiome of golden snub-nosed monkeys (Rhinopithecus roxellana) in response to seasonal variation in diet. npj Biofilms Microbiomes 2025, 11, 169. [Google Scholar] [CrossRef] [Scilit] [PubMed]
- Liu, X.; Yu, J.; Huan, Z.; Xu, M.; Song, T.; Yang, R.; Zhu, W.; Jiang, J. Comparing the gut microbiota of Sichuan golden monkeys across multiple captive and wild settings: Roles of anthropogenic activities and host factors. BMC Genom. 2024, 25, 148. [Google Scholar] [CrossRef] [Scilit] [PubMed]
- Lax, S.; Smith, D.P.; Hampton-Marcell, J.; Owens, S.M.; Handley, K.M.; Scott, N.M.; Gibbons, S.M.; Larsen, P.; Shogan, B.D.; Weiss, S.; et al. Longitudinal analysis of microbial interaction between humans and the indoor environment. Science 2014, 345, 1048–1052. [Google Scholar] [CrossRef] [Scilit] [PubMed]
- Tung, J.; Barreiro, L.B.; Burns, M.B.; Grenier, J.C.; Lynch, J.; Grieneisen, L.E.; Altmann, J.; Alberts, S.C.; Blekhman, R.; Archie, E.A. Social networks predict gut microbiome composition in wild baboons. eLife 2015, 4, e05224. [Google Scholar] [CrossRef]
- Moeller, A.H.; Foerster, S.; Wilson, M.L.; Pusey, A.E.; Hahn, B.H.; Ochman, H. Social behavior shapes the chimpanzee pan-microbiome. Sci. Adv. 2016, 2, e1500997. [Google Scholar] [CrossRef] [Scilit] [PubMed]
- Wang, Y.; Yang, X.; Zhang, M.; Pan, H. Comparative Analysis of Gut Microbiota between Wild and Captive Golden Snub-Nosed Monkeys. Animals 2023, 13, 1625. [Google Scholar] [CrossRef] [Scilit] [PubMed]
- Xi, L.; Wen, X.; Jia, T.; Han, J.; Qin, X.; Zhang, Y.; Wang, Z. Comparative study of the gut microbiota in three captive Rhinopithecus species. BMC Genom. 2023, 24, 398. [Google Scholar] [CrossRef] [Scilit] [PubMed]
- Wang, X.; Wang, Z.; Pan, H.; Qi, J.; Li, D.; Zhang, L.; Shen, Y.; Xiang, Z.; Li, M. Captivity Influences the Gut Microbiome of Rhinopithecus roxellana. Front. Microbiol. 2021, 12, 763022. [Google Scholar] [CrossRef] [Scilit] [PubMed]
- Li, Y.; Yan, Y.; Fu, H.; Jin, S.; He, S.; Wang, Z.; Dong, G.; Li, B.; Guo, S. Does diet or macronutrients intake drive the structure and function of gut microbiota? Front. Microbiol. 2023, 14, 1126189. [Google Scholar] [CrossRef] [Scilit] [PubMed]
- Mowat, A.M.; Agace, W.W. Regional specialization within the intestinal immune system. Nat. Rev. Immunol. 2014, 14, 667–685. [Google Scholar] [CrossRef] [Scilit] [PubMed]
- Kim, S.H.; Jang, Y.S. Recent insights into cellular crosstalk in respiratory and gastrointestinal mucosal immune systems. Immune Netw. 2020, 20, e44. [Google Scholar] [CrossRef] [Scilit] [PubMed]
- Huang, Y.J. Nasopharyngeal Microbiota: Gatekeepers or Fortune Tellers of Susceptibility to Respiratory Tract Infections? Am. J. Respir. Crit. Care Med. 2017, 196, 1504–1505. [Google Scholar] [CrossRef] [Scilit] [PubMed]
- Nicholson, J.K.; Holmes, E.; Kinross, J.; Burcelin, R.; Gibson, G.; Jia, W.; Pettersson, S. Host-Gut Microbiota Metabolic Interactions. Science 2012, 336, 1262–1267. [Google Scholar] [CrossRef] [Scilit] [PubMed]
- Chu, H.; Mazmanian, S.K. Innate immune recognition of the microbiota promotes host-microbial symbiosis. Nat. Immunol. 2013, 14, 668–675. [Google Scholar] [CrossRef] [Scilit] [PubMed]
- Belkaid, Y.; Hand, T.W. Role of the microbiota in immunity and inflammation. Cell 2014, 157, 121–141. [Google Scholar] [CrossRef] [Scilit] [PubMed]
- Macpherson, A.J.; McCoy, K.D.; Johansen, F.E.; Brandtzaeg, P. The immune geography of IgA induction and function. Mucosal Immunol. 2008, 1, 11–22. [Google Scholar] [CrossRef] [Scilit] [PubMed]
- Zhang, H.; Wang, Y.; Luo, Z.; Zhang, B.; Lan, X.; Xu, L.; Li, X.; Huang, Z.; Bai, J.; Hu, D. Gut microbiome reveals the trophic variation and significant adaption of three sympatric forest-dwelling ungulates on the eastern Qinghai-Xizang Plateau. BMC Microbiol. 2025, 25, 128. [Google Scholar] [CrossRef] [Scilit] [PubMed]
- Edgar, R.C. UPARSE: Highly accurate OTU sequences from microbial amplicon reads. Nat. Methods 2013, 10, 996–998. [Google Scholar] [CrossRef] [Scilit] [PubMed]
- Bolyen, E.; Rideout, J.R.; Dillon, M.R.; Bokulich, N.A.; Abnet, C.C.; Al-Ghalith, G.A.; Alexander, H.; Alm, E.J.; Arumugam, M.; Asnicar, F. Reproducible, interactive, scalable and extensible microbiome data science using QIIME 2. Nat. Biotechnol. 2019, 37, 852–857. [Google Scholar] [CrossRef] [Scilit] [PubMed]
- Quast, C.; Pruesse, E.; Yilmaz, P.; Gerken, J.; Schweer, T.; Yarza, P.; Peplies, J.; Glöckner, F.O. The SILVA ribosomal RNA gene database project: Improved data processing and web-based tools. Nucleic Acids Res. 2013, 41, D590–D596. [Google Scholar] [CrossRef] [Scilit] [PubMed]
- Segata, N.; Izard, J.; Waldron, L.; Gevers, D.; Miropolsky, L.; Garrett, W.S.; Huttenhower, C. Metagenomic biomarker discovery and explanation. Genome Biol. 2011, 12, R60. [Google Scholar] [CrossRef] [Scilit] [PubMed]
- Huttenhower, C.; Gevers, D.; Knight, R.; Abubucker, S.; Badger, J.H.; Chinwalla, A.T.; Creasy, H.T.; Earl, A.M.; FitzGerald, M.G.; Fulton, R.S.; et al. Structure, function and diversity of the healthy human microbiome. Nature 2012, 486, 207–214. [Google Scholar] [CrossRef] [Scilit] [PubMed]
- Debby, B.; Bart, K.; Susan, H.; John, R.; Reinier, V.; Van Gils, E.; Bruin, J.; Montijn, R.; Bonten, M.; Sanders, E. Variability and diversity of nasopharyngeal microbiota in children: A metagenomic analysis. PLoS ONE 2011, 6, e17035. [Google Scholar] [CrossRef] [Scilit] [PubMed]
- Scott, W.J.; Mackenzie, S.; Mohammad, J.; Robert, F. Evaluation of the nasal microbiota in slaughter-age pigs and the impact on nasal methicillin-resistant Staphylococcus aureus (MRSA) carriage. BMC Vet. Res. 2014, 10, 69. [Google Scholar] [CrossRef] [Scilit] [PubMed]
- Holman, D.B.; McAllister, T.A.; Topp, E.; Wright, A.-D.G.; Alexander, T.W. The nasopharyngeal microbiota of feedlot cattle that develop bovine respiratory disease. Vet. Microbiol. 2015, 180, 90–95. [Google Scholar] [CrossRef] [Scilit] [PubMed]
- Jiang, H.; Yang, L.; Duan, S.; Wu, R.; Li, M.; Liu, B.; Zhu, Y.; Li, J. Analysis of nasopharyngeal microbiota revealing microbial disturbance associated with ovine respiratory complex. Res. Vet. Sci. 2024, 179, 105383. [Google Scholar] [CrossRef] [Scilit] [PubMed]
- Brugger, S.D.; Eslami, S.M.; Pettigrew, M.M.; Escapa, I.F.; Henke, M.T.; Kong, Y.; Lemon, K.P. Dolosigranulum pigrum Cooperation and Competition in Human Nasal Microbiota. mSphere 2020, 5, e00852-20. [Google Scholar] [CrossRef] [Scilit] [PubMed]
- Cisneros, M.; Fuertes, M.B.; Lluansí, A.; Brotons, P.; Henares, D.; Argücello, A.P.; Comino, G.G.; Ciruela, P.; Mira, A.; Muñoz-Almagro, C. Synergistic inhibition of pneumococcal growth by Dolosigranulum pigrum and Corynebacterium pseudodiphtheriticum: Insights into nasopharyngeal microbial interactions. Microbiol. Spectr. 2025, 13, e0013825. [Google Scholar] [CrossRef] [Scilit] [PubMed]
- Li, Y.; Yan, Y.; Wu, H.; Men, Y.; Yang, Y.; Fu, H.; Dunn, D.; Wang, X.; Gao, G.; Zhang, P.; et al. The role of gut microbiota in a generalist, golden snub-nosed monkey, adaptation to geographical diet change. Anim. Microbiome 2024, 6, 63. [Google Scholar] [CrossRef] [Scilit] [PubMed]
- Zautner, A.E. Advances in Campylobacter: Molecular Epidemiology, Virulence Factors, Immune Responses and Drug Resistance. Microorganisms 2023, 12, 28. [Google Scholar] [CrossRef] [Scilit] [PubMed]
- Newell, D.G.; Fearnley, D.J. Sources of Campylobacter colonization in broiler chickens. J. Appl. Microbiol. 2003, 95, 1161–1174. [Google Scholar]
- Kaur, T.; Singh, J.; Huffman, M.A.; Petrzelková, K.J.; Taylor, N.S.; Xu, S.; Dewhirst, F.E.; Paster, B.J.; Debruyne, L.; Vandamme, P.; et al. Campylobacter troglodytis sp. nov., isolated from feces of human-habituated wild chimpanzees (Pan troglodytes schweinfurthii) in Tanzania. Appl. Environ. Microbiol. 2011, 77, 2366–2373. [Google Scholar] [CrossRef] [Scilit] [PubMed]
- Mannion, A.; Shen, Z.; Sheh, A.; Fox, J.G. Draft Genome Sequences of Novel Campylobacter Species Isolated from Nonhuman Primates. Microbiol. Resour. Announc. 2020, 9, e00146-20. [Google Scholar] [CrossRef] [Scilit] [PubMed]
- Costello, E.K.; Lauber, C.L.; Hamady, M.; Fierer, N.; Gordon, J.I.; Knight, R. Bacterial Community Variation in Human Body Habitats Across Space and Time. Science 2009, 326, 1694–1697. [Google Scholar] [CrossRef] [Scilit] [PubMed]
- Su, L.; Guo, J.; Shi, W.; Tong, W.; Li, X.; Yang, B.; Xiang, Z.; Qin, C. Metagenomic analysis reveals the community composition of the microbiome in different segments of the digestive tract in donkeys and cows: Implications for microbiome research. BMC Microbiol. 2024, 24, 530. [Google Scholar] [CrossRef] [Scilit] [PubMed]
- Legrand, T.P.R.A.; Alexandre, P.A.; Wilson, A.; Farr, R.J.; Reverter, A.; Denman, S.E. Genome-centric metagenomics reveals uncharacterised microbiomes in Angus cattle. Sci. Data 2025, 12, 547. [Google Scholar] [CrossRef] [Scilit] [PubMed]
- Fujiogi, M.; Raita, Y.; Pérez-Losada, M.; Freishtat, R.J.; Celedón, J.C.; Mansbach, J.M.; Piedra, P.A.; Zhu, Z.; Camargo, C.A.; Hasegawa, K. Integrated relationship of nasopharyngeal airway host response and microbiome associates with bronchiolitis severity. Nat. Commun. 2022, 13, 4970. [Google Scholar] [CrossRef] [Scilit] [PubMed]
- Choi, B.H.; Hyun, S.; Koo, S.H. The role of BCAA metabolism in metabolic health and disease. Exp. Mol. Med. 2024, 56, 1552–1559. [Google Scholar] [CrossRef] [Scilit] [PubMed]
- Jiang, Q.; Sherlock, D.N.; Guyader, J.; Loor, J.J. Abundance of Amino Acid Transporters and mTOR Pathway Components in the Gastrointestinal Tract of Lactating Holstein Cows. Animals 2023, 13, 1189. [Google Scholar] [CrossRef] [Scilit] [PubMed]
- Xue, C.; Li, G.; Zheng, Q.; Gu, X.; Shi, Q.; Su, Y.; Chu, Q.; Yuan, X.; Bao, Z.; Lu, J.; et al. Tryptophan metabolism in health and disease. Cell Metab. 2023, 35, 1304–1326. [Google Scholar] [CrossRef] [Scilit] [PubMed]
- Ronnett, G.V.; Kleman, A.M.; Kim, E.K.; Landree, L.E.; Tu, Y. Fatty acid metabolism, the central nervous system, and feeding. Obesity 2006, 14, 201S–207S. [Google Scholar] [CrossRef] [Scilit] [PubMed]
- Houten, S.M.; Violante, S.; Ventura, F.V.; Wanders, R.J.A. The Biochemistry and Physiology of Mitochondrial Fatty Acid β-Oxidation and Its Genetic Disorders. Annu. Rev. Physiol. 2016, 78, 23–44. [Google Scholar] [CrossRef] [Scilit] [PubMed]
- Shen, W.; de Boer, J.F.; Kuipers, F.; Fu, J. New insights in amino sugar metabolism by the gut microbiome. Gut Microbes 2025, 17, 2510462. [Google Scholar] [CrossRef] [Scilit] [PubMed]
- Hackstein, J.H.; Van Alen, T.A.; Op Den Camp, H.; Smits, A.; Mariman, E. Intestinal methanogenesis in primates--a genetic and evolutionary approach. Dtsch. Tierarztl. Wochenschr. 1995, 102, 152–154. [Google Scholar] [PubMed]
- Smith, N.W.; Shorten, P.R.; Altermann, E.H.; Roy, N.C.; McNabb, W.C. Hydrogen cross-feeders of the human gastrointestinal tract. Gut Microbes 2019, 10, 270–288. [Google Scholar] [CrossRef] [Scilit] [PubMed]
- Hu, D.; Zhang, T.; He, S.; Pu, T.; Yin, Y.; Hu, Y. Mining metagenomic data to gain a new insight into the gut microbial biosynthetic potential in placental mammals. Microbiol. Spectr. 2024, 12, e00864-24. [Google Scholar] [CrossRef] [Scilit] [PubMed]
- Adolf, L.A.; Heilbronner, S. Nutritional Interactions between Bacterial Species Colonising the Human Nasal Cavity: Current Knowledge and Future Prospects. Metabolites 2022, 12, 489. [Google Scholar] [CrossRef] [Scilit] [PubMed]
- Neill, R.D.; Clarke, B.T. The metabolic, microbial and immunological demands of pneumococcal colonisation. PLoS Pathog. 2025, 21, e1013675. [Google Scholar] [CrossRef] [Scilit] [PubMed]
- Cantarel, B.L.; Lombard, V.; Henrissat, B. Complex carbohydrate utilization by the healthy human microbiome. PLoS ONE 2012, 7, e28742. [Google Scholar] [CrossRef] [Scilit] [PubMed]
- Urban, M.; Cuzick, A.; Seager, J.; Nonavinakere, N.; Sahoo, J.; Sahu, P.; Iyer, V.L.; Khamari, L.; Carbajo Martinez, M.; Hammond-Kosack, K.E. PHI-base-the multi-species pathogen–host interaction database in 2025. Nucleic Acids Res. 2025, 53, D826–D838. [Google Scholar] [CrossRef] [Scilit] [PubMed]
- Drigot, Z.G.; Clark, S.E. Insights into the role of the respiratory tract microbiome in defense against bacterial pneumonia. Curr. Opin. Microbiol. 2024, 77, 102428. [Google Scholar] [CrossRef] [Scilit] [PubMed]
- Gloor, G.B.; Macklaim, J.M.; Pawlowsky-Glahn, V.; Egozcue, J.J. Microbiome Datasets Are Compositional: And This Is Not Optional. Front. Microbiol. 2017, 8, 2224. [Google Scholar] [CrossRef] [Scilit] [PubMed]
- Friedman, J.; Alm, E.J. Inferring correlation networks from genomic survey data. PLoS Comput. Biol. 2012, 8, e1002687. [Google Scholar] [CrossRef] [Scilit] [PubMed]
- Kudo, H.; Cheng, K.J.; Costerton, J.W. Interactions between Treponema bryantii and cellulolytic bacteria in the in vitro degradation of straw cellulose. Can. J. Microbiol. 1987, 33, 244–248. [Google Scholar] [CrossRef] [Scilit] [PubMed]
- Wu, Y.H.; Yao, Y.F.; Dong, M.M.; Xia, T.R.; Li, D.Y.; Xie, M.; Xu, H.L. Characterisation of the gut microbial community of rhesus macaques in high-altitude environments. BMC Microbiol. 2020, 20, 68. [Google Scholar] [CrossRef] [Scilit] [PubMed]
- Campbell, T.P.; Sun, X.Q.; Patel, V.H.; Sanz, C.; Morgan, D.; Dantas, G. The microbiome and resistome of chimpanzees, gorillas, and humans across host lifestyle and geography. ISME J. 2020, 14, 1584–1599. [Google Scholar] [CrossRef] [Scilit] [PubMed]
- Obregon-Tito, A.J.; Tito, R.Y.; Metcalf, J.; Sankaranarayanan, K.; Clemente, J.C.; Ursell, L.K.; Lewis, C.M. Subsistence strategies in traditional societies distinguish gut microbiomes. Nat. Commun. 2015, 6, 6505. [Google Scholar] [CrossRef] [Scilit] [PubMed]
- Rampelli, S.; Gallois, S.; D’Amico, F.; Turroni, S.; Fabbrini, M.; Scicchitano, D.; Candela, M.; Henry, A.G. The gut microbiome of Baka forager-horticulturalists from Cameroon is optimized for wild plant foods. iScience 2024, 27, 109211. [Google Scholar] [CrossRef] [Scilit] [PubMed]
- Alao, J.O.; Bamigboye, F.O. Nasal-gut microbiome axis in health and disease. Med. Microecol. 2025, 26, 100153. [Google Scholar] [CrossRef] [Scilit]
- Reyman, M.; Clerc, M.; van Houten, M.A.; Arp, K.; Chu, M.L.J.N.; Hasrat, R.; Sanders, E.A.M.; Bogaert, D. Microbial community networks across body sites are associated with susceptibility to respiratory infections in infants. Commun. Biol. 2021, 4, 1233. [Google Scholar] [CrossRef] [Scilit] [PubMed]
- Ravcheev, D.A.; Thiele, I. Comparative Genomic Analysis of the Human Gut Microbiome Reveals a Broad Distribution of Metabolic Pathways for the Degradation of Host-Synthetized Mucin Glycans and Utilization of Mucin-Derived Monosaccharides. Front. Genet. 2017, 8, 111. [Google Scholar] [CrossRef] [Scilit] [PubMed]
- Dubois, A.; Fiala, N.; Weichbrod, R.H.; Ward, G.S.; Nix, M.; Mehlman, P.T.; Taub, D.M.; I Perez-Perez, G.; Blaser, M.J. Seroepizootiology of Helicobacter pylori gastric infection in nonhuman primates housed in social environments. J. Clin. Microbiol. 1995, 33, 1492–1495. [Google Scholar] [CrossRef] [Scilit] [PubMed]
- Knittler, M.R.; Sachse, K. Chlamydia psittaci: Update on an underestimated zoonotic agent. Pathog. Dis. 2015, 73, 1–15. [Google Scholar] [CrossRef] [Scilit] [PubMed]
- Doi, S.Q.; Kimbason, T.; Reindel, J.; Dubois, A. Molecular characterization of Helicobacter pylori strains isolated from cynomolgus monkeys (M. fascicularis). Vet. Microbiol. 2005, 108, 133–139. [Google Scholar] [CrossRef] [Scilit] [PubMed]
- Flahou, B.; Modrý, D.; Pomajbíková, K.; Petrželková, K.J.; Smet, A.; Ducatelle, R.; Pasmans, F.; Sá, R.; Todd, A.; Hashimoto, C.; et al. Diversity of zoonotic enterohepatic Helicobacter species and detection of a putative novel gastric Helicobacter species in wild and wild-born captive chimpanzees and western lowland gorillas. Vet. Microbiol. 2014, 174, 186–194. [Google Scholar] [CrossRef] [Scilit] [PubMed]
- Kabeya, H.; Sato, S.; Maruyama, S. Prevalence and characterization of Chlamydia DNA in zoo animals in Japan. Microbiol. Immunol. 2015, 59, 507–515. [Google Scholar] [CrossRef] [Scilit] [PubMed]
- Caspe, S.G.; Hill, H. Chlamydiosis in Animals. Animals 2024, 14, 3130. [Google Scholar] [CrossRef] [Scilit] [PubMed]
- Zang, X.; Pascoe, B.; Mourkas, E.; Kong, K.; Jiao, X.; Sheppard, S.K.; Huang, J. Evidence of potential Campylobacter jejuni zooanthroponosis in captive macaque populations. Microb. Genom. 2023, 9, 001121. [Google Scholar] [CrossRef] [Scilit] [PubMed]
- Koga, T.; Aoki, W.; Mizuno, T.; Wakazono, K.; Ohno, J.; Nakai, T.; Nomiya, T.; Fujii, M.; Fusegawa, K.; Kinoshita, K.; et al. Antimicrobial resistance in Campylobacter coli and Campylobacter jejuni in cynomolgus monkeys (Macaca fascicularis) and eradication regimens. J. Microbiol. Immunol. Infect. 2017, 50, 75–82. [Google Scholar] [CrossRef] [Scilit] [PubMed]
- Devaux, C.A.; Mediannikov, O.; Medkour, H.; Raoult, D. Infectious Disease Risk Across the Growing Human-Non Human Primate Interface: A Review of the Evidence. Front. Public Health 2019, 7, 305. [Google Scholar] [CrossRef] [Scilit] [PubMed]
- Davoust, B.; Levasseur, A.; Mediannikov, O. Studies of nonhuman primates: Key sources of data on zoonoses and microbiota. New Microbes New Infect. 2018, 26, S104–S108. [Google Scholar] [CrossRef] [Scilit] [PubMed]
- Liu, P.; Wang, D.; Zhang, F.; Wang, T.; Han, J.; Zou, Q. Seasonal Metagenomic Survey of Pathogenic Microorganisms in Non-Human Primates in Mayanghe National Nature Reserve, China. Pathogens 2025, 14, 1237. [Google Scholar] [CrossRef] [Scilit] [PubMed]
- Franzosa, E.A.; Morgan, X.C.; Segata, N.; Waldron, L.; Reyes, J.; Earl, A.M.; Giannoukos, G.; Boylan, M.R.; Ciulla, D.; Gevers, D.; et al. Relating the metatranscriptome and metagenome of the human gut. Proc. Natl. Acad. Sci. USA 2014, 111, E2329–E2338. [Google Scholar] [CrossRef] [Scilit] [PubMed]
- Zierer, J.; Jackson, M.A.; Kastenmüller, G.; Mangino, M.; Long, T.; Telenti, A.; Mohney, R.P.; Small, K.S.; Bell, J.T.; Steves, C.J.; et al. The fecal metabolome as a functional readout of the gut microbiome. Nat. Genet. 2018, 50, 790–795. [Google Scholar] [CrossRef] [Scilit] [PubMed]
- Aguiar-Pulido, V.; Huang, W.; Suarez-Ulloa, V.; Cickovski, T.; Mathee, K.; Narasimhan, G. Metagenomics, Metatranscriptomics, and Metabolomics Approaches for Microbiome Analysis. Evol. Bioinform. 2016, 12, 5–16. [Google Scholar] [CrossRef] [Scilit] [PubMed]
Disclaimer/Publisher’s Note: The statements, opinions and data contained in all publications are solely those of the individual author(s) and contributor(s) and not of MDPI and/or the editor(s). MDPI and/or the editor(s) disclaim responsibility for any injury to people or property resulting from any ideas, methods, instructions or products referred to in the content. |
© 2026 by the authors. Licensee MDPI, Basel, Switzerland. This article is an open access article distributed under the terms and conditions of the Creative Commons Attribution (CC BY) license.