


Abstract
Externally bonded carbon fiber-reinforced polymer (CFRP) systems are used to improve the flexural performance of reinforced concrete members. However, premature debonding, particularly intermediate crack-induced (IC) debonding, limits CFRP utilization and may lead to sudden failure. This study experimentally and numerically investigates the effectiveness of CFRP patch anchors with different anchorage configurations in improving the flexural behavior and failure mode of CFRP-strengthened reinforced concrete slabs. Nine reinforced concrete slabs were tested under four-point bending, including one reference slab, two slabs strengthened with longitudinal CFRP strips without anchorage, and six slabs strengthened with CFRP strips and transverse patch anchors. The experimental results showed that CFRP increased the ultimate load by about 30–61% compared with the reference slab. The unanchored specimens failed mainly by IC debonding. In contrast, the patch-anchored specimens showed better strain distribution, delayed debonding, and a shift toward CFRP rupture. The numerical results showed good agreement with the experimental results, with ultimate-load prediction errors below 7%. Changing the patch area did not significantly increase the ultimate load, with about 0.8% difference between the mean capacities of the anchored groups, while end anchors alone were insufficient to prevent debonding. CFRP patch anchors effectively delayed premature debonding and improved CFRP utilization.
1. Introduction
The continued widespread use of reinforced concrete (RC) structures is attributed to the availability of effective solutions for addressing structural deficiencies, including strengthening and rehabilitation [1,2]. Previous studies have recommended innovative techniques for concrete strengthening over traditional methods, with increasing interest focused on carbon fiber-reinforced polymer (CFRP) composites [3,4]. Externally bonded CFRP has become an important strengthening technique due to its superior material properties, such as exceptionally high tensile strength, excellent corrosion and moisture resistance, low density, and ease of on-site application [2,4]. Recent research has demonstrated the effectiveness of CFRP composites in enhancing the flexural response of concrete elements [2,5] and steel members [6,7]. However, effective utilization of the mechanical properties of CFRP depends heavily on the bond integrity among the concrete substrate, adhesive resin, and carbon fibers. Externally bonded CFRP systems frequently suffer from premature debonding, which limits fiber tensile strength utilization and may lead to premature brittle failure [4,8,9,10]. Intermediate crack-induced (IC) debonding represents one of the most critical failure modes, typically initiating near flexural cracks and propagating along the concrete–CFRP interface [5,9,11,12]. Design guidelines such as ACI 440.2R-17 provide design recommendations to mitigate premature debonding by treating CFRP debonding as a critical failure mode. However, these recommendations rely on conservatively reducing the allowable effective design strain of the fibers rather than establishing a unified design procedure for bonded patch-anchor systems [2]. The updated ACI PRC-440.2-23 introduced anchorage provisions for FRP spike anchors used with shear U-wraps; nevertheless, bonded patch anchors for flexurally strengthened concrete slabs remain outside its specific design provisions [13]. Consequently, current engineering practice continues to rely on experimental investigations and analytical studies to develop reliable anchorage details for this application [14,15,16]. Most previous research has focused on strengthening RC beams, while studies addressing strengthened slabs and floor systems remain relatively limited, particularly regarding CFRP systems with supplementary anchorage [9,17,18]. This limitation is important because slabs exhibit two-dimensional flexural behavior and multiaxial stress fields that differ from the predominantly one-dimensional response of narrow beams. Moreover, slabs lack the vertical web surfaces commonly used for installing conventional FRP U-wraps. Although some studies have investigated CFRP-strengthened slabs with various anchorage methods, a clear and unified design framework remains lacking [12,17,18]. Thus, the core research problem stems from the premature debonding inherent to externally bonded CFRP systems—particularly IC debonding—compounded by the scarcity of slab-specific investigations and the absence of standardized design equations for patch anchors [9,12,17]. Recent experimental studies indicate that anchorage systems significantly improve strengthening efficiency by increasing load-carrying capacity, enhancing deformation capacity and ductility, and enabling higher CFRP strain utilization [19,20,21]. Anchorage systems fall into two primary categories. Traditional steel anchors are generally undesirable due to corrosion susceptibility, localized stress concentrations, and the need for drilling through the CFRP and concrete, which may also risk damaging the internal reinforcement and weakening the structural section. In contrast, FRP anchorage systems, particularly those made of carbon FRP, offer material compatibility with the strengthening system, corrosion resistance, and improved stress redistribution over larger bonded areas without creating critical stress concentrations [9,22]. Various CFRP anchorage configurations have been developed to delay or prevent premature debonding, including U-wrap anchors, warp-and-woof strap (WWS) anchors, FRP spike anchors, stitch anchors, π-anchors, C-anchors, near-surface mounted (NSM) anchors, and hybrid systems [9,10,14,19,20,21,22,23,24,25,26]. These systems can enhance stress transfer, increase ultimate load capacity, improve ductility, delay debonding, and potentially shift the failure mode from premature debonding to fiber rupture or concrete crushing [19,20,21,24]. However, many of these methods involve relatively complex installation procedures—such as drilling, grooving, or embedding anchor tails—which may complicate practical field implementation [14,22,27]. Externally bonded patch anchors represent a practical anchorage solution for CFRP systems because they can enhance load transfer, increase the effective bonded area resisting debonding, and delay IC debonding without requiring drilling into the concrete or perforating the primary longitudinal CFRP strips [12,15,16,25,28]. Experimental findings have demonstrated that unidirectional and bidirectional patch anchors can enhance ultimate load capacity and CFRP strain utilization, with anchorage efficiency influenced by parameters such as concrete strength, anchor spacing, fiber width, and anchor length [15,16,25,28]. Nevertheless, the stress-transfer mechanisms, effective geometric parameters, and influence of patch-anchor arrangement on failure-mode transition in concrete slabs remain insufficiently understood. In particular, a knowledge gap remains regarding how patch-anchor dimensions and spatial arrangements affect stress redistribution and delay debonding in slab configurations, for which flexural applications still require further investigation and design development [12,17,18]. The significance of the present study lies in evaluating longitudinal CFRP strips anchored using surface-bonded patch anchors as a practical and relatively simple solution for mitigating premature debonding—specifically IC debonding—in externally strengthened RC slabs [12,15,16]. This research focuses on the role of patch anchors in enhancing interfacial stress transfer, reducing stress concentrations, increasing CFRP utilization, and shifting the governing failure mode from premature debonding toward CFRP rupture [12,15,16,25]. Unlike previous investigations that have predominantly focused on RC beams or conventional anchorage systems, the novelty of the present study lies in experimentally and numerically evaluating surface-bonded CFRP patch anchors with different anchorage dimensions and arrangements in RC slabs, while considering the slab-specific two-dimensional stress field and its influence on debonding, CFRP strain utilization, and failure-mode transition. Accordingly, this study evaluates the flexural behavior of RC slabs externally strengthened with CFRP laminates with and without patch anchors. It specifically investigates the effects of patch anchor dimensions and arrangement on load capacity, deflection behavior, crack development, CFRP strain distribution, and final failure modes. This work bridges a key research gap concerning patch-anchor applications in concrete slabs, establishes a design-oriented understanding of the transition from interfacial debonding to fiber rupture, and provides a scientific foundation for adopting patch anchors as an efficient alternative to conventional anchorage systems [12,17,18].
2. Experimental Program
2.1. Specimen Design and Preparation
The design is based on the studies of Smith et al. [17] and Al-Atta et al. [12], which investigated the use of spike anchors and patch anchors in reinforced concrete slabs strengthened with CFRP and confirmed the effectiveness of anchorage systems in improving debonding resistance and increasing load capacity. This study investigates reinforced concrete slabs strengthened with CFRP laminates with and without anchorage through an experimental approach. The specimens were designed with dimensions of 2700 mm in length, 400 mm in width, and 150 mm in depth, with an effective depth of 120 mm. All slabs were reinforced with two 10 mm diameter longitudinal bars in the tension zone and 10 mm diameter stirrups spaced at 150 mm to prevent shear failure and allow the debonding behavior to be effectively investigated. The strengthening system consisted of unidirectional CFRP strips with a length of 2200 mm, a width of 100 mm, and a thickness of 0.167 mm. For the anchored specimens, patch anchors were arranged at the strip ends and near the maximum moment region to limit both plate-end debonding and IC debonding. The strengthened slabs were divided into three groups according to the presence of anchorage, patch dimensions, and the configuration of the anchorage system, and this classification was adopted to evaluate the effect of patch length and anchorage arrangement on debonding behavior in CFRP-strengthened slabs. All concrete slab specimens were cast at the same time using one concrete mix and a thick wooden formwork to achieve dimensional accuracy. During casting, the ambient laboratory temperature was approximately 32 °C, with a relative humidity of approximately 70%. The concrete was compacted using a mechanical vibrator and water-cured for more than 7 days, then left for 28 days before surface preparation. After demolding, the concrete surface was mechanically ground, and then the concrete surface was mechanically roughened using a steel comb to enhance the bond with the epoxy adhesive. The roughened surface was then carefully cleaned using compressed air and a vacuum cleaner to ensure that it was free of dust and debris. The CFRP fabrics were cut to the required dimensions, and the epoxy adhesive was prepared and applied to both the concrete surface and the fibers before placing the fibers and pressing them to ensure proper bonding and remove air. The ambient temperature during the application of the Sikadur®-330 epoxy adhesive was approximately 34 °C. The longitudinal fibers were oriented parallel to the slab axis to resist the maximum tensile stresses induced by flexure. For the anchored specimens, CFRP patch anchors made from the same fabric were applied perpendicular to the longitudinal fibers following the same bonding procedure. Finally, all specimens were left under natural ambient conditions for a period of not less than seven days to allow the epoxy to dry and harden properly before testing. The reinforcement details are shown in Figure 1, while the CFRP strengthening and strain-gauge configurations are shown in Figure 2, Figure 3 and Figure 4. The patch anchorage installation process is shown in Figure 5.
Figure 1.
Reinforcement plan.
Figure 2.
Distribution of strain gauges and bottom view of strengthened unanchored in specimen B.
Figure 3.
Distribution of strain gauges and bottom view of strengthened and anchored specimen C (patch length 380 mm).
Figure 4.
Distribution of strain gauges and bottom view of strengthened and anchored specimen D (patch length 400 mm).
Figure 5.
The patch anchorage installation process.
2.2. Test Setup and Loading Procedure
All tests were conducted in the Structural Laboratory for Postgraduate Studies at the College of Engineering/University of Kufa. A four-point bending testing system was used to generate a constant-moment region at mid-span and investigate the flexural behavior of the slabs while minimizing the influence of shear within this region. The testing machine consisted of a steel frame designed to carry the applied loads without significant deformation and a displacement-controlled hydraulic jack connected to the control unit, with the possibility of manual operation. A load cell was installed at the top of the machine to continuously measure the applied load. A distribution beam was used to transfer the load to two loading points on the slab surface. Supports were provided at both ends of the slab to represent a simply supported condition and allow rotational movement without additional restraint. The clear span between the supports was 2400 mm, and the load was applied at two symmetric points about mid-span, forming an 800 mm constant maximum-moment region. This loading arrangement minimized the influence of shear within the constant-moment region and allowed the flexural and debonding behavior of the strengthened slabs to be investigated. A displacement-controlled loading system was adopted to allow continuous monitoring of the cracking and post-peak behavior. The displacement rate was maintained at 1 mm/min for all specimens from the start of loading until failure. The test was terminated when rupture occurred or when a sudden drop in the recorded load indicated failure. Deflection was measured using linear variable displacement transducers (LVDTs) placed at mid-span and at specified locations along the slab. The applied load was recorded using the load cell connected to the control system. Crack development was visually monitored throughout the different loading stages, and the final failure mode of each specimen was recorded. The experimental test setup and specimen placement are shown in Figure 6.
Figure 6.
Preparation of the testing machine and placement of the specimens in the machine.
2.3. Materials
2.3.1. Epoxy Material
An epoxy adhesive material from Sika, Sikadur®-330 (Zürich, Switzerland), was used to ensure an effective bond between the CFRP fibers and the concrete surface during the strengthening process. No independent adhesive-strength or pull-off tests were performed in the present study; therefore, the mechanical properties of Sikadur®-330 were adopted from the manufacturer’s technical datasheet [29]. The properties of the Sikadur®-330 epoxy adhesive are summarized in Table 1.
Table 1.
Properties of Sikadur®-330 epoxy adhesive.
2.3.2. Concrete
All specimens were cast from a single concrete batch with a total volume of approximately 2 m3. The batch was sufficient to cast nine reinforced concrete slabs with dimensions of 2700 × 400 × 150 mm, in addition to standard concrete cubes measuring 150 × 150 × 150 mm. Sulfate-resisting Portland cement was used together with washed fine aggregate free from salts, coarse aggregate, and an appropriate water content to achieve the required workability and strength. The concrete compressive strength was approximately 29 MPa at an age of 10 days. Additional compressive-strength tests were conducted at the same age as the structural testing of the slabs, approximately 196 days after casting, and a compressive strength of 36 MPa was obtained. The 196-day strength was adopted because it more accurately represents the actual concrete properties at the time of slab testing. This value was therefore used in the interpretation of the experimental results and in defining the concrete material properties in the numerical models.
2.3.3. CFRP
Unidirectional carbon fiber fabric (UD-CFRP), SikaWrap®-300 C supplied by Sika, was used as the strengthening material. The longitudinal CFRP strips were bonded along the slab axis to resist the tensile stresses induced by flexure. The same CFRP material was also used to fabricate the patch anchors for the anchored specimens. For the longitudinal strengthening strips, the primary fiber direction was aligned with the longitudinal axis of the slab, while the patch-anchor fibers were arranged according to the adopted anchorage configuration to improve stress transfer and reduce the tendency for premature debonding. The mechanical properties of the CFRP, including tensile strength, elastic modulus, ultimate tensile strain, and nominal fiber thickness, were adopted from the manufacturer’s technical data sheet [30] because no separate tensile coupon tests were conducted as part of the present experimental program. These properties are summarized in Table 2.
Table 2.
Mechanical properties of SikaWrap®-300 C CFRP.
2.3.4. Steel Reinforcement
Local reinforcing steel from the Iraqi FF company with a diameter of 10 mm was used. Representative steel bars were subjected to a tensile test using a universal testing machine to determine their mechanical properties. The yield strength fy was 464 MPa, while the ultimate tensile strength fu was 581 MPa according to the tensile test results. The same reinforcing steel was used in all specimens to ensure consistent reinforcement properties and to reduce the effect of material variability on the results.
2.4. Measuring Devices and Instrumentation
A set of high-precision devices was used to monitor the structural response of the strengthened and unstrengthened slabs throughout all loading stages, and to follow the development of stresses, strains, cracking, and deflection up to the final failure. These devices were distributed in a carefully planned manner to ensure measuring the governing variables of slab behavior in the maximum moment region, where debonding occurs. A set of strain gauges was used, totaling 80 gauges on eight specimens. For specimens B1 and B2, seven gauges were used for each specimen, and they were concentrated in the maximum moment region where three gauges were installed, while the remaining gauges were distributed toward the ends and the regions close to the strengthening ends/plate end, as shown in Figure 2. As for the remaining six specimens, 11 gauges were used for each specimen; these gauges were installed under the patches, between the patches, and above the end patches, according to Figure 3 and Figure 4. This distribution helped in tracking stress transfer along the CFRP fibers, identifying strain concentration regions, and evaluating the effectiveness of patch anchors in delaying debonding. Strain gauges from Zemic (BE350-6AA-P300) were used, and these gauges are considered among the most accurate means for measuring small deformations in structural materials, as they were bonded directly to the surfaces to be measured, and the change in their electrical resistance is directly proportional to the strain value. Three LVDTs were also used to measure the vertical displacement—one at the slab mid-span, and two near the support regions—in order to correct the total deflection readings and to verify that no slip or local settlement occurred at the supports that could affect the measurement accuracy.
3. Numerical Analysis
Finite element analysis was used to represent the flexural behavior of reinforced concrete slabs strengthened with externally bonded CFRP, with and without patch anchors, and with anchors of different areas and distributions. Numerical analysis is considered an important tool for understanding the slab response under loading, because it can represent the nonlinear behavior of concrete, including cracking, crushing, yielding of steel reinforcement, and the response up to failure. The numerical model was developed to support the experimental observations and to adequately understand how loads are transferred, identify stress concentration regions, determine the distribution of CFRP strains, and define the failure mode. The numerical results were also compared with the experimental results through the load–deflection curves, strain response, ultimate load, and the observed failure behavior. In general, the finite element model is considered a useful tool for evaluating the behavior of CFRP-strengthened slabs within a scientific framework, but under conditions including its verification by comparison with the experimental results.
3.1. Geometric Model
The ABAQUS software was used to simulate the experimental specimens and study the behavior of reinforced concrete slabs strengthened with carbon fiber-reinforced polymer (CFRP) or unstrengthened, in order to identify the effect of strengthening and compare it with the experimental results, since this software is considered a general simulation tool and its analysis provides solutions for a wide range of engineering problems, including structural analysis problems. It also contains extensive libraries of elements and materials, and it is capable of modeling different geometric shapes of structural members and defining constitutive behavior laws for materials, in addition to its ability to assemble different parts and build a complex structural member composed of multiple materials. Accordingly, our analytical program consists of four models for the purpose of direct comparison with the test curves and determining the effect of longitudinal fiber strengthening on the ultimate capacity and overall behavior, namely: an unstrengthened reference model, a strengthened model similar to the specimens of Group (B) (longitudinal strengthening only), and two models provided with patches as in specimens (C) and (D). The same geometric dimensions of the numerical slabs used in the experimental program were adopted. The slab dimensions were length 2700 mm, width 400 mm, and depth 150 mm, respectively. The clear span between the supports was 2400 mm, and the distance between the two loading points was 800 mm, which results in a constant maximum moment region at the mid-span of the slab. The longitudinal CFRP strip and the patch anchors were also modeled according to the actual strengthening configurations used in the experimental specimens.
3.2. Concrete Modeling
The reinforced concrete slab was modeled using 8-node reduced-integration solid elements (C3D8R). The Concrete Damaged Plasticity (CDP) model available in ABAQUS was adopted to represent the nonlinear behavior of concrete under loading, including tensile cracking and compressive crushing. The elastic properties of concrete were defined using the modulus of elasticity and Poisson’s ratio ν, while the nonlinear response was introduced through the compressive hardening and tensile softening curves. The CDP parameters, including the dilation angle ψ, the biaxial-to-uniaxial compressive strength ratio /, the eccentricity (e), the yield-surface parameter , and the viscosity parameter, were defined to control the plastic flow and yield behavior of concrete. The adopted CDP parameters are summarized in Table 3 and were selected based on values reported in previous numerical studies [31]. The tensile and compressive damage variables and were also used to simulate stiffness degradation due to tensile cracking and compressive crushing, respectively. The measured concrete compressive strength of 36 MPa at the age of structural testing was adopted, and the CEB–FIP Model Code 1990 [32] relationships were used to estimate the required concrete material properties. Shrinkage was not considered because no shrinkage cracks were observed during testing.
Table 3.
Values of plastic damage parameters used for concrete model.
3.3. Steel Reinforcement Modeling
The steel reinforcement was modeled using T3D2 wire elements with a diameter of 10 mm. The steel reinforcement was modeled using an elastic–plastic stress–strain relationship based on the experimentally measured tensile properties. The elastic part was represented by a linear relationship with a modulus of elasticity of 200 GPa and a Poisson’s ratio of 0.3. After yielding, the post-yield stage was represented using a bilinear curve (Bilinear). The steel properties were defined in the program through the plasticity behavior, and the true plastic strain was used instead of the total strain. The reinforcement bars were embedded inside the concrete elements to ensure strain compatibility and force transfer between the steel reinforcement and the surrounding concrete.
3.4. Modeling of Carbon Fibers (CFRP)
The carbon fiber fabrics of type SikaWrap®-300 C were modeled in Abaqus as a shell layer since they are very thin and do not require a volumetric representation. A four-node shell element suitable for thin plates such as S4R was used, with the assumption of linear elastic behavior of the fibers within the loading range. The material properties were defined using the Engineering Constants formulation, where E1 represents the modulus of elasticity in the fiber direction (the principal direction), with the remaining required elastic constants and Poisson’s ratio (and the remaining shear constants/orthotropic parameters) being introduced. The fiber orientation within the model was defined at an angle of 0° so that it is parallel to the strengthening axis/longitudinal strengthening direction. Based on the manufacturer’s data, the same thickness and the same material properties were used for the patch anchors, while the fiber orientation was assigned according to what was applied in the experimental specimens. The engineering constants used for the CFRP material in the numerical model are summarized in Table 4. No explicit CFRP material failure criterion was defined in the numerical models. Therefore, the numerical results were used to evaluate CFRP stress and strain utilization, but fiber rupture was not explicitly simulated.
Table 4.
Engineering constants of SikaWrap®-300 C CFRP used in the numerical model.
3.5. Bond Interface Between CFRP Fibers and Concrete Surface
Based on the experimental results, it was observed that the governing failure mode in the Group B specimens was CFRP debonding without any clear fiber rupture. This indicates that the bond between the fibers and the concrete surface remained effective up to advanced loading levels but ultimately governed the failure through premature IC debonding, as it contributed to an increase in load of approximately 30%. Accordingly, the bond interface between CFRP and concrete was modeled in the numerical program as a cohesive bond to ensure compatibility in the transfer of stresses and displacements between the two surfaces and to allow simulation of debonding behavior. The cohesive bond properties were defined using a traction–separation relationship, where the initial stiffness parameters in the normal direction and the two shear directions, namely Kn, Ks, and Kt, were introduced to represent the interface resistance prior to damage initiation. The initial values of the cohesive interface parameters were adopted from the numerical study of Al-Atta et al. [33], which investigated FRP-strengthened RC slabs using anchorage systems, and were subsequently refined through an iterative calibration procedure based on the experimental results of the present study. The calibration was performed by comparing the numerical and experimental load–deflection responses, ultimate loads, and observed IC debonding failure mode, with the parameters progressively adjusted to minimize the difference between the numerical predictions and the experimental behavior. The damage initiation criterion of the Max nominal stress type was adopted by specifying the interface strengths Tn0, Ts0, and Tt0. After damage initiation, damage evolution was defined based on the fracture energy Gc, allowing gradual degradation of the interface stiffness and simulation of the propagation of debonding between the CFRP and concrete surface. The values used for the cohesive bond properties are presented in Table 5. It was also observed that fiber rupture in Groups C and D was the governing mode after anchorage using patches; therefore, two types of surface modeling were adopted, namely cohesive bonding and perfect bonding for the contacting surfaces, and the curves were compared, since the CFRP response was governed by the tensile capacity of the fibers rather than by weak bonding between the concrete and the fibers. These two approaches were considered in separate numerical model variants to evaluate the influence of the interface representation. In addition, modeling the interface using a cohesive approach can capture bond failure and debonding behavior, but it cannot by itself represent fiber rupture unless a CFRP material failure criterion is also defined. Therefore, the cohesive model was used to represent debonding behavior, whereas the perfect-bonding model was used to evaluate cases in which anchorage delays debonding and allows higher utilization of the tensile capacity of CFRP.
Table 5.
Cohesive interface properties between CFRP and concrete.
3.6. Boundary Conditions and Loading
The numerical model was supported in a manner consistent with the experimental program. Rigid bodies of type R3D4 were created at the support locations, with a reference point assigned at the center of each rigid body to control its motion. A clear span of 2400 mm was provided between the supports. The vertical displacement was restrained at both supports, while horizontal movement was allowed at one support to represent the roller condition and restrained at the opposite support to represent the pin support and prevent rigid-body motion. The applied loads were also represented using rigid bodies of type R3D4 to distribute the load over a contact area and avoid stress concentration at a single node. A reference point was assigned at the center of each loading rigid body, and a vertical displacement was applied in the negative direction at the two loading reference points to simulate the experimental four-point bending setup. The contact surfaces between the rigid bodies and the concrete slab were defined, and friction was neglected to allow realistic movement at the support and loading regions. A smooth loading amplitude was used so that the displacement increased gradually from zero to the final value, which helped improve numerical convergence and reduce sudden changes at the contact surfaces.
3.7. Solution Strategies
In this part, the stability of the nonlinear analysis is ensured after modelling in the numerical analysis program for reinforced concrete with carbon fiber fabrics. Since this model combines the nonlinearity of concrete and the nonlinearity of steel reinforcement in addition to the contact regions of supports and the loading regions, the success of the analysis depends largely on selecting the appropriate loading method and adjusting the time settings and calibrating the Newton–Raphson convergence in order to obtain stable load–deflection curves that are convergent with the experimental results and to enable the analysis to reach an advanced stage of loading, especially near the ultimate-load stage, where strong material and contact nonlinearities develop. A quasi-static analysis was adopted, and NLGEOM was activated to capture the geometric nonlinear effects when the deflection becomes noticeable or when there is a change in stiffness with the increase in cracking, and nevertheless, displacement control was the appropriate loading to prevent sudden collapse or sudden transition in stiffness, which means numerical instability of the model, as the gradual displacement at the loading points provides the more stable solution, and also prevents jumps over the nonlinear regions, and allows tracking the response when approaching the ultimate load and failure stage.
3.8. Mesh
Different mesh sizes were used in the numerical model. A coarse mesh with a small number of nodes provides a shorter analysis time; however, it may result in less smooth outcomes, a coarse stress distribution, and sharp edges in stress-concentration regions. When a finer mesh with a larger number of nodes is used, the analysis time becomes longer, but it provides better smoothness and higher accuracy in representing the numerical response. A mesh sensitivity analysis was performed using three different mesh sizes. The coarse mesh consisted of 30 mm concrete elements and 20 mm CFRP elements, while the adopted mesh consisted of 25 mm concrete elements and 12.5 mm CFRP elements. A finer mesh consisting of 20 mm concrete elements and 10 mm CFRP elements was also investigated. The ultimate loads obtained from the coarse, adopted, and fine meshes were 34.68, 35.50, and 34.50 kN, respectively, while the corresponding deflections were 27.4, 32.56, and 27.0 mm. The difference in ultimate load between the coarse and adopted meshes was approximately 2.31%, while the difference between the fine and adopted meshes was approximately 2.82%. These results indicate that the ultimate load showed relatively low sensitivity to mesh refinement, whereas the predicted deflection showed greater sensitivity to the adopted mesh size. An element size of 25 mm was used for the concrete elements (C3D8R), which provides an appropriate representation of stress distribution, cracking behavior, and the shape of the slab load–deflection curve. The steel reinforcement was modeled using T3D2 elements with an element size of 8 mm to provide sufficient discretization for the longitudinal bars and the stirrups embedded in the concrete. An element size of 12.5 mm was used for the CFRP strips and patch anchors (S4R elements) to improve the representation of strain distribution along the fibers and stress transfer between the concrete surface and the strengthening system. For the rigid bodies used in the support and loading regions, a mesh size of 30 mm was adopted, since they were primarily used to transfer loads and boundary conditions to the slab rather than to represent deformational behavior. Overall, this mesh-size distribution helped achieve an appropriate balance between result accuracy and analysis time. The adopted finite element mesh is shown in Figure 7.
Figure 7.
Finite element mesh of the reinforced concrete slab model in ABAQUS.
4. Results and Discussion
4.1. Experimental Results and Discussion
4.1.1. Ultimate Load Capacity
The ultimate capacity results showed that the reference specimen sustained a load of 27.11 kN, which was adopted as the baseline for comparison with the strengthened groups. Group B, strengthened with CFRP without anchorage, achieved clear increases in flexural load capacity, as the ultimate loads of specimens B1 and B2 reached 36.80 and 35.31 kN, corresponding to increases of 35.7% and 30.2%, respectively. In contrast, Groups C and D, strengthened with CFRP and patch anchors, recorded higher ultimate loads than Group B. The ultimate loads of specimens C2 and C3 were 40.45 and 39.83 kN, respectively, while those of specimens D1, D2, and D3 were 39.36, 43.75, and 38.24 kN, respectively. These results demonstrate the positive contribution of the patch anchors to increasing the ultimate load capacity and delaying premature debonding. In general, the patch anchors produced a clear improvement in ultimate capacity, whereas changing the anchorage area did not produce a meaningful increase in the average ultimate load. Groups C and D achieved mean ultimate loads of 40.14 and 40.45 kN, respectively, corresponding to a difference of only approximately 0.8%. Table 6 summarizes the experimental ultimate loads, failure modes, peak strains, and statistical parameters, including the mean, standard deviation (SD), and coefficient of variation (CoV), for the tested RC slabs. The replicate tests showed good repeatability among the strengthened groups. The CoV of the ultimate load capacity was 2.92% for the unanchored Group B, 1.09% for anchored Group C, and 7.20% for anchored Group D. These CoV values, all below 10%, indicate good repeatability and relatively limited scatter in the experimental ultimate-load results. Furthermore, the application of CFRP patch anchors increased the average ultimate load capacity by 48.1% for Group C and 49.2% for Group D relative to the control specimen. The anchored specimens also exhibited a transition in the governing failure mode from premature IC debonding, observed in the unanchored specimens, toward CFRP rupture.
Table 6.
Ultimate load and failure mode of tested specimens and peak strain.
4.1.2. Failure Mode
Two main failure modes were observed through visual inspection during and after loading: intermediate crack-induced debonding (IC debonding) and CFRP fiber rupture. The unanchored Group B specimens exhibited premature debonding that initiated near the mid-span region and propagated toward one of the ends, accompanied by flexural cracks that developed upward from the tension side toward the compression zone. In contrast, Groups C and D, strengthened with CFRP and anchored using patch anchors, showed restricted propagation of debonding toward the ends, which allowed higher load capacity and shifted the governing failure mode toward CFRP fiber rupture within the maximum-moment region. Representative IC debonding and CFRP fiber rupture failure modes are shown in Figure 8. This behavior confirms that the patch anchors were effective in delaying premature debonding and improving CFRP utilization, although CFRP rupture remained a relatively brittle failure mode. Visual inspection of the debonded regions showed that the separation was accompanied by the removal of a thin layer of the concrete substrate that remained attached to the CFRP/epoxy system. This observation indicates that the failure was governed mainly by separation within the near-surface concrete rather than by adhesive failure at the epoxy–CFRP interface. Accordingly, the epoxy–CFRP bond appeared to remain effective up to failure, while the weaker near-surface concrete layer controlled the debonding process. This observation is consistent with previous studies showing that failure in FRP–epoxy–concrete bonded systems may occur within the adhesive layer or within the adjacent concrete substrate rather than necessarily at the FRP–epoxy interface. Zhang et al. [34] reported that the failure mechanism of epoxy-bonded FRP–concrete interfaces depends strongly on the local stress state and may involve damage within the epoxy or the surrounding concrete. Therefore, the presence of a thin concrete layer attached to the CFRP/epoxy system in the present specimens supports the interpretation that near-surface concrete separation was the dominant mechanism. Recent studies on epoxy-based bonding systems have also emphasized the importance of adhesive mechanical properties and interface quality in controlling stress transfer and bond performance [35]. Specimen C1 was excluded from the statistical analysis because its failure was not representative of the general behavior observed for the remaining specimens.
Figure 8.
Modes of failure: (a) IC debonding; (b) CFRP fiber rupture failure.
4.1.3. Comparison with ACI 440.2R Predictions
It is noted from the manual analysis results according to ACI 440.2R [2] that the governing failure behavior in most cases is premature debonding or concrete cover failure, because the code specifies an allowable fiber strain limit that is much lower than the rupture strain, which leads to a noticeable reduction in the ultimate load. This is considered realistic because ACI 440.2R takes into account the possibility of weak execution conditions on site, including insufficient roughening and surface preparation, absence of fiber anchorage means, or poor quality of the adhesive material, all of which may lead to premature debonding of the fibers. When debonding is neglected and the contribution of the fibers is calculated up to the rupture stage, the load capacity becomes higher, while neglecting safety factors and relying on the nominal strength only gives a load capacity close to the experimental results and reaches approximately 42 kN, with greater utilization of the fiber capacity. In general, the increase in the load-carrying capacity of slabs is governed by the fiber strain and the corresponding failure mode, while the recommendations of ACI 440.2R remain conservative by nature and focus primarily on ensuring safety and reducing debonding risks, even if this is at the expense of not fully utilizing the fiber strength.
4.1.4. Load–Deflection Response
From the load–deflection curves of all specimens shown in Figure 9, the slab behavior during loading up to failure is clarified through the stages of initial stiffness before cracking, reduction in stiffness after cracking, reaching the ultimate load, and the post-peak response. The reference specimen A exhibited more ductile behavior, with a quasi-linear increase in load in the initial stage, followed by a gradual decrease in stiffness after cracking, and continued deflection up to 47 mm without a sudden drop in load, indicating a relatively plastic stage. Group B exhibited a quasi-linear increase in stiffness up to the stage close to reinforcing steel yielding, after which stiffness decreased at a load of approximately 30 kN, while the load continued to increase until reaching the maximum value, followed by a gradual but relatively sharp drop, which indicates the occurrence of premature debonding of the IC debonding type. Groups C and D showed a clear increase in initial stiffness compared to the reference specimen, and a gradual increase in load until reaching the maximum value, followed by a sharp drop in resistance with only a limited increase in deformation, which indicates a more brittle failure mode associated with CFRP fiber rupture in the maximum tensile region. In general, the results indicate that increasing anchorage efficiency improves force transfer and delays premature debonding, but it may also reduce ductility when the failure mode shifts.
Figure 9.
Load–Deflection Curves.
4.1.5. FRP Strain Response
In Group B, seven strain gauges were installed along the CFRP strip of each specimen. The strain increased from the strip ends toward the maximum-moment region, where the highest values were recorded. At ST4, the peak strains reached approximately 6500 µε in B1 at 36.8 kN and 6000 µε in B2 at 35.3 kN. The relatively low strains near the strip ends and the concentration of strain around mid-span indicate that the governing mechanism was intermediate crack-induced debonding rather than plate-end debonding. The close ultimate loads and strain levels of B1 and B2 also indicate reasonably repeatable behavior. For Group C, eleven strain gauges were used on each specimen, including gauges along the longitudinal CFRP and on the end patches. The strains increased more gradually with loading and became concentrated within the maximum-moment region after approximately 20 kN. C2 developed higher strains than C3 at intermediate load levels, while C3 reached approximately 10,000 µε near failure. The high CFRP strains recorded in the anchored specimens indicate that the patch anchors delayed premature debonding and allowed greater utilization of the tensile capacity of the longitudinal CFRP. The very small strains measured on the end patches suggest that their principal role was to restrain debonding propagation rather than directly carry a large proportion of the longitudinal tensile force. Group D showed a similar overall trend of increasing CFRP utilization after cracking; however, differences were observed among the individual specimens. D1 exhibited a localized strain concentration near ST6. In contrast, D2 developed high strains over a wider portion of the maximum-moment region, with ST5, ST6, and ST7 approaching approximately 10,000 µε near the ultimate load. This wider strain distribution and continued increase in strain after cracking indicate progressive stress redistribution through the patch anchorage system, which delayed debonding and allowed the CFRP to continue mobilizing tensile resistance, producing the pronounced post-cracking response observed in D2. D3 did not exhibit the same distributed response as D2; instead, a sharp localized increase in strain was recorded at ST5 near failure, indicating a more concentrated strain demand. Overall, the strain measurements demonstrate that the patch anchors altered the CFRP stress-transfer mechanism by distributing tensile strains over a larger region and delaying premature IC debonding. The unanchored specimens developed peak strains of approximately 6000–6500 µε, whereas the anchored specimens approached or exceeded 10,000 µε before failure. This increased strain utilization is consistent with the observed shift in failure mode from IC debonding toward CFRP rupture. The measured CFRP strain distributions for specimens B1, B2, C2, C3, D1, D2, and D3 are presented in Figure 10.
Figure 10.
Strain distribution along the CFRP sheet for specimens: (a) B1; (b) B2; (c) C2; (d) C3; (e) D1; (f) D2; (g) D3.
4.2. Numerical Results and Discussion
4.2.1. Control Model
In this part, the numerical analysis results were discussed and compared with the experimental results to determine the ability of the finite element model to represent the behavior of the control slab. Through the load–deflection curve, as shown in Figure 11, high agreement was observed between the numerical and experimental results in terms of ultimate capacity. The experimental and numerical ultimate loads were both approximately 27 kN, with a small error ratio of 0.77%, indicating good agreement in predicting the ultimate load. However, some differences were observed in the deflection at ultimate load. The experimental specimen recorded a deflection of 44.9 mm, whereas the numerical model recorded 39.9 mm, corresponding to an underestimation of approximately 11.1% by the numerical model. This difference may be attributed to realistic effects that are not fully represented in the numerical model, such as the flexibility of the loading device, local compression at the loading regions, non-ideal support conditions, and possible small slips at the supports. These factors may lead to larger deflection in the experimental slab under continuous loading. In terms of stiffness, the numerical model showed higher initial stiffness compared with the experimental curve. This can be attributed to the ideal boundary and contact conditions used in the numerical model, in addition to assuming a perfect bond between concrete and steel reinforcement without explicitly defining bond–slip behavior. This assumption increases the calculated initial stiffness of the model. A qualitative comparison of the crack patterns also showed reasonable agreement between the experimental and numerical results. In both cases, flexural cracking was concentrated mainly within the maximum-moment region and propagated upward from the tension face toward the compression zone. Nevertheless, cracks in the numerical analysis do not appear as discrete cracks as in the experimental test, but are represented through the increase in damage variables, especially the tensile damage variable dt (DAMAGET). The localized regions of high tensile damage in the numerical model corresponded reasonably well with the experimentally observed flexural-crack region. The experimental and numerical crack patterns at peak load are compared in Figure 12, while the numerical deflected shape is shown in Figure 13. As the tensile strain increases in the tension zone, the overall stiffness of the numerical model decreases. In the steel yielding stage, the experimental specimen showed a more flexible and ductile response due to the large increase in deflection with a small gradual increase in load, while the numerical model remained more stable and regular because of the idealization of the numerical simulation and the neglect of some additional deformation sources in the test setup.
Figure 11.
Load–Deflection Curve: Numerical Models (FEM1) and Experimental (A) (Control).
Figure 12.
FEM results showing cracks in the control specimen at peak load compared with experimental results: (a) experimental; (b) FEM.
Figure 13.
Deflected shape of specimen (Control).
4.2.2. The Strengthened Model
Through comparison of the strengthened numerical models without anchorage, which consist of a model neglecting the effect of concrete damage, B_FEM2, and a model considering this effect, B_FEM1, with the strengthened experimental specimens without anchorage using the load–deflection curves, as shown in Figure 14, a notable agreement with the experimental response was observed. The agreement was very high in terms of ultimate load, as specimens B1 and B2 reached ultimate loads of 36.80 and 35.31 kN, respectively, while B_FEM1 and B_FEM2 achieved ultimate loads of 35.50 and 35.26 kN, respectively. The mean experimental and numerical ultimate loads were 36.06 and 35.38 kN, respectively, corresponding to an error of only 1.88%. The experimental specimens reached their ultimate loads at deflections of approximately 27.9–28.7 mm, whereas the numerical models reached their ultimate loads at approximately 32.3–32.6 mm. The mean deflection at ultimate load was 28.30 mm experimentally and 32.45 mm numerically, corresponding to an overestimation of approximately 14.65% by the numerical models. Clear differences were observed in terms of the initial stiffness, where the numerical models exhibited higher stiffness during the early stages of loading. This difference may be attributed to the nature of numerical modeling, which assumes ideal loading and boundary conditions, in addition to idealized contact regions and material interfaces. Moreover, the numerical models do not fully represent the effects of bearing at the supports, construction tolerances, micro-defects, and pre-existing micro-cracks, which in reality may lead to increased flexibility in the experimental specimens. A qualitative comparison of the cracking and failure patterns also showed reasonable agreement between the experimental and numerical results. In specimens B1 and B2, flexural cracks developed mainly within the maximum-moment region and propagated upward from the tension face with increasing load. These cracks generated local stress concentrations at the concrete–CFRP interface and subsequently initiated intermediate crack-induced (IC) debonding. Similarly, the numerical models showed concentration of tensile damage in the same flexural region together with progressive damage at the CFRP–concrete interface, reproducing the experimentally observed sequence of flexural cracking followed by IC debonding. The numerical damage distribution was more regular than the experimental cracking pattern because of the idealized material properties and boundary conditions adopted in the finite element models. The corresponding experimental–numerical crack comparison at peak load is shown in Figure 15. To further evaluate the overall structural response, the energy dissipation capacity was estimated from the area under the recorded load–deflection curves using trapezoidal integration. The mean energy obtained from the experimental specimens was approximately 870.24 J, compared with 885.56 J for the numerical models, corresponding to a difference of only 1.76%. This close agreement indicates that the numerical models reproduced the overall energy response of the strengthened slabs with good accuracy, despite the larger difference observed in the deflection at ultimate load. With regard to ductility, the numerical and experimental responses showed reasonably comparable behavior, although the deflection at the ultimate load in the numerical models was slightly higher than that of the experimental specimens. Both the numerical and experimental results exhibited behavior close to brittle failure due to interfacial debonding after reaching the ultimate load. In general, the load–deflection curves of the numerical models were stiffer than the experimental curves during the early stages of loading. Nevertheless, the errors of 1.88% in ultimate load and 1.76% in energy response, together with the reasonable agreement in crack and failure patterns, confirm the ability of the numerical models to represent the overall structural behavior of the CFRP-strengthened slabs without anchorage.
Figure 14.
Load–Deflection Curve: Numerical Models (B_FEM1 & B_FEM2) and Experimental (B1, B2) (strengthened model).
Figure 15.
FEM results showing cracks in specimen B at peak load compared with experimental results: (a) experimental; (b) FEM.
4.2.3. The Strengthened and Anchored Model
From the load–deflection curve, as shown in Figure 16, an acceptable agreement can be observed between the numerical and experimental curves. However, some differences can be noticed between the experimental curves of specimens C2 and C3 and the numerical curve C_FEM1. The numerical model gave higher initial stiffness, where a significant increase in load can be observed with a relatively small deflection. This difference is due to the idealization in modeling within Abaqus, in addition to the assumptions of contact and bonding, the method of material representation within the program, and the non-representation of all real defects and cracks existing in the experimental specimens. The ultimate load in the numerical model was close to the experimental specimens, which indicates good calibration of the numerical model in terms of representing the ultimate load and the general behavior of the curve. The experimental specimens C2 and C3 reached ultimate loads of 40.45 and 39.83 kN, respectively, giving a mean value of 40.14 kN, whereas C_FEM1 reached 40.08 kN. The corresponding error in the ultimate load was only approximately 0.16%. The mean experimental deflection at ultimate load was approximately 33.35 mm, compared with 34.98 mm for C_FEM1, corresponding to an overestimation of approximately 4.88% by the numerical model. Nevertheless, the numerical curve was smoother and more stable in reaching the ultimate load compared with the experimental curves, due to the nature of the numerical solution in the program. A qualitative comparison of the crack patterns also showed good agreement between the experimental and numerical results, as shown in Figure 17. In the experimental specimens, flexural cracks were concentrated mainly within the maximum-moment region and propagated upward from the tension face toward the compression zone. A similar concentration of tensile damage was observed in the numerical model within the same region. The numerical crack pattern was represented through localized regions of high tensile damage (DAMAGET), which corresponded reasonably well with the experimentally observed flexural cracking. However, the experimental crack distribution was more irregular, while the numerical damage pattern was more uniform because of the idealized material properties and boundary conditions adopted in the finite element analysis. The numerical model also showed a better distribution of stresses in the patch regions and bonding interface compared with the unanchored behavior, which led to a response associated with high CFRP stress and strain utilization after the stresses developed to high levels. This indicates that the patch anchorage arrangement used in model C_FEM1 was effective in delaying debonding and allowing higher utilization of the tensile capacity of CFRP. To further evaluate the overall response, the energy dissipation capacity was estimated from the area under the recorded load–deflection curves using trapezoidal integration. The mean experimental energy for specimens C2 and C3 was approximately 967.97 J, while C_FEM1 gave approximately 1096.28 J, corresponding to a difference of approximately 13.26%. This difference is larger than the error in ultimate load and may be attributed to the slightly higher numerical stiffness and deflection capacity, together with the idealized material and interface behavior adopted in the model. Nevertheless, the comparison shows that the numerical model reasonably reproduced the overall load–deflection response while providing very high accuracy in predicting the ultimate load. As for the numerical model C_FEM2, which consists of end anchorage patches only and has a small area, it gave an ultimate load lower than model C_FEM1 and the experimental specimens C2 and C3. The ultimate load of C_FEM2 was approximately 35.82 kN, which is about 10.77% lower than the mean experimental ultimate load of specimens C2 and C3. The load then began to decrease, indicating the occurrence of gradual damage in the bonding interface and interfacial debonding before achieving higher CFRP strain utilization. It is also observed from the curve that model C_FEM2 showed good initial stiffness at the beginning of loading and close behavior to the experimental specimens in the early stage. However, after the development of cracks and the increase in deflection, it became less able to continue increasing the load compared with model C_FEM1 and the experimental specimens. This underestimation can be attributed to the limited anchorage area and the use of end patches only, which were insufficient to redistribute the high interfacial stresses generated near the maximum-moment region. Consequently, damage at the CFRP–concrete interface developed earlier, limiting the effective utilization of the CFRP tensile capacity. From this model, it can be predicted that using end patches only with a small area does not provide a clear effect in changing the failure type or significantly increasing the ultimate load, and it was not sufficient to achieve the higher CFRP utilization observed in the fully anchored configuration. Therefore, the distribution of patch anchors near the maximum moment region is more effective than using end patches only in improving stress transfer and delaying debonding. The CFRP strain distribution obtained for model C_FEM2 is shown in Figure 18. Overall, the very small ultimate-load error of 0.16%, the deflection error of 4.88%, the qualitative agreement in crack patterns, and the comparison of energy response provide additional validation of model C_FEM1 in representing the behavior of the CFRP-strengthened and anchored slabs.
Figure 16.
Load–Deflection Curve: Numerical Models (C_FEM1 & C_FEM2) and Experimental (C2, C3) (strengthened and anchored model).
Figure 17.
FEM results showing cracks in specimen C at peak load compared with experimental results: (a) experimental; (b) FEM.
Figure 18.
Strain in CFRP sheet (C_FEM2).
Through the load–deflection curves of the numerical models, which consist of two models—a model representing perfect bonding using a Tie constraint and a model representing the CFRP–concrete bonding interface using a cohesive interface—compared with the experimental specimens, as shown in Figure 19, the numerical models provided a good representation of the structural response in terms of ultimate load. The two bonding approaches were considered to evaluate the influence of the CFRP–concrete interface representation. The Tie constraint represents an ideal perfect-bond condition without interfacial separation, whereas the cohesive interface allows progressive damage and debonding to develop at the bonding interface. However, some differences were observed in the behavioral characteristics at the beginning of loading and before the peak. The experimental specimens D1, D2, and D3 reached ultimate loads of 39.36, 43.75, and 38.24 kN, respectively, giving a mean ultimate load of 40.45 kN. The perfect-bond model (D_FEM_TIE) reached an ultimate load of approximately 41.40 kN, corresponding to an error of approximately 2.34% relative to the mean experimental value. The cohesive interface model (D_FEM_COHESIVE) reached approximately 43.26 kN, corresponding to an error of approximately 6.94% relative to the experimental mean and remaining close to the highest experimental load recorded for specimen D2. This indicates good calibration of the numerical models in representing the ultimate load capacity of the strengthened slabs compared with the experimental results. As for the deflection at the ultimate load, the numerical models showed larger deflection than the experimental specimens. The experimental specimens D1, D2, and D3 reached their ultimate loads at deflections of approximately 33.02, 35.45, and 32.39 mm, respectively, with a mean value of 33.62 mm. In comparison, D_FEM_TIE and D_FEM_COHESIVE reached their ultimate loads at approximately 43.11 and 43.92 mm, respectively. Accordingly, the numerical models overestimated the mean experimental deflection at ultimate load by approximately 28.23% for the Tie model and 30.64% for the cohesive model. This indicates that the numerical models overestimated the deflection and ductility compared with the experimental specimens, despite their closeness in ultimate load. It is also observed from the load–deflection curves that the initial stiffness of the numerical models was higher than the stiffness of some experimental curves. This difference can be attributed to the idealized assumptions in the numerical modeling, such as contact and bonding conditions, the nature of loading and supports, the method of material representation within the program, and the non-representation of all fine defects, microcracks, and execution tolerances existing in the experimental specimens. After cracking and the development of nonlinearity, a gradual convergence of the curves was observed within a close load range, which indicates that the numerical models provided a suitable representation of cracking behavior and stress redistribution up to the ultimate load. A qualitative comparison of the crack patterns also showed good agreement between the experimental and numerical results, as shown in Figure 20. In the experimental specimen, flexural cracks were concentrated mainly within the maximum-moment region and propagated upward from the tension face toward the compression zone. Similarly, the numerical model showed localized regions of high tensile damage (DAMAGET) concentrated within the same region, indicating that the finite element model reasonably reproduced the main crack locations and the general crack propagation behavior. The experimental cracks showed more irregular spacing and propagation, whereas the numerical damage pattern was more uniform. This difference may be attributed to the heterogeneity of real concrete, local imperfections, and construction variability, which are not fully represented in the idealized numerical model. The comparison therefore indicates that the numerical model provided an acceptable representation of the cracking behavior of the strengthened and anchored slabs, particularly within the maximum-moment region. Among the experimental specimens, D2 exhibited a more pronounced increase in load after cracking and reached both the highest ultimate load of 43.75 kN and the largest deflection at peak load of 35.45 mm. This behavior indicates more effective progressive stress redistribution and greater utilization of the CFRP strengthening system before failure. In contrast, D3 reached a lower ultimate load of 38.24 kN at a deflection of approximately 32.39 mm and did not exhibit the same degree of post-cracking load development observed in D2. Therefore, the responses of D2 and D3 should not be considered identical. However, the failure mode in the experimental specimens was relatively brittle after reaching the ultimate load due to CFRP fiber rupture, which appeared through the sharp drop in load immediately after the peak. In contrast, the numerical models showed greater continuity in loading and higher deflection before losing resistance, which indicates higher numerical ductility than the experimental behavior. To further evaluate the overall structural response, the energy response was estimated from the area under the recorded load–deflection curves using trapezoidal integration. The mean experimental energy for specimens D1, D2, and D3 was approximately 968.07 J, whereas the Tie and cohesive numerical models produced values of approximately 1380.24 and 1484.76 J, respectively. These values correspond to overestimations of approximately 42.58% for the Tie model and 53.37% for the cohesive model. The larger differences in energy compared with the ultimate-load errors are mainly associated with the greater deflection capacity predicted by the numerical models and their more gradual response before loss of resistance. Thus, although the numerical models accurately predicted the ultimate load capacity, they overestimated the deformation and energy response of the experimental specimens. Therefore, it can be stated that the numerical models represented the ultimate load well, with ultimate-load errors of approximately 2.34% and 6.94% for the Tie and cohesive models, respectively, but overestimated the deflection at the ultimate load compared with the experimental specimens. The quantitative comparison also demonstrates that the largest numerical discrepancy was associated with deformation and energy response rather than load capacity. Within the limits of the studied patch areas, changing the patch area did not show a clear effect on increasing the load capacity. The CFRP stress distribution obtained from model D_FEM_COHESIVE is shown in Figure 21. A summary of the experimental and numerical results is presented in Table 7.
Figure 19.
Load–Deflection Curve: Numerical Models (FEM_TIE & FEM_COHESIVE) and Experimental (D1, D2, D3) (strengthened and anchored model).
Figure 20.
FEM results showing cracks in specimen D at peak load compared with experimental results: (a) experimental; (b) FEM.
Figure 21.
Stress in CFRP sheet (D_FEM_COHESIVE).
Table 7.
Summary of experimental and numerical results.
4.3. Comparison with Previous Investigations
The improvements obtained in the present study are generally consistent with those reported in previous investigations on CFRP anchorage systems. In the present tests, the unanchored CFRP specimens achieved an average ultimate-load increase of 33.0% relative to the control specimen, whereas the application of patch anchors increased the average capacity by 48.1% and 49.2% for Groups C and D, respectively. These values are comparable with the results reported in [28], where transverse unidirectional CFRP patch anchors increased the ultimate load by approximately 39–43%, while another anchorage configuration produced increases of approximately 46–57%. The corresponding improvements in CFRP strain were approximately 19–28% and 18–37%, respectively, confirming that patch anchorage can enhance fiber utilization by redistributing interfacial stresses and delaying premature debonding. Similarly, Kalfat and Al-Mahaidi [36] reported increases in anchorage strength ranging from approximately 53% to 81% for the investigated configurations, although variations in anchor geometry did not always produce proportional improvements in capacity. This observation is consistent with the present results, where Groups C and D achieved mean ultimate loads of 40.14 and 40.45 kN, respectively, differing by only approximately 0.8%, indicating that increasing the patch area alone did not provide a significant additional benefit. Kalfat et al. [37] also reported substantial improvements in load capacity for specimens provided with bidirectional patch anchors, demonstrating improved FRP utilization and delayed debonding. In the present study, the unanchored specimens reached approximately 6000–6500 με and failed by IC debonding, whereas the anchored specimens developed strains approaching or exceeding 10,000 με and generally shifted toward CFRP rupture. Overall, these comparisons indicate that the effectiveness of CFRP patch anchorage depends not only on the anchorage area but also on its location, arrangement, and ability to redistribute interfacial stresses within the critical flexural region.
4.4. Experimental–Numerical Discussion
The experimental and numerical results showed generally good agreement in predicting the overall structural response of the tested slabs, particularly in terms of ultimate load and overall response. The finite element models accurately reproduced the increase in load-carrying capacity resulting from CFRP strengthening and the additional improvement associated with the use of patch anchors. The numerical damage patterns were also consistent with the experimentally observed flexural cracking regions. The numerical models further reproduced the increased CFRP strain utilization associated with patch anchorage, while CFRP rupture was identified from the experimental observations rather than explicitly simulated in the numerical models. Some differences were observed in the deflection response, with the numerical models generally exhibiting a stiffer response due to the idealized boundary conditions, material representation, and bond assumptions adopted in the finite element analysis. The CFRP strain distributions predicted numerically also followed the experimental trends, with higher strain concentrations developing near the maximum-moment region. In addition, the lower capacity predicted by model C_FEM2 confirmed that end anchorage alone was insufficient to fully control interfacial debonding and utilize the tensile capacity of the CFRP. Overall, the agreement between the experimental and numerical results indicates that the developed finite element models can reasonably represent the main mechanisms governing the behavior of CFRP-strengthened and patch-anchored reinforced concrete slabs.
4.5. Limitations of the Study
The present study has several limitations that should be considered when interpreting the results. The experimental program was limited to nine reinforced concrete slabs with one concrete strength, one CFRP material, and a limited number of patch-anchor configurations and dimensions. Therefore, the observed behavior may not represent all possible slab geometries, reinforcement ratios, CFRP layouts, or anchorage arrangements. In addition, no independent pull-off or adhesive bond-strength tests were conducted; therefore, the CFRP–concrete bond performance was evaluated indirectly through the observed failure modes, CFRP strain response, and numerical interface modeling. Crack development was monitored visually during testing rather than by an automated crack-measurement system. Furthermore, the finite element models involve idealizations of material behavior, bond-interface response, and boundary conditions that may contribute to differences between the experimental and numerical results. In addition, no explicit CFRP material failure criterion was defined in the numerical models; therefore, CFRP rupture was not explicitly simulated numerically. Future studies should investigate a wider range of patch-anchor geometries, concrete strengths, CFRP reinforcement ratios, and direct bond characterization to further assess the applicability of the proposed strengthening technique.
5. Conclusions
- •
- This research confirmed the effectiveness of CFRP strengthening in increasing the load-carrying capacity of reinforced concrete slabs, while maintaining the advantages of low weight and limited impact on the structural system.
- •
- The experimental results showed that one layer of unidirectional CFRP fibers increased the ultimate load by approximately 30.2–61.4% compared with the reference specimen, which confirms the efficiency of the externally bonded strengthening system in improving the flexural behavior of the slabs.
- •
- The results indicated that premature debonding, particularly intermediate crack-induced debonding (IC debonding), was the governing failure mode in the unanchored specimens, which limited the full utilization of the tensile capacity of CFRP fibers. The unanchored Group B reached a mean ultimate load of 36.06 kN, representing an increase of 33.0% compared with the control specimen.
- •
- Patch anchors, especially those located near the beginning of the maximum-moment region, contributed to improving fiber utilization and delaying or limiting premature debonding. They also helped to shift the failure mode from debonding toward CFRP fiber rupture at higher loading levels. The anchored Groups C and D reached mean ultimate loads of 40.14 and 40.45 kN, corresponding to increases of 48.1% and 49.2%, respectively, compared with the control specimen.
- •
- The results indicated that the quality of surface preparation and bonding, together with the uniformity of strain distribution along the CFRP, influenced the overall strengthening response. However, the adhesive bond strength was not independently measured in the present experimental program.
- •
- In general, patch anchors proved to be a practical solution for slabs, as they contribute to improving stress transfer and achieving better utilization of CFRP strength, although the strengthened specimens exhibited more brittle behavior compared with the reference specimen. The anchored specimens reached CFRP strains approaching or exceeding 10,000 με before failure, compared with approximately 6000–6500 με in the unanchored specimens.
- •
- The numerical models showed good agreement with the experimental results in terms of the ultimate load and the general behavior of the load–deflection curve. The ultimate-load error was approximately 0.77% for the control model, 1.88% for Group B, and 0.16% for model C_FEM1. For Group D, the ultimate-load errors were approximately 2.34% and 6.94% for the Tie and cohesive models, respectively.
- •
- The numerical models generally showed higher initial stiffness compared with the experimental specimens, and some models also showed larger deflection at the ultimate load. The difference in deflection at ultimate load was approximately 11.1% for the control model, 14.65% for Group B, and 4.88% for C_FEM1, whereas the Group D numerical models overestimated the mean experimental deflection by approximately 28.23–30.64%. This was due to the idealized assumptions in the numerical modeling, including contact conditions, boundary conditions, bond representation, and the incomplete representation of microcracks and execution defects.
- •
- The study showed that, within the limits of the studied patch anchor areas, changing the patch area did not show a clear or consistent effect on increasing the ultimate load capacity. Groups C and D achieved mean ultimate loads of 40.14 and 40.45 kN, respectively, with a difference of only approximately 0.8%. This indicates that the location and arrangement of the patch anchors, especially near the maximum-moment region, may be more influential than increasing the patch area alone.
- •
- The numerical results showed that patch anchors improved the stress transfer mechanism and reduced strain concentration along the CFRP strip, which led to delaying intermediate crack-induced debonding (IC debonding) and allowing higher utilization of CFRP strain before failure. In addition, the numerical crack patterns showed reasonable agreement with the experimentally observed flexural cracking, particularly in the maximum-moment region.
Author Contributions
Conceptualization, I.H.M.Z. and A.A.-M.; methodology, I.H.M.Z. and A.A.-M.; software, I.H.M.Z.; validation, I.H.M.Z. and A.A.-M.; formal analysis, I.H.M.Z.; investigation, I.H.M.Z.; resources, I.H.M.Z. and A.A.-M.; data curation, I.H.M.Z.; writing—original draft preparation, I.H.M.Z.; writing—review and editing, A.A.-M.; visualization, I.H.M.Z.; supervision, A.A.-M.; project administration, A.A.-M. All authors have read and agreed to the published version of the manuscript.
Funding
This research received no external funding.
Institutional Review Board Statement
Not applicable. This study involved laboratory testing of reinforced concrete specimens and numerical analysis and did not involve human participants or animals.
Informed Consent Statement
Not applicable.
Data Availability Statement
The raw data supporting the conclusions of this article will be made available by the authors on request.
Acknowledgments
The authors gratefully acknowledge the support of the Structural Engineering Laboratory for Postgraduate Studies, College of Engineering, University of Kufa, for providing the facilities used in the experimental program. During the preparation of this manuscript, the authors used OpenAI ChatGPT (GPT-5.6 Sol) for English-language editing, improving clarity, and organizing references. The authors reviewed and edited the output and take full responsibility for the content of this publication.
Conflicts of Interest
The authors declare no conflicts of interest.
References
- Hollaway, L.C.; Teng, J.G. Strengthening and Rehabilitation of Civil Infrastructures Using Fibre-Reinforced Polymer (FRP) Composites; Woodhead Publishing: Cambridge, UK, 2008. [Google Scholar]
- ACI 440.2R-17; Guide for the Design and Construction of Externally Bonded FRP Systems for Strengthening Concrete Structures. American Concrete Institute: Farmington Hills, MI, USA, 2017.
- FIB. Externally Bonded FRP Reinforcement for RC Structures; fib Bulletin 14; International Federation for Structural Concrete: Lausanne, Switzerland, 2001. [Google Scholar]
- Teng, J.G.; Chen, J.F.; Smith, S.T.; Lam, L. FRP-Strengthened RC Structures; John Wiley & Sons: Chichester, UK, 2002. [Google Scholar]
- Al-Ghrery, K.; Al-Mahaidi, R.; Kalfat, R.; Oukaili, N.; Al-Mosawe, A. Externally bonded CFRP for flexural strengthening of RC beams with different levels of soffit curvature. J. Compos. Constr. 2022, 26, 04021062. [Google Scholar] [CrossRef] [Scilit]
- Al-Mosawe, A.; Agha, M.; Oraim, H.; Al-Mahaidi, R. Enhancing fatigue life of steel plates with CFRP laminate: Effects of curing temperature, stress range, and adhesive thickness. J. Constr. Steel Res. 2024, 213, 108352. [Google Scholar] [CrossRef] [Scilit]
- Delzendeh Moghadam, M.; Fathi, A.; Chaallal, O. Retrofitting of steel structures with CFRP: Literature review and research needs. Appl. Sci. 2024, 14, 5958. [Google Scholar] [CrossRef] [Scilit]
- Lu, X.Z.; Teng, J.G.; Ye, L.P.; Jiang, J.J. Bond–slip models for FRP sheets/plates bonded to concrete. Eng. Struct. 2005, 27, 920–937. [Google Scholar] [CrossRef] [Scilit]
- Kalfat, R.; Al-Mahaidi, R.; Smith, S.T. Anchorage devices used to improve the performance of reinforced concrete beams retrofitted with FRP composites: State-of-the-art review. J. Compos. Constr. 2013, 17, 14–33. [Google Scholar] [CrossRef] [Scilit]
- Al-Safy, R.; Al-Mosawe, A.; Al-Mahaidi, R. Utilization of magnetic water in cementitious adhesive for near-surface mounted CFRP strengthening system. Constr. Build. Mater. 2019, 197, 474–488. [Google Scholar] [CrossRef] [Scilit]
- Chen, J.F.; Teng, J.G. Anchorage strength models for FRP and steel plates bonded to concrete. J. Struct. Eng. 2001, 127, 784–791. [Google Scholar] [CrossRef] [Scilit]
- Al-Atta, B.; Kalfat, R.; Al-Mahaidi, R.; Al-Mosawe, A. Mitigation of IC debonding in FRP-plated concrete slabs using patch anchors. Eng. Struct. 2020, 214, 110626. [Google Scholar] [CrossRef] [Scilit]
- ACI PRC-440.2-23; Design and Construction of Externally Bonded Fiber-Reinforced Polymer (FRP) Systems for Strengthening Concrete Structures—Guide. American Concrete Institute: Farmington Hills, MI, USA, 2023.
- del Rey Castillo, E.; Kanitkar, R.; Smith, S.T.; Griffith, M.C.; Ingham, J.M. Design approach for FRP spike anchors in FRP-strengthened RC structures. Compos. Struct. 2019, 214, 23–33. [Google Scholar] [CrossRef] [Scilit]
- Kalfat, R.; Al-Mahaidi, R. A prediction model for bidirectional fiber patch anchors used to enhance the performance of FRP materials bonded to concrete. Compos. Struct. 2014, 117, 51–58. [Google Scholar] [CrossRef] [Scilit]
- Kalfat, R.; Al-Mahaidi, R. Experimental investigation into the size effect of bidirectional fiber patch anchors in strengthening of concrete structures. Compos. Struct. 2014, 112, 134–145. [Google Scholar] [CrossRef] [Scilit]
- Smith, S.T.; Hu, S.; Kim, S.J.; Seracino, R. FRP-strengthened RC slabs anchored with FRP anchors. Eng. Struct. 2011, 33, 1075–1087. [Google Scholar] [CrossRef] [Scilit]
- Al-Atta, B.M.J. Development of Efficient Anchorage Systems for Strengthening of Concrete Structures Using FRP Materials. Ph.D. Thesis, Swinburne University of Technology, Melbourne, Australia, 2023. [Google Scholar]
- Zhang, H.W.; Smith, S.T. FRP-to-concrete joint assemblages anchored with multiple FRP anchors. Compos. Struct. 2012, 94, 403–414. [Google Scholar] [CrossRef] [Scilit]
- Kalfat, R.; Al-Mahaidi, R. Improvement of FRP-to-concrete bond performance using bidirectional fiber patch anchors combined with FRP spike anchors. Compos. Struct. 2016, 155, 89–98. [Google Scholar] [CrossRef] [Scilit]
- Zhang, H.; Smith, S.T. Influence of plate length and anchor position on FRP-to-concrete joints anchored with FRP anchors. Compos. Struct. 2017, 159, 615–624. [Google Scholar] [CrossRef] [Scilit]
- Razaqpur, A.G.; Mostafa, A.B. C-Anchor for strengthening the connection between adhesively bonded laminates and concrete substrates. Technologies 2015, 3, 238–258. [Google Scholar] [CrossRef] [Scilit]
- Mostofinejad, D.; Hosseini, S.M.; Nader Tehrani, B.; Eftekhar, M.R.; Dyari, M. Innovative warp and woof strap (WWS) method to anchor the FRP sheets in strengthened concrete beams. Constr. Build. Mater. 2019, 218, 351–364. [Google Scholar] [CrossRef] [Scilit]
- Eslami, A.; Shayegh, H.R.; Moghavem, A.; Ronagh, H.R. Experimental and analytical investigations of a novel end anchorage for CFRP flexural retrofits. Compos. Part B Eng. 2019, 176, 107309. [Google Scholar] [CrossRef] [Scilit]
- Al-Mahaidi, R.; Kalfat, R. Investigation into CFRP laminate anchorage systems utilising bi-directional fabric wrap. Compos. Struct. 2011, 93, 1265–1274. [Google Scholar] [CrossRef] [Scilit]
- Al-Atta, B.; Kalfat, R.; Al-Mahaidi, R.; Al-Mosawe, A. Influence of anchorage systems on externally-bonded CFRP sheets used for flexural strengthening. IOP Conf. Ser. Mater. Sci. Eng. 2020, 671, 012105. [Google Scholar] [CrossRef] [Scilit]
- Kim, S.J.; Smith, S.T. Pullout strength models for FRP anchors in uncracked concrete. J. Compos. Constr. 2010, 14, 406–414. [Google Scholar] [CrossRef] [Scilit]
- Al-Mahaidi, R.; Kalfat, R. Investigation into CFRP plate end anchorage utilising uni-directional fabric wrap. Compos. Struct. 2011, 93, 821–830. [Google Scholar] [CrossRef] [Scilit]
- Sika. Sikadur®-330 Product Data Sheet; Version 06.01; Sika: Baar, Switzerland, 2025. [Google Scholar]
- Sika. SikaWrap®-300 C Product Data Sheet; Version 01.03; Sika: Baar, Switzerland, 2023. [Google Scholar]
- Azizi, R.; Talaeitaba, S.B. Punching shear strengthening of flat slabs with CFRP on grooves (EBROG) and external rebars sticking in grooves. Int. J. Adv. Struct. Eng. 2019, 11, 79–95. [Google Scholar] [CrossRef] [Scilit]
- Comité Euro-International du Béton (CEB); Fédération Internationale de la Précontrainte (FIP). CEB-FIP Model Code 1990: Design Code; CEB Bulletin Nos. 213/214; Thomas Telford: London, UK, 1993. [Google Scholar]
- Al-Atta, B.; Kalfat, R.; Al-Mahaidi, R. Numerical investigation into RC slabs strengthened using FRP and hybrid anchors. Structures 2023, 58, 105558. [Google Scholar] [CrossRef] [Scilit]
- Zhang, H.; Sun, X.; Wang, Y. Bond behavior of NSM FRP–concrete interfaces with epoxy adhesive under fatigue loading. Struct. Concr. 2026, 27, 2583–2600. [Google Scholar] [CrossRef] [Scilit]
- Hussain, Z.; Riaz, I.; Wang, X.; Lin, Z.; Nie, W.; Huang, Y. Corrosion-protective nanoclay reinforced epoxy coating for structural applications: Mechanics and molecular dynamics. Constr. Build. Mater. 2026, 526, 146330. [Google Scholar] [CrossRef] [Scilit]
- Kalfat, R.; Al-Mahaidi, R. Finite element investigation into the size effect of bidirectional fibre patch anchors used to enhance the performance of FRP-to-concrete joints. Compos. Struct. 2015, 121, 27–36. [Google Scholar] [CrossRef] [Scilit]
- Kalfat, R.; Jumaah, R.; Al-Mahaidi, R.; Abdouka, K.; Hashemi, J. Post-Tensioned Concrete Beams Strengthened in Shear Using Fiber-Reinforced Polymer Laminates and Patch Anchors. J. Compos. Constr. 2020, 24, 04019065. [Google Scholar] [CrossRef] [Scilit]
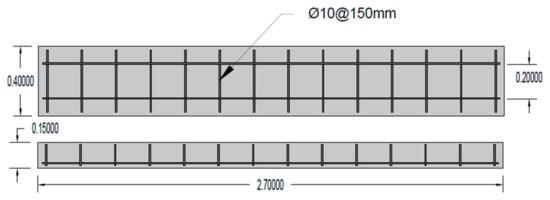
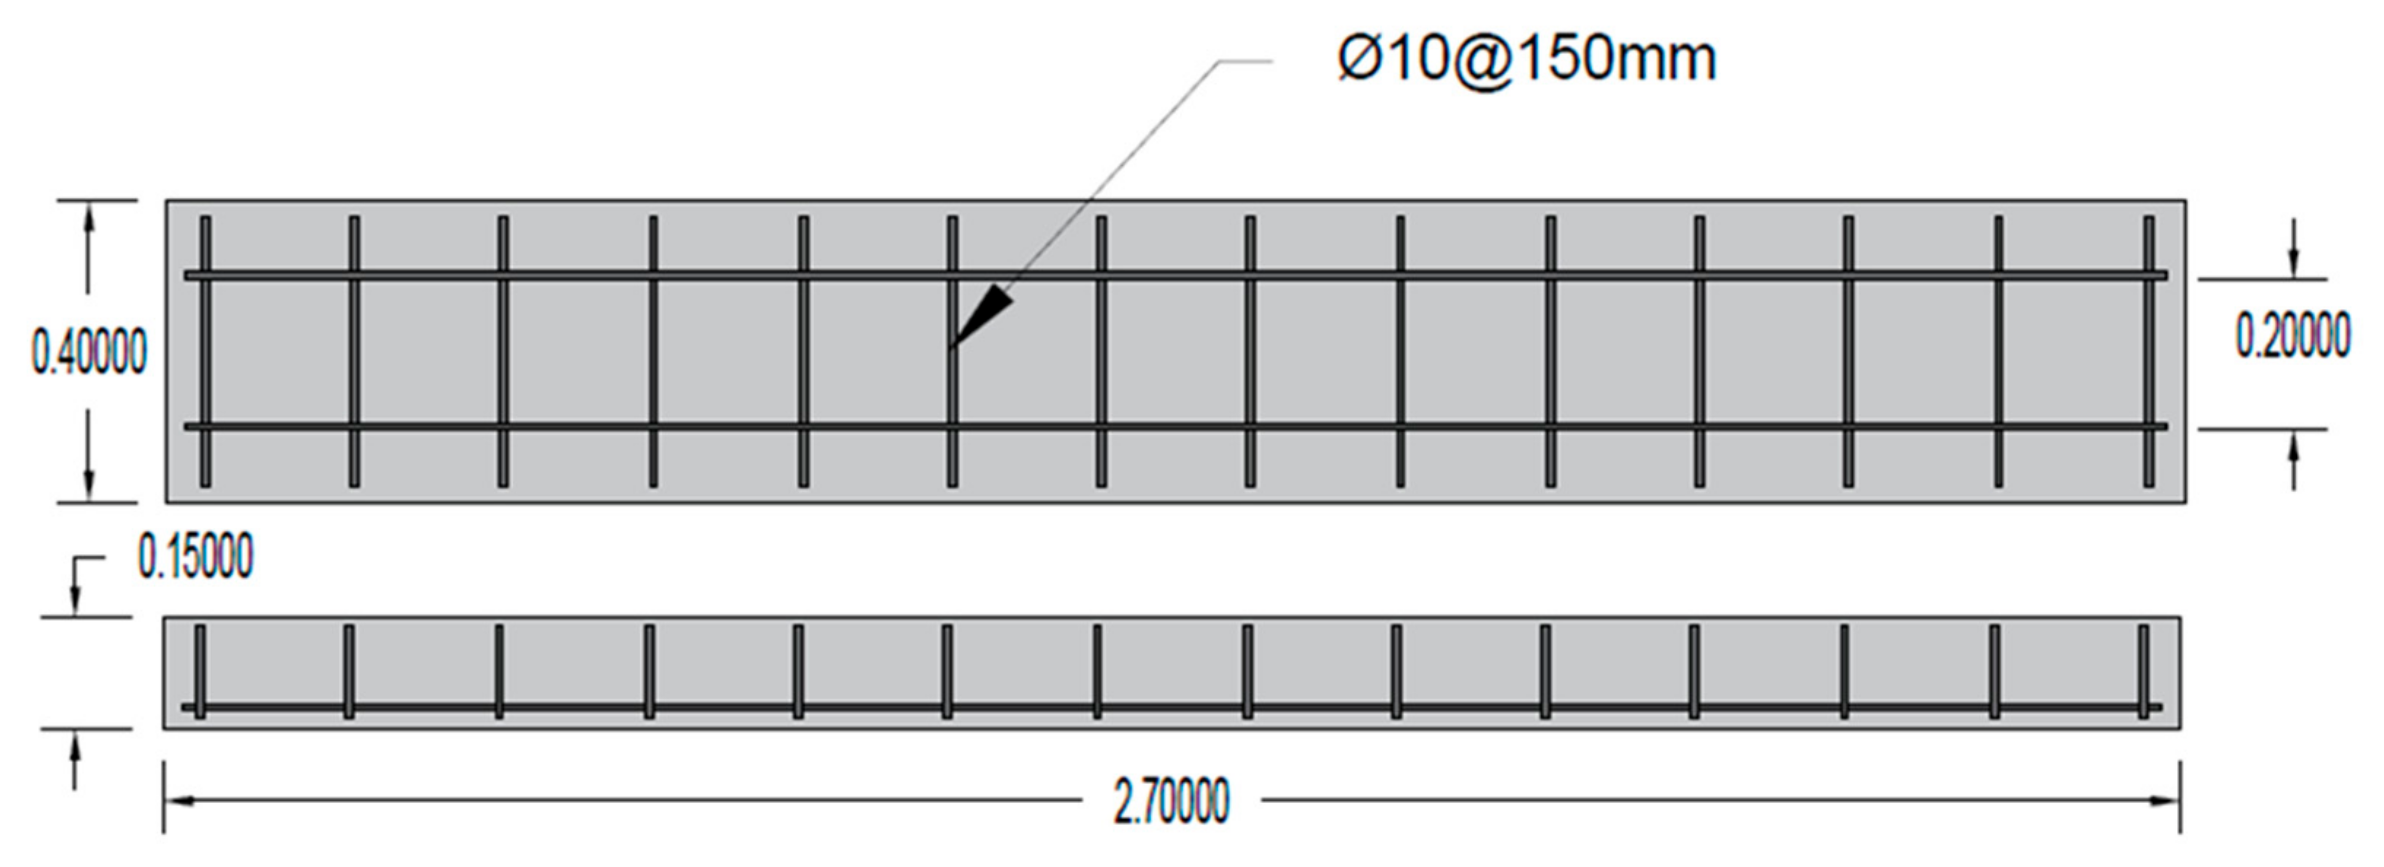
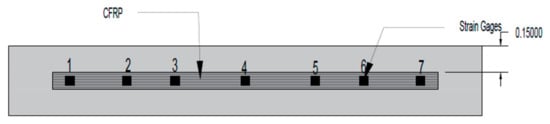
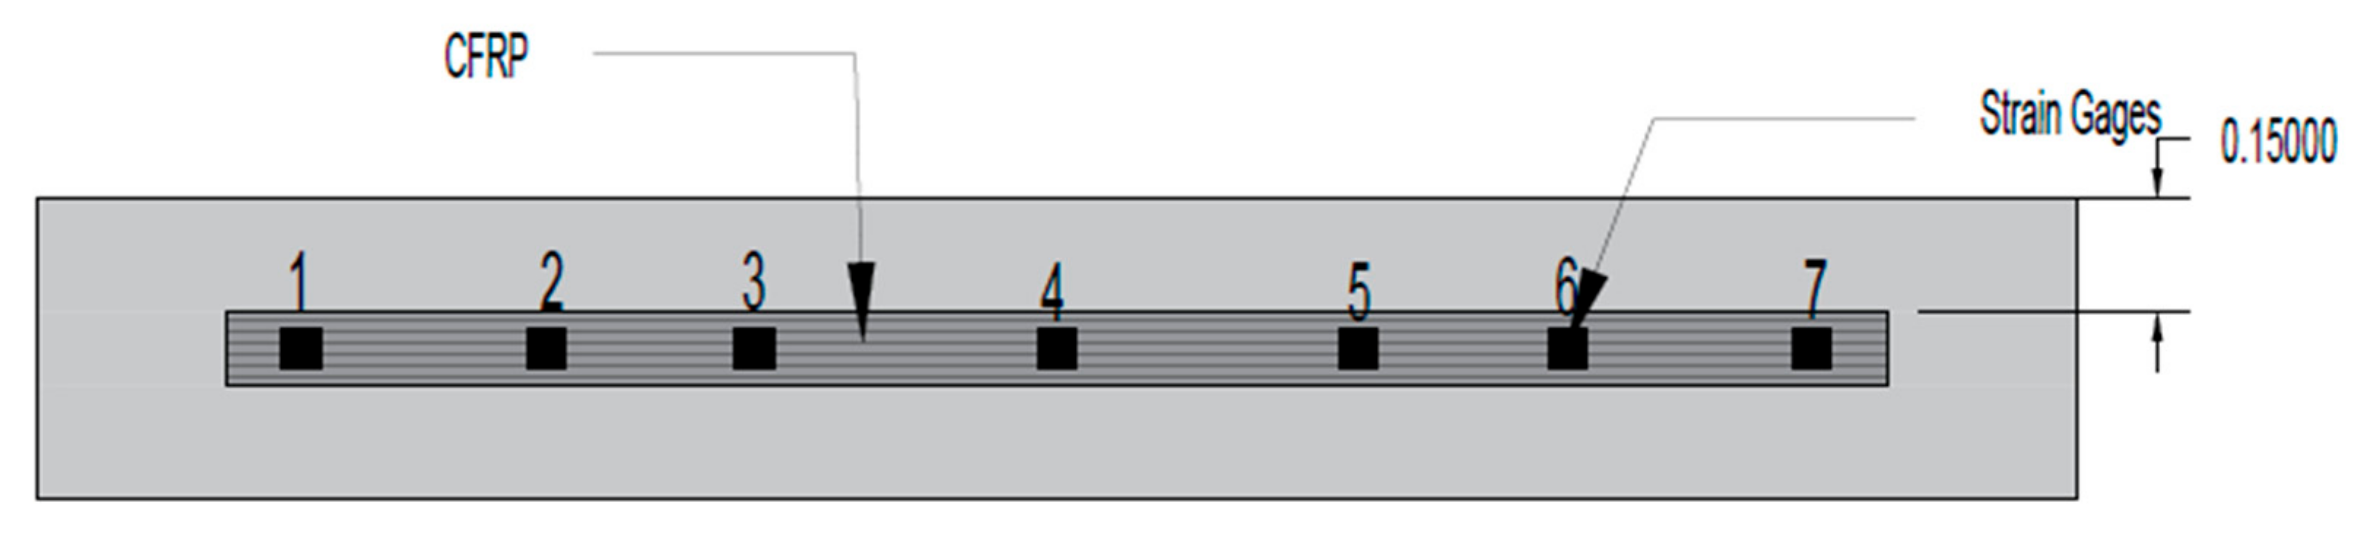
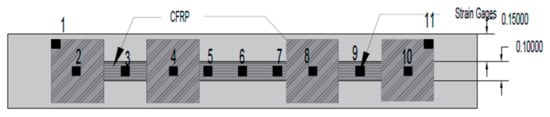
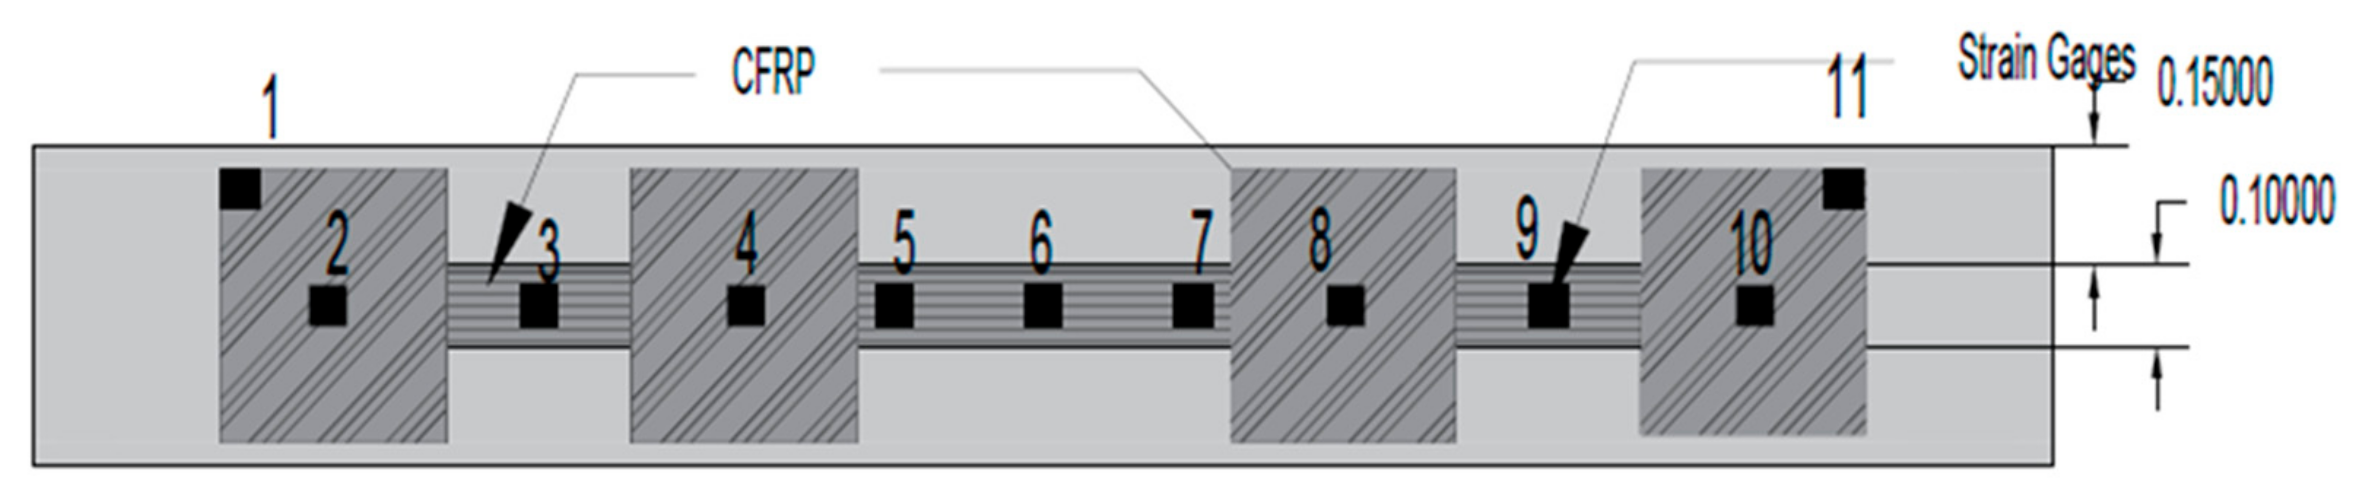
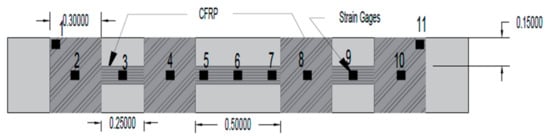
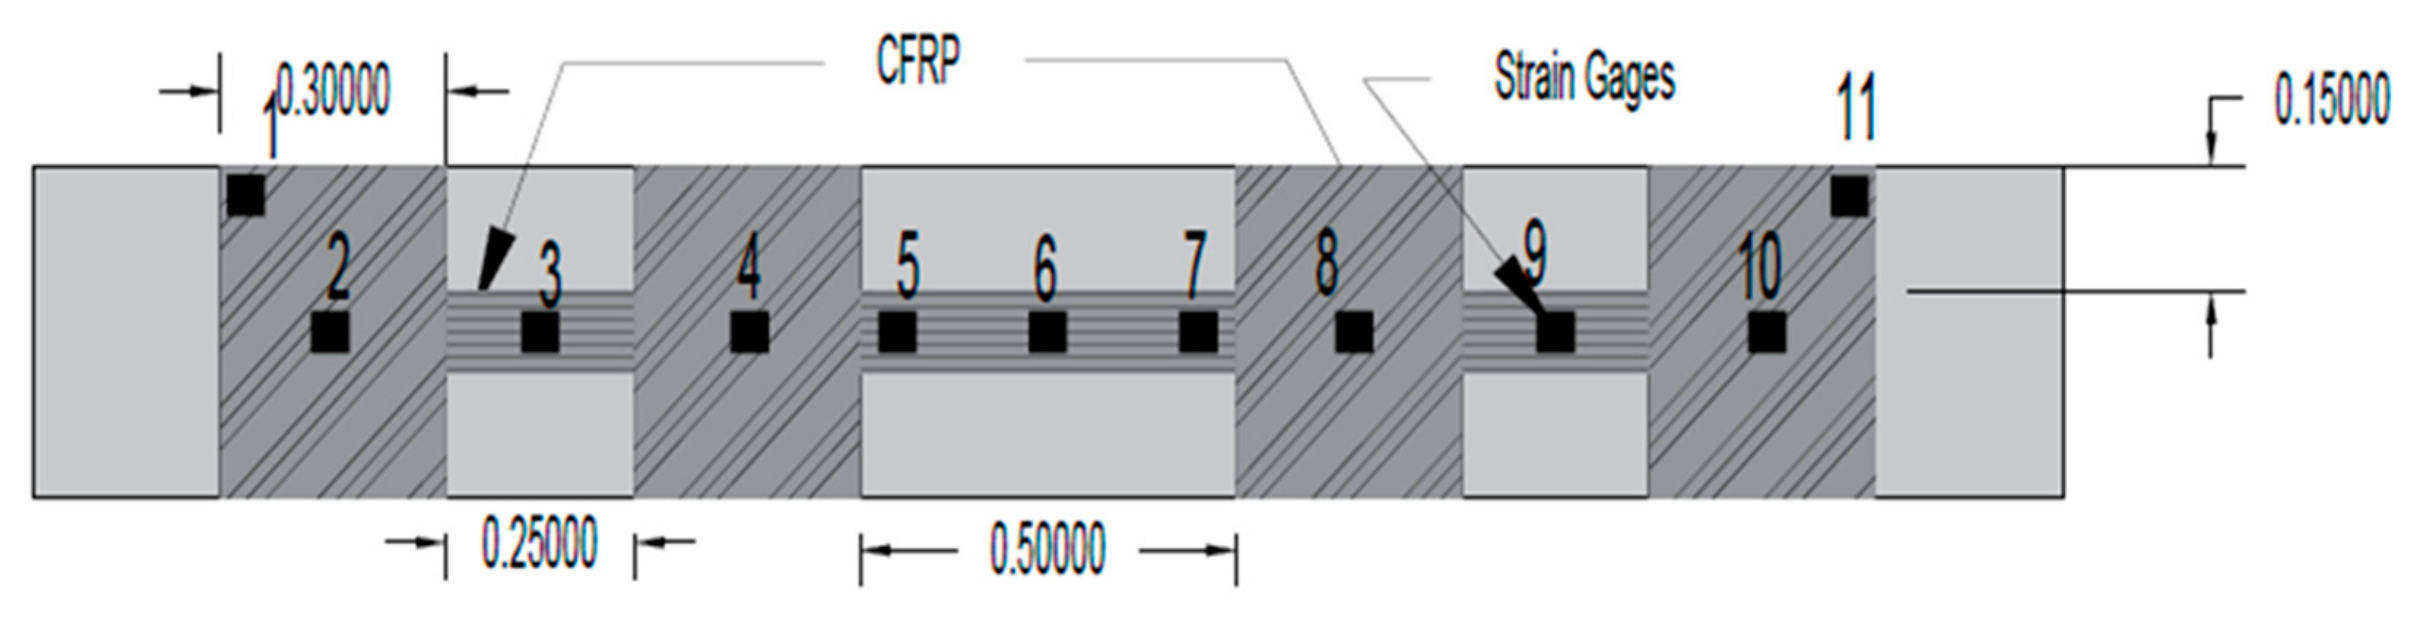
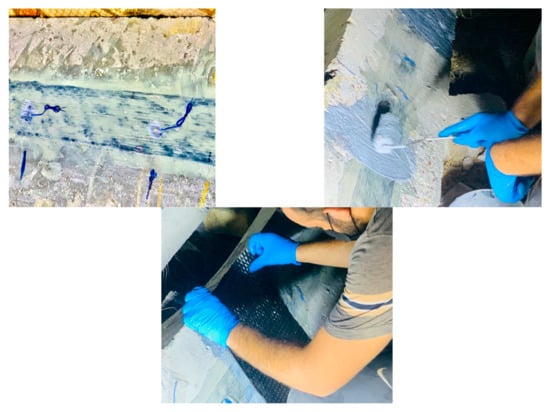
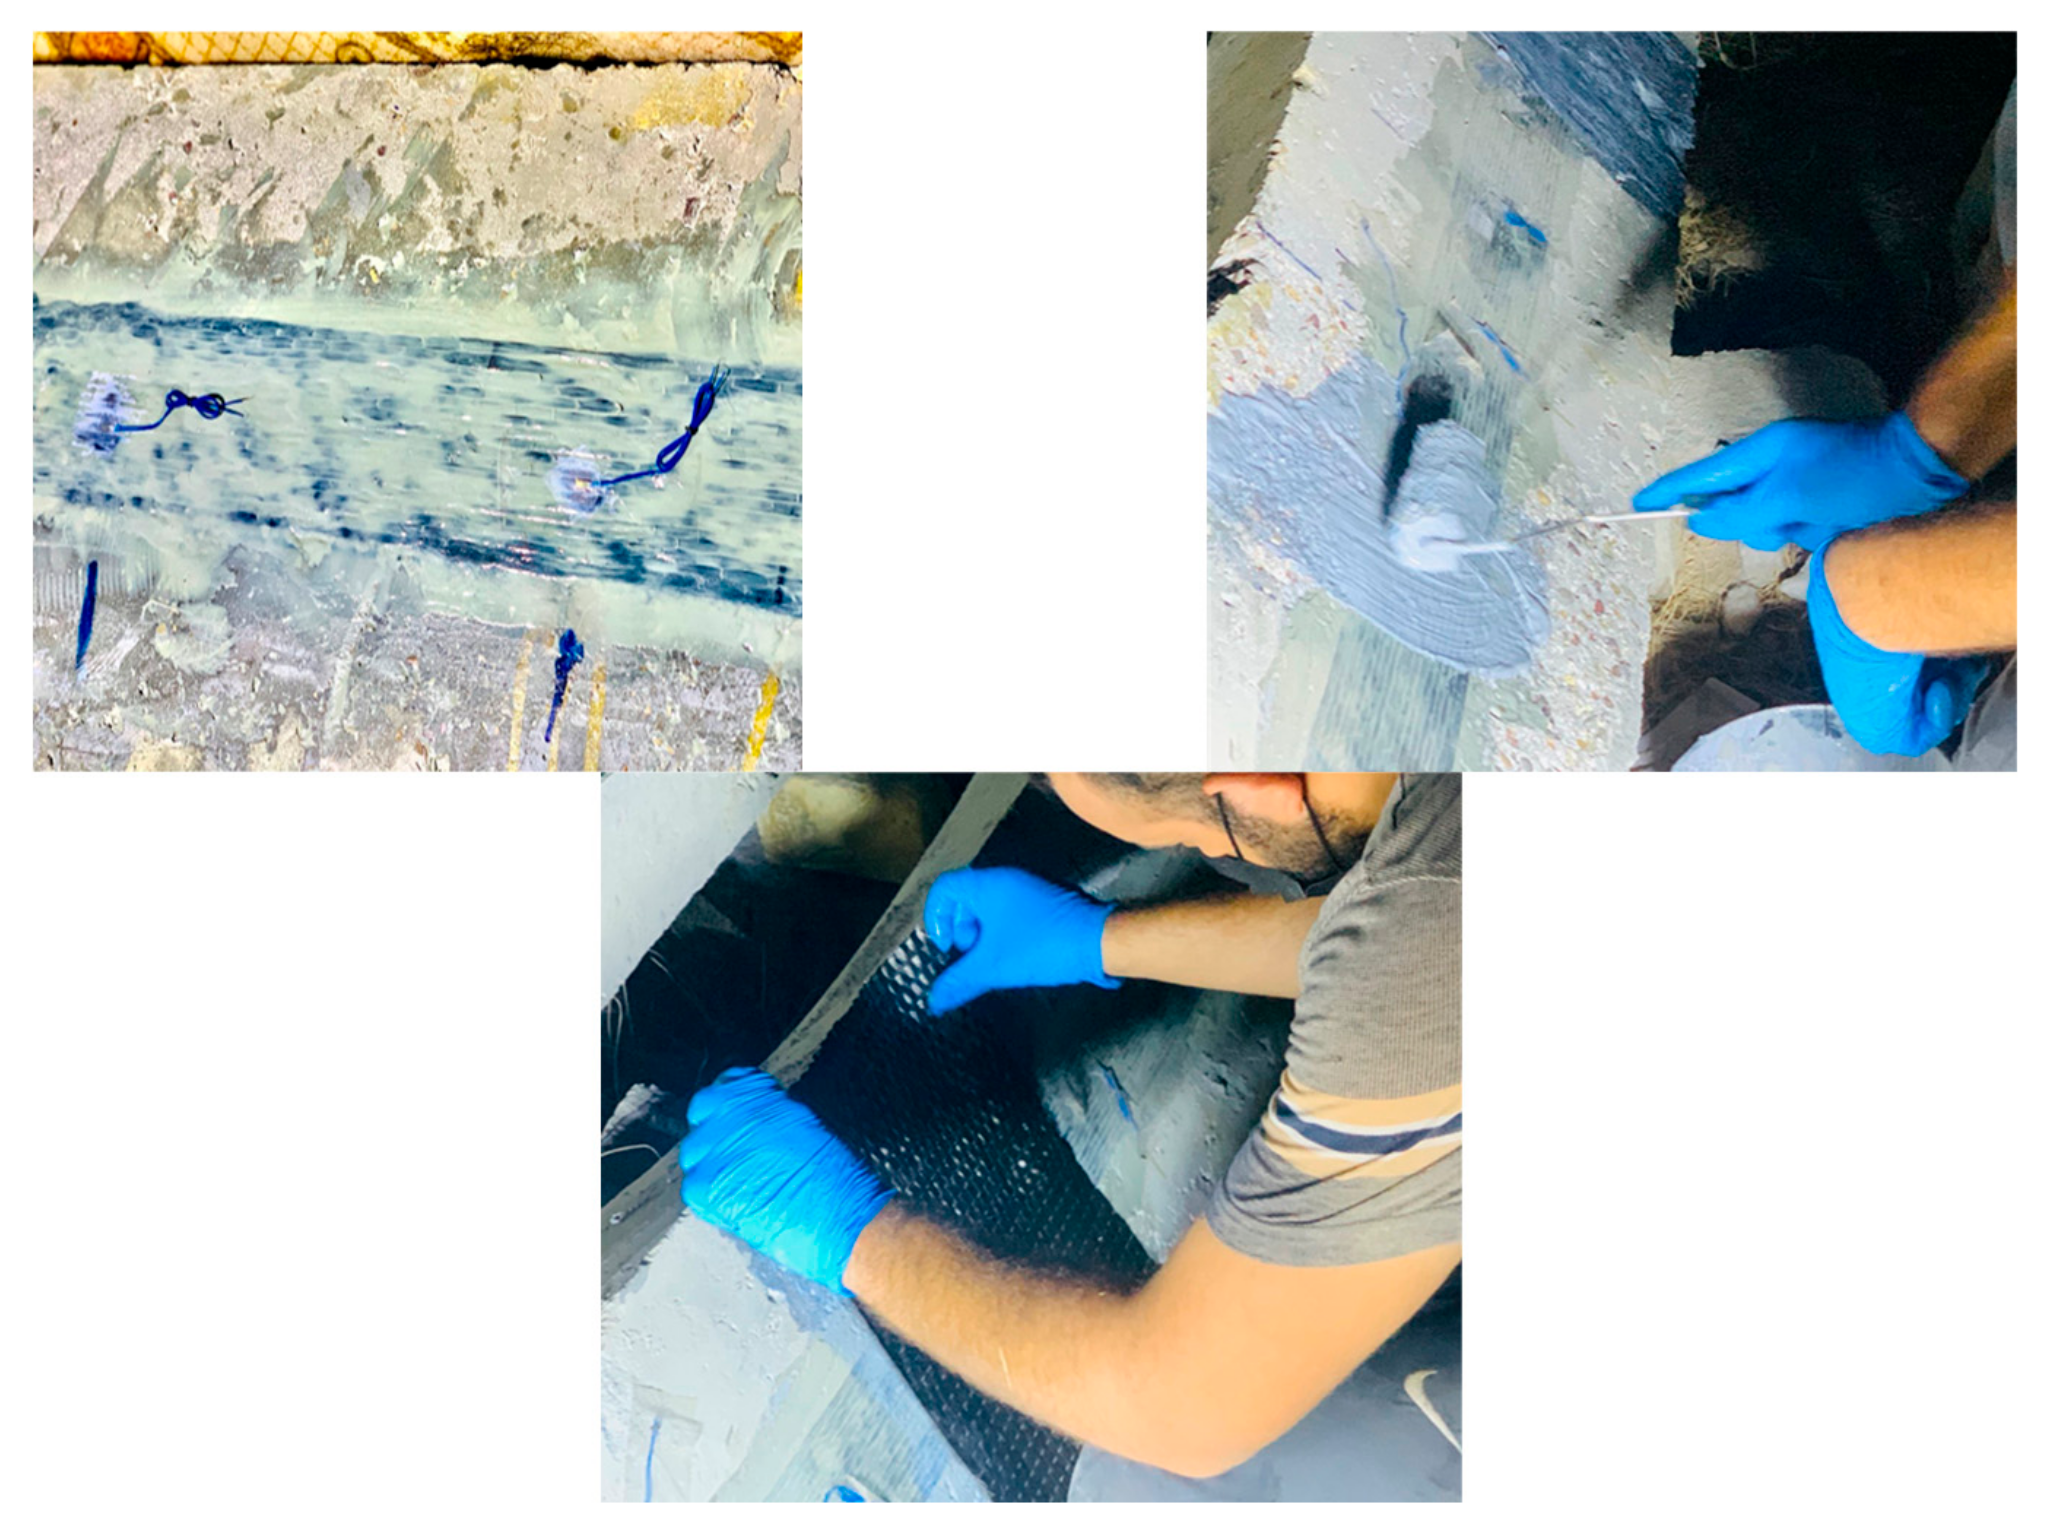
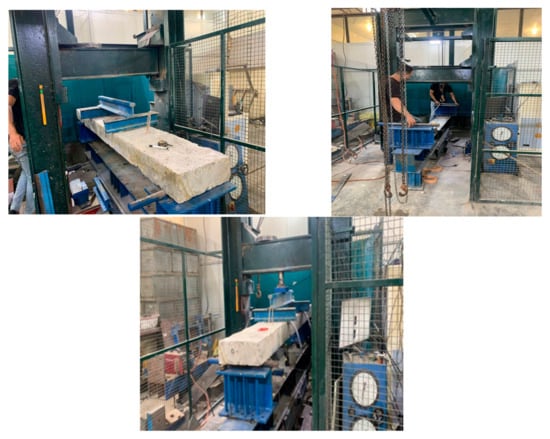
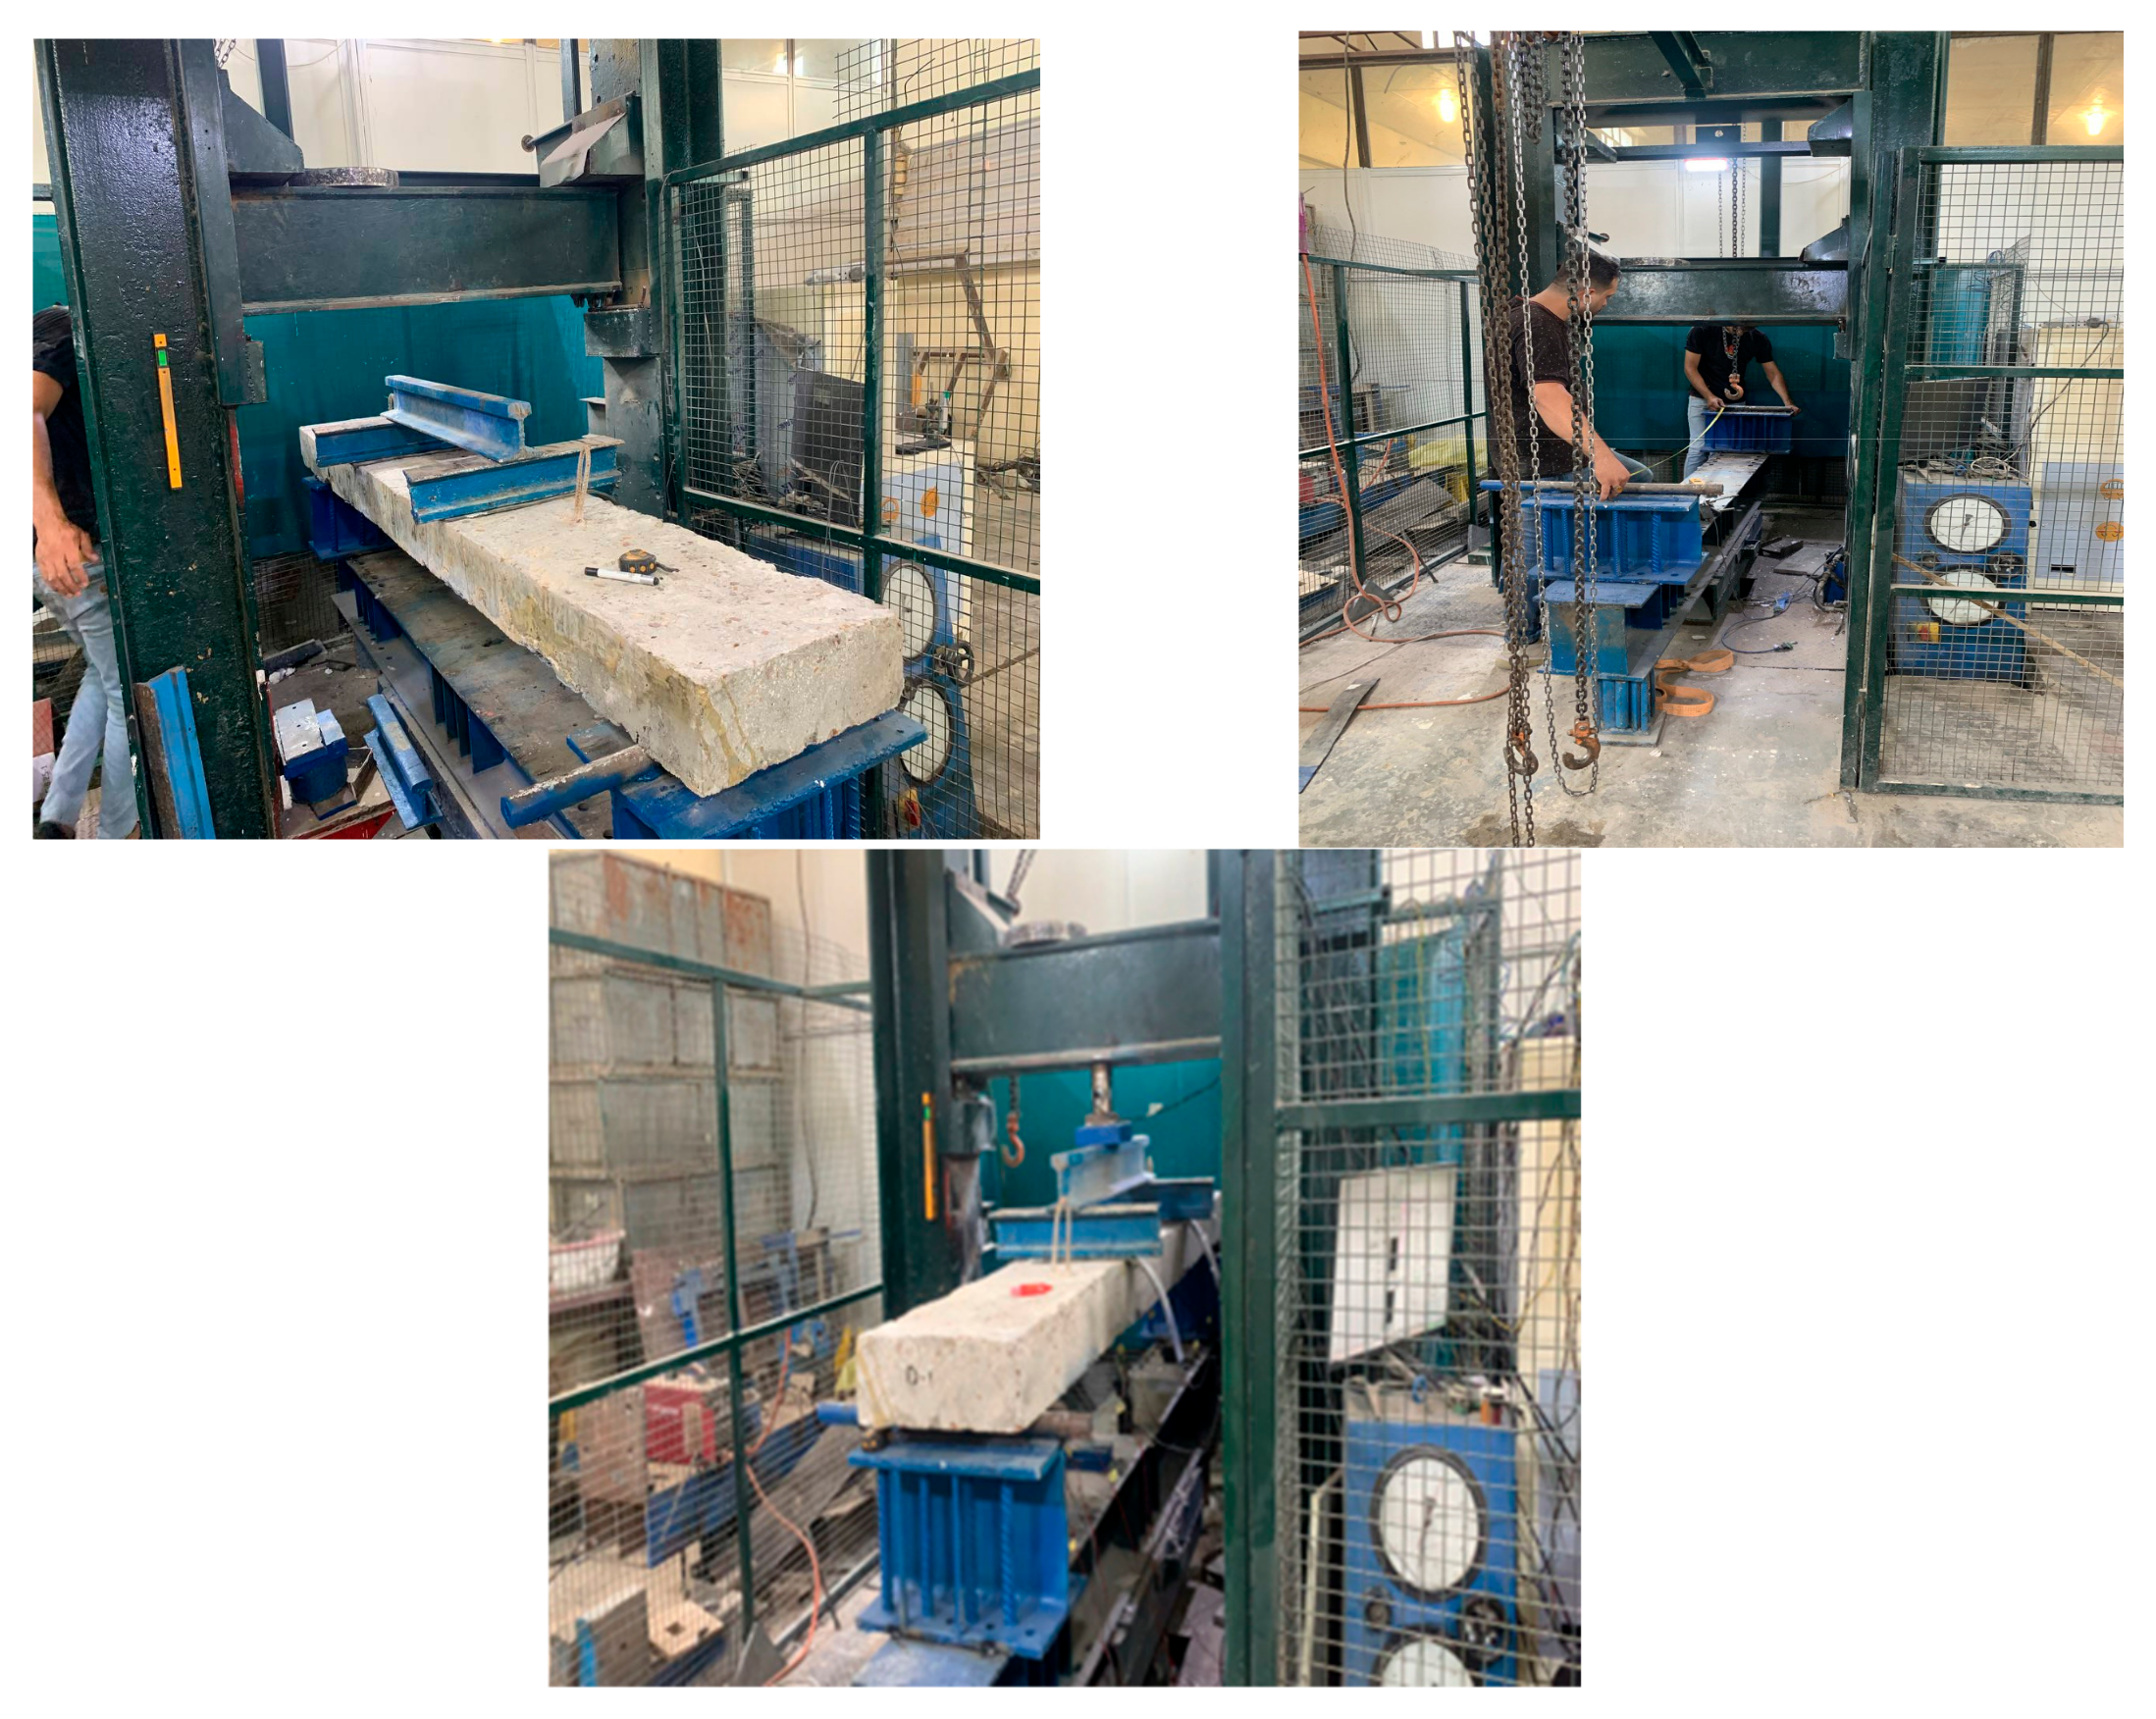
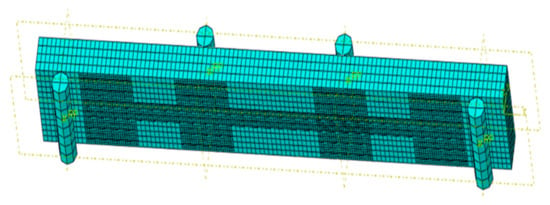
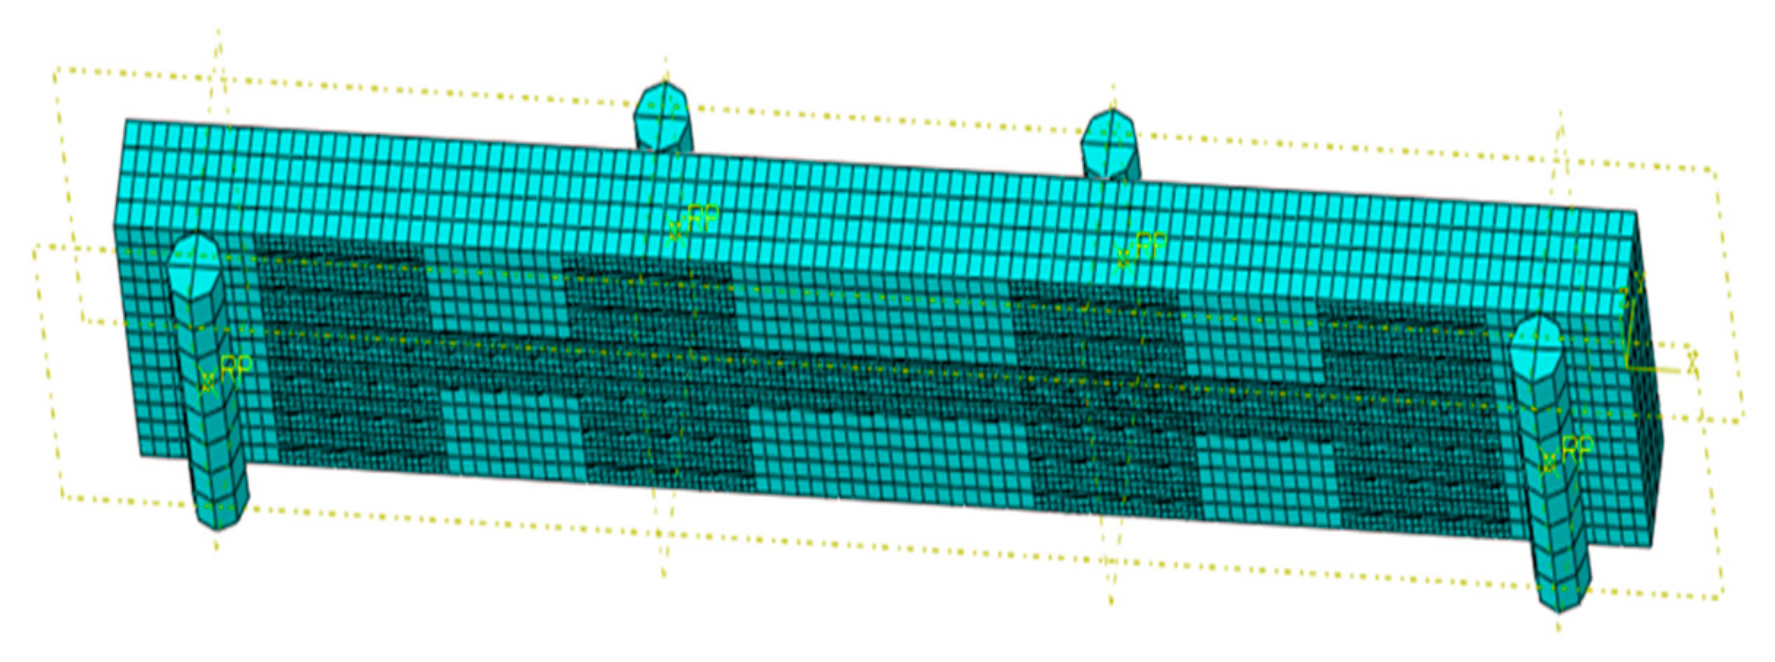
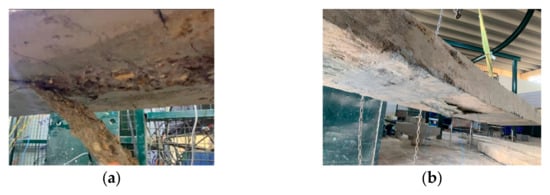
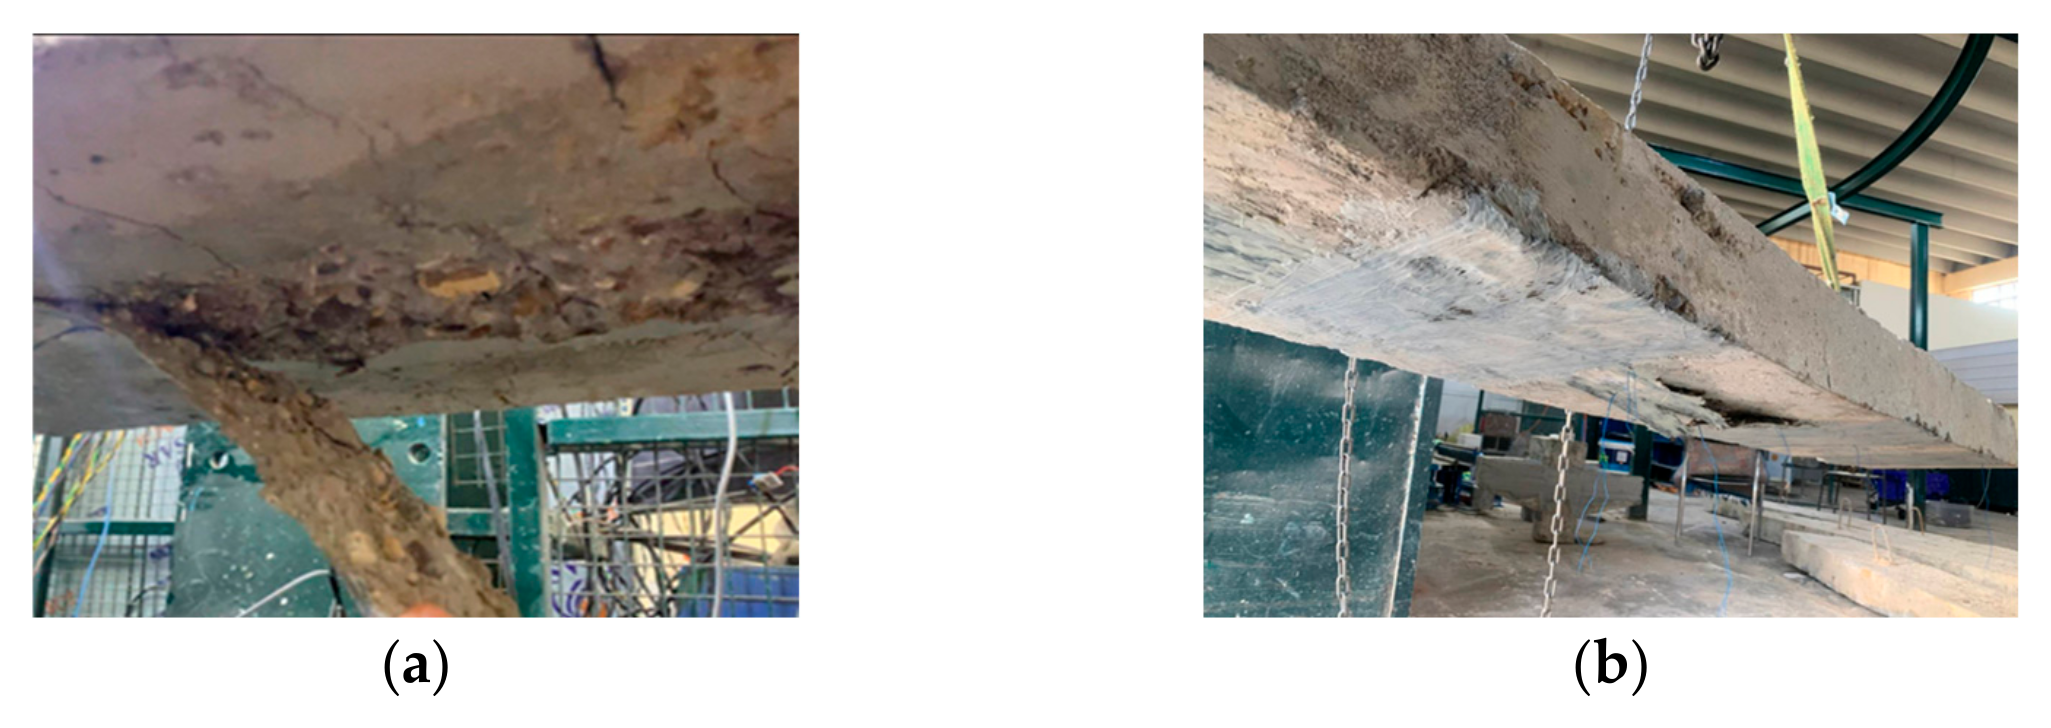
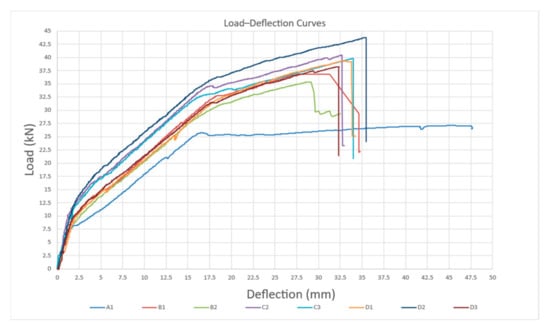
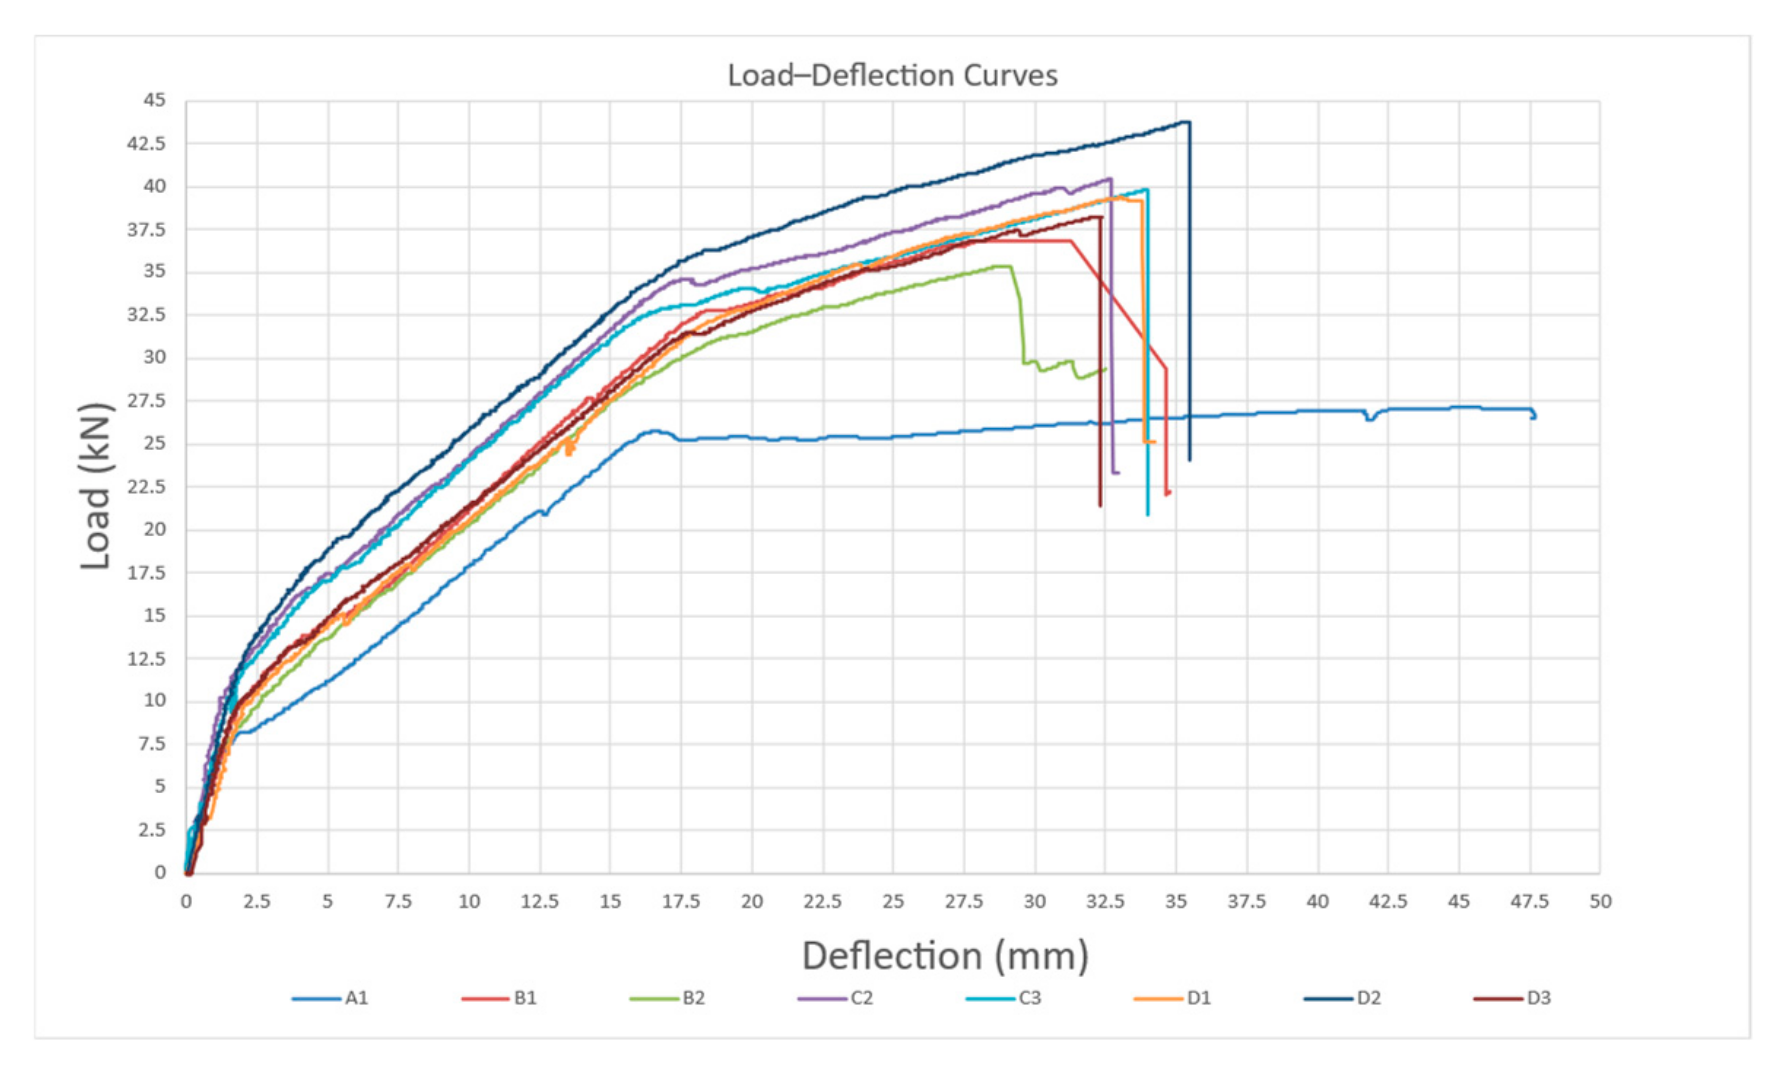
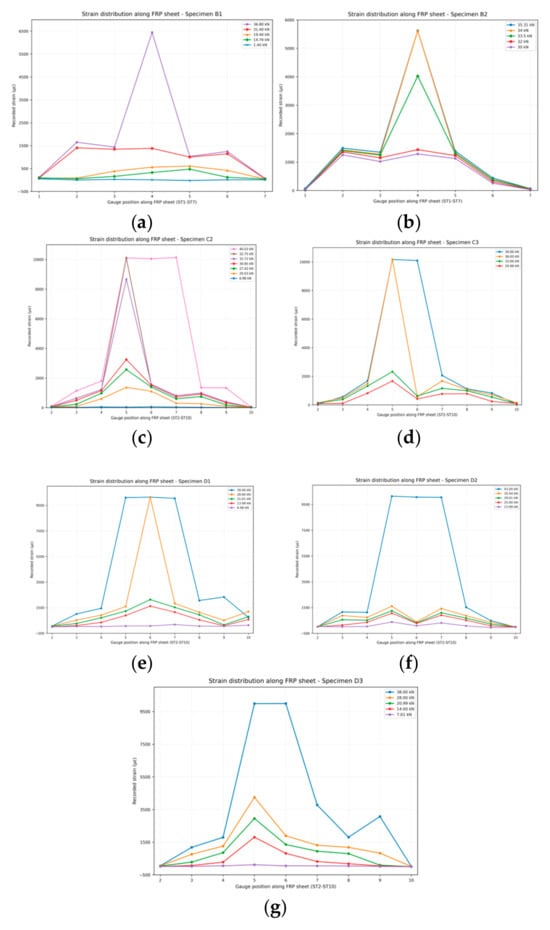
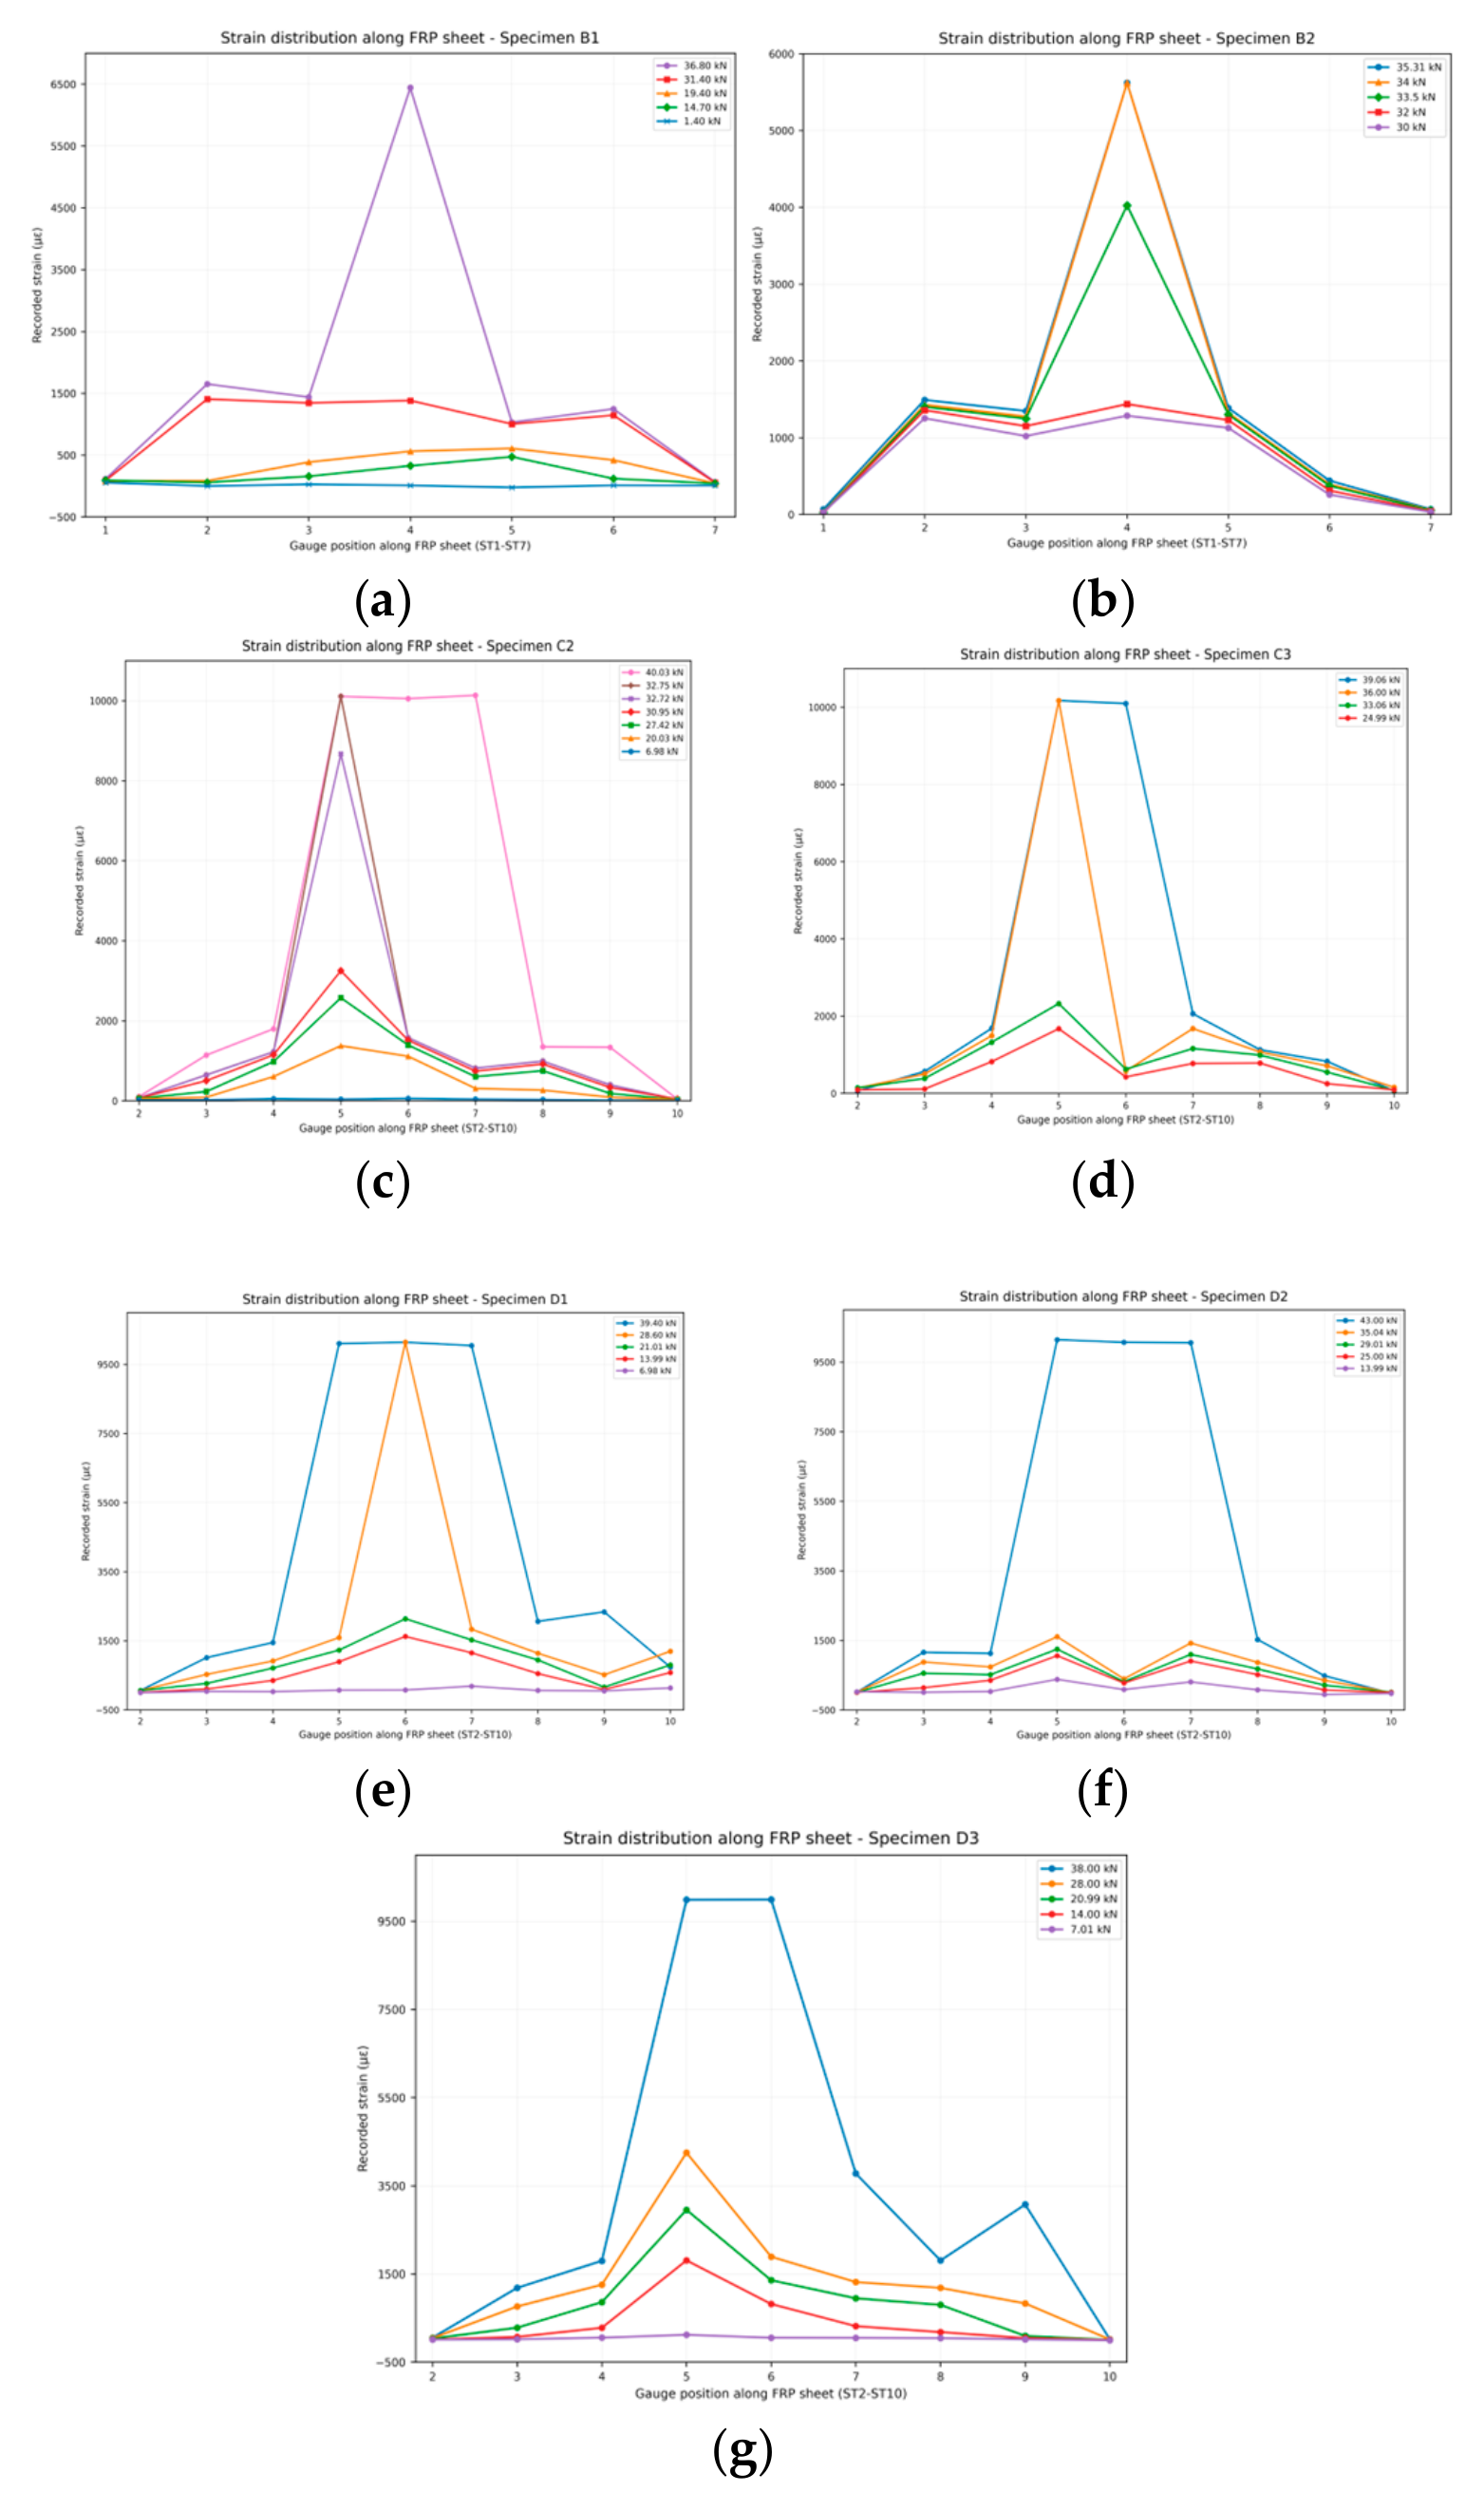
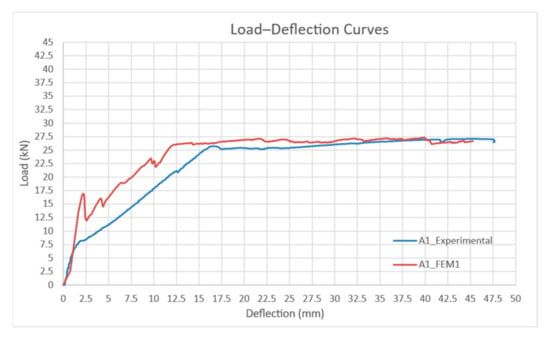
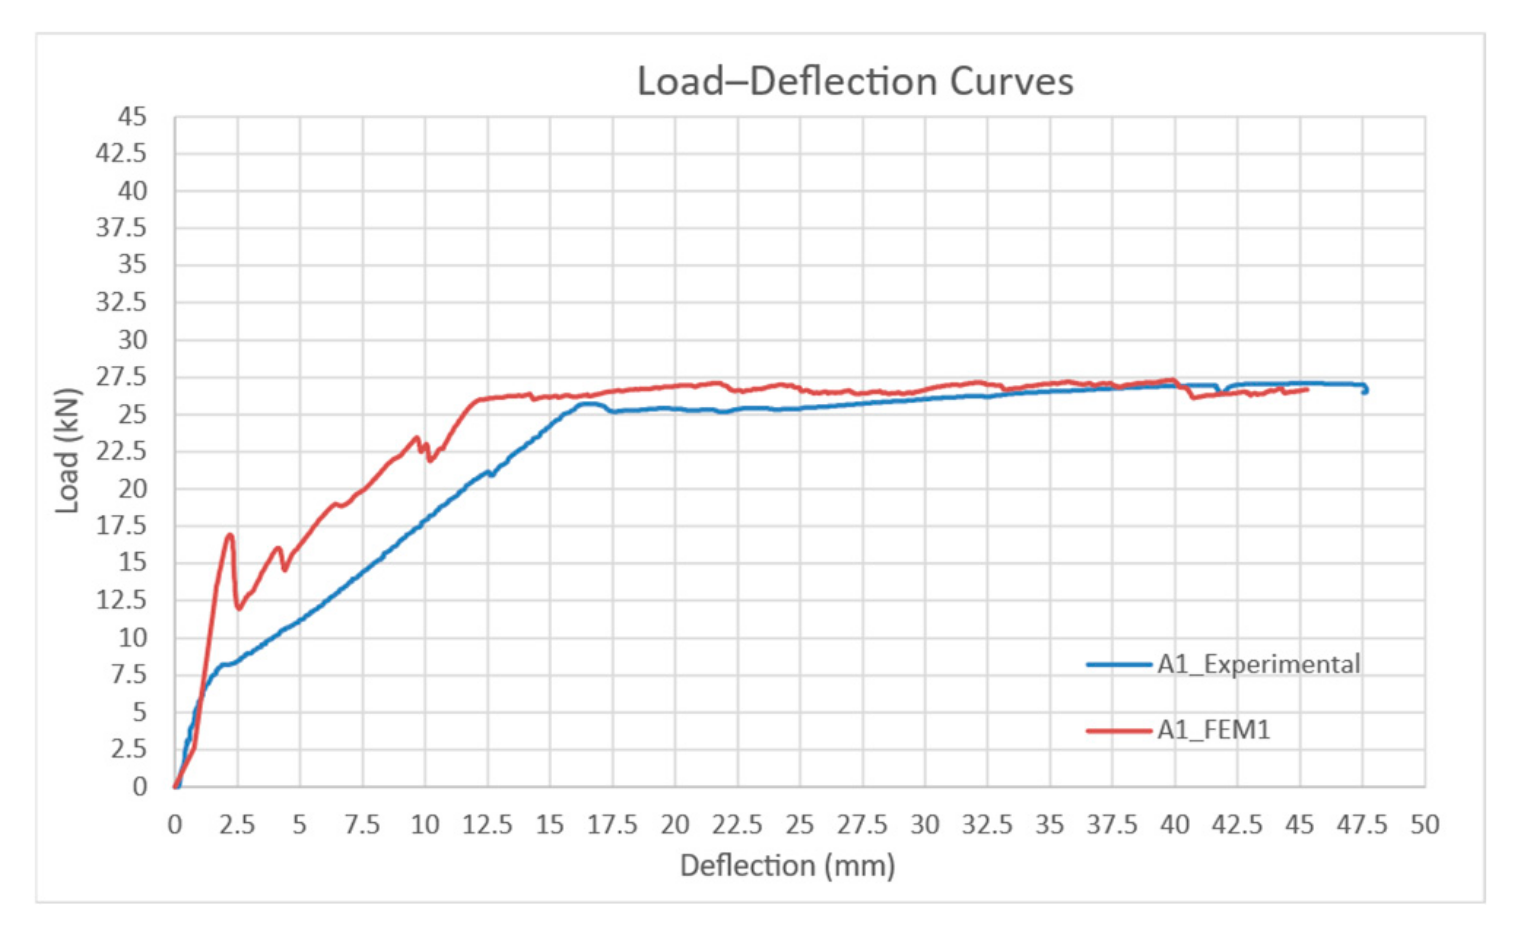
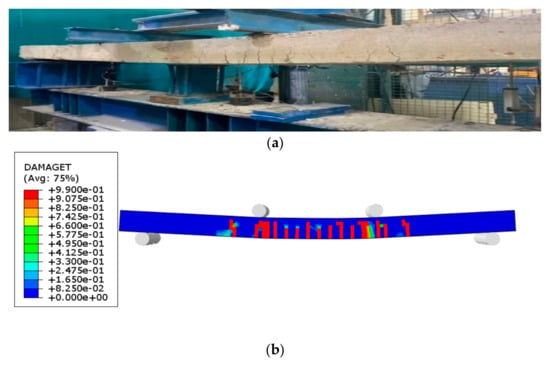
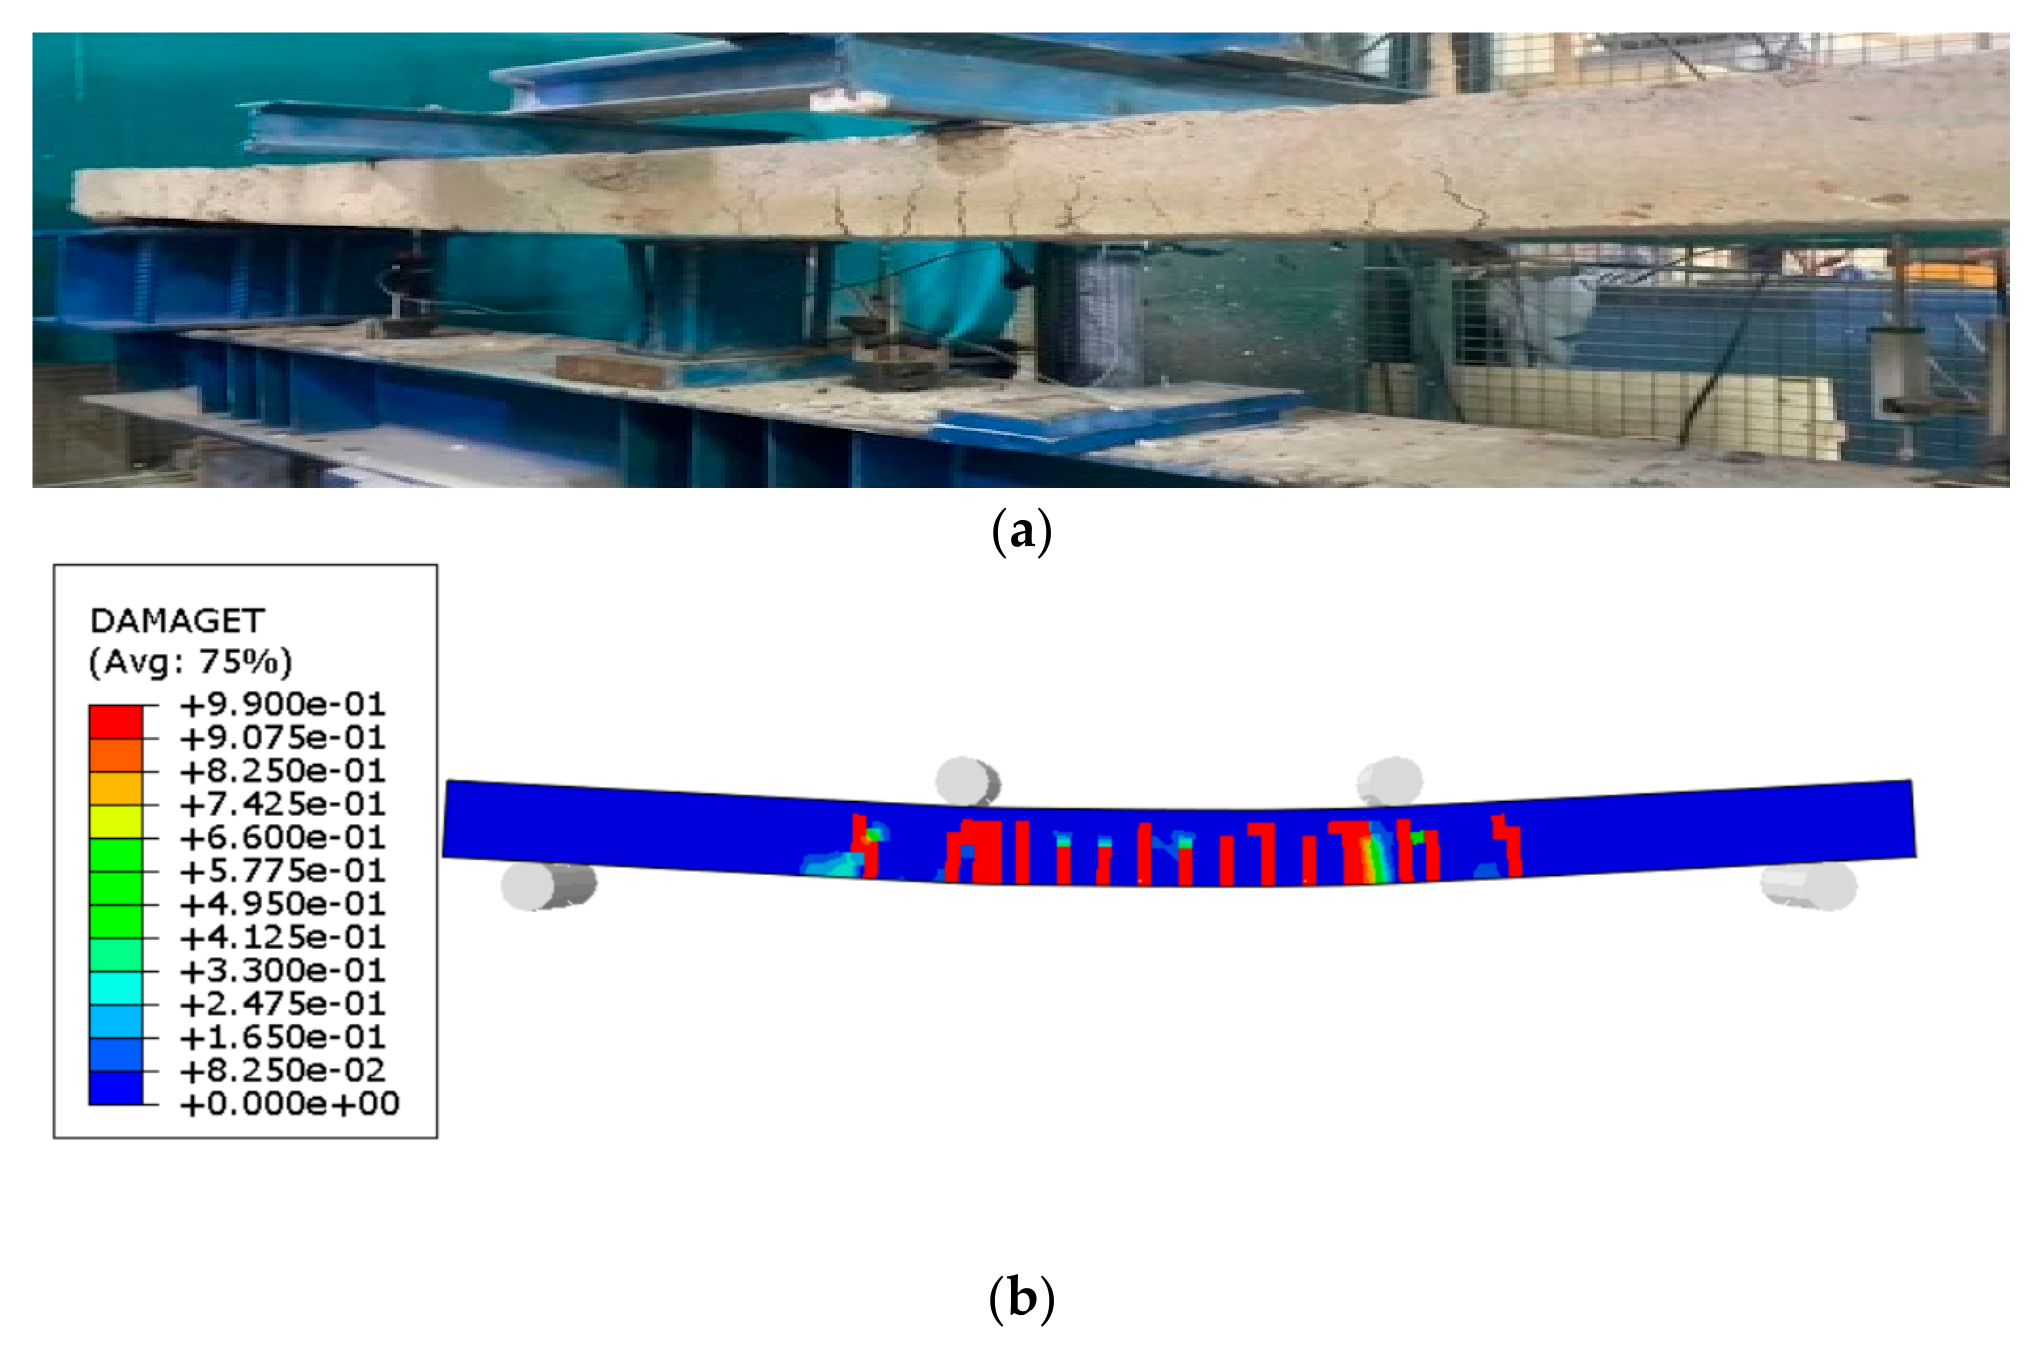
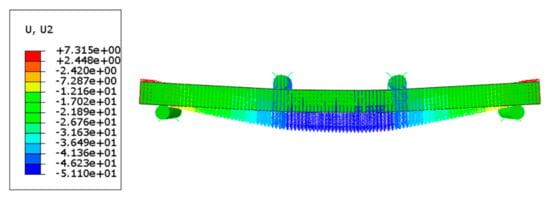
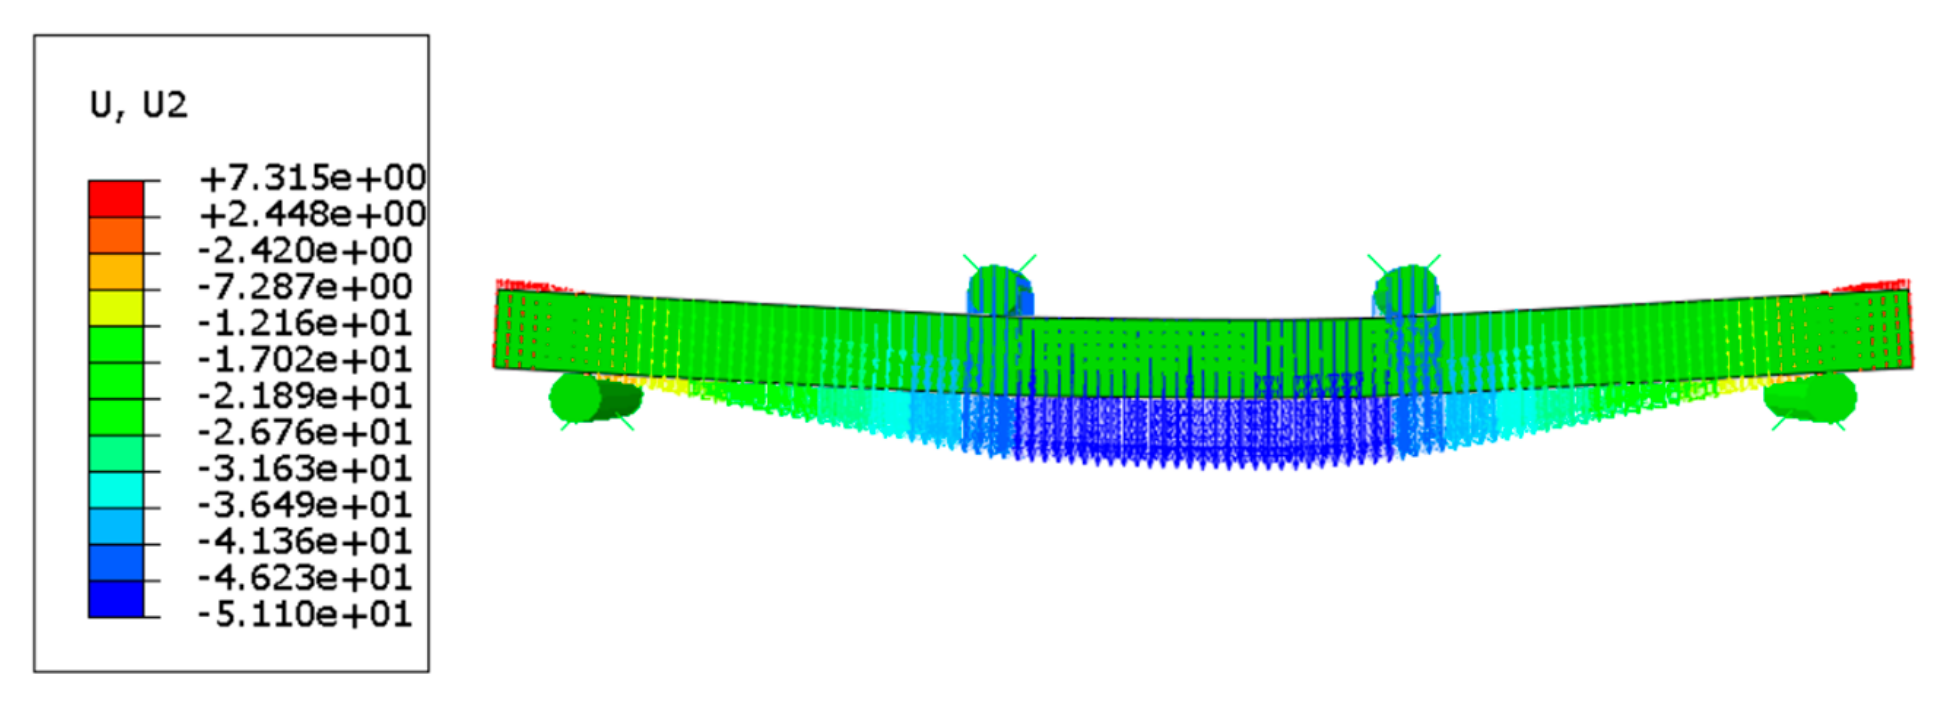
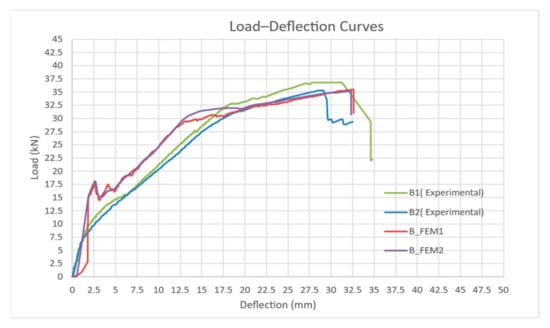
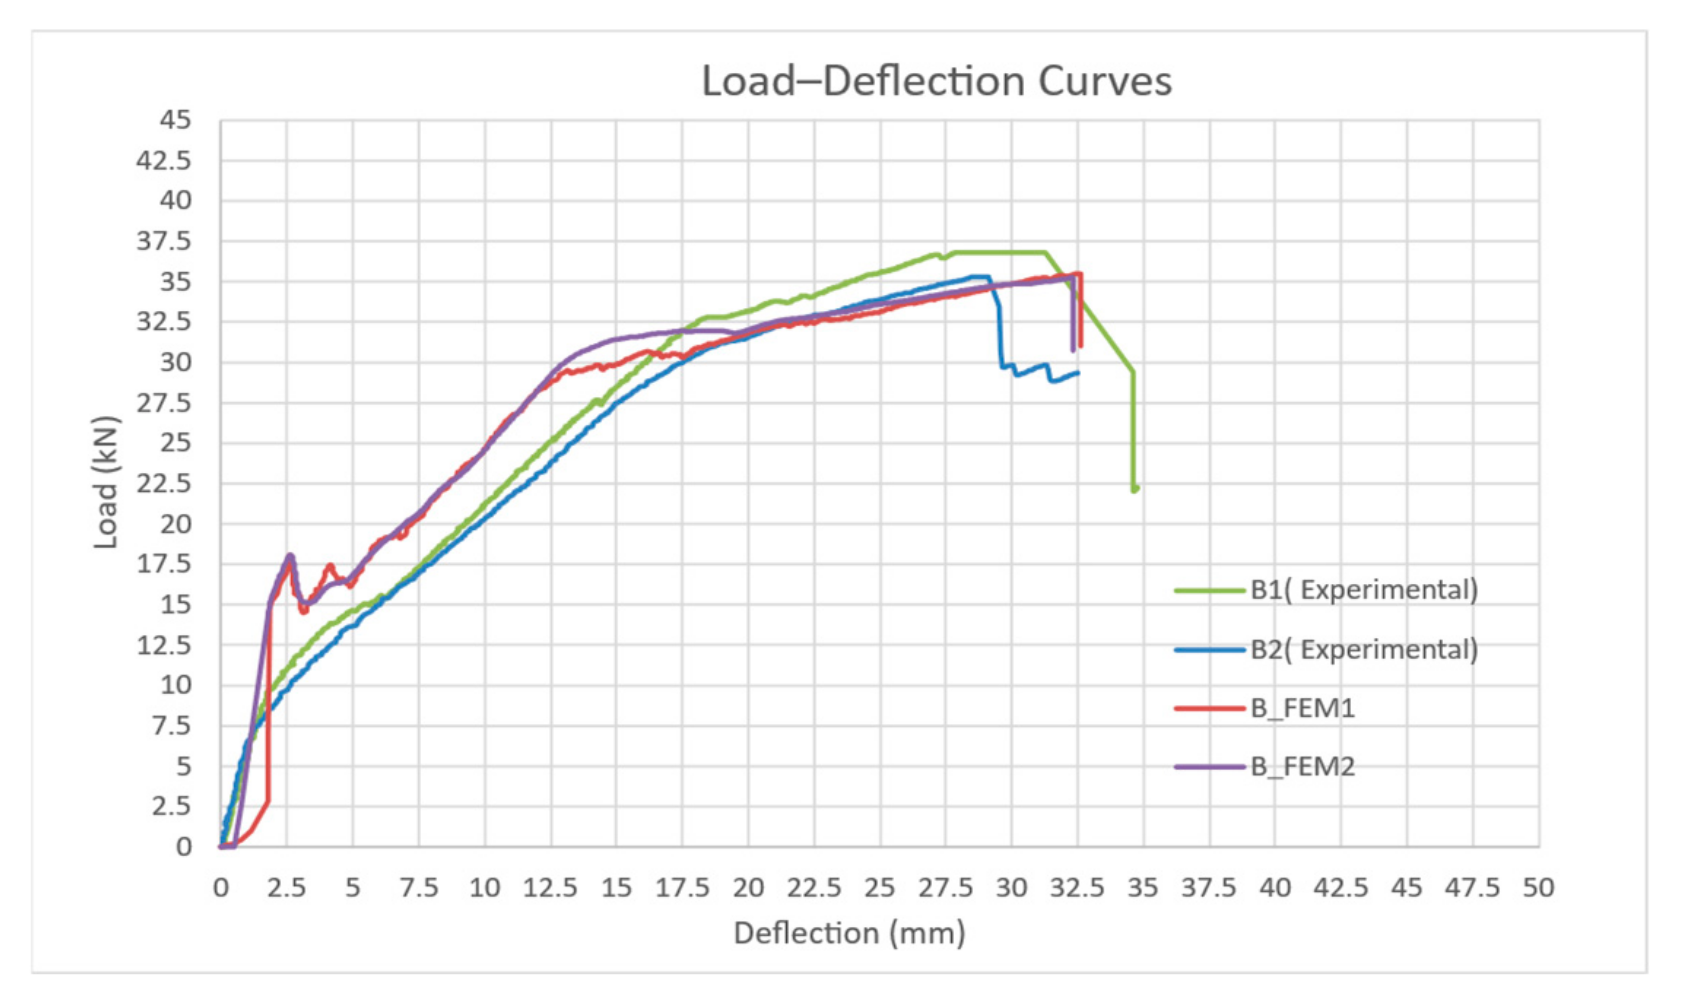
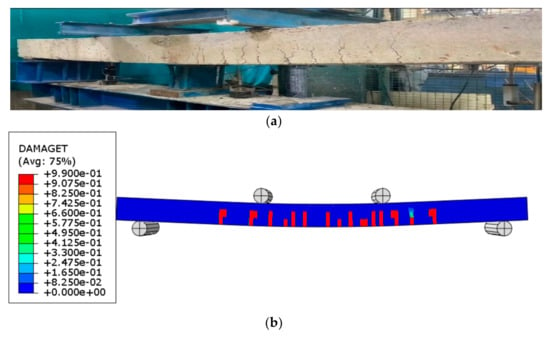
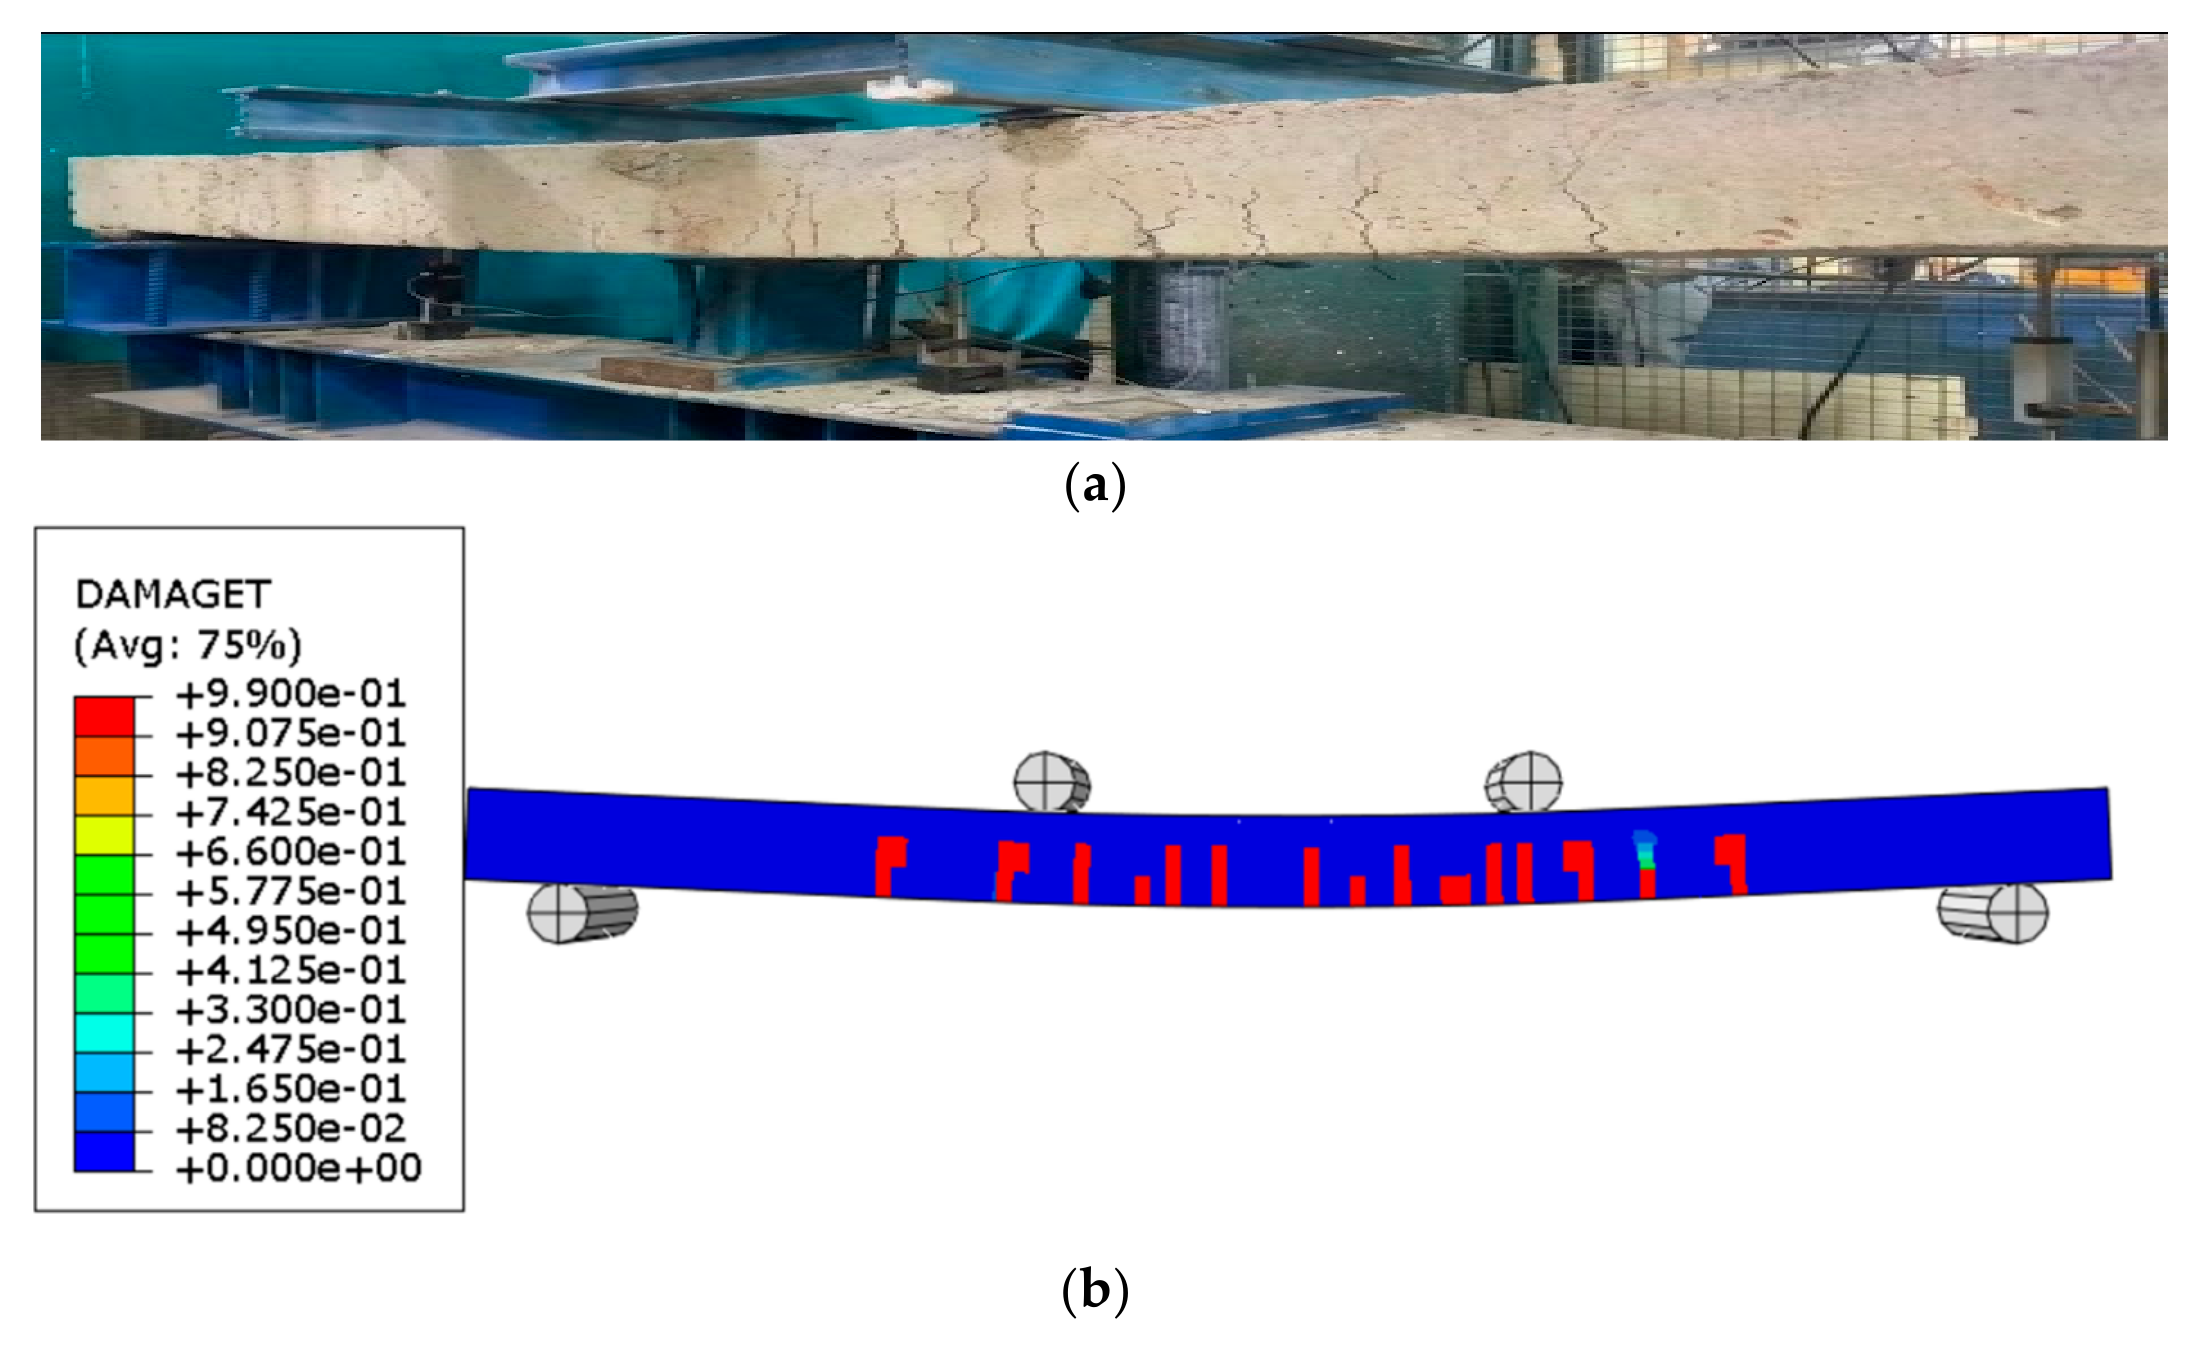
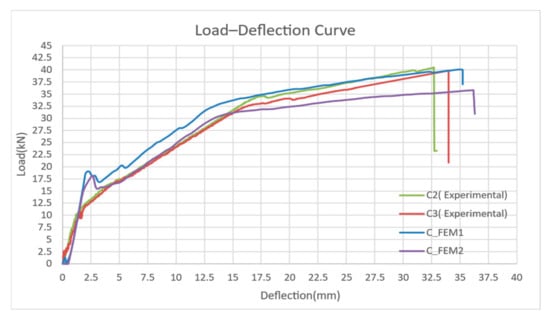
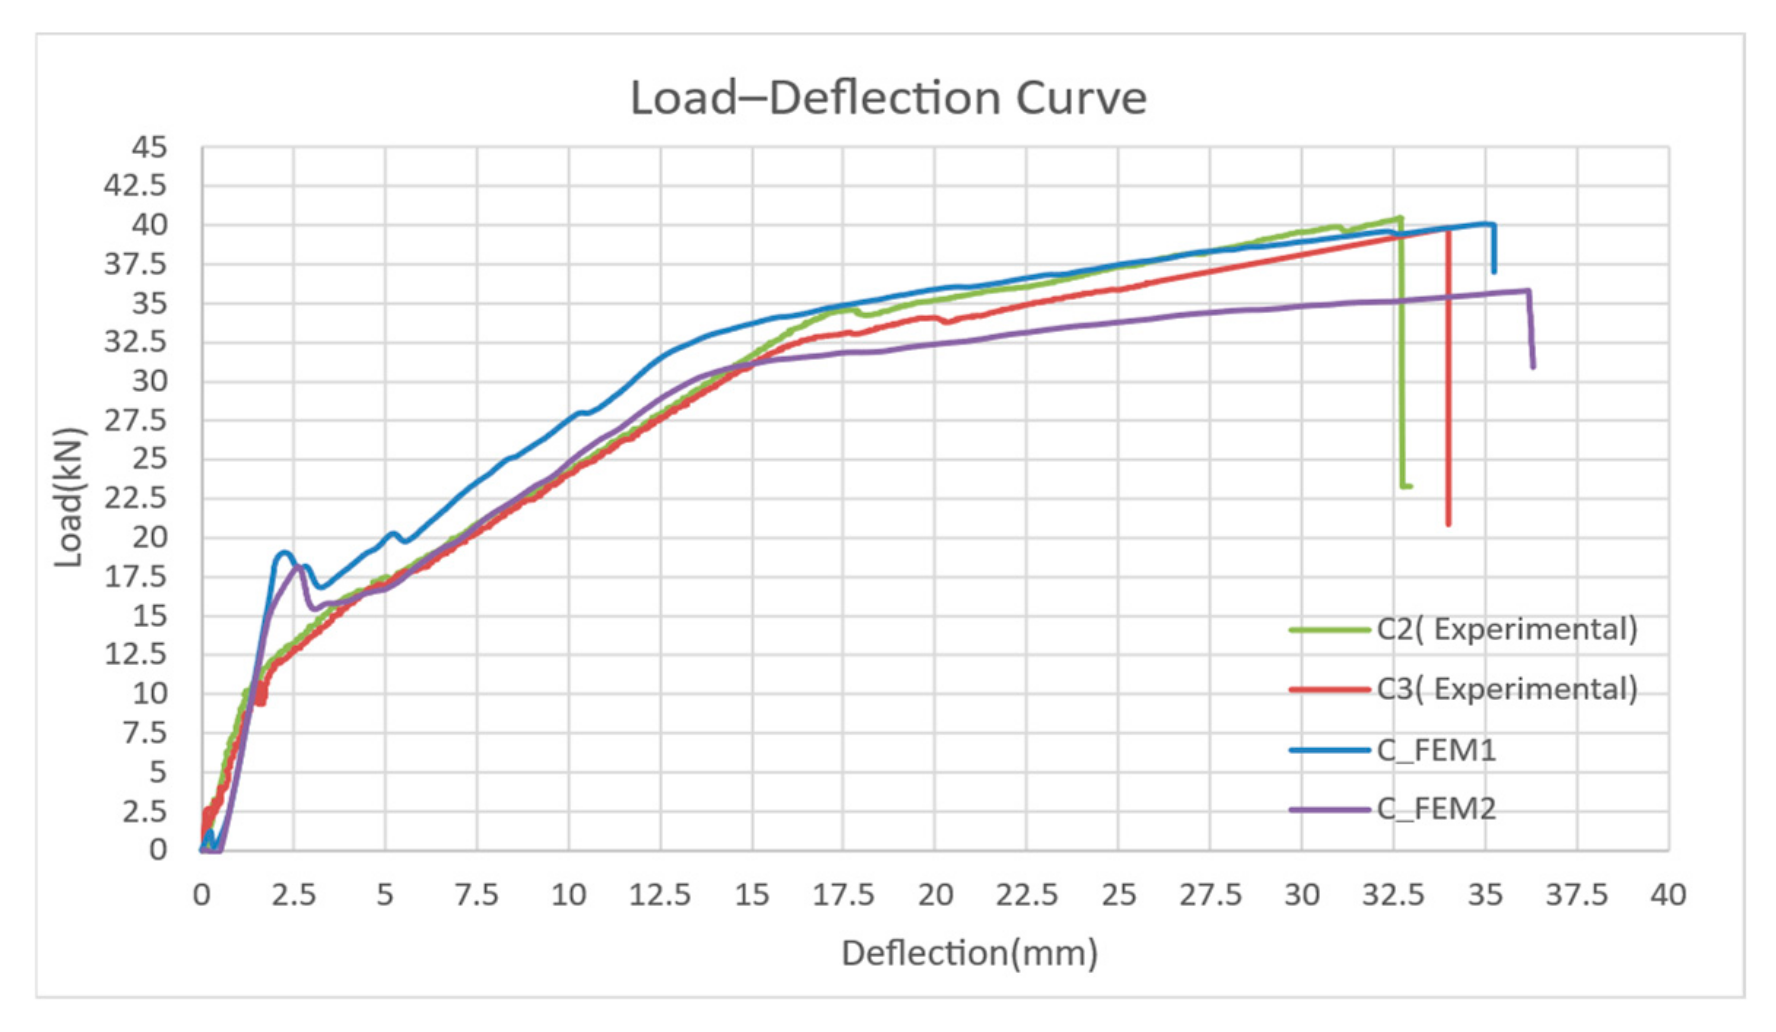
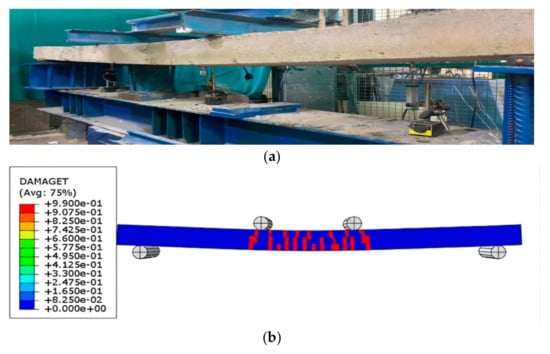
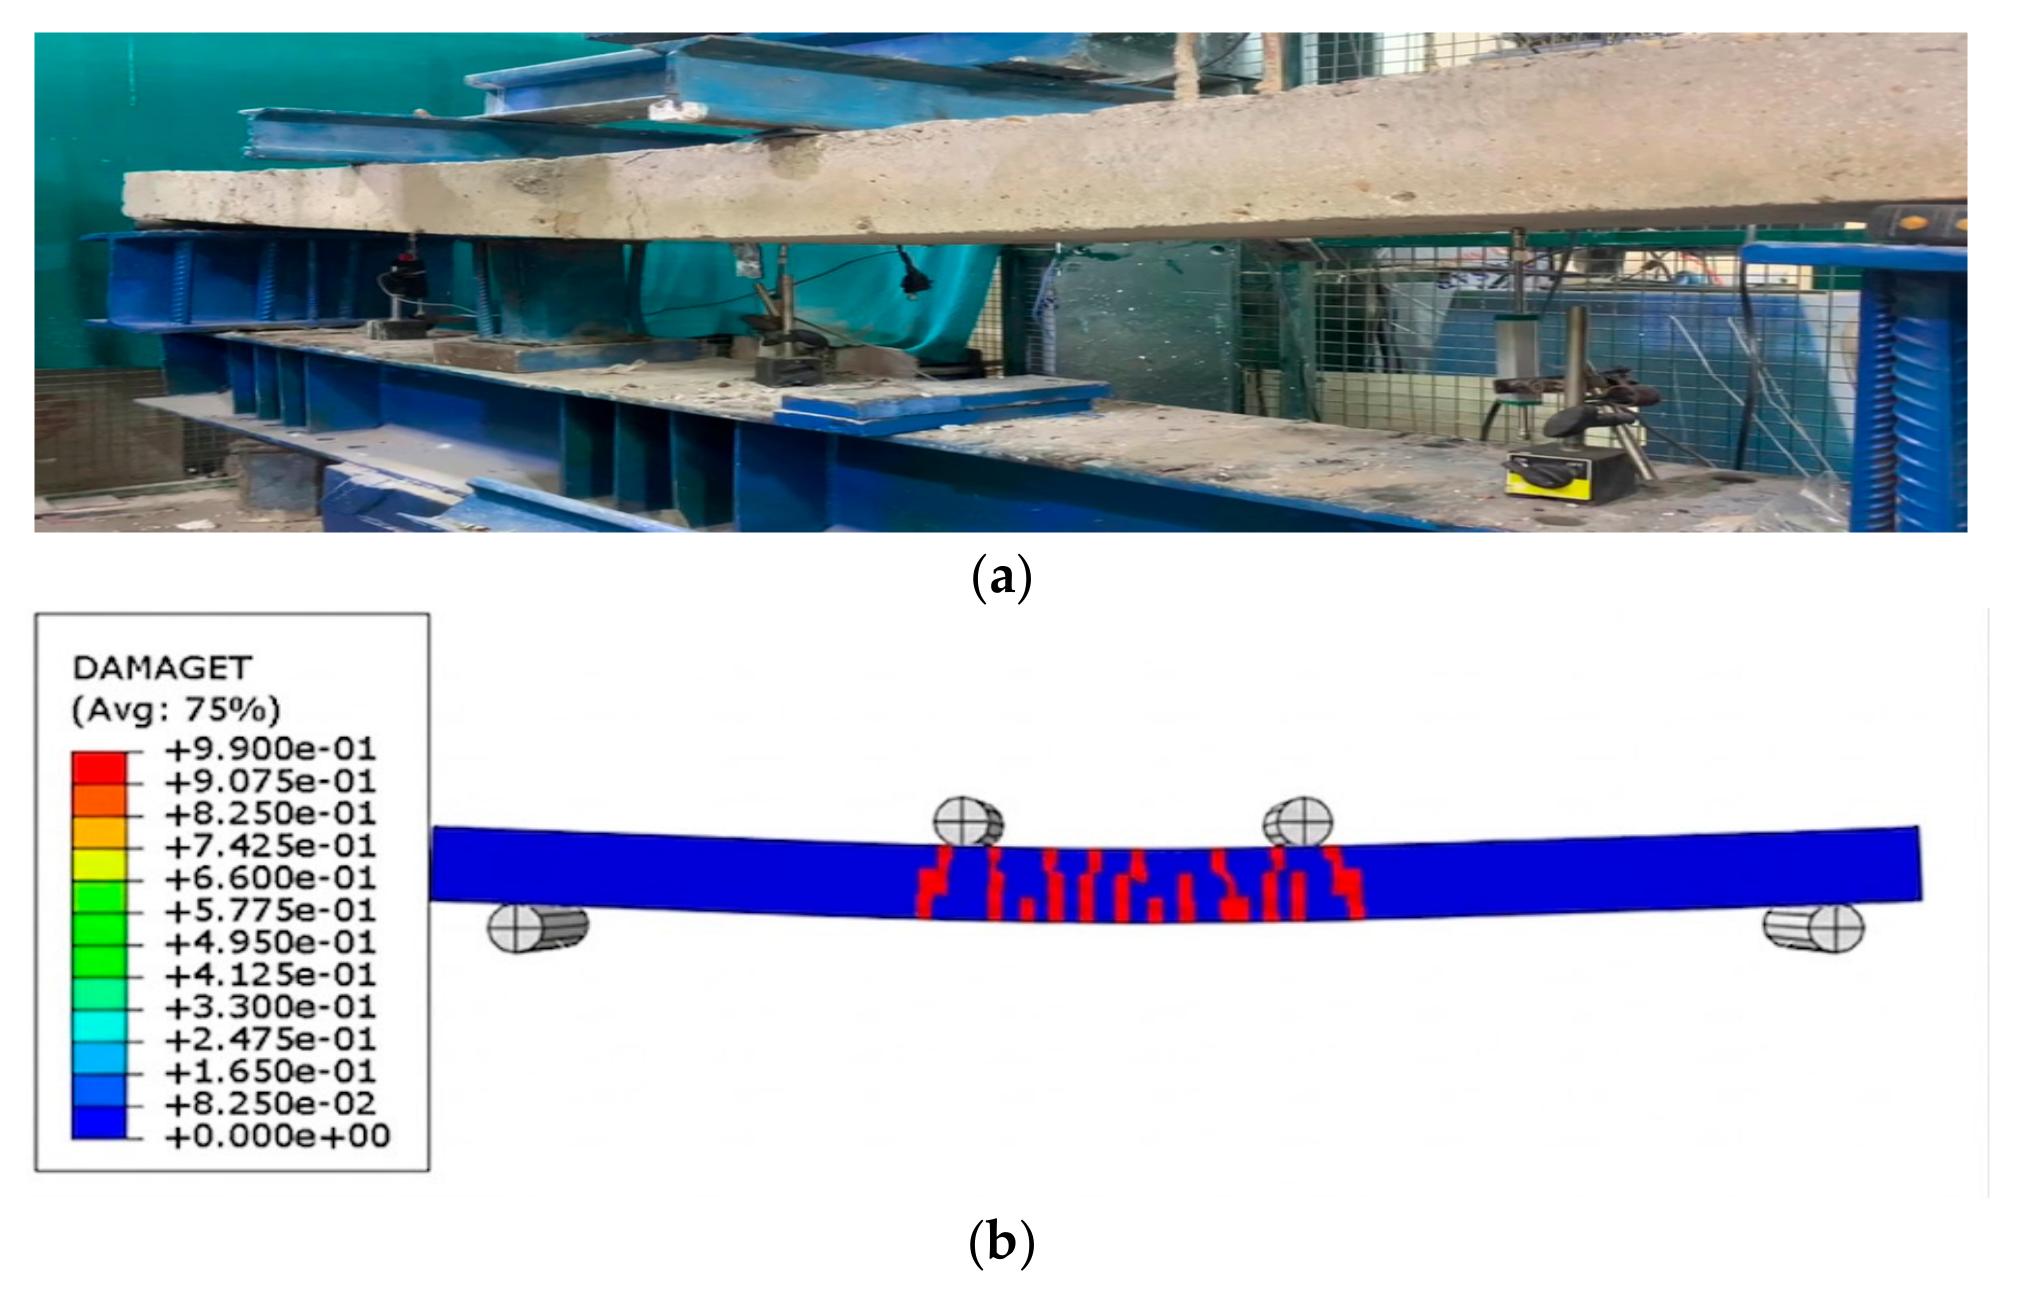
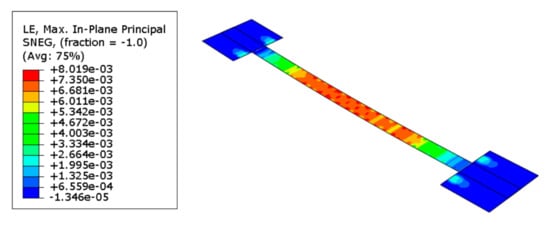
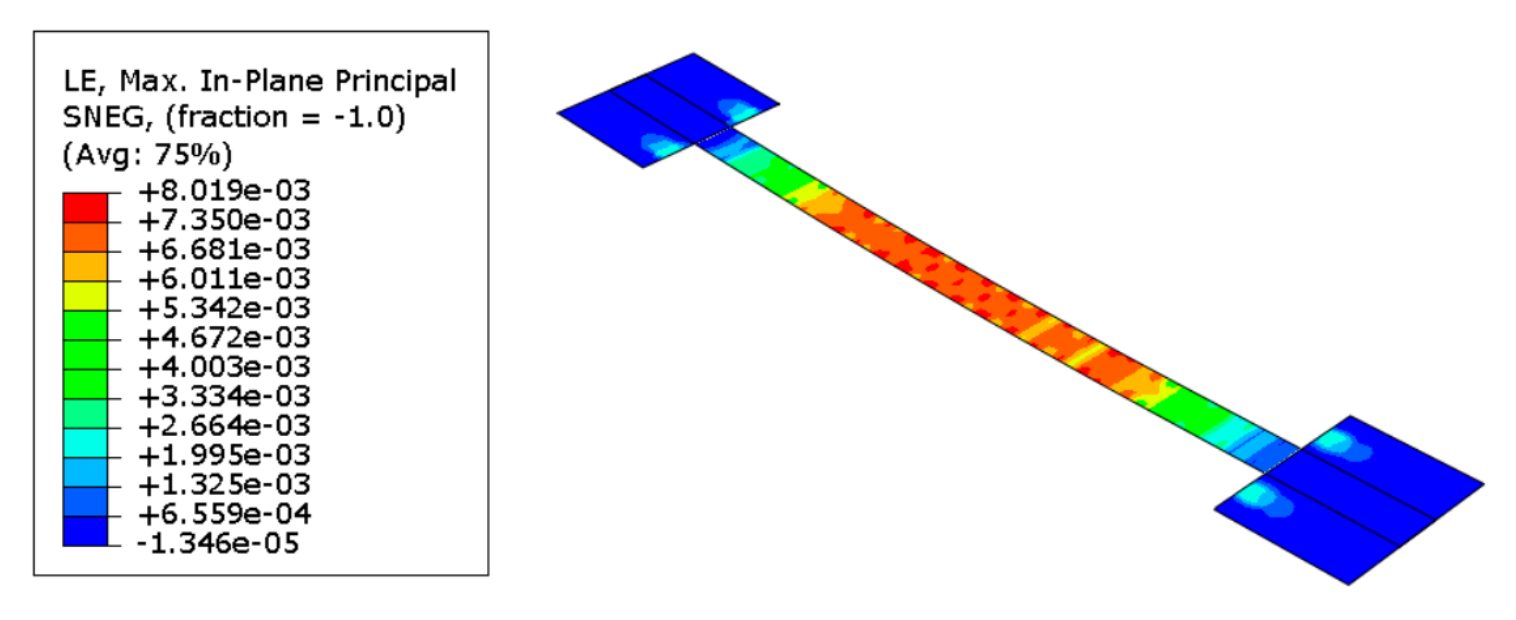
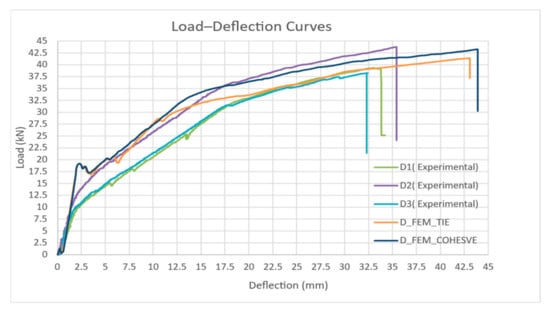
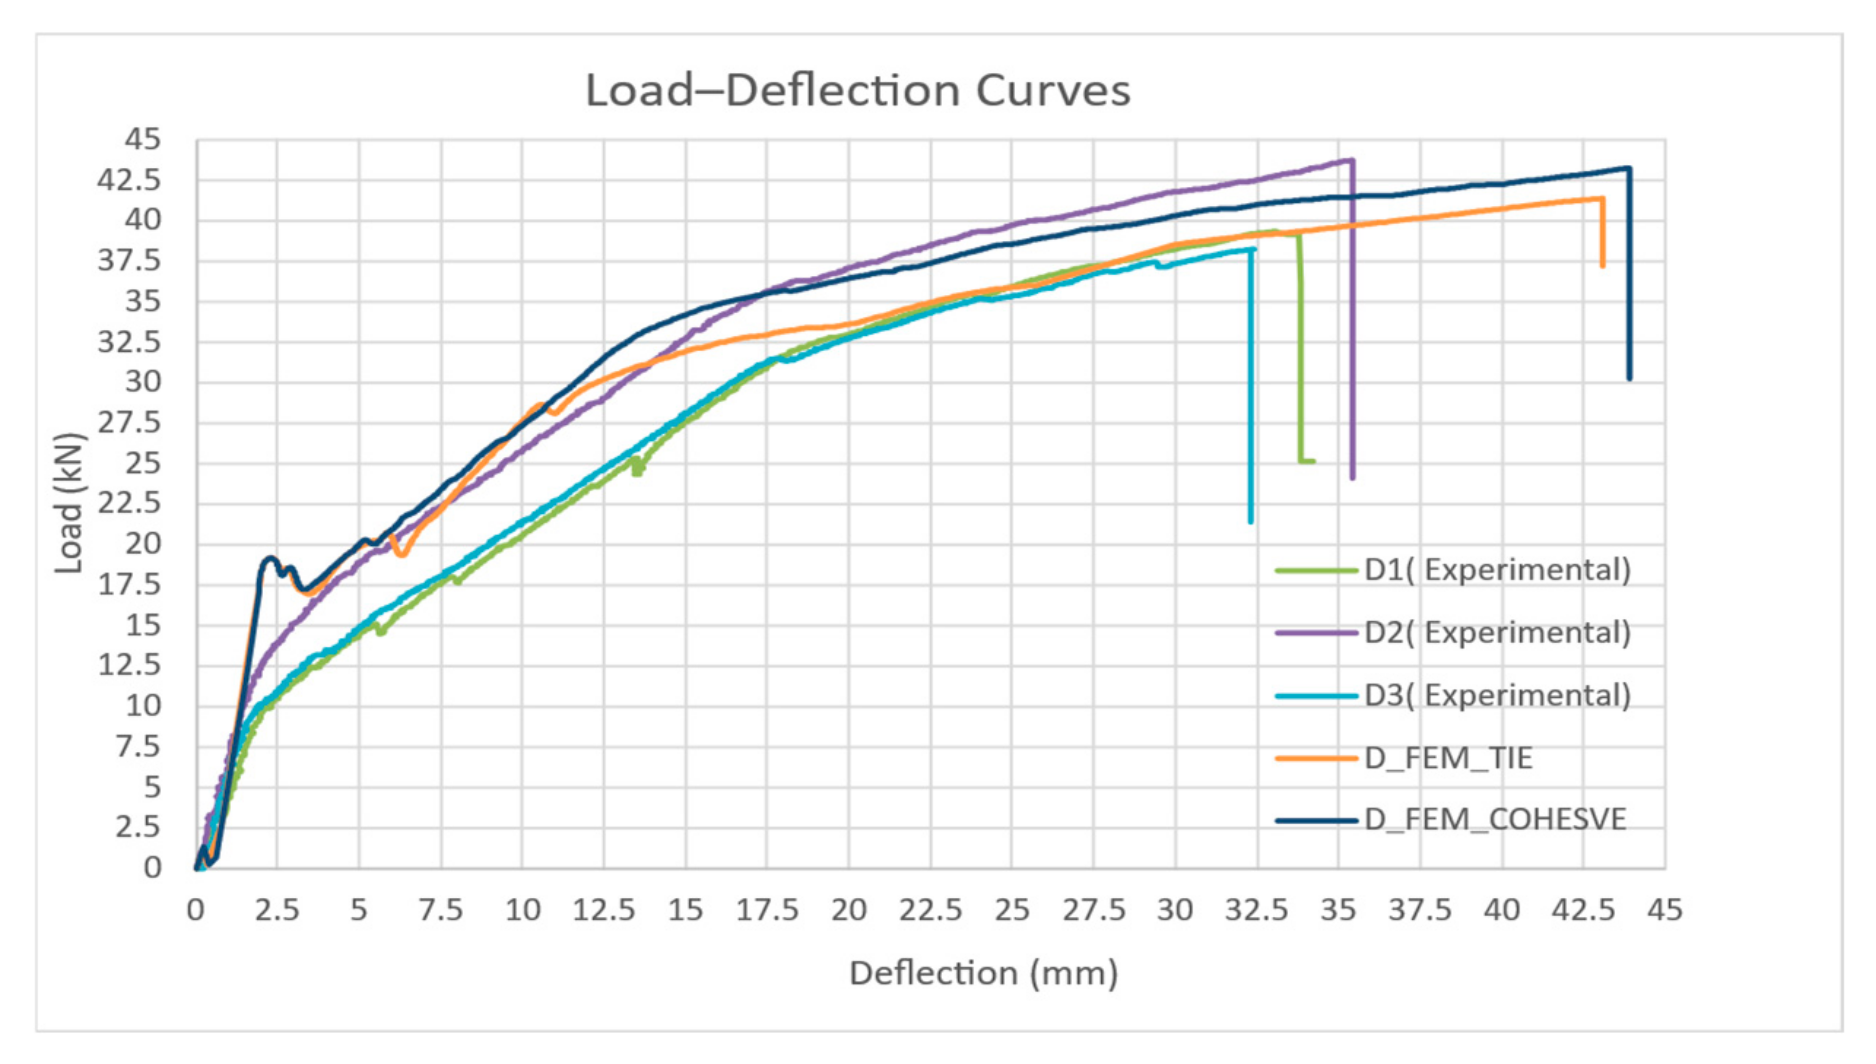
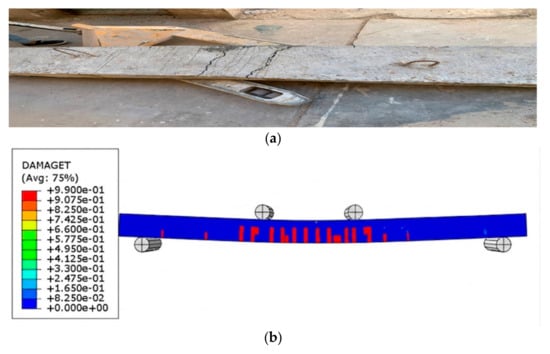
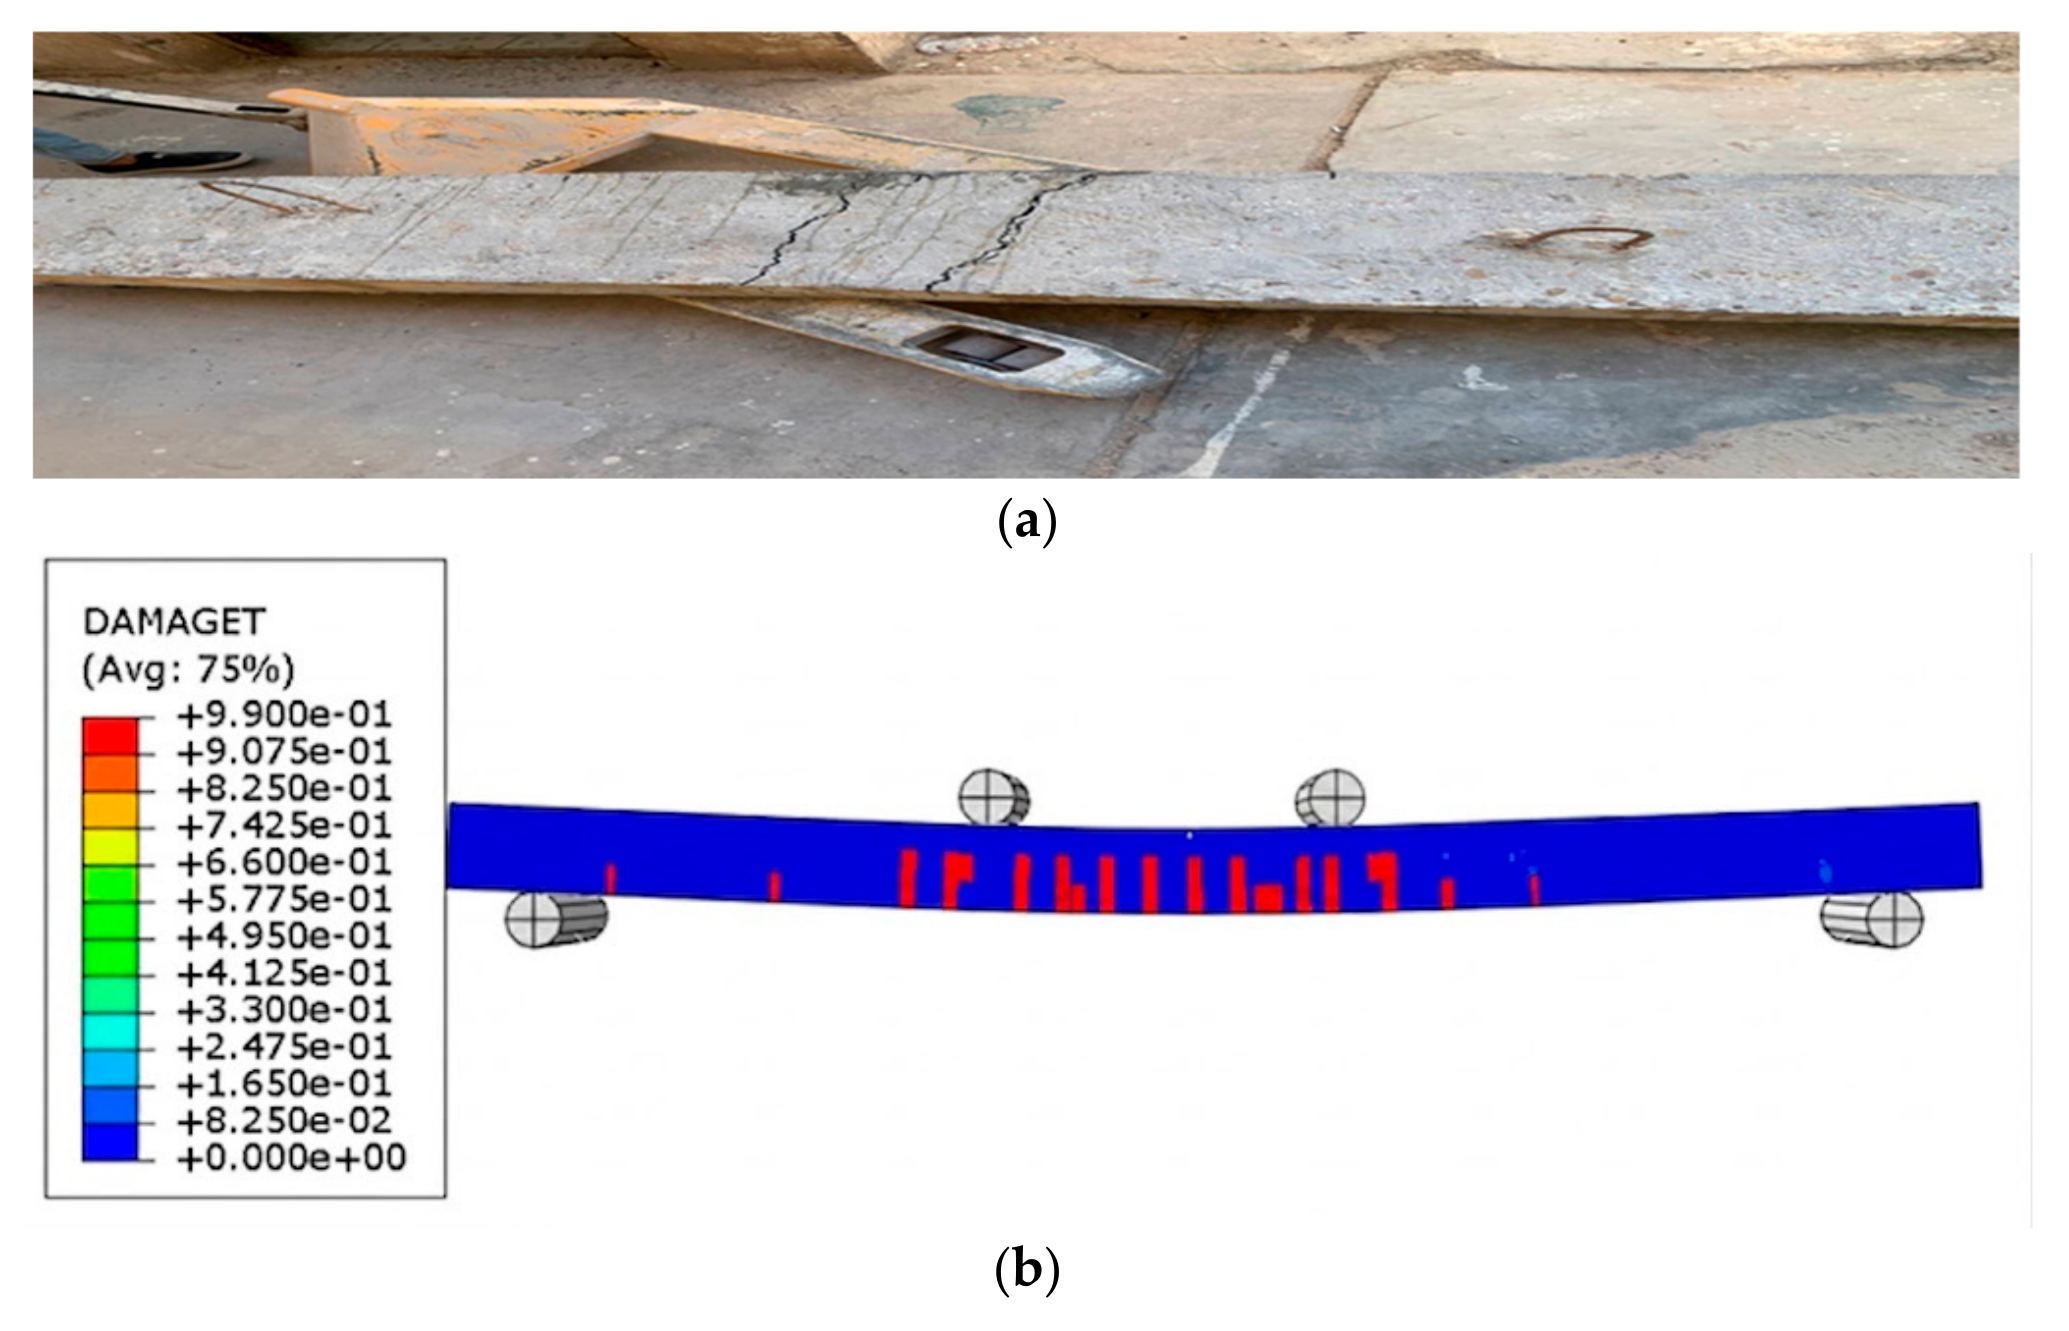
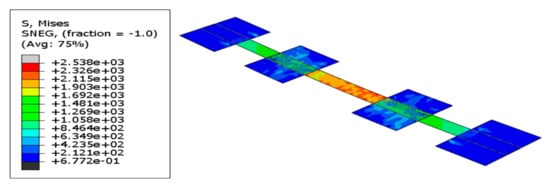
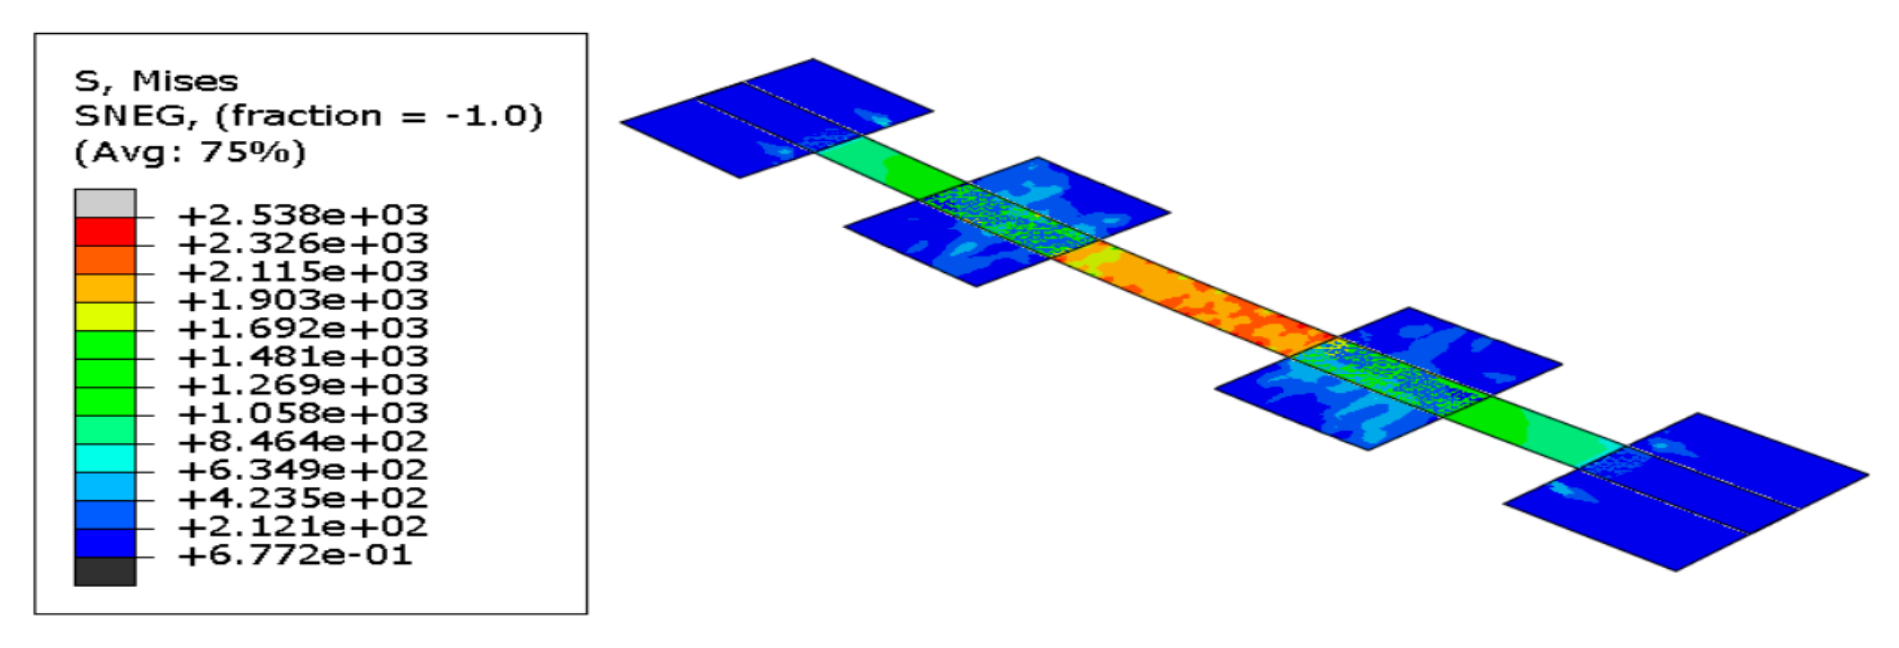

Disclaimer/Publisher’s Note: The statements, opinions and data contained in all publications are solely those of the individual author(s) and contributor(s) and not of MDPI and/or the editor(s). MDPI and/or the editor(s) disclaim responsibility for any injury to people or property resulting from any ideas, methods, instructions or products referred to in the content. |
© 2026 by the authors. Licensee MDPI, Basel, Switzerland. This article is an open access article distributed under the terms and conditions of the Creative Commons Attribution (CC BY) license.