


Highlights
- Lower H2 flow reduced GZO porosity from 1.25% to 0.89%.
- GZO1 showed improved structural homogeneity and thermal stability.
- GZO1 remained intact after 300 cycles at 1200 °C.
- GZO2 exhibited stronger pyrochlore-to-fluorite phase disordering.
- A 1.5 g/min H2 flow is preferred for durable YSZ/GZO TBCs.
Abstract
This study aimed to evaluate how two hydrogen flow rates during atmospheric plasma spraying of the gadolinium zirconate (GZO) top layer are associated with the microstructure and high-temperature performance of multilayer nickel–chromium–aluminum–yttrium (NiCrAlY)/yttria-stabilized zirconia (YSZ)/GZO thermal barrier coatings. Coatings produced at 1.5 and 1.8 L/min were characterized by scanning electron microscopy, energy-dispersive X-ray spectroscopy, X-ray diffraction with Rietveld refinement, thermomechanical analysis, calcium–magnesium–alumino–silicate (CMAS) hot-corrosion testing, and thermal cycling. Increasing the hydrogen flow rate was accompanied by increases in GZO thickness from 313.48 to 467.57 μm and porosity from 0.89 ± 0.11% to 1.25 ± 0.05%. CMAS penetration depths were 41.22 ± 4.18 μm for GZO1 and 60.44 ± 4.82 μm for GZO2. After 300 thermal cycles, GZO1 retained greater structural integrity, whereas GZO2 exhibited cracking and local spallation. Rietveld refinement indicated predominant pyrochlore in GZO1 and a larger defect-fluorite contribution in GZO2 after cycling. These results demonstrate that processing-related microstructural differences are associated with coating durability. Among the two investigated conditions, GZO1 showed better overall performance, indicating its potential for further development of thermal barrier coatings for high-temperature applications.
1. Introduction
Thermally loaded parts and components of rocket and space technology products (turbine blades, combustion chambers, nozzle apparatuses) operate under conditions of extremely high temperatures, significant thermomechanical loads, and an aggressive environment of fuel combustion products [1,2]. Increasing the gas temperature ahead of the turbine is one of the main ways to raise engine efficiency and specific power, but it is limited by the temperature resistance of materials [3,4]. Nickel-based heat-resistant superalloys, particularly Inconel 718 (Ni718), are widely used for hot-section components owing to their high strength and structural stability at elevated temperatures [5]. However, their intrinsic temperature limit is practically exhausted, and further increases in operating temperature are only possible through the application of Thermal Barrier Coatings (TBC).
A classical TBC system is a multilayer structure comprising a metallic bond coat and a ceramic thermally insulating top coat deposited on a superalloy substrate [6,7]. The NiCrAlY (nickel-chromium-aluminum-yttrium) bond coat performs a dual function: it provides a transition in coefficient of thermal expansion between the metallic substrate and the ceramic, and it forms a thermally grown oxide (TGO) on its surface, which slows the diffusion of oxygen and corrosive species into the material [8,9,10]. Yttria-stabilized zirconia (YSZ, ZrO2–7–8 wt.% Y2O3) has remained the unrivaled ceramic thermal-barrier material for decades owing to its favorable combination of low thermal conductivity, relatively high coefficient of thermal expansion, and acceptable fracture toughness [11,12].
At the same time, modern requirements for increased operating temperatures (above 1200 °C) have revealed a number of fundamental limitations of YSZ: phase instability associated with the tetrathlon-to-monoclinic transformation during prolonged service, accelerated sintering and grain growth leading to a loss of strain tolerance, as well as insufficient resistance to hot corrosion upon interaction with calcium-magnesium-alumino-silicate (CMAS) entering the gas path together with atmospheric dust and fuel combustion products [13,14,15]. This has stimulated the search for alternative ceramic materials. One promising option is gadolinium zirconate (Gd2Zr2O7, GZO) with a pyrochlore structure, characterized by lower thermal conductivity compared with YSZ, enhanced sintering resistance, and high phase stability at elevated temperatures [16]. However, GZO is inferior to YSZ in fracture toughness and coefficient of thermal expansion, which makes the study of combined and multilayer systems that unite the advantages of both materials particularly relevant.
One approach to overcoming the drawbacks of GZO is the development of multilayer YSZ/GZO structures. In [17], two- and three-layer YSZ(APS)/GZO(SPS) systems—APS: atmospheric plasma spraying; SPS: suspension plasma spraying—on the IN 738 superalloy demonstrated a significantly longer thermal cycling lifetime compared with single-layer APS-YSZ, while the three-layer system additionally exhibited better resistance to CMAS attack owing to higher durability to cold shock and the resistance of GZO to melt infiltration.
The influence of GZO microstructure on coating durability was separately investigated in [18], which compared coatings obtained by the APS and SPPS (solution precursor plasma spraying) methods. The more porous SPPS coating with vertical cracks outperformed the dense APS coating in thermal cycling resistance by nearly a factor of 8 owing to stress relief, but was approximately 10 times inferior to it under CMAS attack, since the cracks served as channels for rapid melt infiltration. Blockage of infiltration through apatite formation occurred only in cracks narrower than ~1 μm. This work demonstrates a trade-off between strain tolerance and CMAS resistance of the GZO coating, highlighting the importance of controlling its microstructure when designing multilayer TBC systems.
Bakan et al. systematically investigated the relationship between APS processing conditions, microstructure, and durability of GZO/YSZ double-layer thermal barrier coatings. Their results demonstrated that variations in spraying conditions significantly affect the cumulative porosity and pore-size distribution of the GZO layer, which in turn influence its Young’s modulus and the lifetime of the double-layer coating system. The authors further showed that changes in particle thermal history during APS modify the relative contribution of interlamellar cracks, globular pores, and other microstructural defects, highlighting the critical role of deposition conditions in controlling the performance of GZO-based TBCs [19].
Li et al. [20] investigated the CMAS corrosion behavior of APS-deposited Sc-doped GZO/YSZ double-ceramic-layer coatings at 1200 and 1250 °C. They reported that the interaction between molten CMAS and the GZO-based top layer resulted in the formation of fluorite- and apatite-type reaction products. At 1250 °C, these products developed into a reaction layer at the CMAS/coating interface, which substantially suppressed further penetration of molten CMAS into the coating [20]. More recently, Wang et al. emphasized that the CMAS resistance of GZO-based coatings should not be assessed solely in terms of melt penetration depth. They proposed that the thickness of the reaction layer, the amount of residual melt retained on the surface, and the compactness and stability of the reaction layer should be considered simultaneously [21].
Previous investigations have therefore established that both the processing-induced microstructure of GZO and its interaction with molten CMAS are critical factors governing the durability of GZO/YSZ thermal barrier coatings. However, the combined relationship between APS deposition conditions, the resulting GZO microstructure, and the subsequent thermal cycling, CMAS corrosion, and thermomechanical response of multilayer YSZ/GZO systems remains insufficiently understood. In particular, the specific role of hydrogen flow rate during APS deposition in controlling the microstructure of the GZO top layer and its subsequent behavior under multiple high-temperature degradation mechanisms has received comparatively limited attention. Therefore, a systematic assessment linking deposition conditions with microstructure and multiple degradation mechanisms within the same multilayer coating system is required.
In this context, the present study investigates multilayer NiCrAlY/YSZ(HVOF)/GZO(APS) thermal barrier coatings produced using two different hydrogen flow rates during APS deposition of the GZO top layer. Unlike previous studies on GZO/YSZ systems, which have primarily focused on varying the rare-earth dopant composition (e.g., Sc, Yb, Er, and Y) or comparing different deposition methods (APS, SPS, and SPPS), the present work examines hydrogen flow rate as a readily controllable APS processing parameter and evaluates its relationship with the resulting GZO microstructure and high-temperature performance. The influence of this processing parameter was assessed within an integrated experimental framework using independently prepared specimens produced under the same two deposition conditions. Rather than subjecting the same physical specimens sequentially to different degradation tests, separate specimens from each coating condition were used for microstructural characterization, CMAS hot-corrosion testing, thermal cycling, and thermomechanical analysis. This experimental design enabled the relationships between the selected APS processing condition, the resulting GZO microstructure, and the different high-temperature degradation responses to be assessed within a common comparative framework while avoiding interference between successive testing procedures. In addition, the combination of HVOF deposition for the YSZ layer and APS deposition for the GZO layer within a single multilayer architecture has received comparatively limited systematic attention relative to the more commonly investigated APS/APS or APS/SPS configurations. Thus, the present study provides a comparative assessment of how two hydrogen flow conditions are associated with coating microstructure, CMAS infiltration, thermal-cycling behavior, phase evolution, and thermomechanical response.
2. Materials and Methods
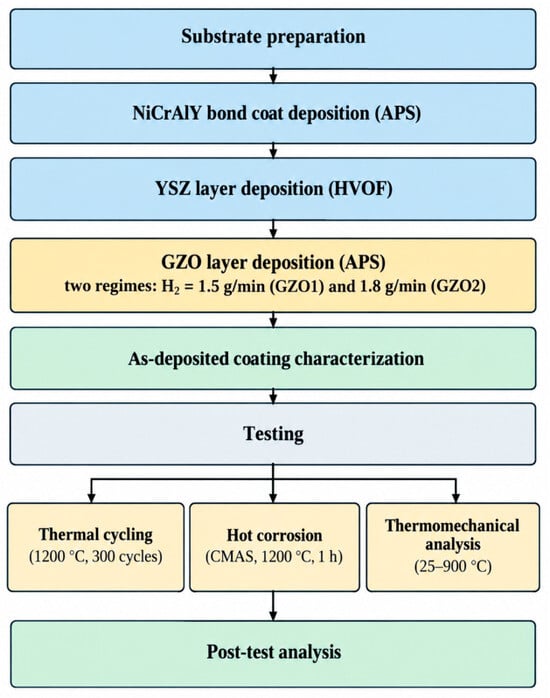
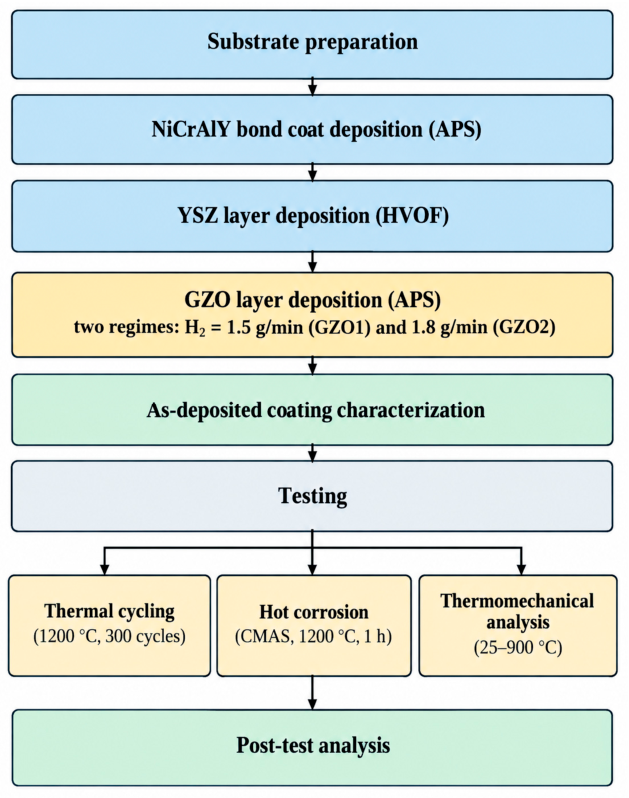
The overall experimental scheme is presented in Figure 1. It summarizes the main stages of the study, including substrate preparation, deposition of the NiCrAlY, YSZ, and GZO layers, as-deposited coating characterization, and subsequent thermal cycling, hot corrosion, and thermomechanical testing, followed by post-test analysis.
Figure 1.
Schematic workflow of the experimental methodology.
In this work, multilayer graded coatings consisting of GZO/YSZ/NiCrAlY layers, deposited on a substrate made of the Inconel 718 nickel superalloy with dimensions of ⌀30 × 4 mm, were used as samples. The chemical composition is presented in Table 1. The chemical composition of the Inconel 718 substrate was provided by the material supplier in accordance with the manufacturer’s certificate of analysis and was not independently verified experimentally in this study.
Table 1.
Chemical composition of the Inconel 718 nickel superalloy [22].
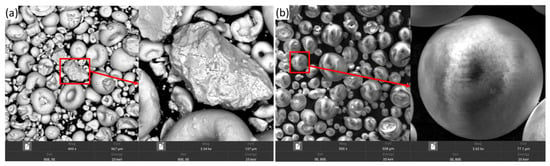
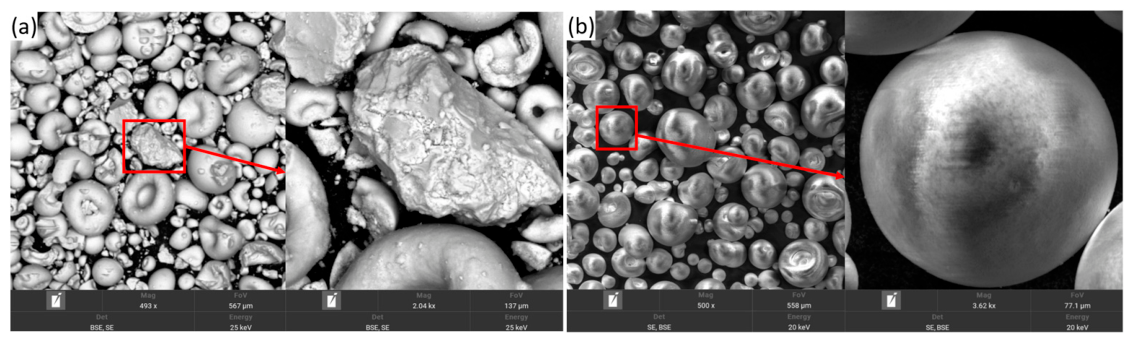
GZO and YSZ ceramic powders, as well as NiCrAlY metallic powder, were used as the starting materials. The morphology of the ceramic powders is shown in Figure 2a,b. Data on the NiCrAlY coating are provided in [22]. According to SEM image analysis results, the YSZ powder is characterized by a spherical morphology with an average particle size of 15–100 μm, while the GZO powder likewise exhibits a spherical particle shape with an average size of 16–120 μm.
Figure 2.
Scanning electron microscopy (SEM) images of the morphology of the initial YSZ (a) and GZO (b) powders.
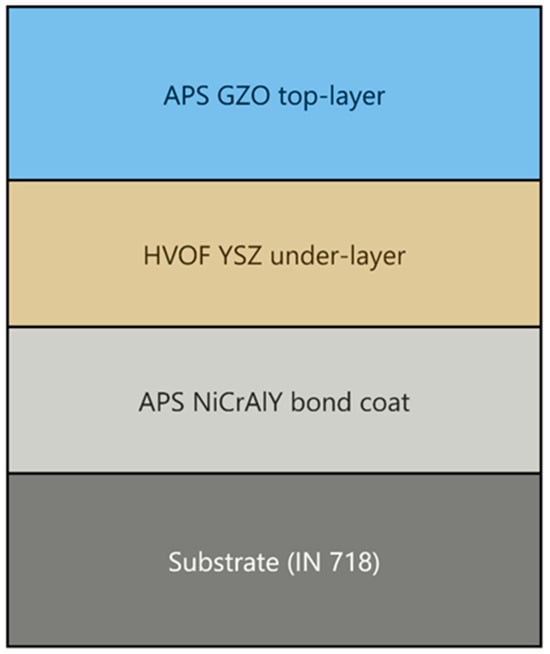
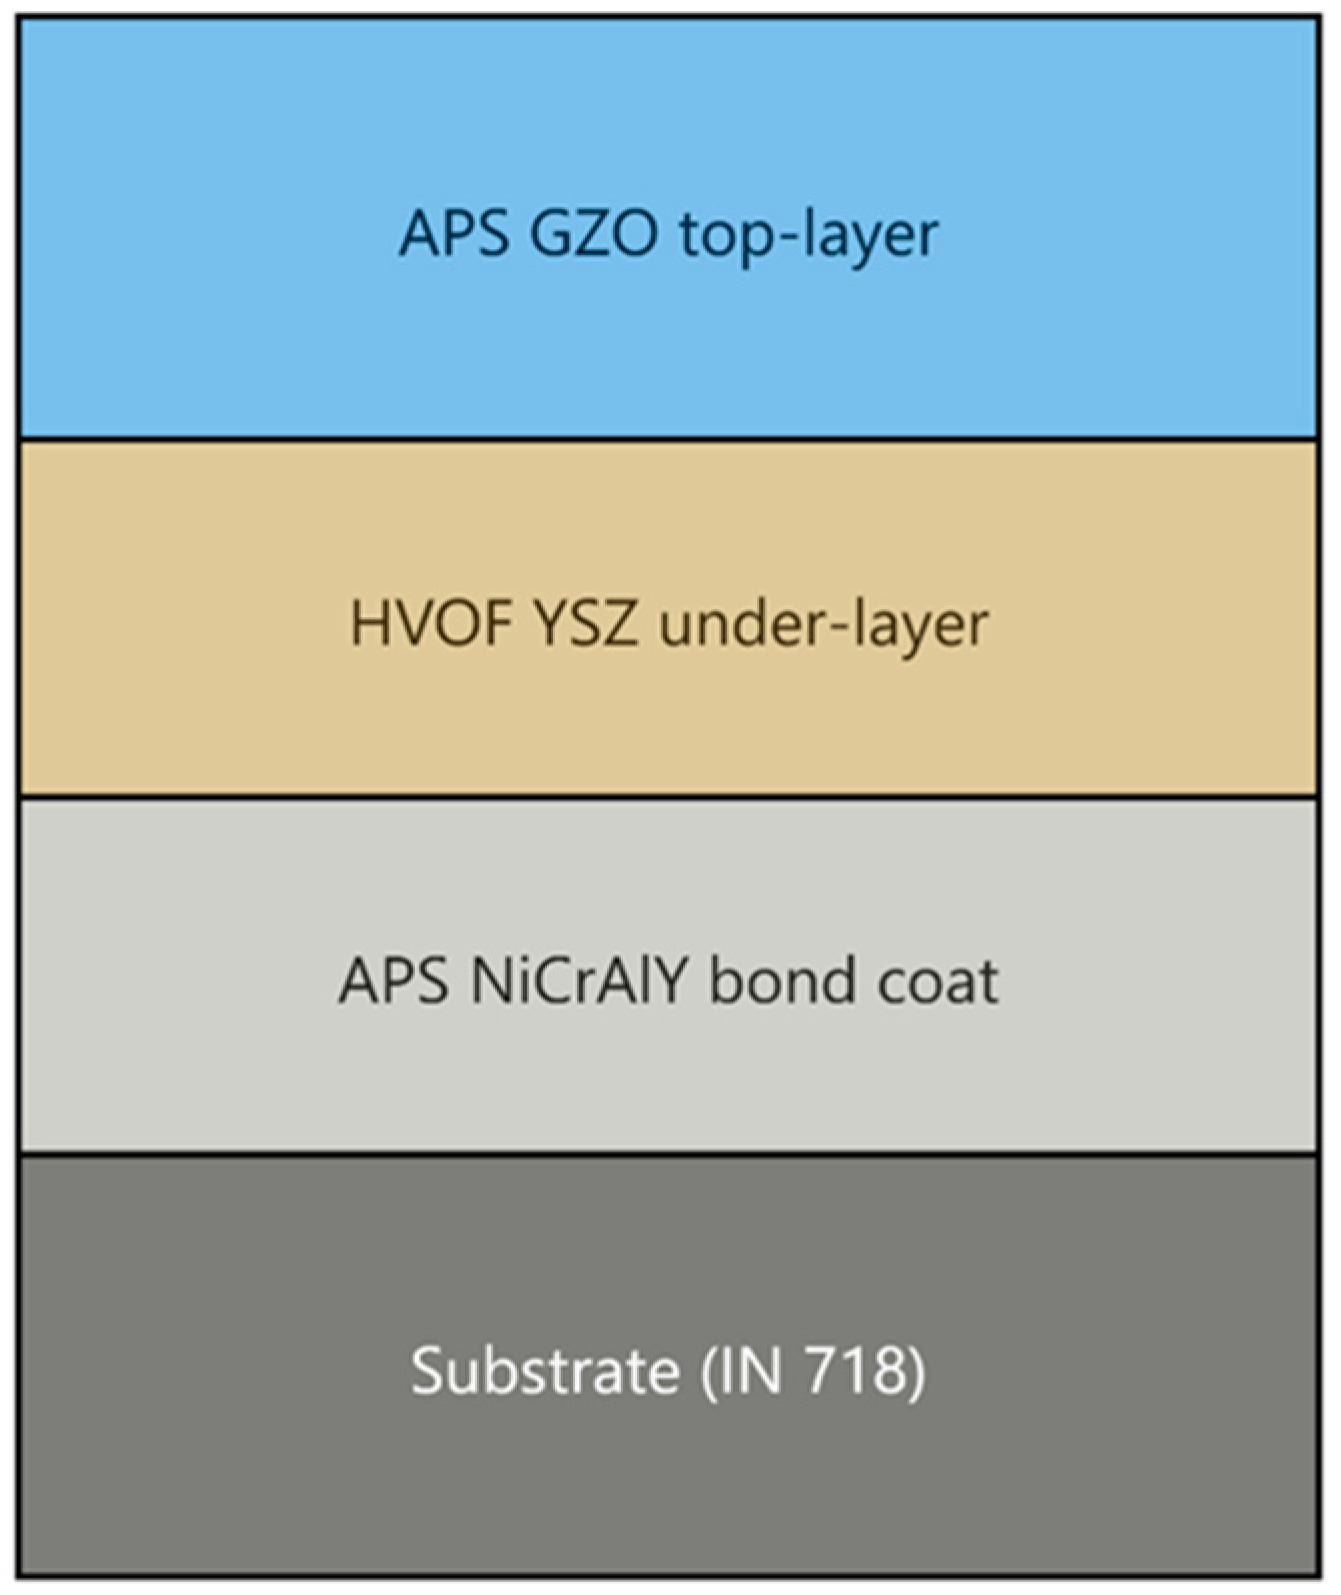
A schematic of the multilayer structure of the investigated YSZ(HVOF)/GZO(APS) coating on the Ni718 superalloy with a NiCrAlY bond coat is shown in Figure 3.
Figure 3.
Schematic of the multilayer structure of the YSZ(HVOF)/GZO(APS) coating on the Ni718 superalloy with a NiCrAlY bond coat.
The multilayer graded YSZ/GZO coatings were fabricated by the HVOF and APS methods [23]. Prior to coating deposition, the substrate surfaces were ground using MIRKA sandpaper with successive grit sizes from 100 to 2500 to remove surface irregularities and machining marks, followed by final polishing with diamond paste to achieve a uniform, defect-free surface. The polished Inconel 718 substrates were then grit-blasted on a Nordberg NS3 machine to produce the surface roughness required for coating adhesion, using electrocorundum with a particle size of 60–80 μm at an air pressure of 0.6 MPa.
After substrate preparation, a 150-μm-thick NiCrAlY bond coat was deposited by plasma spraying, followed by the YSZ ceramic layer. The upper GZO ceramic layer was deposited by atmospheric plasma spraying (APS) at two hydrogen flow rates within the Ar–H2 plasma-forming gas mixture: 1.5 L/min (sample GZO1) and 1.8 L/min (sample GZO2). This parameter was varied because the hydrogen flow rate influences the enthalpy of the plasma jet and, consequently, the thermal state and melting behavior of Gd2Zr2O7 particles, which may affect the density, porosity, homogeneity, and deposition efficiency of the resulting ceramic layer.
The two hydrogen flow rates were selected based on preliminary process optimization in which both the plasma arc current and hydrogen flow rate were varied to evaluate their effects on coating porosity, adhesion, and hardness. Based on these preliminary results, the plasma arc current was fixed at 550 A, while hydrogen flow rates of 1.5 and 1.8 L/min were selected for the present comparative study. The corresponding APS spraying parameters for the GZO coatings are given in Table 2.
Table 2.
APS spraying regimes.
The microstructural features of the coatings were characterized by scanning electron microscopy (Tescan VEGA 4, Brno, Czech Republic) equipped with energy-dispersive spectroscopy (EDS) (Xplore 30, Oxford Instruments, Oxford, UK) for detailed analysis of the elemental composition. X-ray phase analysis (XRD) was performed to determine the phase composition of the coatings. For this purpose, an X-ray diffractometer (X’PertPro, Philips Corporation, Eindhoven, the Netherlands) with a copper Kα anode (λ = 0.154 nm) was used. The following parameters were applied: tube voltage U = 40 kV and tube current I = 30 mA. The diffraction patterns were processed using OriginPro software (version 2019b), while phase identification was performed using the PDF-4 database. Data collection was carried out in the 2θ range from 20° to 90° with a step size of 0.02° and a counting time of 1 s/step.
Porosity was determined from cross-sections of the coatings using SEM at a magnification of 200×, based on five different areas of 500 × 500 μm each, distributed across the coating cross-section, for three independent specimens per composition (15 measurements per composition in total). Porosity was calculated as the ratio of the total pore area to the total analyzed cross-sectional area using ImageJ software (version 1.54g) in accordance with ASTM E2109 [24]. The reported porosity values represent specimen-averaged means ± standard deviation for three independent specimens per composition. Statistical significance between compositions was assessed using Welch’s t-test based on the independent specimen averages.
The thickness of the thermally grown oxide (TGO) layer was determined from cross-sectional SEM images. For each coating condition (GZO1 and GZO2), three independent specimens were analyzed. Five local thickness measurements were taken at spatially distributed positions along the irregular bond coat/TGO interface for each specimen, resulting in 15 local measurements per coating condition. The five local measurements were averaged for each specimen, and the results are reported as the mean ± standard deviation (SD) calculated from the three independent specimen averages (n = 3).
Coating thickness was measured from the same cross-sectional images obtained by scanning electron microscopy, at several points, and was taken into account when selecting representative areas to ensure an accurate assessment of porosity across the entire coating thickness.
CMAS hot corrosion tests were performed on three independently prepared specimens of each composition (three of GZO1 and three of GZO2). The coatings’ resistance to hot corrosion was evaluated using a CMAS synthesis and application procedure described in detail in [25]: a model glass with the composition 33CaO–9MgO–13Al2O3–45SiO2 [26] was obtained by melting a mixture of the starting oxides (CaO, MgO, Al2O3, SiO2, 99.9% purity) at 1550 °C, followed by quenching in deionized water, grinding, and sieving through a 200 μm mesh. The resulting powder was applied to the surface of the coating samples at a loading of 5 mg/cm2, identical for all specimens and uniformly distributed over the sample surface using a sieve to ensure even powder coverage; the applied loading was verified by weighing each specimen before and after powder deposition on an analytical balance, ensuring consistent test conditions across specimens. The samples were subjected to heat treatment at 1200 °C for 1 h, followed by slow cooling to room temperature in a SNOL 7.2/1100 muffle furnace.
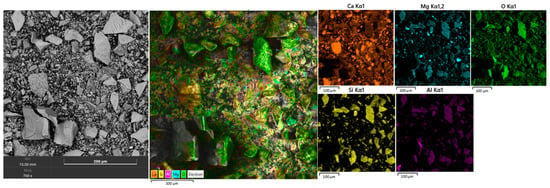
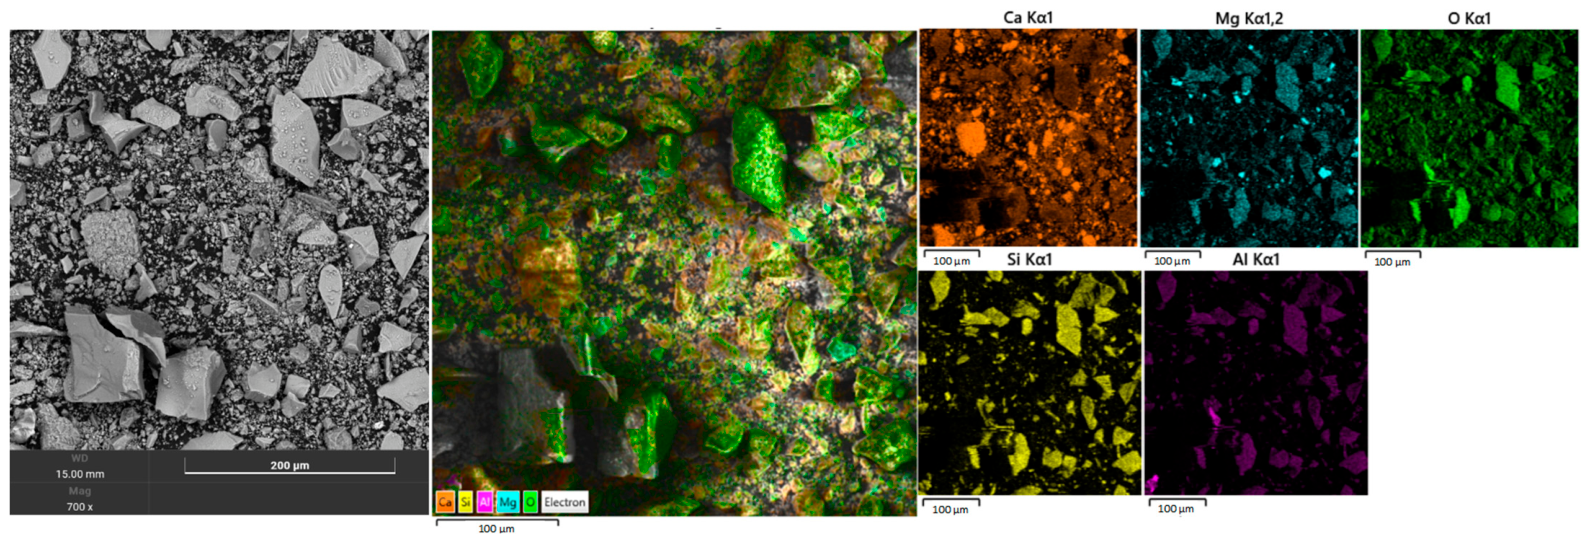
Figure 4 presents the results of SEM analysis and EDS mapping of the synthesized CMAS powder (33CaO–9MgO–13Al2O3–45SiO2) used in the subsequent hot corrosion resistance tests of the coatings.
Figure 4.
Morphology and elemental composition of the CMAS powder: SEM image (left), combined EDS elemental distribution map, and individual distribution maps of Ca, Mg, O, Si, and Al.
The SEM image reveals the characteristic morphology of the CMAS powder after grinding of the quenched glass—the particles exhibit an irregular, angular (fragment-like) shape with sharp edges, typical of a mechanically ground brittle glassy material. A wide particle size distribution is observed, ranging from a fine fraction to large fragments on the order of 50–100 μm, consistent with the expected outcome of sieving the powder through a 200 μm mesh.
The overlaid EDS maps show a broadly homogeneous distribution of the principal CMAS constituents, with some local variations in Mg intensity. Ca, O, Si, and Al are relatively uniformly distributed across the analyzed area. Si exhibits the most intense and homogeneous signal, consistent with its high content and its role as the principal glass-forming component of the CMAS composition. In contrast, Mg shows localized regions of increased signal intensity, indicating minor compositional heterogeneity within the synthesized CMAS powder.
To quantify CMAS infiltration, the penetration depth was determined from cross-sectional SEM/BSE images in conjunction with corresponding EDS maps showing the distribution of characteristic CMAS components (Ca, Mg, and Si). Three independent specimens were analyzed for each coating condition. For each specimen, the penetration depth was measured at three spatially distributed locations across the examined cross-section, resulting in nine local measurements per coating condition. The penetration depth was defined as the distance from the outer coating surface to the deepest region in which CMAS-derived Ca, Mg, and/or Si signals were detected. The three local measurements were averaged for each specimen, and the final mean ± SD was calculated from the three independent specimen averages (n = 3).
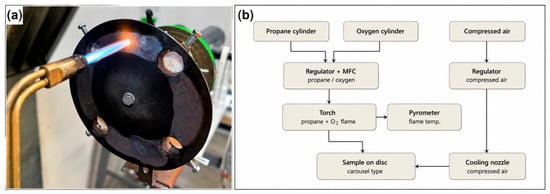
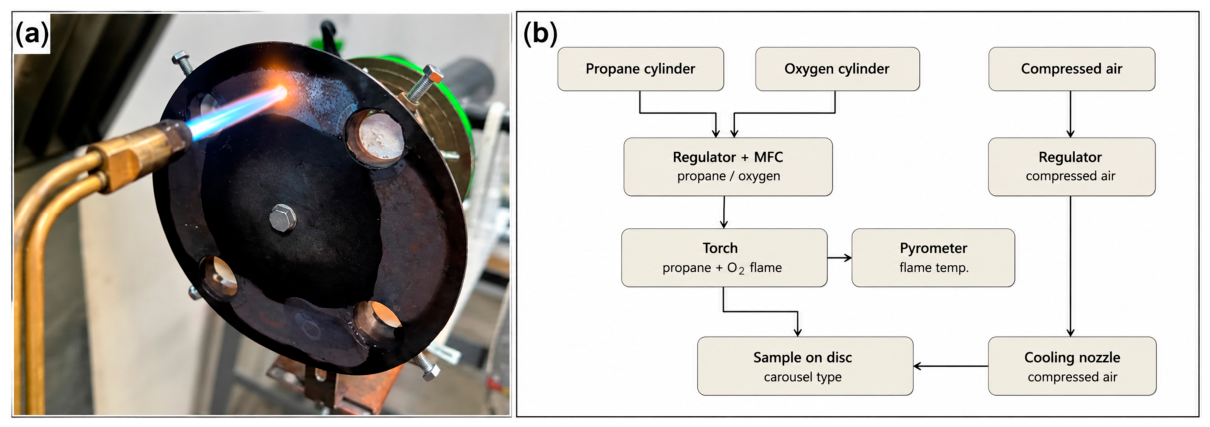
Thermal cycling tests were performed on five independently prepared specimens of each composition (five of GZO1 and five of GZO2) using a carousel-type bench rig in accordance with the international standard ISO 13123:2011 [27]. The specimens were tested in successive batches under identical cycling conditions. A propane–oxygen torch was used, with propane and oxygen flow rates regulated by flow meters to produce a stable oxidizing flame; the flame-to-specimen distance was fixed at 120 mm, and the flame fully covered the front surface of the specimen, ensuring uniform heating across the exposed area. The front-surface temperature was monitored using an optical pyrometer.
One thermal cycle consisted of the following stages: (1) heating for 1 min until the surface temperature reached 1220 ± 20 °C, corresponding to an average heating rate of approximately 20 °C/s; no separate isothermal dwell stage was applied, and cooling began immediately upon reaching peak temperature; (2) forced-air cooling of the front surface, with a compressed-air nozzle simultaneously directed at the back surface to induce a through-thickness thermal gradient. Upon rotation of the carousel away from the flame, both specimen surfaces were cooled with compressed air until the temperature dropped below 100 °C within 60–90 s, corresponding to an average cooling rate of approximately 12–19 °C/s. The carousel indexing time between positions was approximately 15 s; accounting for the sequential heating of all four specimens and the indexing intervals, one full carousel rotation lasted approximately 5 min, during which each specimen spent approximately 1 min in the flame zone and approximately 4 min outside it before returning to the heating position. Thermal cycling was continued for a maximum of 300 cycles or until approximately 20% coating spallation was observed, whichever occurred first. The general appearance of the rig is shown in Figure 5a.
Figure 5.
(a) General appearance of the experimental rig during sample heating with a propane–oxygen torch, and (b) schematic diagram of the experimental setup for thermal cycling testing of the coatings.
The rig used in this work complies with the requirements of the international standard ISO 13123:2011, enabling comparative evaluation of the obtained results with those reported in other studies. The configuration of the laboratory rig enables controlled assessment of coating behavior under cyclic thermal loading and through-thickness temperature gradients. The accelerated cycling regime provides a reproducible approach for evaluating coating durability under repeated heating and cooling conditions. A schematic diagram of the experimental setup is shown in Figure 5b.
One thermal cycle was defined as one complete heating–cooling sequence, consisting of heating the specimen surface to 1220 ± 20 °C followed by forced-air cooling to below 100 °C. The total number of cycles was determined from the number of completed heating–cooling sequences. After thermal cycling tests, the samples were subjected to visual inspection for cracking and coating spallation. The structural and phase state of the coatings before and after thermal cycling was investigated by X-ray diffractometry.
Quantitative phase analysis of the XRD patterns obtained after thermal cycling was performed by Rietveld refinement using PowderCell for Windows, Version 2.4 (W. Kraus and G. Nolze, Federal Institute for Materials Research and Testing, Berlin, Germany). The refinement included pyrochlore Gd2Zr2O7, defect fluorite, monoclinic ZrO2, and tetragonal ZrO2 phases. The quality of the refinement was evaluated using the Rp, Rwp, and Rexp parameters.
Thermomechanical analysis was performed on two independently prepared specimens of each composition (two of GZO1 and two of GZO2), using a TMA Q400EM instrument (TA Instruments, New Castle, DE, USA) at the University of West Bohemia (Plzeň, Czech Republic). Based on the analysis results, the coefficients of thermal expansion (over the temperature range of 25–900 °C) below (α1) and above (α2) the identified inflection region were determined. The inflection temperature was determined by the intersection of linear fits to the low- and high-temperature portions of the ΔL(T) curve.
3. Results
3.1. Microstructure and Elemental Composition of the Coatings
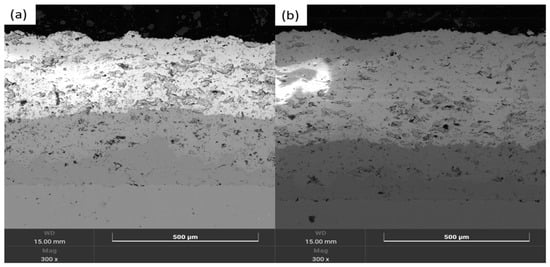
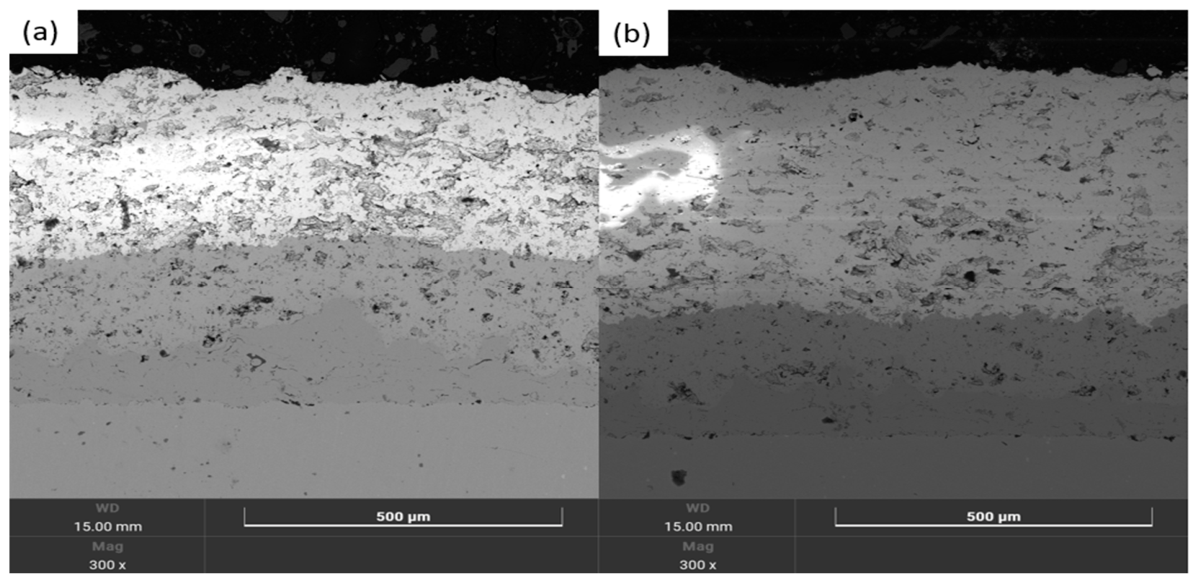
The cross-sectional microstructure of the YSZ(HVOF)/GZO(APS) coating on the Ni718 substrate (Figure 6) exhibits a characteristic multilayer architecture: the GZO ceramic layer (APS), the YSZ layer (HVOF), the NiCrAlY bond coat, and the Ni718 substrate. The GZO layer has a typical lamellar structure resulting from the sequential deposition of molten powder droplets, whereas the YSZ layer is characterized by a denser and more homogeneous structure—owing to the higher particle velocity during HVOF spraying compared with plasma spraying [23]. Both layers contain pores and incompletely melted particles typical of thermally sprayed coatings, predominantly localized within the GZO layer.
Figure 6.
Cross-sectional microstructure of the as-deposited multilayer YSZ/GZO coating on the Ni718 substrate at a hydrogen flow rate of 1.5 L/min (a) and 1.8 L/min (b).
Comparison of the samples obtained at different hydrogen flow rates showed that at 1.5 L/min (Figure 6a) the GZO/YSZ interface is sharper and more even, whereas at 1.8 L/min (Figure 6b) the interface is more irregular, and the upper part of the GZO layer exhibits local structural inhomogeneity and increased porosity.
The increase in hydrogen flow rate from 1.5 to 1.8 L/min was accompanied by a substantial increase in the GZO layer thickness from 313.48 to 467.57 μm, corresponding to an approximately 1.5-fold increase. The porosity also increased from 0.89% to 1.25%. Porosity was evaluated using three independent specimens per coating condition, with five measurement areas analyzed for each specimen (15 local measurements per condition). The specimen-averaged porosity was 0.89 ± 0.11% for GZO1 and 1.25 ± 0.05% for GZO2 (mean ± SD, n = 3 independent specimens). Welch’s t-test showed that the difference in porosity between the two coating conditions was statistically significant (p < 0.05).
The higher hydrogen flow rate is expected to increase the enthalpy of the plasma jet and thereby modify particle heating, melting, and deposition behavior. Under the present spraying conditions, the increase in hydrogen flow rate was accompanied by greater GZO layer thickness, higher porosity, and greater structural inhomogeneity. However, because the variation in hydrogen flow rate was accompanied by simultaneous changes in coating thickness and porosity, the individual contribution of coating thickness to the observed differences in thermal gradients, residual stresses, cracking behavior, and CMAS infiltration cannot be fully separated from the accompanying microstructural changes within the present experimental design. Quantitatively decoupling these effects would require additional controlled experiments using coatings of comparable thickness.
A similar sensitivity of GZO microstructure to APS processing conditions was reported by Bakan et al. [19], who demonstrated that changes in the thermal history of the sprayed particles significantly modify the cumulative porosity, pore-size distribution, and characteristic pore morphology of GZO coatings. Their results further showed that the porosity and microstructural features of the GZO layer strongly affect its elastic response and thermal cycling lifetime.
It should be emphasized that total porosity alone does not determine the thermal cycling resistance of thermally sprayed GZO coatings. Controlled porosity and appropriately oriented segmentation cracks may improve strain tolerance by facilitating the relaxation of thermally induced stresses. Therefore, pore morphology, connectivity, and orientation, as well as the architecture and propagation paths of cracks, may be more important than the absolute porosity value. In the present study, the poorer thermal cycling performance of GZO2 is therefore not attributed solely to its higher total porosity (1.25% compared with 0.89% for GZO1), but rather to the combined effect of its overall microstructural characteristics, including greater structural inhomogeneity and the development of local damage. Increasing the hydrogen flow rate from 1.5 to 1.8 L/min simultaneously increased the coating thickness and porosity and promoted local structural inhomogeneity. This suggests that the higher plasma enthalpy did not simply enhance particle melting but altered the balance between particle heating, deposition rate, spreading, and interlamellar packing. Thus, the improved homogeneity of GZO1 is consistent with the general observation that optimized APS particle thermal histories are essential for tailoring the microstructure and durability of GZO-based coatings [19]. A comparable dependence of coating durability on layer microstructure, obtained by isothermal oxidation testing of GZO/YSZ multilayer systems, was also reported by Mahade et al. [28], supporting the view that processing-induced microstructural differences contribute substantially to the degradation behavior of GZO-based multilayer TBCs.
Overall, increasing the hydrogen flow rate resulted in a thicker coating with higher total porosity and greater structural inhomogeneity. The observed difference in durability should therefore be interpreted in terms of the combined microstructural architecture rather than total porosity alone.
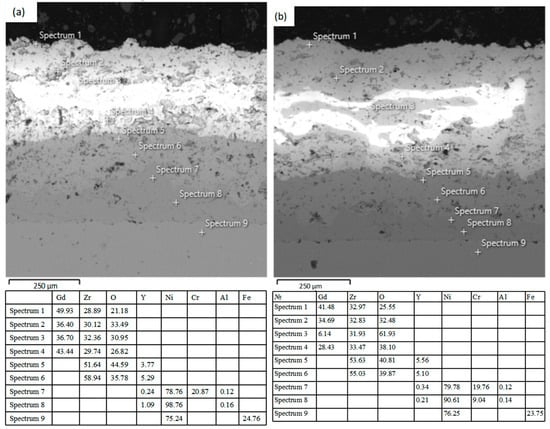
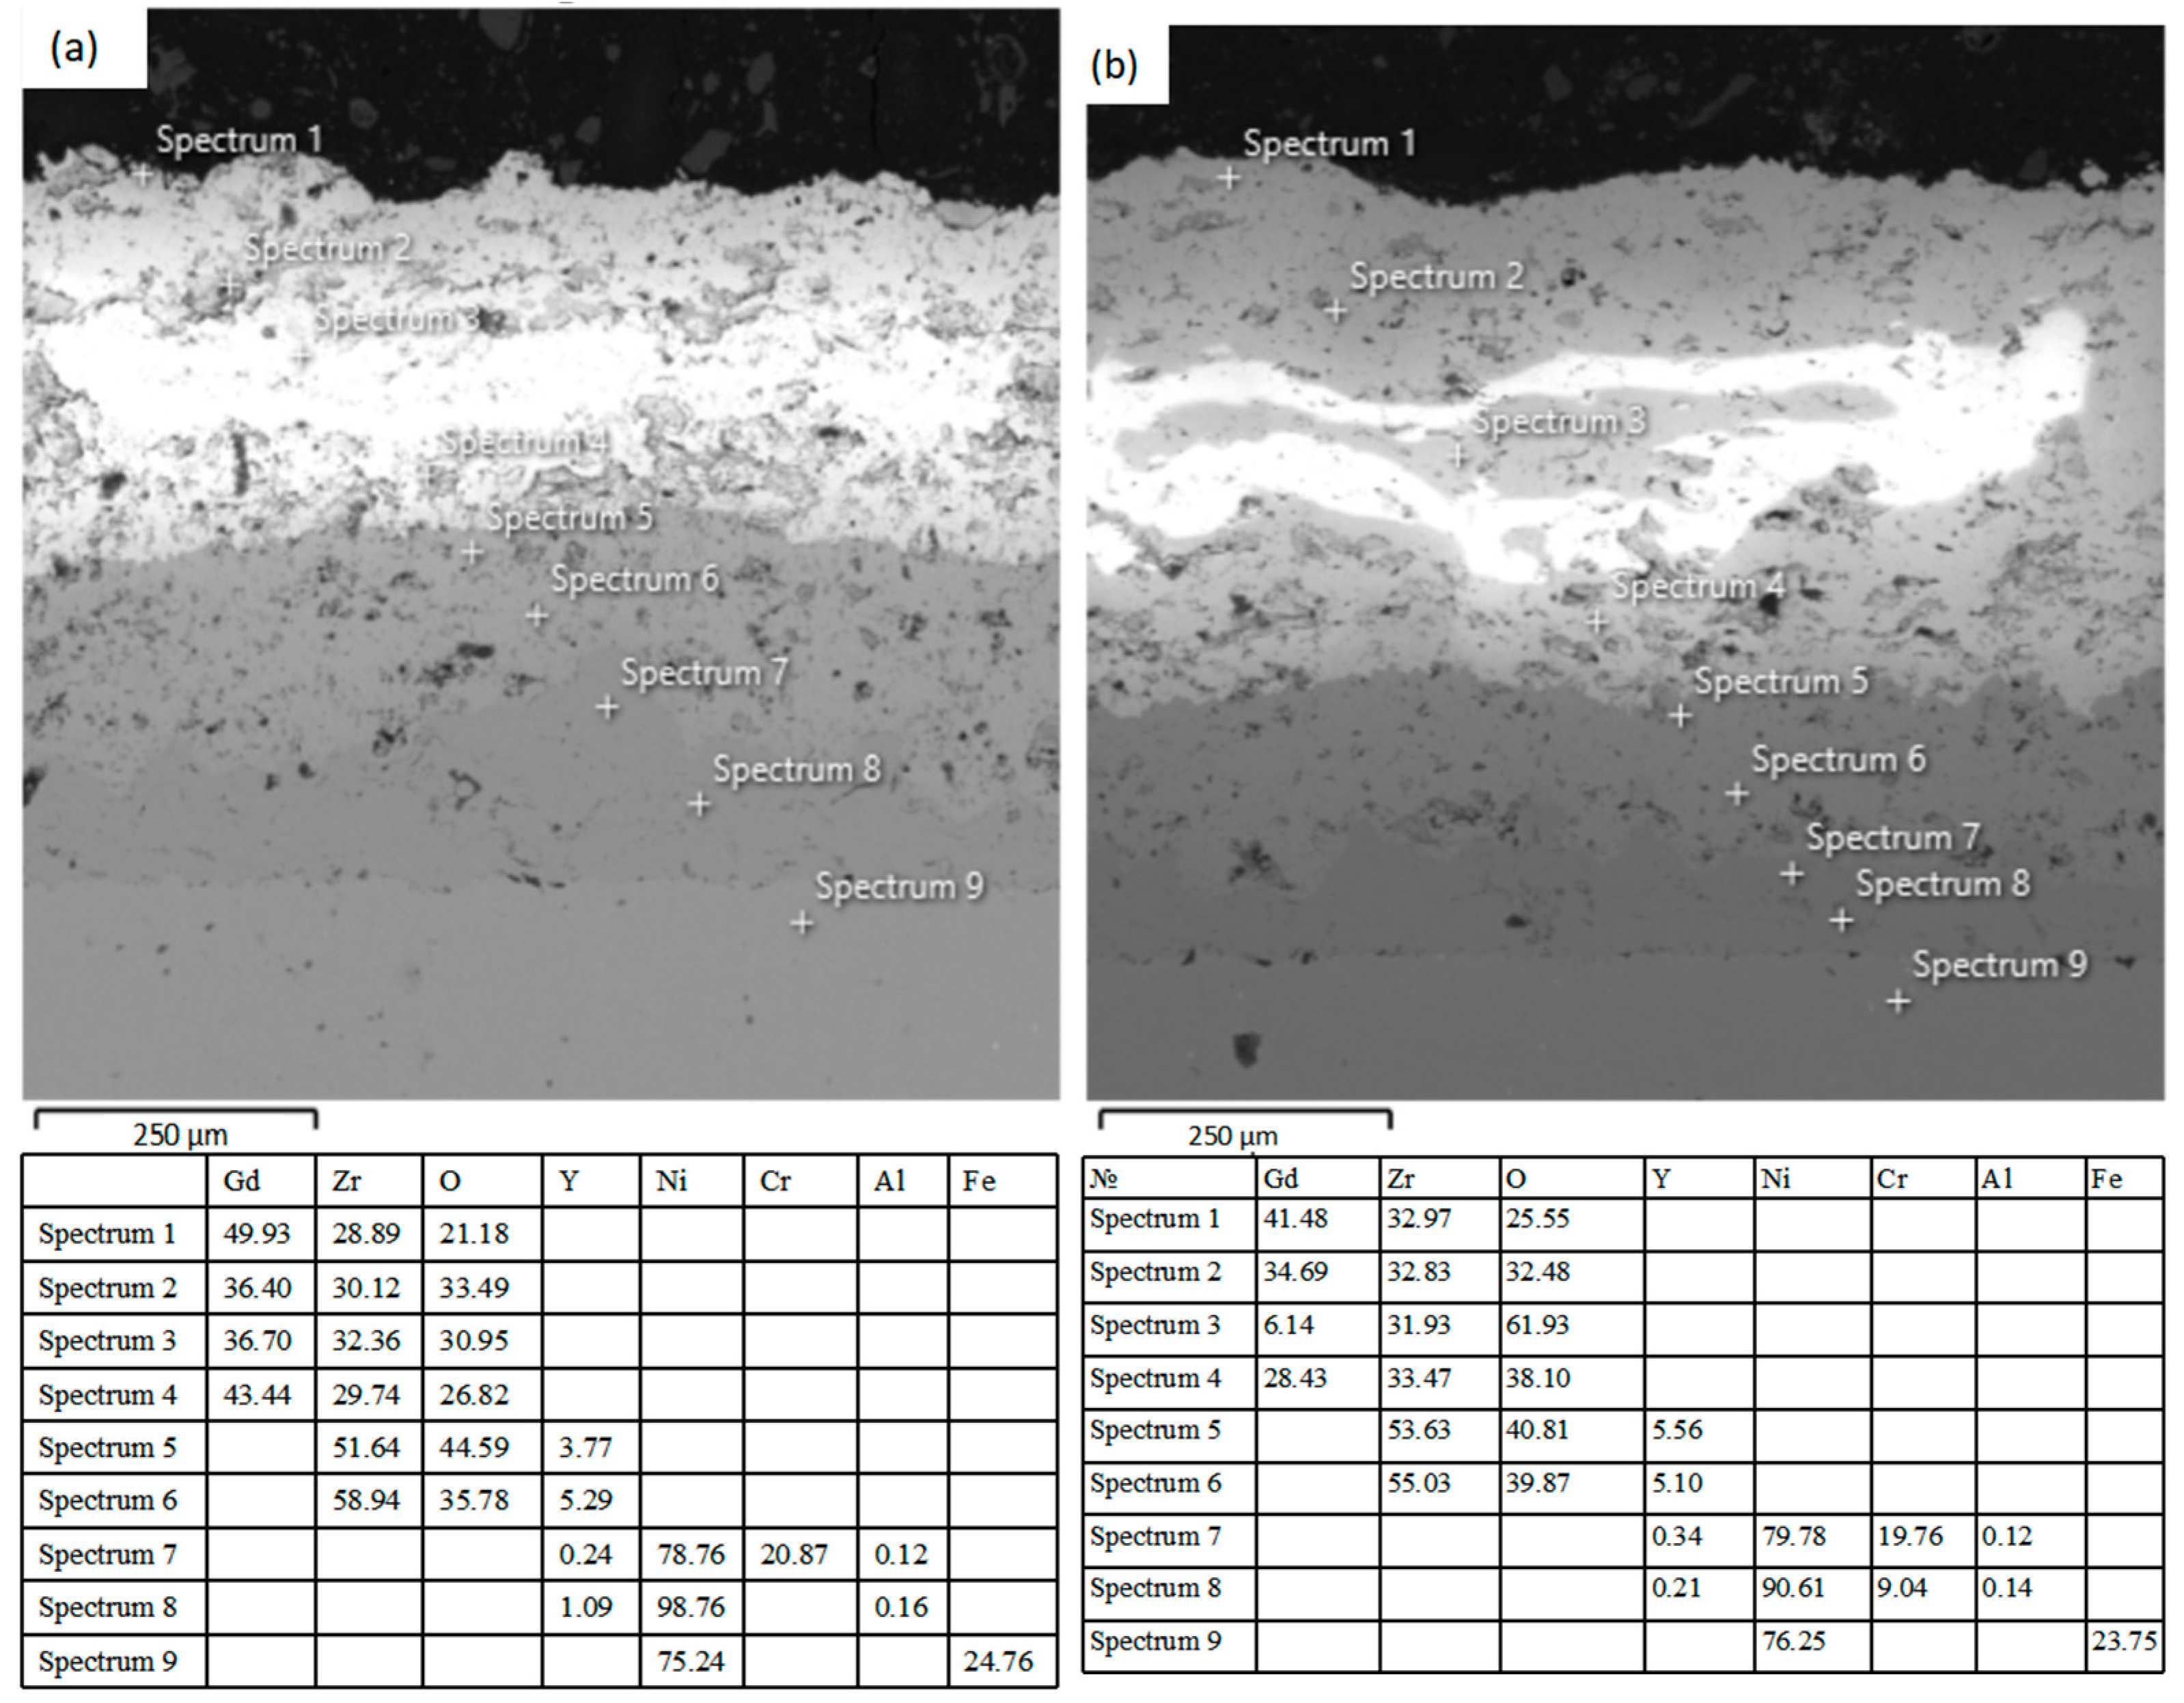
Point EDS analysis (Figure 7, points Spectrum 1–9, from the surface to the substrate) confirms a well-defined layered structure of the coatings for both spraying regimes (1.5 and 1.8 L/min).
Figure 7.
Cross-sectional microstructure of the YSZ/GZO coating on the Ni718 substrate with EDS analysis points (Spectrum 1–9): (a) sample GZO1, sprayed at a hydrogen flow rate of 1.5 L/min; (b) sample GZO2, sprayed at a hydrogen flow rate of 1.8 L/min.
GZO layer (points 1–4). The composition corresponds to gadolinium zirconate (Gd2Zr2O7): Gd 36.4–49.9 at.%, Zr 28.9–32.4 at.%, O 21.2–33.5 at.% (1.5 L/min); Gd 28.43–41.48 at.%, Zr 32.83–33.47 at.%, O 25.55–38.10 at.% (1.8 L/min). In both coatings, a decrease in the measured Gd content was observed among the analyzed points from the coating surface toward the GZO/YSZ interface, indicating local compositional variations within the APS-deposited GZO layer.
For the sample sprayed at 1.8 L/min, an additional local anomaly was identified (point Spectrum 3, in the region of a bright inclusion): Gd content was reduced to 6.14 at.%, and O was increased to 61.93 at.%, while Zr remained comparable to that at the other points (31.93 at.%, close to the 32.83–33.47 at.% range observed elsewhere). No comparable anomaly was identified at the analyzed points in the coating produced at 1.5 L/min. This local compositional variation in GZO2 is consistent with greater local compositional inhomogeneity observed under the higher hydrogen-flow condition.
YSZ layer (points 5–6). Zirconium (51.64–58.94 at.% and 53.63–55.03 at.%, respectively) and oxygen (35.78–44.59 at.% and 39.87–40.81 at.%) dominate, with stabilizing yttrium also present (3.77–5.29 at.% and 5.10–5.56 at.%). Gadolinium was not detected at the analyzed points within the YSZ layer, consistent with a compositionally distinct GZO/YSZ interface within the spatial resolution of the EDS analysis.
Bond coat and substrate (points 7–9). The bond coat is characterized by a high content of nickel (78.76–98.76 at.% and 79.78–90.61 at.%) and chromium (up to 20.87 at.% and 9.04–19.76 at.%), with trace amounts of aluminum—typical of NiCrAlY. The substrate (point 9) for both samples consists of an alloy based on Ni (75.24 and 76.25 at.%) and Fe (24.76 and 23.75 at.%), consistent with the composition of Ni718.
EDS mapping confirms the regular compositional variation from GZO through YSZ to the substrate, without evidence of pronounced interdiffusion within the spatial resolution of the EDS analysis. At the same time, increasing the hydrogen flow rate to 1.8 L/min leads to local structural and chemical inhomogeneity in the GZO layer, which, together with the increased porosity, indicates less homogeneous coating formation compared with the 1.5 L/min regime.
3.2. Coating Microstructure and CMAS Penetration Depth After Hot Corrosion Testing
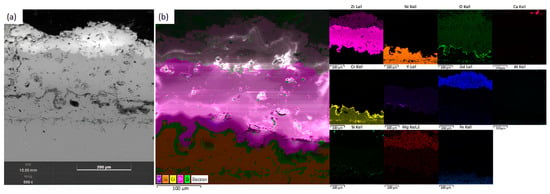
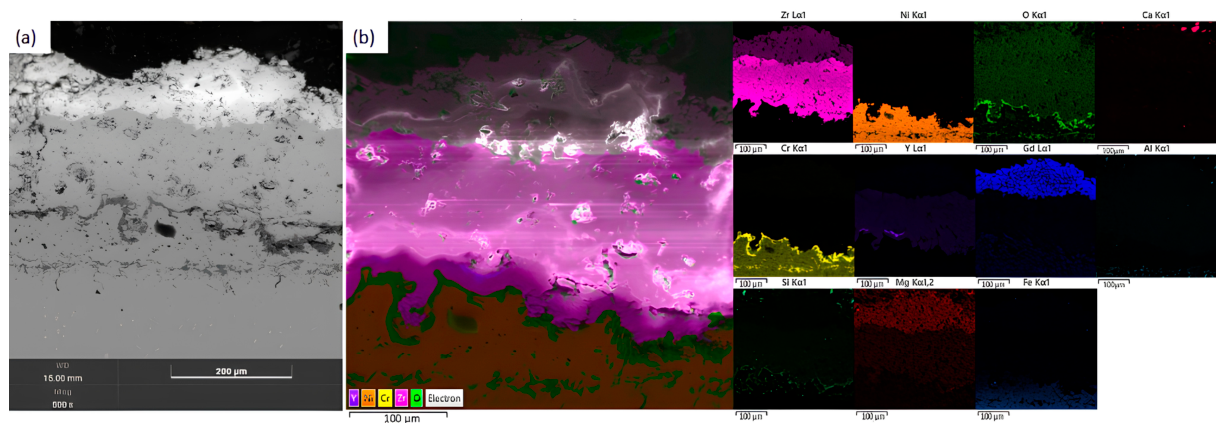
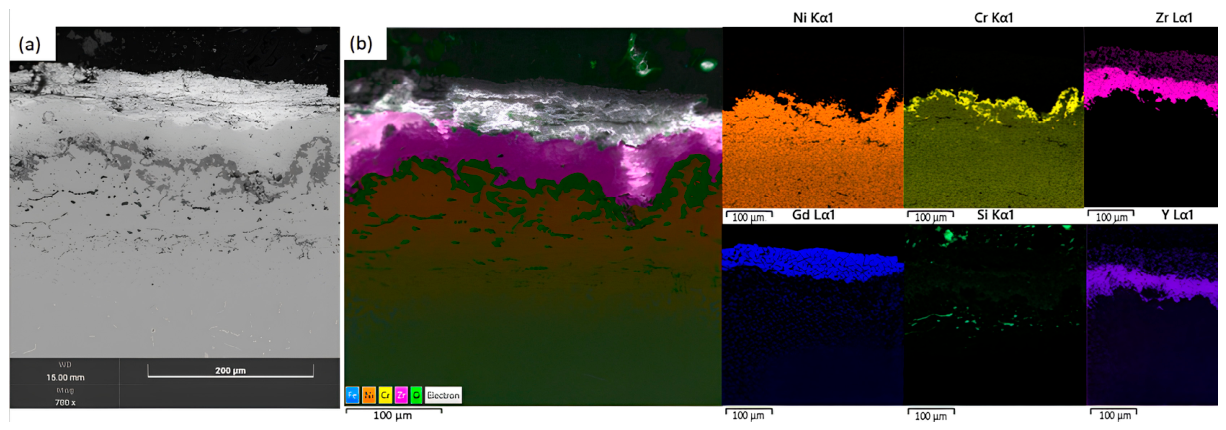
Figure 8 and Figure 9 show the cross-sections of the YSZ/GZO coatings of samples GZO1 and GZO2 after hot corrosion testing with applied CMAS: SEM images (a), combined EDS elemental maps (b), and the corresponding individual elemental maps.
Figure 8.
Cross-sectional microstructure of the GZO1 coating after CMAS hot-corrosion testing: SEM image (a), combined EDS elemental distribution map (b), and individual distribution maps.
Figure 9.
Cross-sectional microstructure of the GZO2 coating after CMAS hot-corrosion testing: SEM image (a), combined EDS elemental distribution map (b), and individual distribution maps.
In the SEM image of sample GZO1, the upper part of the GZO layer exhibits a visually altered, loose, and inhomogeneous morphology with characteristic bright, irregularly shaped agglomerates near the surface—solidified remnants of the CMAS melt and products of its reaction with the ceramic [29]. The underlying YSZ layer and the bond coat visually retain a dense, undamaged structure.
In the SEM image of sample GZO2, an extended bright band of irregular, sinuous morphology is clearly visible in the near-surface region, reflecting a similar process of interaction with CMAS; compared with GZO1, however, the zone of visible structural changes appears more extensive and inhomogeneous, with a more pronounced wavy penetration front [30].
The combined and individual EDS maps confirm the multilayer structure of the samples: Ca, Mg, and Si serve as markers of residual CMAS melt localized in the near-surface zone; Zr and Gd correspond to the GZO layer; Y together with Zr to the YSZ layer; Ni, Cr, and Al to the bond coat; and Fe to the substrate.
The Ca map for sample GZO1 shows a weak signal confined to a narrow near-surface region, whereas for GZO2 the signal is distributed over a substantially larger area and depth. A similar trend is observed for Mg—the signal is more intense and more uniformly distributed over the upper part of the coating in GZO2. The Si signal on both maps is weak and diffuse, localized mainly in the zone of CMAS–ceramic reaction products, consistent with the silicate phases identified by XRD.
The elemental distribution maps of Zr and Gd show continuity of the GZO layer, with no visible discontinuities in either coating. The O distribution map reveals a distinct wavy band of increased signal intensity at the bond coat/ceramic interface, corresponding to the TGO region. The Ni and Cr distribution maps clearly delineate the bond coat region, with a local increase in Cr signal intensity observed near the TGO interface. The Al signal is relatively weak and diffuse in both coatings. The higher average TGO thickness observed for GZO2 may be associated with its higher porosity, which facilitates oxygen transport to the bond coat interface.
The measured TGO thickness ranged from 15 to 20 μm for GZO1 and 17–23 μm for GZO2. The mean values, calculated from the average values of three individual specimens, were 17.20 ± 0.53 μm for GZO1 and 19.53 ± 0.23 μm for GZO2 (mean ± standard deviation, n = 3 specimens). Thus, despite the overlap in the ranges of the individual local measurements, the GZO2 coating exhibited a higher mean TGO thickness compared with GZO1. Given the limited number of independent specimens, this difference is regarded as an experimentally observed trend rather than a statistically confirmed difference. The greater and less uniform TGO thickness in GZO2 is consistent with its higher porosity. The Ni and Cr maps clearly delineate the bond-coat region, while the Cr signal is locally enhanced along the wavy TGO interface, indicating Cr enrichment within the TGO region. The Al signal remains weak and diffuse in both coatings.
This elemental distribution indicates deeper penetration of the CMAS melt into the GZO2 coating compared with GZO1, consistent with the higher porosity of GZO2 (1.25% versus 0.89%) and the local structural inhomogeneity previously identified in its GZO layer [31].
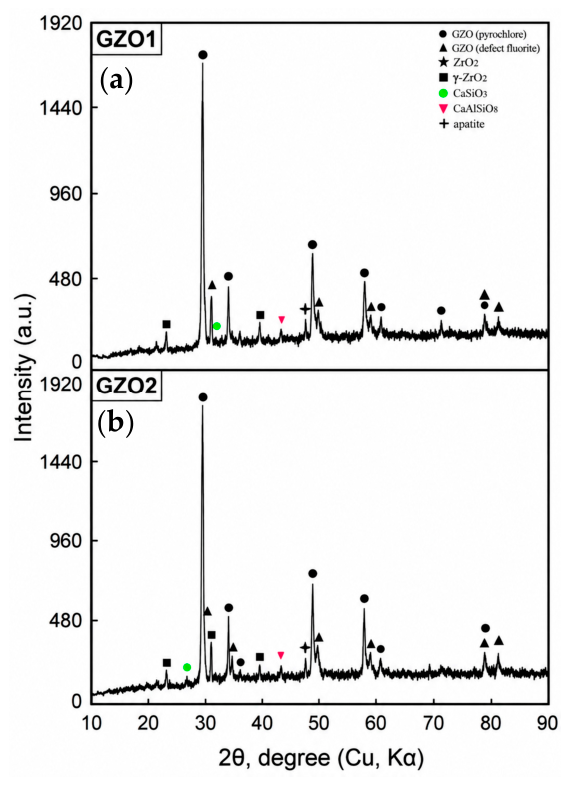
The XRD pattern of GZO1 (Figure 10) after CMAS exposure is dominated by reflections attributed to the pyrochlore phase, indicating that pyrochlore remains the dominant crystalline phase in the analyzed region. Reflections of a defect fluorite phase accompanying the pyrochlore are additionally recorded, along with reflections associated with the YSZ layer—tetragonal t′-ZrO2 and trace peaks of monoclinic m-ZrO2, the appearance of which indicates partial local destabilization of the tetragonal phase due to thermal stresses.
Figure 10.
XRD patterns of the GZO1 (a) and GZO2 (b) coatings after CMAS hot-corrosion testing.
A key result for assessing corrosion resistance is the appearance in both diffraction patterns of coating–CMAS melt reaction products: CaSiO3 (wollastonite), CaAl2Si2O8 (anorthite), and a Gd-based apatite-like phase—the crystalline product of the protective reaction between Gd2Zr2O7 and the melt. The set of identified phases in GZO1 and GZO2 is qualitatively the same; however, the intensities of the CaSiO3 and CaAl2Si2O8 peaks on the GZO2 diffraction pattern are noticeably higher, which correlates with the EDS mapping data indicating deeper penetration of Ca and Mg into the bulk of this coating.
The combined SEM, EDS, and XRD results indicate that GZO1 exhibited a shallower CMAS-affected zone than GZO2 under the applied test conditions. The CMAS-affected region in GZO1 was largely confined to the near-surface portion of the GZO layer. The GZO2 coating, characterized by higher porosity (1.25%) and a greater TGO thickness (17–23 μm), showed deeper and more extensive melt penetration, reducing the effectiveness of the protective mechanism. At the same time, the formation of the apatite-like phase in both samples confirmed the operation of a self-protective mechanism arising from the reaction of Gd2Zr2O7 with the CMAS melt, which limits further infiltration into the coating.
The formation of reaction products such as CaSiO3, CaAl2Si2O8, and a Gd-based apatite-like phase observed here is consistent with the reaction pathway described by Li et al. [20] for Sc-doped GZO/YSZ coatings exposed to CMAS at 1200–1250 °C, where fluorite-type and apatite-type products formed a reaction layer that suppressed further melt infiltration. In our case, the more limited and superficial formation of reaction products in GZO1 compared with GZO2 reflects the porosity-dependent infiltration behavior described in [18], and is consistent with the three-criteria model proposed by Wang et al. [21]—thin reaction-layer thickness, large residual melt thickness, and a compact, stable reaction layer—who argued that CMAS resistance should be evaluated according to all three factors jointly, rather than by melt penetration depth alone. Considering these criteria, the thinner reaction layer and more limited Ca/Mg penetration in GZO1 indicate a more effective self-limiting protective mechanism than in GZO2, where the higher porosity promotes deeper and less uniform infiltration—consistent with the general CMAS degradation mechanisms summarized in the review by Nair and Brabazone [32].
The slightly greater TGO thickness observed beneath GZO2 can also be considered in relation to the permeability of the ceramic top coat. Previous investigations of multilayer GZO/YSZ TBC systems have shown that the growth and stress state of the TGO are critical factors governing high-temperature degradation and coating lifetime [33,34]. Mahade et al. [28], for example, reported lower TGO growth in multilayer GZO/YSZ systems compared with conventional single-layer YSZ coatings during isothermal oxidation, indicating that the architecture and transport characteristics of the ceramic layers can influence oxygen access to the bond coat.
However, the effectiveness of this protective mechanism depends strongly on the initial coating microstructure. The deeper Ca and Mg distribution observed in GZO2 indicates that its higher porosity and local structural inhomogeneity provided more accessible infiltration paths before an effective reaction barrier could develop. Wang et al. [21] recently emphasized that CMAS resistance should therefore be assessed not solely by penetration depth but also by the thickness, compactness, and stability of the reaction layer and by the amount of residual melt retained at the coating surface. In this context, the shallower CMAS-affected zone observed for GZO1 supports its higher corrosion resistance, although quantitative characterization of the reaction-layer thickness would be required for a complete evaluation according to these criteria.
To quantitatively assess the difference in CMAS infiltration between the coatings, three independent specimens were analyzed for each coating condition, with three local penetration-depth measurements obtained from each specimen. The three local measurements were averaged for each specimen, and the final values were calculated from the three independent specimen averages (n = 3). The mean CMAS penetration depth was 41.22 ± 4.18 μm for GZO1 and 60.44 ± 4.82 μm for GZO2 (mean ± SD, n = 3 independent specimens), as summarized in Table 3. Thus, the mean penetration depth in GZO2 was approximately 1.47 times, or 46.6%, greater than that in GZO1. These quantitative results are consistent with the EDS elemental maps and indicate shallower CMAS infiltration in GZO1 under the applied test conditions.
Table 3.
Quantitative CMAS penetration depth.
The identification of CaSiO3, CaAl2Si2O8, and a Gd-based apatite-like phase is consistent with chemical interaction between the GZO layer and molten CMAS. The formation of these reaction products may contribute to restricting further melt infiltration, as reported for related GZO-based coating systems. Under the present experimental conditions, GZO1 exhibited a shallower CMAS penetration depth than GZO2, indicating better resistance to CMAS infiltration among the two investigated coating conditions. However, because CMAS exposure and thermal cycling were evaluated separately in this study, further combined CMAS–thermal cycling experiments would be required before extrapolating these results to practical gas-turbine operating conditions.
The rapid formation of a dense reaction layer (CaSiO3, CaAl2Si2O8, Gd-based apatite), as observed for GZO1, may reduce the risk of premature coating failure in turbines exposed to dust or volcanic ash. Since these characteristics depend on the hydrogen flow rate during APS, this parameter could serve as a lever for tailoring CMAS resistance without changing the ceramic composition. Quantifying the benefit for service life would require longer, field-representative testing.
3.3. Thermal Cycling Tests of YSZ/GZO Coatings
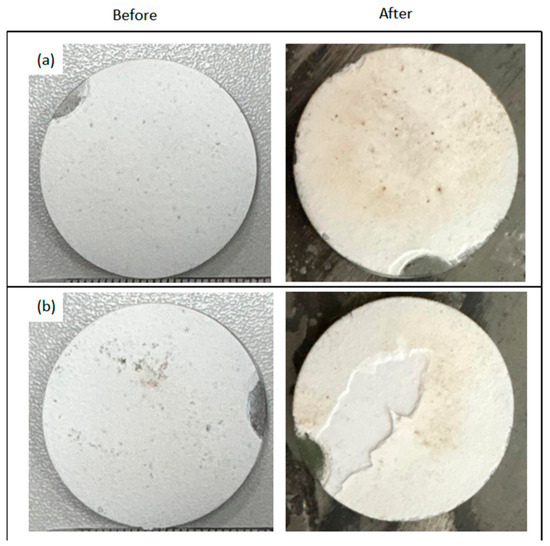
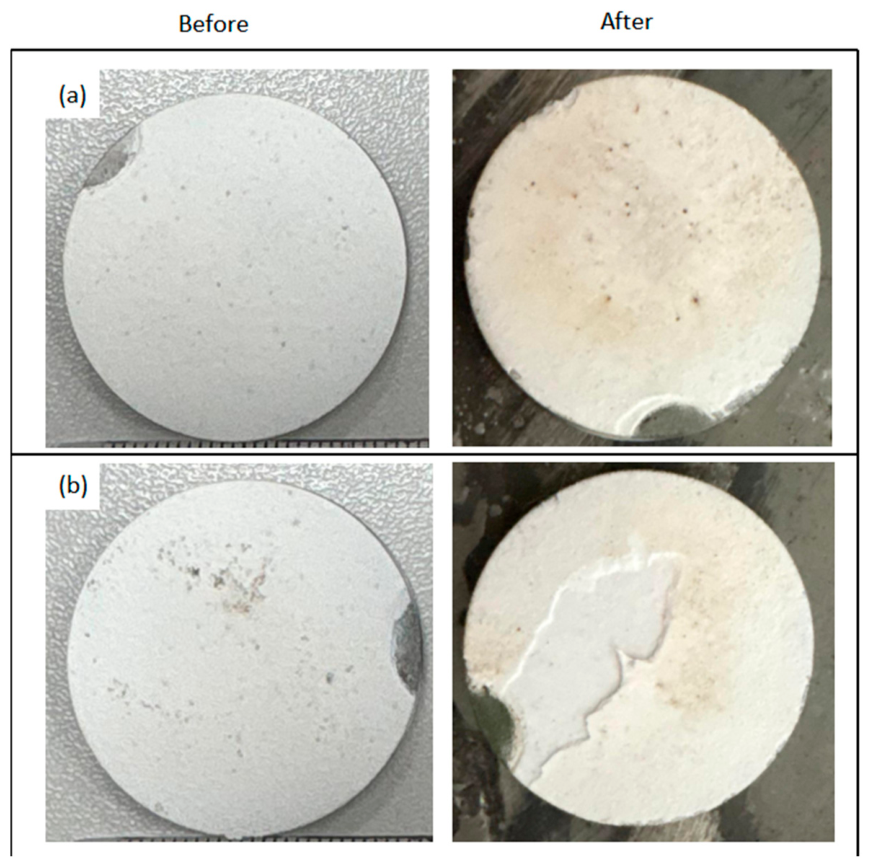
Figure 11 shows the appearance of the GZO1 (a) and GZO2 (b) coating samples before and after thermal cycling testing.
Figure 11.
Appearance of the GZO1 (a) and GZO2 (b) coating samples before and after thermal cycling testing.
For sample GZO1 (Figure 11a), macrostructural integrity was fully preserved after 300 thermal cycles—no visible cracks, chipping, or coating spallation were detected. Only a slight change in surface tone and isolated small dark spots were observed, which are characteristic of surface thermally induced processes and do not indicate degradation of the bulk coating structure.
For sample GZO2 (Figure 11b), after the same 300 cycles, pronounced cracking of the coating surface was observed, with the formation of an extended, irregular, branched through-crack dividing the sample into fragments.
Thus, under identical test conditions, visual comparison of the samples demonstrates a substantially lower thermal cycling resistance of the GZO2 coating compared with GZO1.
The observed difference is consistent with the strong dependence of thermal-cycling durability on the microstructure of GZO-based coatings reported in previous studies. Bakan et al. [19] demonstrated that the thermal-cycling lifetime of GZO/YSZ double-layer coatings is governed not only by total porosity but also by pore morphology and the resulting elastic compliance of the GZO layer. In addition, multilayer YSZ/GZO systems have been shown to provide improved high-temperature durability when an appropriate balance between strain tolerance, microstructural stability, and interfacial compatibility is achieved [35]. In the present study, GZO1 and GZO2 differed not only in total porosity but also in coating thickness and microstructural homogeneity. Therefore, the greater thermal-cycling damage observed in GZO2 cannot be attributed to porosity alone but is more appropriately associated with the combined effects of these microstructural characteristics.
A similar influence of TGO morphology and non-uniform oxide growth on the thermal-shock behavior of multilayer GZO/YSZ coatings was reported by Sadri et al. [36]. In the present study, the greater visible damage observed in GZO2 was accompanied by a higher mean TGO thickness; however, because the TGO thickness ranges partially overlapped and the difference was not statistically confirmed, this relationship is interpreted as an experimental trend rather than as evidence of a direct causal relationship.
To complement the visual assessment of cracking and spallation, the mass change in five independently tested specimens for each coating condition (n = 5) was determined before and after 300 thermal cycles and normalized to the exposed surface area, Δm/S = (m300 − m0)/S. After 300 cycles, all GZO1 specimens exhibited a positive net mass change, with a mean value of +1.87 ± 2.56 mg/cm2, whereas all GZO2 specimens showed a negative net mass change, with a mean value of −0.59 ± 0.15 mg/cm2 (mean ± SD, n = 5). The positive mass change in GZO1 indicates that net mass gain processes exceeded material loss under the applied cycling conditions, whereas the negative mass change in GZO2 is consistent with net material loss, in agreement with the observed local spallation.
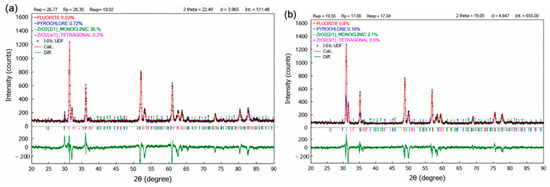
The XRD patterns of GZO1 and GZO2 recorded after 300 thermal cycles are shown in Figure 12. In addition to the qualitative comparison of the diffraction patterns, quantitative phase analysis was performed using Rietveld refinement in PowderCell for Windows, Version 2.4. The corresponding Rietveld refinement profiles for GZO1 and GZO2 are presented in Figure 13. The refined phase fractions for GZO1 were 72.1% pyrochlore, 0.3% defect fluorite, 26.9% monoclinic ZrO2, and 0.7% tetragonal ZrO2, whereas GZO2 contained 16.0% pyrochlore, 81.9% defect fluorite, and 2.1% monoclinic ZrO2, with the tetragonal ZrO2 contribution being negligible (0.0%). The corresponding refinement parameters were Rp = 26.37%, Rwp = 36.26%, and Rexp = 18.02% for GZO1, and Rp = 19.55%, Rwp = 27.00%, and Rexp = 17.04% for GZO2.
Figure 12.
XRD patterns of the GZO1 and GZO2 coatings after thermal cycling testing.
Figure 13.
Rietveld refinement of the XRD patterns of the coatings after 300 thermal cycles using PowderCell for Windows, Version 2.4: (a) GZO1 and (b) GZO2. The observed (Ind), calculated (SUM), and difference (DIFF) profiles are shown together with the Bragg reflection positions of the identified crystalline phases.
The Rietveld refinement indicates a substantially larger contribution of the defect fluorite structure in GZO2 after thermal cycling, whereas the pyrochlore structure remains predominant in GZO1. However, considering the relatively high refinement residuals and the characteristics of plasma-sprayed coatings, including surface roughness, possible preferred orientation, differences in coating thickness, and X-ray sampling-depth effects, the refined phase fractions should be regarded as semi-quantitative rather than absolute phase contents. Nevertheless, the pronounced difference in the refined phase contributions between GZO1 and GZO2 indicates a greater degree of structural disordering in GZO2 after thermal cycling [37]. These results demonstrate an association between phase evolution and the more pronounced structural degradation observed in GZO2; however, they do not establish the increased defect-fluorite contribution as the direct cause of coating failure.
Overall, GZO1 retained greater structural integrity after 300 thermal cycles than GZO2, which exhibited more pronounced cracking and local spallation. These observations suggest that, within the comparatively low porosity range investigated here, structural homogeneity may have contributed more strongly to the observed durability differences than total porosity alone. However, because the two coating conditions also differed substantially in GZO layer thickness, the individual contributions of microstructural homogeneity, porosity, and coating thickness cannot be fully separated within the present experimental design.
The established difference in the pyrochlore/fluorite ratio between GZO1 and GZO2 after thermal cycling is consistent with the visual inspection results: the larger contribution of the disordered fluorite phase in GZO2 correlates with the macroscopic cracking observed in this sample, whereas the predominantly single-phase pyrochlore composition of GZO1 corresponds to the preservation of its integrity. Given that the phase compositions of the two coatings in the as-deposited state were initially similar, the more pronounced fluorite-related reflections observed for GZO2 after 300 cycles suggest a greater susceptibility of its GZO structure to thermally induced disordering. This phase evolution occurs concurrently with the higher initial porosity and macroscopic cracking of GZO2; therefore, it should be regarded as part of the overall degradation response rather than as the sole cause of coating failure. The results are consistent with previous studies showing that the durability of GZO/YSZ coatings is controlled by the combined effects of microstructure, elastic compliance, interfacial stresses, and thermally induced structural evolution [38].
The combined XRD and visual inspection data after thermal cycling show that the GZO1 coating exhibits higher thermal cycling resistance, retaining a predominantly ordered pyrochlore structure and macroscopic integrity, whereas the GZO2 coating, with its higher initial porosity, is characterized both by more pronounced accumulation of the defect fluorite phase and by through-thickness surface cracking. These results indicate an association between the more homogeneous microstructure of GZO1 and its improved phase and mechanical stability under the applied thermal-cycling conditions.
The observed thermal-cycling behavior is consistent with previous studies showing that the durability of GZO/YSZ coatings depends on the combined effects of porosity, pore and crack architecture, elastic compliance, interfacial stresses, and phase evolution [17,18,19,38]. In the present study, however, the individual contributions of these factors cannot be fully separated because the two coating conditions also differed substantially in GZO layer thickness. Therefore, the greater damage observed in GZO2 is interpreted as being associated with the combined effects of processing-induced microstructural differences rather than with total porosity alone.
3.4. TMA and Structural-Phase Characterization of GZO1 and GZO2 Coatings After Testing
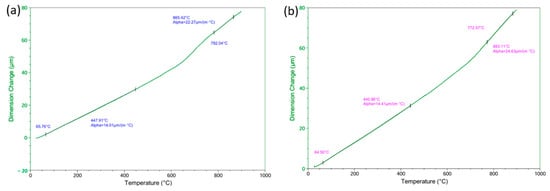
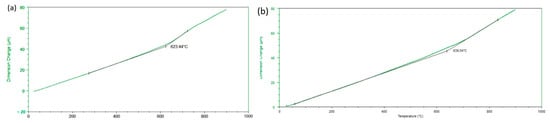
Figure 14 shows representative thermomechanical curves ΔL(T) for the GZO1 (a) and GZO2 (b) coatings during heating from room temperature to 900 °C. TMA measurements were performed on two independent specimens for each coating condition. For each specimen, two approximately linear temperature regions with different slopes were identified, and the corresponding effective coefficients of thermal expansion (CTEs) were calculated using the instrument software.
Figure 14.
Representative thermomechanical curves showing the linear dimensional change as a function of temperature for (a) GZO1 and (b) GZO2.
For GZO1, the mean effective CTE was 14.11 ± 0.13 μm/(m·°C) in the lower-temperature region and 22.61 ± 0.48 μm/(m·°C) in the higher-temperature region. For GZO2, the corresponding values were 14.44 ± 0.04 and 23.42 ± 1.71 μm/(m·°C), respectively (mean ± SD, n = 2 independent specimens). The specimen-to-specimen variation was small in the lower-temperature region, whereas greater variability was observed for GZO2 in the higher-temperature region.
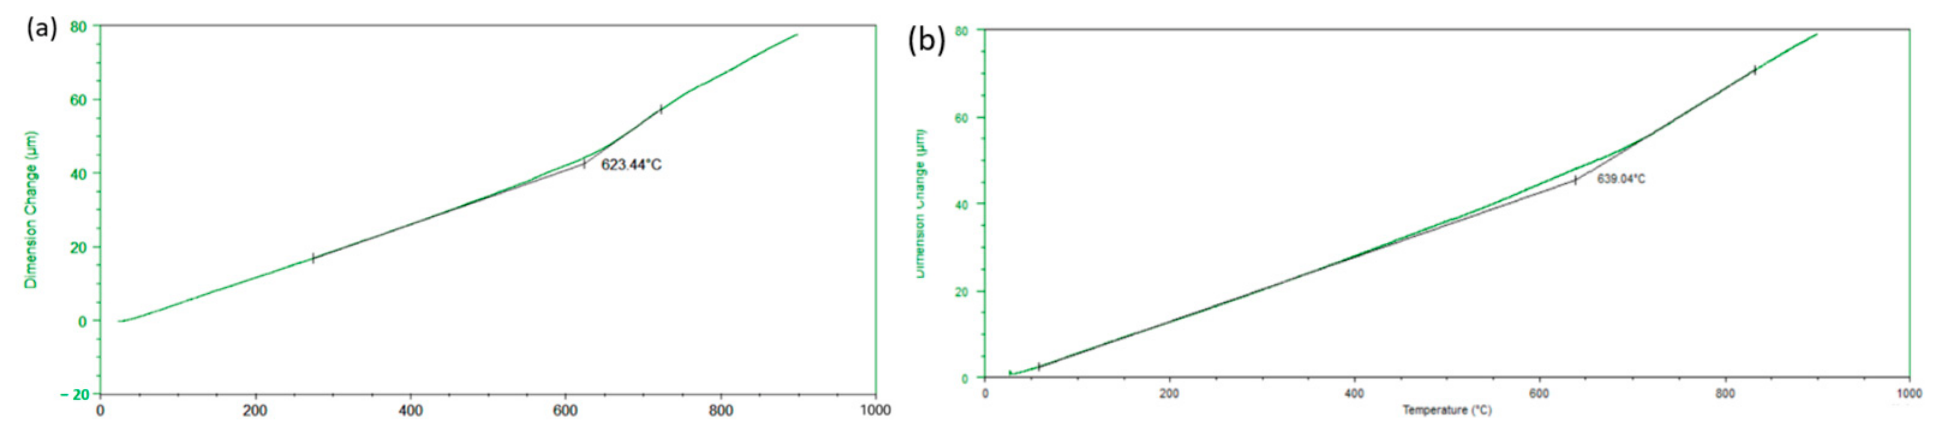
Figure 15 presents the heating and cooling segments within a single TMA thermal cycle for both coatings. For the representative GZO1 curve, the heating and cooling branches nearly coincide in the lower- and higher-temperature regions, whereas a slight hysteresis is observed around an inflection temperature of 623.44 °C. For the representative GZO2 curve, the inflection occurs at a somewhat higher temperature of 639.04 °C, and a wider separation between the heating and cooling branches is observed in this region. These observations indicate differences in the effective thermomechanical response of the two coatings; however, the physical origin of the inflection cannot be determined from the TMA data alone.
Figure 15.
Determination of the inflection temperature by the tangent-intersection method applied to representative thermomechanical curves: (a) GZO1 (Tinf = 623.44 °C) and (b) GZO2 (Tinf = 639.04 °C).
The higher inflection temperature and more pronounced hysteresis observed for GZO2 indicate differences in the thermomechanical response of the two coating conditions. These differences may be associated with their different microstructural characteristics, including porosity, coating thickness, and structural inhomogeneity. However, TMA alone does not provide direct evidence of a specific structural ordering mechanism. Therefore, the observed inflection is interpreted here as a characteristic change in the effective thermomechanical response rather than as a glass transition or a specific pyrochlore ordering transition.
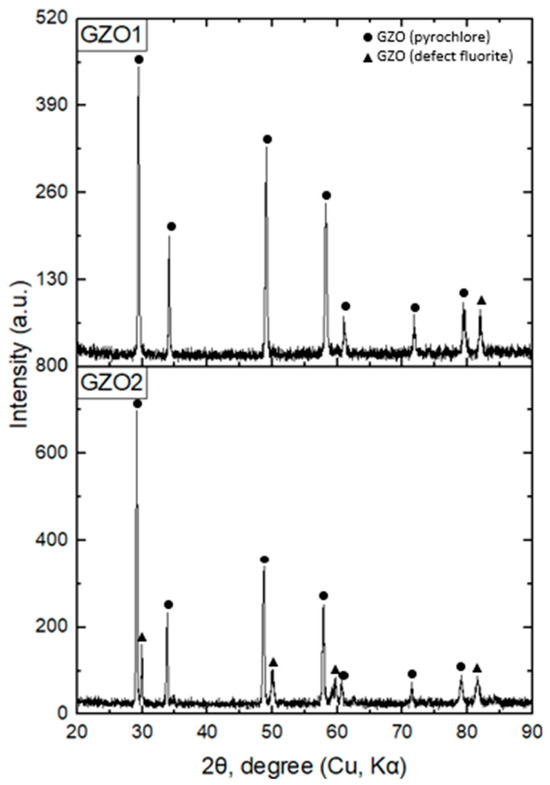
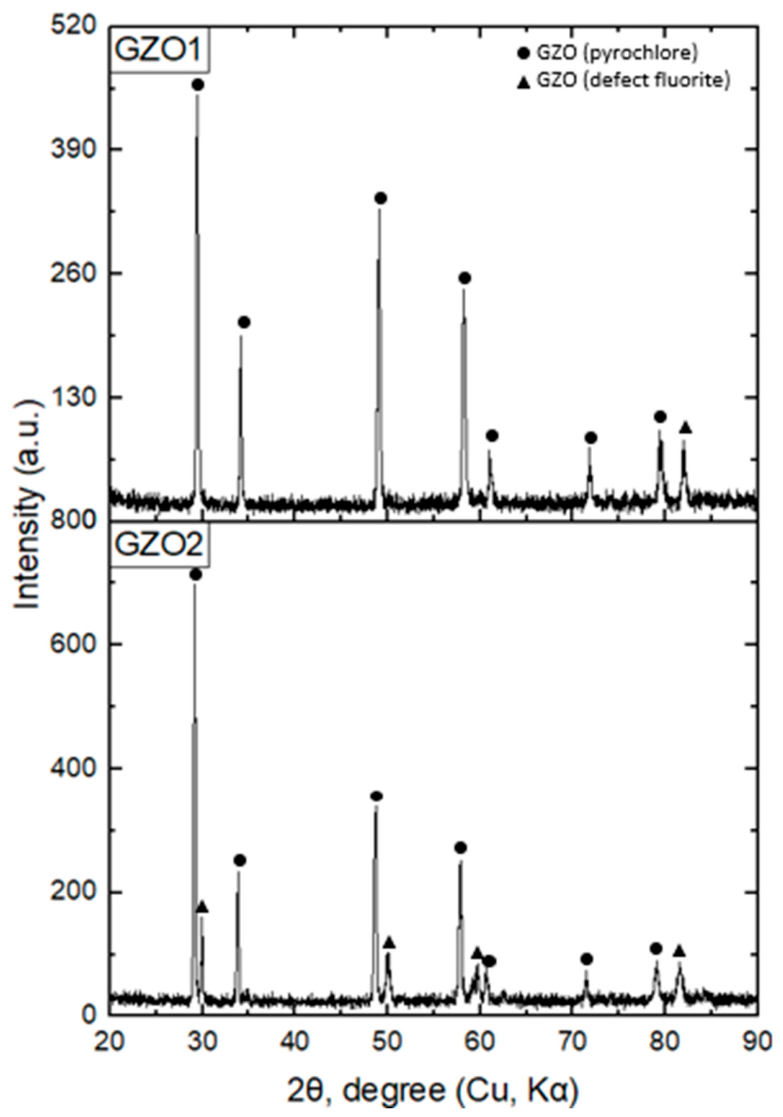
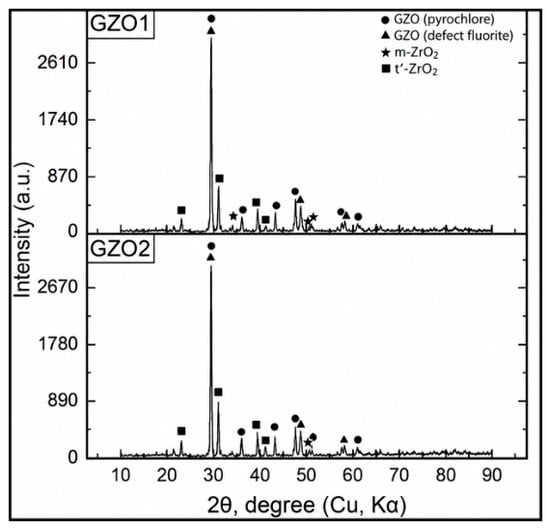
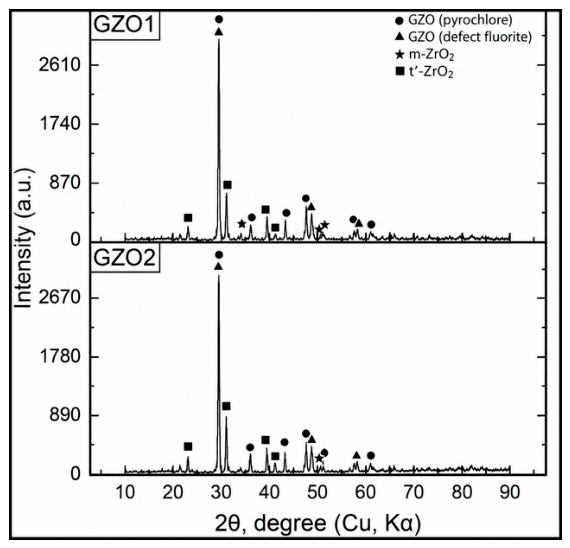
The XRD patterns recorded after TMA for GZO1 and GZO2 are shown in Figure 16. Both coatings exhibit reflections attributable to pyrochlore Gd2Zr2O7, the defect-fluorite phase, t′-ZrO2, and minor m-ZrO2. Thus, ex situ XRD confirms the presence of these crystalline phases after thermal exposure to 900 °C. However, because the XRD measurements were performed only after TMA and not in situ as a function of temperature, the diffraction results cannot establish whether the inflection observed in the TMA curves is associated with a temperature-dependent structural transformation.
Figure 16.
X-ray diffraction (XRD) patterns of the coatings after TMA: GZO1 and GZO2.
The combined TMA and ex situ XRD results demonstrate differences in the thermomechanical response of GZO1 and GZO2, with representative inflection temperatures of 623.44 and 639.04 °C, respectively. However, in the absence of temperature-resolved in situ XRD, differential scanning calorimetry (DSC), Raman spectroscopy, or other complementary temperature-resolved measurements, the physical origin of these inflections cannot be unambiguously assigned to a glass transition or a specific pyrochlore ordering mechanism. Therefore, the inflection temperatures are considered characteristic thermomechanical parameters rather than glass-transition temperatures.
The mean low-temperature effective CTE obtained for GZO1 (14.11 ± 0.13 μm/(m·°C)) is close to the range reported for Gd2Zr2O7 pyrochlore ceramics by Tuncer et al. [16] and remains somewhat higher than the CTE commonly reported for YSZ (~11 μm/(m·°C)) [39]. In the higher-temperature region, the mean effective CTE increased to 22.61 ± 0.48 μm/(m·°C) for GZO1 and 23.42 ± 1.71 μm/(m·°C) for GZO2 (mean ± SD, n = 2 independent specimens), indicating a change in the effective thermomechanical response of both coatings at elevated temperatures. Although order–disorder transformations have been reported for zirconates with the pyrochlore structure, the present TMA and ex situ XRD data are insufficient to assign the observed inflection directly to such a transformation. Temperature-resolved in situ structural or calorimetric measurements would be required to establish its physical origin.
4. Conclusions
This study demonstrates that variation in the hydrogen flow rate during APS deposition of the GZO top layer is associated with measurable changes in the microstructure, CMAS resistance, thermal-cycling behavior, and thermomechanical response of multilayer NiCrAlY/YSZ(HVOF)/GZO(APS) thermal barrier coatings. By evaluating these degradation mechanisms using coatings produced under the same deposition conditions within a common experimental framework, this work provides insight into the relationship between the APS processing conditions, resulting coating characteristics, and high-temperature performance.
Increasing the hydrogen flow rate from 1.5 to 1.8 L/min was accompanied by an increase in GZO layer thickness from 313.48 to 467.57 μm and in porosity from 0.89 ± 0.11% to 1.25 ± 0.05% (mean ± SD, n = 3 independent specimens), together with greater local microstructural inhomogeneity. Because the change in hydrogen flow rate was accompanied by simultaneous changes in coating thickness and porosity, the individual contributions of these factors to the observed performance differences cannot be fully separated within the present experimental design.
In the as-deposited state, both coatings were predominantly characterized by the Gd2Zr2O7 pyrochlore structure, without pronounced qualitative differences in the identified crystalline phases. The subsequent differences in coating behavior are therefore associated with the combined effects of processing-induced microstructural characteristics, including porosity, structural homogeneity, and coating thickness, rather than being attributed solely to differences in the initial phase composition.
During CMAS hot-corrosion testing, GZO1 exhibited a shallower CMAS-affected region than GZO2. The mean CMAS penetration depth was 41.22 ± 4.18 μm for GZO1 and 60.44 ± 4.82 μm for GZO2, corresponding to an approximately 46.6% greater penetration depth in GZO2. The mean TGO thickness was 17.20 ± 0.53 μm for GZO1 and 19.53 ± 0.23 μm for GZO2 (mean ± SD, n = 3 independent specimens). Given the limited number of independent specimens, the difference in TGO thickness should be interpreted as an experimental trend rather than as a statistically confirmed difference.
After 300 thermal cycles, GZO1 retained greater structural integrity, whereas GZO2 exhibited more pronounced cracking and local spallation. Rietveld refinement indicated a substantially larger contribution of the defect-fluorite structure in GZO2 after thermal cycling, whereas the pyrochlore structure remained predominant in GZO1. This phase evolution was associated with the more pronounced degradation observed in GZO2 but should not be interpreted as the direct cause of coating failure.
TMA measurements performed on two independent specimens per coating condition showed mean effective CTE values of 14.11 ± 0.13 and 22.61 ± 0.48 μm/(m·°C) in the lower- and higher-temperature regions, respectively, for GZO1. The corresponding values for GZO2 were 14.44 ± 0.04 and 23.42 ± 1.71 μm/(m·°C) (mean ± SD, n = 2 independent specimens). Representative TMA curves exhibited inflection temperatures of approximately 623 °C for GZO1 and 639 °C for GZO2. These features are interpreted as changes in the effective thermomechanical response of the coatings rather than as glass-transition temperatures or evidence of a specific pyrochlore ordering transition. Their physical origin cannot be unambiguously established without complementary temperature-resolved in situ structural or calorimetric measurements.
Overall, among the two investigated spraying conditions, the coating produced at the lower hydrogen flow rate of 1.5 L/min exhibited lower porosity, greater microstructural homogeneity, shallower CMAS infiltration, and better preservation of structural integrity after 300 thermal cycles. However, because hydrogen flow rate, coating thickness, porosity, and microstructural characteristics varied simultaneously, the improved performance cannot be attributed exclusively to the hydrogen flow rate. Additional controlled experiments using coatings of comparable thickness are required to quantitatively decouple these effects. Furthermore, thermal cycling and CMAS exposure were evaluated separately; therefore, combined CMAS–thermal cycling experiments under representative thermal gradients and mechanical loading would be required before extrapolating the present results to practical gas-turbine operating conditions.
5. Patents
The original solutions reported for the combined protective coating were protected by Patent No. 38199, application No. 2025/0537.1, filed on 4 June 2025 with the National Institute of Intellectual Property RSE, Ministry of Justice of the Republic of Kazakhstan, Astana, and issued on 14 August 2026, entitled “Combined Protective Coating,” by authors B.K. Rakhadilov, N.M. Magazov, I.K. Abizhanova, S.A. Abdulina, A. Kusainov, and D.B. Buitkenov.
Author Contributions
Conceptualization, A.K. and S.A.; methodology, M.D. and R.K.; software, R.K.; validation, S.A. and I.A.; formal analysis, I.A.; investigation, I.A. and M.D.; resources, M.D.; data curation, S.A.; writing—original draft preparation, I.A.; writing—review and editing, A.K. and S.A.; visualization, I.A.; supervision, A.K. All authors have read and agreed to the published version of the manuscript.
Funding
This research was funded by the Science Committee of the Ministry of Education and Science of the Republic of Kazakhstan (Grant No. AP23489951).
Data Availability Statement
The raw data supporting the conclusions of this article will be made available by the authors on request.
Conflicts of Interest
Authors Merkhat Dautbekov and Rashid Kuanyshbay were employed by the company PlasmaScience LLP. The remaining authors declare that the research was conducted in the absence of any commercial or financial relationships that could be construed as a potential conflict of interest.
Abbreviations
The following abbreviations are used in this manuscript:
| TBC | Thermal Barrier Coating |
| TGO | Thermally Grown Oxide |
| YSZ | Yttria-Stabilized Zirconia |
| NiCrAlY | Nickel-Chromium-Aluminum-Yttrium |
| GZO | Gadolinium Zirconate (Gd2Zr2O7) |
| APS | Atmospheric Plasma Spraying |
| HVOF | High Velocity Oxygen Fuel |
| EDS | Energy-Dispersive Spectroscopy |
| TMA | Thermomechanical Analysis |
| SPS | Suspension Plasma Spraying |
| SPPS | Solution Precursor Plasma Spraying |
References
- Meiirbekov, M.; Sadykov, M.; Kuandyk, A.; Nurguzhin, M.; Janikeyev, M.; Gulmaira, P.; Mustafa, L.; Yesbolov, N. Multimatrix composite materials for rocket nozzle manufacturing: A comparative review. Polymers 2026, 17, 2946. [Google Scholar] [CrossRef] [Scilit] [PubMed]
- Kravchuk, L.; Buiskykh, K.; Kucher, M. Research methods on strength and reliability of composite structural elements of rocket and space technology under extreme thermomechanical loading conditions. In Advances in Mechanics; Guz, A.N., Altenbach, H., Bogdanov, V., Nazarenko, V.M., Eds.; Advanced Structured Materials; Springer Nature: Cham, Switzerland, 2023; Volume 191, pp. 267–291. [Google Scholar] [CrossRef] [Scilit]
- Zhao, J.-C.; Westbrook, J.H. Ultrahigh-temperature materials for jet engines. MRS Bull. 2003, 28, 622–630. [Google Scholar] [CrossRef] [Scilit]
- Padture, N.P.; Gell, M.; Jordan, E.H. Thermal barrier coatings for gas-turbine engine applications. Science 2002, 296, 280–284. [Google Scholar] [CrossRef] [Scilit] [PubMed]
- Bhat, S.; Rahman, A.; Sharma, M. Evaluation of Mechanical Behaviour of Nanostructured Chromium Coating Deposited on Superni 718 for High-Temperature Environment. SSRN Prepr. 2024, 16. [Google Scholar] [CrossRef] [Scilit]
- Bogdan, M.; Peter, I. A comprehensive understanding of thermal barrier coatings (TBCs): Applications, materials, coating design and failure mechanisms. Metals 2024, 14, 575. [Google Scholar] [CrossRef] [Scilit]
- Berger, O. The correlation between structure, multifunctional properties and application of PVD MAX phase coatings. Part III. Multifunctional applications. Surf. Eng. 2020, 36, 303–325. [Google Scholar] [CrossRef] [Scilit]
- Liu, H.; Wang, Z.; Li, W.; Qiu, Z.; Zheng, Z.; Wang, G.; Huang, J.; Zeng, D. Structural evolution and enhanced thermal cycling life of HVAF-sprayed NiCrAlY bond coat modified by YSZ. J. Mater. Res. Technol. 2024, 30, 5133–5144. [Google Scholar] [CrossRef] [Scilit]
- Naumenko, D.; Pillai, R.; Chyrkin, A.; Quadakkers, W.J. Overview on recent developments of bondcoats for plasma-sprayed thermal barrier coatings. J. Therm. Spray. Technol. 2017, 26, 1743–1757. [Google Scholar] [CrossRef] [Scilit]
- Grechanyuk, M.I.; Grechanyuk, I.M.; Yevterev, Y.N.; Grechanyuk, V.G.; Prikhna, T.O.; Bagliuk, G.A.; Hots, V.I.; Khomenko, O.V.; Dudnik, O.V.; Matsenko, O.V. Electron-beam and plasma oxidation-resistant and thermal-barrier coatings deposited on turbine blades using cast and powder Ni(Co)CrAlY(Si) alloys produced by electron beam melting III. Formation, structure, and chemical and phase composition of thermal-barrier Ni(Co)CrAlY/ZrO2–Y2O3 coatings produced by physical vapor deposition in one process cycle. Powder Metall. Met. Ceram. 2022, 61, 328–336. [Google Scholar] [CrossRef] [Scilit]
- Chen, L.B. Yttria-stabilized zirconia thermal barrier coatings—A review. Surf. Rev. Lett. 2006, 13, 535–544. [Google Scholar] [CrossRef] [Scilit]
- Diwahar, D.; Manivachakan, V.; Syed, R.B. An overview of rare earth-doped ceramic thermal barrier coatings for high-temperature performance of nickel-based superalloys. High Temp. Corros. Mater. 2025, 102, 17. [Google Scholar] [CrossRef] [Scilit]
- Ren, X.; Pan, W. Mechanical properties of high-temperature-degraded yttria-stabilized zirconia. Acta Mater. 2014, 69, 397–406. [Google Scholar] [CrossRef] [Scilit]
- Lima, R.S.; Marple, B.R. Insights on the high-temperature operational limits of ZrO2-Y2O3 TBCs manufactured via air plasma spray. J. Mater. Eng. Perform. 2017, 26, 1272–1282. [Google Scholar] [CrossRef] [Scilit]
- Lughi, V.; Clarke, D.R. High temperature aging of YSZ coatings and subsequent transformation at low temperature. Surf. Coat. Technol. 2005, 200, 1287–1291. [Google Scholar] [CrossRef] [Scilit]
- Tuncer, R.; Karabaş, M.; Gökçe, H.; Kayali, Y. Thermal and mechanical properties of metal oxide-doped Gd2Zr2O7 ceramics. J. Therm. Anal. Calorim. 2026, 151, 8669–8684. [Google Scholar] [CrossRef] [Scilit]
- Zhou, D.; Mack, D.E.; Bakan, E.; Mauer, G.; Sebold, D.; Guillon, O.; Vaßen, R. Thermal cycling performances of multilayered yttria-stabilized zirconia/gadolinium zirconate thermal barrier coatings. J. Am. Ceram. Soc. 2020, 103, 2048–2061. [Google Scholar] [CrossRef] [Scilit]
- Kumar, R.; Cietek, D.; Jiang, C.; Roth, J.; Gell, M.; Jordan, E.H. Influence of microstructure on the durability of gadolinium zirconate thermal barrier coatings using APS & SPPS processes. Surf. Coat. Technol. 2018, 337, 117–125. [Google Scholar] [CrossRef] [Scilit]
- Bakan, E.; Mack, D.E.; Mauer, G.; Vaßen, R. Porosity–property relationships of plasma-sprayed Gd2Zr2O7/YSZ thermal barrier coatings. J. Am. Ceram. Soc. 2015, 98, 2647–2654. [Google Scholar] [CrossRef] [Scilit]
- Li, B.; Sun, J.; Guo, L. CMAS corrosion behavior of Sc doped Gd2Zr2O7/YSZ thermal barrier coatings and their corrosion resistance mechanisms. Corros. Sci. 2021, 193, 109899. [Google Scholar] [CrossRef] [Scilit]
- Wang, K.; Wu, J.; Pan, L.; Zhang, H.; Guo, L. Assessment criteria for the corrosion resistance of Gd2Zr2O7-based thermal barrier coatings exposed to CMAS and CMAS + sea salt. npj Mater. Degrad. 2026, 10, 94. [Google Scholar] [CrossRef] [Scilit]
- Kengesbekov, A.; Rakhadilov, B.; Magazov, N.; Abizhanova, I.; Kussainov, A.; Abdulina, S. Formation of a low-porosity bonding layer with enhanced adhesive strength via gas-thermal spraying. Metals 2026, 16, 303. [Google Scholar] [CrossRef] [Scilit]
- Kengesbekov, A. Influence of plasma arc current and gas flow on the structural and tribological properties of TiN coatings obtained by plasma spraying. Coatings 2024, 14, 1404. [Google Scholar] [CrossRef] [Scilit]
- ASTM E2109 International. ASTM License Agreement. Available online: https://www.astm.org/astm-license-agreement (accessed on 17 August 2026).
- Buitkenov, D.; Sagdoldina, Z.; Nabioldina, A.; Drenda, C. The study of tribological characteristics of YSZ/NiCrAlY coatings and their resistance to CMAS at high temperatures. Appl. Sci. 2025, 15, 8109. [Google Scholar] [CrossRef] [Scilit]
- Krämer, S.; Yang, J.; Levi, C.G.; Johnson, C.A. Thermochemical interaction of thermal barrier coatings with molten CaO–MgO–Al2O3–SiO2 (CMAS) deposits. J. Am. Ceram. Soc. 2006, 89, 3167–3175. [Google Scholar] [CrossRef] [Scilit]
- ISO 13123:2011; Thermal Shock/Thermal Cycling Testing of Thermal Barrier Coatings. International Organization for Standardization: Geneva, Switzerland, 2011. Available online: https://www.iso.org/standard/53006.html (accessed on 17 August 2026).
- Mahade, S.; Li, R.; Björklund, S.; Markocsan, N.; Nylén, P. Isothermal oxidation behavior of Gd2Zr2O7/YSZ multilayered thermal barrier coatings. Int. J. Appl. Ceram. Technol. 2016, 13, 443–450. [Google Scholar] [CrossRef] [Scilit]
- Rakhadilov, B.K.; Kurbanbekov, S.R.; Kilishkhanov, M.K.; Kenesbekov, A.B. Changing the structure and phase states and the microhardness of the R6M5 steel surface layer after electrolytic-plasma nitriding. Eurasian J. Phys. Funct. Mater. 2018, 2, 259–266. [Google Scholar] [CrossRef] [Scilit]
- Frommherz, M.; Scholz, A.; Oechsner, M.; Bakan, E.; Vaßen, R. Gadolinium zirconate/YSZ thermal barrier coatings: Mixed-mode interfacial fracture toughness and sintering behavior. Surf. Coat. Technol. 2016, 286, 119–128. [Google Scholar] [CrossRef] [Scilit]
- Aringozhina, Z.; Magazov, N.; Rakhadilov, B.; Batanov, Y.; Serikbaikyzy, A.; Kussainov, A. Influence of layer configuration on the mechanical, tribological and corrosion performance of Ti/TiN multilayer coatings. Coatings 2025, 15, 1313. [Google Scholar] [CrossRef] [Scilit]
- Nair, R.B.; Brabazone, D. Calcia magnesia alumino silicate (CMAS) corrosion attack on thermally sprayed thermal barrier coatings: A comprehensive review. npj Mater. Degrad. 2024, 8, 44. [Google Scholar] [CrossRef] [Scilit] [PubMed]
- Sagdoldina, Z.; Rakhadilov, B.; Kurbanbekov, S.; Kozhanova, R.; Kengesbekov, A. Effect of irradiation with Si+ ions on phase transformations in Ti–Al system during thermal annealing. Coatings 2021, 11, 205. [Google Scholar] [CrossRef] [Scilit]
- Lee, D.; Kim, T.W.; Lee, K.S. Design of thermal barrier coatings using gadolinium zirconate ceramics: A study on gadolinium zirconate/YSZ bilayers. J. Ceram. Soc. Jpn. 2009, 117, 550–554. [Google Scholar] [CrossRef] [Scilit]
- Mahade, S.; Curry, N.; Jonnalagadda, K.P.; Peng, R.L.; Markocsan, N.; Nylén, P. Influence of YSZ layer thickness on the durability of gadolinium zirconate/YSZ double-layered thermal barrier coatings produced by suspension plasma spray. Surf. Coat. Technol. 2019, 357, 456–465. [Google Scholar] [CrossRef] [Scilit]
- Sadri, E.; Ashrafizadeh, F.; Eslami, A.; Salimi Jazi, H.; Ehsaei, H. Thermal shock performance and microstructure of advanced multilayer thermal barrier coatings with Gd2Zr2O7 topcoat. Surf. Coat. Technol. 2022, 448, 128892. [Google Scholar] [CrossRef] [Scilit]
- Iqbal, A.; Moskal, G.; Witala, B. Degradation mechanism of dual-phase thermal barrier coatings Gd2Zr2O7 + 8YSZ under hot corrosion in pure Na2SO4. J. Therm. Anal. Calorim. 2025, 150, 151–165. [Google Scholar] [CrossRef] [Scilit]
- Vaßen, R.; Bakan, E.; Mack, D.; Schwartz-Lückge, S.; Sebold, D.; Sohn, Y.J.; Guillon, O. Performance of YSZ and Gd2Zr2O7/YSZ double layer thermal barrier coatings in burner rig tests. J. Eur. Ceram. Soc. 2020, 40, 480–490. [Google Scholar] [CrossRef] [Scilit]
- Rakhadilov, B.; Bayatanova, L.; Kengesbekov, A.; Magazov, N.; Toleukhanova, Z.; Yeskermessov, D. Study of the influence of air plasma spraying parameters on the structure, corrosion resistance, and tribological characteristics of Fe–Al–Cr intermetallic coatings. Coatings 2025, 15, 790. [Google Scholar] [CrossRef] [Scilit]

Disclaimer/Publisher’s Note: The statements, opinions and data contained in all publications are solely those of the individual author(s) and contributor(s) and not of MDPI and/or the editor(s). MDPI and/or the editor(s) disclaim responsibility for any injury to people or property resulting from any ideas, methods, instructions or products referred to in the content. |
© 2026 by the authors. Licensee MDPI, Basel, Switzerland. This article is an open access article distributed under the terms and conditions of the Creative Commons Attribution (CC BY) license.