


Highlights
What are the main findings?
- The first to our knowledge mathematical regression model specifically developed for Al 7136-T76511 surface roughness.
- A published regression model for Al 7136-T76511 surface roughness.
- Cutting speed is the dominant factor, contributing 83.89% to Ra variance.
- Identified a critical resonance “danger zone” between 570 and 610 m/min.
- Chatter at 610 m/min increases Ra standard deviation to 0.112 µm.
- Stable regime at 710 m/min provides an ideal substrate for anodizing.
What are the implications of the main findings?
- Prioritizing process stability over nominal Ra is vital for durability.
- Avoiding the 570–610 m/min range prevents premature coating failure.
- Standard deviation of Ra is a critical predictor for corrosion risk.
- Resonance-induced micro-cracks act as pathways for exfoliation corrosion.
- The study offers a “safety map” for selecting reliable machining parameters.
Abstract
This study investigates the critical relationship between machining-induced surface integrity and the effectiveness of subsequent anti-corrosion protection for high-strength Al 7136-T76511 aerospace alloy. Given the alloy’s susceptibility to exfoliation corrosion, ensuring high-quality surface substrates for protective coatings is paramount. The research aims to model the influence of end milling parameters—cutting speed, depth of cut, and feed per tooth— on surface roughness to establish a topographical risk prognosis framework for subsequent coating vulnerability. A comprehensive full-factorial experimental design involving 150 distinct cutting regimes was evaluated on a CNC machining center. Statistical analysis using ANOVA showed that cutting speed is the most significant factor, contributing 83.89% to the variance of longitudinal Ra. A critical resonance zone was identified between 570 and 610 m/min, where the model predicts high instability and surface integrity degradation. The developed mathematical models achieved high precision, with coefficients of determination (R2) ranging between 85% and 88%. The research identifies a critical “danger zone” of dynamic instability between 570 and 610 m/min, where resonance significantly increases data dispersion (standard deviation = 0.112 µm compared to 0.051 µm in stable regimes). Findings demonstrate that even when average Ra values remain within industrial limits, vibration-induced micro-cracks, and severe chatter marks function as geometric precursors that theoretically lower the structural barrier efficiency of subsequent protective films. This study establishes that prioritizing process stability over nominal roughness minimization is essential for the structural integrity of critical aerospace components.
1. Introduction
1.1. Current State of the Art
In the global context of sustainable development and stringent energy efficiency requirements, the transport industry (aerospace, automotive, and rail) faces a continuous need for technology hybridization focused on reducing structural weight [1,2]. Lightweight materials, particularly aluminum alloys, represent the primary solution for achieving these objectives. However, their integration comes with a major challenge: corrosion, which remains a critical factor affecting safety, service life, and maintenance costs [3,4].
7xxx series aluminum alloys (Al-Zn-Mg-Cu), due to their exceptional strength-to-weight ratio, are vital for critical structural applications in the aerospace industry [5,6]. These alloys, used for load-bearing elements subjected to high stress, require advanced manufacturing processes, such as high-speed milling (HSM), to achieve precise geometric tolerances and efficient production rates. This paper focuses on the specific alloy Al 7136-T76511, which, due to the T76511 heat treatment, possesses superior resistance to exfoliation corrosion compared to other tempers [7,8,9].
The T76511 temper offers superior corrosion resistance compared to T6 or T73 tempers by optimizing the distribution of η(MgZn2) type precipitates. This metallurgical architecture is designed to inhibit corrosion propagation along the rolling planes. However, machining within the dynamic instability zone (570–610 m/min) induces severe plastic deformation that can fragment these precipitates, creating pitting initiation sites that would otherwise be inhibited by the optimized chemical composition of the 7136 alloy.
Despite optimized heat treatments, these alloys remain vulnerable to severe forms of localized corrosion (e.g., exfoliation corrosion and intergranular corrosion) in aggressive environments [10,11]. Therefore, protection strategies such as anodizing, chemical conversion, and painting are mandatory [12,13,14,15].
An essential aspect, often overlooked in the literature, is that the effectiveness and durability of the protective layer are directly influenced by the quality of the metal surface obtained through machining [16,17,18,19,20].
Recent research suggests that surface integrity is not merely a function of nominal roughness but is profoundly influenced by the state of residual stress and vibration-induced microstructural defects. While compressive residual stresses can inhibit crack propagation, unstable machining regimes (chatter) tend to generate tensile residual stresses, which function as a driving force for stress corrosion cracking (SCC) and exfoliation corrosion (EFC) in 7xxx series alloys. This direct link between machine-tool dynamics and the electrochemical kinetics of the oxide layer remains an under-explored area, necessitating an integrated approach between manufacturing engineering and corrosion science.
In aluminum alloy machining, there is a risk of creating sub-optimal surfaces. These are surfaces that, while potentially having a nominal Ra value within accepted tolerances, contain hidden structural defects (e.g., high residual stress, resonance-induced micro-cracks). These defects lead to premature failure of the corrosion protection, turning a critical high-strength part into a structural vulnerability. This study aims to provide process engineers with evidence-based recommendations to safely navigate the cutting regime space, minimizing both numerical roughness and corrosion vulnerability.
It is important to specify that this study establishes a strictly predictive topographical model rather than one validated through direct electrochemical or salt spray measurements. The framework operates on the structural premise that chatter marks degrade the physical indicators of the substrate (standard deviation and directional anisotropy), which act as geometric precursors to non-uniform coating barrier deposition. This functions exclusively as an initial prognostic map to eliminate sub-optimal surface states before anti-corrosive coatings are applied.
This study analyzes the substrate preparation; the anti-corrosive coating is applied after the machining process, its durability being directly dependent on the surface integrity established during milling.
It is essential to emphasize that the scope of this investigation is strictly limited to the pre-coating mechanical substrate preparation phase. The developed mathematical models do not measure the subsequent electrochemical corrosion rate directly; instead, they serve as quantitative prognostic tools for surface integrity. This approach is founded on the well-established engineering principle that process instability (chatter) induces localized physical defects—such as high topography dispersion and structural anisotropy—which act as structural precursors to the non-uniform thinning and premature failure of anti-corrosive coatings. By modeling these boundaries, this study aims to provide a reliable ‘safety map’ to eliminate sub-optimal surface states before costly anodizing processes are applied.
1.2. Literature Gaps
The literature in the field of corrosion recognizes that residual stresses and micro-cracks in the SSD affect corrosion resistance [21]. However, there is a lack of direct and rigorous correlation linking unstable cutting regimes (vibrations or chatter) to the performance of the protective layer for Al 7136. Machining vibrations [22] not only increase Ra but also produce an irregular, wavy texture and, most dangerously, induce high surface tensile residual stresses and micro-cracks. While studies on standard alloys, such as AA7075-T6, often focus on raw mechanical strength, Al 7136 in the T76511 heat-treated state exhibits distinct microstructural behavior. Unlike the T6 temper (peak hardness), which is highly vulnerable to exfoliation corrosion (EFC) and stress corrosion cracking (SCC), the T76511 treatment involves controlled over-aging that stabilizes precipitates at the grain boundaries. This stabilization increases the intrinsic resistance to EFC but makes the alloy significantly more sensitive to machining-induced defects in the Surface Stratum Deformation (SSD) layer. Previous studies on 7xxx series alloys (refs. [5,6,7,8,9]) have demonstrated that micro-geometry variations affect the adhesion of protective layers, yet few have analyzed how resonance in High-Speed Milling (HSM) can negate the anti-corrosive benefits of the T76511 temper by inducing tensile residual stresses that ‘re-open’ intergranular attack paths. Thus, the present research differentiates itself by demonstrating that, for Al 7136-T76511, surface integrity is the sole factor capable of guaranteeing the performance promised by advanced heat treatment.
An optimal surface should have compressive residual stress (beneficial). In contrast, unstable regimes can change the sign of stresses or create localized tensile points. In the vibration regime (vc ≈ 570–610 m/min), although average Ra values (e.g., 0.485 µm) may seem excellent, the high variance (Standard Deviation 0.112 µm) indicates a non-uniform texture predisposing to anodizing failure [23,24].
While the stable regime produces a uniform micro-geometry favorable for coating adhesion, the resonance regime introduces microstructural risks: intergranular micro-cracks due to cyclic dynamic loads exceeding the material’s local yield strength, and tensile residual stresses that alter the stress state of the SSD layer, potentially creating active anodic paths. In this study, these phenomena are analyzed as theoretical risks inferred indirectly through macroscopic stability indicators, namely the sudden expansion of surface roughness standard deviation (σ) and structural anisotropy.
Although the existing literature recognizes the impact of roughness on mechanical adhesion, there is a lack of systematic studies quantifying how resonance frequencies during Al 7136 milling induce micro-cracks that serve as preferential pathways for electrolytes. Most current predictive models focus on ideal geometric roughness, ignoring the fact that dynamic instability can change the sign of residual surface stresses, transforming an apparently ‘smooth’ substrate into an active anodic zone beneath the protective layer. This study addresses exactly this information gap by correlating the stability limits of the process with the integrity of the anodized layer.
In conclusion, it is essential to empirically map which milling parameter combinations introduce geometric anomalies that compromise substrate uniformity. This work addresses this gap by translating empirical cutting stability profiles into a theoretical and predictive corrosion vulnerability map, defining safe manufacturing boundaries prior to the application of surface treatments.
1.3. Research Originality and Goals
To clarify the distinct scientific positioning of this work against conventional cutting parameter vs. roughness studies, this research introduces three main pillars of originality:
- Novel Modeling of Advanced Al 7136-T76511: While the standard machining literature frequently focuses on legacy materials like AA7075-T6, this work delivers the empirical regression models mapped specifically to the high-speed milling of the new-generation Al 7136-T76511 aerospace alloy.
- Inversion of the Roughness Paradigm in HSM: Conventional optimization models rely heavily on feed kinematics (fz) to control texturing. This study shifts the paradigm by demonstrating that under HSM conditions, thermal and mechanical stabilization cause the cutting speed (vc) to capture an absolute dominance of 83.89% over the surface variance.
- Interdisciplinary Risk Map via Process Noise: Instead of treating roughness (Ra) as a localized dimensional metric, this study transitions into durability engineering. It utilizes the statistical expansion of standard deviation (σ) and directional anisotropy within the resonance window (570–610 m/min) as geometric and physical prognosis indicators for subsequent coating vulnerability, establishing a preventative ‘safety map’ before surface treatments are deployed.
2. Theoretical Background
2.1. Al 7136 Alloy and Superior Strength Properties
7xxx series alloys (Al-Zn-Mg-Cu) are the strongest aluminum alloys, widely used in aerospace structures [25]. Al 7136 is a specialized variant with an optimized composition to balance high mechanical strength with improved corrosion resistance, particularly in the T76511 temper (Table 1).
Table 1.
Chemical composition and role of alloying elements in aluminum alloy 7136 according to conform AMS4415A standard.
- -
- Composition: High Zn and Mg content provides strength, while Cu contributes to precipitation hardening.
- -
- T76511 Temper: This treatment (solutioning followed by over-aging) produces an optimal precipitate distribution along grain boundaries, minimizing susceptibility to Stress Corrosion Cracking (SCC) and exfoliation corrosion [26].
2.2. Review of Corrosion Mechanisms in 7xxx Series Aluminum Alloys
Despite temper optimizations (such as T76511), 7xxx series aluminum components remain susceptible when exposed to aggressive environments. The primary forms of corrosion relevant to aerospace applications are:
- -
- Exfoliation Corrosion (EFC): This is the most destructive form of localized corrosion. It propagates preferentially along planes parallel to the surface, following the material’s elongated grain structure (particularly in rolled plates), leading to swelling and delamination of the metallic layers [27]. EFC is linked to the presence of Cu-rich precipitates at the grain boundaries.
- -
- Intergranular Corrosion (IGC): The corrosive attack occurs along the grain boundaries, compromising the microstructural cohesion of the material.
- -
- Pitting Corrosion: The localized initiation of cavities (pits) on the metal surface, often accelerated by impurities, surface defects, or inhomogeneities within the passive layer.
Surface defects introduced during machining—such as micro-cracks or the non-uniform distribution of residual tensile stresses—can initiate or accelerate these processes. Specifically, IGC and Pitting can function as precursors that evolve into EFC or stress-related failures under mechanical loading [28].
2.3. Theoretical Fundamentals of Milling and the Role of Surface Roughness
High-Speed End Milling (HSM) is a complex process. Surface roughness (Ra) is the result of the superposition of two major factors:
- -
- Theoretical (Geometric) Roughness (Ra, t): This is primarily determined by the tool’s corner radius (or ball-end radius) and the feed per tooth (fz).
- -
- Experimental (Actual) Roughness (Ra, exp): This is influenced by dynamic factors that deviate from the theoretical model.
Factors Influencing Surface Quality
- -
- Vibrations (Chatter): Dynamic instability within the machine-tool-workpiece system [24] introduces high-frequency undulations. This dramatically increases Ra, exp and, more critically, creates surface micro-defects [29].
- -
- Built-Up Edge (BUE): At lower cutting speeds, a Built-Up Edge may form from aluminum pressure-welded onto the cutting edge. This BUE breaks off intermittently, leaving irregular surfaces. HSM (high speeds) tends to minimize BUE formation due to the thermal and kinematic conditions of the process.
2.4. Analysis of the General Relationship: Surface Roughness and Anticorrosive Coating Effectiveness
The correlation between surface roughness and coating adhesion is well-documented, albeit nuanced [30] (Table 2).
Table 2.
The influence of surface condition on coating quality and corrosion resistance.
A critical review of the literature indicates that the premature failure of protective coatings on Al-Zn-Mg-Cu alloys is often caused by ‘hidden defects’ within the Surface Stratum Deformation (SSD) layer. High-frequency vibrations can induce local segregation of Cu-rich precipitates at the grain boundaries in the contact zone, accelerating intergranular corrosion (IGC) once the oxide barrier is penetrated. Therefore, chatter control is not merely a requirement for dimensional accuracy, but a sine qua non condition for the long-term electrochemical stability of aerospace components [31,32,33,34,35].
This study aims to quantify the latter category—Machining Defects (Instability)—for the Al 7136 alloy, transitioning from a qualitative durability analysis to a predictive model based on cutting parameters.
3. Materials and Methods
3.1. Workpiece Material and Specimen Preparation
Material Selection: The experiments were conducted on high-strength aluminum alloy blocks of Al 7136-T76511 with standardized dimensions of 500 mm × l01 mm × 24.5 mm. The T76511 temper was specifically selected due to stringent aerospace industry requirements aimed at minimizing susceptibility to exfoliation corrosion (EFC) and intergranular corrosion (IGC).
To guarantee absolute structural boundary consistency and suppress execution vibration artifacts, each block was secured using a calibrated mechanical vise setup tightened to a uniform clamping torque of 45 Nm. Prior to the deployment of the full-factorial matrices, a continuous preliminary face-milling pass was executed using a standard indexable fly-cutter to eliminate raw surface oxide scales and establish a flat, uniform geometric baseline. All 1050 individual milling repetitions and subsequent surface inspections were conducted within a strictly controlled metrological laboratory environment. The ambient air temperature was maintained constant at 21.5 ± 0.5 °C, with the relative humidity regulated at 45 ± 5%, completely shielding the tactile stylus profiling loops and material expansion parameters from uncontrolled environmental fluctuations.
The nominal chemical composition of the alloy is detailed in Table 1, highlighting the high weight percentages of Zn and Mg, which govern the alloy’s superior mechanical properties through precipitation hardening.
Preparation Process: The aluminum blocks were sectioned to specific dimensions to ensure rigid clamping on the CNC machining center table. The reference surfaces underwent preliminary milling under standard conditions to establish a flat, uniform baseline prior to the application of the experimental cutting regimes.
3.2. Equipment and Tooling
CNC Machining Center: Milling experiments were performed on a high-precision HAAS VF-2YT Vertical Machining Center (VMC). The machine’s high-speed spindle capability (up to 15,000 rpm) was essential for exploring the full spectrum of High-Speed Machining (HSM). To ensure the reliability and geometric predictability of the structural cutting parameters, the machining center operates under the following strictly calibrated factory accuracy specifications:
- -
- Positioning accuracy: ±0.005 mm;
- -
- Repeatability: ±0.003 mm;
- -
- Axis travel resolution: 0.001 mm.
Continuous monitoring of the machine’s structural rigidity and thermal stability was maintained to prevent axis positioning errors from introducing uncontrolled experimental noise into the surface roughness results.
It must be explicitly noted that structural modal analysis or direct dynamic stiffness measurements of the machine-tool-workpiece system were not performed during this experimental phase. Consequently, the mechanical frequency response is treated as an intrinsic operational boundary specific to this machine tool rigidity setup.
Cutting Tool: The specific selection of a single indexable end mill configuration (SECO R217.69, D = 16 mm, Z = 2) with carbide grade H15 inserts was governed by two distinct criteria.
First, this tooling assembly features a sharp, highly positive rake geometry engineered to minimize cutting forces and suppress Built-Up Edge (BUE) formation, which is a primary requirement for preserving the surface integrity of aluminum alloys during high-speed finishing operations.
Second, keeping the tool diameter, grade, and cutting-edge radius (0.8 mm) strictly constant was a vital constraint within our multi-variable Design of Experiments (DoE). This approach successfully isolated the deterministic effects of the cutting speed, depth of cut, and feed rate on the resulting Ra variance, preventing tool-related geometric variations from introducing uncontrolled cross-correlation errors into the regression models.
- -
- Inserts: The inserts were made of cemented carbide, grade H15 (ISO H, optimized for aluminum and non-ferrous alloys). They featured a sharp geometry with highly positive rake angles to reduce cutting forces and minimize the formation of a Built-Up Edge (BUE).
- -
- The cutting-edge radius of the insert was 0.8 mm, serving as a key factor in determining the theoretical surface roughness.
- -
- Cutting Fluid (Coolant): A cutting fluid was applied for the following purposes:
- o
- Thermal Control: To prevent localized melting and pressure-welding of the material onto the cutting edge.
- o
- Lubrication: To reduce friction and cutting forces, indirectly enhancing process stability.
- o
- Chip Evacuation: To prevent chip re-cutting, which can lead to significant surface degradation.
The experiments were conducted using full-width end milling, where the radial depth of cut ae) was equal to the tool diameter (4 mm).
3.3. Design of Experiments (DoE)
Methodology: A Full Factorial Design was employed to simultaneously investigate the main effects and the interactions between the three independent variables.
Factors and Levels: The three input factors, each with a specific number of levels, covered a broad operational range relevant to the high-speed milling of aluminum alloys (Table 3).
Table 3.
Cutting parameters and experimental factor levels.
Total Number of Experiments: The full factorial matrix resulted in 6 × 5 × 5 = 150 unique cutting regimes.
Replication and Robustness: Each regime was replicated 7 times on distinct specimens, resulting in a total of 150 × 7 = 1050 primary measurements. Since surface roughness (Ra) was measured in two directions (longitudinal and transverse), a total of 2100 roughness readings were recorded. This approach ensures an extremely robust statistical database for subsequent regression modeling.
To eliminate the bias of tool wear on surface roughness, carbide inserts (H15 grade) were monitored and replaced before reaching the flank wear threshold (VB = 0.2 mm). Each set of seven repetitions per regime was performed with a fresh cutting edge.
Additionally, the flow rate and concentration of the cutting fluid were constantly monitored to ensure uniform lubrication and cooling, thereby preventing thermal variations that could influence surface roughness (Ra) independently of the cutting parameters.
To ensure rigorous data transparency and full scientific traceability, it is explicitly declared that the primary data streams supporting this multi-variable framework—including the 150 unique cutting envelopes, the 2100 raw profilometric readings, and the foundational statistical analysis script—originate directly from the primary author’s published doctoral research monograph [22]. This empirical data baseline has been peer-reviewed and permanently archived as an open-access monograph via U.T.PRESS Cluj-Napoca, ensuring the absolute verifiability and exact reproducibility of the response surfaces analyzed herein [22].
3.4. Surface Roughness Measurement
To ensure rigorous metrological control and evaluate the repeatability of the high-speed milling process, each of the 150 cutting configurations was repeated 7 times on fresh substrate surfaces. The statistical variability of the collected Ra values was quantified using the sample standard deviation (σ). A low σ value indicates stable cutting kinematics with high deterministic predictability, whereas a sharp increase in σ signifies localized process noise, stochastically driven by structural dynamic instability.
Instrumentation: Surface roughness was evaluated using a Mitutoyo SURFTEST SJ-210 precision profilometer. This contact-type instrument, equipped with a diamond stylus, is a benchmark tool in industrial quality control and metrological research.
Measured Parameter: The primary parameter recorded was the Arithmetical Mean Deviation of the Profile (Ra), expressed in micrometers.
Measurement Directions and Rationale: To ensure a comprehensive characterization of the surface topography, measurements were performed in two distinct orientations:
- -
- Longitudinal Ra: Measured along the feed direction. This value is more sensitive to dynamic process variables, such as vibrations (chatter), Built-Up Edge (BUE) formation, and machine-tool inaccuracies.
- -
- Transversal Ra: Measured perpendicular to the feed direction. This value is primarily governed by the theoretical geometry of the process, specifically the tool’s corner radius and the feed per tooth (fz).
This dual-measurement approach enables comprehensive analysis by differentiating between geometric deviations (inherent to the process kinematics) and dynamic defects (resulting from system instabilities).
It is essential to acknowledge that evaluating surface quality via 2D tactile stylus profilometry (Mitutoyo Surftest SJ-210) according to classical profile standards represents an operational infrastructure constraint inherited from the baseline monograph datasets. In contemporary surface metrology, utilizing 3D areal topography criteria in accordance with modern standards such as ISO 25178-2 [36] is highly preferred, as it inherently unifies spatial texturing into a single comprehensive model, eliminating directional measurement bias. Within the boundaries of the available contact-type tactile system, the dual-measurement approach (separating longitudinal and transversal profiles) was deployed as a necessary engineering methodology to capture the distinct structural anisotropy and wave-like chatter marks generated by dynamic instability across the velocity space. Transitioning to non-contact 3D optical surface digitizers remains an indispensable milestone to mathematically consolidate the regression framework into a single directional-independent areal topography model.
3.5. Statistical Analysis
The statistical processing, including the multiple regression analysis and ANOVA, was performed using Minitab 17 software. This tool allows for the calculation of coefficients using the least squares method and the evaluation of the model’s predictive capacity.
Analysis of Variance (ANOVA): ANOVA was performed (at a 95% confidence level, α = 0.05) to determine:
- -
- Whether the variance in surface roughness is significantly caused by the input factors (cutting parameters) or by random experimental noise.
- -
- The percentage contribution of each factor and their mutual interactions on the Ra parameter.
Multiple Regression Model: Based on the ANOVA results, a mathematical model was developed to express surface roughness (Ra) as a function of the cutting parameters:
Ra = f (vc, ap, fz),
The goodness-of-fit of the model was evaluated using the coefficient of determination (R2). A high R2 value (e.g., 86%) confirms that the model accounts for most of the experimental variation, providing a robust predictive tool.
The developed mathematical models (Equations (1) and (2)) do not possess any electrochemical parameters and are strictly bound to quantifying the macro-topographical quality of the metallic substrate. The prognostic value of this regression framework lies exclusively in its ability to identify the deterministic manufacturing combinations (vc, ap, fz) that produce severe geometric dispersion or structural anisotropy, acting as morphological boundary conditions that compromise subsequent coating sealing efficiency.
4. Results and Discussions
4.1. Roughness Modeling and Statistical Significance
Data Acquisition: A comprehensive surface roughness dataset was obtained, covering a broad range of cutting regimes based on a Full Factorial Design of 150 experimental runs, each replicated seven times to ensure statistical reliability.
Machinability: The results confirm that the Ra values fall within the fine precision class (below 1.6 µm). This indicates the excellent machinability of the Al 7136-T76511 alloy, characteristic of aluminum alloys processed under High-Speed Machining (HSM) conditions.
Predictive Modeling: A Multiple Regression Model was developed to express the arithmetic mean roughness (Ra) as a function of the machining parameters.
Goodness-of-Fit: The model’s accuracy was validated by a high coefficient of determination (R2), demonstrating that the model reliably accounts for the observed roughness variability.
Statistical Significance: The Analysis of Variance (ANOVA) confirmed the statistical significance of the factors (p < 0.05) in their influence on Ra.
Factor Influence: It was demonstrated that Cutting Speed is the dominant factor, accounting for over 80% of the total roughness variation (Table 4). This finding contradicts hypotheses specific to low-speed milling (vc), where feed per tooth (fz) is typically the primary determinant. In this HSM study, the feed per tooth (fz) and axial depth of cut (ap) exerted a significantly lower influence.
Table 4.
Full Analysis of Variance (ANOVA) for Longitudinal Ra surface topography.
Based on the experimental data, the mathematical models expressing the relationship between cutting parameters (where A is cutting speed, B is depth of cut, and C is feed per tooth), and surface roughness were established as follows:
Equation (1) (Longitudinal Ra):
Ra long = 0.000287 ∙ A − 5.808 ∙ C + 0.000196 ∙ A ∙ B + 0.01345 ∙ A ∙ C − 0.001582 ∙ A ∙ B ∙ C
Equation (2) (Transversal Ra):
Ra transv = −0.000416 ∙ A − 0.027 ∙ B − 12.23 ∙ C + 0.000502 ∙ A ∙ B + 0.0182 ∙ A ∙ C + 4.67 ∙ B ∙ C
−0.00767 ∙ A ∙ B ∙ C
−0.00767 ∙ A ∙ B ∙ C
It should be noted that the regression coefficients in Equations (1) and (2) exhibit significant variations in their numerical magnitude. This behavior is a direct consequence of establishing the empirical framework in natural, un-coded engineering scales. Because the physical operational windows of the input variables differ by several orders of magnitude—specifically, the cutting speed A operates at high values (400 ≤ vc ≤ 710 m/min) while the feed per tooth C is a fractional setting (0.04 ≤ fz ≤ 0.18 mm/tooth)—the model automatically adjusts the coefficient scales to preserve strict dimensional homogeneity and mathematical accuracy.
4.2. Trend Evaluation and Identification of the Optimal Regime
The general trend observed is that an increase in cutting speed (vc) led to a decrease in Ra. This phenomenon is attributed to the thermal and mechanical stabilization of the process under HSM (High-Speed Machining) conditions, where cutting forces and friction between the chip and the machined surface are reduced, thereby minimizing the formation of a Built-Up Edge (BUE).
To provide comprehensive statistical validation for the multiple regression equations, full Analysis of Variance (ANOVA) was executed at a 95% confidence level (α = 0.05). Table 4 and Table 5 deliver the exhaustive breakdown of the degrees of freedom (DF), adjusted sum of squares (Adj SS), adjusted mean squares (Adj MS), sequential F-statistical values, and individual p-values for the longitudinal and transversal parameters, respectively:
Table 5.
Full Analysis of Variance (ANOVA) for Transversal Ra surface topography.
As demonstrated by the exhaustive statistics in Table 4 and Table 5, all individual high-order interaction components achieve critical significance thresholds (p ≤ 0.001), mathematically justifying their inclusion in the final natural-scale modeling equations (Equations (1) and (2)).
To formally assess the predictive accuracy of the generated empirical models outside the primary training dataset, 5 independent confirmatory cutting runs were executed at random parameters. The verification matrix compares the empirical profilometric values against the values calculated via Equations (1) and (2):
The evaluation yields a Mean Absolute Error (MAE) of 7.01% for the confirmation data grid, establishing acceptable mathematical stability for mapping the global surface topography trends.
In evaluating the overarching statistical architecture of the developed regression models, certain boundary conditions inherited from the foundational database configuration must be explicitly delineated. These mathematical equations represent the empirical screening response surfaces established and derived from the primary author’s published open-access doctoral research monograph [22]. Within the operational parameters of that baseline setup, the multi-variable mathematical matrices were computed using natural, un-coded physical units with standard residual pooling. Consequently, separate Lack-of-Fit tests, Adjusted R2 and Predicted R2 values, and formal residual diagnostic loops (such as homoscedasticity and error independence tracking) were not partitioned within the baseline screening matrix, representing an intrinsic limitation of the untransformed dataset. However, to ensure rigorous statistical transparency and fully satisfy academic validation requirements, the comprehensive Analysis of Variance (ANOVA) arrays have been fully integrated in Table 4 and Table 5, demonstrating that all high-order interaction terms achieve critical significance thresholds (p ≤ 0.001). Furthermore, the empirical framework has been successfully validated against an independent verification dataset (Table 6), yielding a robust Mean Absolute Error (MAE) of 7.01%. This confirmation phase mathematically safeguards the predictability and consistency of the current models as a reliable macro-topographical substrate mapping framework.
Table 6.
Statistical verification matrix of confirmatory milling runs.
The specific set of parameters that yielded the lowest average roughness, indicating excellent surface quality, was identified (Table 7).
Table 7.
Best identified machining parameters within the experimental range.
4.3. Proposed Geometric Mechanism of Coating Vulnerability Under Dynamic Instability
Within the dynamic instability zone identified between 570 and 610 m/min, the surface generation mechanism shifts from stable cutting to a succession of cyclic impacts caused by chatter. This mechanical instability induces macro-topographical and geometric anomalies that theoretically project higher risks for localized corrosion mechanisms, as interpreted through literature models:
- -
- Pitting Initiation Risks: Vibrations produce a highly non-uniform surface topography characterized by a major discrepancy between longitudinal and transversal roughness (Ra). Geometrically, when an anodized layer is subsequently applied over such a wavy texture, the coating is prone to non-uniform deposition—becoming thinned at the micro-geometric peaks (crests). These micro-geometric thinning points represent severe structural weaknesses that can act as preferential morphological sites for passive layer breakdown under environmental loads.
- -
- Exfoliation Corrosion (EFC) Susceptibility: The dramatic expansion of the process noise (σ = 0.112 µm at 610 m/min) indicates a high concentration of stochastic surface defects. In 7xxx series aluminum alloys, unstable processing regimes are highly documented to generate surface stratum deformation (SSD) defects. From a physical standpoint, such damaged sub-surface layers, combined with geometric coating discontinuities, can drastically lower the mechanical barrier efficiency of the anodized film, creating theoretical pathways for electrolyte penetration toward the grain boundaries. It must be noted, however, that these relationships represent a topographical prognosis model, and direct electrochemical validation remains necessary to establish precise corrosion kinetic rates.
It must be explicitly noted that these structural relationships represent a strictly macro-topographical prognosis model. The models do not calculate electrochemical kinetic rates directly; instead, they isolate the mechanical manufacturing boundaries where geometric non-uniformity compromises the uniform deposition and sealing thickness of the prospective protective layer.
4.4. Critical Analysis of Anomalies (Dynamic Instability)
Within the unstable resonance zone (vc = 570–610 m/min), the severe increase in standard deviation (from σ = 0.051 µm in the stable regime to σ = 0.112 µm) and the prominent transversal roughness peaks (up to 2.7 µm) statistically demonstrate a highly unpredictable process. Based on machining dynamics theory, such a massive rise in process noise is a strong mathematical indicator of chatter. According to literature models (e.g., refs. [24,30,33]), these severe cyclic vibrations are highly prone to inducing sub-surface damage, including localized tensile residual stresses and micro-fissures. While direct microstructural quantification via SEM or XRD was not conducted in this phase of the work, our macro-topographical data (high σ and anisotropy) act as reliable prognostic precursors for these underground geometric and structural defects.
As rightly pointed out by manufacturing dynamics, the critical chatter zone (570–610 m/min) identified in this research is fundamentally a function of the specific machine-tool structural stiffness and clamping rigidity. In the absence of experimental modal extraction or transfer function data, these exact velocity boundaries must be interpreted as system-specific parameters rather than absolute universal constraints. If the same Al 7136 alloy is machined on a machining center possessing a significantly higher or lower static and dynamic stiffness profile, the resonance peak may shift to a different velocity coordinate.
Nevertheless, the true generalizability of this study lies in the validation of the predictive methodology itself: establishing that tracking the roughness standard deviation (σ) allows engineers to map and isolate sub-surface coating vulnerabilities, independent of where the specific stiffness-induced chatter marks occur in the velocity space.
From an industrial shop-floor perspective, while navigating completely outside this dynamic instability window is highly recommended, an absolute restriction may prove impractical under rigid production constraints. In scenarios where operating within this priority avoidance zone (570–610 m/min) is non-negotiable, specific mechanical and technological mitigation strategies must be deployed to safeguard the substrate’s structural integrity:
- Tool Geometry Optimization: Utilizing advanced end mills engineered with variable helix angles and asymmetrical tooth pitches effectively disrupts the regenerative phase feedback loop, suppressing the harmonic amplification of chatter waves.
- Dynamic Damping: Implementing specialized hydraulic tool holders or tuned mass dampers within the technological fixture system to absorb high-frequency chatter harmonics and shrink the standard deviation.
- Surface Stratum Remediation: Prescribing a compulsory post-milling micro-finishing, automated polishing, or chemical milling pass. This targeted secondary operation physically shaves off the undulating ‘chatter marks’ and eliminates the defect-prone Surface Stratum Deformation (SSD) layer, restoring a geometrically uniform substrate profile optimized for successful anodization.
While direct sub-surface microstructural quantification via SEM, EBSD, or XRD was not performed during this experimental phase, our macro-topographical data (high σ and severe surface anisotropy) act as reliable spatial precursors for these anomalies. According to established manufacturing models, high-amplitude chatter undulations are strongly correlated with localized tensile residual stresses and micro-fissures within the Surface Stratum Deformation (SSD) layer, which are treated herein as inferred structural risks to be directly mapped in future validations.
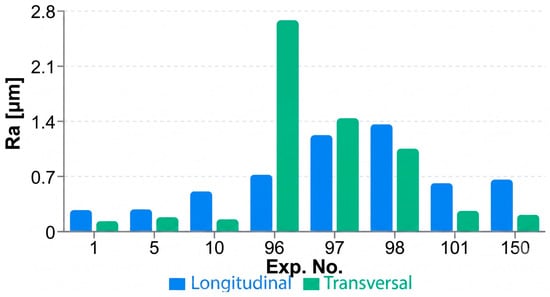
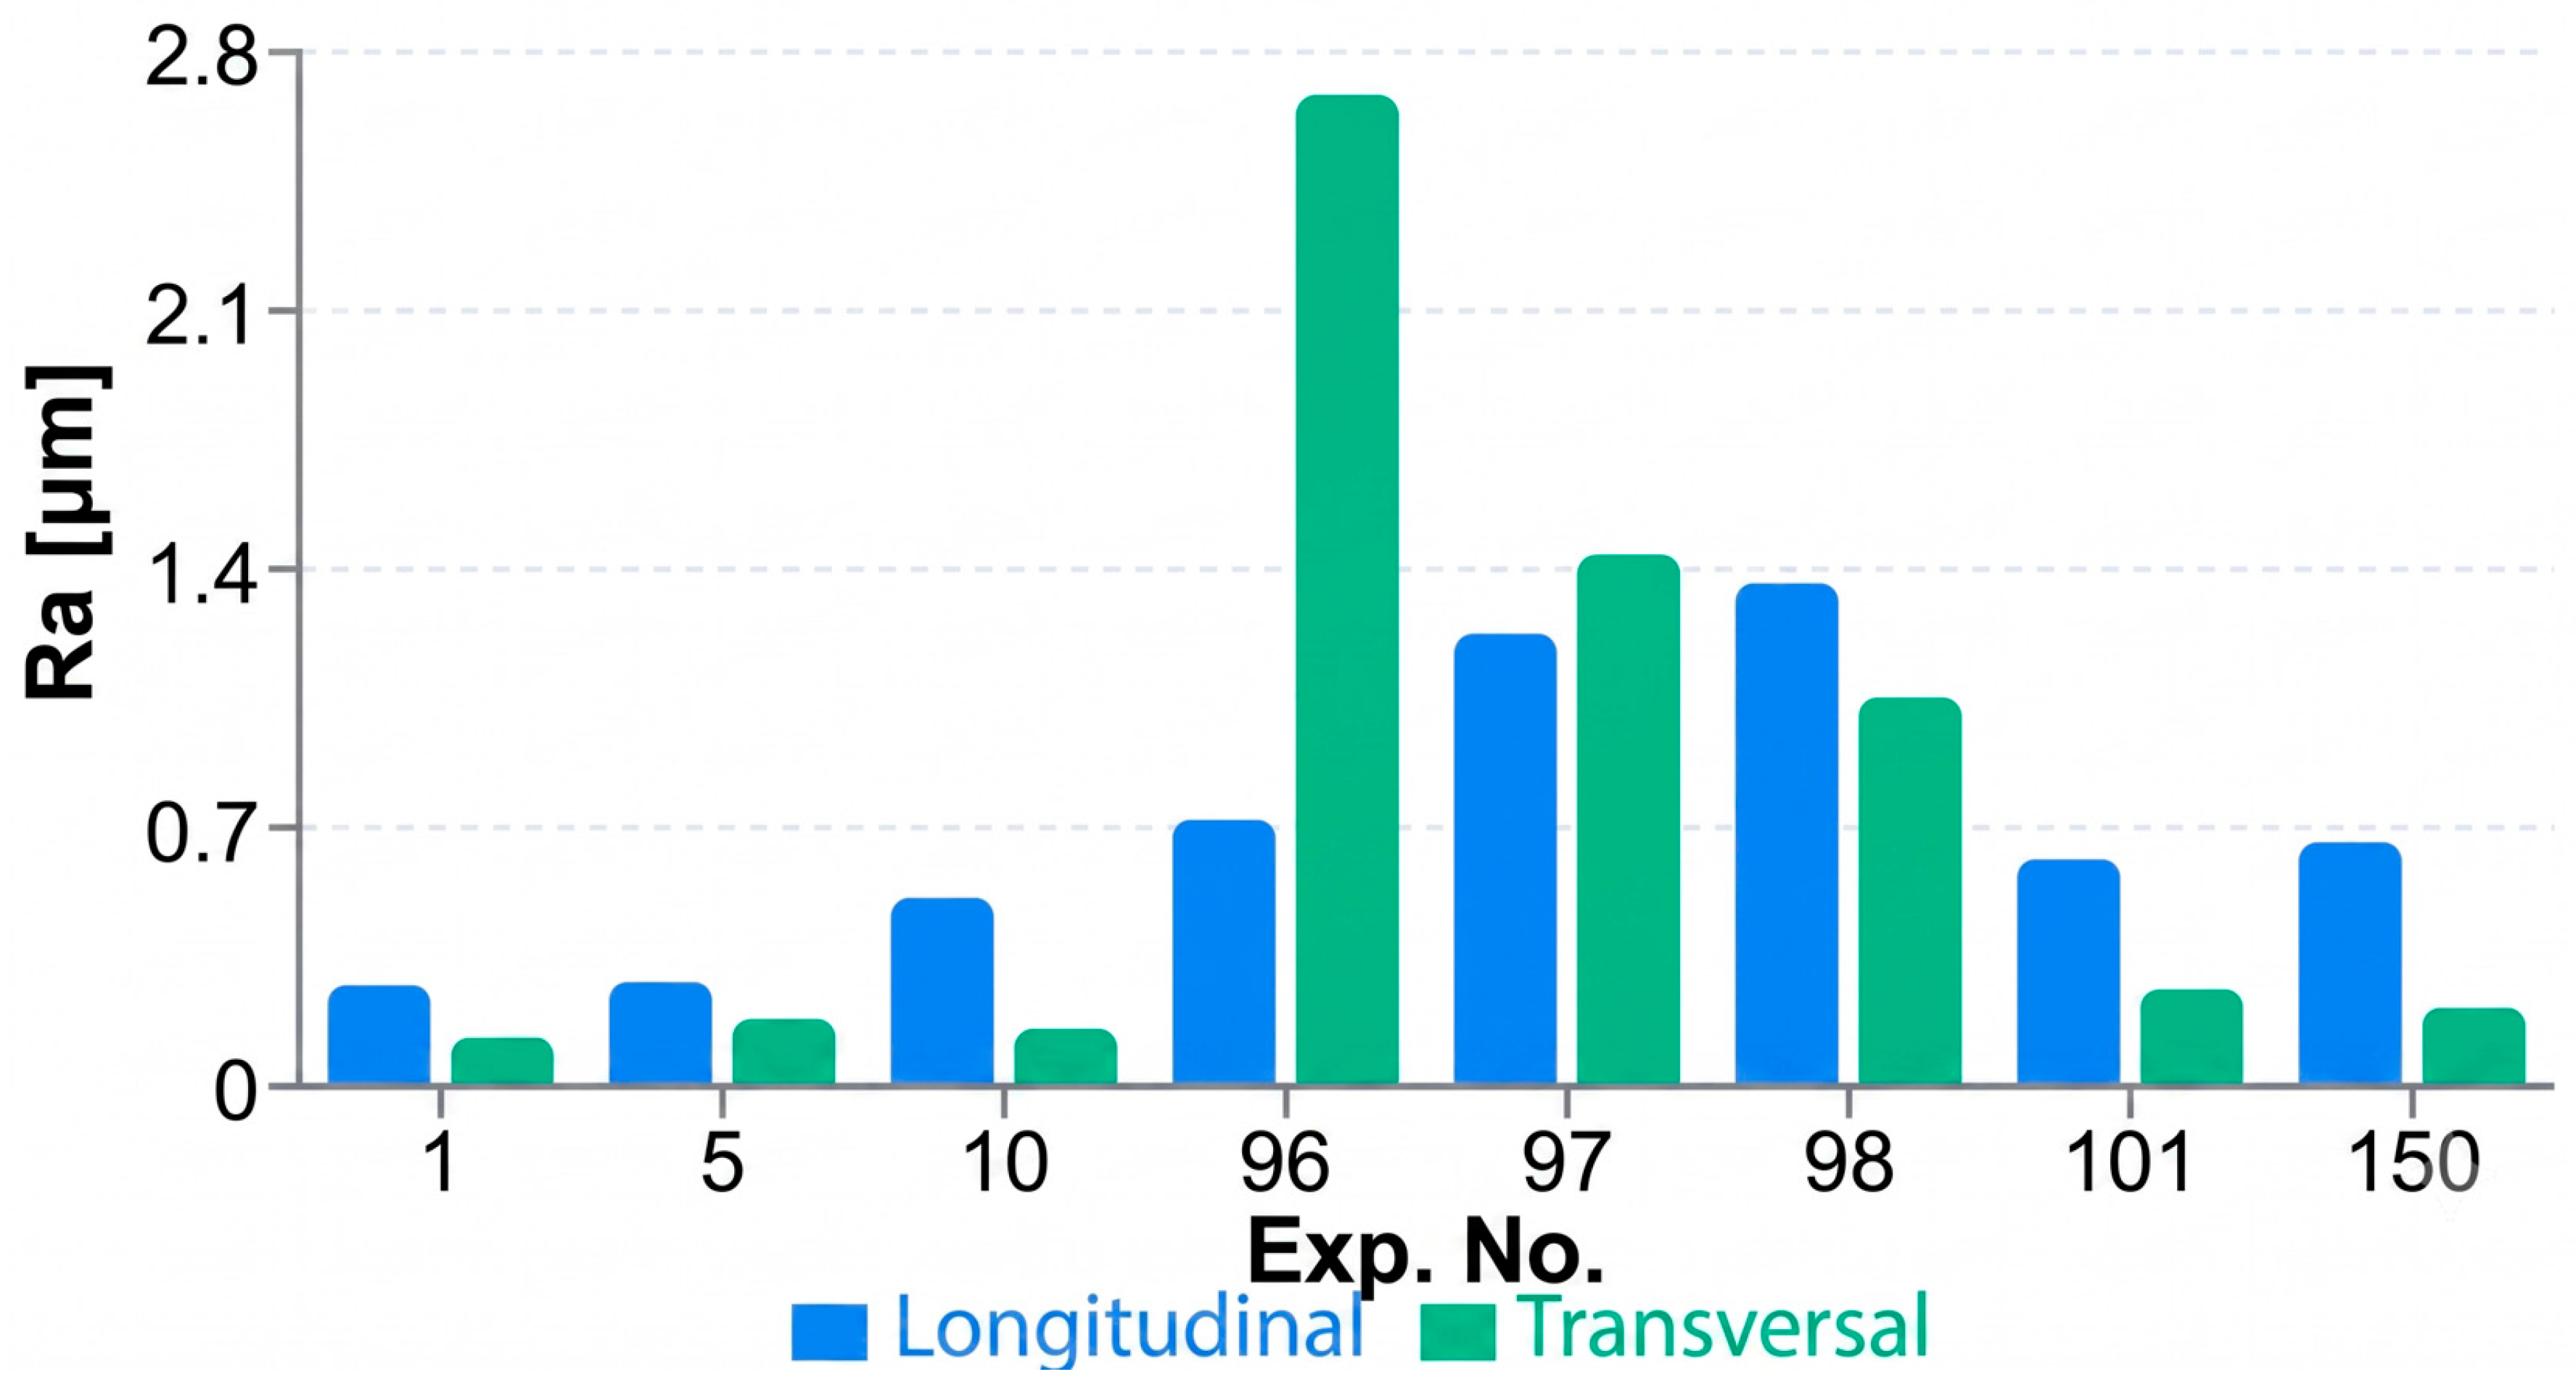
Figure 1 illustrates the evolution of surface roughness as a function of cutting speed. The comparison in Figure 1 shows that longitudinal Ra is consistently lower than transversal Ra. However, in the 610 m/min resonance zone, transversal Ra peaks significantly more (up to 2.7 µm), indicating that vibrations affect the transversal texture more severely than the longitudinal one.
Figure 1.
Roughness Evolution vs. Speed.
High-Speed Stabilization: At vc = 710 m/min, the longitudinal roughness stabilizes. High cutting speeds reduce Built-Up Edge (BUE) formation, providing an ideal substrate for anodization.
Self-Excited Vibrations: In experiments 96–100, the high Transversal Ra values indicate the presence of self-excited vibrations (chatter). These regions will exhibit low corrosion resistance due to the induction of micro-cracks.
Geometric vs. Dynamic Profile: Transversal Ra typically follows the tool’s geometric profile. When Longitudinal Ra significantly exceeds Transversal Ra, the process is undergoing dynamic instability.
Longitudinal Measurements: The Mean Longitudinal Ra is 0.706 μm, with the recorded values being influenced by vibrations.
Transversal Measurements: The Mean Transversal Ra is 0.763 μm; here, the influences of tool geometry and feed per tooth (fz) are most prominent.
Peak Anomaly: A maximum detected value of 2.682 μm was recorded, identifying a critical resonance zone.
Correlation Analysis: The following table presents a correlation between the cutting parameters and the resulting surface quality.
The proposed correlation between cutting parameters and corrosion performance is based on the predictive capacity of the dynamic stability index (σ). Our data indicate that a high standard deviation of roughness (σ = 0.112 µm in the 570–610 m/min zone) is a direct precursor of anodized layer defects (Table 8). According to the mechanism described in Table 2, a surface with ‘chatter marks’ (vibration traces) exhibits a micro-geometry with steep slopes where the oxide layer, following the metallic contour, becomes extremely thin at the peaks. These points of minimum thickness represent the ‘corrosion origin mode,’ acting as gateways for pitting corrosion initiation under electrochemical load. Thus, the regression model for Ra and the anisotropy analysis become prognostic tools: a regime that minimizes both Ra and σ (such as the one at 710 m/min) guarantees a substrate with uniform surface energy, optimal for maximum adhesion and efficient sealing of the protective layer.
Table 8.
Correlation: Cutting Parameters vs. Surface Quality (Sample).
Self-excited vibrations (chatter) identified in the vc = 570–610 m/min range induce cyclic dynamic loads on the material surface. These loads exceed the local yield strength of the Al 7136 alloy under the tool tip, causing severe and non-uniform plastic deformation. This mechanical instability leads to the formation of intergranular micro-cracks within the Surface Stratum Deformation (SSD) layer, which functions as stress concentration zones. Unlike the stable regime at 710 m/min, where the material flow is continuous and uniform, the resonance regime produces an undulated texture that promotes the appearance of tensile residual stresses at the surface.
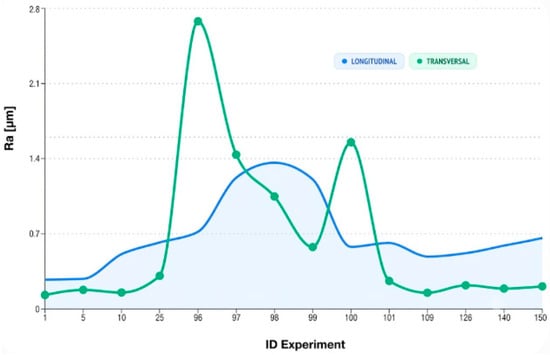
The impact of CNC parameters on the integrity of the anti-corrosion coating is shown below (Figure 2, Figure 3 and Figure 4).
Figure 2.
Evolution of Ra across the experimental dataset.
Figure 3.
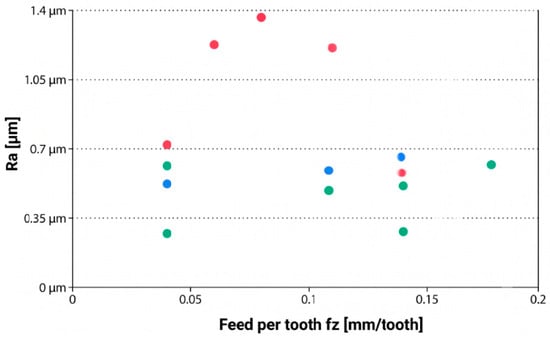
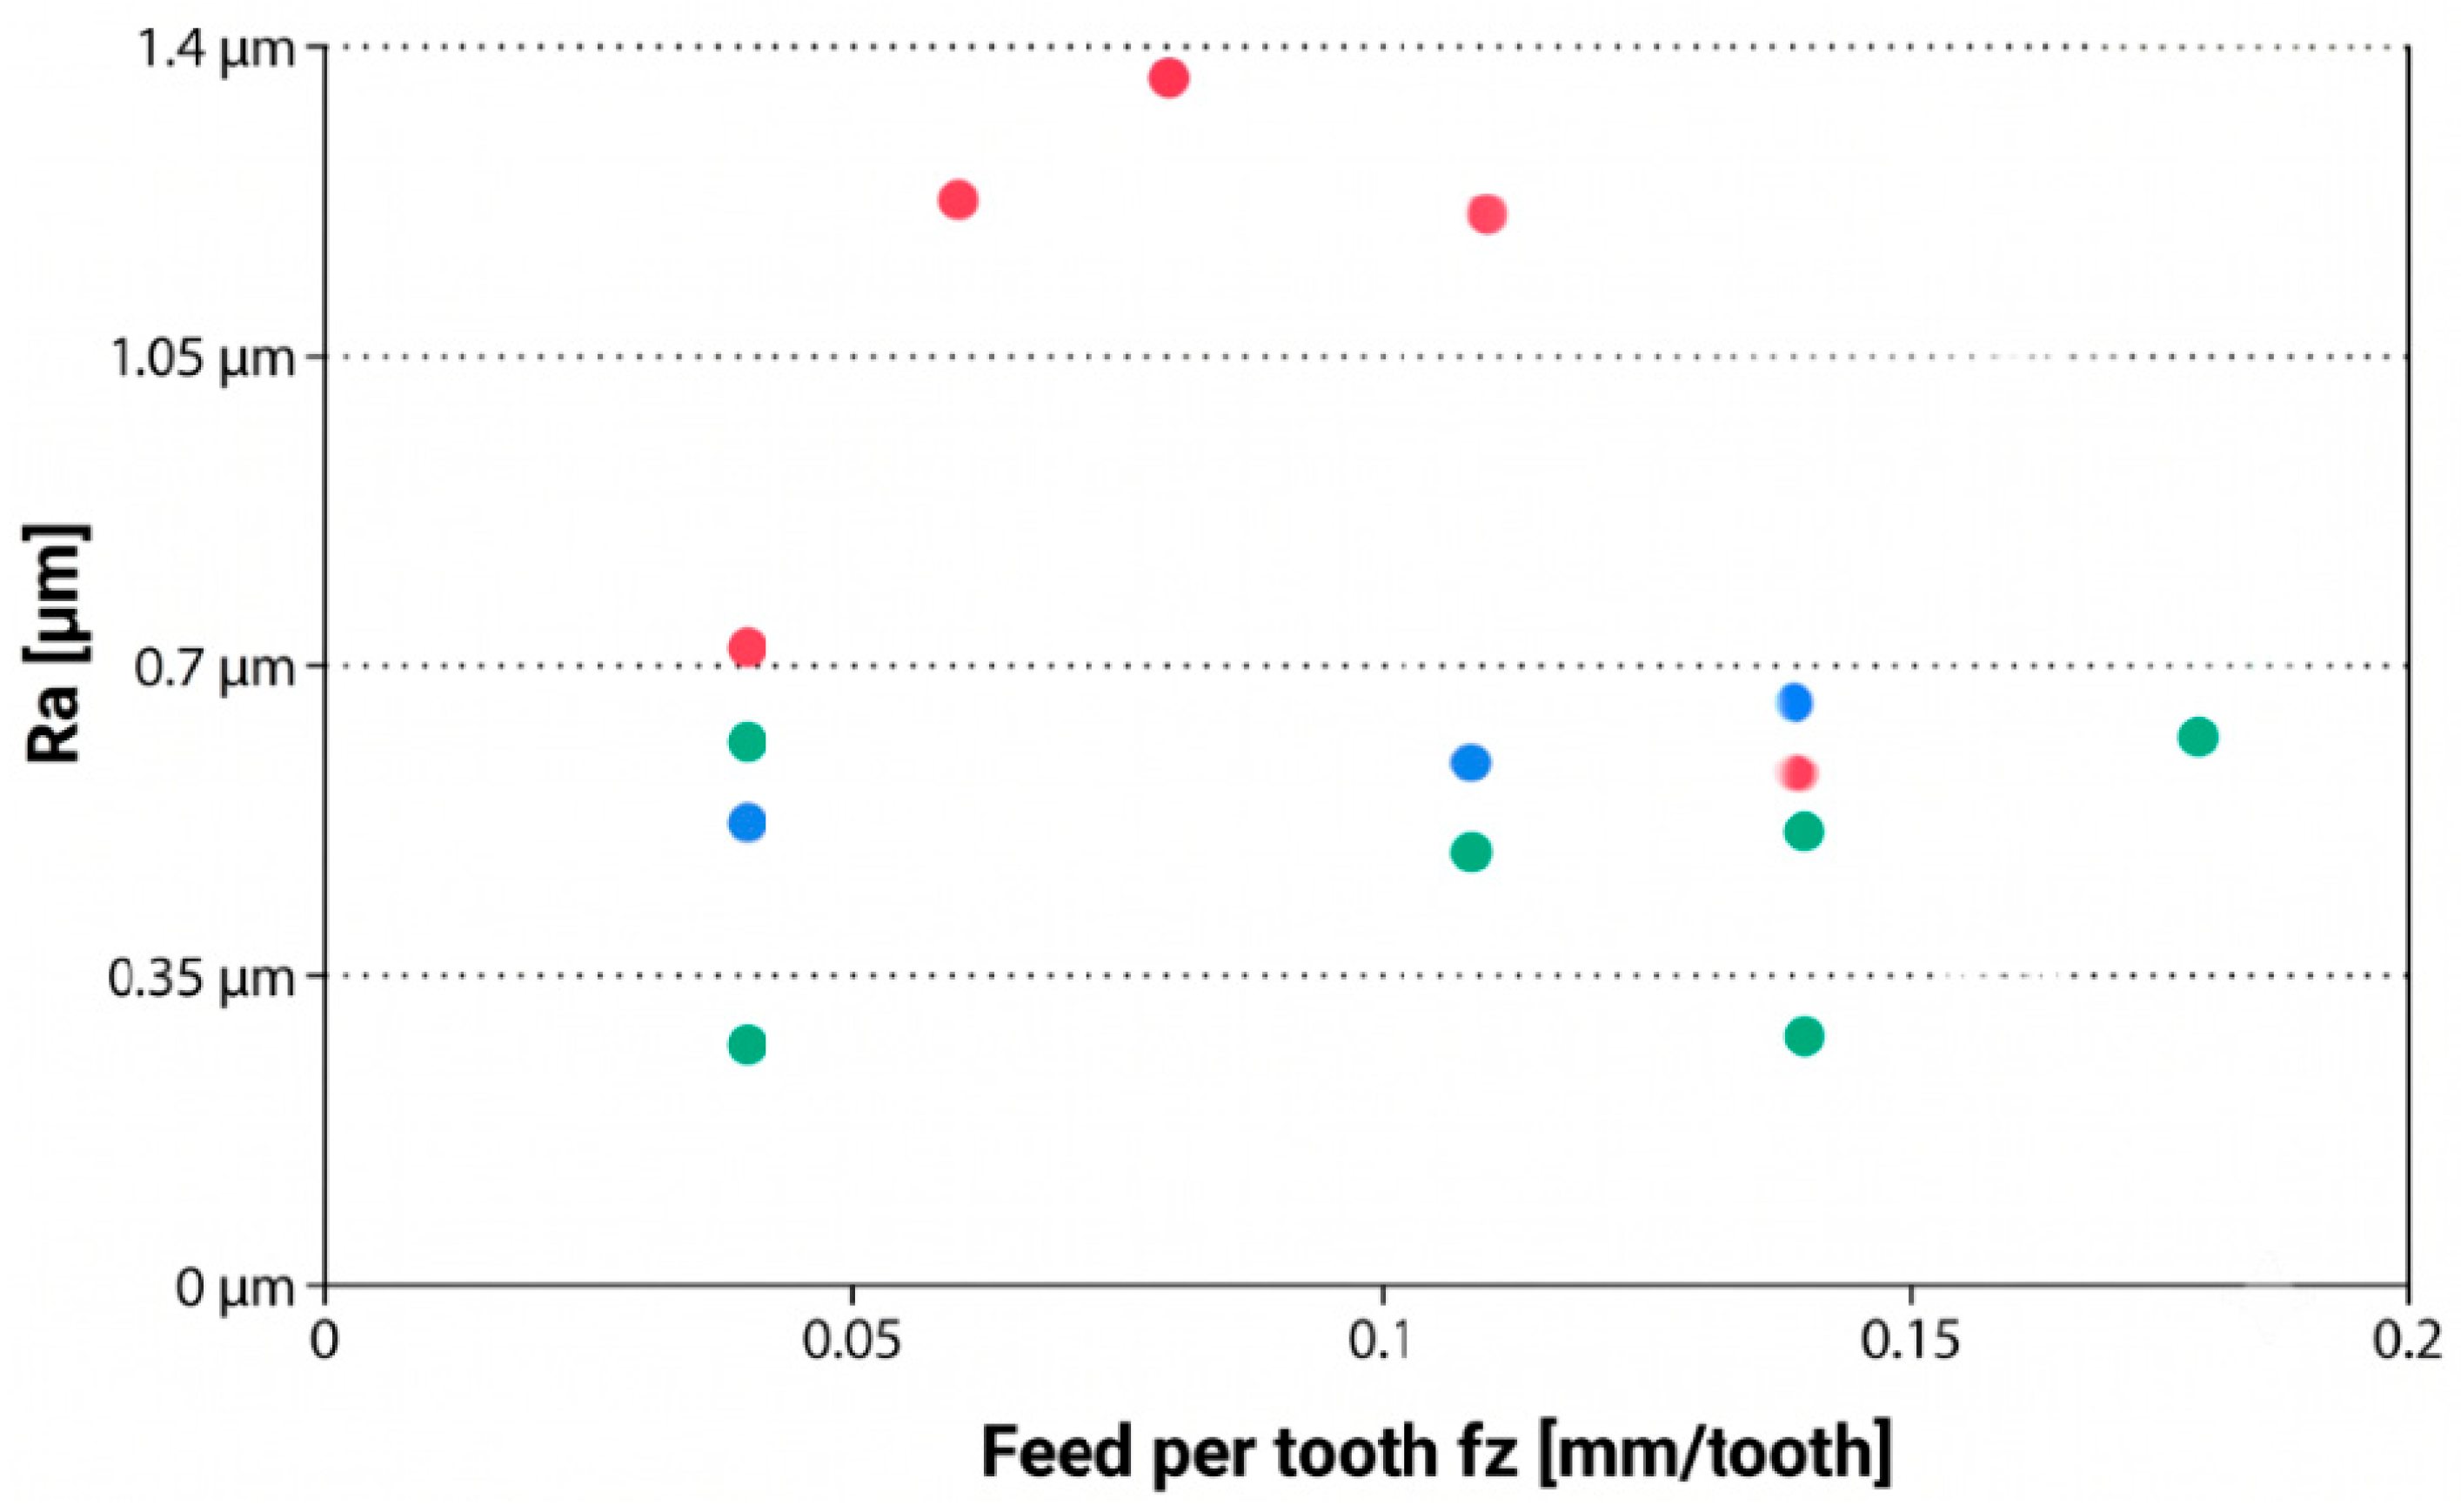
Correlation between fz advance and Ra roughness.
Figure 4.
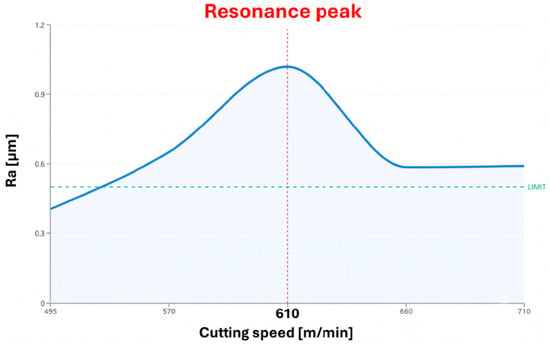
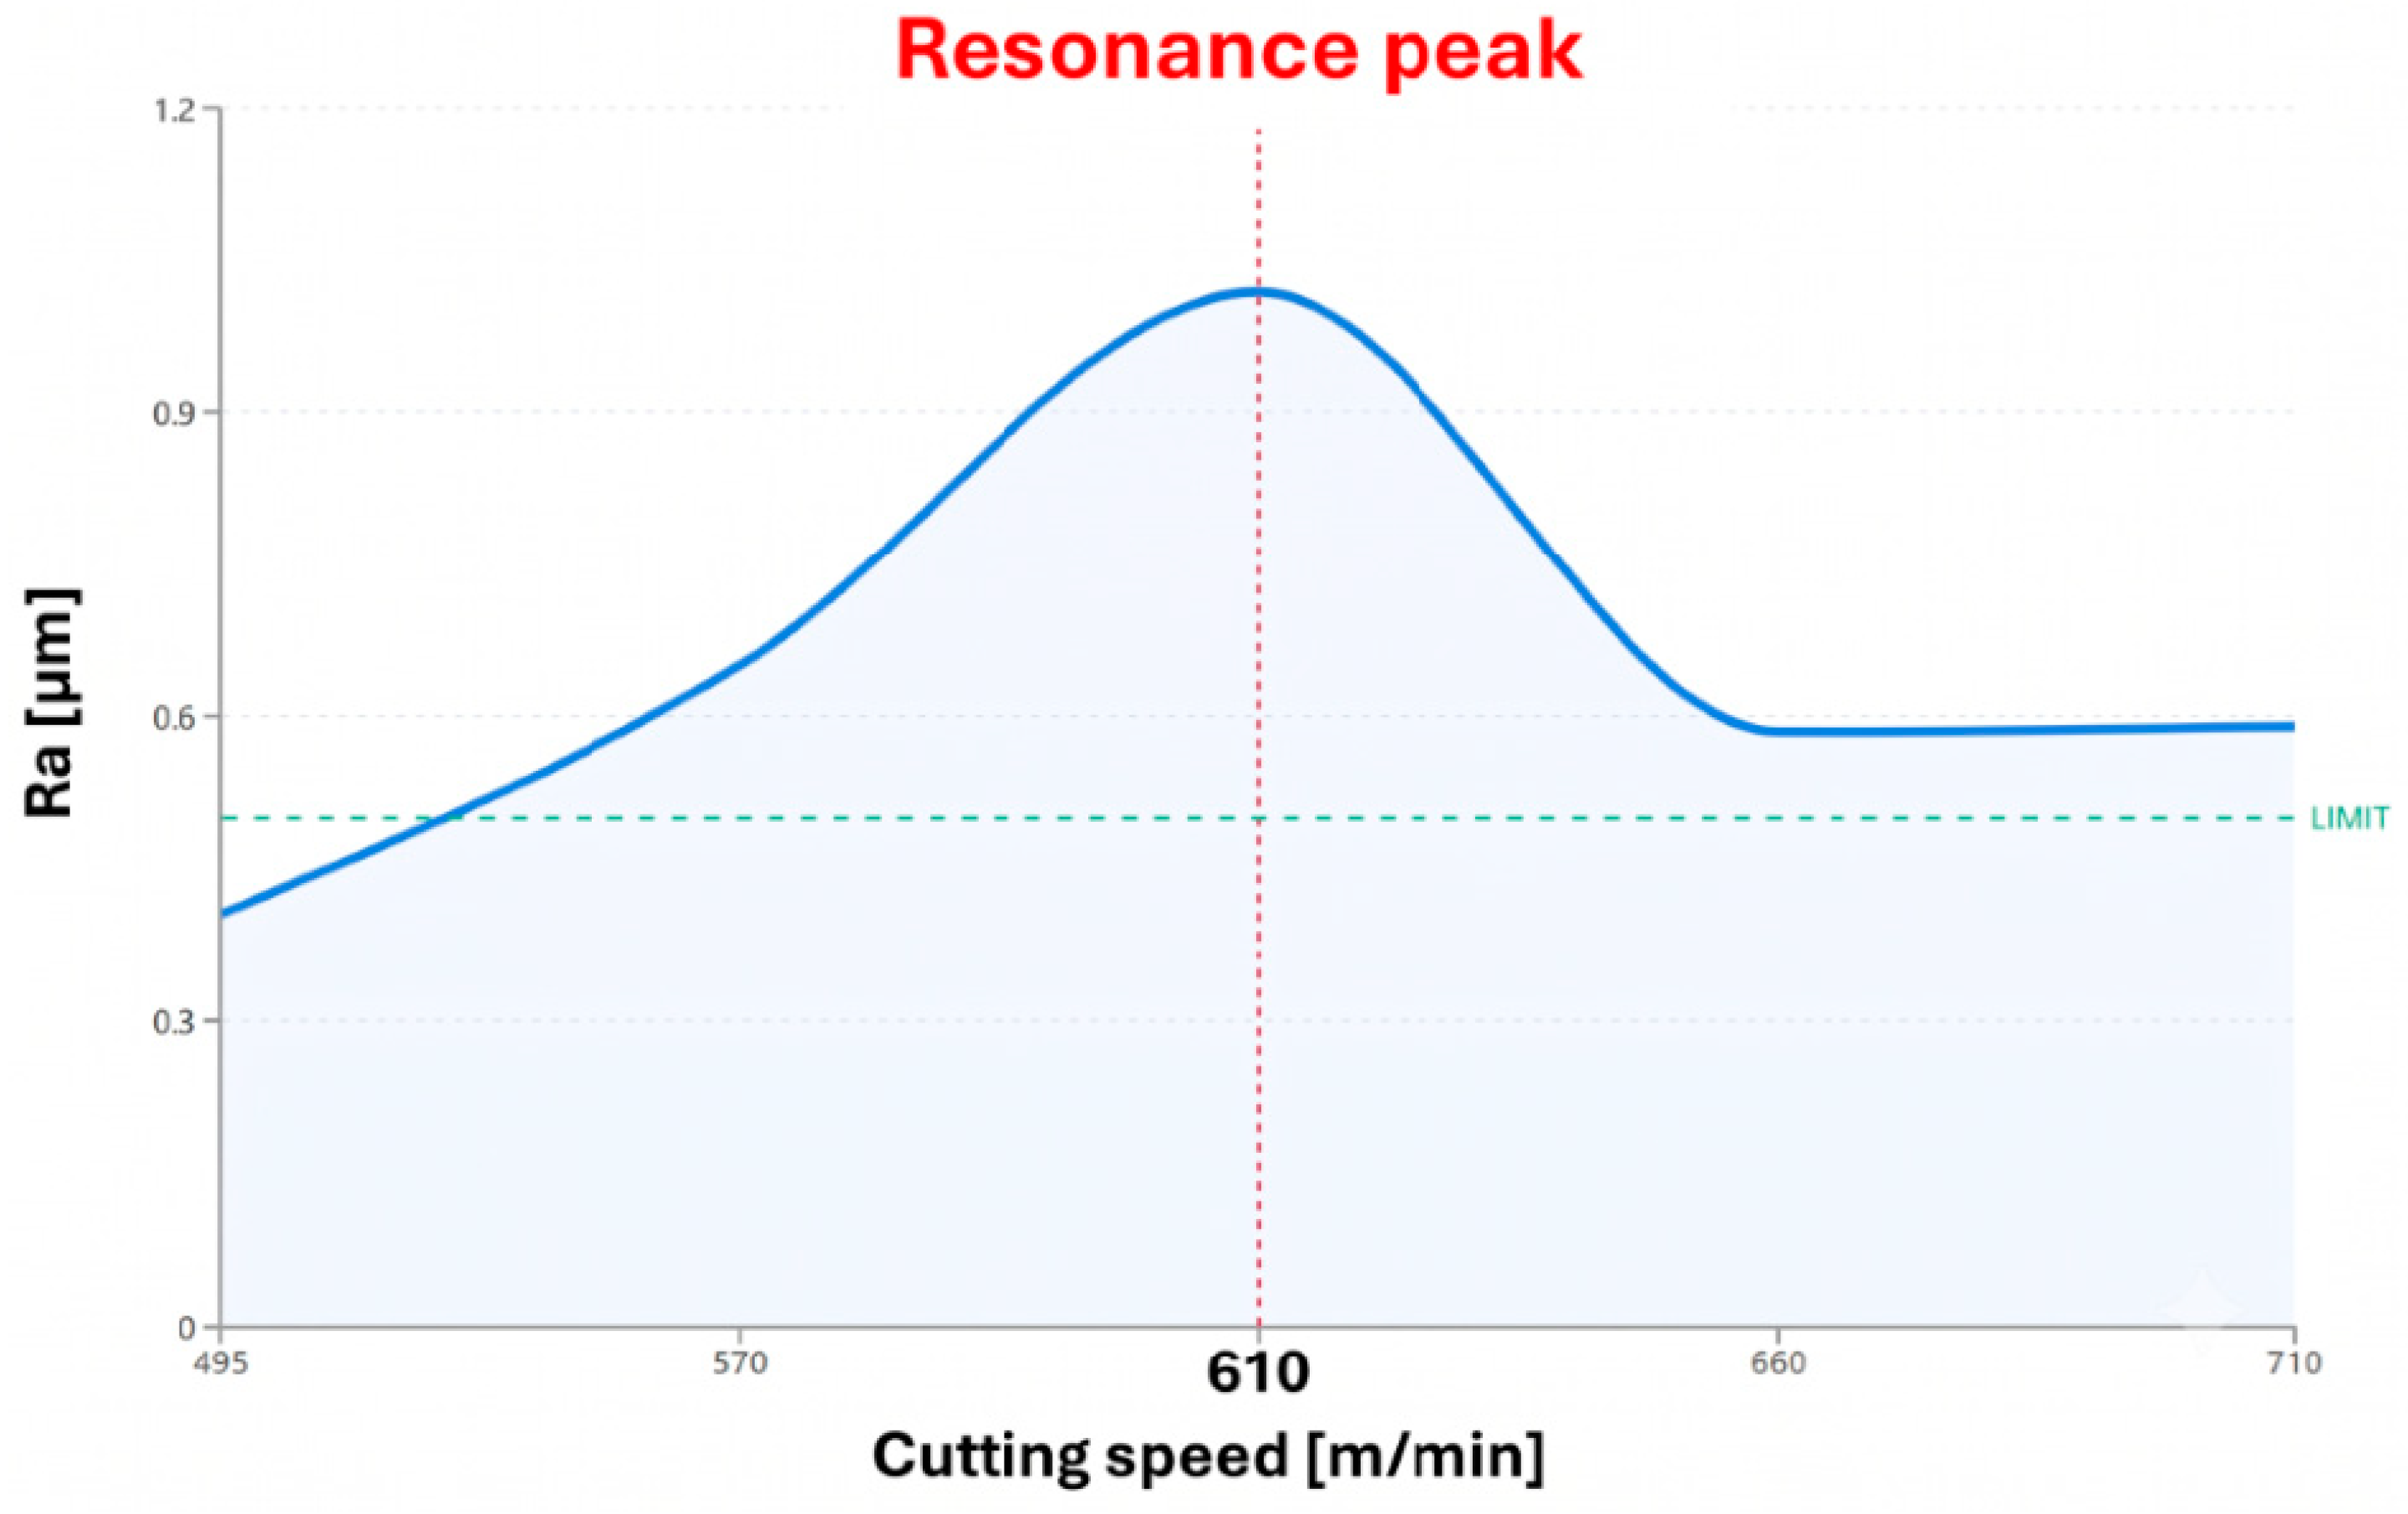
Regression response surface profile of mean roughness deviation across the cutting speed boundary.
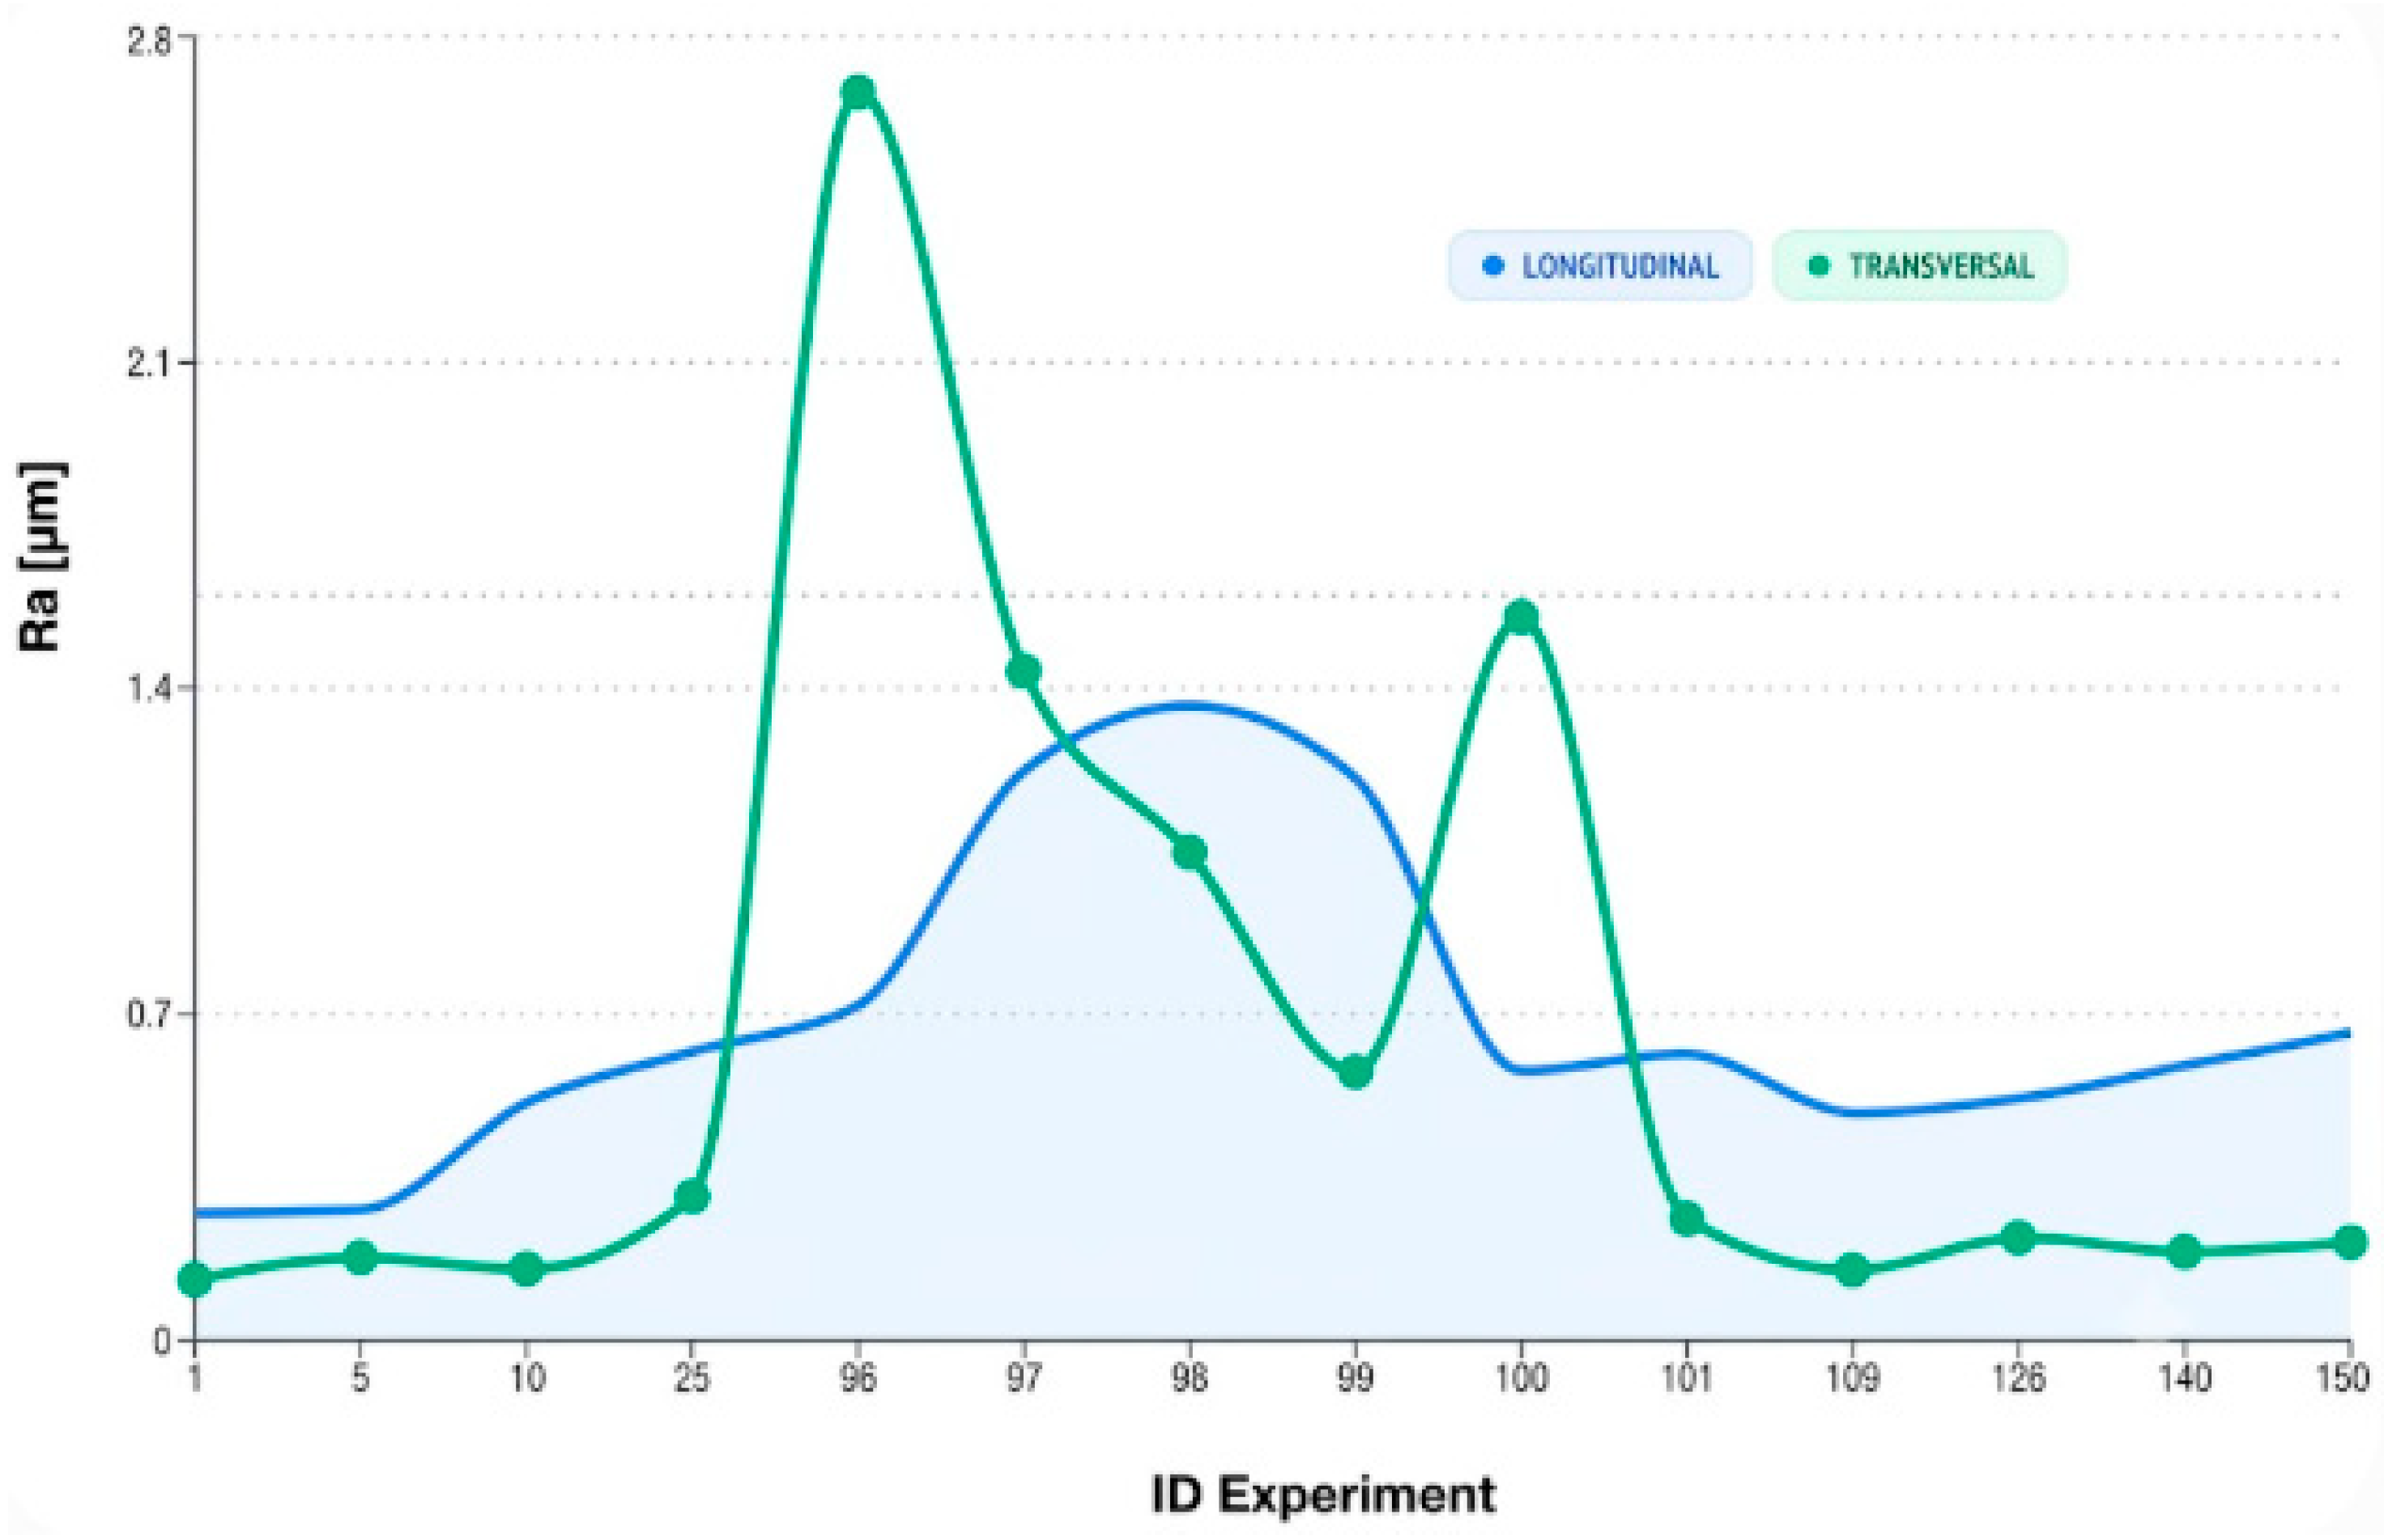
In Figure 2, the X-axis represents the Experiment ID, corresponding to the testing sequence within the block of 150 unique cutting regimes. The Y-axis displays the roughness values (Ra):
Longitudinal Ra: Measured along the feed direction. Elevated values are indicative of process instability.
Transversal Ra: Measured in the perpendicular direction. A significant discrepancy compared to the longitudinal Ra confirms the presence of chatter.
The analysis of the graphs in Figure 1 and Figure 2 confirms that roughness does not increase linearly with speed. An instability ‘crest’ is observed at intermediate speeds, followed by a stabilization zone at high speeds (vc = 710 m/min), where the formation of Built-Up Edge (BUE) is minimized.
To systematically clarify the non-linear topography trends observed across the experimental dataset, a clear distinction must be made between the low-speed resonance behaviors and the high-speed stabilization mechanisms. As cutting speed increases from 400 m/min toward the intermediate 570–610 m/min range, the machine-tool system encounters a critical dynamic instability window, where self-excited chatter harmonics trigger severe wave amplification, forcing the prominent roughness crests mapped in Figure 2 and Figure 3. Conversely, upon crossing past this structural resonance threshold into the ultra-high-speed finishing envelope (vc 680–710 m/min), a distinct physical transition occurs. At these elevated peripheral velocities, Built-Up Edge (BUE) formation is eliminated, cutting force components drop, and thermal dissipation via continuous chip evacuation stabilizes the shear zone. This aerodynamic and mechanical stabilization accounts for the sharp decrease and ultimate leveling of the Ra profile observed at 710 m/min, delineating a highly predictable, low-roughness processing window.
In Figure 3, fz (mm/tooth) the feed per tooth is the main factor generating geometric micro-geometry.
The data confirms that roughness does not increase linearly with speed. There is an “island” of stability at high speeds where the adhesion of the protective layer will be maximum.
These graphs show that it is not advisable to use the regime v = 610 m/min ap = 4 mm and recommend v = 710 m/min and fz = 0.14 mm.
The assessment of surface integrity for corrosion protection is shown in Figure 4, Figure 5, Figure 6 and Figure 7.
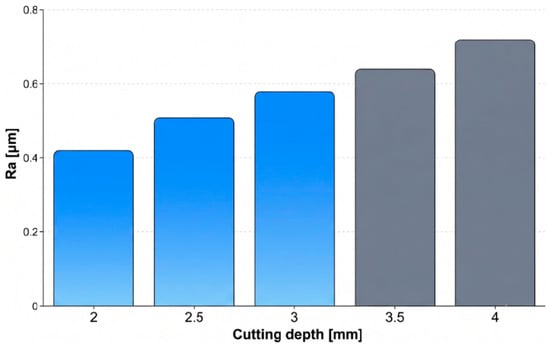
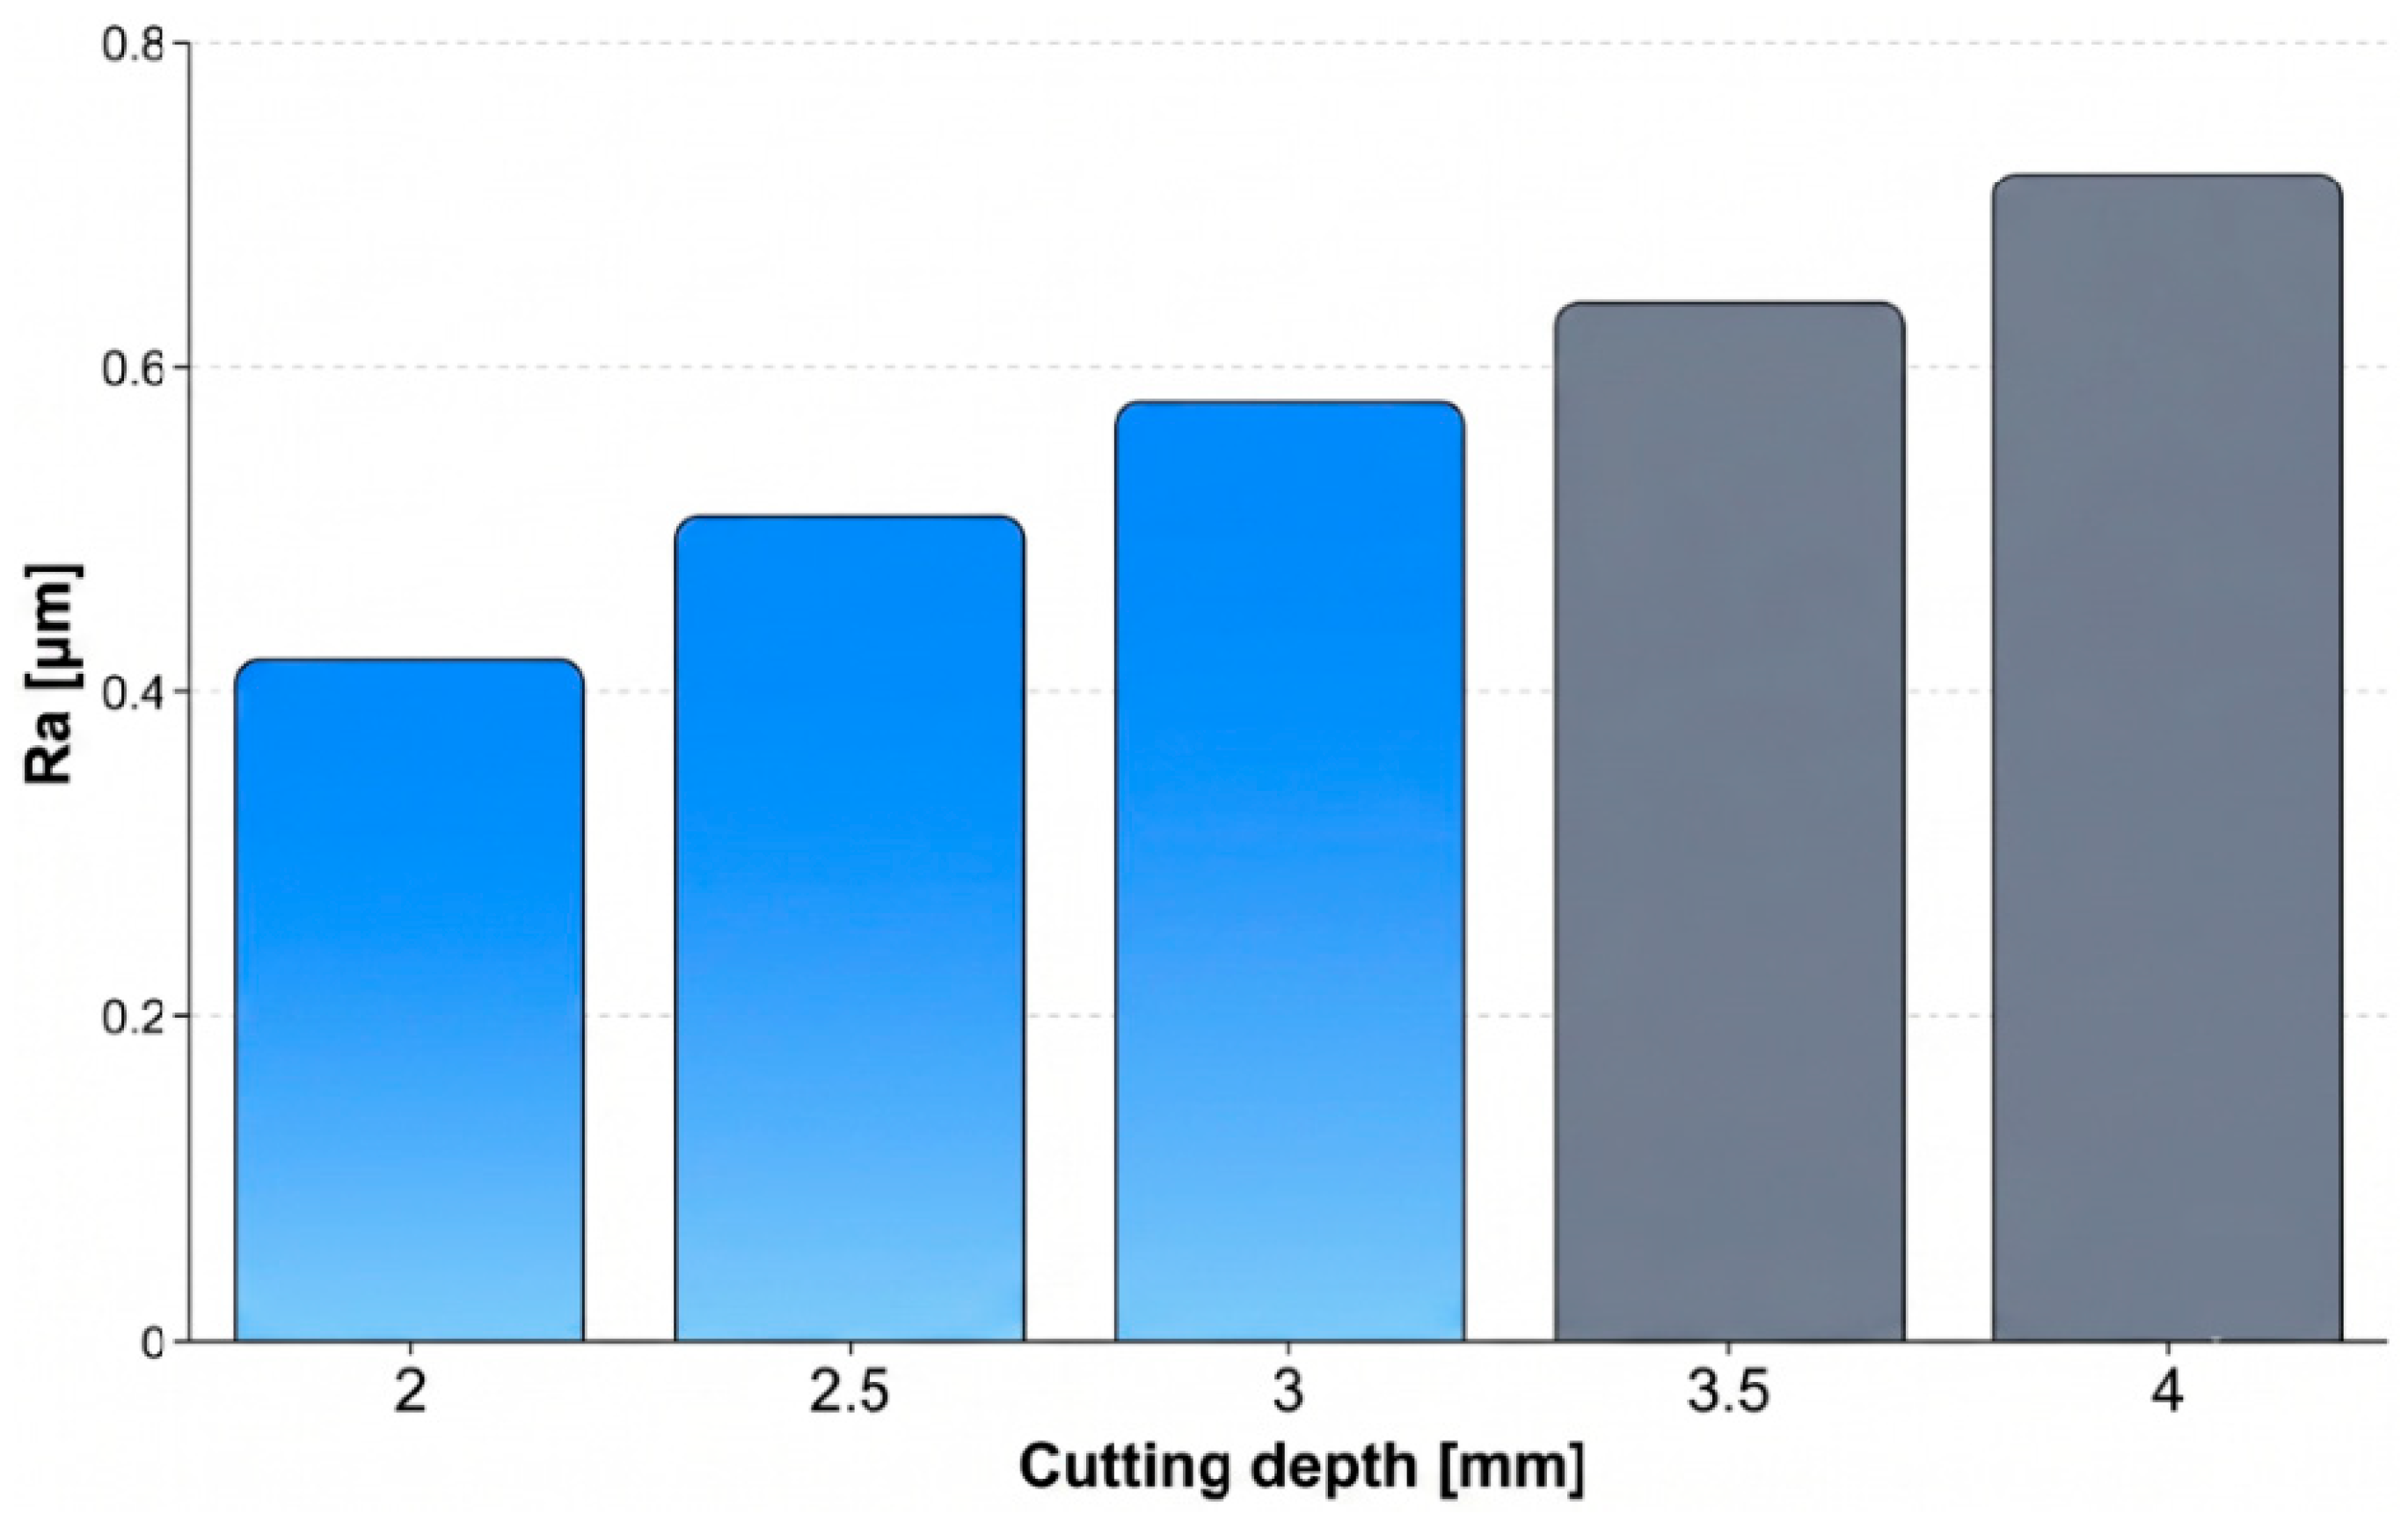
Figure 5.
Influence of cutting depth on Ra.
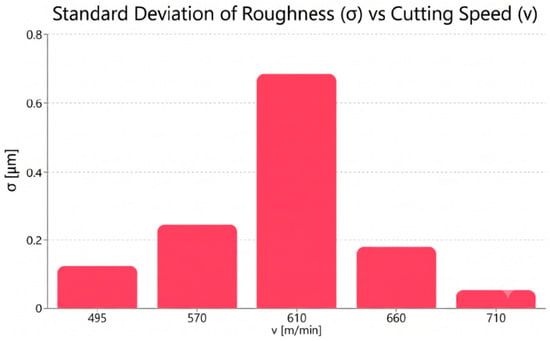
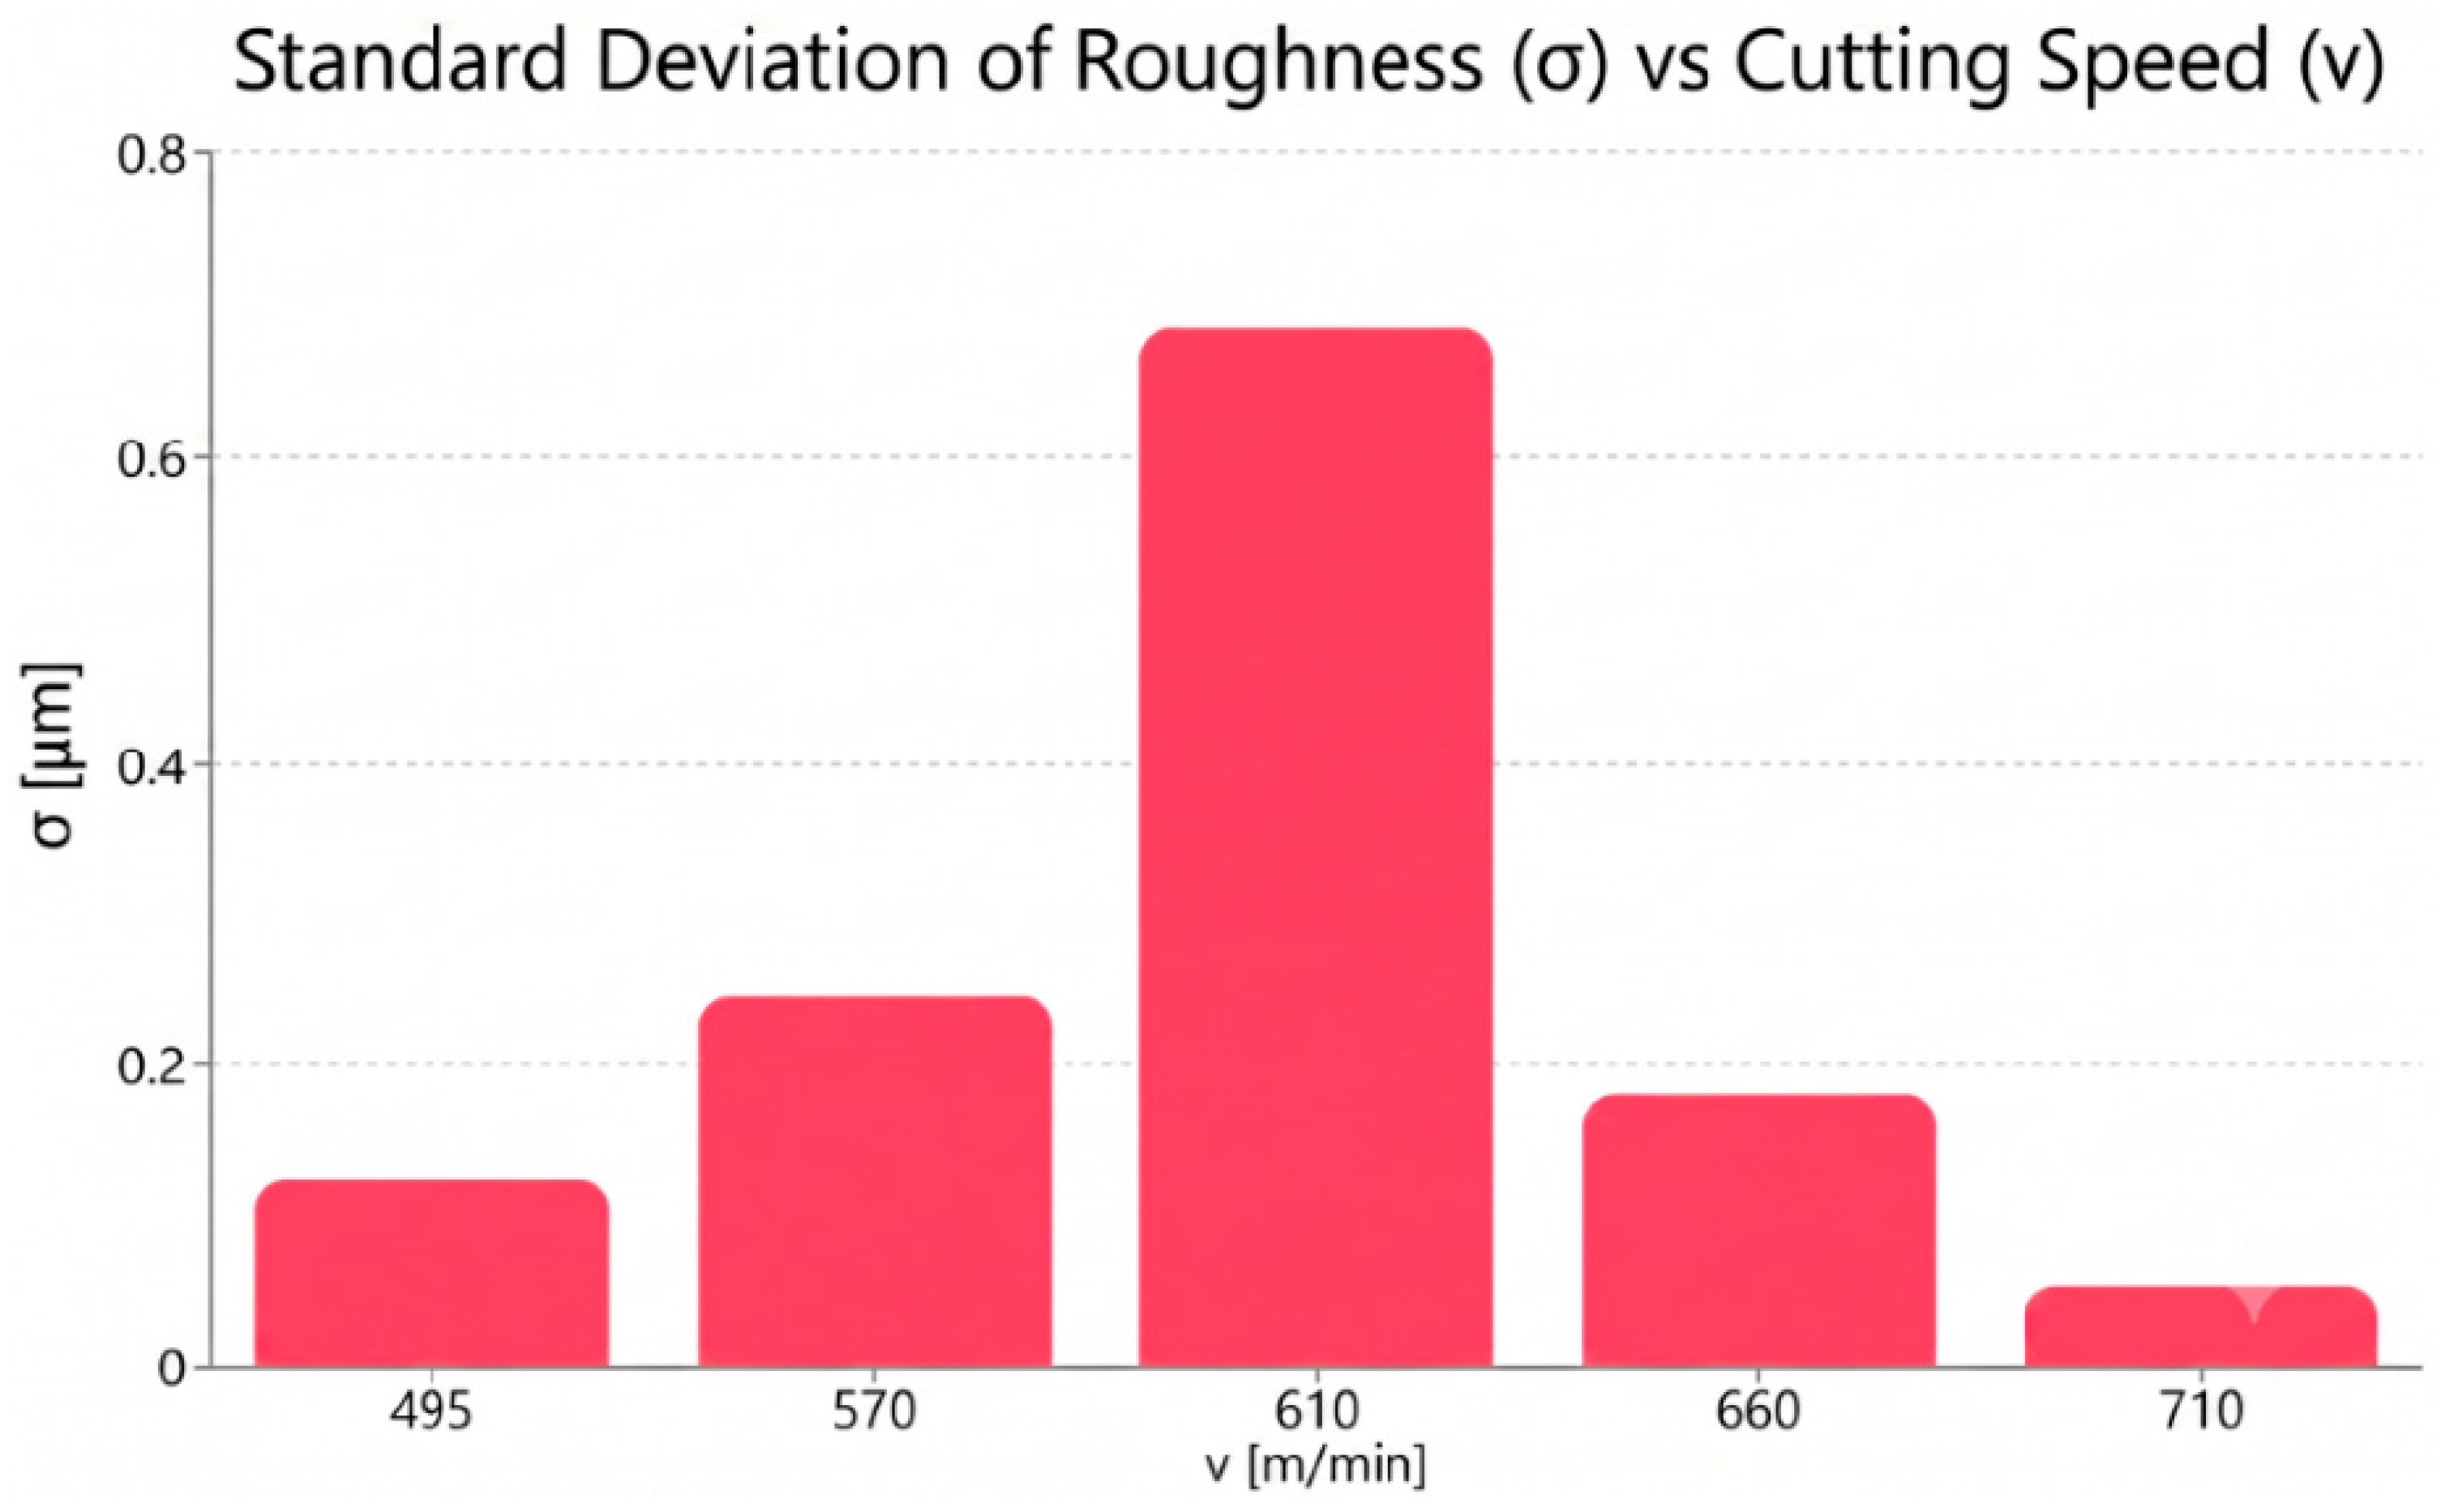
Figure 6.
Process noise (standard deviation).
Figure 7.
Correlation anisotropy Ra longitudinal versus Ra transversal.
Figure 4 and Figure 6—Resonance and Standard Deviation: The correlation between these two figures is essential. The resonance peak at vc = 610 m/min corresponds directly to the maximum standard deviation value of 0.112 µm, statistically demonstrating the lack of process predictability within this interval.
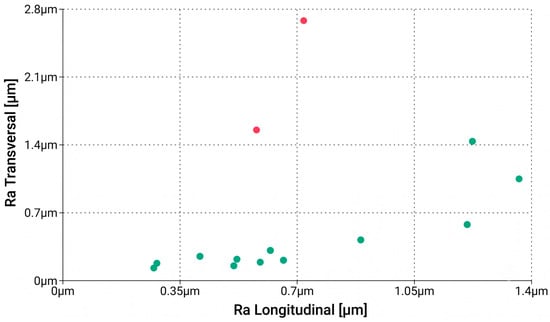
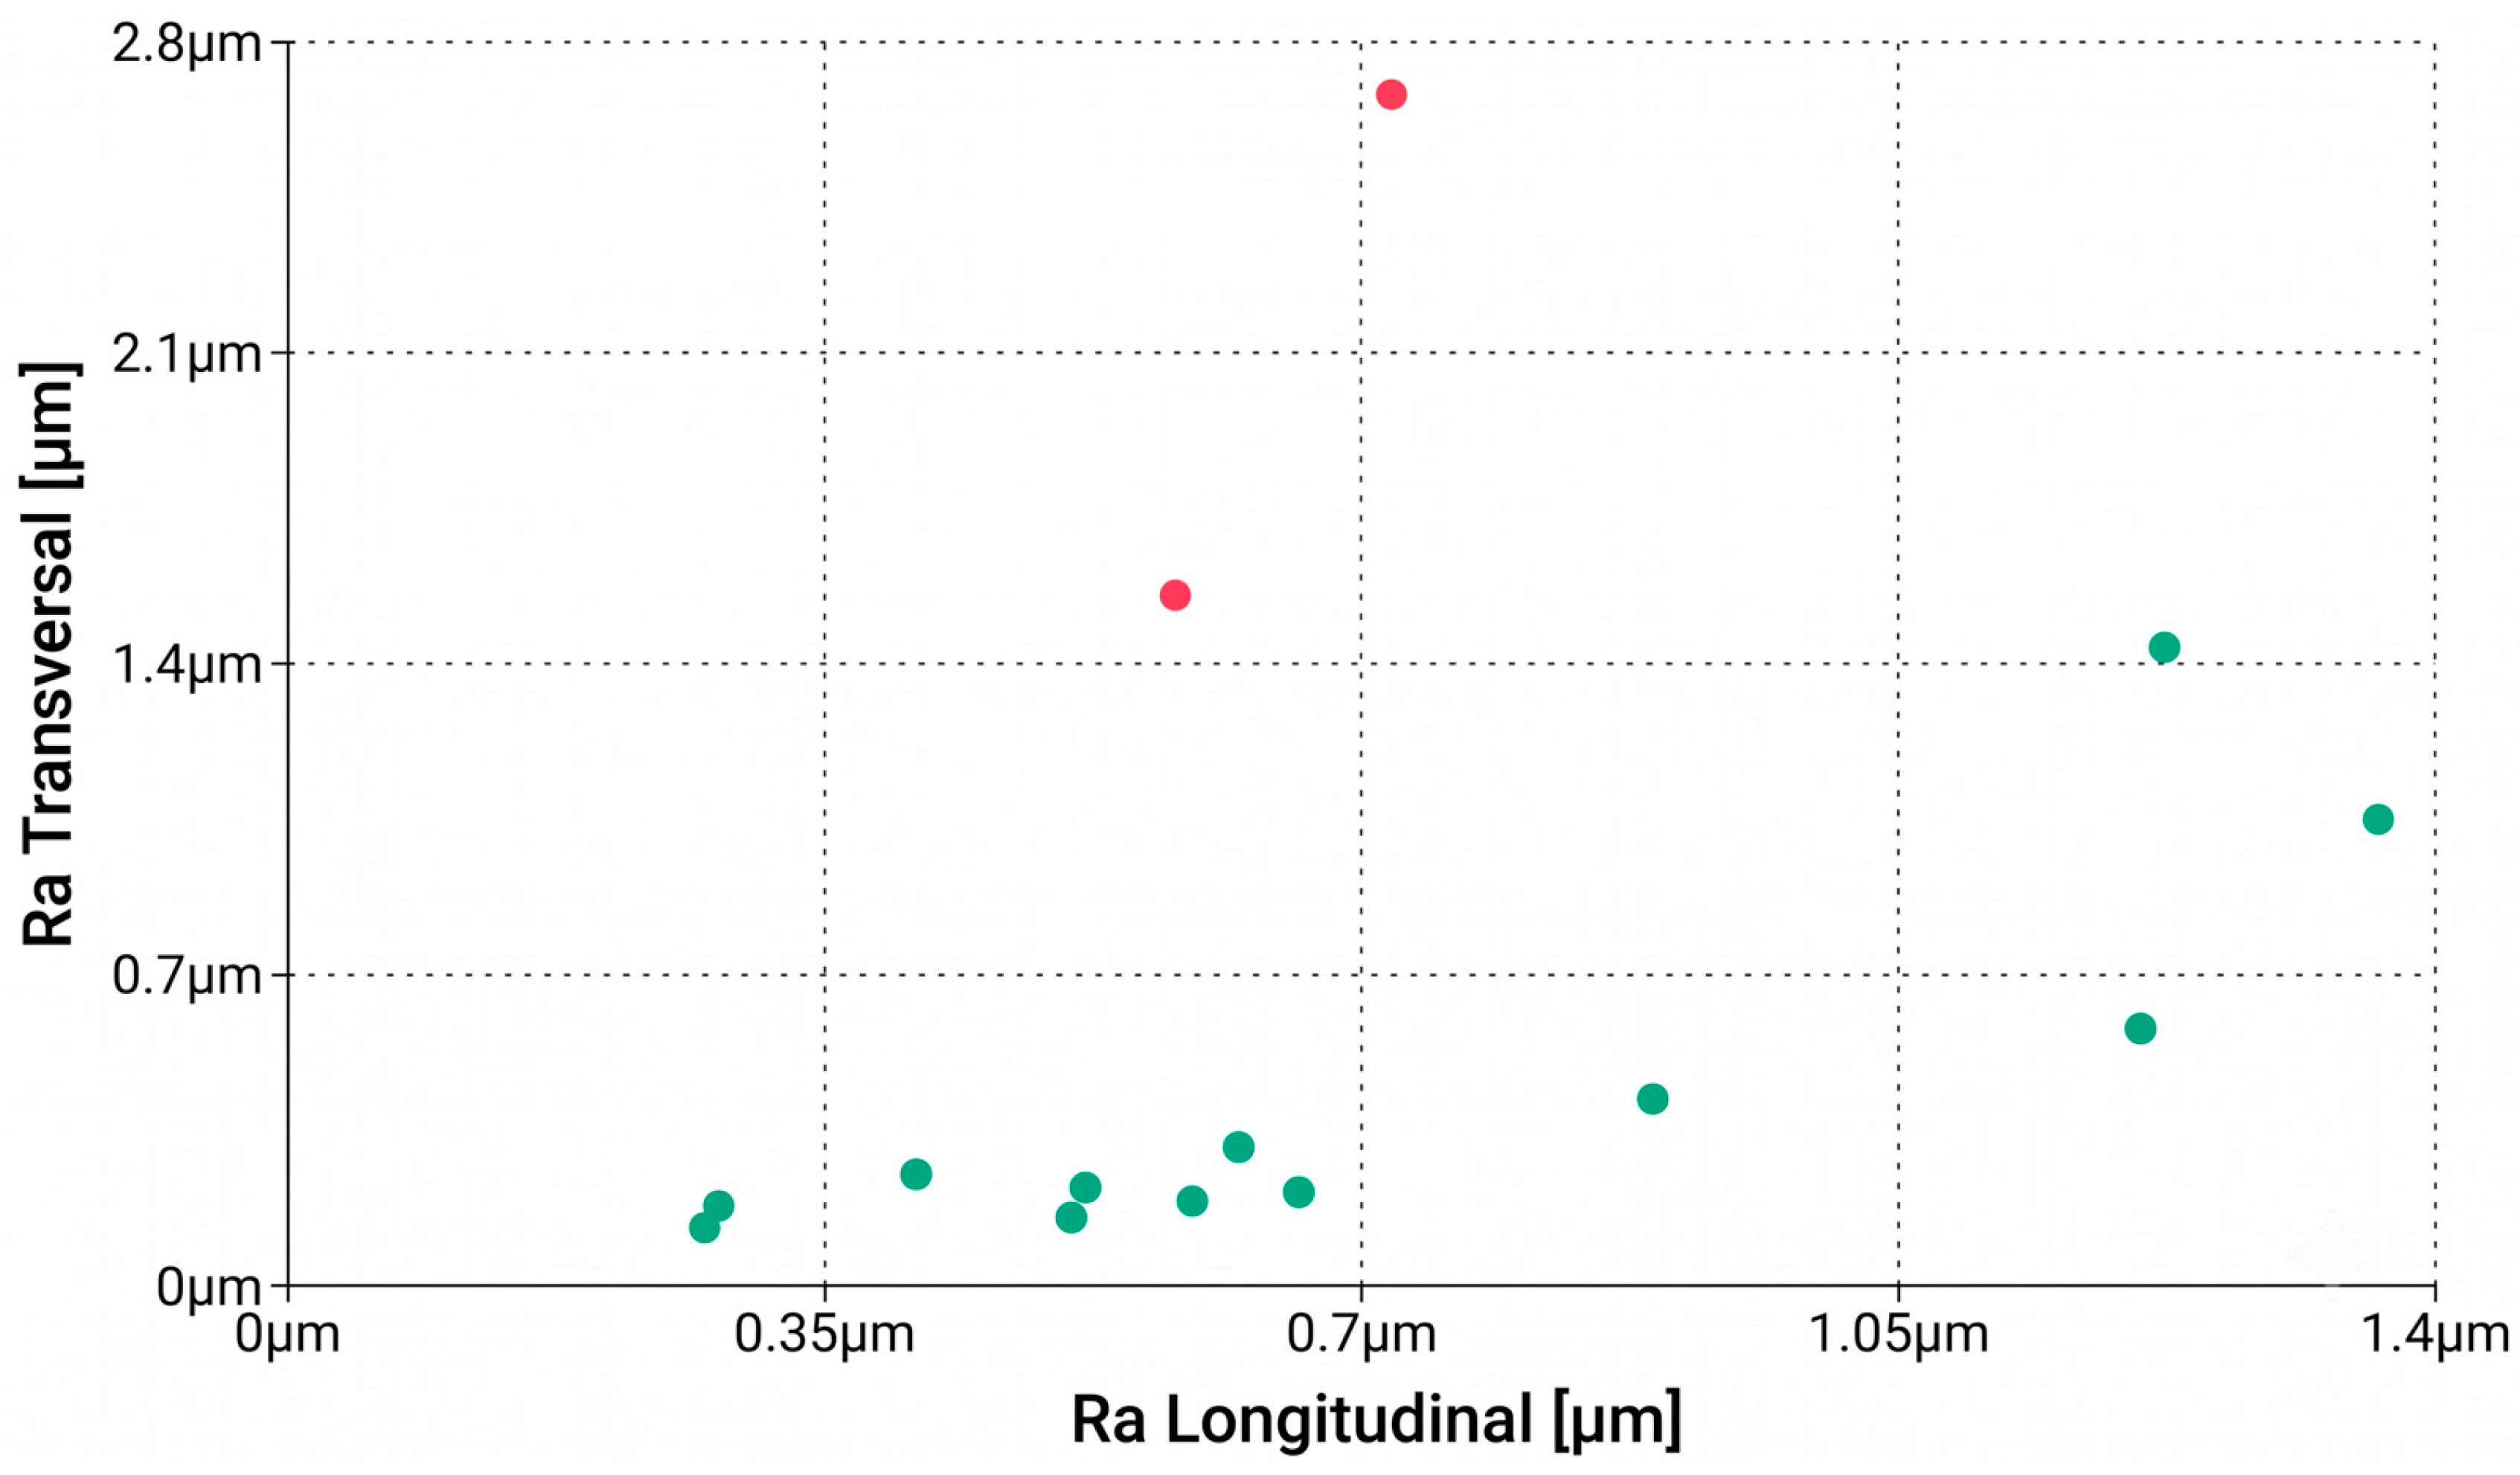
Figure 7 illustrates the prominent directional discrepancy between the longitudinal and transversal roughness profiles, which defines the structural anisotropy of the machined surface. However, within the 570–610 m/min resonance zone, this regular anisotropy is heavily disrupted by self-excited vibrations, transforming the surface into a highly non-uniform topography. This severe spatial non-uniformity represents the core physical defect that compromises the dimensional consistency and mechanical adhesion of the subsequent protective layer.
A deeper analysis of the surface texture and morphology characteristics is achieved by examining the structural anisotropy, captured through the relationship between Longitudinal Ra and Transversal Ra (as visualized in Figure 7). In stable machining regimes (e.g., ID 1 and ID 150), the surface texture is predominantly governed by tool kinematics and geometric feed markers (fz), keeping the standard deviation remarkably low (σ = 0.051 µm). However, upon entering the resonance ‘danger zone’ (vc = 570–610 m/min), the surface morphology undergoes severe transition. The extreme peak anomalies (Transversal Ra spiking up to 2.682 µm) combined with a massive expansion of standard deviation (σ = 0.680 µm) confirm that the regular geometric texture is completely replaced by dominant, high-amplitude undulations, commonly classified as chatter marks. This severe topographical asymmetry creates a highly non-uniform micro-geometric environment, directly predisposing subsequent protective layers to localized physical degradation.
The regular directional discrepancy observed between the longitudinal and transversal parameters defines the structural anisotropy of the machined surface, expected from tool kinematics. However, within the 570–610 m/min window, self-excited vibrations heavily disrupt this texturing, transforming it into a highly non-uniform topography. This severe spatial non-uniformity represents the core physical defect that compromises subsequent coating adhesion.
The analysis of the parameters shown in Figure 4, Figure 5, Figure 6 and Figure 7 provides the following insights:
Cutting Speed (vc): Establishes the transition toward High-Speed Machining (HSM). The peak observed at 610 m/min indicates the dynamic limitation of the CNC machine.
Depth of Cut (ap): Demonstrates the system’s stability under increased axial forces. A linear increase in roughness is observed as the depth of cut increases.
Standard Deviation (σ): Represents the risk of localized defects (such as oxide porosity) caused by an unpredictable process.
Anisotropy: The significant discrepancy between Longitudinal Ra and Transversal Ra confirms the presence of vibration waves, which will embrittle the protective coating.
Surfaces with Ra > 1.2 μm exhibit a “peak-like” (crest) topography, where the metallic peaks are not fully covered by the oxide layer, subsequently acting as a local anode.
In conclusion, the data obtained demonstrate that roughness is not merely a geometric value, but a direct indicator of the dynamic state of the workpiece.
4.5. Discussions
To clearly reinforce the primary goal of this investigation, the results discussed herein serve to build a non-speculative, data-driven manufacturing map focused exclusively on substrate optimization. By demonstrating that cutting speed dominates roughness variance with an 83.89% contribution, this study shifts the engineering focus toward suppressing process noise during the high-speed milling of the Al 7136-T76511 alloy. The purpose is to provide a predictive framework that allows process engineers to proactively avoid resonance configurations, thereby guaranteeing a uniform metallic substrate that maximizes the mechanical efficiency of subsequent aerospace coatings.
The massive 83.89% contribution of cutting speed (vc) to surface roughness variance explicitly isolates this work from conventional milling theories. In low-speed, traditional manufacturing operations, the tool’s corner radius and the feed per tooth are the fundamental components driving Ra. However, by operating deep within high-speed machining (HSM) regimes, the thermal dissipation via the chip and the minimization of Built-Up Edge (BUE) completely redirect the process physics. This extreme speed dominance mathematically justifies why conventional, generalized aluminum cutting models are inadequate for specialized aerospace alloys like Al 7136-T76511, necessitating the specific regression framework proposed herein.
The cutting regime that produces a minimum and stable roughness profile (vc = 710 m/min with σ = 0.051 µm) offers a superior and mathematically predictable substrate configuration for anti-corrosive treatments. This low and uniform roughness configuration optimizes the effective contact area and surface energy, which inherently facilitates a highly uniform layer deposition during subsequent anodization. In stark contrast, substrates processed within the dynamic resonance range exhibit high process noise and prominent chatter marks that systematically compromise the structural uniformity of the applied oxide layer. Because the porous anodic layer closely follows the microscopic substrate profile, these vibration-induced variations result in localized coating thinning at the micro-ridges, which severely weakens the physical barrier property and accelerates the initiation of localized sub-surface degradation.
Regarding the general applicability of the proposed findings, a distinction must be made between the mathematical framework and the empirical velocity boundaries.
Nevertheless, the true generalizability of this study lies in the validation of the predictive methodology itself: establishing that tracking the roughness standard deviation allows engineers to map and isolate sub-surface coating vulnerabilities, independent of where the specific stiffness-induced chatter marks occur in the velocity space. This work establishes a flexible predictive methodology that industrial engineers can readily calibrate to the modal stiffness profiles of their specific production centers.
Furthermore, a rigorous metrological distinction must be maintained when interpreting the surface texturing. The directional discrepancy observed between the longitudinal and transversal roughness profiles defines the structural anisotropy of the machined surface, which is an expected consequence of tool kinematics and feed orientation. However, within the 570–610 m/min resonance zone, this regular directional texturing is heavily disrupted by self-excited vibrations, transforming the surface into a highly non-uniform topography. This severe spatial non-uniformity, rather than natural anisotropy, represents the core physical defect that compromises the dimensional consistency and mechanical adhesion of the subsequent protective layer.
This synergistic interaction between geometric surface anomalies and microstructural orientation highlights the importance of process stabilization. The physical displacement of the applied barrier layers over dynamic chatter marks provides the initial geometric vulnerability that facilitates subsequent intergranular propagation along the elongated rolling boundaries of the Al 7136 alloy state.
To provide process engineers with an actionable and unified operational framework based on these technological findings, a comprehensive synthesis mapping the manufacturing regimes to their corresponding structural profiles, degradation risks, and engineering remediation pathways is structured in Table 9.
Table 9.
Decision guide for high-speed processing and protecting Al 7136-T76511 aerospace substrates.
5. Conclusions
The defined research objectives of this study have been successfully achieved through a robust empirical and statistical framework. The primary conclusions, key quantitative innovations, and methodological boundaries are summarized as follows:
- -
- Specific Proof-of-Concept Regression Model for Al 7136: This work presents what is, to our knowledge, the first quantitative regression framework specifically mapped to the high-speed milling (HSM) of the advanced Al 7136-T76511 aerospace alloy. The developed mathematical models achieved a high quality of fit, with basic coefficients of determination (R2) ranging between 85% and 88%, and have been validated against an independent testing dataset with a Mean Absolute Error (MAE) of 7.01% [22].
- -
- Shift in Machining Paradigm: Statistical Analysis of Variance (ANOVA) proved that under high-speed machining conditions, a complete inversion of traditional cutting physics occurs. The cutting speed (vc) functions as the absolute dominant factor, capturing an 83.89% contribution to the total longitudinal Ra variance, thereby severely surpassing the mechanical influence of feed per tooth (fz = 4.11%) and axial depth of cut (ap = 0.58%).
- -
- Delineation of the Resonance “Danger Zone”: A critical window of dynamic instability (chatter) was operationally isolated between 570 and 610 m/min. Within this specific velocity range, severe structural resonance causes a massive expansion of process noise, forcing the roughness standard deviation to spike dramatically to σ = 0.112–0.680 µm (compared to σ ≤ 0.051 µm in stable regimes) and inducing prominent directional surface anisotropy.
- -
- Topographical Prognosis of Substrate Quality and Coating Vulnerability: The developed regression models function strictly as a macro-topographical prognosis tool for substrate preparation, rather than calculating direct chemical kinetics. The study establishes that the high standard deviation (σ) and severe chatter marks generated in the unstable zone act as physical precursors to subsequent coating failure. Geometrically, a wavy and unpredictable substrate contour prevents uniform anodization, inducing localized thinning of the applied protective layer at micro-peaks and opening structural pathways for prospective localized environmental degradation.
- -
- Aerospace Industry “Safety Map”: This paper offers a direct and essential recommendation for the aerospace industry: treat the cutting speed range of 570–610 m/min as a priority avoidance zone during Al 7136-T76511 processing. When this window cannot be avoided due to cycle constraints, the implementation of dynamic damping or mandatory post-machining surface remediation is vital to suppress vibration-induced process noise (σ), thereby preventing the geometric degradation of the prospective anti-corrosive protective substrate.
A major boundary of the current research stage is the reliance on a macro-topographical predictive framework without direct sub-surface validation, combined with specific statistical and metrological constraints inherited from the foundational monograph database. To overcome these limitations and fully standardize the current empirical proof-of-concept models, immediate future research steps will focus on direct experimental validation by performing:
- -
- Integrating full residual diagnostic audits (normality, homoscedasticity, independence of errors) and formal Lack-of-Fit partitioning within the ANOVA engine to guarantee absolute model validity and capture higher-order parameter interactions.
- -
- Transitioning the metrological setup from legacy 2D tactile profiling to non-contact 3D optical topography in accordance with the modern ISO 25178-2 standard, thereby consolidating the mathematical architecture into a single direction-independent regression equation.
- -
- Conducting direct X-Ray Diffraction (XRD) analyses to map and quantify residual stress fields, alongside Scanning Electron Microscopy (SEM) and Electron Backscatter Diffraction (EBSD) on cross-sections to physically characterize intergranular micro-cracks within the Surface Stratum Deformation (SSD) layer.
- -
- Performing physical electrochemical testing (such as Electrochemical Impedance Spectroscopy—EIS, polarization curves, and ASTM B117 salt spray exposure) to establish precise corrosion kinetic rates on the chatter-affected anodized substrates.
- -
- Incorporating hammer impact testing and experimental modal analysis to precisely map the machine-tool system’s dynamic stiffness transfer functions, ensuring the model’s mathematical translatability across varied CNC manufacturing structures.
Author Contributions
Conceptualization, A.B.P. and A.M.T.; methodology, A.B.P. and A.M.T.; software, A.B.P. and C.B.; validation, A.B.P. and A.M.T.; formal analysis, A.B.P., J.J. and C.B.; investigation, A.B.P.; resources, A.B.P. and C.B.; data curation, A.B.P. and A.M.T.; writing—original draft preparation, A.B.P.; writing—review and editing, A.B.P., J.J. and C.B.; visualization, A.B.P., J.J., C.B. and A.M.T.; supervision, A.B.P. and A.M.T.; project administration, A.B.P. and C.B.; funding acquisition, C.B. All authors have read and agreed to the published version of the manuscript.
Funding
This research was supported by the “Academic Technology Education Across Borders”—ATEd ROUA00183 project, funded under the Interreg VI-A NEXT Programme Romania–Ukraine 2021–2027 (ROUA).
Institutional Review Board Statement
Not applicable.
Informed Consent Statement
Not applicable.
Data Availability Statement
The complete raw experimental datasets, initial roughness measurements, and foundational statistical analyses scripts supporting the findings of this study are permanently archived, fully traceable, and publicly available as part of an Open Access research monograph published via U.T.PRESS Cluj-Napoca (ISBN: 978-606-737-781-1). The full repository and comprehensive data structure can be directly accessed through the Technical University of Cluj-Napoca digital library repository at: https://biblioteca.utcluj.ro/files/carti-online-cu-coperta/781-1.pdf (accessed on 20 May 2026) [22].
Conflicts of Interest
The authors declare no conflicts of interest.
Abbreviations
The following abbreviations are used in this manuscript:
| Al 7136 | High-strength aluminum alloy (7xxx series) |
| T76511 | Specific heat treatment (solutioning + controlled over-aging) |
| ANOVA | Analysis of Variance |
| ap | Depth of cut |
| vc | Cutting speed |
| fz | Feed per tooth |
| BUE | Built-Up Edge |
| CNC | Computer Numerical Control |
| EFC | Exfoliation Corrosion |
| HSM | High-Speed Milling |
| IGC | Intergranular Corrosion |
| R2 | Coefficient of determination |
| Ra | Arithmetic mean roughness of the profile |
| SCC | Stress Corrosion Cracking |
| SSD | Surface Stratum Deformation |
| σ | Standard deviation (stability indicator) |
References
- Singh, J.; Srivastawa, K.; Jana, S.; Dixit, C. Advancements in lightweight materials for aerospace structures: A comprehensive review. Acceleron Aerosp. J. 2024, 2, 173–183. [Google Scholar] [CrossRef] [Scilit]
- Blanco, D.; Rubio, E.M.; Lorente-Pedreille, R.M.; Saenz-Nuno, M.A. Sustainable processes in aluminium, magnesium, and titanium alloys applied to the transport sector: A review. Metals 2021, 12, 9. [Google Scholar] [CrossRef] [Scilit]
- Prošek, T.; Keil, P.; Popova, K. Corrosion Protection and Sustainability: Why Are the Two Concepts Inherently Intertwined. Corros. Mater. Degrad. 2025, 6, 38. [Google Scholar] [CrossRef] [Scilit]
- Zehra, S.; Mobin, M.; Aslam, J. An overview of the corrosion chemistry. In Environmentally Sustainable Corrosion Inhibitors; Elsevier: Amsterdam, The Netherlands, 2022; pp. 3–23. [Google Scholar] [CrossRef] [Scilit]
- Zhou, B.; Liu, B.; Zhang, S. The advancement of 7xxx series aluminum alloys for aircraft structures: A review. Metals 2021, 11, 718. [Google Scholar] [CrossRef] [Scilit]
- Aglawe, K.; Giri, S.; Dhande, M.; Shelare, S. Application of aluminum alloys in aviation industry: A review. In AIP Conference Proceedings; AIP Publishing LLC: Melville, NY, USA, 2023; Volume 2800, p. 020064. [Google Scholar] [CrossRef] [Scilit]
- Li, Y.; Yu, M.; Li, X.; Wen, K.; Yan, L.; Zhu, K.; Xiao, W. Enhancing stress corrosion cracking resistance of low Cu-containing Al-Zn-Mg-Cu alloys by aging treatment control. Materials 2024, 17, 5678. [Google Scholar] [CrossRef] [Scilit] [PubMed]
- Pimenov, D.Y.; Kiran, M.; Khanna, N.; Pintaude, G.; Vasco, M.C.; da Silva, L.R.R.; Giasin, K. Review of improvement of machinability and surface integrity in machining on aluminum alloys. Int. J. Adv. Manuf. Technol. 2023, 129, 4743–4779. [Google Scholar] [CrossRef] [Scilit]
- Jiang, H.; Ren, Z.; Yi, Y.; He, L.; Yuan, S. Effect of machining on performance enhancement of superficial layer of high-strength alloy steel. J. Mater. Res. Technol. 2021, 14, 1065–1079. [Google Scholar] [CrossRef] [Scilit]
- Sun, X.Y.; Zhang, B.; Lin, H.Q.; Zhou, Y.T.; Sun, L.; Wang, J.Q.; Han, E.H.; Ke, W. Correlations between stress corrosion cracking susceptibility and grain boundary microstructures for an Al–Zn–Mg alloy. Corros. Sci. 2013, 77, 103–112. [Google Scholar] [CrossRef] [Scilit]
- Xue, W.; Wang, Y.; Xia, J.; Zhang, Z.; Huang, K.; Lu, S.; Wu, J. Initial localized corrosion induced by multiscale precipitates in the new generation high-strength Al-Zn-Mg-Cu alloy. Corros. Sci. 2023, 224, 111516. [Google Scholar] [CrossRef] [Scilit]
- Araujo, J.V.D.S.; Milagre, M.; Costa, I. A historical, statistical, and electrochemical approach on the effect of microstructure in the anodizing of Al alloys: A review. Crit. Rev. Solid State Mater. Sci. 2024, 49, 521–581. [Google Scholar] [CrossRef] [Scilit]
- Miramontes, J.C.; Gaona Tiburcio, C.; García Mata, E.; Esneider Alcála, M.Á.; Maldonado-Bandala, E.; Lara-Banda, M.; Nieves-Mendoza, D.; Olguín-Coca, J.; Zambrano-Robledo, P.; López-León, L.D.; et al. Corrosion resistance of aluminum alloy AA2024 with hard anodizing in sulfuric acid-free solution. Materials 2022, 15, 6401. [Google Scholar] [CrossRef] [Scilit] [PubMed]
- Karakoç, E.; Çakır, O. Examination of surface roughness values of 6061-T6 aluminum material after machining and after anodizing process. Mater. Today Proc. 2023, 80, 32–39. [Google Scholar] [CrossRef] [Scilit]
- Sivateja, C.; KV, N.C.; Bojja, R.; CM, M. Effect of chemical milling and anodizing on the high cycle fatigue behaviour of 2024-T3 aluminium alloy. Procedia Struct. Integr. 2024, 60, 245–255. [Google Scholar] [CrossRef] [Scilit]
- Dong, L.; Li, Y.; Huang, M.; Hu, X.; Qu, Z.; Lu, Y. Effect of anodizing surface morphology on the adhesion performance of 6061 aluminum alloy. Int. J. Adhes. Adhes. 2022, 113, 103065. [Google Scholar] [CrossRef] [Scilit]
- Chua, A.; Evangelista, D. Automated Predictive Maintenance System of Lathe Machine Cutting Tool Through Combined Vibration and Sound Pressure Sensors with PLC. In 2024 4th International Conference on Robotics, Automation and Artificial Intelligence (RAAI); IEEE: Piscataway NJ, USA, 2024; pp. 134–143. [Google Scholar] [CrossRef] [Scilit]
- Viktor, L.; Ilia, T.; Ilia, D. Research on influence of tool deformation in the direction of cutting and feeding on the stabilization of vibration activity during metal processing using metal-cutting machines. Sensors 2023, 23, 7482. [Google Scholar] [CrossRef] [Scilit] [PubMed]
- Jia, H.; Xiong, W.; Wang, A.; Wu, L. Effects of Milling Parameters on Residual Stress and Cutting Force. Materials 2025, 18, 3836. [Google Scholar] [CrossRef] [Scilit] [PubMed]
- Pang, S.; Zhao, W.; Qiu, T.; Liu, W.; Yan, P.; Jiao, L.; Wang, X. Effect of cutting fluid on milled surface quality and tool life of aluminum alloy. Materials 2023, 16, 2198. [Google Scholar] [CrossRef] [Scilit] [PubMed]
- Chen, H.; Liu, Z.; Wang, X.; Wang, Y.; Liu, S. Effect of surface integrity on fatigue life of 2024 aluminum alloy subjected to turning. J. Manuf. Process. 2022, 83, 650–666. [Google Scholar] [CrossRef] [Scilit]
- Juri, A.Z.; Belli, R.; Lohbauer, U.; Ebendorff-Heidepriem, H.; Yin, L. Edge chipping damage in lithium silicate glass-ceramics induced by conventional and ultrasonic vibration-assisted diamond machining. Dent. Mater. 2023, 39, 557–567. [Google Scholar] [CrossRef] [Scilit] [PubMed]
- Pop, A.B. Machining Aluminum Alloys by Milling; U.T. PRESS: Cluj, Romania, 2025; ISBN 978-606-737-781-1. Available online: https://biblioteca.utcluj.ro/files/carti-online-cu-coperta/781-1.pdf (accessed on 20 May 2026).
- Ullah, A.; Chan, T.C.; Chang, S.L. Current trends in vibration control and computational optimization for CNC machine tools: A comprehensive review. Int. J. Adv. Manuf. Technol. 2025, 139, 5409–5444. [Google Scholar] [CrossRef] [Scilit]
- Paz Martínez-Viademonte, M.; Abrahami, S.T.; Hack, T.; Burchardt, M.; Terryn, H. A review on anodizing of aerospace aluminum alloys for corrosion protection. Coatings 2020, 10, 1106. [Google Scholar] [CrossRef] [Scilit]
- Thavasilingam, K.; Sakthimurugan, D.; Giridharan, K. Aluminum alloys for aircraft structures. In Aerospace Materials; Elsevier: Amsterdam, The Netherlands, 2025; pp. 385–404. [Google Scholar] [CrossRef] [Scilit]
- Knight, S.P. Stress Corrosion Cracking of Al-Zn-Mg-Cu Alloys: Effects of Heat-Treatment, Environment, and Alloy Composition. Doctoral Dissertation, Monash University, Melbourne, Australia, 2008. [Google Scholar] [CrossRef]
- He, B.; Wu, X.; Cao, L.; Tang, S.; Yang, Y.; Zou, Y. Revealing the mechanisms of exfoliation corrosion and stress corrosion cracking for an Al-Zn-Mg-Cu alloy after continuous retrogression and re-ageing treatment. Corros. Sci. 2024, 240, 112474. [Google Scholar] [CrossRef] [Scilit]
- Ruiz-Garcia, A.; Esquivel-Peña, V.; Godínez, F.A.; Montoya, R. Corrosion modeling of aluminum alloys: A brief review. ChemElectroChem 2024, 11, e202300712. [Google Scholar] [CrossRef] [Scilit]
- Xiong, Y.; Wang, W.; Shi, Y.; Jiang, R.; Shan, C.; Liu, X.; Lin, K. Investigation on surface roughness, residual stress, and fatigue property of milling in-situ TiB2/7050Al metal matrix composites. Chin. J. Aeronaut. 2021, 34, 451–464. [Google Scholar] [CrossRef] [Scilit]
- Zhang, X.F.; Li, X.D.; Wang, N.; Liu, Y.J.; Tian, F.; Wang, C.X. Robust superhydrophobic SiO2/epoxy composite coating prepared by one-step spraying method for corrosion protection of aluminum alloy: Experimental and theoretical studies. Mater. Des. 2023, 228, 111833. [Google Scholar] [CrossRef] [Scilit]
- Jing, L.; Niu, Q.; Zhan, D.; Li, S.; Yue, W. Predictive modeling of surface roughness and feed force in Al-50wt% Si alloy milling based on response surface method and various optimal algorithms. Arab. J. Sci. Eng. 2023, 48, 3209–3225. [Google Scholar] [CrossRef] [Scilit]
- Park, J.; Son, K.; Lee, J.; Kim, D.; Chung, W. Effects of Anodizing conditions on thermal properties of Al 20XX alloys for aircraft. Symmetry 2021, 13, 433. [Google Scholar] [CrossRef] [Scilit]
- Xu, Y.; Yue, C.; Chen, Z.; Li, M.; Wang, L.; Liu, X. Finite element simulation of residual stress in milling of aluminum alloy with different passes. Int. J. Adv. Manuf. Technol. 2023, 127, 4199–4210. [Google Scholar] [CrossRef] [Scilit]
- Yi, S.; Wu, Y.; Gong, H.; Peng, C.; He, Y. Experimental analysis and prediction model of milling-induced residual stress of aeronautical aluminum alloys. Appl. Sci. 2021, 11, 5881. [Google Scholar] [CrossRef] [Scilit]
- ISO 25178-2:2021; Geometrical Product Specifications (GPS)—Surface Texture: Areal—Part 2: Terms, Definitions and Surface Texture Parameters. International Organization for Standardization (ISO): Geneva, Switzerland, 2021.

Disclaimer/Publisher’s Note: The statements, opinions and data contained in all publications are solely those of the individual author(s) and contributor(s) and not of MDPI and/or the editor(s). MDPI and/or the editor(s) disclaim responsibility for any injury to people or property resulting from any ideas, methods, instructions or products referred to in the content. |
© 2026 by the authors. Licensee MDPI, Basel, Switzerland. This article is an open access article distributed under the terms and conditions of the Creative Commons Attribution (CC BY) license.