


Highlights
What are the main findings?
- DIC reveals severe necking strain concentration: local max 35.9% vs. avg 22.5%.
- Tensile anisotropy: 90° highest strength (860 MPa), 0° best ductility, 45° poorest ductility.
- 45° direction shows the largest transverse contraction and the highest plastic instability susceptibility.
What are the implications of the main findings?
- Full-field DIC data enables precise calibration of anisotropic constitutive models.
- Forming processes should avoid a 45° loading direction to reduce necking failure risk.
- Design load directions: 0° for ductility, 90° for strength-critical applications.
Abstract
Q420 high-strength steel exhibits pronounced anisotropy due to its rolling process, and conventional uniaxial tensile testing is incapable of acquiring strain field evolution information during the local necking stage. In this study, quasi-static uniaxial tensile tests were conducted on Q420 cold-rolled high-strength steel sheets at six orientations (0°, 15°, 30°, 45°, 60°, and 90°) using Digital Image Correlation (DIC) technology. The evolution of the strain field and the corresponding stress–strain responses at different orientations were systematically investigated. The results show that the DIC technique effectively captured the full-field strain evolution of the specimens from uniform deformation to local necking and final fracture in all directions. Taking the 0° direction as an example, the local maximum engineering strain prior to fracture reached 35.866%, whereas the average fracture strain within the gauge section was only approximately 22.5%, corresponding to a ratio of approximately 1.6 and clearly demonstrating the severe strain concentration within the necking zone. The stress–strain curves corresponding to different rolling directions exhibited pronounced anisotropy. The tensile strength was highest in the 90° direction and lowest in the 0° direction; however, the 0° direction exhibited the best ductility, whereas the 45° direction showed the poorest ductility. Among the six orientations, the midpoint transverse engineering strain exhibited the largest absolute value in the 45° direction, further indicating that this orientation is the most susceptible to plastic instability. In this work, DIC-based full-field measurement was combined with multi-directional tensile testing to quantitatively characterize the relationship between local strain concentration and anisotropy. The findings provide high-precision experimental data for the calibration of anisotropic constitutive models and the optimization of forming processes.
1. Introduction
Q420 steel, a typical low-alloy high-strength structural steel, is widely used in transmission towers, bridge structures, and offshore engineering equipment. As engineering structures continue to develop toward lightweight design and higher safety margins, increasing attention has been paid to the deformation and failure behaviors of materials under complex loading conditions. Previous studies have shown that the mechanical properties of such steels vary significantly under welding thermal cycles, elevated-temperature environments, and different loading rates [1,2,3], indicating that mechanical parameters obtained under a single condition cannot fully reflect the in-service performance of the material.
In recent years, studies on the mechanical properties of high-strength steels have mainly focused on anisotropy and processing effects. Alhalaybeh et al. [4] investigated the anisotropic hardening behavior of HC420 steel sheets and found that the evolution of grain structure plays a crucial role in governing the anisotropic mechanical response. These results indicate that the microstructural anisotropy induced by rolling dominates the deformation behavior of cold-rolled high-strength steels, and that the material exhibits pronounced differences under different loading directions. Pokropek et al. [5] further reported that the rolling direction exerts a pronounced effect on the strength and ductility of steel sheets. In addition, Pereira et al. [6] employed Digital Image Correlation (DIC) to experimentally calibrate a damage model for advanced high-strength steels.
Conventional uniaxial tensile tests generally rely on extensometers to obtain the average strain over the gauge length. However, this approach cannot accurately measure deformation after the onset of local necking, thereby limiting the accurate characterization of the complete plastic deformation process. Particularly for high-strength steels, which are sensitive to strain localization, the lack of local deformation information directly affects the understanding of damage evolution mechanisms [7]. Digital Image Correlation (DIC) provides an effective approach to overcoming this limitation. By tracking the displacement variation in random speckle patterns on the specimen surface, DIC enables non-contact full-field strain measurement and continuously records the deformation process from uniform deformation to localization and eventual fracture. Related studies have also demonstrated that DIC exhibits good adaptability in complex structural testing and multi-scale measurements [8], and its applications have also been extended to residual stress analysis and multiphysics coupling problems [9].
With the development of image processing algorithms and computational capability, DIC technology is evolving from a measurement tool into a parameter-identification tool. For example, by combining DIC with finite element model updating methods, inverse identification of material constitutive parameters can be achieved [10]. Meanwhile, material property evaluation methods based on full-field data have also been gradually established [11]. In addition, the application of DIC in crack propagation and fracture behavior analysis has continued to expand [12]. Although the tensile behavior of Q420 steel under various service conditions has been studied, most investigations still rely on strain-gauge measurements, which provide only average strain information. The evolution of local strain localization and post-necking deformation along different rolling directions has not yet been fully characterized. Digital Image Correlation (DIC) enables full-field strain measurement, capturing both strain localization and necking evolution, and is therefore particularly suitable for addressing this gap in the characterization of anisotropic deformation in cold-rolled Q420 steel [13].
Over the course of its development, Digital Image Correlation has become an important technique in the field of experimental mechanics. Extensive studies have been conducted on its measurement principles and applications. Romanowicz et al. [14] experimentally verified the reliability of DIC in strain measurement of complex structures. Nasajpour-Esfahani et al. [15] summarized recent advances in the application of DIC to residual stress measurement, Mousa et al. [16] systematically reviewed the technique from the perspective of engineering structural testing, and Janeliukstis et al. [17] focused on its application in composite materials. These studies demonstrate that DIC can continuously capture the full-field strain evolution, resolve post-yield strain gradients, and quantitatively track deformation localization. These capabilities are particularly important for characterizing orientation-dependent deformation behavior during the anisotropic failure of rolled steel plates, as local strain concentration is a key factor contributing to such failure [18]. In practical applications, DIC has gradually evolved from an auxiliary tool into a core analytical method. For example, Agha [19] employed this technique to investigate fracture behavior and forming limit problems during sheet metal tensile deformation. Fayad et al. [10] combined DIC data with finite element model updating methods to achieve high-accuracy identification of material parameters, while Kim et al. [20] proposed a DIC-based evaluation method for the mechanical properties of sheet metals.
Although substantial progress has been made, several limitations still remain. On the one hand, conventional tensile tests are unable to characterize the local strain distribution and its evolution process. On the other hand, many studies on the anisotropy of rolled steel sheets rely primarily on stress–strain curves, r-values, and forming limit parameters, whereas the evolution of local strain fields during deformation is rarely measured directly. Consequently, the mechanisms governing strain localization and orientation-dependent failure remain incompletely understood. Digital image correlation (DIC) offers an effective full-field measurement technique that can overcome this limitation [13]. Nevertheless, systematic investigations supported by comprehensive full-field strain data remain limited. In contrast, tensile tests combined with DIC technology can acquire rich strain information within a single experiment, thereby providing more direct experimental evidence for anisotropy research [21].
Although digital image correlation (DIC) has been widely employed in tensile investigations of metallic materials, previous studies on Q420 high-strength steel have primarily focused on conventional tensile properties such as yield strength, ultimate tensile strength, and elongation. The influence of loading orientation on the evolution of full-field strain localization has rarely been reported. Moreover, most existing studies evaluate anisotropy mainly through macroscopic mechanical parameters, leaving the relationship between loading direction and local strain evolution poorly understood. In this study, DIC in conjunction with uniaxial tensile testing was therefore used to systematically investigate the strain localization behavior and anisotropic deformation characteristics of cold-rolled Q420 steel sheets under six loading orientations (0°, 15°, 30°, 45°, 60°, and 90°). The resulting full-field strain data offer deeper insights into anisotropic deformation mechanisms than those obtainable through conventional strain-gauge measurements.
2. Materials and Methods
This study systematically investigates the anisotropic tensile and fracture behavior of high-strength steel along different rolling directions. Digital Image Correlation (DIC), a non-contact full-field optical measurement technique, was employed to obtain accurate deformation field data that are not readily accessible using conventional methods.
2.1. Experimental Material and Specimen Preparation
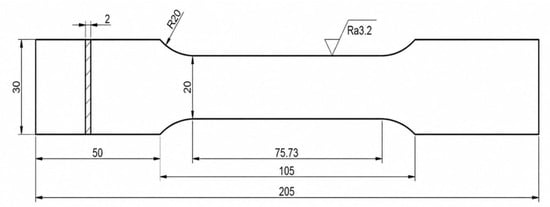
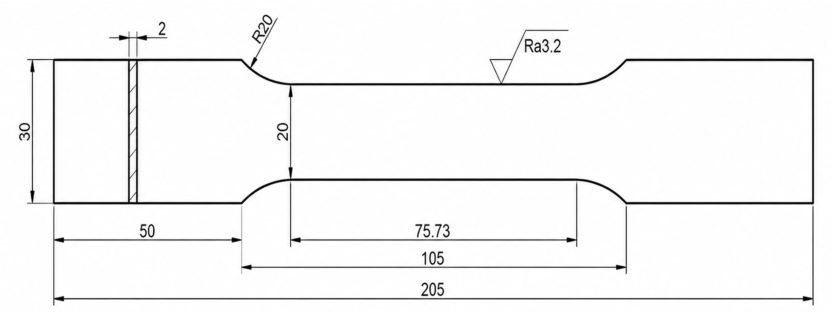
The experimental material consisted of Q420 cold-rolled high-strength steel sheets. The specimen geometry is shown in Figure 1. The specimens were prepared in accordance with GB/T 228.1-2010 [22], with a gauge length of 71 mm, a gauge width of 20 mm, a grip width of 20 mm, a filet radius of 20 mm, and a thickness of 2 mm. To investigate the plastic anisotropy of the sheet metal, flat tensile specimens were cut at six orientations relative to the rolling direction, namely 0°, 15°, 30°, 45°, 60°, and 90°. The specimen geometry strictly followed the standard to ensure uniform stress distribution within the gauge section. After machining, the specimen surfaces were carefully treated to prepare for DIC measurement. Three specimens were tested for each orientation.
Figure 1.
Schematic diagram of tensile specimen dimensions.
The DIC system mainly consisted of a high-resolution CCD camera system, a uniform and stable illumination system, and a computer for data acquisition and processing. Prior to testing, a high-quality speckle pattern was prepared on the surface of the gauge section. The speckle pattern was required to exhibit high contrast and random distribution without affecting the intrinsic properties of the material. Black-and-white matte spray paint was used to generate the speckle pattern. A white primer layer was first applied as the background, followed by randomly distributed black speckles on the surface.
2.2. Tensile Testing and Data Acquisition
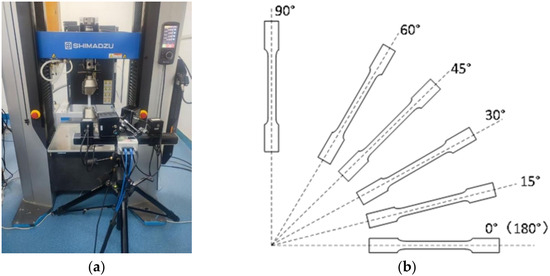
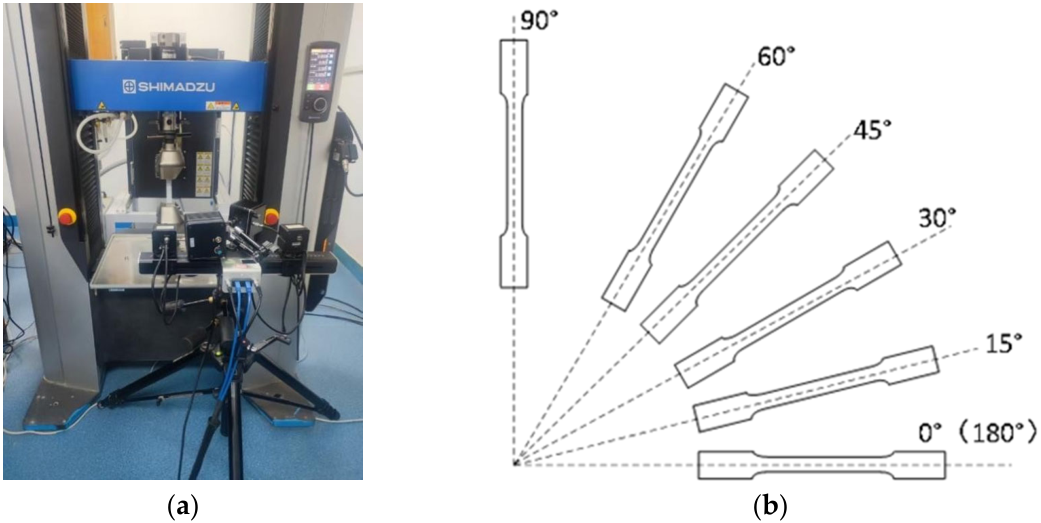
The prepared speckle-coated dumbbell specimens were subjected to quasi-static uniaxial tensile tests using an electronic universal testing machine at a tensile rate of 2 mm/min. Simultaneously, the DIC system was activated. The system employed a high-precision camera (model XTDIC-CONST-5M (XTOP 3D Technology Co., Ltd., Shenzhen, China)) with a resolution of 2448 × 2048 pixels and a lens with a focal length of 25 mm. A 20 mm × 75 mm calibration grid was used for stereoscopic calibration, yielding a root-mean-square (RMS) reprojection error below 0.03 pixels. A sensitivity analysis was performed to determine the optimal subset size; a size of 35 pixels was selected to balance measurement noise and spatial resolution, giving a strain resolution of approximately 0.02%. The measurement uncertainty was evaluated using an unloaded reference specimen, resulting in an uncertainty of ±0.1% strain. During the tensile process, speckle images on the specimen surface were continuously captured at a fixed acquisition rate of 1 frame/s until the specimen fractured completely. Meanwhile, the testing machine automatically recorded the load–displacement data. The acquired image sequences were processed by the DIC software (XTDIC_Ver9.7.2_x64_pro_202407) using correlation analysis. In the analysis software, the region of interest within the specimen gauge section was selected, with a subset size of 25 × 25 pixels and a step size of 25 × 25 pixels. Gaussian smoothing was applied during strain field calculation to reduce noise. Consequently, the full-field displacement and strain distributions of the specimen during the deformation process, particularly within the gauge section, were reconstructed. Figure 2a shows the experimental setup of the tensile testing machine and the Digital Image Correlation (DIC) system. Figure 2b depicts the strain evolution of the specimen during the uniaxial tensile test.
Figure 2.
(a) Experimental setup of the tensile testing machine and Digital Image Correlation (DIC) system; (b) strain evolution of the specimen during the uniaxial tensile test.
3. Uniaxial Tensile Analysis of High-Strength Steel
3.1. Strain Evolution During Uniaxial Tension
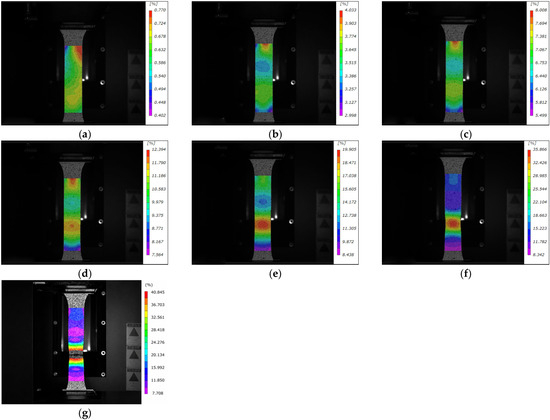
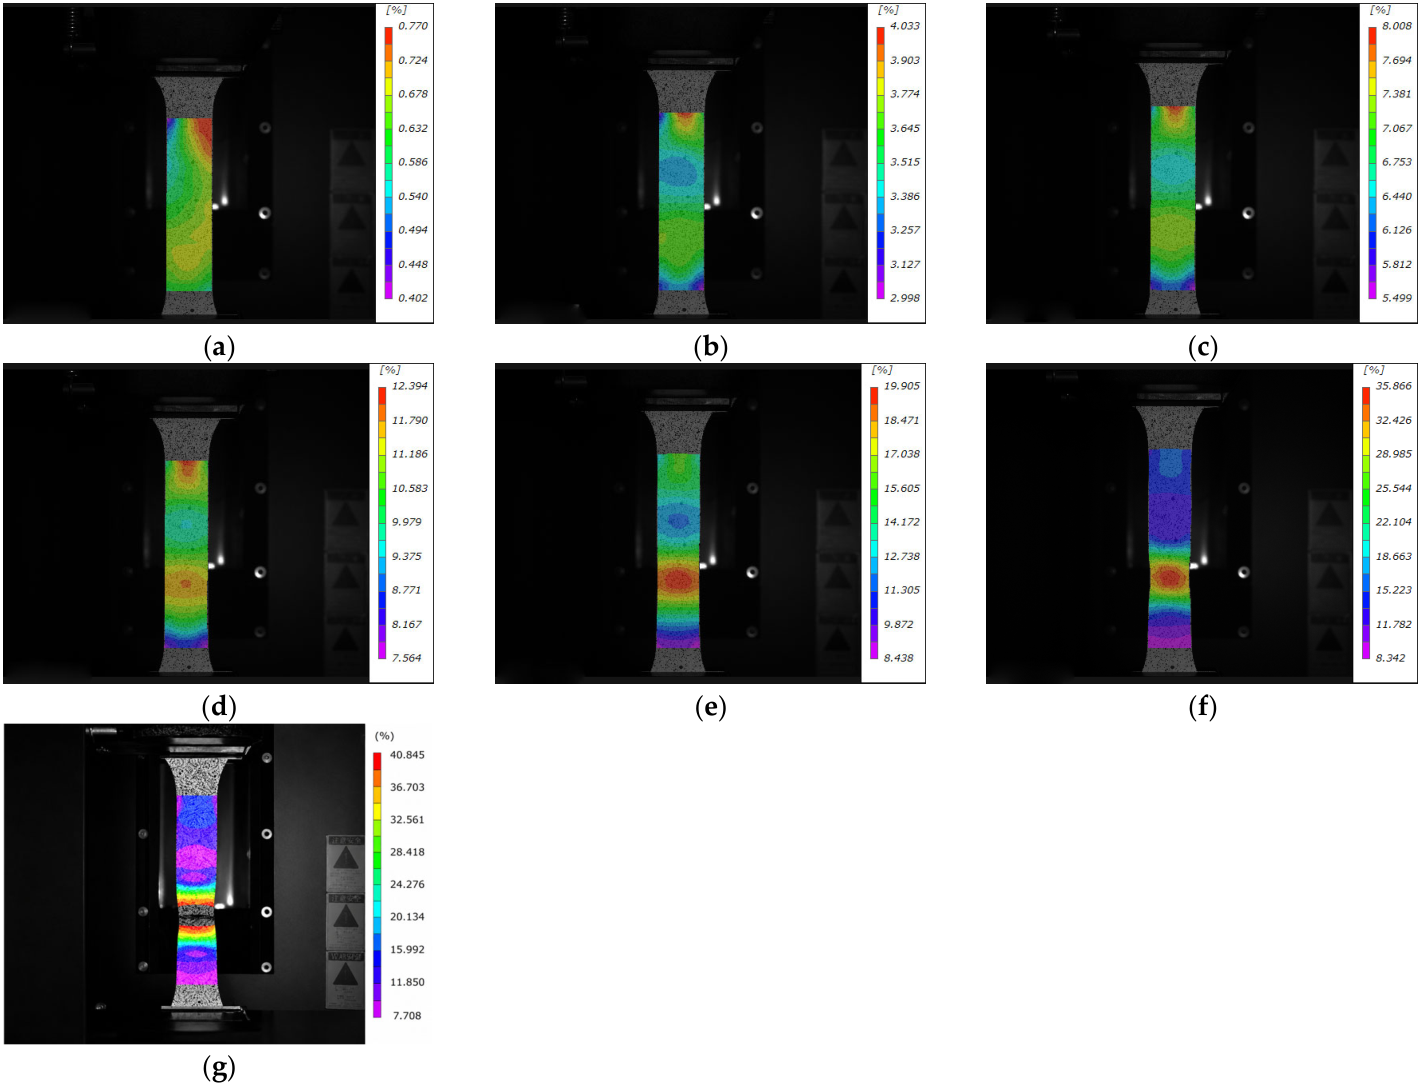
When the dumbbell specimen was aligned with the rolling direction (0°), as shown in Figure 3, the process from initial loading to final fracture lasted 341 s. At the early stage of tensile loading (60 s), the strain distribution within the gauge section was relatively uniform, ranging from 0.402% to 0.770%, which is characteristic of the elastic stage. As the loading time increased to 120 s and 180 s, the strain values increased, and the strain range gradually widened to 2.998%–4.033% and 5.499%–8.008%, respectively. At this stage, the specimen underwent uniform plastic deformation, and the strain field remained relatively uniform without significant strain localization.
Figure 3.
Strain evolution during the uniaxial tensile test: (a) 60 s; (b) 120 s; (c) 180 s; (d) 240 s; (e) 300 s; (f) 341 s; (g) 342 s.
When the loading time reached 240 s, the strain range broadened markedly to 7.564%–12.394%, indicating the onset of strain localization. At 300 s, the strain range expanded sharply to 8.438%–19.905%, suggesting that plastic deformation became concentrated in localized regions and that necking had begun to develop. Immediately before fracture at 341 s, the strain distribution exhibited strong non-uniformity. The maximum local strain reached 35.866%, whereas the minimum strain was only 8.342%, with the former being nearly 4.3 times greater than the latter. This clearly reflects the rapid concentration and accumulation of strain within the necking region. Based on the fracture image captured at 342 s, the fracture morphology indicated that the strain concentration region was confined to a localized area of the specimen, and the fracture exhibited typical ductile overload characteristics. The fracture surface consists of a central fibrous zone and peripheral shear lips. Pronounced necking prior to final fracture indicates substantial plastic deformation before failure. The rough and uneven morphology suggests that fracture was governed primarily by the nucleation, growth, and coalescence of microvoids—a mechanism widely recognized as typical of ductile fracture in high-strength structural steels under quasi-static tensile loading [23]. The central fibrous zone corresponds to stable microvoid growth and coalescence, whereas the shear lips near the specimen edges are associated with localized shear deformation during the final stage of fracture. No macroscopically flat cleavage surfaces or other features indicative of brittle fracture were observed. Thus, the fracture morphology indicates that failure occurred predominantly through a ductile overload mechanism following extensive plastic deformation. This finding is consistent with the typical ductile fracture behavior reported for high-strength steels, in which fracture proceeds via microvoid nucleation, growth, and coalescence, accompanied by pronounced necking and the formation of fibrous zones and shear lips [24].
Based on the strain evolution process, the plastic deformation behavior of Q420 steel under tension along the rolling direction can be divided into four typical stages: uniform plastic flow, initiation of strain localization, necking development, and final fracture. The non-uniform evolution of the strain field indicates that the damage evolution and fracture of the material were not abrupt, but rather resulted from a prolonged process of local strain concentration.
It should be noted that the local maximum engineering strain measured by DIC prior to fracture in Figure 3f (35.866%) was significantly higher than the corresponding average fracture strain within the gauge section shown in Figure 4 (approximately 22.5%). This difference arises because deformation during the necking stage becomes highly concentrated within a localized region, resulting in local strains far exceeding the average value. This result highlights the capability of DIC full-field measurements in capturing localized deformation behavior.
Figure 4.
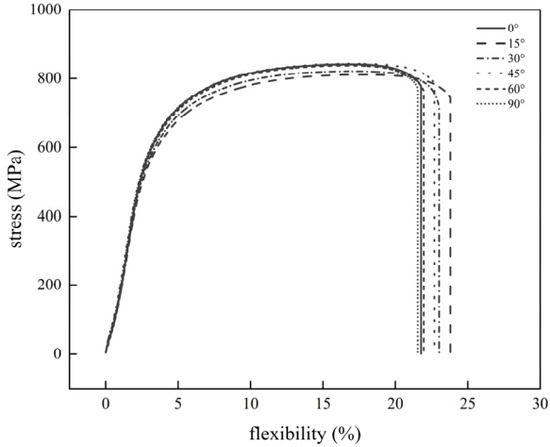
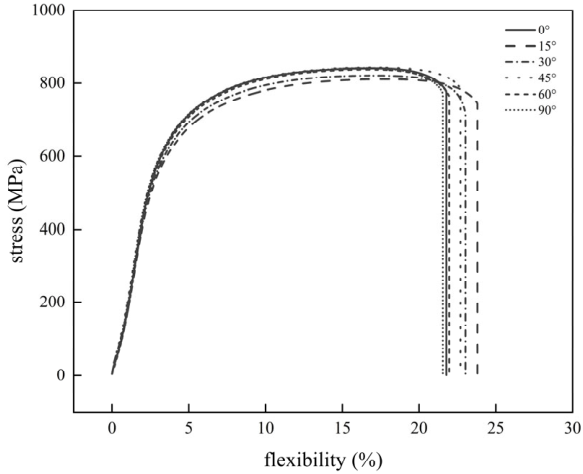
Engineering stress–strain curves of Q420 high-strength steel along different rolling directions (0°, 15°, 30°, 45°, 60°, and 90°).
3.2. Analysis of Anisotropic Stress–Strain Curves of High-Strength Steel
Figure 4 presents the engineering stress–strain curves of Q420 high-strength steel along six rolling directions (0°, 15°, 30°, 45°, 60°, and 90°). The deformation behavior can be divided into four stages: elastic deformation, uniform plastic flow, necking initiation, and necking development, followed by fracture.
During the elastic stage, stress and strain exhibited a linear relationship. At strains below 2%, the curves in all directions nearly overlapped, indicating that the elastic modulus and yield strength showed little dependence on rolling direction.
During the uniform plastic flow stage, corresponding to strains of approximately 2%–15%, the stress increased continuously with strain, whereas the strain hardening rate gradually decreased. Over this strain range, the stress in all directions increased monotonically.
At strains of approximately 15%, the engineering stress reached its maximum value, indicating the onset of plastic instability. The tensile strengths in different directions were 810 MPa for 0°, 820 MPa for 15°, 830 MPa for 30°, 840 MPa for 45°, 850 MPa for 60°, and 860 MPa for 90°. The necking initiation strain remained nearly identical among all directions (approximately 15.0%), indicating that the onset of necking was weakly dependent on loading orientation.
When the strain exceeded 15%, the material entered the necking and fracture stage, during which the stress gradually decreased and deformation became concentrated within the necking region. At a strain of 20.0%, the stress in all directions had already decreased significantly below the peak value. Specifically, the stress in the 0° direction decreased to 790 MPa, whereas that in the 90° direction decreased to 840 MPa. Upon further loading to approximately 22.5% strain, the specimens in the 15–90° directions fractured, whereas the 0° specimen retained load-bearing capability up to a higher strain level.
To characterize the statistical features of the tensile data, the results of repeated tests for each loading orientation are summarized in Table 1 and Table 2. Table 1 lists the mean engineering strain, the corresponding standard deviation, the 95% confidence interval, and error bars (mean ± standard deviation) for each orientation. Table 2 provides a statistical summary of the measured engineering stress values. The standard deviation of the engineering strain measurements was generally below 1.0%, whereas that of the engineering stress measurements was mostly below 25 MPa. These relatively small deviations indicate good experimental repeatability and measurement consistency. Therefore, the orientation-dependent differences observed in the stress–strain responses can be attributed primarily to the intrinsic anisotropy induced by the rolling process rather than to random experimental variability. The reported standard deviations and 95% confidence intervals further offer a quantitative assessment of the precision and reliability of the measured mean values.
Table 1.
Statistical summary of average engineering strain for different orientations.
Table 2.
Statistical summary of average engineering stress for different orientations.
Overall, although the 90° direction exhibited the highest tensile strength (860 MPa) and the 0° direction the lowest (810 MPa), the 0° direction showed the best ductility (average fracture strain >22.5%), whereas the 45° direction exhibited the lowest average fracture strain (approximately 20%), indicating the poorest ductility. These results demonstrate that strength and ductility exhibit complex anisotropic behavior rather than a simple positive correlation. In engineering applications, critical structures should avoid operating under strain levels exceeding 15% to reduce the risk of necking failure. In addition, when ductility is prioritized, the 0° direction is preferable as the principal load-bearing direction, whereas the 90° direction is more suitable when strength is the primary consideration.
3.3. Strain Evolution During Tension Along the 0° Direction
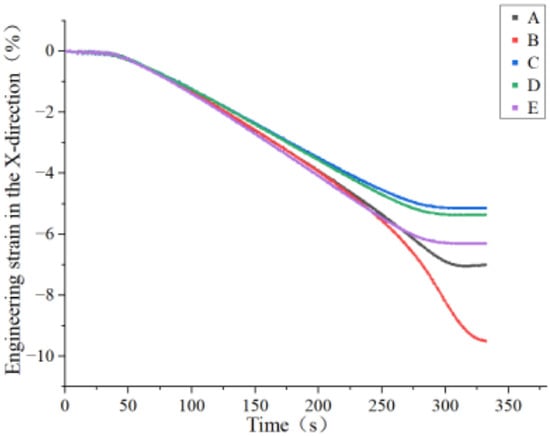
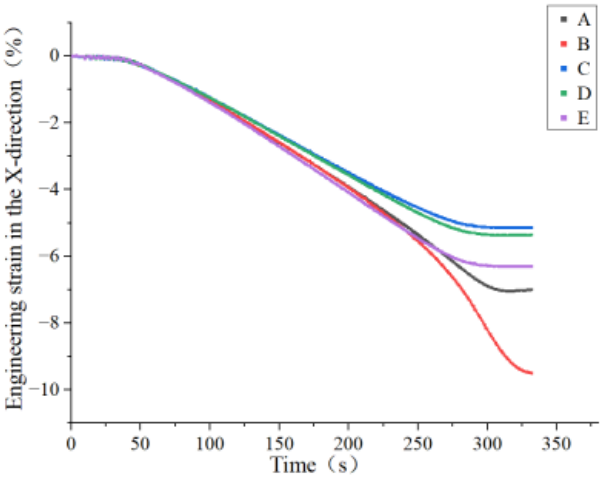
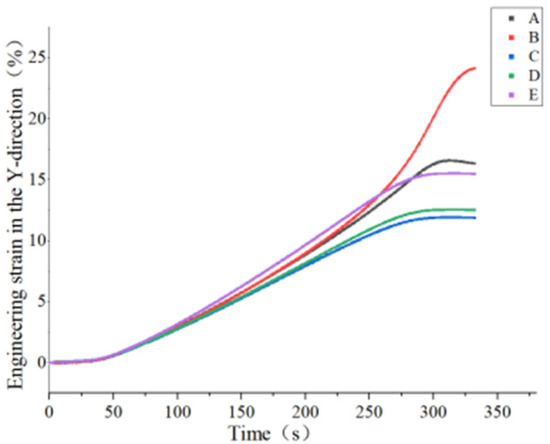
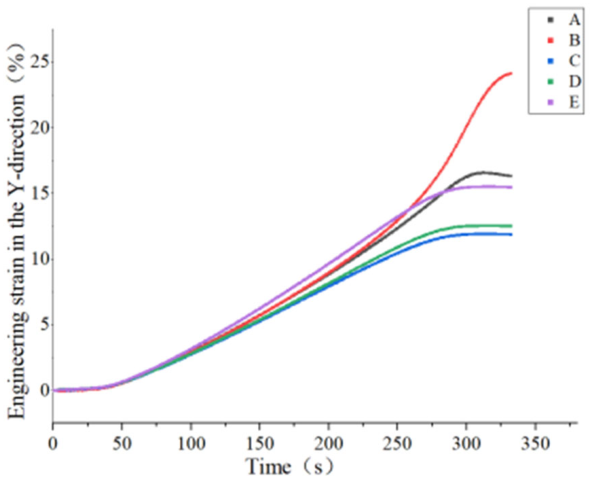
Figure 5 shows the locations of five selected points on the specimen surface during tensile loading along the 0° direction, including the center point C, two symmetric points B and D, and two edge points A and E. The selected points were uniformly distributed with a spacing of 18 mm between adjacent points. Using the Digital Image Correlation (DIC) method, the engineering strain curves of these points in the X direction (loading direction) and Y direction (transverse direction) were obtained during tensile deformation, as shown in Figure 6 and Figure 7.
Figure 5.
Schematic diagram of characteristic points on the specimen during tensile loading along the 0° direction.
Figure 6.
Variation in engineering strain in the X direction with time at five characteristic points during tensile loading along the 0° direction.
Figure 7.
Variation in engineering strain in the Y direction with time at five characteristic points during tensile loading along the 0° direction.
As shown in Figure 6, the engineering strain in the X direction at all five points increased monotonically with loading time during tensile deformation along the 0° direction, exhibiting a typical three-stage response consisting of elastic deformation, uniform plastic deformation, and local necking. During the initial elastic stage, the strain increase rates at different points were similar, indicating relatively uniform deformation at the early stage of loading. After entering the plastic stage, strain differences among different locations gradually became apparent. The center point (Point C) exhibited the fastest strain increase and the highest fracture strain, whereas the edge points (Points A and E) showed relatively slower strain increases, indicating pronounced strain non-uniformity. This phenomenon may be related to specimen geometry and boundary constraints, which caused more concentrated plastic flow in the central region.
Figure 7 presents the evolution of engineering strain in the Y direction with time. Overall, the strain in the Y direction remained negative, and its absolute value increased continuously with loading time. Compared with the X direction, the strain differences among the five points were more pronounced in the Y direction. During the necking stage, particularly within the central region, the transverse contraction rate increased markedly, indicating the development of local plastic instability. In contrast, the transverse strain variation at the edge points remained relatively moderate, indicating that these regions were less influenced by the triaxial stress state.
Therefore, during tensile deformation along the 0° direction, the strain field on the specimen surface exhibited pronounced spatial non-uniformity, with the central region showing the highest degree of strain concentration and thus serving as a potential site for crack initiation and propagation. The DIC method effectively captured this localized deformation behavior, providing high-resolution experimental data for understanding the anisotropic mechanical response under tensile loading along the rolling direction.
3.4. Strain Evolution at the Midpoint During Tensile Loading Along Six Directions
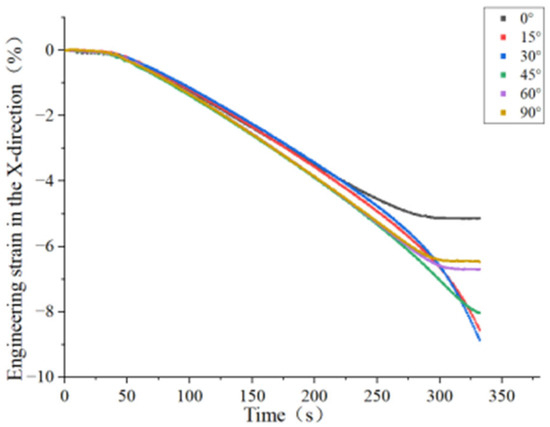
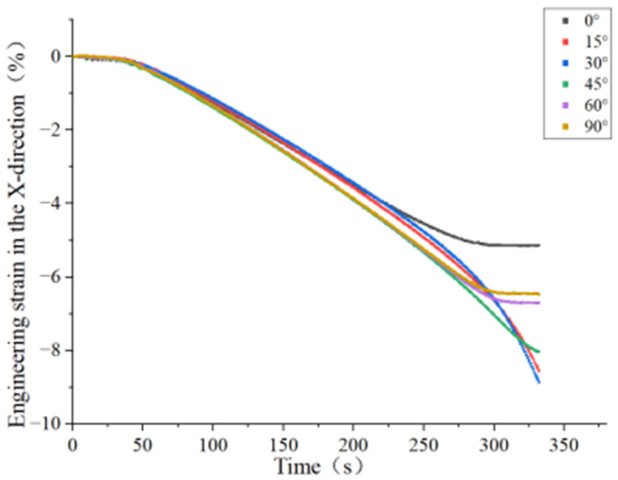
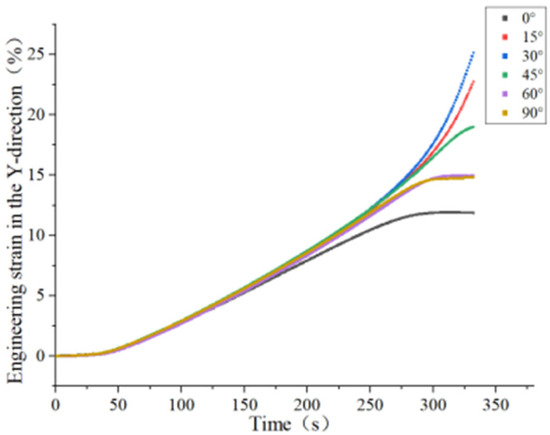
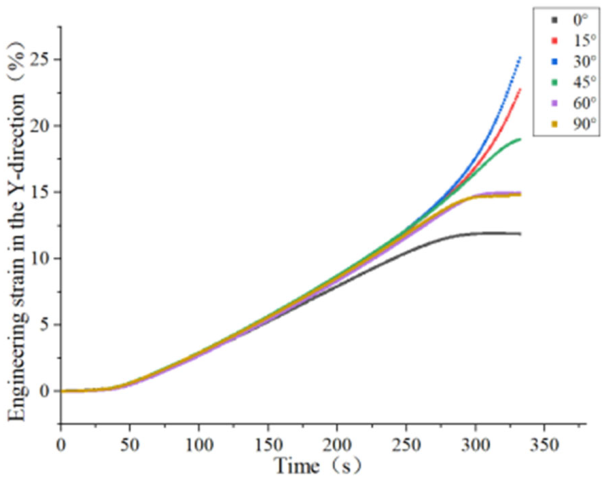
To further investigate the anisotropic behavior of the material, uniaxial tensile tests were conducted along the same six rolling orientations described above. The DIC method was employed to track the evolution of engineering strain in the X and Y directions at the midpoint of each specimen over time. The results are presented in Figure 8 and Figure 9.
Figure 8.
Variation in engineering strain in the X direction with time at the midpoint during tensile loading along six directions.
Figure 9.
Variation in engineering strain in the Y direction with time at the midpoint during tensile loading along six directions.
As shown in Figure 8, the engineering strain curves in the X direction at the midpoint under different orientations nearly overlapped during the elastic stage. This indicates that the elastic modulus exhibits only a weak dependence on the loading orientation, which is consistent with observations reported for many cold-rolled ferritic steels, where elastic anisotropy is generally much less pronounced than plastic anisotropy [18]. After entering the plastic stage, the curves gradually diverged. The 0° direction exhibited the highest strain hardening behavior and the largest fracture strain, indicating the best ductility, whereas the 45° direction exhibited the slowest strain increase and the lowest fracture strain, corresponding to the poorest ductility. The 30° and 60° directions showed intermediate behavior. The differences in strain-hardening behavior across orientations may be attributed to the crystallographic texture and grain orientation distribution developed during cold rolling. Previous studies have demonstrated that rolling-induced textures can alter the resolved shear stresses on various slip systems, thereby affecting the yield behavior, strain-hardening characteristics, and plastic anisotropy of high-strength steels. Accordingly, the orientation-dependent deformation behavior observed in this study is likely related to texture-controlled slip activity [25]. Since microstructural characterization lies beyond the scope of the present work, future investigations will aim to verify this relationship directly through EBSD-based texture analysis.
Figure 9 shows the variation in engineering strain in the Y direction (transverse direction) with time. The strain values in all directions were negative, indicating transverse contraction, although their absolute values differed significantly. The transverse contraction was relatively small in the 0° and 90° directions, whereas the 45° direction exhibited the most pronounced transverse contraction, indicating that the material was more susceptible to transverse plastic flow under tensile loading in this orientation. This observation is consistent with the poor ductility observed in the 45° direction. It is noteworthy that the engineering strain in the Y direction for the 45° and 30° specimens exhibited a temporary decrease in absolute value immediately prior to fracture, indicating that the transverse contraction slowed down or even partially recovered. In contrast, the variation in the 0° and 90° directions remained relatively moderate. The underlying cause of this anomalous phenomenon remains speculative. Several explanations have been proposed: the transition of the stress state in the necking region from uniaxial to multiaxial, apparent lateral displacements due to rigid-body rotation, and DIC measurement errors caused by speckle decorrelation in regions of high strain. Currently, however, these hypotheses lack direct experimental validation, and the interpretation of this observation therefore remains subject to considerable uncertainty.
Based on Figure 8 and Figure 9, the material exhibited pronounced anisotropy during the plastic deformation stage. The 45° direction showed the poorest ductility, whereas the 0° direction exhibited the best ductility. This orientation dependence should be considered in practical forming processes. For example, the principal strain direction should avoid alignment with the 45° orientation to reduce the risk of premature local instability. The DIC method effectively captured the strain evolution behavior under different loading directions, providing reliable experimental data for the development of anisotropic constitutive models.
3.5. Quantification of Plastic Anisotropy by Lankford Coefficients
To provide a more direct characterization of the plastic anisotropy of Q420 cold-rolled high-strength steel, the Lankford coefficient r was further evaluated based on the DIC strain data. As shown in Figure 8 and Figure 9, the engineering strain evolution in the longitudinal (X) and transverse (Y) directions was obtained at the midpoint of the specimen under tensile loading for the six orientations: 0°, 15°, 30°, 45°, 60°, and 90°. For each orientation, the average true longitudinal strain and transverse strain within the ROI were extracted.
Assuming plastic incompressibility, the thickness true strain can be expressed as
therefore,
Based on the definition of the plastic strain ratio, the Lankford coefficient at each orientation was calculated as
Using the DIC-derived strain data, the -values at , and 90° were obtained. To describe the continuous angular dependence of , the discrete data were fitted by least squares using the following trigonometric function:
where the fitted coefficients are
The fitted function gives a coefficient of determination of , indicating that it can reasonably capture the orientation dependence of the plastic strain ratio. Based on the fitted curve, the average plastic strain ratio is
The maximum value of is 0.862 at , while the minimum value is 0.661 at . Accordingly, the anisotropy index is
The results indicate that Q420 cold-rolled high-strength steel exhibits pronounced planar anisotropy during plastic deformation. The mean plastic strain ratio, , suggests that the material offers a certain resistance to thinning, while the planar anisotropy parameter, , indicates substantial variations in plastic flow behavior across different loading orientations. These findings are consistent with the results obtained from the stress–strain curves and DIC-based strain-field analyses, which revealed markedly different plastic deformation capacities and tendencies toward localized instability in different rolling directions. Specifically, specimens oriented at 45° exhibited greater lateral contraction and lower ductility, whereas those oriented at 0° displayed superior plastic deformation capacity. This further underscores the significant influence of rolling-induced texture on the plastic flow behavior of the material.
Thus, incorporating the Lankford coefficient and planar anisotropy parameter enables a more comprehensive and quantitative characterization of the anisotropic behavior of Q420 cold-rolled high-strength steel from the perspective of plastic flow. These results provide valuable experimental evidence for the development of anisotropic constitutive models, the evaluation of sheet-metal forming performance, and the optimization of forming processes.
4. Conclusions
In this study, the tensile behavior of Q420 cold-rolled high-strength steel at six rolling directions (0°, 15°, 30°, 45°, 60°, and 90°) was systematically investigated using digital image correlation (DIC). Full-field strain measurements were employed to characterize local deformation evolution and stress–strain response. The main conclusions are summarized as follows:
- (1)
- Q420 high-strength steel exhibited pronounced tensile anisotropy with respect to the rolling direction. The ultimate tensile strength increased from 810 MPa at 0° to 860 MPa at 90°, whereas the elongation at fracture varied non-monotonically, reaching a minimum at 45°.
- (2)
- The DIC technique successfully captured the full-field strain evolution during tensile deformation, revealing the initiation and propagation of strain localization that could not be identified with conventional extensometer measurements. Strain concentration gradually developed within the gauge section, ultimately leading to localized necking and fracture.
- (3)
- Distinct strain-evolution characteristics were observed along different loading orientations. The 45° specimens exhibited the strongest tendency for strain localization and the lowest elongation at fracture, whereas the 0° and 90° specimens displayed comparatively higher deformation capacity.
- (4)
- The more pronounced strain localization in the 45° orientation indicates a greater susceptibility to localization under uniaxial loading. However, these findings cannot be directly extended to industrial forming processes without further investigations under multiaxial stress states, as multiaxial loading can substantially alter deformation and localization behavior relative to uniaxial tension.
- (5)
- The present results provide valuable experimental evidence for the orientation selection and mechanical property evaluation of cold-rolled Q420 steel sheets. Under the uniaxial tensile conditions investigated, the 0° orientation exhibited the highest ductility, the 90° orientation showed the greatest ultimate tensile strength, and the 45° orientation proved most sensitive to strain localization, necessitating caution when assessing localized deformation behavior in this direction. Furthermore, the full-field strain data obtained via DIC can serve as essential input for calibrating and validating anisotropic constitutive models, thereby enhancing numerical simulations of sheet-metal forming. Nevertheless, further studies incorporating complex multiaxial stress states are required to extend these findings to industrial forming conditions, as anisotropic deformation behavior is strongly influenced by loading path and stress state.
Overall, the DIC full-field measurement method effectively characterized the non-uniform deformation behavior of the material under different loading directions, providing high-precision experimental data for the development of anisotropic constitutive models and the optimization of forming processes.
Author Contributions
Conceptualization, N.G. and X.M.; methodology, X.W. and C.L.; software, Y.L. (Yaoyao Li) and Y.L. (Yangyang Li); validation, N.G. and C.L.; investigation, X.W. and Y.L. (Yaoyao Li); resources, N.G. and X.M.; data curation, Y.L. (Yaoyao Li) and Y.L. (Yangyang Li); writing—original draft preparation, X.W. and Y.L. (Yaoyao Li); writing—review and editing, N.G. and Y.L. (Yangyang Li); supervision, N.G. and C.L.; project administration, X.M. and N.G.; funding acquisition, X.M. All authors have read and agreed to the published version of the manuscript.
Funding
This research was funded by the National Natural Science Foundation of China (Grant No. 52401045), the Scientific and Technological Research Projects in Henan Province (Grant No. 252102110376), and the Key Research and Development Program of Longmen Laboratory (project “Research and industrialization of an efficient and low-loss harvesting machine for oil sunflower beans”, Grant No. LMZDYF-202401; project “Research and industrialization of self-propelled potato bagging harvesting machine”, Grant No. LMZDYF-202403). The APC was funded by the National Natural Science Foundation of China.
Institutional Review Board Statement
Not applicable.
Informed Consent Statement
Not applicable.
Data Availability Statement
The research data are all included in the article.
Conflicts of Interest
The authors declare no conflicts of interest.
References
- Long, H.; Wang, G.; Wang, P.; Ma, J.; Luo, X.; He, H. Study on the influence of heat input on microstructure and properties of Q420C steel welded joints. Coatings 2025, 15, 957. [Google Scholar] [CrossRef] [Scilit]
- Chen, H.; Pu, T.; Zhang, H.; Fan, C.; Jiang, B. Mechanical properties of bridge steel Q420qE at elevated temperatures. J. Constr. Steel Res. 2025, 226, 109207. [Google Scholar]
- Luo, K.; Li, H.; Yang, J.; Kang, H.; Yan, F.; Han, X. Research on post-fire mechanical properties of thin-walled cold-formed steel and its influence on the Σ-shaped columns after fire exposure. Thin-Walled Struct. 2024, 204, 112315. [Google Scholar]
- Alhalaybeh, T.S.; Akhtar, H.; Chowdhury, A.I.; Lou, Y. Anisotropic hardening of HC420 steel sheet: Experiments and analytical modeling. Metals 2025, 15, 149. [Google Scholar] [CrossRef] [Scilit]
- Pokropek, J.; Kluczyński, J.; Sarzyński, B.; Jasik, K.; Szachogłuchowicz, I.; Łuszczek, J.; Joska, Z.; Małek, M.; Torzewski, J. The influence of rolling direction and dynamic strengthening on the properties of steel. Materials 2025, 18, 3808. [Google Scholar] [CrossRef] [Scilit] [PubMed]
- Pereira, R.; Peixinho, N.; Costa, S.L. Direct experimental calibration of Hosford–Coulomb and modified Mohr–Coulomb damage criteria in AHSS using digital image correlation. Metals 2025, 15, 1238. [Google Scholar]
- Zhang, Z.; Tong, D.; Yang, X.; Wang, X.; Han, L.; Yan, G.; Li, C.; Gu, J. In-situ research on tensile deformation and microvoid formation in a nuclear pressure vessel steel. Int. J. Miner. Metall. Mater. 2025, 32, 1893–1901. [Google Scholar] [CrossRef] [Scilit]
- Jones, E.M.C.; Reu, P.L.; Kramer, S.L.B.; Jones, A.R.; Carroll, J.D.; Karlson, K.N.; Seidl, D.T.; Turner, D.Z. Digital image correlation and infrared thermography data for seven unique geometries of 304L stainless steel. Sci. Data 2024, 11, 1101. [Google Scholar] [CrossRef] [Scilit] [PubMed]
- Boruah, D.; Dewagtere, N.; Ahmad, B.; Nunes, R.; Tacq, J.; Zhang, X.; Guo, H.; Verlinde, W.; Waele, W.D. Digital image correlation for measuring full-field residual stresses in wire and arc additive manufactured components. Materials 2023, 16, 1702. [Google Scholar] [CrossRef] [Scilit] [PubMed]
- Fayad, S.S.; Jones, E.M.C.; Seidl, D.T.; Reu, P.L.; Lambros, J. On the importance of direct-levelling for constitutive material model calibration using digital image correlation and finite element model updating. Exp. Mech. 2023, 63, 467–484. [Google Scholar]
- Wang, S.; Wang, B.; Mu, S.; Zhang, J.; Zhang, Y.; Gong, X. Study on the approach to obtaining mechanical properties using digital image correlation technology. Materials 2025, 18, 1875. [Google Scholar] [CrossRef] [Scilit] [PubMed]
- Ferrian, F.; Sapora, A.; Estevez, R.; Doitrand, A. Evaluation of fracture properties by coupling digital image correlation and finite fracture mechanics. Int. J. Fract. 2025, 249, 66. [Google Scholar] [CrossRef] [Scilit]
- Sakaridis, E.; Roth, C.C.; Jordan, B.; Mohr, D. Post-necking full-field FEMU identification of anisotropic plasticity from flat notched tension experiments. Int. J. Solids Struct. 2024, 305, 113076. [Google Scholar] [CrossRef] [Scilit]
- Romanowicz, P.J.; Szybiński, B.; Wygoda, M. Assessment of digital image correlation effectiveness and quality in determination of surface strains of hybrid steel/composite structures. Materials 2024, 17, 3561. [Google Scholar] [CrossRef] [Scilit] [PubMed]
- Nasajpour-Esfahani, N.; Karimi, S.; Nasseri, S.; Borna, H.; Boostani, A.F.; Gao, R.; Huang, W.; Garmestani, H.; Liang, S.Y. Advancements and applications of digital image correlation to characterize residual stress: A review. Mater. Charact. 2025, 228, 115416. [Google Scholar] [CrossRef] [Scilit]
- Mousa, M.A.; Yussof, M.M.; Hussein, T.S.; Assi, L.N.; Ghahari, S.A. A digital image correlation technique for laboratory structural tests and applications: A systematic literature review. Sensors 2023, 23, 9362. [Google Scholar] [CrossRef] [Scilit] [PubMed]
- Janeliukstis, R.; Chen, X. Review of digital image correlation application to large-scale composite structure testing. Compos. Struct. 2021, 271, 114143. [Google Scholar] [CrossRef] [Scilit]
- He, J.; Feng, Y. Determining Localized Necking in Polycrystalline Sheet Metals Using the Bifurcation Phenomenon in Strain Evolution. Crystals 2023, 13, 272. [Google Scholar] [CrossRef] [Scilit]
- Agha, A. Effectiveness of 2D digital image correlation in capturing the fracture behavior of sheet metal alloys. SAE Int. J. Mater. Manuf. 2023, 16, 99–115. [Google Scholar]
- Kim, J.; Gu, G.H.; Kwon, J.; Seo, M.H.; Kim, H.S. A novel framework for evaluating the intrinsic mechanical properties of sheet metals using two-dimensional digital image correlation. Met. Mater. Int. 2025, 31, 2837–2844. [Google Scholar]
- Starman, B.; Chen, B.; Maček, A.; Zhang, Y.; Halilovič, M.; Coppieters, S. Characterising through-thickness shear anisotropy using the double-bridge shear test and finite element model updating. Materials 2025, 18, 2220. [Google Scholar] [PubMed]
- GB/T 228.1-2010; Metallic materials—Tensile testing—Part 1: Method of test at room temperature. Standardization Administration of the People’s Republic of China: Beijing, China, 2010.
- Benzerga, A.A.; Leblond, J.B. Ductile Fracture by Void Growth to Coalescence. Adv. Appl. Mech. 2010, 44, 169–305. [Google Scholar] [CrossRef] [Scilit]
- Marteleur, M.; Leclerc, J.; Colla, M.-S.; Nguyen, V.D.; Noels, L.; Pardoen, T. Ductile Fracture of High Strength Steels with Morphological Anisotropy, Part I: Characterization, Testing, and Void Nucleation Law. Eng. Fract. Mech. 2021, 244, 107569. [Google Scholar] [CrossRef] [Scilit]
- Yang, Y.; Fan, L.; Xu, C. The microstructure, texture evolution and plasticity anisotropy of 30SiMn2MoVA high strength alloy steel tube processed by cold radial forging. Mater. Charact. 2020, 169, 110641. [Google Scholar]



Disclaimer/Publisher’s Note: The statements, opinions and data contained in all publications are solely those of the individual author(s) and contributor(s) and not of MDPI and/or the editor(s). MDPI and/or the editor(s) disclaim responsibility for any injury to people or property resulting from any ideas, methods, instructions or products referred to in the content. |
© 2026 by the authors. Licensee MDPI, Basel, Switzerland. This article is an open access article distributed under the terms and conditions of the Creative Commons Attribution (CC BY) license.