


Abstract
Substoichiometric molybdenum oxide is widely utilized as a hole transport layer (HTL) in polymer solar cells and perovskite solar cells. In this study, the possibility of developing MoOx layers applicable as HTLs with different characteristics by magnetron sputtering from a MoO3 target and annealing in dry nitrogen or air is explored. The optical transmission and reflection, optical band gap, FTIR and Raman spectra, crystallinity, conductivity, and work function of the films are studied depending on deposition and annealing conditions. The results demonstrate that it is possible to tune the properties of the obtained films with a view toward their application in solar cells.
1. Introduction
Molybdenum oxides are a system of solid compounds between molybdenum and oxygen that find a wide variety of applications in solar cells, electrochromic devices, gas sensors, etc. [1]. By changing their oxygen content and structure, a wide range of optical and electrical properties can be achieved in that system. Molybdenum oxides and, more precisely, MoO3 and its suboxide variations are applied as hole transport layers in organic [2], perovskite [3] and silicon solar cells [4]. It is the high work function of MoOx that makes it especially suitable as a hole transport layer in organic and perovskite solar cells [5]. It is also more chemically stable than PEDOT:PSS, which was the first choice for HTL in organic solar cells.
When an HTL is applied on the front of a solar cell, it is very important that it is transparent enough so that as much light as possible reaches the active layer of the device. In all cases, the HTL has to possess a high enough work function for it to be able to facilitate the transfer of holes from the active layer to the outer circuit and block the electrons. MoO3 has both of these important characteristics [5]. In some cases, when the MoOx HTL is thicker, it is preferable for it to be more conductive, which is usually achieved by increasing the amount of oxygen vacancies in the film [6].
There are several ways of obtaining MoO3 thin films for application in solar cells. The most common ones are deposition from solution [7], vacuum evaporation [8] and magnetron sputtering [5,6]. The films deposited by magnetron sputtering are homogeneous and compact. The technique demonstrates good repeatability of the films’ properties and variability of their characteristics with deposition conditions that are easy to control.
The authors of [9] investigated MoO3 films reactively magnetron-sputtered from a metal Mo target, which were applied as HTLs in organic solar cells. They found that the structural, optical and electrical properties of the films strongly depended on the substrate temperature, and the optimal results for solar cells were obtained at 100 °C. The authors of [10] varied the proportion of oxygen in the sputtering chamber during the reactive magnetron sputtering deposition of MoOx, and in this way controlled the stoichiometry of the films. In [4], MoOx films were grown on silicon by rf magnetron sputtering from a MoO3 target at different substrate temperatures. The evolution of the crystal structure as well as the work function was followed, and an increase in the work function with the increase in substrate temperature was observed. By 250 °C, the films had crystalized in a mixture of phases. In [6], films were deposited from a MoO3 target in different atmospheres, varying the temperature and pressure. It was shown that the stoichiometry and, hence, other properties of the films could be controlled in this way. The authors of [5] showed that the stoichiometry, optical properties, etc., of non-reactively sputtered MoOx films can be controlled by only varying the argon pressure in the chamber.
The results in [2] demonstrate that the post deposition annealing of MoOx films for HTLs in organic solar cells significantly improves their suitability for that role by enabling the oxidation state of Mo to reach 6+. In [11], it was observed that there was an increase in the optical transmission of reactively sputtered MoOx films with annealing temperature in air at 300 °C and 400 °C. The authors also found an increase in the band gap from 2.98 eV for as-deposited films to 3.15 eV for films annealed at 400 °C in air. Evaporated MoOx was subjected to annealing in an oxygen atmosphere at temperatures between 100 °C and 400 °C and the work function and optical band gap were found to pass through a maximum at 200 °C and 300 °C, respectively [8].
There are few studies where reactive sputtering from a MoO3 target was applied for obtaining MoOx layers. The deposition from a MoO3 target instead of reactively from a metal Mo target offers the possibility of exploring alternative ways of obtaining layers that could lead to denser and more homogeneous material and cause less poisoning of the target, i.e., more repeatable chemical content. In a previous short paper, we demonstrated that magnetron sputtering from a MoO3 target in an Ar + O2 atmosphere at different deposition temperatures allows the properties of the resultant film to be tuned for application as HTLs in solar cells [12]. In this study, thermal annealing is applied as an additional treatment to try to improve the quality of the prepared films for potential application as HTLs at the front or rear of organic or perovskite solar cells. In the literature, the most common thermal treatment of studied MoOx layers is annealing in oxygen or air. We apply annealing in dry nitrogen for all samples and annealing in air for representative samples for comparison. Sometimes annealing is applied as a technological step in the preparation of the active layer of a solar cell, and if the active layer lies on top of the MoOx HTL, then the HTL also becomes annealed. This study helps elucidate how such a treatment would affect the relevant properties of the MoOx layer. Thickness is an important parameter for a HTL. In this study, we do not explore the dependence of the studied properties of the films on their thickness and all films are of the same medium thickness of about 45 nm. Thickness will be included in further studies when the layers are incorporated in actual solar cells.
2. Materials and Methods
The samples were deposited by magnetron sputtering using a VINCI Technologies, (Nanterre, France) PVD 4SU system. The target was 2″ MoO3 with 99.95% purity. It was placed on one of three cathodes in a confocal configuration. The substrate holder was positioned 13 cm above it. The target was presputtered for 4 min before the start of the actual deposition. The applied power was 60 W. The sputtering gas was Ar or Ar + O2. The O2 proportion of the gas flow varied between 0 and 5%, while the full gas flow was kept at 25 sccm. The thickness of the deposited films was measured during the deposition with a quartz resonator and an SQM-160 Multi-Film Rate/Thickness Monitor (INFICON, East Syracuse, NY, USA). It was about 45 nm. Microscope glass slides and Si wafers were used for substrates. The substrates were not heated during deposition.
Different pieces of the samples were annealed at 200 °C, 300 °C and 340 °C for 1 h on a hot plate in a N2 filled MBraun glovebox (M. Braun Inertgas-Systeme GmbH, Garching, Germany). For comparison, pieces of samples deposited with 0 and 1.8% oxygen in the gas flow during magnetron sputtering were annealed at 200 °C, 300 °C and 400 °C in air for 1 h.
The sheet resistance of all samples was measured with a four-point probe (Jandel, Leighton Buzzard, UK) on glass substrate. The values given are an interval of values measured on different places on a substrate.
A Scanning Kelvin Probe (SKP5050, KP Technology, Wick, UK) was used to measure the Contact Potential Difference (CPD) between the sample surface and a 2 mm diameter vibrating tip. To obtain the work function of the sample (WFs), the work function of the probe tip (WFtip) was first determined by calibrating it against a standard gold reference sample (WFref = 4800 meV). During calibration, the CPD over the gold reference was measured, allowing WFtip to be calculated as WFtip = WFref − CPD. All measurements were performed in ambient air at room temperature. The reported value of the work function is the mean of the results for several different places on the sample.
The optical transmission and reflection spectra were obtained using a Shimadzu UV3600 UV-VIS-NIR spectrometer (Shimadzu Corporation, Kyoto, Japan) from the samples on glass. The optical band gap was determined from a Tauc plot using the formula for amorphous and nanocrystalline semiconductors with indirect allowed transitions [6]. The mean transmission in the range 400–1100 nm was calculated by adding up all of the measured transmission points in that range and dividing by the number of points. The measurements were made at intervals of 1 nm. This wavelength range was chosen as the one most relevant for solar cell applications.
FTIR transmission spectra were measured on Si substrates with a Shimadzu IRPrestige-21 spectrophotometer (Shimadzu Corporation, Kyoto, Japan). The Raman spectra were obtained on glass substrates with a LabRAM HR800 spectrometer (Horiba Jobin Yvon, Longjumeau, France) using the 600 L/mm grating and HeNe laser for excitation. The samples were placed under the 100× achromatic objective of a BX41 microscope (Olympus Corporation, Tokyo, Japan) and measured in back scattering configuration.
The XPS analyses were performed on a Kratos AXIS Supra spectrometer (Kratos, Manchester, UK) with an achromatic Al X-ray source under vacuum better than 10−8 Pa at a 90 degree take-off angle. Each analysis started with a survey scan from 0 to 1200 eV, pass energy of 160 eV at steps of 0.5 eV with 1 sweep. For the high-resolution analysis, the number of sweeps was increased and the pass energy was lowered to 20 eV at steps of 100 meV. The C1s photoelectron line at 284.6 eV was used for the calibration of recorded spectra.
The instrument used for the XRD spectra was an ARL™ EQUINOX 100 X-ray Diffractometer (Thermo Fisher Scientific, Ecublens, Switzerland), equipped with a CuKα X-ray source (λ = 1.5418 Å) and a curved 110° 2θ detector. The counting time was 20 min. Phase composition was determined with EVA 4.0 (Bruker, Karlsruhe, Germany) software using the ICDD-PDF 2 Database (2021).
A digitalized scanning electron microscope (SEM) Philips 515 (Philips, Eindhoven, The Netherlands) was used to visualize the surface morphology of the films. The experiments were performed at an accelerating voltage of 8 kV. The samples were pre-coated with AuPd for better contrast.
3. Results
3.1. XPS Spectra
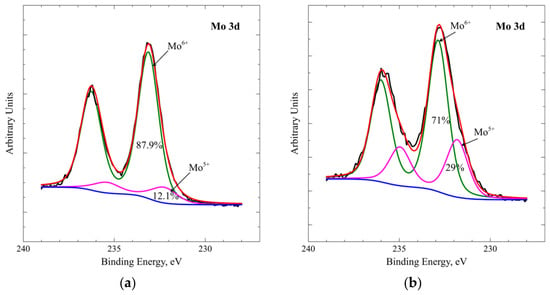
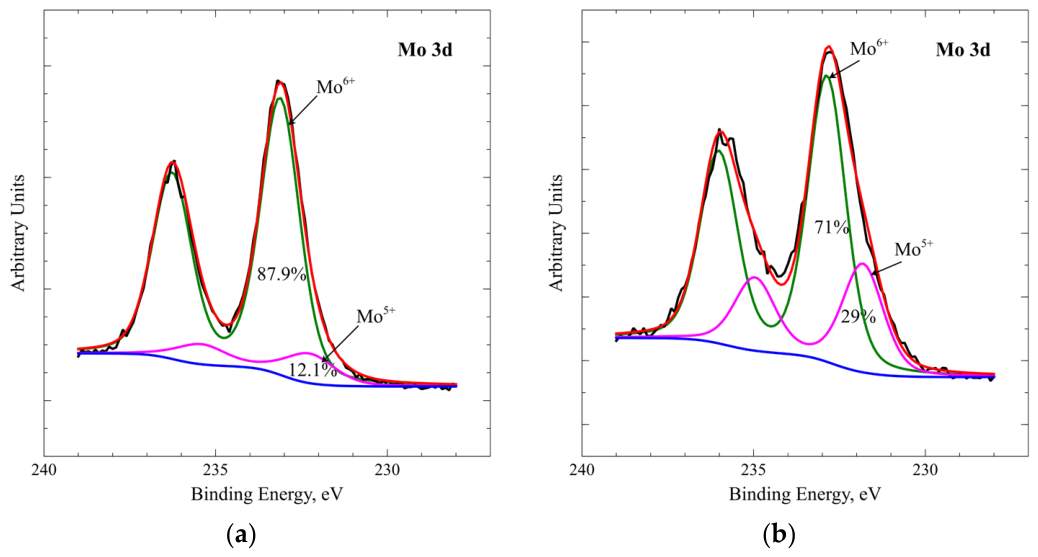
The as-deposited samples were characterized by XPS spectroscopy of the surface in the region of the 3d core levels of Mo (Figure 1 and Figure S1 in the Supplementary Materials) in order to estimate the stoichiometry of the obtained films. The spectra were fitted after subtracting a Shirley background with Gaussian–Lorentzian bands. They were deconvoluted into two doublet peaks corresponding to the 3d5/2 and 3d3/2 bands of Mo6+ and Mo5+ ions. Each doublet has a 3.1 eV splitting and 3:2 ratio of the areas of the two peaks. From the fits, the relative concentration of the 6+ and 5+ oxidation states of Mo can be deduced [13]. It is evident that the film deposited without the addition of oxygen to the sputtering gas has a higher percentage of Mo5+ at 29%, while the samples deposited with the addition of oxygen while sputtering contain less Mo5+—between 12.1 and 18.5%. All of the deposited samples are substoichiometric, but the XPS results show that the addition of oxygen to the plasma reduces the Mo5+ and, hence, oxygen vacancy content.
Figure 1.
XPS spectra in the region of the Mo 3d binding energies for the sample deposited with 1.8% oxygen (a) and with 0% oxygen (b) in the gas mixture.
3.2. Optical Spectra and Band Gap
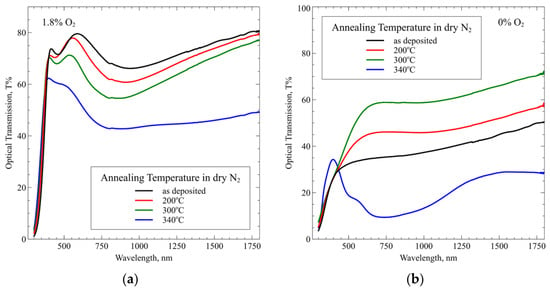
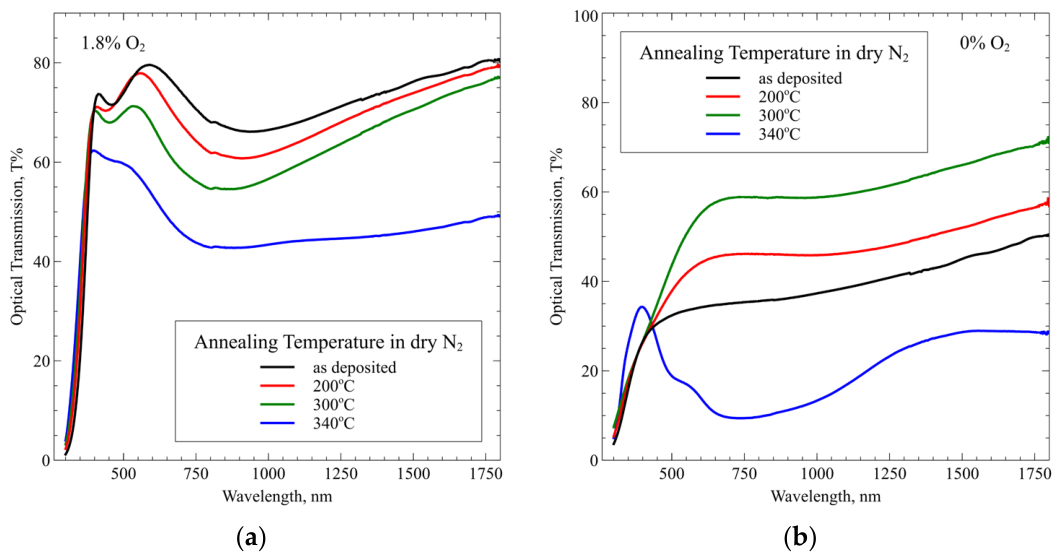
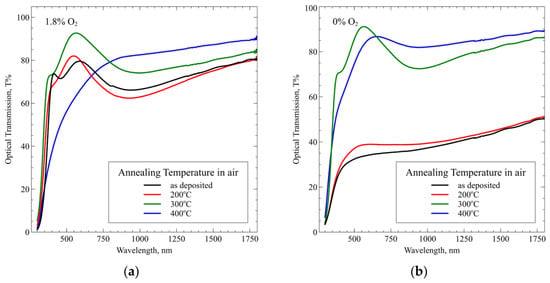
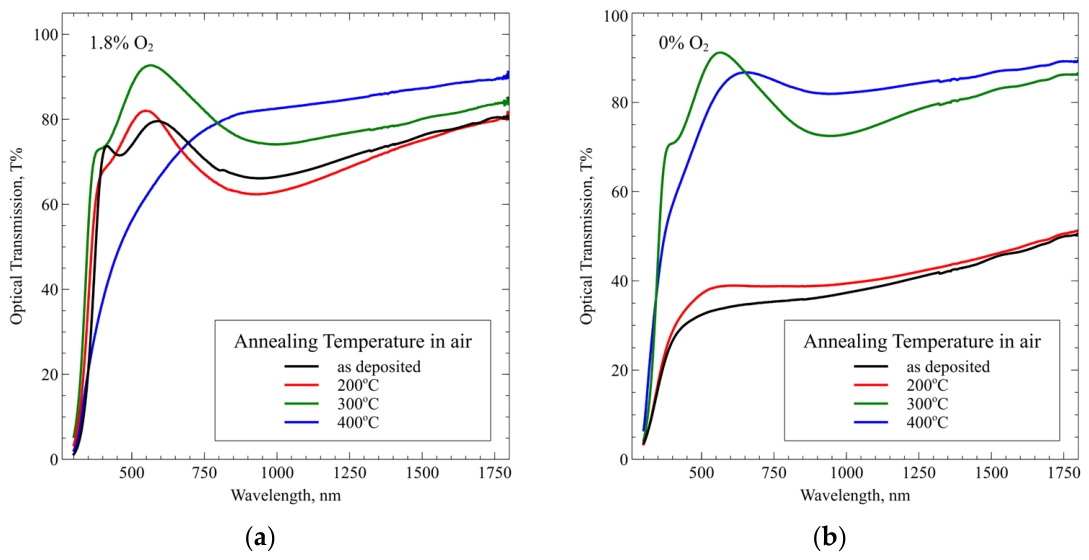
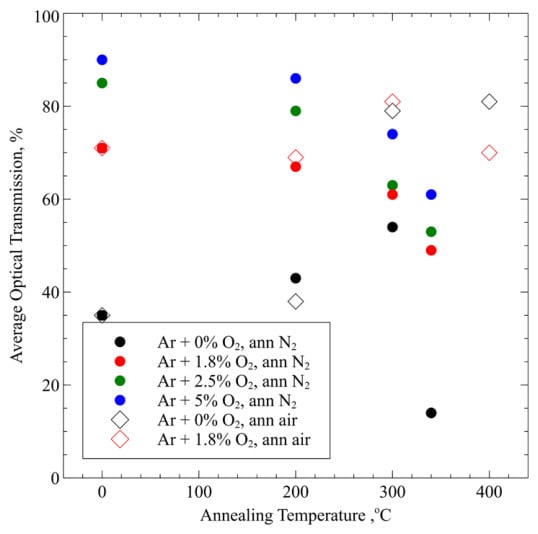
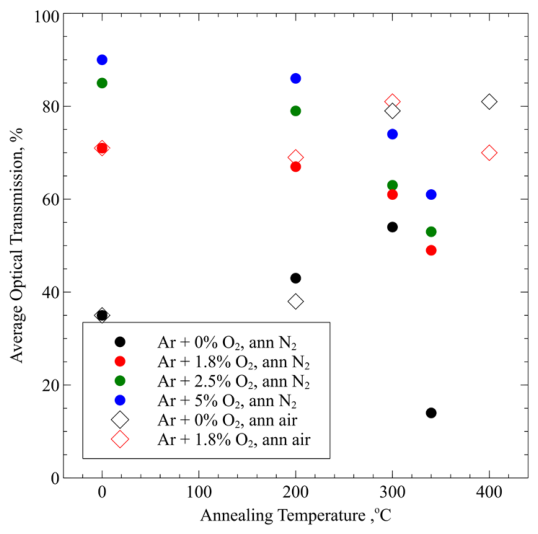
The optical transmission of the as-deposited and annealed films corrected for the transmission of the glass substrate are given in Figure 2 and Figure S2 for the samples annealed in dry nitrogen and in Figure 3 for the samples annealed in air for comparison. The transparency of the as-deposited films depends on the amount of oxygen added to the plasma, as described in our previous study [12]. The transparency is greatest for the highest amount of oxygen used—5% and smallest for the sample deposited with only Ar (Figure 4). The annealing in dry N2 leads to a gradual decrease in transparency for all studied oxygen concentrations different from zero. The effect of annealing at 200 °C on the transparency of these films is small (Figure 2a and Figure S2). At 300 °C, the effect is stronger and at 340 °C, it is the strongest. The sample deposited with no oxygen in the sputtering gas demonstrates a different behavior (Figure 3b). Its transparency increases with annealing temperature in dry nitrogen up to 300 °C, but for the highest annealing temperature, the transparency drops considerably.
Figure 2.
Optical transmission of MoOx samples deposited with 1.8% O2 (a) and 0% O2 (b) in the sputtering gas annealed in dry nitrogen at the indicated temperatures.
Figure 3.
Optical transmission of MoOx samples deposited with 1.8% O2 (a) and 0% O2 (b) in the sputtering gas, annealed in air at the indicated temperatures.
Figure 4.
Average optical transmission in the range 400–1100 nm as a function of annealing temperature. Different symbols and colors are used for combinations of deposition conditions and annealing atmosphere, as shown in the legend. Full circles are used for samples annealed in dry nitrogen and empty diamonds for samples annealed in air. The color indicates the amount of oxygen added during deposition. The size of the symbols indicates the experimental error.
The annealing in air of the sample deposited with 1.8% O2 in the sputtering gas demonstrates an increase in transparency up to 300 °C (Figure 3a). The same happens to the sample sputtered with only Ar (Figure 3b), although it starts from a much lower transparency in the as-deposited state. When annealed at 300 °C, both samples have very similar transmission spectra. Annealing at 400 °C in air deteriorates the transparency of the sample deposited with 1.8% O2 in the sputtering gas. It becomes visibly opaque and scatters more light.
The average optical transmission of the studied samples in the wavelength interval 400–1100 nm as a function of annealing temperature and annealing atmosphere can be seen in Figure 4. As a general tendency, annealing in nitrogen leads to a reduction in transparency for all samples with the exception of the one sputtered in pure Ar. Annealing in air up to 300 °C increases the transparency of the samples. Annealing at temperatures higher than 300 °C in either atmosphere does not lead to any significant increase in transparency in the studied interval, and in most cases leads to a fall in transparency.
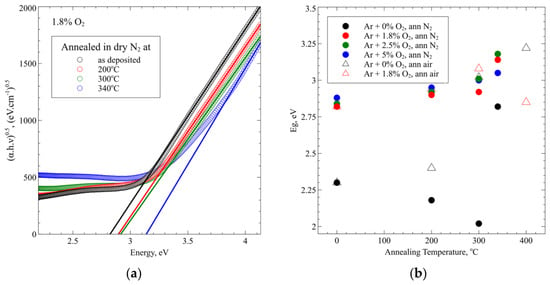
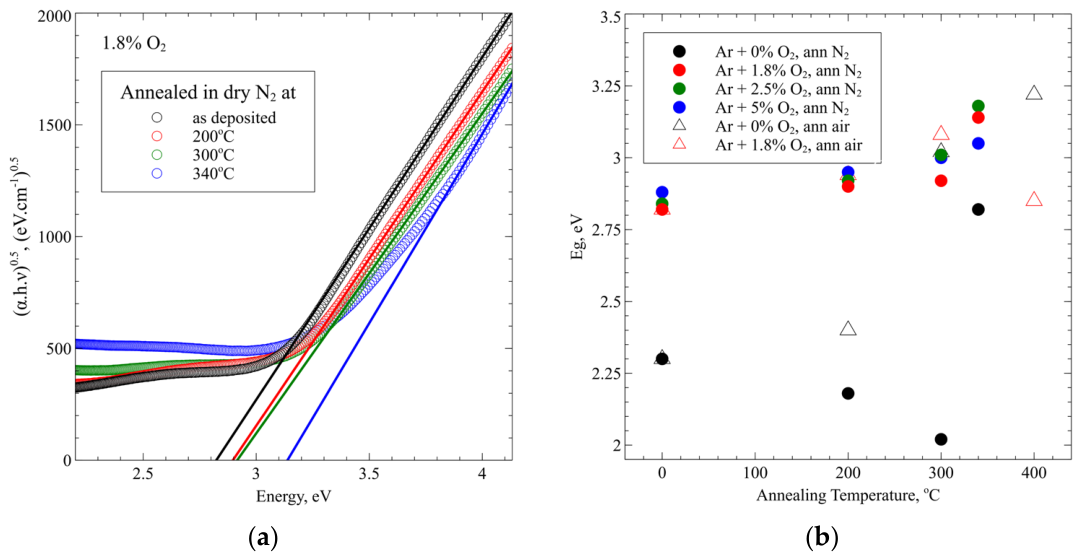
Figure 5a demonstrates an example of the determination of the optical band gap for different annealing temperatures in the case of the sample deposited with the addition of 1.8% O2 in the sputtering gas annealed in dry nitrogen. The figures showing these results for the rest of the studied samples are included in the Supplementary Materials (Figure S3).
Figure 5.
(a) Determination of the optical band gap as a function of the annealing temperature in dry nitrogen of the sample deposited with 1.8% O2 in the sputtering gas. (b) Dependence of the optical band gap determined in this way on annealing temperature. Different symbols and colors are used for combinations of deposition conditions and annealing atmosphere, as shown in the legend. Full circles are used for samples annealed in dry nitrogen and empty triangles for samples annealed in air. The color indicates the amount of oxygen added during deposition. The size of the symbols indicates the experimental error.
The dependence of the band gap on annealing temperature for samples deposited with different oxygen content in the sputtering gas and annealed either in dry nitrogen or air is shown in Figure 5b. The band gap of most samples increases with annealing temperature independent of the annealing gas. The only exceptions are the samples sputtered without oxygen in the plasma and annealed in nitrogen and the result for the highest temperature annealing in air of the sample sputtered with 1.8% O2.
3.3. Work Function
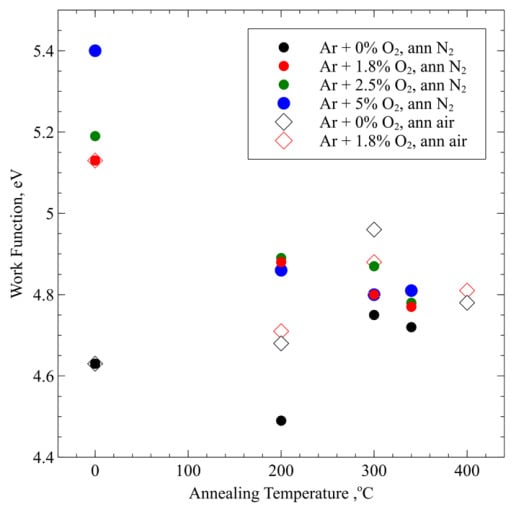
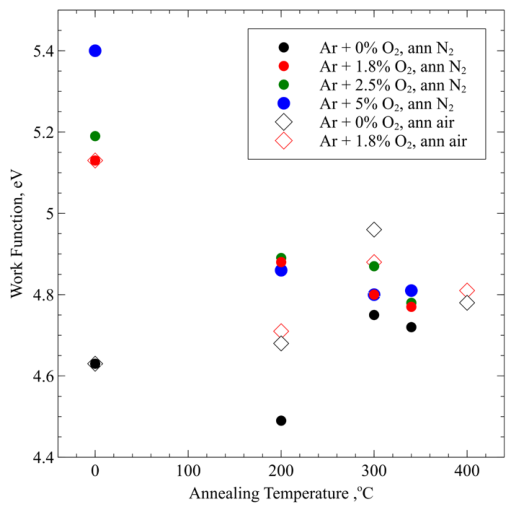
Figure 6 visualizes the dependence of the work function on the temperature and atmosphere of annealing for all samples studied. The work function of the samples deposited with added oxygen to the plasma and annealed in N2 decreases with annealing temperature but stays above 4.7 eV in all cases. The work function of the sample deposited in Ar alone is lower to begin with and falls even more after annealing at 200 °C in dry nitrogen, but after annealing in the same atmosphere at higher temperatures, it increases again.
Figure 6.
Work function dependence on annealing temperature. Different symbols are used for combinations of deposition conditions and annealing atmosphere, as shown in the legend. Full circles are used for samples annealed in dry nitrogen and empty diamonds for samples annealed in air. The color indicates the amount of oxygen added during deposition. The size of the symbols indicates the experimental error, which is ±20 meV.
Annealing in air leads to a kind of convergence of the work functions of the two types of samples treated in this way—it falls for the sample deposited with oxygen in the plasma and increases for the one deposited with Ar only. This last case is the only improvement in the work function achieved by annealing in any atmosphere in this experiment.
3.4. Sheet Resistance
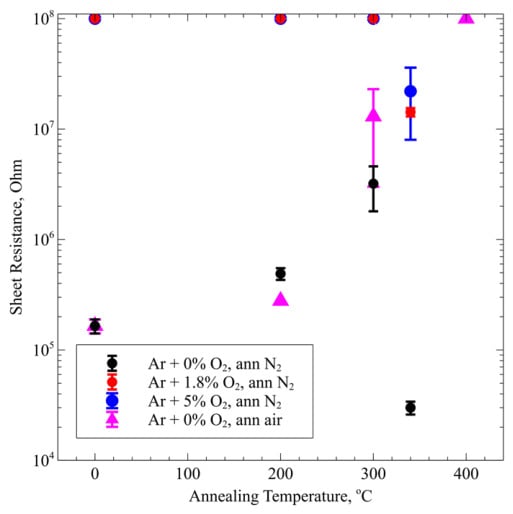
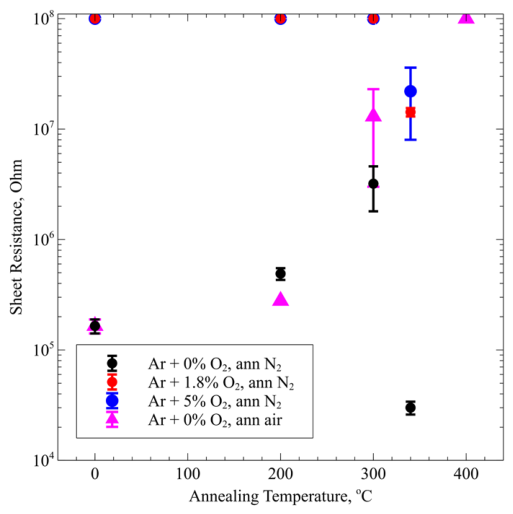
The samples deposited with oxygen in the plasma are isolating in the as-deposited state and remain isolating after annealing in dry nitrogen. Only after annealing at the highest temperature used—340 °C—did some of these samples become marginally conductive (Figure 7).
Figure 7.
Dependence of the measured sheet resistance of the samples on annealing temperature. Different symbols are used for combinations of deposition conditions and annealing atmosphere, as shown in the legend. Full circles are used for samples annealed in dry nitrogen and full triangles for the sample annealed in air. The samples not included in the figure have no measurable conductivity by this method. The data points at the top of the figure indicate resistivity that was greater than 108 Ω/□.
Only the sample deposited with Ar alone shows any conductivity in the as-deposited state. Its sheet resistance increases with the temperature of annealing in air from 165 kΩ/□ to 1.3 MΩ/□, and at a treatment temperature of 400 °C, the film becomes isolating (i.e., its sheet resistance is greater than 108 Ω/□). Annealing in dry nitrogen also leads to an increase in sheet resistance up to 300 °C, but at 340 °C, the conductivity increases.
3.5. Raman Spectra
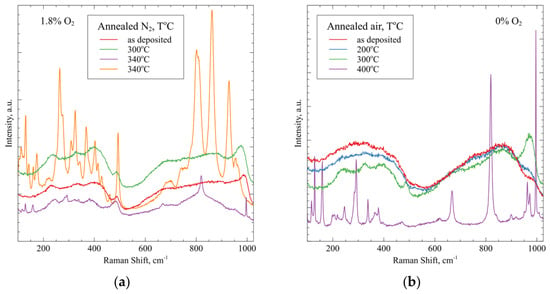
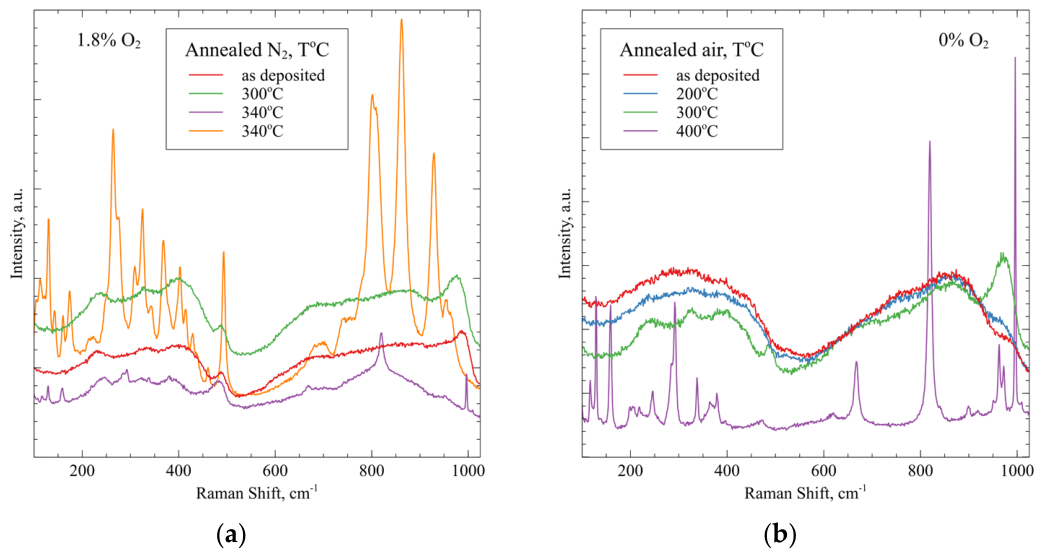
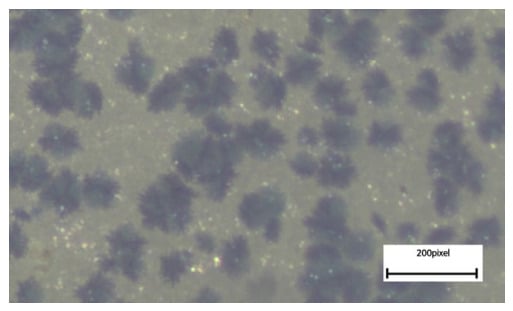
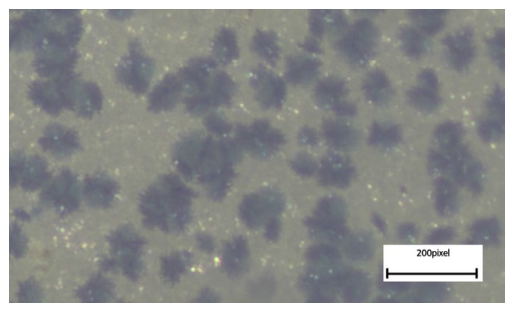
Figure 8a demonstrates the evolution of the Raman spectra of the samples deposited with 1.8% oxygen in the sputtering gas annealed in dry nitrogen. The developments in other samples annealed in the same conditions are similar and shown in Figure S4 of the Supplementary Materials. The Raman spectra of the as-deposited samples show the start of some ordering, and this continues in the annealed samples up to 300 °C. The samples annealed at 340 °C demonstrate two phases. The predominant one is the orthorhombic phase, confirmed by a spectrum containing its main characteristic lines at 117, 128, 159, 245, 291, 338 and 379 cm−1 for the bending modes and 482, 667, 819 and 997 cm−1 for the stretching modes. The background of this spectrum shows the continued existence of some amorphous fraction in the sample. In some isolated spots that look like precipitates (Figure 9), a different crystalline phase with a lower symmetry and possibly the participation of nitrogen appears, as demonstrated by the strong spectrum, which is last in the legend of Figure 8a. The lines observed resemble, in terms of their position and mutual relation, spectra experimentally found for hexagonal molybdenum oxide [14,15,16] and oxynitrade phases [17]. The emergence of a strong spectrum with many bands after partial oxidation is demonstrated in [18].
Figure 8.
(a) Dependence of Raman spectra on annealing temperature for (a) the sample deposited with 1.8% oxygen in the sputtering gas and annealed in dry nitrogen and (b) the sample deposited in pure Ar annealed in air. For the first sample, there are two different spectra after annealing at 340 °C, as explained in the text.
Figure 9.
Optical microscope image of the sample deposited with 1.8% oxygen in the plasma and annealed at 340 °C. 200 pixels correspond to 74 μm.
In the case of annealing in air (Figure 8b), the Raman spectra of the as-deposited samples and those annealed at 200 °C show that the films are amorphous. They consist of two broad structureless bands roughly corresponding to the stretching and bending vibrations of the MoO6 octahedra comprising the MoOx lattice at 200–400 cm−1 and 400–1050 cm−1, respectively [19]. The spectrum of the sample annealed at 300 °C shows the beginning of some ordering, with structure appearing on the broad bands of amorphous MoOx—between 200 and 400 cm−1 and at about 1000 cm−1. The spectrum of the sample annealed at 400 °C is that of crystalline orthorhombic MoO3. The characteristic lines are the stretching modes at 995, 818, 666 and 473 cm−1 and the bending modes at 379, 365, 337, 290, 284, 245, 219, 199, 158, 128 and 117 cm−1 [20]. It can be seen that the wavelength intervals where structures appear in the spectrum of the sample annealed at 300 °C correspond to the areas where the strong characteristic bands of orthorhombic MoO3 are situated. No background due to an amorphous fraction is observed after annealing at 400 °C in air.
3.6. SEM Pictures
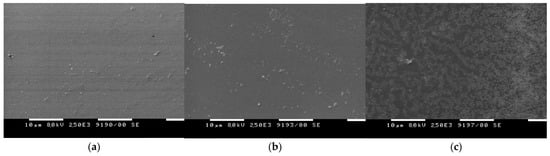
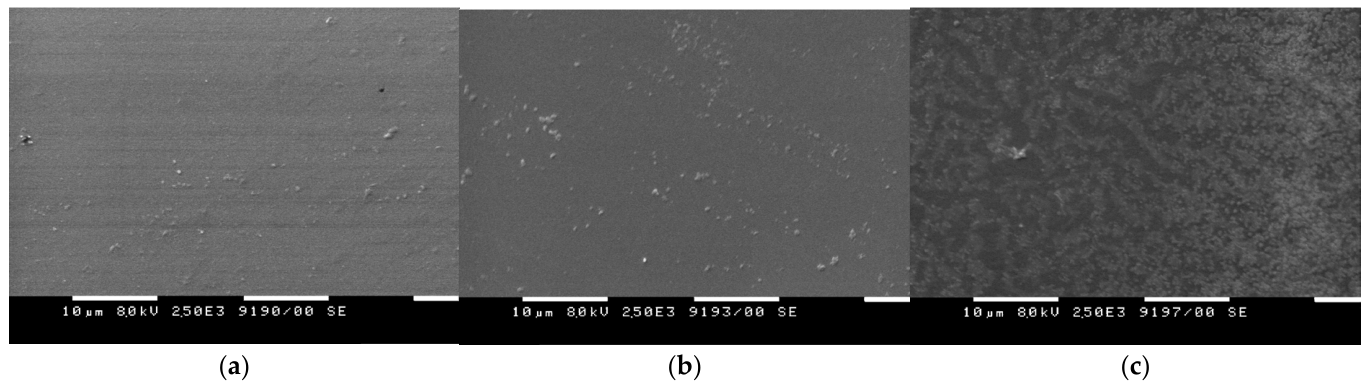
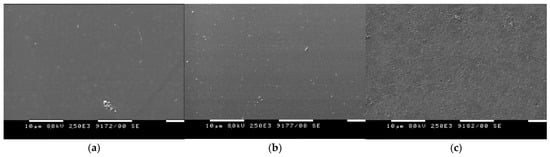
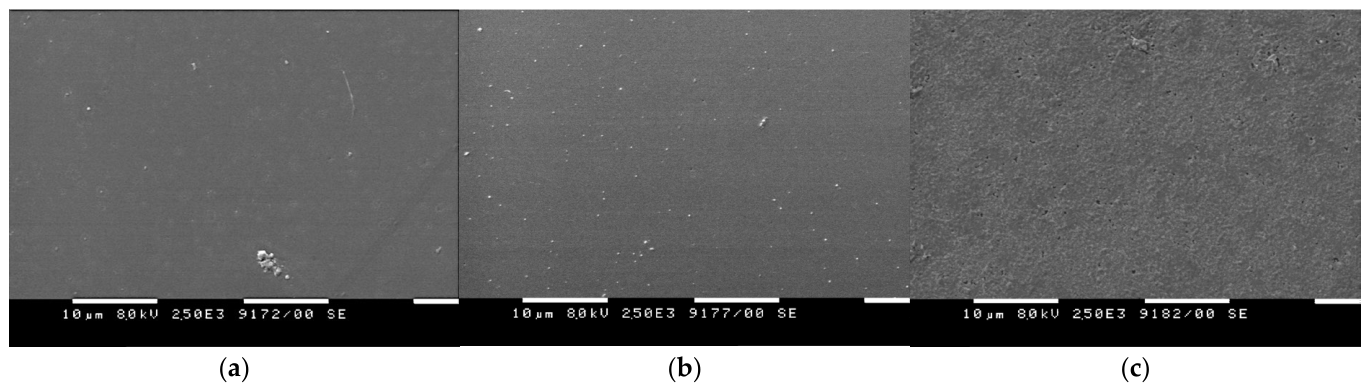
In order to determine the structure and homogeneity of the films after annealing in different conditions, SEM pictures were taken (Figure 10 and Figure 11). After annealing at 200 °C and 300 °C in both dry nitrogen and air, the surface of the studied samples remains largely featureless with some nucleation centers appearing after annealing at 300 °C, which is in agreement with the Raman spectra. After annealing at 340 °C in dry nitrogen (Figure 10c), the sample becomes highly inhomogeneous with at least two separate phases appearing.
Figure 10.
SEM pictures of the surface of the sample deposited with 1.8% oxygen in the sputtering gas annealed in dry N2 at 200 °C (a), 300 °C (b) and 340 °C (c).
Figure 11.
SEM pictures of the surface of the sample deposited with 0% oxygen in the sputtering gas annealed in air at 200 °C (a), 300 °C (b) and 400 °C (c).
On the other hand, the other sample after annealing at 400 °C in air (Figure 11c) also demonstrates some surface structure because of crystallization but consists of only one type of crystal.
3.7. X-Ray Diffraction
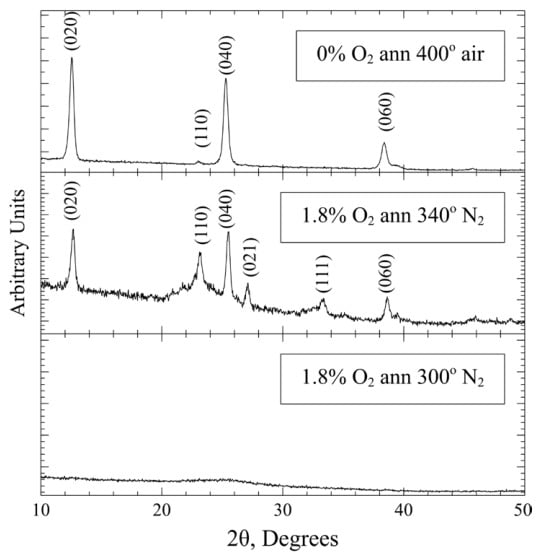
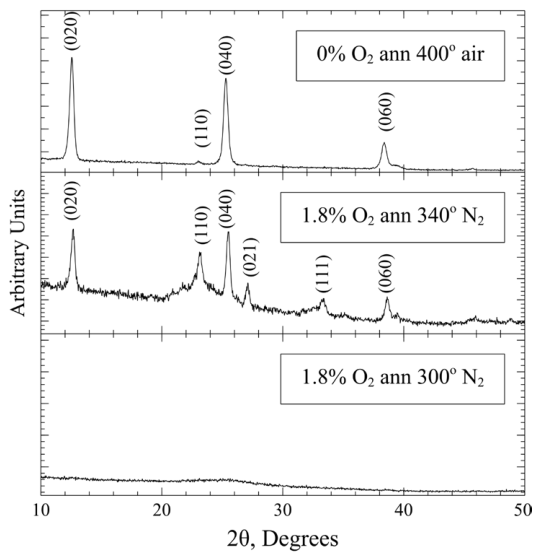
In order to clarify the crystal structure of the studied layers after annealing, XRD spectra were taken from samples annealed at 300 °C in dry nitrogen and air and at the highest temperatures of annealing in the two annealing atmospheres (Figure 12). The lowest pane of the figure shows that after annealing at 300 °C in dry nitrogen, the sample is still amorphous. The spectrum of the 0% O2 sample annealed at 300 °C in air is the same. Annealing of the 1.8% O2 sample in dry N2 at 340 °C exhibited in the middle pane of Figure 12 shows that the layer is partially crystallized in the orthorhombic phase of MoO3, but there is still amorphous phase left. The XRD spectrum shows no evidence for the low symmetry phase observed by Raman spectroscopy in isolated spots (Figure 8a and Figure 9). The reason could be that the amount of this phase is very low and is below the resolution of this experiment. The Raman spectrum was measured under a microscope at the exact spot where one of these precipitates was observed. The sample deposited with 0% O2 and annealed at 400 °C is fully crystallized in the orthorhombic α-MoO3 phase with a preferential orientation perpendicular to the crystal layers that comprise that phase, as demonstrated by the predominance of the (0k0) peaks and the suppression of the rest of the strong diffraction peaks of that phase [8].
Figure 12.
XRD spectra of the samples deposited with 0% O2 and 1.8% O2 in the sputtering gas and annealed at the indicated temperatures in dry N2 and air. The diffraction lines of the MoO3 orthorhombic phase are indicated.
3.8. FTIR Spectra
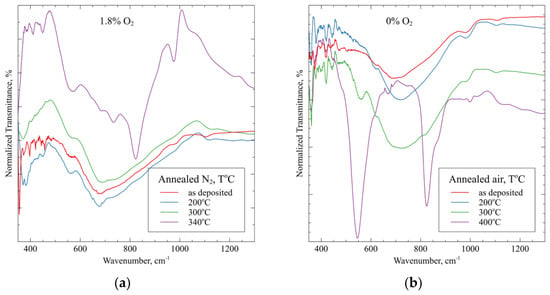
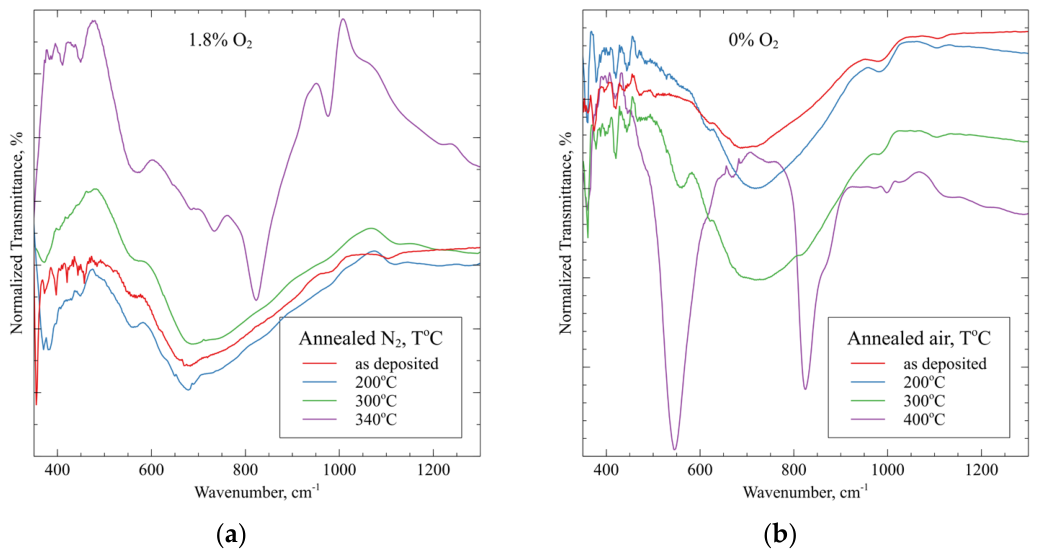
The FTIR spectra of samples deposited with 1.8% oxygen in the sputtering gas and annealed in dry nitrogen are given in Figure 13a. The developments in the other samples annealed in dry nitrogen are similar, and the corresponding spectra are shown in Figure S5 of the Supplementary Materials. The spectra of the as-deposited film and that annealed at 200 °C are dominated by a broad band centered at about 700 cm−1. After annealing at 300 °C for some samples (Figure S5a,c), evidence of crystallization appears, and after annealing at 340 °C, these bands become much more pronounced. The FTIR spectrum is consistent with the spectra in the literature for the orthorhombic structure with three main bands—a weak one at 997 cm−1 due to the terminal Mo=O vibrations, a double band at 825, 866 cm−1 linked to the Mo2-O stretching mode of corner-sharing octahedra, a band centered at about 550 cm−1 attributed to the stretching vibrations of Mo-O-Mo bonds in orthorhombic MoO3 [20].
Figure 13.
(a) FTIR spectra at each annealing temperature of (a) the sample deposited with 1.8% oxygen in the sputtering gas annealed in dry nitrogen and (b) the sample deposited in pure Ar annealed in air at the temperatures indicated in the figure.
The FTIR spectra of the samples annealed in air as a function of the temperature of annealing are shown in Figure 13b and Figure S5d. The layers annealed up to 300 °C contain the main bands characteristic of amorphous MoOx, as in Figure 13a. As demonstrated by the Raman and XRD results, when the samples crystallize in the orthorhombic structure after annealing at 400 °C, the FTIR spectrum is consistent with the spectra for that structure with three main bands—a weak one at 997 cm−1 due to the terminal Mo=O vibrations, a double band 825, 866 cm−1 linked to the Mo2-O stretching mode of corner-sharing octahedra, and a very strong band centered at about 550 cm−1 attributed to stretching vibrations of Mo-O-Mo bonds in orthorhombic MoO3, which is not as pronounced in the samples annealed in dry nitrogen. The positions differ a little from those cited in [20]. There are some weak bands at these positions already in the spectra of the samples annealed at lower temperatures.
4. Discussion
In this study, we investigate the dependence of some parameters of MoOx films on the details of their deposition by reactive magnetron sputtering from an oxide target and the conditions of their subsequent annealing. These parameters include transparency and optical band gap, work function, conductivity and structure. These parameters are of interest when such layers are developed for application as hole transport layers in solar cells.
The as-deposited films are all amorphous suboxides of molybdenum. The fact that they are suboxides is shown by the XPS spectra and the content of Mo5+ in the films. This content is higher than 4.8%, which is the value characteristic for stoichiometric MoO3 at thermodynamic equilibrium [5]. The Raman and FTIR spectra demonstrate that the as-deposited films are amorphous. The highest transparency, band gap and work function are exhibited by the sample deposited with the highest amount of oxygen in the plasma—5%. The work function has been shown to correlate with the content of oxygen vacancies in the MoOx films and increase when their number falls [2]. The rest of the as-deposited samples show lower transparency, band gap and work function as the amount of oxygen in the plasma during deposition is reduced. These parameters have their lowest values for the sample deposited with only Ar. On the other hand, the sample deposited with only Ar and having the highest content of oxygen vacancies is the only one showing conductivity in the as-deposited state. The film’s conductivity is also due to the oxygen vacancies as they generate states in the gap, which become donors and make the film an n-type semiconductor [21].
Annealing in dry nitrogen or air at several temperatures was applied in order to investigate how the structure, optical transparency, band gap, work function and conductivity are influenced by these treatments. After annealing at 200 °C and 300 °C in both nitrogen and air, the samples still remain mostly amorphous. This is clear from the XRD results, which show only a broad featureless structure and no diffraction lines of any crystalline phase. The Raman spectra of the as-deposited samples and those annealed at 200 °C are also characteristic of amorphous layers, but after annealing at 300 °C, they start to show the appearance of some short-range order. In the FTIR spectra, similar developments can be observed. The transparency of the films after annealing at these two temperatures decreases after annealing in dry N2 and increases after annealing in air, which can be expected as the transparency correlates with the oxygen content in the films. This circumstance was observed by other authors [11] and can be seen from the transparency of our as-deposited samples. Annealing in air is expected to increase the oxygen content, while annealing in dry N2 decreases it. The only sample that diverges from these tendencies is the sample sputtered with no oxygen and annealed in dry nitrogen. Its transparency increases with annealing starting from a very low value. It is likely that this initial low transparency is due to defects that are annealed during the heat treatment. However, annealing in air at 300 °C leads to higher transparency of the sample than annealing in nitrogen at the same temperature. Annealing in either atmosphere generally leads to an increase in the optical bad gap of the samples but does not significantly affect the transparency. Annealing in both atmospheres at these two temperatures leads to a decrease in the work function of the samples. Only for the sample deposited with Ar alone and annealed in air is an increase in work function observed. The highest achieved work function after annealing at these medium temperatures is that for the sample deposited without oxygen and annealed in air, but it is lower than those of the as-deposited samples with oxygen added to the plasma. The sheet resistance of the sample deposited with no oxygen in the plasma increases with annealing in both atmospheres. This could be due either to the increase in the oxygen in the lattice or its redistribution by annealing so that some oxygen vacancies are filled. The annealing of the samples with the addition of oxygen during deposition at these two temperatures does not lead to measurable conductivity.
Annealing at the highest temperatures used in both nitrogen and air leads to a major structural change in all annealed samples, which consists of the formation of crystal structures. The samples annealed in nitrogen become inhomogeneous, as seen from the SEM and optical microscope images. Orthorhombic MoO3 crystals form, as evidenced by the XRD, Raman and FTIR spectra. Besides these crystals, there is still some amorphous phase, which can be seen from the Raman and XRD results. There also appears to be some low symmetry suboxide or oxynitride phase in some places, producing a strong Raman spectrum but not registering in the XRD spectra. On the other hand, annealing in air at 400 °C leads to crystallization in the orthorhombic phase with a preferential orientation perpendicular to the crystal layers. These structural changes do not lead to an increase in transparency. One important reason is that the formation of crystallites causes scattering of the light, and that decreases the transparency. This is not compensated for by the increase in the band gap caused by crystallization for most samples. The work function does not improve in comparison with the lower annealing temperatures for both atmospheres used in annealing. There is an important change in conductivity. Some of the samples annealed in nitrogen, which were isolated after annealing at lower temperatures, became marginally conductive. The samples deposited with only argon, which are conductive when as-deposited and after annealing at lower temperatures, became isolating after the crystallization in the orthorhombic MoO3 phase.
The question arises as to whether there are optimal deposition and treatment conditions for magnetron-sputtered MoOx layers from an oxide target for application as HTLs in organic or perovskite solar cells. It depends, of course, on the details of the application—whether the HTL is in the front or in the rear of the cell, or what the energy level of the HOMO of the active layer is. Our results demonstrate that it is difficult to obtain maximum transparency, maximal work function and conductivity at the same time. If the HTL is to be applied in the front of the solar cell, it is crucial for it to be as transparent as possible. In this case, it will be most suitable to use the as-deposited film with 5% O2 in the plasma during deposition. If annealing is included in the deposition of the active layer on top of the HTL, then there are several possibilities. The MoOx layer could be deposited with only Ar and the structure with or without the active layer could be annealed in air. This would achieve high enough transparency and some conductivity as well as the good work function of the HTL. As annealing an active layer in air is rare as they are usually sensitive to moisture and oxygen, a HTL deposited with oxygen added to the plasma could be chosen and the annealing carried out in a glove box. This would keep the HTL transparent enough and with an acceptable work function. If the HTL is used in the rear of the organic or perovskite solar cell, on top of the active layer, it could be deposited with no oxygen in the plasma or with some added oxygen depending on the optimal value of the desired work function and conductivity, as transparency is not important. Some annealing of a layer deposited without oxygen could be applied to improve the work function and keep some conductivity. Annealing at temperatures above 300 °C should only be used for a front HTL, as the organic and perovskite layers are adversely affected by such temperatures. However, the transparency and homogeneity of the films start to deteriorate at these temperatures, as demonstrated by the experimental results.
From the above, it is evident that the different deposition and treatment conditions discussed in this work make it possible to choose the characteristics of the HTL according to the concrete application.
5. Conclusions
Films of MoOx were deposited via magnetron sputtering of a MoO3 target in an Ar or Ar + O2 atmosphere with different amounts of oxygen. All samples were annealed in dry nitrogen at several temperatures and some were annealed in air for comparison. As-deposited and annealed samples were characterized by measuring their optical transmission and reflection, work function, sheet resistance, FTIR, and Raman and XRD spectra. The evolution of these characteristics with deposition and annealing conditions was analyzed and discussed. It has been shown that by varying the amount of oxygen during deposition as well as the temperature and atmosphere during annealing, one can achieve an optimal combination of optical, work function and electrical characteristics of the MoOx films for their application as HTLs in organic or perovskite solar cells.
Supplementary Materials
The following supporting information can be downloaded at: https://www.mdpi.com/article/10.3390/coatings16060720/s1, Figure S1: XPS spectra in the region of the Mo 3d binding energies for the sample deposited with 2.5% oxygen (a) and with 5% oxygen in the gas mixture (b); Figure S2: Optical transmission of MoOx samples deposited with 2.5% O2 (a) and 5% O2 (b) in the sputtering gas annealed in dry nitrogen at the indicated temperatures; Figure S3: Tauc plots of samples deposited with (a) 0% O2, (b) 2.5% O2, (c) 5% O2 in the sputtering gas and annealed in dry N2 as well as samples deposited with (d) 0% O2, (e) 1.8% O2 in the sputtering gas and annealed in air; Figure S4: Raman spectra of of MoOx samples deposited with 2.5% O2 (a) and 5% O2 (b) in the sputtering gas annealed in dry nitrogen at the indicated temperatures; Figure S5: FTIR spectra of samples deposited with (a) 0% O2, (b) 2.5% O2, (c) 5% O2 in the sputtering gas and annealed in dry N2 as well as (d) sample deposited with 1.8% O2 in the sputtering gas and annealed in air.
Author Contributions
Conceptualization, M.S.-V.; methodology, M.S.-V.; formal analysis, M.S.-V., S.S. and S.T.; investigation, M.S.-V., A.B. and V.D.; resources, M.S.-V.; writing—original draft preparation, M.S.-V.; writing—review and editing, S.S., A.B., V.D. and S.T.; funding acquisition, M.S.-V. All authors have read and agreed to the published version of the manuscript.
Funding
This work was accomplished by the Center of Competence for Mechatronics and Clean Technologies “Mechatronics, Innovation, Robotics, Automation and Clean Technologies”—MIRACle, with the financial support of contract No. BG16RFPR002-1.014-0019-C01, funded by the European Regional Development Fund (ERDF) through the “Research, Innovation and Digitalisation for Smart Transformation” (PRIDST) 2021–2027 program. The research infrastructure of Energy Storage and Hydrogen Energetics (NSI ESHER), funded by Bulgarian Ministry of Science and Education, was used for measurements.
Institutional Review Board Statement
Not applicable.
Informed Consent Statement
Not applicable.
Data Availability Statement
The raw data supporting the conclusions of this article will be made available by the authors on request.
Conflicts of Interest
The authors declare no conflicts of interest.
References
- de Castro, I.A.; Datta, R.S.; Ou, J.Z.; Castellanos-Gomez, A.; Sriram, S.; Daeneke, T.; Kalantar-zadeh, K. Molybdenum Oxides—From Fundamentals to Functionality. Adv. Mater. 2017, 29, 1701619. [Google Scholar] [CrossRef] [Scilit]
- Ma, P.; Xu, J.; Wang, C.; Wang, C.; Meng, F.; Xiea, Y.; Wen, S. Enhanced open-circuit voltages and efficiencies: The role of oxidation state of molybdenum oxide buffer layer in polymer solar cells. RSC Adv. 2021, 11, 35141. [Google Scholar] [CrossRef] [Scilit] [PubMed]
- Li, S.; Cao, Y.-L.; Li, W.-H.; Bo, Z.-S. A brief review of hole transporting materials commonly used in perovskite solar cells. Rare Met. 2021, 40, 2712–2729. [Google Scholar] [CrossRef] [Scilit]
- Parashar, P.K.; Komarala, V.K. Sputter deposited sub-stochiometric MoOx thin film as hole-selective contact layer for silicon based heterojunction devices. Thin Solid Films 2019, 682, 76–81. [Google Scholar] [CrossRef] [Scilit]
- La Manna, S.; Franzo, G.; Terrasi, A.; Condorelli, G.G.; Miritello, M. Stoichiometry modulation of molybdenum oxide thin films by direct sputtering for energy applications. Surf. Coat. Technol. 2025, 496, 131663. [Google Scholar] [CrossRef] [Scilit]
- Lopez-Pinto, N.; Tom, T.; Bertomeu, J.; Asensi, J.M.; Ros, E.; Ortega, P.; Voz, C. Deposition and characterization of sputtered molybdenum oxide thin films with hydrogen atmosphere. Appl. Surf. Sci. 2021, 563, 150285. [Google Scholar] [CrossRef] [Scilit]
- Jasieniak, J.J.; Seifter, J.; Jo, J.; Mates, T.; Heeger, A.J. A solution-processed MoOx anode Interlayer for use within organic photovoltaic devices. Adv. Funct. Mater. 2012, 22, 2594–2605. [Google Scholar] [CrossRef] [Scilit]
- Han, B.; Gao, M.; Wan, Y.; Li, Y.; Song, W.; Ma, Z. Effect of post-annealing on the properties of thermally evaporated molybdenum oxide films: Interdependence of work function and oxygen to molybdenum ratio. Mater. Sci. Semicond. Process. 2018, 75, 166–172. [Google Scholar] [CrossRef] [Scilit]
- Fan, X.; Fang, G.; Qin, P.; Sun, N.; Liu, N.; Zheng, Q.; Cheng, F.; Yuan, L.; Zhao, X. Deposition temperature effect of RF magnetron sputtered molybdenum oxide films on the power conversion efficiency of bulk-heterojunction solar cells. J. Phys. D Appl. Phys. 2011, 44, 045101. [Google Scholar] [CrossRef] [Scilit]
- Griffin, J.; Buckley, A.R. Reactive sputtering: A method for controlling the stoichiometry and energy level structure of amorphous molybdenum oxide films. MRS Online Proc. Libr. 2012, 1443, 34–40. [Google Scholar] [CrossRef] [Scilit]
- Subbarayudu, S.; Madhavi, V.; Uthanna, S. Post-deposition annealing controlled structural and optical properties of RF magnetron sputtered MoO3 films. Adv. Mater. Lett. 2013, 4, 637–642. [Google Scholar] [CrossRef] [Scilit]
- Sendova-Vassileva, M. Properties of magnetron sputtered molybdenum oxide for application in solar cells as a function of deposition conditions. J. Phys. Conf. Ser. 2026, 3194, 012001. [Google Scholar] [CrossRef] [Scilit]
- Jiang, Y.; Cao, S.; Lu, L.; Du, G.; lin, Y.; Wang, J.; Yang, L.; Zhu, W.; Li, D. Post-annealing effect on optical and electronic properties of thermally evaporated MoOX thin films as hole-selective contacts for p-Si solar cells. Nanoscale Res. Lett. 2021, 16, 87. [Google Scholar] [CrossRef] [Scilit] [PubMed]
- Zhang, C.C.; Zheng, L.; Zhang, Z.M.; Dai, R.C.; Wang, Z.P.; Zhang, J.W.; Ding, Z.J. Raman studies of hexagonal MoO3 at high pressure. Phys. Status Solidi B 2011, 248, 1119–1122. [Google Scholar] [CrossRef] [Scilit]
- Moura, J.V.B.; Silveira, J.V.; da Silva Filho, J.G.; Souza Filho, A.G.; Luz-Lima, C.; Freire, P.T.C. Temperature induced phase transition in h-MoO3: Stability loss mechanism uncovered by Raman spectroscopy and DFT calculations. Vib. Spectrosc. 2018, 98, 98–104. [Google Scholar] [CrossRef] [Scilit]
- Medeiros Leao, G.S.; Silva Ribeiro, M.D.; de Freitas Filho, R.L.; Saraiva, L.B.; Pena-Garcia, R.R.; de Carvalho Teixeira, A.P.; Lago, R.M.; Freitas, F.A.; de Sa Barros, S.; Junior, S.D.; et al. The synergic effect of h-MoO3, α-MoO3, and β-MoO3 phase mixture as a solid catalyst to obtain methyl oleate. ACS Appl. Mater. Interfaces 2024, 16, 60103–60121. [Google Scholar] [CrossRef] [Scilit] [PubMed]
- Drinek, V.; Klementova, M.; Palatinus, L.; Dytrych, P.; Fajgar, R.; Jandová, V.; Koštejn, M.; Kupčík, J. Synthesis and characterization of nanostructured molybdenum oxynitride films fabricated by sub-atmospheric chemical vapor deposition. J. Alloys Compd. 2019, 808, 151470. [Google Scholar] [CrossRef] [Scilit]
- Kumari, L.; Ma, Y.-R.; Tsai, C.-C.; Lin, Y.-W.; Wu, S.Y.; Cheng, K.-W.; Liou, Y. X-ray diffraction and Raman scattering studies on large-area array and nanobranched structure of 1D MoO2 nanorods. Nanotechnology 2007, 18, 115717. [Google Scholar] [CrossRef] [Scilit]
- Ivanova, T.; Gesheva, K.A.; Szekeres, A. Structure and optical properties of CVD molybdenum oxide films for electrochromic application. J. Solid State Electrochem. 2002, 7, 21–24. [Google Scholar] [CrossRef] [Scilit]
- Seguin, L.; Figlarz, M.; Cavagnat, R.; Lassegues, J.C. Infrared and Raman spectra of MoO3 molybdenum trioxides and MoO3·xH2O molybdenum trioxide hydrates. Spectrochim. Acta Part A Mol. Biomol. Spectrosc. 1995, 51, 1323–1344. [Google Scholar] [CrossRef] [Scilit]
- Peelaers, H.; Chabinyc, M.L.; Van de Walle, C.G. Controlling n-type doping in MoO3. Chem. Mater. 2017, 29, 2563–2567. [Google Scholar] [CrossRef] [Scilit]
Disclaimer/Publisher’s Note: The statements, opinions and data contained in all publications are solely those of the individual author(s) and contributor(s) and not of MDPI and/or the editor(s). MDPI and/or the editor(s) disclaim responsibility for any injury to people or property resulting from any ideas, methods, instructions or products referred to in the content. |
© 2026 by the authors. Licensee MDPI, Basel, Switzerland. This article is an open access article distributed under the terms and conditions of the Creative Commons Attribution (CC BY) license.