


Highlights
What are the main findings?
- Material sourcing and rammed technology are linked to compressive performance.
- Aggregate characteristics were incorporated into DEM modeling of rammed earth.
- Tests and DEM simulations revealed the mesoscopic basis of mechanical behavior.
What are the implications of the main findings?
- The results support mechanical assessment of heritage rammed-earth sites.
- The aggregate-based DEM model helps interpret strength and failure differences.
- The findings provide guidance for conservation of rammed-earth Great Wall sites.
Abstract
Heritage rammed earth is a special soil material formed by manually selecting and ramming locally available Quaternary surface deposits layer by layer. However, the quantitative influence of material sourcing and rammed technology on the compressive properties of heritage rammed earth remains insufficiently understood, which limits the mechanical assessment and conservation planning of rammed earth sites. In this study, undisturbed rammed earth from 15 Ming Great Wall sites in Northwest China was investigated. Field 3D scanning, particle-size analysis, uniaxial compression testing, mesoscopic structural observation, and DEM analysis were combined to evaluate the effects of material characteristics and rammed technology on the compressive properties of heritage rammed earth. The results show clear regional differences in material characteristics and rammed technology parameters across the 15 sites. Across the five occurrence regions from the Extremely Arid Area to the Semi-Humid Area, dry density, silt fraction, curvature coefficient, and ramming pit distribution area ratio generally decreased, whereas clay and colloidal particle fraction, , , and rammed modulus generally increased. These variations were accompanied by changes in internal fabric, including aggregate proportion, coordination-number difference, high-stress particle proportion, and force-chain particle proportion. The peak stress and failure strain ranged from 0.48 to 1.01 MPa and from 0.03 to 0.07, respectively. Both parameters showed a decreasing regional trend from the extremely arid area to the semi-humid area, following the sequence: extremely arid area, arid area, semi-arid area, cold and humid area, and semi-humid area. From the Extremely Arid Area to the Semi-Humid Area, the shear failure mode changed from single-fork to mixed double-fork and then to intersecting double-fork. Regression analysis further showed that material and rammed technology parameters were closely related to mesoscopic structural parameters, with R2 values generally greater than 0.75. These findings suggest that the regional differences in compressive behavior were closely associated with variations in material sourcing, rammed technology, internal fabric, and the load-bearing structure of rammed earth.
1. Introduction
Heritage rammed earth is commonly formed by manually selecting and ramming locally available Quaternary surface deposits layer by layer. Its mechanical properties are strongly influenced by material sourcing and rammed technology [1,2]. However, the quantitative influence of material sourcing and rammed technology on the mechanical behavior of heritage rammed earth remains insufficiently understood, which limits scientific understanding of deterioration mechanisms and the development of conservation strategies for earthen heritage sites. The Ming Great Wall extends from Shanhai Pass in the east to Jiayu Pass in the west and is one of the largest and best-preserved Great Wall systems in Chinese history [3]. In contrast to the masonry-dominated sections of the Ming Great Wall in eastern China [4,5], the northwestern sections were mainly constructed using rammed earth. The principle of adapting to local conditions and using locally available materials is a distinctive feature of these sections [6]. Owing to their representative material selection and well-developed rammed technology [7], the rammed earth sections of the Ming Great Wall in Northwest China provide a suitable study subject for investigating the compressive properties of heritage rammed earth.
Although research on the mechanical properties of heritage rammed earth remains relatively limited, numerous studies on the physical and mechanical properties of soils provide useful insights for rammed earth research. The physical and mechanical properties of soils are influenced by the contents of coarse and fine particles [8,9,10], the structure and interlocking mode of soil particles [11,12,13], and structural anisotropy [14,15]. Zhang et al. [16] prepared five sand samples with different particle-shape parameters for compression tests and found that differences in particle shape are an important factor affecting the mechanical properties of sand. During resonance-column tests on coral sand–fine particle mixtures used in island-reef hydraulic fill projects, Wu et al. [17] observed that the fine particle content directly influenced the contact modes between soil particles, which, in turn, modified the force-transfer pathway of the soil skeleton. These changes resulted in variations in both the dynamic shear modulus and damping ratio. Liu et al. [18] compared the macroscopic mechanical behavior and microscopic structure of expansive soil in semi-arid areas and found that environmental action can damage the soil microstructure and alter its particle-size distribution, as reflected by a slight decrease in clay content, a slight increase in silt content, and relatively stable sand content. At the same time, the expansion and contraction of clay minerals can reduce soil cohesion and shear strength. Based on mesoscopic structural tests, Wei et al. [19] compared unsaturated triaxial shear results for undisturbed and remolded loess and found that pore structure and cementation state strongly influence the structural strength of soil. Through undrained triaxial shear tests and nuclear magnetic resonance scanning, An et al. [20] found that climatic conditions can damage soil pore structure and cementation, and that soil mechanical properties evolve consistently with changes in pore structure.
In addition to laboratory testing, the discrete element method has been widely used in geomechanics [21,22,23] because it can reproduce the evolution of particle structures from a mesoscopic perspective [24,25,26]. Gong et al. [27] and Wang et al. [28] pointed out that changes in fine-particle content can change soil contact types and further affect soil skeleton structure, coordination number, and load-transfer mode. Zhang et al. [29] investigated particle orientation and coordination number under different deposition modes and found that particle arrangement and contact density are major contributors to soil anisotropy, while differences in primary anisotropy influence the strength parameters of soil. Research methods for investigating the mechanical properties and mesoscopic mechanisms of geomaterials have therefore been well developed [30,31,32,33,34]. However, this methodological progress has not been fully extended to heritage rammed earth. Existing studies on the mechanical properties of heritage rammed earth have mainly relied on laboratory testing, and the use of numerical simulation remains limited. As a result, the mesoscopic mechanisms by which material sourcing and rammed technology influence the compressive behavior and failure characteristics of heritage rammed earth remain insufficiently clarified.
To address these issues, undisturbed rammed earth from 15 Ming Great Wall sites in Northwest China was investigated in this study. Three-dimensional scanning was used to characterize ramming traces, particle composition tests were conducted to determine material characteristics, uniaxial compression tests were performed to evaluate compressive behavior, and microscopic tests were used to identify mesoscopic fabric features. Based on these experimental results, a PFC2D model was established to analyze the mesoscopic behavior of rammed earth under different regional material and rammed-technology conditions. By combining field investigation, laboratory testing, microscopic characterization, and numerical simulation, this study links material sourcing and rammed technology with mesoscopic fabric and compressive response, thereby providing a multi-scale interpretation of the mechanical behavior and failure characteristics of heritage rammed earth.
2. Research Methods
2.1. Selection of Study Sites
Heritage rammed earth is a special soil material formed by manual selection of materials and layer-by-layer ramming. Considering differences in material sourcing, regional environment, and rammed technology, 15 typical rammed-earth sites along the Ming Great Wall in Northwest China were selected as study sites, including the Jiayuguan Ming Great Wall (MJYG), Yongchang Ming Great Wall (MYC), Gulang Ming Great Wall (MGL), Huzhu Ming Great Wall (MHZT), and Weinan Ming Great Wall (MGC), among others. These sites are distributed across Gansu, Qinghai, and Shaanxi provinces and cover five occurrence regions: Extremely Arid Area, Arid Area, Semi-Arid Area, Cold and Humid Area, and Semi-Humid Area. They therefore cover the main distribution range of Ming-dynasty rammed-earth Great Wall sites in Northwest China and provide a geographical basis for capturing regional variability in material sourcing and rammed technology.
2.2. Investigation of Rammed Technology
The rammed-layer interface morphology of the 15 rammed-earth sites was investigated at recently collapsed and exposed sections of the walls. These exposed sections were selected because they allowed the original rammed-layer interfaces and ramming pits to be observed clearly. For each site, three exposed positions with well-preserved rammed-layer interfaces were selected, and approximately 15 ramming pits were measured at each position. Before measurement, loose surface soil was carefully removed to reduce disturbance from external deposits. Interfaces or ramming pits that were obviously damaged, severely weathered, or poorly preserved were excluded from the statistical analysis.
The rammed-layer thickness, ramming-pit diameter, and ramming-pit depth were measured using a vernier caliper with an accuracy of 0.02 mm. The measured values from the selected positions were averaged to represent the rammed characteristics of each site. To further obtain three-dimensional information on the rammed-layer interface, high-resolution 3D scanning was performed using a SHINING EinScan Pro 2X handheld 3D scanner (SHINING 3D Tech Co., Ltd., Hangzhou, China) in the handheld fine-scan mode. During field acquisition, the working distance was maintained at approximately 0.3–0.5 m, with a nominal single-scan accuracy of 0.045 mm, a volumetric accuracy of 0.045 mm + 0.3 mm/m, and a point spacing of 0.2–3.0 mm. These settings were sufficient to capture centimeter-scale interface undulations and millimeter-scale ramming pits. The interface point-cloud data were imported into Geomagic Studio 2014 (3D Systems, Rock Hill, SC, USA) for alignment and marking, and the processed point-cloud data were then imported into Origin 2018 (OriginLab Corporation, Northampton, MA, USA) to generate the original rammed-layer topography maps.
2.3. Test Methods
2.3.1. Basic Physical Properties Tests
The basic physical properties of the rammed earth samples were determined according to the Standard for Geotechnical Testing Method (GB/T 50123-2019) [35]. For each site, three replicate tests were conducted for each basic physical property, and the average values were used for subsequent analysis. The density was measured using the wax-sealing method. Particle-size distribution was determined using a combination of sieving and hydrometer analyses. Representative samples of 15–30 g were taken from each rammed earth sample for water-content testing. The specific gravity was measured using the pycnometer method. If abnormal deviations occurred among parallel measurements, the corresponding test was checked and repeated according to the standard.
2.3.2. Unconfined Compression Tests
Unconfined compression tests were carried out using a CSS-WAW300D microcomputer-controlled electronic universal testing machine (Changchun Testing Machine Research Institute Co., Ltd., Changchun, China). For each site, three intact cube specimens were prepared and tested. The repeatability of the tests was evaluated based on the peak stress, failure strain, and overall stress–strain curve shape. When the three specimens from the same site showed only small differences, the most representative stress–strain curve was selected for subsequent analysis. Because archeological rammed earth blocks are generally dense, hard, brittle, scarce, and limited in integrity, preparing standard cylindrical specimens may easily cause disturbance, cracking, or sample loss. Therefore, cube specimens with dimensions of 70.7 mm × 70.7 mm × 70.7 mm were prepared for testing, and all specimens were tested under the same geometric and loading conditions to ensure comparability across the 15 sites.
2.3.3. Mesoscopic Structural Observations
Mesoscopic structural observations were carried out using a JSM-5600LV low-vacuum scanning electron microscope (JEOL Ltd., Tokyo, Japan). For each site, three specimens were selected for SEM observation. For each specimen, ten representative fields of view were selected, and images were acquired at magnifications of 500× and 2000× for each field of view. After acquisition, the SEM images were imported into PCAS 2327 software and binarized for quantitative analysis. The extracted mesoscopic structural information included particle morphology, particle arrangement, and particle contact mode.
3. Test Results
3.1. Basic Material Characteristics of Heritage Rammed Earth
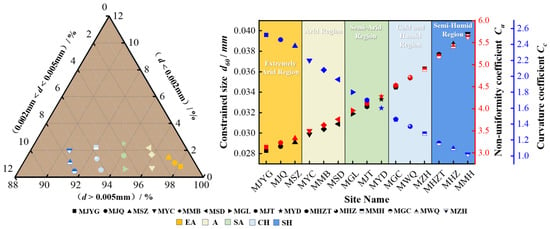
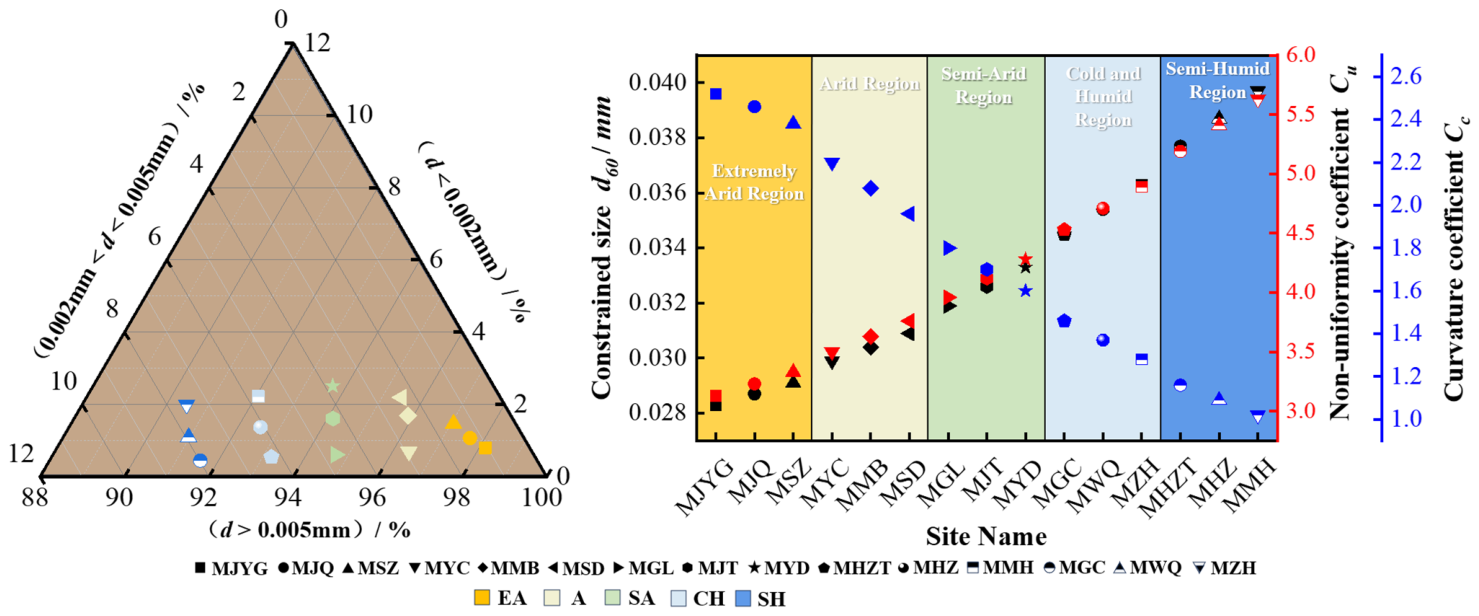
The basic physical properties of rammed earth from the 15 sites are shown in Figure 1 and Table 1. The dry density ranged from 1.48 to 1.70 g·cm−3, the water content ranged from 1.18% to 3.66%, and the specific gravity ranged from 2.60 to 2.70. The rammed earth was mainly composed of fine particles, including grain groups of d 0.005 mm, 0.002 mm d 0.005 mm and d 0.002 mm. The constrained size ranged from 0.028 to 0.040 mm, indicating that the particle composition was dominated by silt and clay fractions. In addition, the coefficient of uniformity ranged from 3.0 to 5.7, and the coefficient of curvature ranged from 1.0 to 2.6. Clear region-dependent differences were observed in dry density, grain-size composition, , , and .
Figure 1.
Distribution of particle composition of rammed earth at 15 sites.
Table 1.
Test results of basic physical properties of rammed earth.
The dry density, silt fraction, and generally decreased in the order of Extremely Arid Area > Arid Area > Semi-Arid Area > Cold and Humid Area > Semi-Humid Area, whereas the clay and colloidal particle fraction, , and showed the opposite trend. These differences indicate that the material composition of rammed earth was closely related to locally available surface deposits and material selection during construction, rather than being randomly distributed across the 15 sites.
3.2. Rammed Technology Characteristics of the Sites
Heritage rammed earth was constructed by layer-by-layer ramming, which leaves characteristic rammed-layer interfaces and ramming pits. These morphological features record the rammed technology used during construction and are closely related to the compaction state of rammed earth. To quantify the rammed technology characteristics of the 15 sites, field investigation and high-resolution 3D scanning were conducted on exposed rammed-layer interfaces. The rammed-layer thickness, ramming-pit diameter, and ramming-pit depth were measured using a vernier caliper.
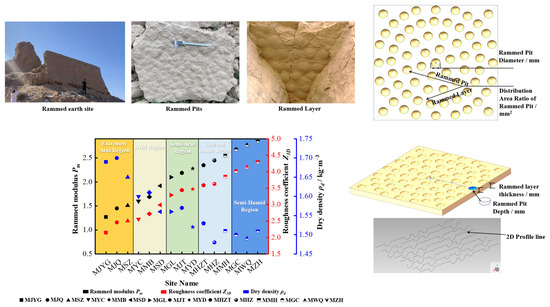
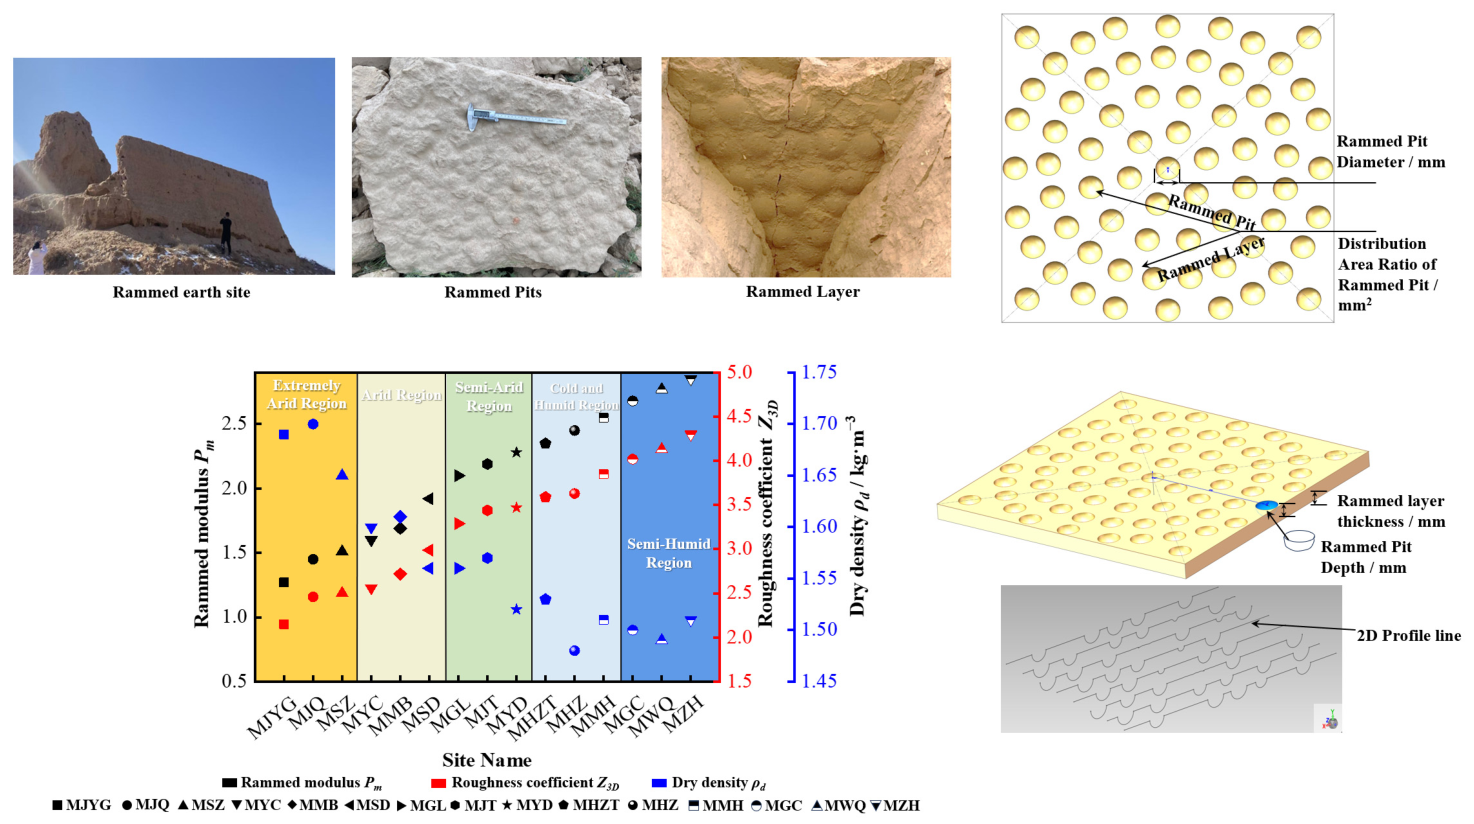
The ramming-pit distribution area ratio was then obtained using the plane projection method (Figure 2). The ramming-pit distribution area ratio, , is defined as the ratio of the total projected area of the ramming pits, , on the rammed-layer interface to the actual area of the rammed layer, . This parameter characterizes the areal distribution of ramming pits on the interface. A larger indicates a wider distribution of ramming pits, whereas a smaller indicates a more limited distribution of ramming pits. The formula for the distribution area ratio of the rammed pit is as follows.
Figure 2.
Field measurement and 3D scanning of rammed-layer interfaces.
Finally, the method proposed by Barton [36] and Tse [37] is adopted to calculate the value of the two-dimensional section line of the rammed-layer interface.
where L represents the total length of the interface profile line; and are the coordinates of each point on the profile line; and is the total number of sample points. The three-dimensional roughness of the rammed-layer interface can be obtained by averaging the roughness values of multiple section lines.
where is the three-dimensional roughness of the rammed-layer interface, is the roughness of each section line, and m is the number of section lines. The Barton–Tse method was originally proposed for quantifying rock-joint roughness. In this study, it was not used as a rock-joint strength model, but only as a geometric index to describe the undulation of rammed-layer interfaces. Although rammed-layer interfaces are frictional–cohesive earthen interfaces rather than rock joints, their surface morphology can still be represented by height variations along section lines. Therefore, and were adopted in this study to compare the relative roughness of rammed-layer interfaces among different sites.
The three-dimensional topographic parameters calculated using Equations (1)–(3) are listed in Table 2. The rammed-layer thickness ranged from 10.38 to 15.61 cm, the ramming-pit diameter ranged from 5.78 to 9.37 cm, and the ramming-pit depth ranged from 1.31 to 2.56 cm. The ramming-pit distribution area ratio ranged from 0.42 to 0.82, and ranged from 2.15 to 3.63. Meanwhile, the rammed layer thickness, rammed-pit diameter, rammed-pit depth, and roughness coefficient showed region-dependent differences among the five occurrence regions. From the Extremely Arid Area to the Semi-Humid Area, these parameters generally increased, whereas the ramming-pit distribution area ratio showed the opposite tendency.
Table 2.
Morphological parameters of rammed-layer interfaces at the 15 sites.
To further characterize the rammed technology of heritage rammed earth, the rammed modulus was defined using the roughness coefficient and dry density.
where is the roughness coefficient of the rammed layer, and is the dry density of the rammed earth. Since is a geometric roughness coefficient and is expressed in g/cm3, the unit of is cm3/g. Dimensionally, this corresponds to m3/kg in SI units. is an empirical index rather than a mechanical modulus in the conventional sense. It represents the rammed-layer interface roughness per unit of dry density and is used to jointly characterize the interface undulation and compactness of rammed earth. A lower indicates a relatively smoother rammed-layer interface combined with higher dry density, whereas a higher indicates stronger interface undulation relative to the compactness of the material.
The regional variation in rammed modulus among the 15 sites is shown in Figure 2. A lower roughness coefficient combined with a higher dry density resulted in a smaller . Overall, increased in the order of Extremely Arid Area < Arid Area < Semi-Arid Area < Cold and Humid Area < Semi-Humid Area.
3.3. Macromechanical Characteristics of Heritage Rammed Earth
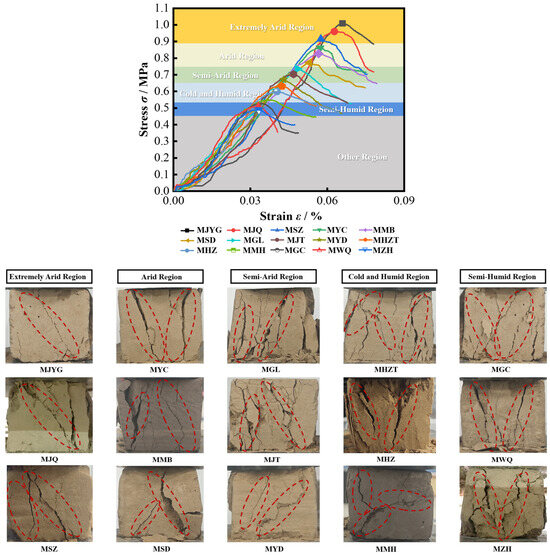
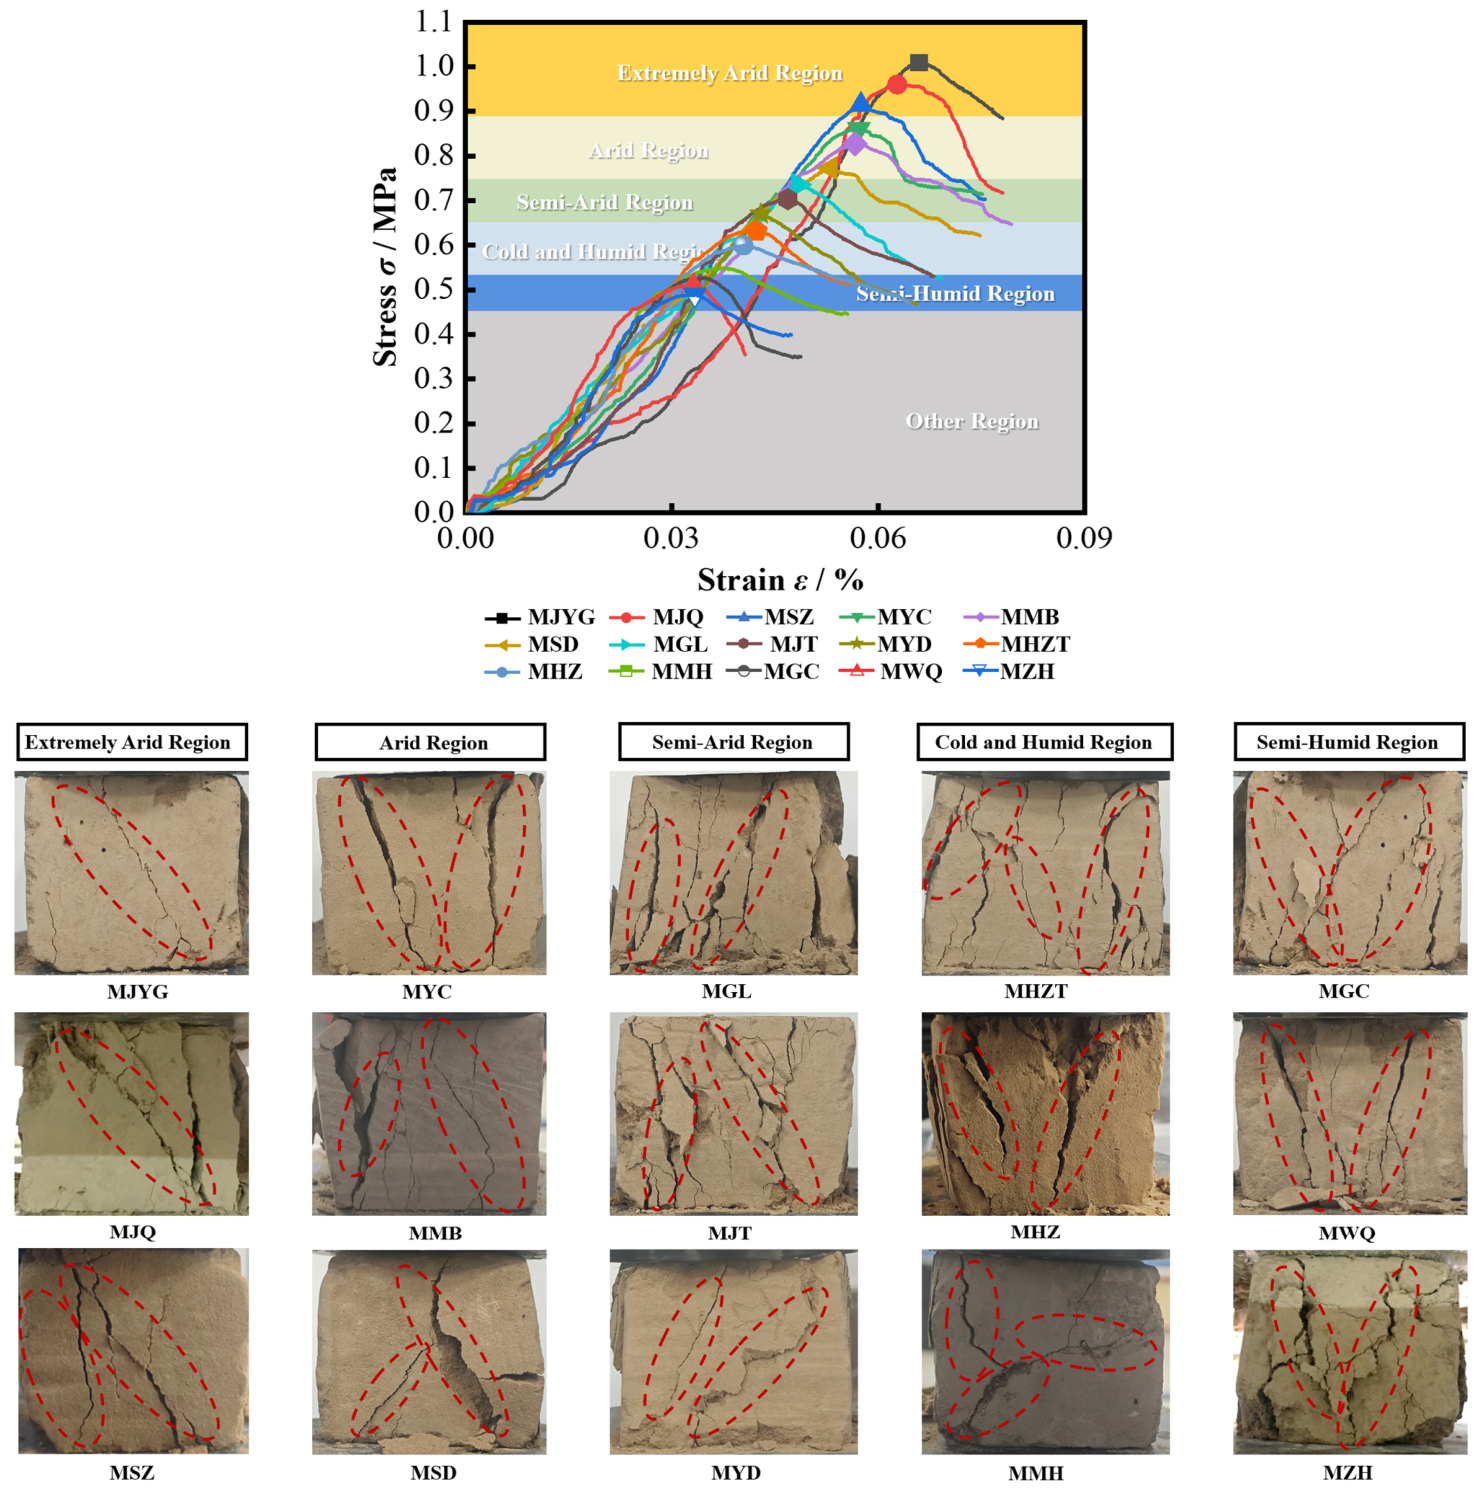
Uniaxial compression tests were carried out on heritage rammed earth from the 15 sites, and the stress–strain curves and failure modes are shown in Figure 3. All samples exhibited strain-softening behavior. The peak stress ranged from 0.48 to 1.01 MPa, the corresponding failure strain ranged from 0.03 to 0.07, and the elastic modulus ranged from 14 to 16 MPa. The failure modes were classified into three types: single-fork shear failure, mixed double-fork shear failure, and intersecting double-fork shear failure. The failure modes also differed among occurrence regions.
Figure 3.
Stress–strain curves and typical failure modes of rammed earth from the 15 sites (red circles indicate the main crack-development regions).
Samples from the Extremely Arid Area mainly showed single-fork shear failure, whereas those from the Semi-Humid Area mainly showed intersecting double-fork shear failure. Samples from the Arid Area, Semi-Arid Area, and Cold and Humid Area mainly showed mixed double-fork shear failure. The development range of surface fractures increased in the order of Extremely Arid Area < Arid Area < Semi-Arid Area < Cold and Humid Area < Semi-Humid Area. In addition, the peak stress and failure strain exhibited clear regional differences among the five occurrence regions. Both parameters decreased in the order of Extremely Arid Area > Arid Area > Semi-Arid Area > Cold and Humid Area > Semi-Humid Area. This trend indicates that samples located in drier occurrence regions generally had higher compressive resistance and greater deformation capacity before failure.
3.4. Mesoscopic Structural Characteristics of Heritage Rammed Earth
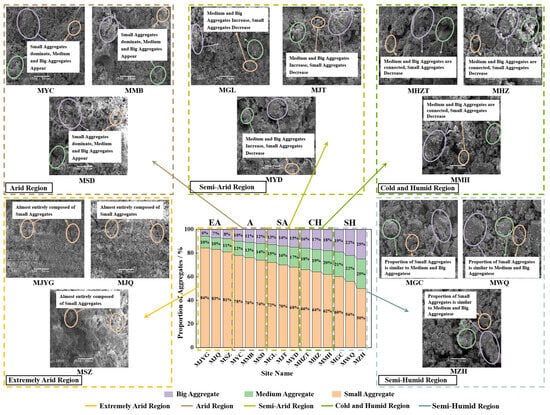
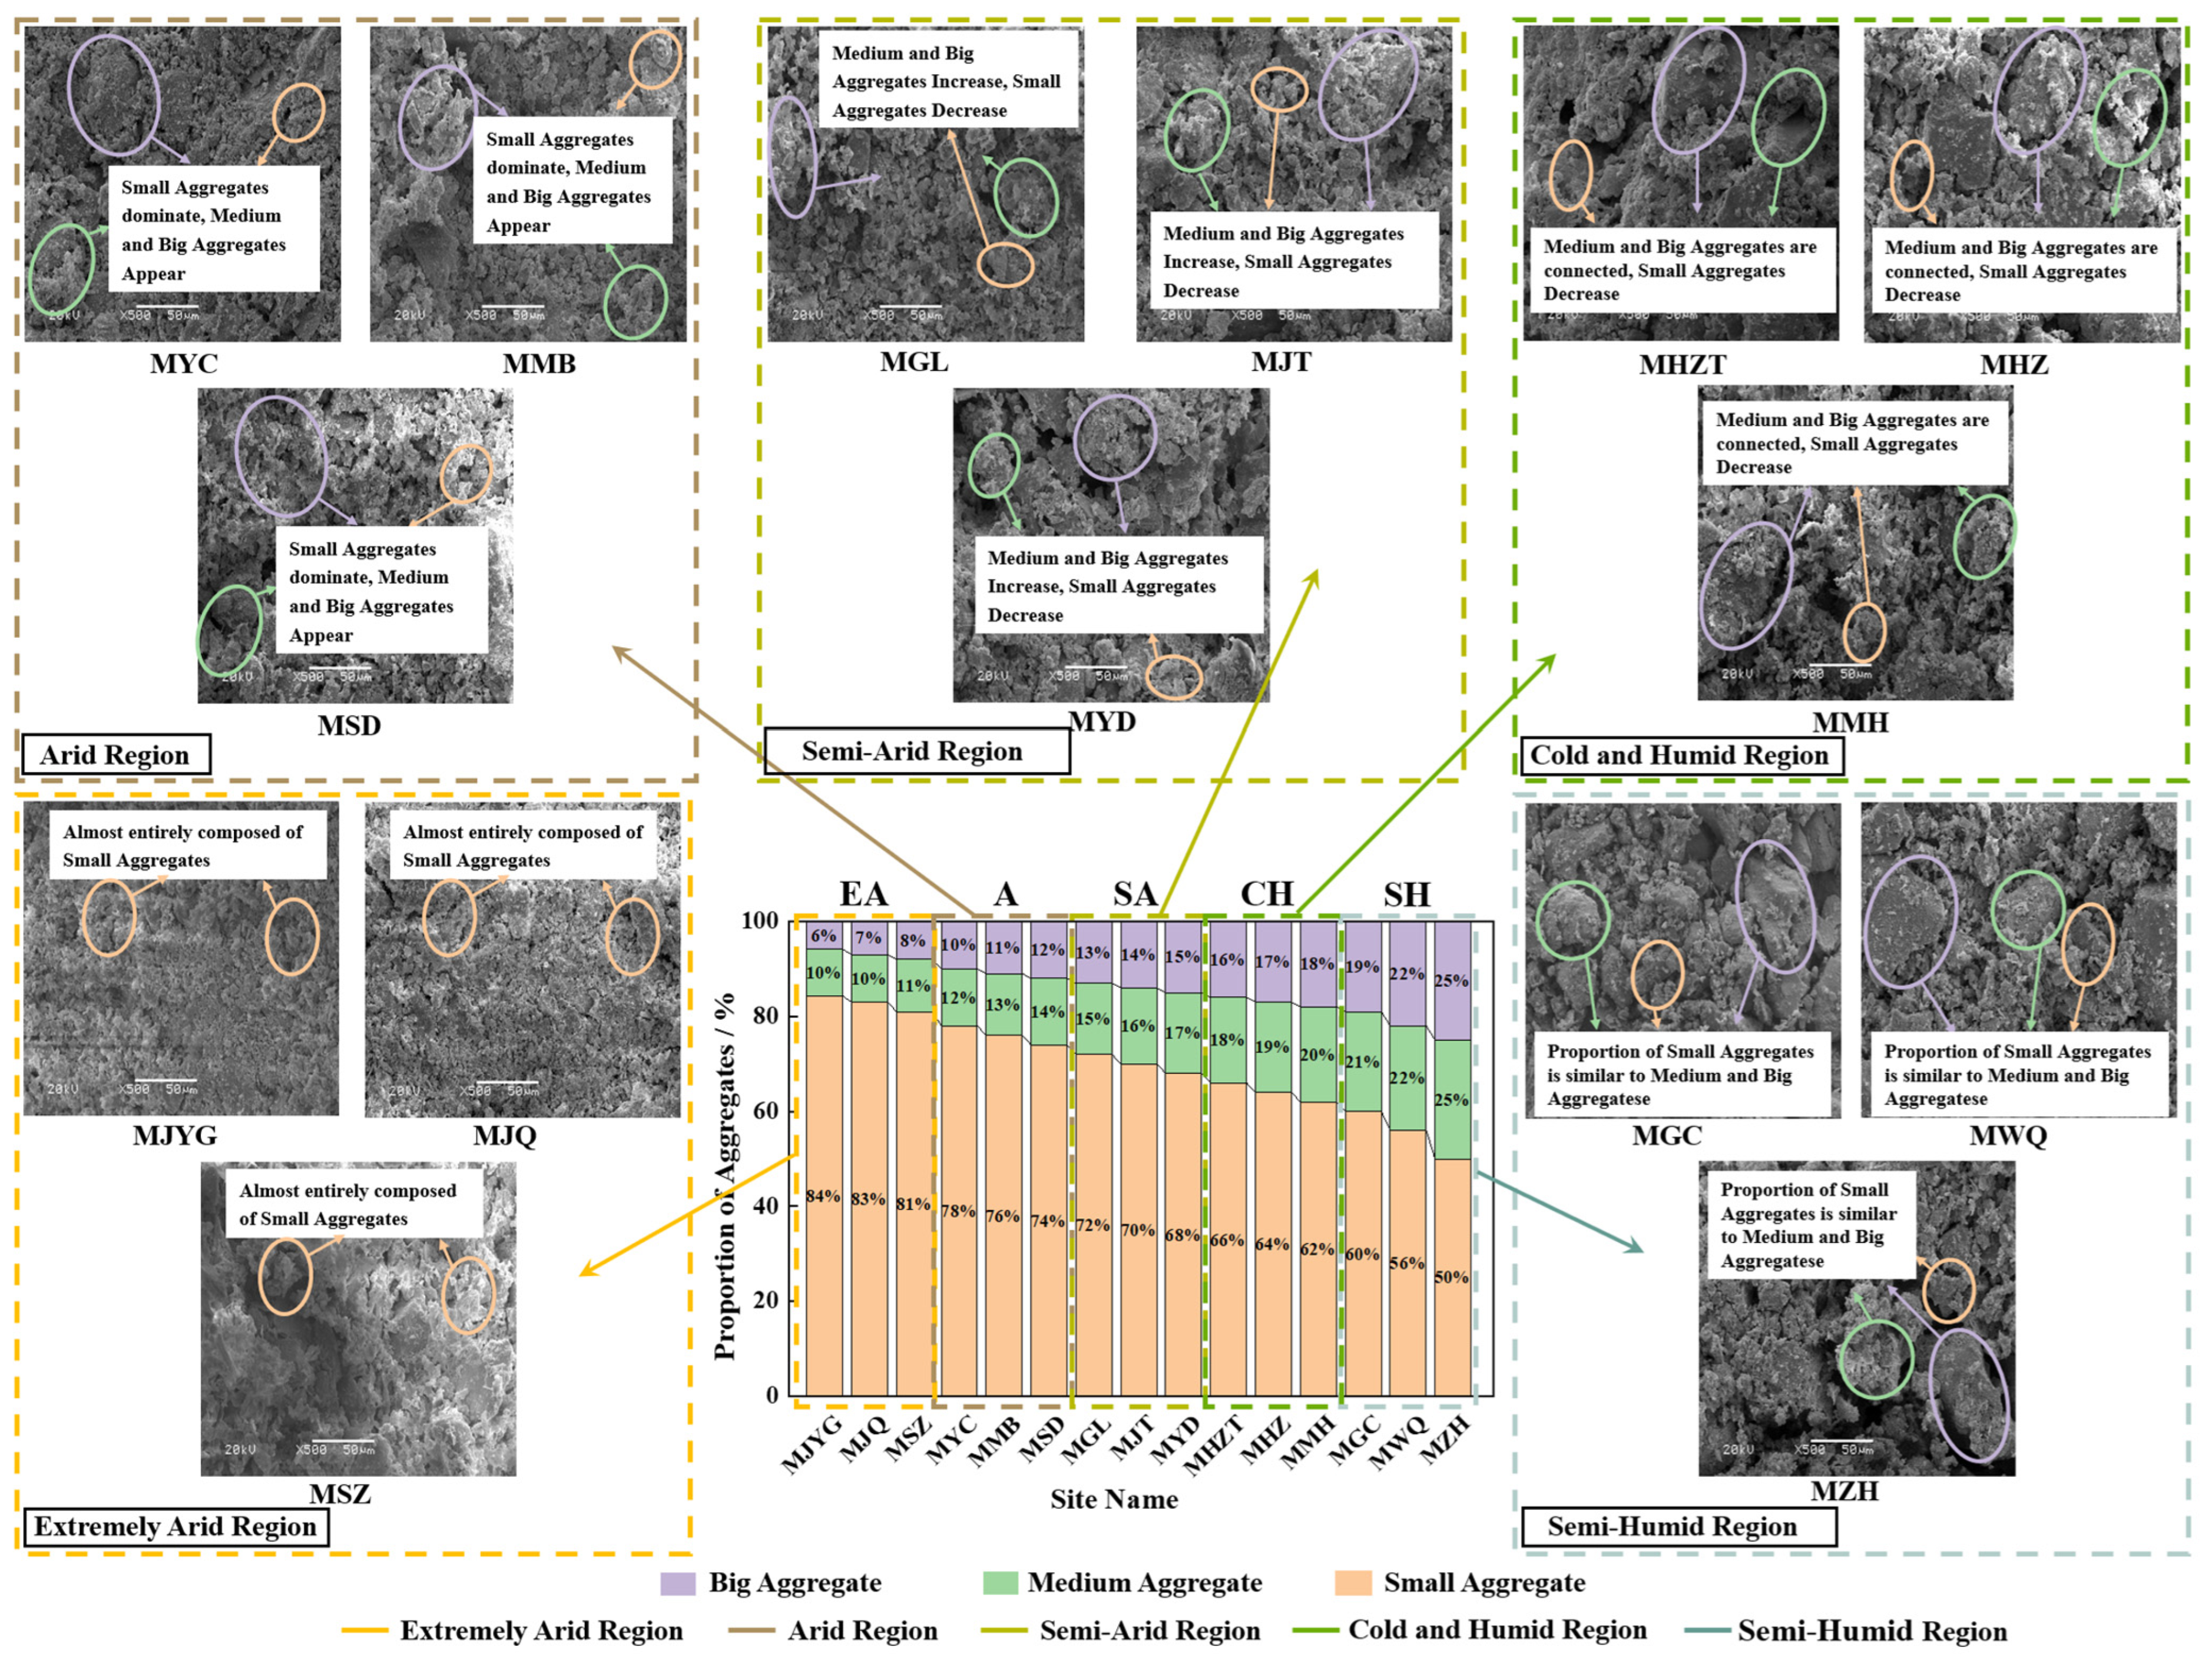
The SEM image analysis results of heritage rammed earth from the 15 sites are shown in Figure 4. The rammed earth particles were granular and closely interlocked, forming an evident aggregated structure. The aggregates were mainly composed of silt, clay, and colloidal particles. According to the equivalent diameter , the aggregates in heritage rammed earth can be divided into big aggregates ( μm), medium aggregates (18 μm) and small aggregates ( μm). The thresholds of 18 μm and 35 μm were determined based on the equivalent-diameter distribution extracted from SEM images, with reference to the hierarchical concept of soil microaggregates reported in previous studies. The same thresholds were applied to all 15 sites to ensure comparability of aggregate-size composition. Small aggregates were closely packed and were dominated by face-to-face and face-to-edge contacts, whereas medium and large aggregates were mainly characterized by face-to-edge and point-to-surface contacts. Furthermore, the aggregate-size distribution varied among the five occurrence regions. The proportion of small aggregates decreased in the order of Extremely Arid Area > Arid Area > Semi-Arid Area > Cold and Humid Area > Semi-Humid Area, whereas the proportions of medium and large aggregates showed the opposite tendency. This indicates that samples located in drier occurrence regions contained a higher fraction of fine and densely packed aggregates, whereas samples located in less dry occurrence regions contained relatively higher proportions of medium and large aggregates.
Figure 4.
Aggregate types and proportions.
3.5. Correlation Between Material Sourcing, Rammed Characteristics, and Mesoscopic Structure of Heritage Rammed Earth
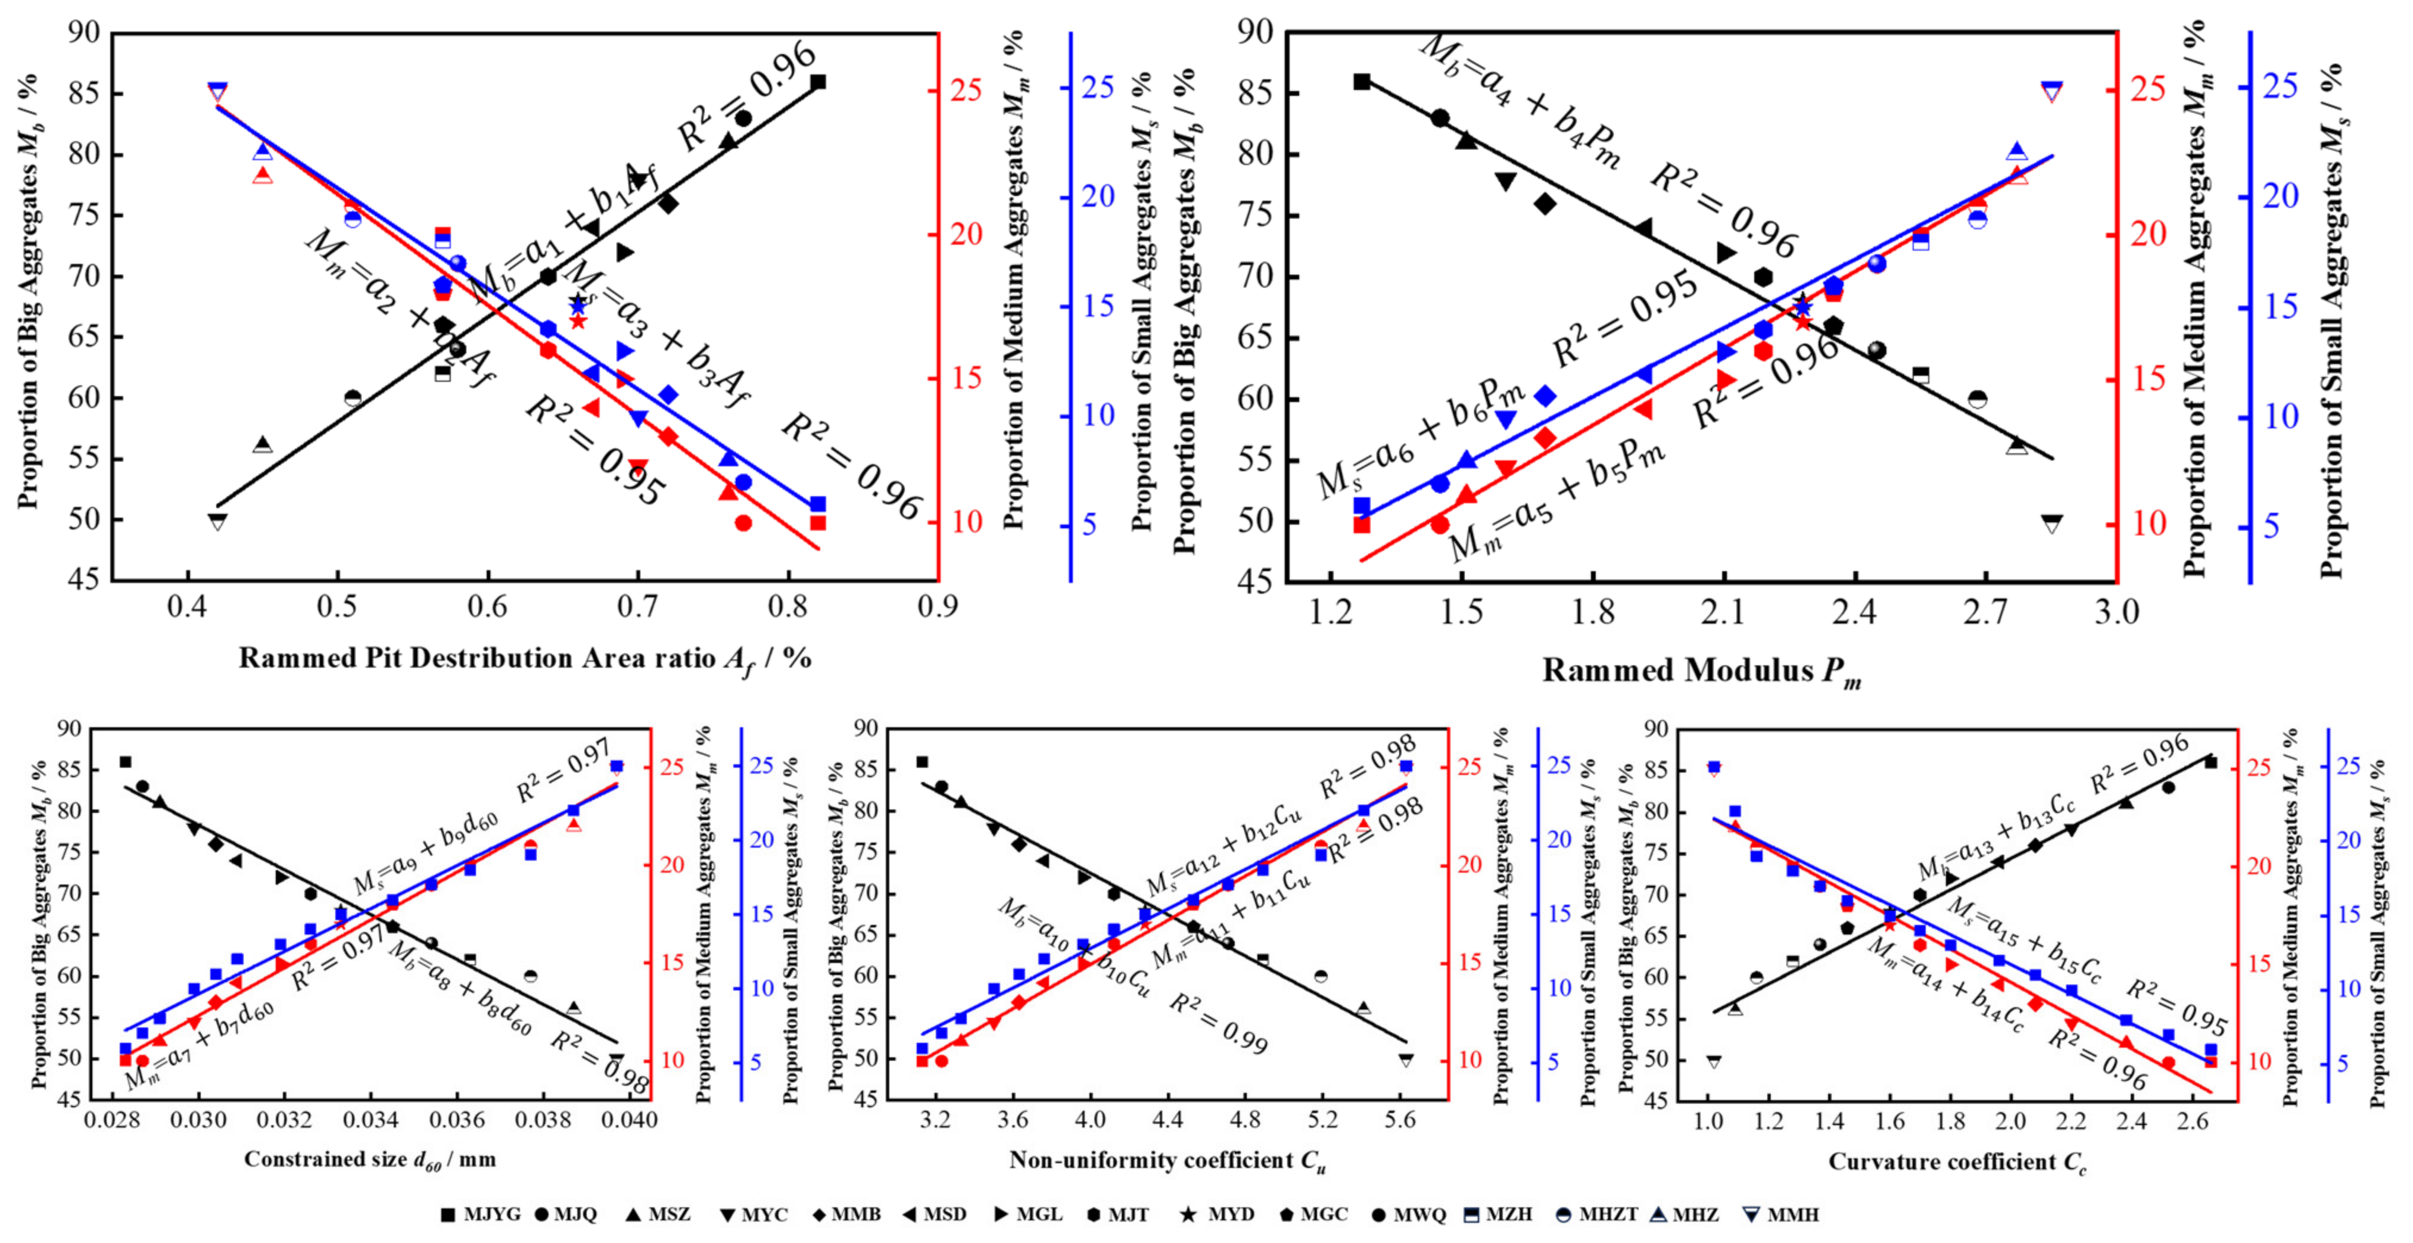
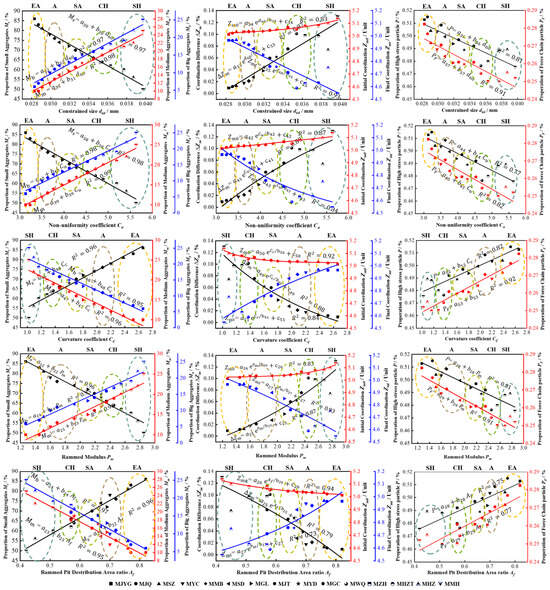
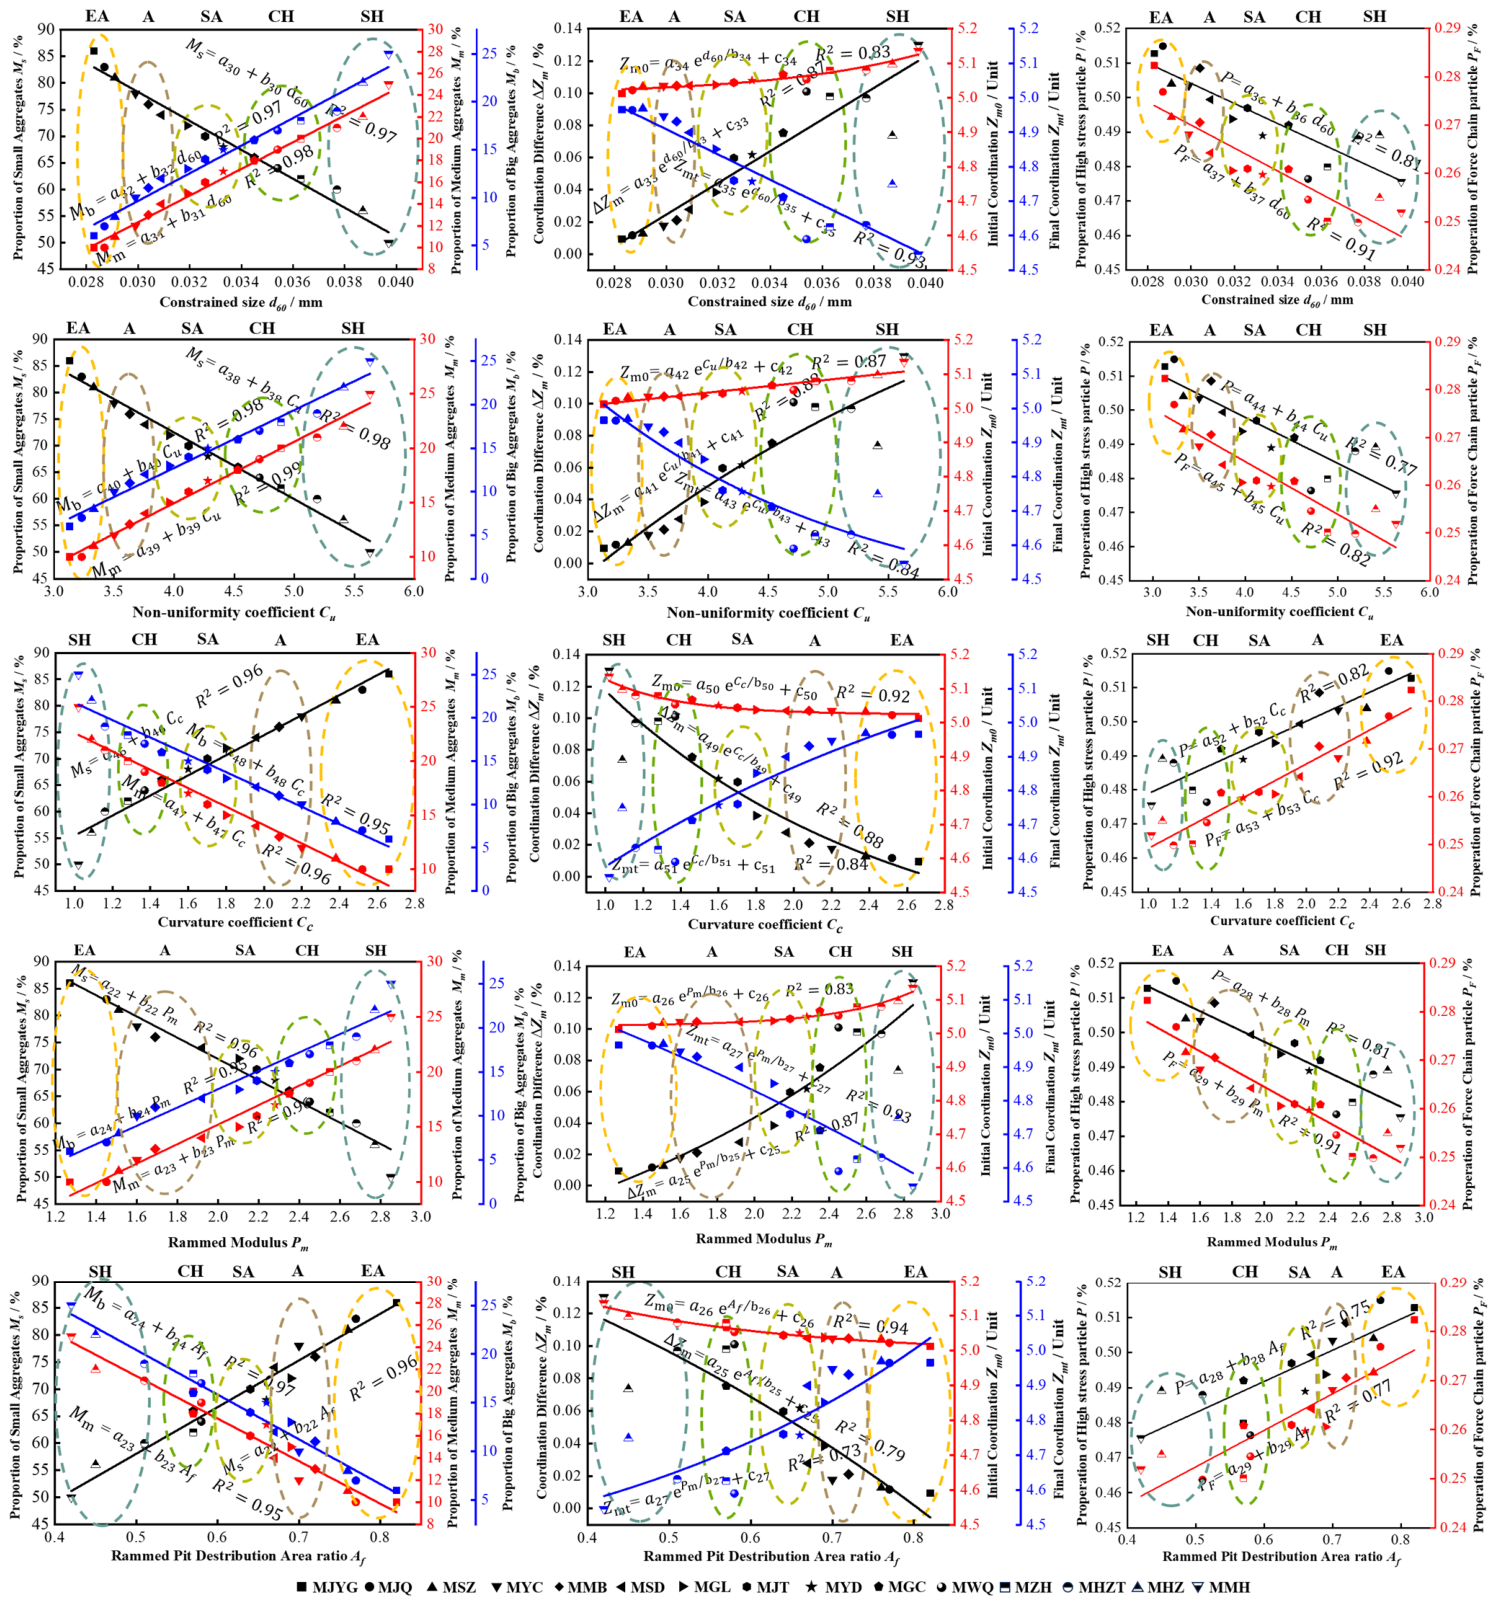
The relationships among rammed characteristics, material parameters, and aggregate proportions of the 15 sites are shown in Figure 5. Because the analysis focused on differences among sites, each data point represents the representative value of one Ming Great Wall site. The regression results indicate that the ramming pit distribution area ratio, , was positively associated with the proportion of small aggregates and negatively associated with the proportions of medium and large aggregates. In contrast, the rammed modulus, , showed an opposite trend, with lower Pm values corresponding to a higher proportion of small aggregates and lower proportions of medium and large aggregates. The material parameters also showed clear associations with aggregate distribution. Specifically, lower and values corresponded to a higher proportion of small aggregates and lower proportions of medium and large aggregates, whereas higher values corresponded to a higher proportion of small aggregates and lower proportions of medium and large aggregates.
Figure 5.
Relationship among rammed characteristics, material parameters, and aggregate proportions.
These results indicate that the site-level variation in both material parameters and rammed characteristics was closely related to the aggregate-size distribution of heritage rammed earth. In samples with finer particle composition and higher ramming pit distribution area ratio, small aggregates accounted for a larger proportion, while medium and large aggregates were relatively reduced.
3.6. Correlation Between Mesoscopic Structure and Compressive Properties of Heritage Rammed Earth
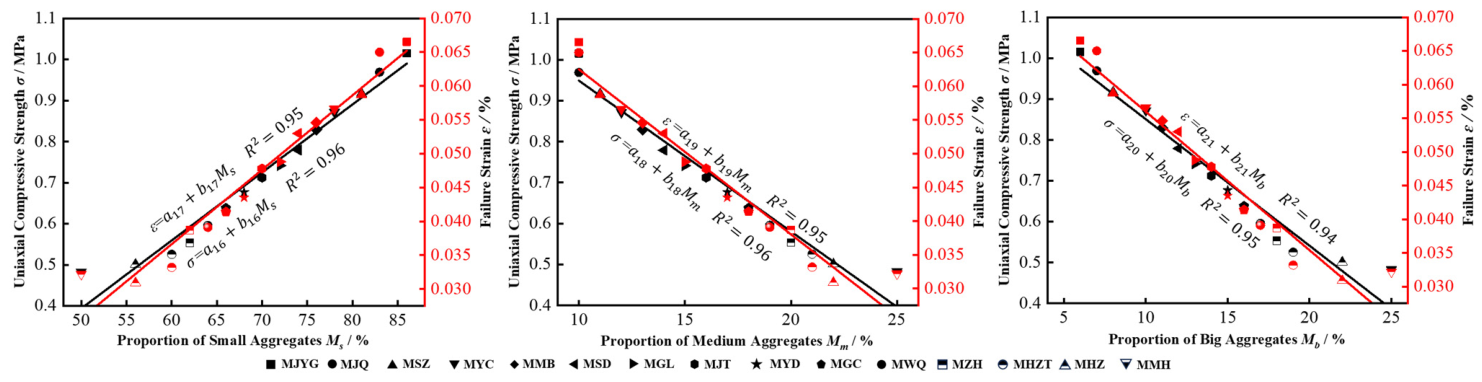
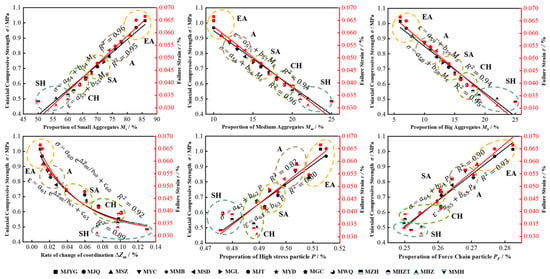
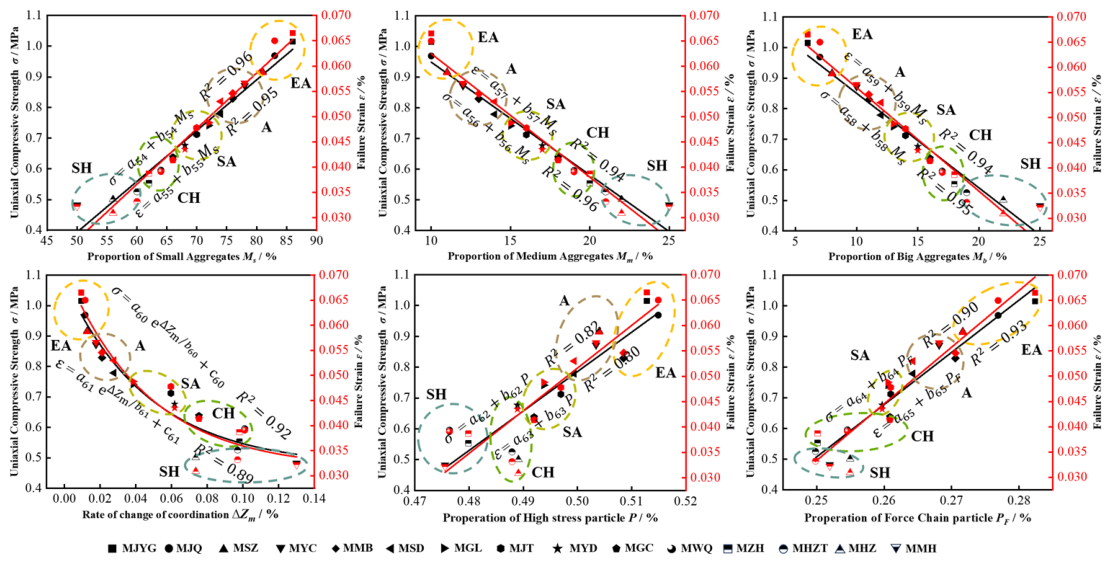
The relationship between mesoscopic structure and macromechanical properties of heritage rammed earth at the 15 sites is shown in Figure 6. The proportions of small, medium, and large aggregates showed strong linear correlations with peak stress and failure strain, with R2 values greater than 0.94. Specifically, a higher proportion of small aggregates corresponded to higher peak stress and larger failure strain, whereas a higher proportion of large aggregates corresponded to lower peak stress and smaller failure strain.
Figure 6.
Relationship between aggregate proportions, peak stress, and failure strain.
These results indicate that aggregate-size distribution was closely associated with the compressive response of heritage rammed earth. A higher proportion of small aggregates increased the number of effective particle contacts and improved the continuity of the load-bearing skeleton, which was consistent with the higher peak stress and larger failure strain observed in these samples. In contrast, a higher proportion of large aggregates increased structural heterogeneity and promoted localized deformation, resulting in lower strength and smaller deformation capacity.
4. Discrete Element Modeling and Analysis
The preceding field investigation, basic physical property tests, uniaxial compression tests, mesoscopic structural observations, and preliminary analyses indicate that material characteristics, rammed technology parameters, mesoscopic structure, and compressive behavior are closely associated with each other. Therefore, SEM-based model generalization and DEM simulations were conducted to interpret the compressive behavior of rammed earth from a mesoscopic perspective.
4.1. Generalization of Mesoscopic Structure of Heritage Rammed Earth
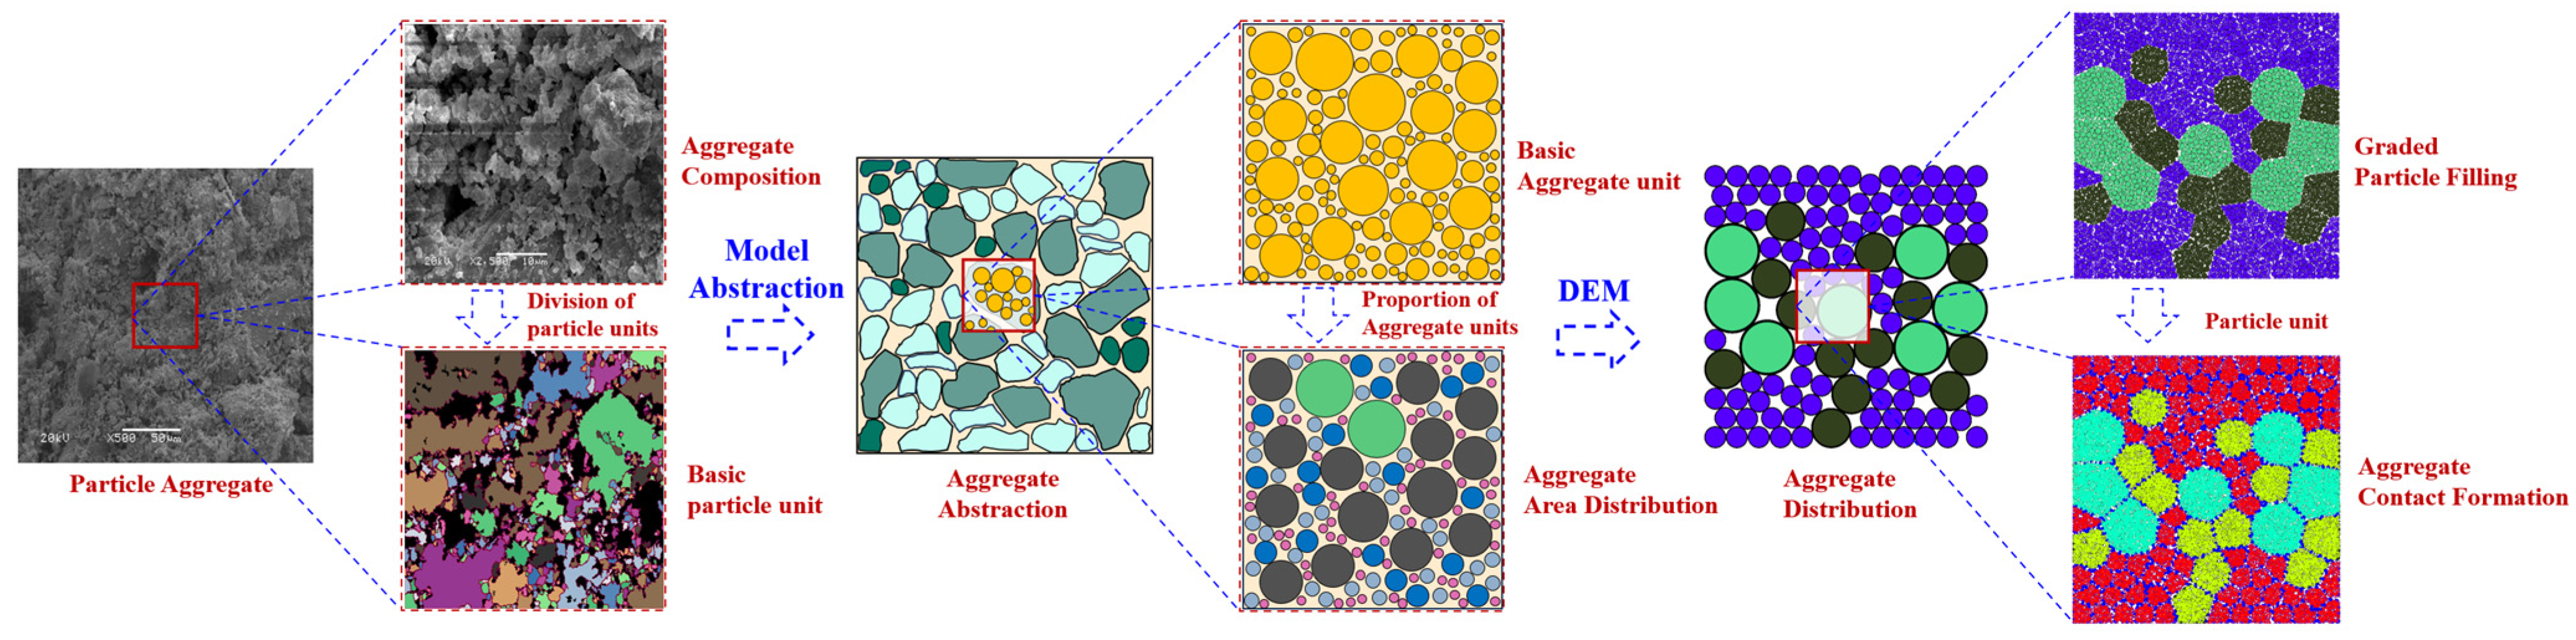
The SEM images of heritage rammed earth from the 15 sites and the generalized two-dimensional particle representation are shown in Figure 7. The SEM images at magnifications of 500× and 2000× show that the rammed earth samples were composed of irregular particle aggregates, which consisted of finer and approximately circular basic particle units. To represent the aggregate structure of rammed earth with different material characteristics and rammed technology parameters, the numerical specimen was simplified as a mixture of large, medium, and small aggregates. The particle-size distribution of the real rammed earth samples was also considered, and graded particles were randomly generated within the aggregates. The proportions of large, medium, and small aggregates used in the numerical model were determined according to the SEM image analysis results for each site. Therefore, the generalized aggregate model was constructed based on the measured aggregate-size composition rather than an arbitrary particle arrangement.
Figure 7.
Conceptual representation of the aggregate structure of rammed earth.
4.2. Establishment and Calibration of the Rammed Earth Aggregate Model
PFC2D was used to simulate the uniaxial compression behavior of heritage rammed earth. It was adopted as a comparative mesoscopic modeling tool rather than a full three-dimensional prediction model. Its purpose was to provide a visual and consistent numerical framework for interpreting the influence of material characteristics and rammed technology on the compressive behavior of heritage rammed earth. Although the two-dimensional simplification cannot fully reproduce three-dimensional particle packing and crack propagation, all models were established using the same geometry, boundary conditions, loading method, and contact laws, allowing consistent comparison among the 15 sites. Because particle distribution and contact form strongly influence the mechanical response of the numerical specimen, a cluster-based aggregate model was established according to the mesoscopic structural characteristics described in Section 3.4.
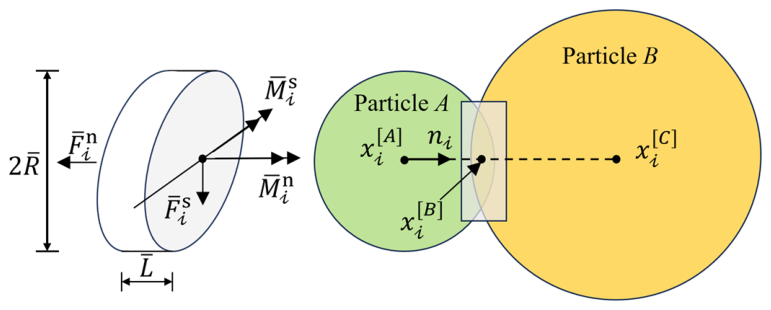
In the PFC simulation, the contacts between aggregates and the contacts between particles within aggregates were represented using a parallel-bond model, as shown in Figure 8. This contact model was selected because the SEM observations showed that the rammed earth was composed of aggregates formed by finer particles and cemented contacts. The parallel-bond model can transmit both forces and moments and can represent the progressive breakage of cemented contacts during compression, which is consistent with the aggregation and cementation characteristics of heritage rammed earth. When the contact force or moment exceeds the bond strength, the bond breaks and the contact response degenerates into a linear contact state, allowing the model to represent bond breakage and post-peak failure behavior. After the contact model was selected, the corresponding meso-mechanical parameters were assigned to generate the final numerical specimen.
Figure 8.
Parallel-bond model.
The parallel-bond model is defined by several parameters, including the normal stiffness , shear stiffness , normal strength , shear strength and bond radius . The total contact force and moment of the parallel bond are expressed as follows:
The maximum tensile stress and shear stress acting on the bond periphery are calculated as follows:
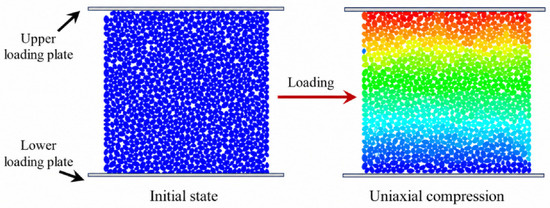
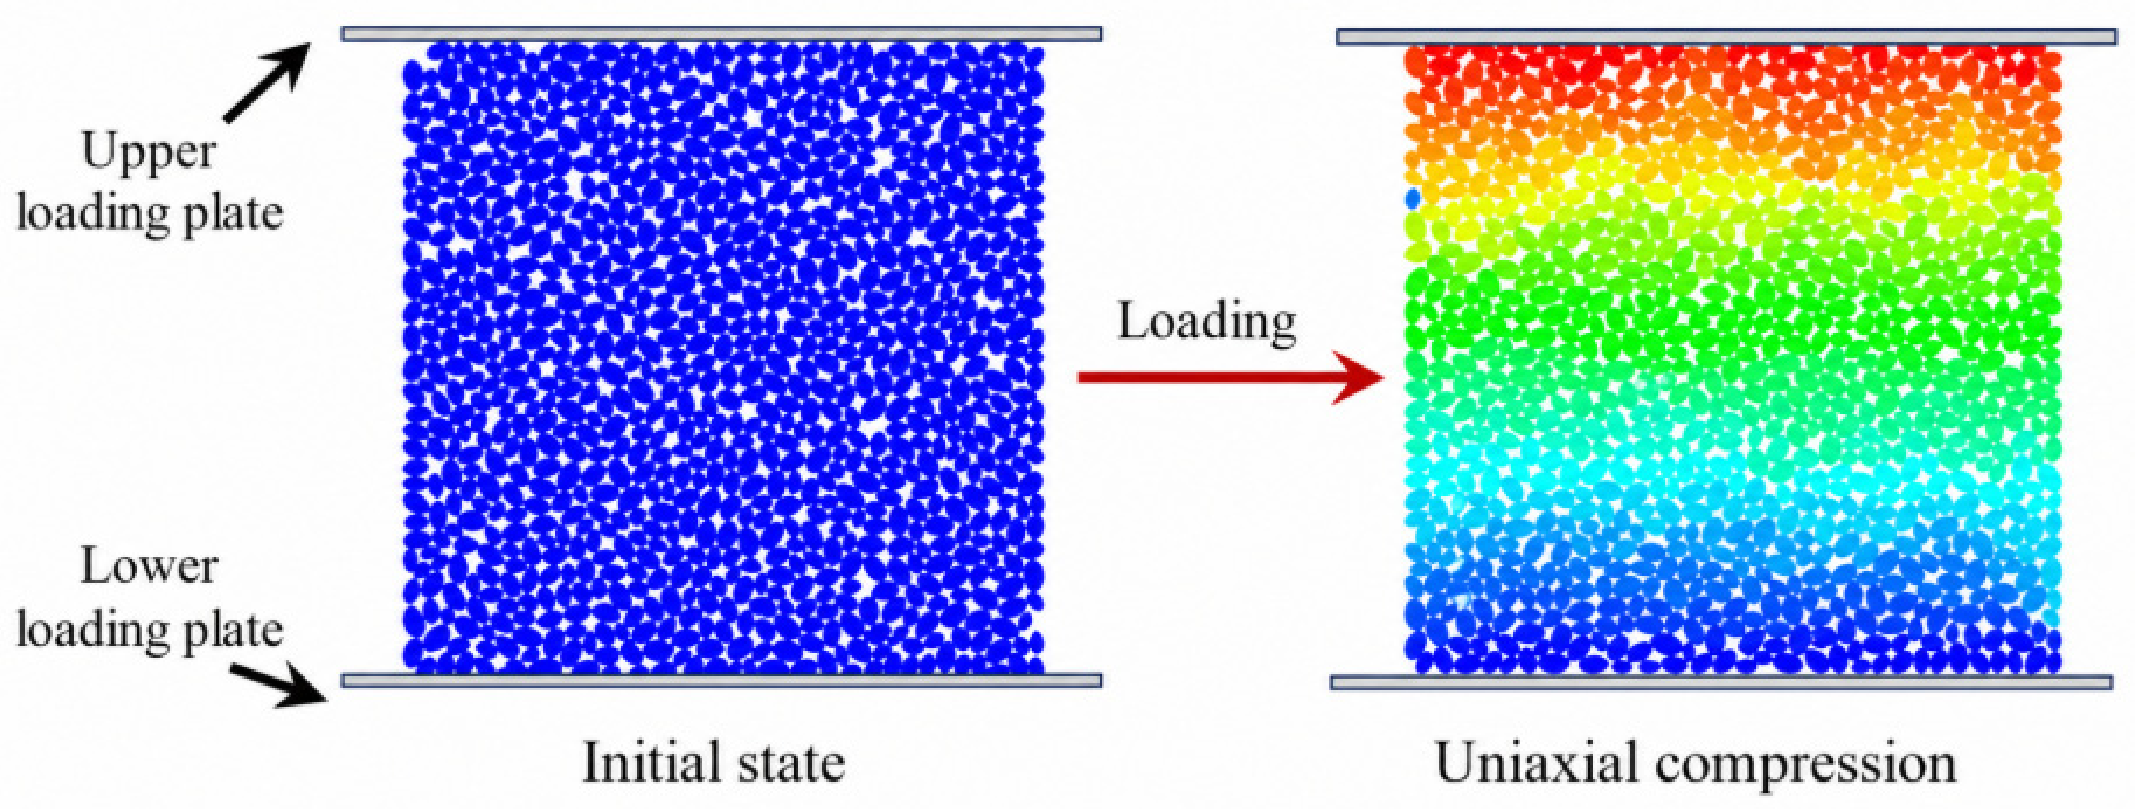
The height-to-width ratio of the numerical specimen was consistent with that used in the laboratory test, with a value of 1:1. The parallel-bond model was used for aggregate–aggregate contacts, whereas the linear contact model was used for contacts between aggregates and the upper and lower loading plates.
The numerical specimen was generated within the prescribed specimen boundary and then equilibrated before loading to reduce the unbalanced force and avoid unreasonable particle overlap or local stress concentration near the boundaries. As shown in Figure 9, the specimen was placed between two rigid loading plates. The lower loading plate was fixed, and axial compression was applied by moving the upper loading plate downward under displacement control. No rigid lateral confinement was applied on the two sides, allowing free lateral deformation under unconfined compression. During loading, the vertical reaction force and displacement of the loading plate were recorded using FISH scripts. Because a two-dimensional model was used, a unit thickness was assumed when calculating the axial stress. The axial stress and strain of the numerical specimen were calculated as follows:
where is the axial stress, is the vertical reaction force acting on the loading plate, is the initial specimen width in the two-dimensional model, is the axial strain, is the initial specimen height, and is the specimen height during loading.
Figure 9.
Boundary condition and loading mode of the numerical specimen.
The numerical simulation adopted a loading method consistent with the laboratory test. The meso-parameters used in the DEM model are contact- and bond-level numerical parameters rather than directly measured laboratory parameters. Following common calibration procedures in DEM studies [38,39,40], these parameters were obtained through inverse calibration based on the macroscopic response of the unconfined compression tests. The particle contact modulus, bond effective modulus, and stiffness ratios mainly control the stiffness response of the numerical specimen, whereas the friction coefficient, bond tensile strength, bond cohesion, and bond internal friction angle mainly control particle sliding, bond breakage, peak strength, and post-peak failure behavior. The parameters were repeatedly adjusted using the trial-and-error method until the simulated stress–strain curve shape, peak stress, elastic modulus, failure strain, and failure mode were consistent with the laboratory results. The final parameter set was accepted when the differences in the main mechanical indices were controlled within 5% (Figure 10). Subsequent analysis was conducted based on the calibrated model (Table 3).
Figure 10.
Experimental and simulated stress–strain curves of rammed earth from the 15 sites.
Table 3.
Calibrated mesoscopic parameters of the rammed earth aggregate model.
4.3. Analysis of DEM Simulation Results
4.3.1. Contact Fabric Analysis
Contact fabric is an important descriptor of anisotropy in granular materials and strongly influences their mechanical behavior. Casagrande [41] classified soil anisotropy into primary anisotropy and stress-induced anisotropy. The latter develops as the internal geometric and mechanical characteristics of a material evolve under external loading. Satake [42] and Oda [43] proposed the use of fabric tensors to describe specimen anisotropy, and subsequent studies have shown that normal contacts play a dominant role in carrying external loads. The fabric tensor was calculated as follows [44].
where and are the different components of the unit normal vector at the k-th strong contact; is the total number of strong contacts of the particle system; is the normal contact force density distribution function; is the mean value of normal contact force; is the main direction of anisotropy of normal contact force; is anisotropic principal axis deviation; is the anisotropy coefficient of normal contact force; and represents the anisotropy tensor of normal contact force. In this study, all normal contact forces in the particle system were first counted, and their average value was calculated. Contacts with normal contact forces greater than this average value were defined as strong contacts. The contact orientations were grouped at an angular interval of 5°, and the fabric anisotropy in each angular interval was statistically analyzed.
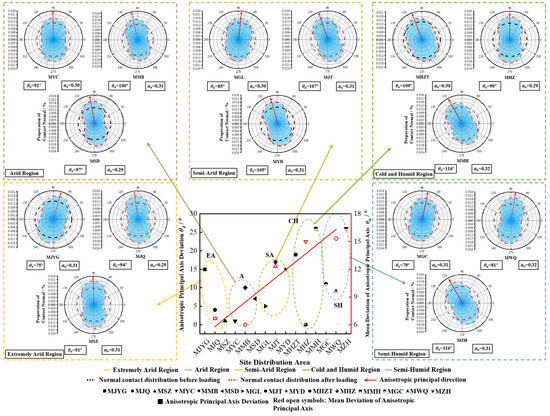
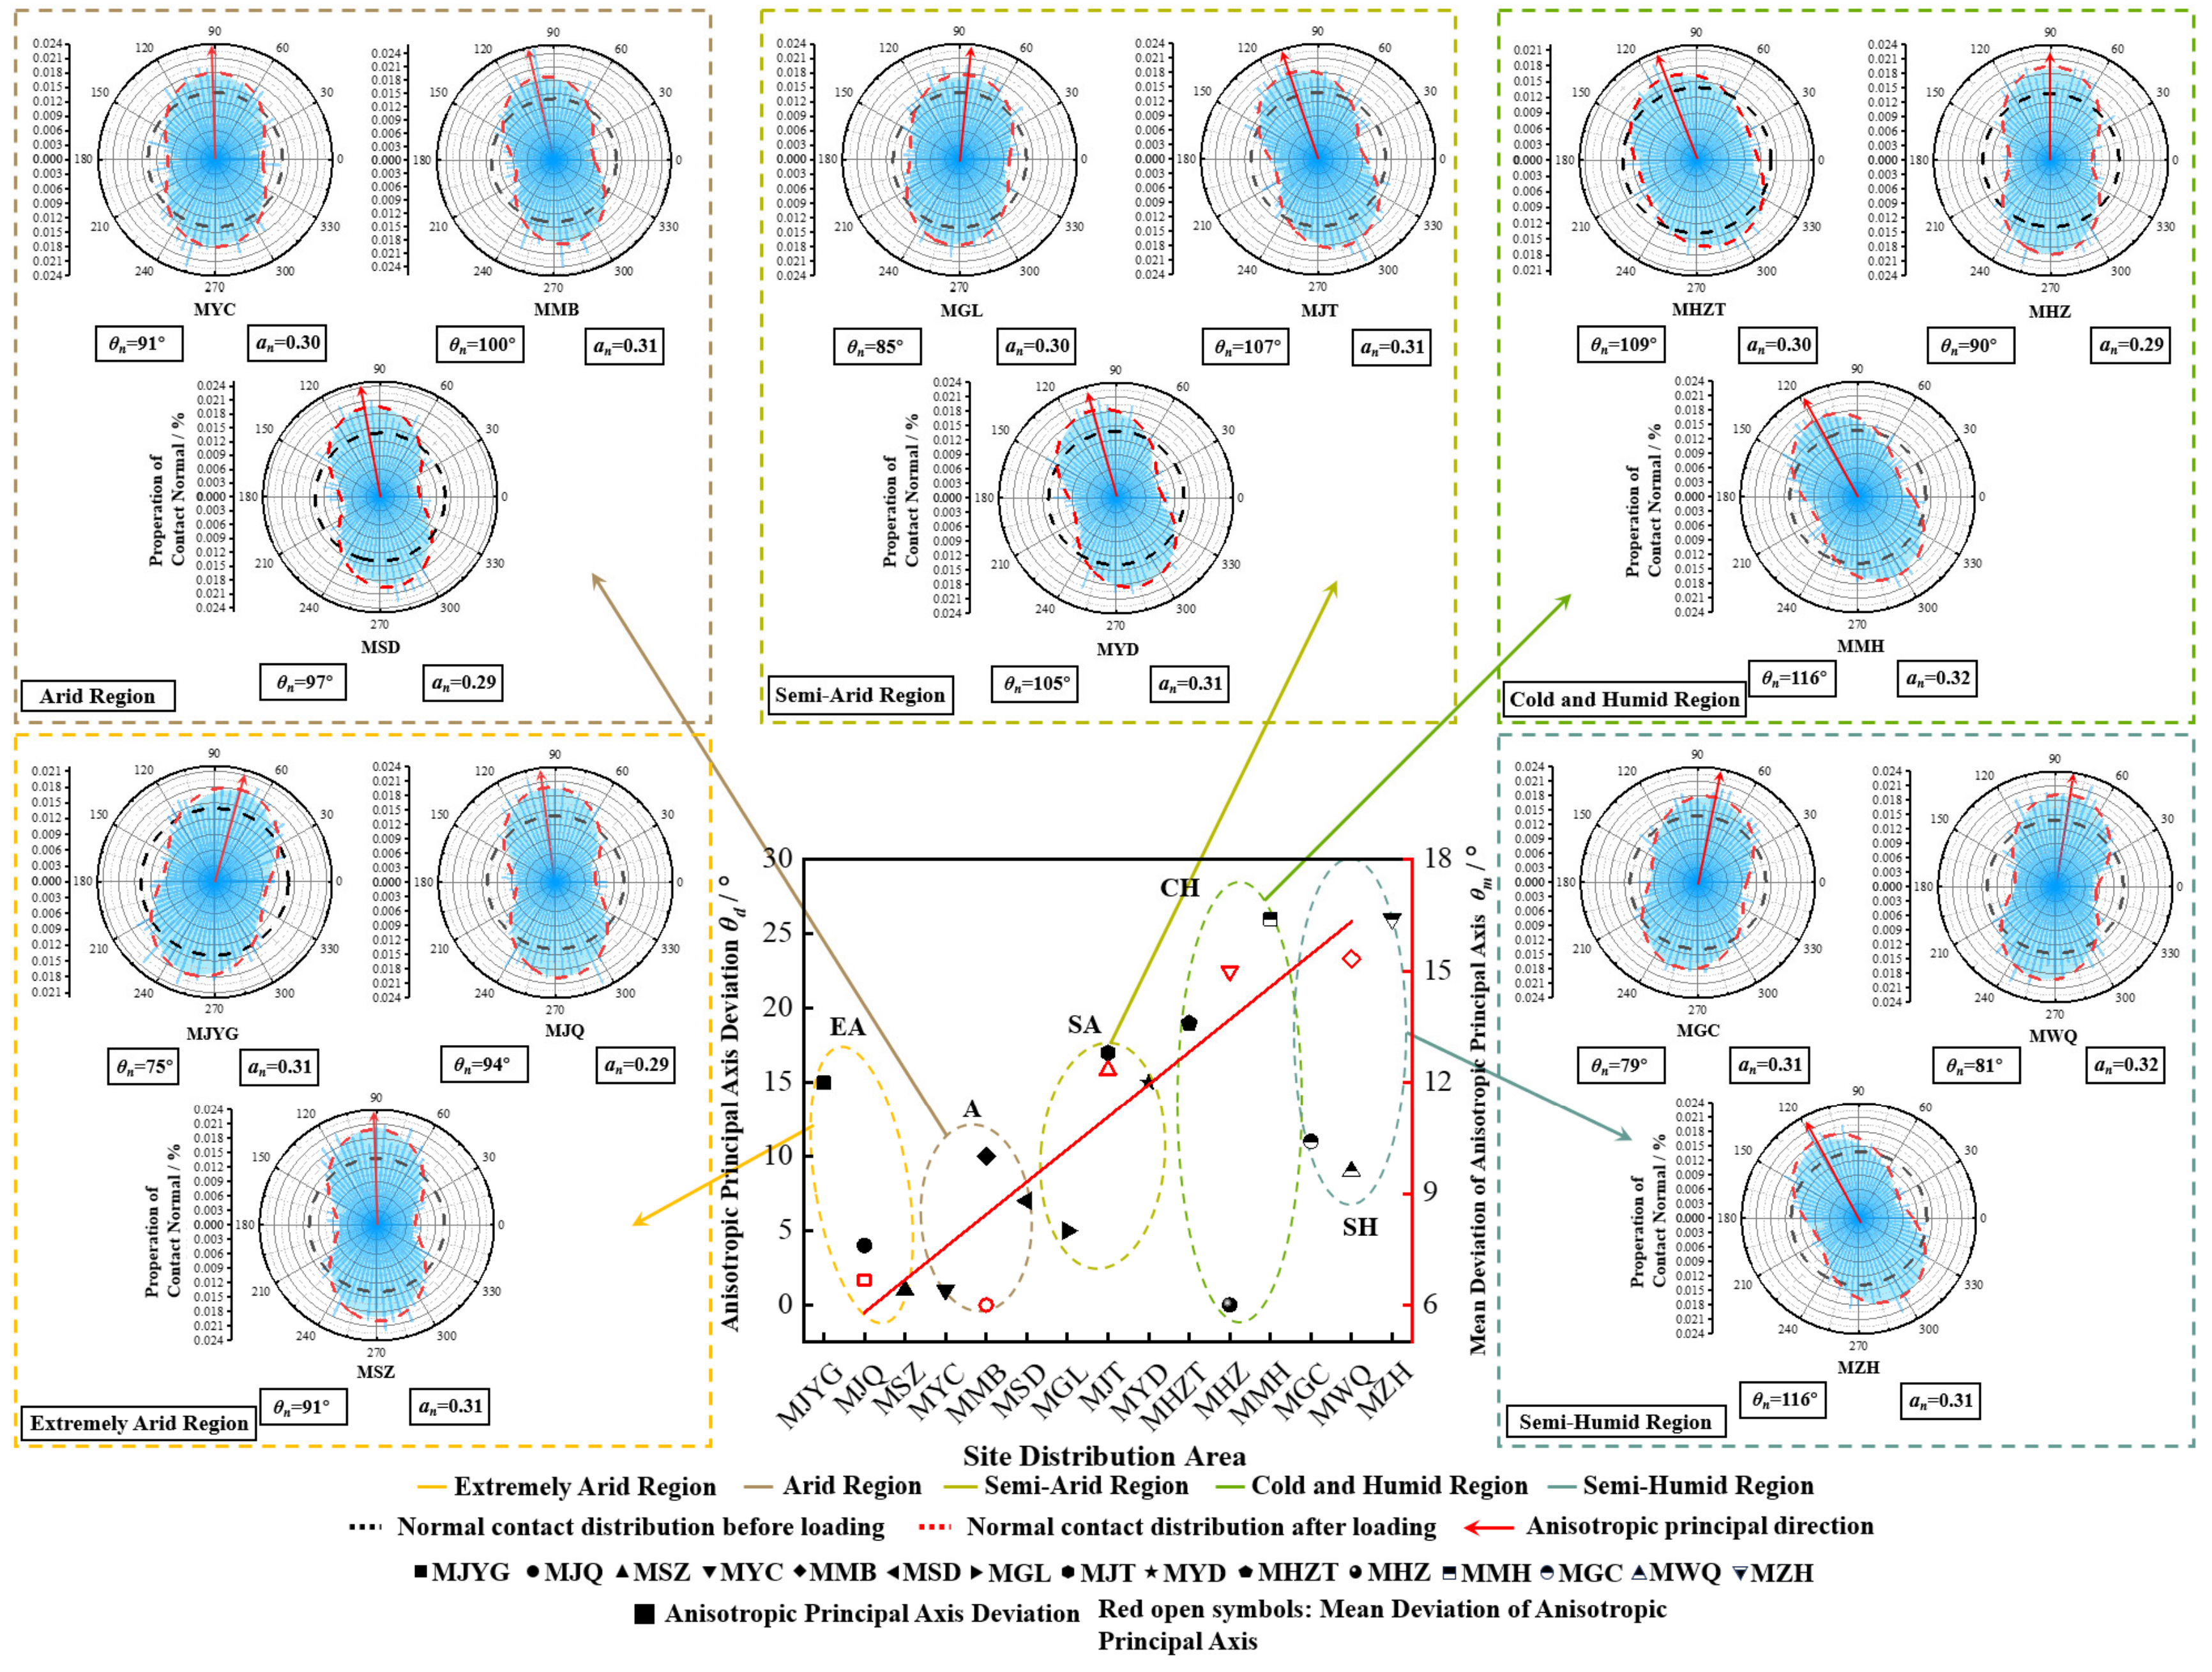
Figure 11 shows the rose diagrams of normal contacts and the mean principal-direction deviations of normal contact anisotropy for the rammed earth samples from the 15 sites. In the initial state, the normal contacts were approximately uniformly distributed, indicating a low degree of anisotropy. As axial strain increased, the normal contact distribution became more concentrated along the loading direction, and the degree of anisotropy increased. The principal direction of normal contact anisotropy ranged from 75° to 116°, the anisotropy coefficient ranged from 0.29 to 0.32, and the principal-axis deviation ranged from 0° to 26°. The mean principal-axis deviation ranged from 2° to 14°. The anisotropy parameters showed region-dependent differences among the five occurrence regions, and the anisotropy degree generally decreased in the order of Extremely Arid Area > Arid Area > Semi-Arid Area > Cold and Humid Area > Semi-Humid Area. These results indicate that contact anisotropy was closely associated with the mesoscopic fabric of rammed earth.
Figure 11.
Rose diagrams of normal contacts and mean principal-direction deviations of contact anisotropy for rammed earth from the 15 Ming Great Wall sites.
4.3.2. Particle Stress Analysis
In rammed earth, force is transferred through interparticle contacts. After visualization, the main force-transfer paths appear as chain-like structures, commonly referred to as force chains. Each particle is subjected to multiple contact forces, and the major principal stress can be used to characterize its stress state [45]. In this study, FISH scripts were used to calculate the major principal stress of each particle and the average stress of the particle system. Particles with major principal stress greater than the average value were defined as high-stress particles. The force-chain state was then identified using Equations (18) and (19). A force chain was defined as a connected structure consisting of three or more high-stress particles. When the angle between the branch vector connecting two adjacent particles and the direction of the major principal stress was less than (), the two adjacent high-stress particles were considered to belong to the same force chain. These high-stress particles and force chains form the main load-bearing network of the granular system [46,47].
where is the number of particles in the granular system; is the stress of particles in different directions; is the direction of ; is the branch vector connecting two adjacent particles; and is the major principal stress (vector) of the neighboring particle.
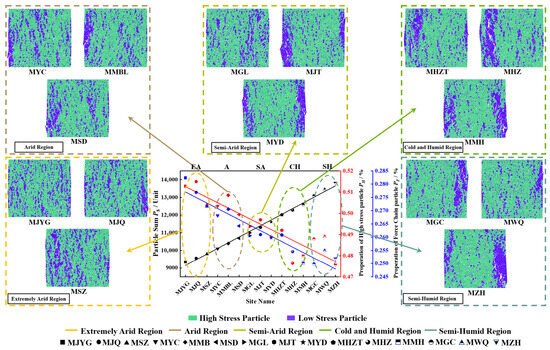
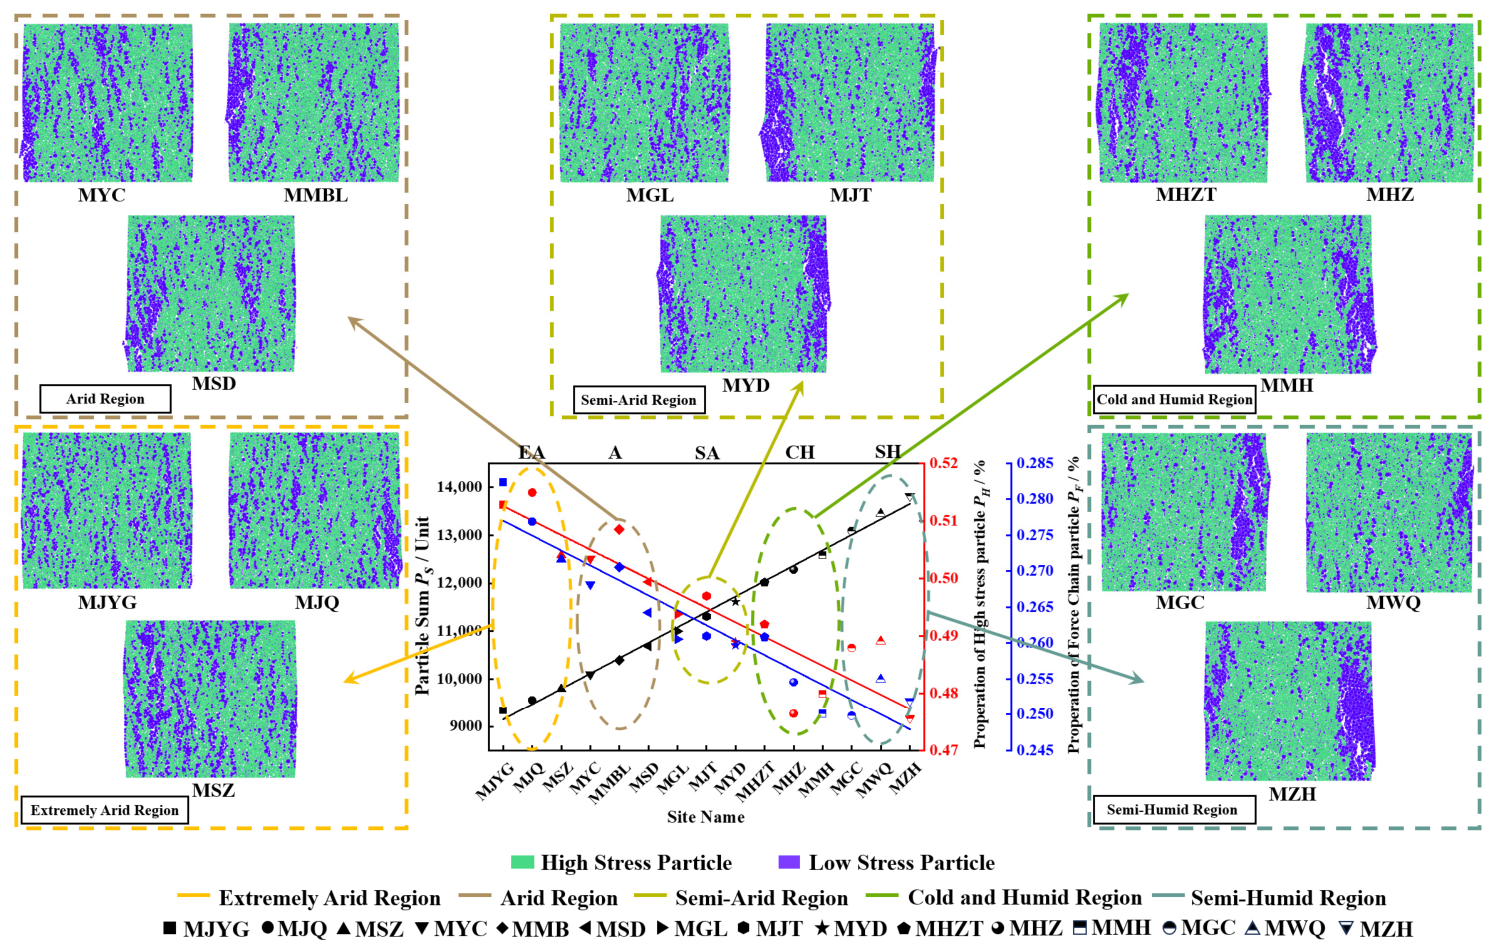
The distribution and frequency of high-stress particles in heritage rammed earth are shown in Figure 12. The total number of particles across the 15 sites ranged from 9900 to 14,000. High-stress particles accounted for 47–52% of the total particles, and force-chain particles accounted for 24.5–28.5%, indicating that a considerable fraction of particles participated in load transfer under axial compression. The spatial distribution of high and low-stress particles varied across different sites, with low-stress particles shifting from a uniform to a more concentrated marginal distribution. Moreover, variations in the number of force-chain particles were observed among the sites. Samples with a higher relative proportion of coarse particles tended to contain more isolated high-stress particles, whereas samples with a higher relative proportion of fine particles were more likely to form continuous force chains, which was consistent with their stronger load-bearing capacity. Finally, the proportions of high-stress and force-chain particles showed region-dependent differences, decreasing in the order of Extremely Arid Area > Arid Area > Semi-Arid Area > Cold and Humid Area > Semi-Humid Area. These differences in high-stress and force-chain particle proportions provide mesoscopic evidence for the regional variation in load-bearing behavior.
Figure 12.
Distribution and proportion of high-stress particles and force-chain particles in rammed earth.
4.3.3. Mechanical Coordination Number Analysis
For granular materials, mechanical behavior is strongly influenced by particle composition and structure. At the mesoscopic scale, the density of interparticle contacts can be described by the mechanical average coordination number, which represents the average number of contacts per particle after excluding floating particles with fewer than two contacts. Thornton [48] noted that particles with only one contact or no contact contribute little to maintaining a stable stress state of the specimen. Therefore, the mechanical average coordination number is calculated as follows:
where is the mechanical average coordination number; is the total number of contacts in the particle system; is the total number of particles in the particle system; and and are the number of particles with only one or no contact, respectively.
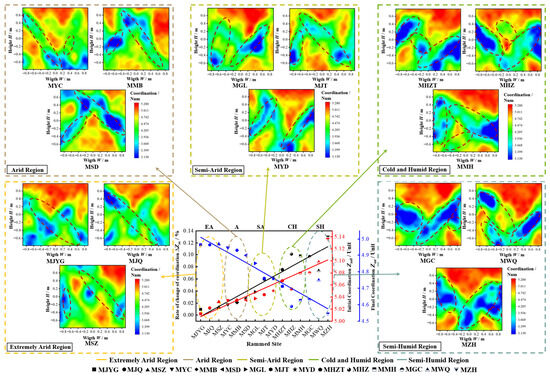
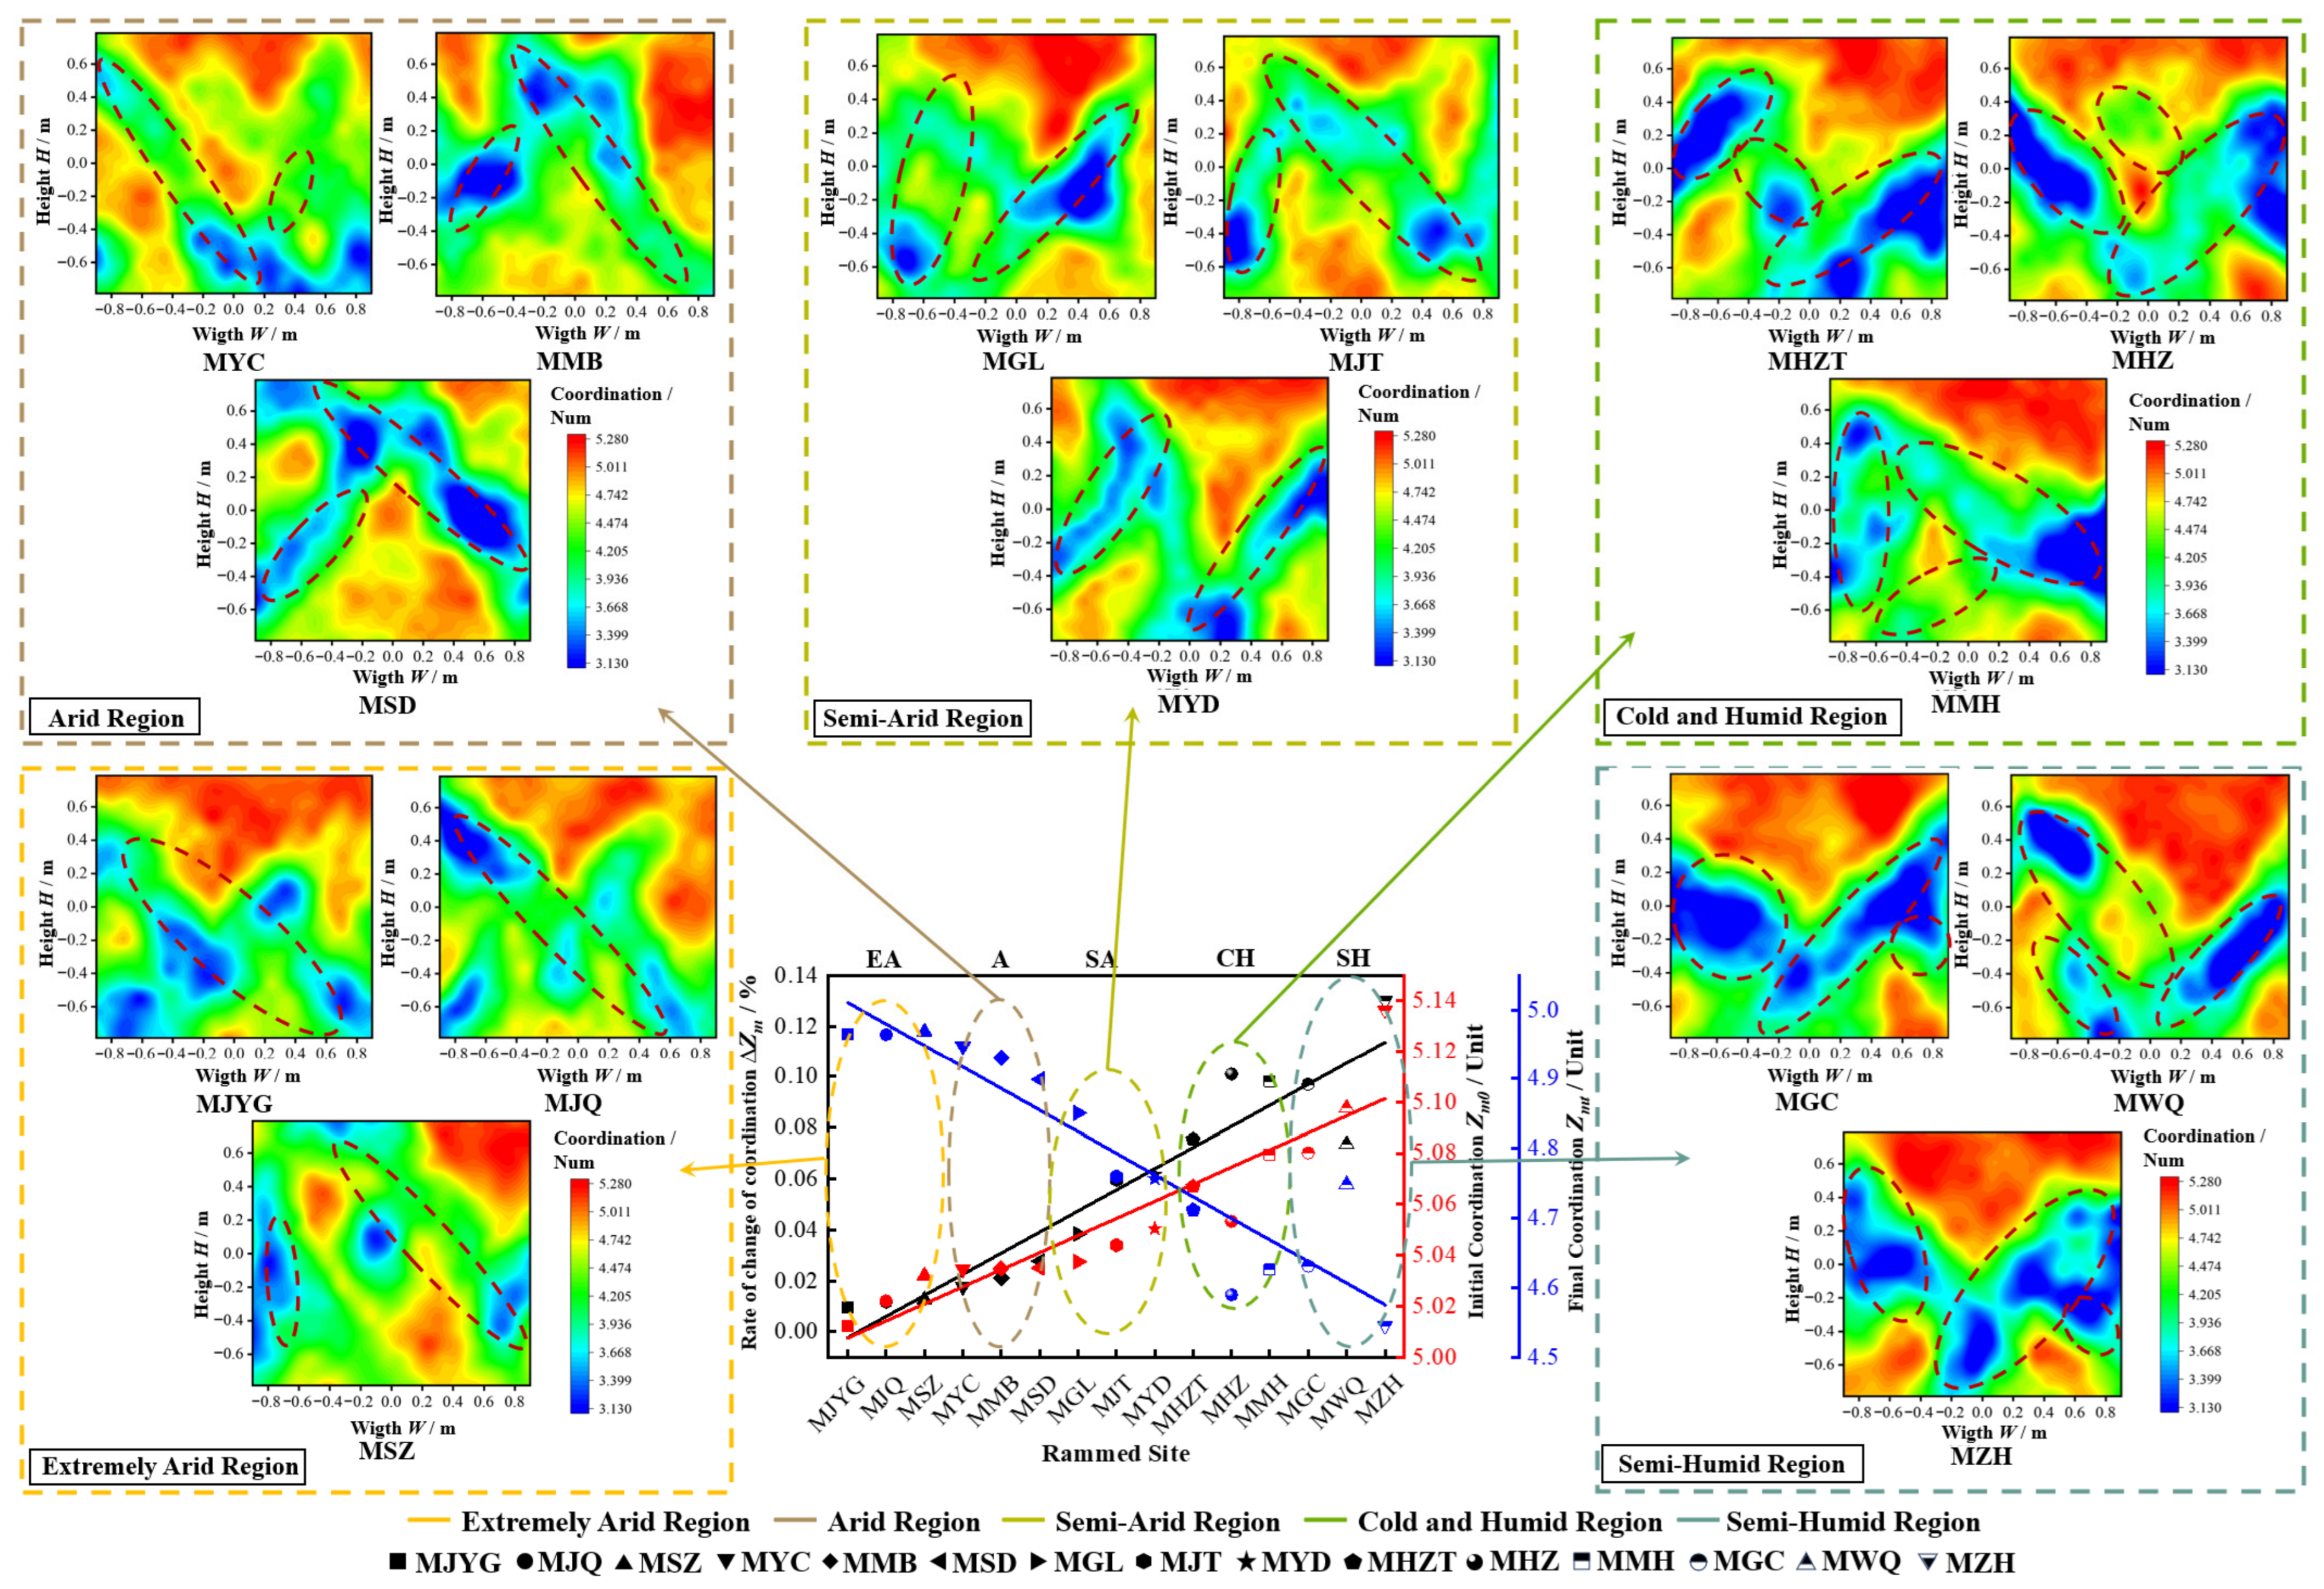
Figure 13 shows the mechanical coordination-number distribution of heritage rammed earth from the 15 sites at peak stress. The red regions represent areas with high coordination numbers, whereas the blue regions represent areas with low coordination numbers. The mechanical coordination number ranged from 4.2 to 5.2 and decreased with axial loading. During loading, fracture zones formed in the numerical specimens, and their patterns were consistent with the failure modes observed in the laboratory compression tests. The failure modes were classified as single-fork shear failure, mixed double-fork shear failure, and intersecting double-fork shear failure. The distribution and development range of the fracture surfaces differed among the sites. The orientation of the fracture surface was generally consistent with the principal direction of contact anisotropy, and the fracture development range was related to the distribution of low-stress particles. In addition, the initial mechanical coordination number, peak mechanical coordination number, and coordination difference showed region-dependent differences among the five occurrence regions. These results indicate that the coordination-number distribution was closely associated with fracture-zone development and macroscopic failure mode.
Figure 13.
Mechanical coordination-number distribution of rammed earth (red dashed circles indicate the main fracture or low-coordination-number regions).
5. Discussion
5.1. Relationship Between Rammed Earth Materials, Rammed Technology, and Mesoscopic Structural Parameters
The relationship among material sourcing, rammed technology, and mesoscopic structural parameters of rammed earth from the 15 sites is shown in Figure 14. The results indicate that material parameters and rammed technology parameters were statistically associated with aggregate composition, coordination difference, high-stress particle proportion, and force-chain particle proportion.
Figure 14.
Relationship among material sourcing, rammed technology parameters, and mesoscopic structural parameters.
From the material perspective, particle-size composition controls the potential contact framework of rammed earth. Previous studies have shown that particle-size composition, particle morphology, and particle contact mode strongly influence the skeleton structure and mechanical behavior of soils [8,9,10,11,12,13]. In this study, a finer particle composition provided more potential contact points and was more likely to form a dense aggregate assemblage dominated by small aggregates. In contrast, a coarser or more heterogeneous particle composition tended to increase aggregate-size heterogeneity, resulting in a lower proportion of small aggregates and a less continuous contact network. This explains why , the coefficient of uniformity , and the coefficient of curvature were closely related to aggregate proportion and coordination difference.
From the rammed-technology perspective, rammed-layer interface morphology reflects the ramming imprint left by the construction process. A larger rammed-pit distribution area ratio indicates a wider distribution of rammed traces on the layer interface, whereas a lower rammed modulus corresponds to a relatively smoother interface combined with higher dry density. Such a compaction state promotes closer particle contact and a more continuous load-bearing particle network. This interpretation is also consistent with DEM-based studies showing that particle contact state and contact-network organization are closely related to the load-transfer behavior of granular materials [27,28]. Therefore, material sourcing mainly defines the initial particle framework, while rammed technology further adjusts the contact state and aggregate arrangement during construction.
It should be noted that the regional differences discussed above should not be attributed solely to post-construction environmental conditions. The material composition of Ming Great Wall rammed earth was primarily related to local material availability and the construction principle of using locally available surface deposits, while rammed technology was associated with material properties and local construction practices. Therefore, the observed regional differences should be interpreted as the combined result of original construction-related factors and subsequent environmental conditions.
5.2. Relationship Between Mesoscopic Structural Parameters and Compressive Performance of Rammed Earth
The relationship between mesoscopic structural parameters and compressive performance of the 15 sites is shown in Figure 15. The results indicate that aggregate proportion, high-stress particle proportion, force-chain particle proportion, and coordination difference were closely associated with peak stress and failure strain. However, the influence of these mesoscopic structural parameters on compressive performance can be understood more clearly from the load-transfer and structural-stability mechanisms of granular materials.
Figure 15.
Fitted relationships between mesoscopic structural parameters and mechanical parameters.
Small aggregates increase the number of effective contacts and improve the continuity of the particle skeleton. Therefore, samples with a higher proportion of small aggregates tend to form a denser contact network, which promotes more uniform axial load transfer and delays localized deformation. This explains why a higher small-aggregate proportion corresponded to higher peak stress and larger failure strain.
High-stress particles and force-chain particles represent the main load-bearing components in the particle system. Force chains provide preferential paths for stress transfer, and their continuity controls the ability of granular materials to carry external loads. Previous DEM studies have shown that force-network rearrangement and strong-contact connectivity are closely related to the load-transfer capacity and deformation response of granular materials [49,50]. In this study, higher proportions of high-stress particles and force-chain particles indicate a more continuous load-bearing network, which is consistent with the higher peak stress observed in the corresponding rammed earth samples.
Coordination number reflects the contact density and structural stability of a granular system. A smaller coordination difference indicates that the contact network remains more uniform during loading, which reduces local stress concentration and improves structural stability before failure. This interpretation is consistent with DEM studies showing that coordination number is an important particle-scale descriptor of the mechanical response of granular materials [51]. Therefore, the nonlinear relationship between coordination difference and compressive parameters suggests that structural stability is not controlled by contact quantity alone, but also by the uniformity and redistribution of contacts during loading.
In addition, the principal direction of contact-force anisotropy was generally consistent with the development direction of the fracture surface, indicating that anisotropic force transmission influenced the orientation of failure localization. This agrees with previous studies showing that fabric anisotropy and strong-contact networks play important roles in deformation localization and failure evolution in granular materials [50,51]. Overall, the meso–macro linkage revealed in this study indicates that material sourcing and rammed technology are associated with compressive behavior mainly through aggregate composition, force-chain continuity, coordination-number stability, and contact-force anisotropy.
6. Conclusions
This study investigated the material characteristics, rammed technology, mesoscopic structure, and compressive behavior of rammed earth from 15 Ming Great Wall sites in Northwest China. The main conclusions are as follows:
- (1)
- The rammed earth from the 15 Ming Great Wall sites showed clear regional differentiation in material characteristics, rammed parameters, and internal fabric across the five occurrence regions. Across the five occurrence regions from the Extremely Arid Area to the Semi-Humid Area, dry density, silt fraction, ramming-pit distribution area ratio, small-aggregate proportion, contact anisotropy, coordination difference, high-stress particle proportion, and force-chain particle proportion generally decreased, whereas clay and colloidal particle fraction, , , rammed modulus, and the proportions of medium and large aggregates generally increased.
- (2)
- The compressive properties and failure modes of rammed earth also showed clear regional variation. The peak stress and failure strain decreased in the order of Extremely Arid Area > Arid Area > Semi-Arid Area > Cold and Humid Area > Semi-Humid Area. Correspondingly, the shear failure mode changed from single-fork shear failure to mixed double-fork shear failure and then to intersecting double-fork shear failure.
- (3)
- Regression analysis showed that the material and rammed parameters were closely related to the mesoscopic structural parameters of rammed earth. The constrained size, non-uniformity coefficient, curvature coefficient, ramming pit distribution area ratio, and rammed modulus showed linear relationships with aggregate proportion, high-stress particle proportion, and force-chain particle proportion, with R2 values greater than 0.75. These parameters also showed nonlinear relationships with coordination difference, with R2 values greater than 0.73.
- (4)
- The mesoscopic structural parameters were closely associated with the compressive properties and failure characteristics of rammed earth. Aggregate proportion, high-stress particle proportion, and force-chain particle proportion showed linear relationships with peak stress and failure strain, with R2 values greater than 0.80. Coordination difference showed nonlinear relationships with peak stress and failure strain, with R2 values greater than 0.89. In addition, the principal direction of contact-force anisotropy was generally consistent with the development direction of the fracture surface.
Overall, this study establishes a multi-scale connection among material characteristics, rammed technology, mesoscopic structure, and compressive behavior of Ming Great Wall rammed earth. The results provide a reference for regional mechanical assessment, failure tendency identification, and conservation planning of rammed-earth Great Wall sites.
Author Contributions
C.G.: Writing—original draft, Visualization, Software, Methodology. K.C.: Writing—review and editing, Methodology. X.W.: Writing—review and editing, Validation. P.X.: Data curation, Visualization. All authors have read and agreed to the published version of the manuscript.
Funding
This work was supported by the National Key Research and Development Plan (Grant Nos. 2025YFE0211602; 2023YFF0905902), the National Natural Science Foundation of China (Nos. 52068050, 41562015), and the Key Projects of Two Chain Integration of Shaanxi Province of China (2022LL-ZD-01, Cultural Heritage Protection and Utilization), Gansu Province Innovation Platform Plan (26JDWF001).
Institutional Review Board Statement
Not applicable.
Informed Consent Statement
Not applicable.
Data Availability Statement
The data presented in this study are available on request from the corresponding author.
Conflicts of Interest
The authors declare no conflicts of interest.
References
- Zhang, S.; Chen, W.; Guo, Z. Study on the spatial regularity of rammed pits of the Ming Great Wall using 3D scanning technique and Random Forest algorithm. J. Cult. Herit. 2023, 62, 230–241. [Google Scholar] [CrossRef] [Scilit]
- Chen, F.; Zhou, W.; Xu, H.; Parcharidis, I.N.; Lin, H.; Fang, C. Space Technology Facilitates the Preventive Monitoring and Preservation of the Great Wall of the Ming Dynasty: A Comparative Study of the Qingtongxia and Zhangjiakou Sections in China. IEEE J. Sel. Top. Appl. Earth Obs. Remote Sens. 2020, 13, 5719–5729. [Google Scholar] [CrossRef] [Scilit]
- Cao, Y.; Zhang, Y. The fractal structure of the Ming Great Wall Military Defense System: A revised horizon over the relationship between the Great Wall and the military defense settlements. J. Cult. Herit. 2018, 33, 159–169. [Google Scholar] [CrossRef] [Scilit]
- Shi, J.; Chun, Q.; Feng, S.; Liu, C.; Liu, Z.; Wang, D.; Zhang, Y. Pore structure and fractal dimension analysis of ancient city wall bricks in China. J. Build. Eng. 2023, 76, 107324. [Google Scholar] [CrossRef] [Scilit]
- Zhao, P.; Zhang, X.; Qin, L.; Zhang, Y.; Zhou, L. Conservation of disappearing traditional manufacturing process for Chinese grey brick: Field survey and laboratory study. Constr. Build. Mater. 2019, 212, 531–540. [Google Scholar] [CrossRef] [Scilit]
- Chen, J.; Jin, S.; Liao, A.; Zhao, Y.; Zhang, H.; Rong, D.; Yang, Z. Stereo mapping of Ming Great Wall with remote sensing. Chin. Sci. Bull. 2010, 55, 3105–3110. [Google Scholar] [CrossRef] [Scilit]
- Huang, K.; Ma, Q. Chinese Cultural Relics Protection and Restoration Technology; Science Press: Beijing, China, 2009. [Google Scholar]
- Alam, M.; Das, A.; Disfani, M.M. Microstructural behaviour of soft-rigid granular mixes under compressive loads: DEM study using coherent contact model. Comput. Geotech. 2024, 176, 106749. [Google Scholar] [CrossRef] [Scilit]
- Moreira, E.B.; Baldovino, J.A.; Rose, J.L.; Izzo, R.L.D.S. Effects of porosity, dry unit weight, cement content and void/cement ratio on unconfined compressive strength of roof tile waste-silty soil mixtures. J. Rock Mech. Geotech. Eng. 2019, 11, 369–378. [Google Scholar] [CrossRef] [Scilit]
- Gong, J.; Nie, Z.; Zhu, Y.; Liang, Z.; Wang, X. Exploring the effects of particle shape and content of fines on the shear behavior of sand-fines mixtures via the DEM. Comput. Geotech. 2019, 106, 161–176. [Google Scholar] [CrossRef] [Scilit]
- Tan, Q.; Huang, M.; Tang, H.; Zou, Z.; Li, C.; Huang, L.; Zhou, X. Insight into the anisotropic deformation of landslide sliding zone soil containing directional cracks based on in situ triaxial creep test and numerical simulation. Eng. Geol. 2022, 311, 106898. [Google Scholar] [CrossRef] [Scilit]
- Sun, Z.; Zhang, S.; Wang, Y.; Bai, R.; Li, S. Mechanical behavior and microstructural evolution of frozen soils under the combination of confining pressure and water content. Eng. Geol. 2022, 308, 106819. [Google Scholar] [CrossRef] [Scilit]
- Zheng, Y.; Sun, H.; Hou, M.; Ge, X. Microstructure evolution of soft clay under consolidation loading. Eng. Geol. 2021, 293, 106284. [Google Scholar] [CrossRef] [Scilit]
- Song, W.; Xu, F.; Wu, H.; Xu, Z. Investigating the skeleton behaviors of open-graded friction course using discrete element method. Powder Technol. 2021, 385, 528–536. [Google Scholar] [CrossRef] [Scilit]
- Zhang, A.; Jiang, M.; Wang, D. Effect of fabric anisotropy on the cyclic liquefaction of sands: Insight from DEM simulations. Comput. Geotech. 2023, 155, 105188. [Google Scholar] [CrossRef] [Scilit]
- Zhang, Y.; Wang, H.; Zhang, J.; Ding, Y.; Yan, P.; Li, D. Study on the influence of particle shape on mechanical properties of sand. J. Railw. Sci. Eng. 2022, 19, 3256–3265. [Google Scholar] [CrossRef]
- Wu, Y.; Cui, J.; Li, C.; Wen, L.; Shan, C.; Liao, J. Experiential study on the effect of fines on the maximum dynamic shear modulus of coral sand in a hydraulic fill island-reef. Chin. J. Rock Mech. Eng. 2022, 41, 205–216. [Google Scholar] [CrossRef]
- Liu, K.; Ye, W.; Gao, H.; Dong, Q. Multi-scale effects of mechanical property degradation of expansive soils under drying-wetting environments. Chin. J. Rock Mech. Eng. 2020, 39, 2148–2159. [Google Scholar] [CrossRef]
- Wei, Y.; Yao, Z.; Chong, X.; Zhang, J. Microstructural properties of unsaturated Q3 loess and their influence mechanisms on strength properties. Chin. J. Geotech. Eng. 2021, 43, 2127–2133. [Google Scholar] [CrossRef]
- An, R.; Kong, L.; Li, C.; Luo, X. Strength attenuation and microstructure damage of granite residual soils under hot and rain weather. Chin. J. Rock Mech. Eng. 2020, 39, 1902–1911. [Google Scholar] [CrossRef]
- Cundall, P.A. A discontinuous future for numerical modelling in geomechanics? Geotech. Eng. 2001, 149, 41–47. [Google Scholar] [CrossRef]
- Cui, L.; O’Sullivan, C. Exploring the macro- and micro-scale response of an idealised granular material in the direct shear apparatus. Géotechnique 2006, 56, 455–468. [Google Scholar] [CrossRef]
- Wang, T.; Tang, C.; Liu, W.; Cheng, Q.; Shen, Z.-T.; Pan, X.-H. Insight into the initiation and propagation mechanism of desiccation cracking in clayey soil from DEM simulations. Comput. Geotech. 2024, 175, 106694. [Google Scholar] [CrossRef] [Scilit]
- Hu, J.; Wu, H.; Gu, X.; Zhou, Q. Particle shape effects on dynamic properties of granular soils: A DEM study. Comput. Geotech. 2023, 161, 105578. [Google Scholar] [CrossRef] [Scilit]
- Gao, Y.; Chen, Q.; Yuan, Q.; Wang, Y.-H. The kinematics and micro mechanism of creep in sand based on DEM simulations. Comput. Geotech. 2023, 153, 105082. [Google Scholar] [CrossRef] [Scilit]
- Xu, M.; Hong, J.; Song, E. DEM study on the macro- and micro-responses of granular materials subjected to creep and stress relaxation. Comput. Geotech. 2018, 102, 111–124. [Google Scholar] [CrossRef] [Scilit]
- Gong, J.; Wang, X.; Li, L.; Nie, Z.H. DEM study of the effect of fines content on the small-strain stiffness of gap-graded soils. Comput. Geotech. 2019, 112, 35–40. [Google Scholar] [CrossRef] [Scilit]
- Wang, T.; Zhu, J.; Liu, S. DEM simulation on plasticity behavior of soil-rock mixtures with different fine contents. Chin. J. Theor. Appl. Mech. 2022, 54, 1075–1084. [Google Scholar] [CrossRef]
- Zhang, K.; Li, W.; Luo, X.; Frederick, C.N. Numeral experiences of microscopic mechanism of inherited anisotropy for sand based on PFC2D. Chin. J. Geotech. Eng. 2017, 39, 518–524. [Google Scholar] [CrossRef]
- Ma, X.; Liu, Z.; Wang, W.; Wang, J.; Lu, L.; Zhou, D.; Zhang, H. Characteristics of physical parameters and predictive modeling of mechanical properties in loess-like silty clay for engineering geology. Eng. Geol. 2024, 339, 107672. [Google Scholar] [CrossRef] [Scilit]
- Lu, Z.; Yao, A.; Su, A.; Ren, X.; Liu, Q.; Dong, S. Re-recognizing the impact of particle shape on physical and mechanical properties of sandy soils: A numerical study. Eng. Geol. 2019, 253, 36–46. [Google Scholar] [CrossRef] [Scilit]
- Luo, F.; Zhang, G.; Yao, Y. Macro-micro tests of cohesive soil under varied normal and shear stresses subjected to drying-wetting cycles. J. Rock Mech. Geotech. Eng. 2024, 16, 5893–5905. [Google Scholar] [CrossRef] [Scilit]
- Goldberg-Yehuda, N.; Nachshon, U.; Assouline, S.; Mau, Y. The effect of mechanical compaction on the soil water retention curve: Insights from a rapid image analysis of micro-CT scanning. CATENA 2024, 242, 108068. [Google Scholar] [CrossRef] [Scilit]
- Wang, M.; Zhang, Y.; Yan, J.; Xiong, F. Molecular dynamics simulations of the creep behavior of illite in the net-like red soils of Xuancheng, China. Comput. Geotech. 2025, 177, 106840. [Google Scholar] [CrossRef] [Scilit]
- GB/T 50123-2019; Standard for Geotechnical Testing Method. China Planning Press: Beijing, China, 2019.
- Barton, N.; Choubey, V. The shear strength of rock joints in theory and practice. Rock Mech. 1977, 10, 1–54. [Google Scholar] [CrossRef] [Scilit]
- Tse, R.; Cruden, D.M. Estimating joint roughness coefficients. Int. J. Rock Mech. Min. Sci. Geomech. Abstr. 1979, 16, 303–307. [Google Scholar] [CrossRef] [Scilit]
- Fu, R.; Yang, B.; Hu, X.; Zhou, B.; Coop, M.R. A micromechanical investigation of sand–rubber mixtures using the discrete element method. Eng. Geol. 2023, 318, 107106. [Google Scholar] [CrossRef] [Scilit]
- Yang, S.; Huang, Y.; Jing, H.; Liu, X.-R. Discrete element modeling on fracture coalescence behavior of red sandstone containing two unparallel fissures under uniaxial compression. Eng. Geol. 2014, 178, 28–48. [Google Scholar] [CrossRef] [Scilit]
- Peng, J.; Wong, L.; Teh, C. A re-examination of slenderness ratio effect on rock strength: Insights from DEM grain-based modelling. Eng. Geol. 2018, 246, 245–254. [Google Scholar] [CrossRef] [Scilit]
- Casagrande, A.; Carillo, N. Shear failure of anisotropic materials. Proc. Boston Soc. Civ. Eng. 1944, 31, 74–78. Available online: https://cir.nii.ac.jp/crid/1572824500008688256 (accessed on 1 March 2026).
- Satake, M. The role of the characteristic line in static soil behavior. In IUTAM Symposium on Deformation and Failure of Granular Materials; Balkema: Delft, The Netherlands, 1982; pp. 63–68. Available online: https://vbn.aau.dk/ws/files/44434785/The_Role_of_the_Characteristic_Line_in_Static_Soil_Behavior.pdf (accessed on 1 March 2026).
- Oda, M. Fabric tensor for discontinuous geological materials. Soils Found. 1982, 22, 96–108. [Google Scholar] [CrossRef] [Scilit]
- Radjai, F.; Jean, M.; Moreau, J.J.; Roux, S. Force distributions in dense two-dimensional granular systems. Phys. Rev. Lett. 1996, 77, 274–277. [Google Scholar] [CrossRef] [Scilit]
- Zhang, W.; Yuan, C.; Xiao, W.; Lian, G.; Zhang, N.; Zhang, T. Effects of force chain on the jamming during iron powder compaction. Comput. Part. Mech. 2024, 11, 615–625. [Google Scholar] [CrossRef] [Scilit]
- Cates, M.E.; Wittmer, J.P.; Bouchaud, J.P.; Claudin, P. Jamming, force chains and fragile matter. Phys. Rev. Lett. 1998, 81, 1841–1844. [Google Scholar] [CrossRef] [Scilit]
- Fu, L.; Zhou, S.; Tian, Z.; Tian, Z. Force chain evolution in granular materials during biaxial compression. Rock Soil Mech. 2019, 40, 2427–2434. [Google Scholar] [CrossRef]
- Thornton, C. Numerical simulations of deviatoric shear deformation of granular media. Géotechnique 2000, 50, 43–53. [Google Scholar] [CrossRef] [Scilit]
- Świtała, B.; Leśniewska, D.; Kalwar, M.A. Micro-mechanisms of force network rearrangement in granular materials. Comput. Geotech. 2024, 174, 106602. [Google Scholar] [CrossRef] [Scilit]
- Liu, J.; Zhou, W.; Ma, G.; Yang, S.; Chang, X. Strong contacts, connectivity and fabric anisotropy in granular materials: A 3D perspective. Powder Technol. 2020, 366, 747–760. [Google Scholar] [CrossRef] [Scilit]
- Jin, L.; Li, J.; Ye, Y.; Wang, Y. 3D DEM-based particle-scale analysis of drained and undrained triaxial behaviors of granular materials. Comput. Part. Mech. 2024, 11, 2641–2654. [Google Scholar] [CrossRef] [Scilit]



Disclaimer/Publisher’s Note: The statements, opinions and data contained in all publications are solely those of the individual author(s) and contributor(s) and not of MDPI and/or the editor(s). MDPI and/or the editor(s) disclaim responsibility for any injury to people or property resulting from any ideas, methods, instructions or products referred to in the content. |
© 2026 by the authors. Licensee MDPI, Basel, Switzerland. This article is an open access article distributed under the terms and conditions of the Creative Commons Attribution (CC BY) license.