


Highlights
What are the main findings?
- Straw fibers enhance black soil mechanics, with content effect stronger than type.
- Optimal fiber content is 1%, achieving maximum UCS and RM for coarse fiber–soil.
- Fine fiber-reinforced soil shows better freeze–thaw resistance with lower porosity.
What are the implications of the main findings?
- A freeze–thaw damage evolution equation (R2 > 0.85) is proposed for cold-region soils.
Abstract
Freeze–thaw cycles are the main cause of subgrade damage in cold regions. To investigate how straw fibers affect the road performance of reinforced black soil in these areas, this study conducted unconfined compressive strength (UCS), California bearing ratio (CBR), and resilient modulus (RM) tests, supplemented by CT scanning. The novelty lies in comparing coarse and fine straw fibers and establishing a freeze–thaw damage prediction model. It analyzed the effects of straw fiber types (coarse and fine) and contents (0, 0.5%, 1.0%, 1.5%, 2.0%, 2.5%) on the soil’s mechanical properties and reinforcement mechanisms. Results showed that straw fibers enhance soil mechanics by distributing stress, limiting soil particle movement, inhibiting crack growth, and reducing porosity. Fiber content impacts the mechanical properties of reinforced soil more significantly than fiber type. The optimal fiber content for both coarse and fine straw fibers is 1%. At this content, the UCS of coarse fiber-reinforced soil (CFS) reached 1.11 MPa, a 32.14% increase compared to the reference group (B-0), and the RM reached 207.39 MPa, a 63.70% increase compared to B-0. Meanwhile, the UCS of fine fiber-reinforced soil (FFS) reached 1.01 MPa, a 20.24% increase, and the RM reached 150.33 MPa, an 18.66% increase. Freeze–thaw cycles degrade mechanical properties by weakening the bond between soil and straw fibers. As the number of freeze–thaw cycles increases, both the UCS loss rate and RM loss rate rise. FFS exhibits superior freeze–thaw resistance compared to CFS, due to its lower porosity and fewer cracks. The developed freeze–thaw damage evolution equation shows a strong fit (R2 > 0.85) and applies to straw fiber-reinforced black soil under the conditions of this study. This research provides a theoretical basis for designing eco-friendly straw fiber-reinforced subgrades in cold regions.
1. Introduction
Cold regions and areas with seasonal permafrost in China cover about 53.5% of the total land area, mainly in the Northeast and Northwest [1]. In these regions, subgrades undergo prolonged freeze–thaw cycles, causing the pore water in the soil to periodically freeze and melt. This leads to ice expansion pressure and osmotic pressure, resulting in subgrade heaving, uneven settlement, and slope collapse [2,3,4,5]. For instance, within 10 years, a railway subgrade in western China’s permafrost region settled by a maximum of 29.1 cm [6]. Similarly, 8 years after the Mobei Highway’s main line was completed in Northeast China, some subgrade sections showed a maximum settlement of 60 cm [7]. The freeze–thaw cycle is the primary cause of these issues [8]. Black soil, often used as a roadbed filling material in cold regions, is somewhat adhesive but prone to loosening and damage after freeze–thaw cycles. A single freeze–thaw cycle can reduce its UCS by up to 38.2% [9], making it unsuitable for the long-term stability needs of roadbeds.
The article, Accelerating the Resource Utilisation of Agricultural Wastes, published by China’s Ministry of Agriculture and Rural Affairs in 2025, states that China’s annual crop straw production has reached 865 million tons. Traditional incineration methods waste biomass resources and cause significant air pollution. Research has shown, each increase of 10 straw burning sites raises the PM2.5 concentration in the air by 8.17 μg/m3 [10]. Straw fiber, an eco-friendly modifier, offers advantages such as abundant availability, low cost, and biodegradability. Research has shown that straw fiber enhances soil cohesion [11], strength [12], and deformation resistance [13]. However, current studies on straw fiber-enhanced soil face three key limitations: (1) Regarding mechanical property optimization, Sunil et al. (2019) [14] demonstrated that incorporating 1.0% wheat straw fiber could triple the UCS of clay, but experiments were restricted to a single fiber type. (2) Regarding freeze–thaw resistance, Xu et al. (2021) [15] investigated cotton straw fiber in saline soil, but focusing solely on macroscopic strength attenuation without analyzing the mesoscopic structure. (3) In terms of filler compatibility, research has predominantly concentrated on sandy soil [16,17] and loess [18,19], with limited studies on black soil in cold regions. The “fiber–soil interface bonding” mechanism remains unclear.
Research on black soil subgrade currently faces three main gaps: (1) A comparative analysis of the effects of coarse versus fine straw fibers on black soil properties is lacking; (2) There is inadequate systematic evaluation of core road performance indicators, such as UCS, CBR, and RM; (3) The correlation model for “macroscopic performance—mesoscopic structure” under freeze–thaw cycles remains incomplete. To address these gaps, this study aims to (1) investigate how varying fiber content (0, 0.5%, 1.0%, 1.5%, 2.0%, 2.5%) and fiber type (coarse/fine) influence the UCS, CBR, and RM of black soil; (2) uncover the attenuation characteristics of UCS and RM in black soil enhanced with different fibers after 1, 3, 5, and 7 freeze–thaw cycles; (3) develop a correlation mechanism between “macroscopic performance—mesoscopic structure” using CT scanning; (4) propose the best method for enhancing black soil subgrades in cold regions using straw fibers. Against this background, the main novelties and contributions of this work are as follows: (1) Existing studies mainly focus on a single fiber type or lack comparative analysis between coarse and fine fibers, while this study systematically compares the reinforcement effect of coarse and fine straw fibers on black soil; (2) Previous studies only characterize macroscopic strength attenuation, but this work combines CT scanning to establish the “macroscopic performance—mesoscopic structure” correlation mechanism under freeze–thaw cycles, which makes up for the lack of multi-scale analysis. (3) Most studies do not involve freeze–thaw damage prediction models, whereas this study proposes a freeze–thaw damage evolution equation with high fitting accuracy, which can be applied to the durability prediction of fiber-reinforced black soil subgrade in cold regions.
2. Materials and Methods
2.1. Test Materials
2.1.1. Black Soil
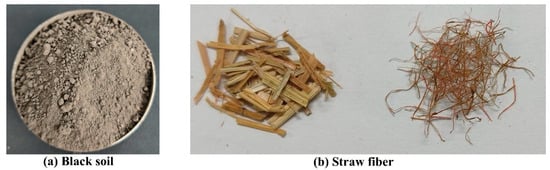
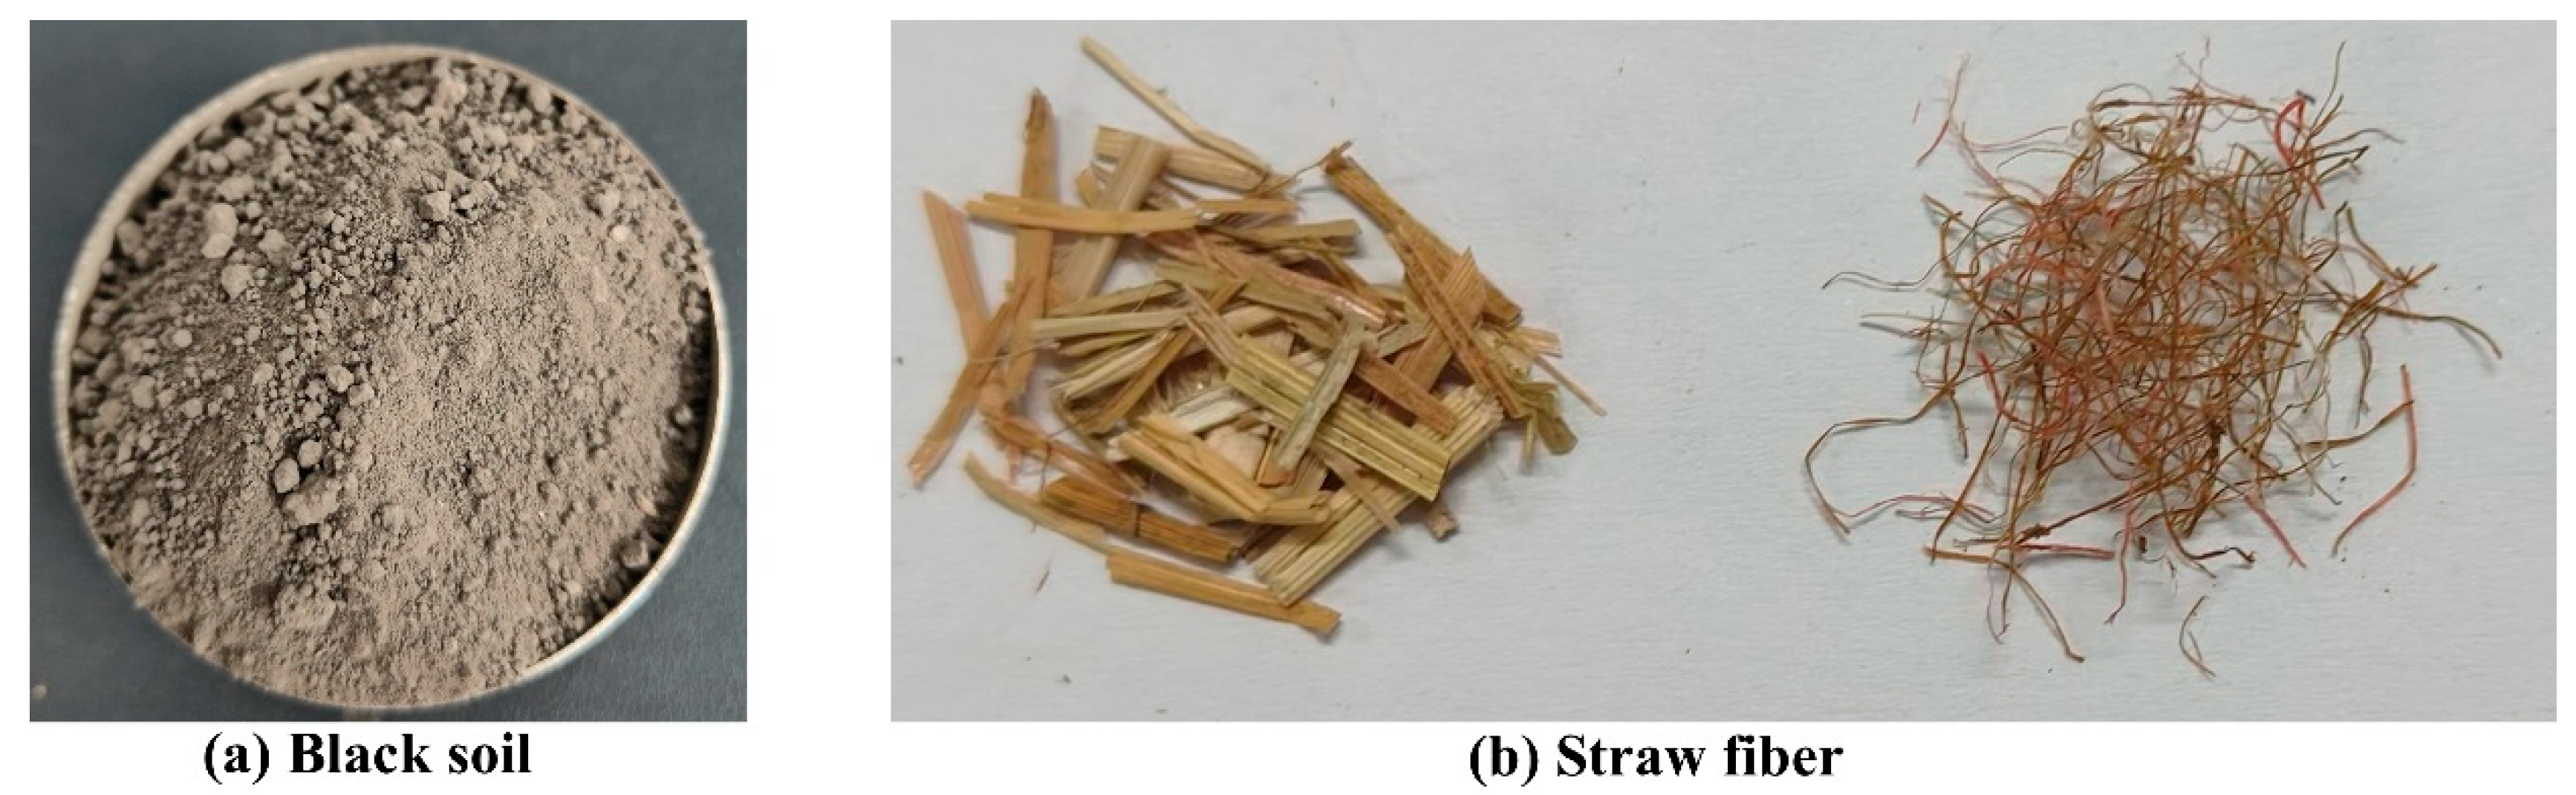
Black soil samples were obtained from a subgrade construction site on the Mobei Expressway, specifically the Wudalianchi to Nenjiang section in Heilongjiang Province, China. The samples were collected at a depth of 1.5 to 2.0 m (48°30′ N, 125°15′E), as depicted in Figure 1a.
Figure 1.
Test materials.
The fundamental physical properties of black soil were assessed following the Test Methods of Soils for Highway Engineering (JTG 3430-2020, Chinese Industry Standard; China Communications Press: Beijing, China, 2020). The results are presented in Table 1.
Table 1.
Physical properties of black soil.
2.1.2. Straw Fiber
The study uses agricultural waste straw as the raw material. Two types of straw fibers—coarse and fine—were prepared. The coarse fibers, manually sheared, and the fine fibers, mechanically processed, were both lengths of 5–10 mm (Figure 1b). The straw underwent an anti-corrosion treatment [20], soaking in 5% saturated lime water for 24 h. Subsequently, it was rinsed with clean water until neutral, dried at 60 °C for 48 h to achieve a constant weight, and then sealed for future use. The fine fibers were sourced from a processing factory in Heilongjiang. The physical and mechanical properties of the two fiber types are characterized as follows: the coarse fibers have a diameters of 0.5–2.0 mm, aspect ratio of 3–20, tensile strength of 15–40 MPa, apparent density of 0.3–0.6 g/cm3, and 24-h water absorption capacity of 200%–280%. The fine fibers have a diameter of 0.1–0.3 mm, aspect ratio of 17–100, tensile strength of 5–30 MPa, apparent density of 0.3–0.6 g/cm3, and 24-h water absorption capacity of 280–380%.
2.2. Specimen Preparation
2.2.1. Mix Ratio Design
Six fiber content gradients were established based on the mass of dry black soil, with mass fractions of 0%, 0.5%, 1.0%, 1.5%, 2.0%, and 2.5%. Each gradient was tested with two fiber types: coarse and fine. The control group, without fiber, was labeled B-0. Coarse fiber-reinforced soils were designated CFS(-α), and fine fiber-reinforced soils were labelled FFS(-α), where α indicates the fiber content (%). To ensure reliable test data, three parallel specimens were prepared for each group. All specimens adhered to the black soil’s optimal moisture content of 16.5% and maximum dry density of 1.69 g/cm3. The compaction level was maintained at 96%, suitable for subgrades in cold regions.
Although the optimal straw fiber content for soil reinforcement is mostly reported in the range of 0.2%–1.0%, this study sets a higher content range (up to 2.5%) for the following reasons: (1) To determine the complete variation law of mechanical properties with fiber content, including the rising stage, peak point and declining stage; (2) To reveal the adverse effect of excessive fiber agglomeration on soil strength and deformation performance, so as to avoid excessive fiber addition in engineering practice; (3) To provide full-range data support for the correlation analysis between fiber content and road performance. Therefore, the extended content range is essential to achieve the research objectives and ensure practical guiding significance.
2.2.2. Sample Preparation
During the specimen forming process, sample preparation focused on preventing fiber agglomeration: (1) Crush the dried black soil and pass it through a 2-mm sieve to remove impurities. (2) Calculate the required water and straw fiber amounts based on the mix ratio. First, evenly distribute the straw fibers into the black soil, stirring manually for 2 min to achieve initial dispersion. (3) Spray the water onto the mixture in three stages, stirring manually for 1 min after each spray (total stirring time is 3 min) to prevent fiber agglomeration. (4) Place the well-mixed mixture into a sealed plastic bag and leave it for 24 h to ensure even water distribution. (5) Fill the mixture into the mold layer by layer, compacting it to form the specimen (cylindrical specimens: 152 mm in diameter and 120 mm in height).
2.3. Test Methods
2.3.1. Macroscopic Mechanical Property Tests
(1) CBR Test: This test was conducted in accordance with the T0134-2019 procedure specified in Test Methods of Soils for Highway Engineering (JTG 3430-2020, Chinese Industry Standard). Initially, the test specimen was submerged in water for 96 h, maintaining the water temperature at 20 ± 2 °C. After soaking, the surface moisture was wiped off. The specimen is then centered on the test bench, and an axial load is applied at a rate of 1 mm/min. During this process, the load-penetration curve is recorded. The CBR is calculated using the load at a penetration of 2.5 mm. However, if the CBR at a 5.0 mm penetration is greater, this value is used instead. One-way analysis of variance (ANOVA) was performed to examine the effect of fiber content on CBR, UCS and RM. Tukey’s post hoc multiple comparison test was used to identify significant differences between groups, with a significance level set at p < 0.05.
(2) UCS Test: This test was performed using an electronic universal testing machine (model: NLUTM-50 3.0, Shanghai Nolai Technology Development Co., Ltd., Shanghai, China). The loading rate is set at 2.4 mm/min. Axial load is applied continuously until the specimen fails. The maximum failure load is recorded, and the UCS (MPa) is calculated using Formula (1).
where Pmax is the maximum load (N) that the specimen experienced at the time of failure; A is the cross-sectional area of the specimen (mm2), calculated as πd2/4, where d indicated the diameter of the specimen.
(3) RM Test: This test follows the T0135-1993 method, as outlined in JTG 3430-2020, using the lever pressure gauge technique. The specimen is positioned beneath the bearing plate, and axial loads are applied incrementally at levels of 25, 50, 100, 150, and 200 kPa. At each load stage, both total and resilient deformations are recorded and the RM (MPa) is calculated using Formula (2).
where μ is the Poisson’s ratio of soil (taken as 0.35); D is the diameter of the bearing plate (cm); P is the unit pressure on the bearing plate (kPa); and δ is the rebound deformation under each level of load (cm).
2.3.2. Freeze–Thaw Cycles Test
The freezing temperature was −20 ± 1 °C for 12 h and the thaw temperature was 20 ± 1 °C for 12 h, such that one freeze–thaw cycle lasted 24 h [21]. The selected freeze–thaw temperatures (−20 °C and 20 °C) and durations (12 h each) were determined based on the field climatic conditions of typical cold regions in northern China, where the minimum winter temperature can reach −20 °C and the daily temperature variation is approximately 40 °C. This regime is also consistent with the commonly adopted test protocols for subgrade materials, ensuring the rationality and comparability of the test results. The freeze–thaw durability test was only performed on specimens with 1% fiber content, which was identified as the optimal dosage in the preceding mechanical property tests. This selection is based on the principle of focusing on the most representative and engineering-relevant condition, as the 1% content showed the best balance between strength improvement and economic efficiency. The purpose of the freeze–thaw test was to evaluate the durability performance of the optimal reinforced soil under field conditions, rather than to conduct a full parametric study on all dosages. A total of seven freeze–thaw cycles were conducted. Specimens of coarse- and fine-fiber-reinforced soil with a fiber content of 1% were selected, wrapped in plastic film to prevent internal moisture loss during cycling, and labelled. The specimens were then placed in a high–low temperature freeze–thaw chamber and subjected to the prescribed regime. After completion of 1, 3, 5 and 7 cycles, UCS and RM were measured; UCS loss rate (Dn) and RM loss rate (ηn) were calculated using Equations (3) and (4), respectively, and the deterioration behavior of the straw fiber reinforced soil under freeze–thaw cycling was analyzed.
where UCS0 and RM0 is the initial UCS (MPa) and RM (MPa) of the specimen prior to freeze–thaw, respectively, while UCSn and RMn denoted the UCS (MPa) and RM (MPa) of the specimens following n freeze–thaw cycles, respectively.
2.3.3. Mesoscopic Test
(1) CT Scanning: Specimens CFS-1-F7 and FFS-1-F7 were scanned after 7 freeze–thaw cycles using an industrial CT scanner (model: v∣tome∣x s 240, GE Sensing & Inspection Technologies GmbH, Wunstorf, Germany; scanning voltage: 180 kV, current: 100 μA, resolution: 142 μm). The scanned slices were binarized to determine porosity, allowing analysis of the evolution of internal pores in the soil due to freeze–thaw cycles. The raw CT images were processed as follows: median filtering was applied to reduce noise, and a global thresholding method based on the gray-level histogram was used to segment the solid and pore phases, which was validated by visual inspection of cross-sections. For each specimen, 100 consecutive slices in the central region (avoiding boundary effects) were selected for analysis. To assess repeatability, two independent analyses were performed on the same specimen, and the coefficient of variation (CV) of porosity measurements was less than 5%.
(2) Digital Camera Imaging: Examine the cross-sections of specimens (B-0, CFS-0.5, CFS-1, CFS-2.5, FFS-0.5, FFS-1, FFS-2.5) post-failure in the UCS test. Analyze the fiber dispersion within the soil and the interface bonding morphology between fibers and soil particles.
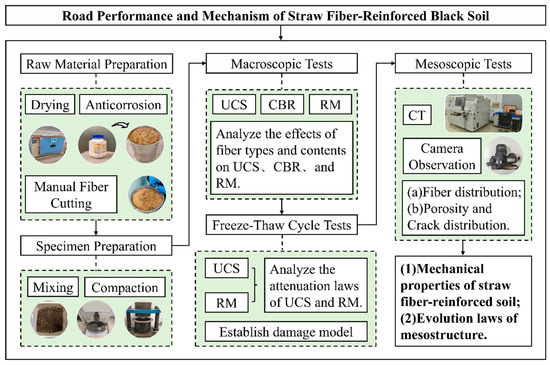
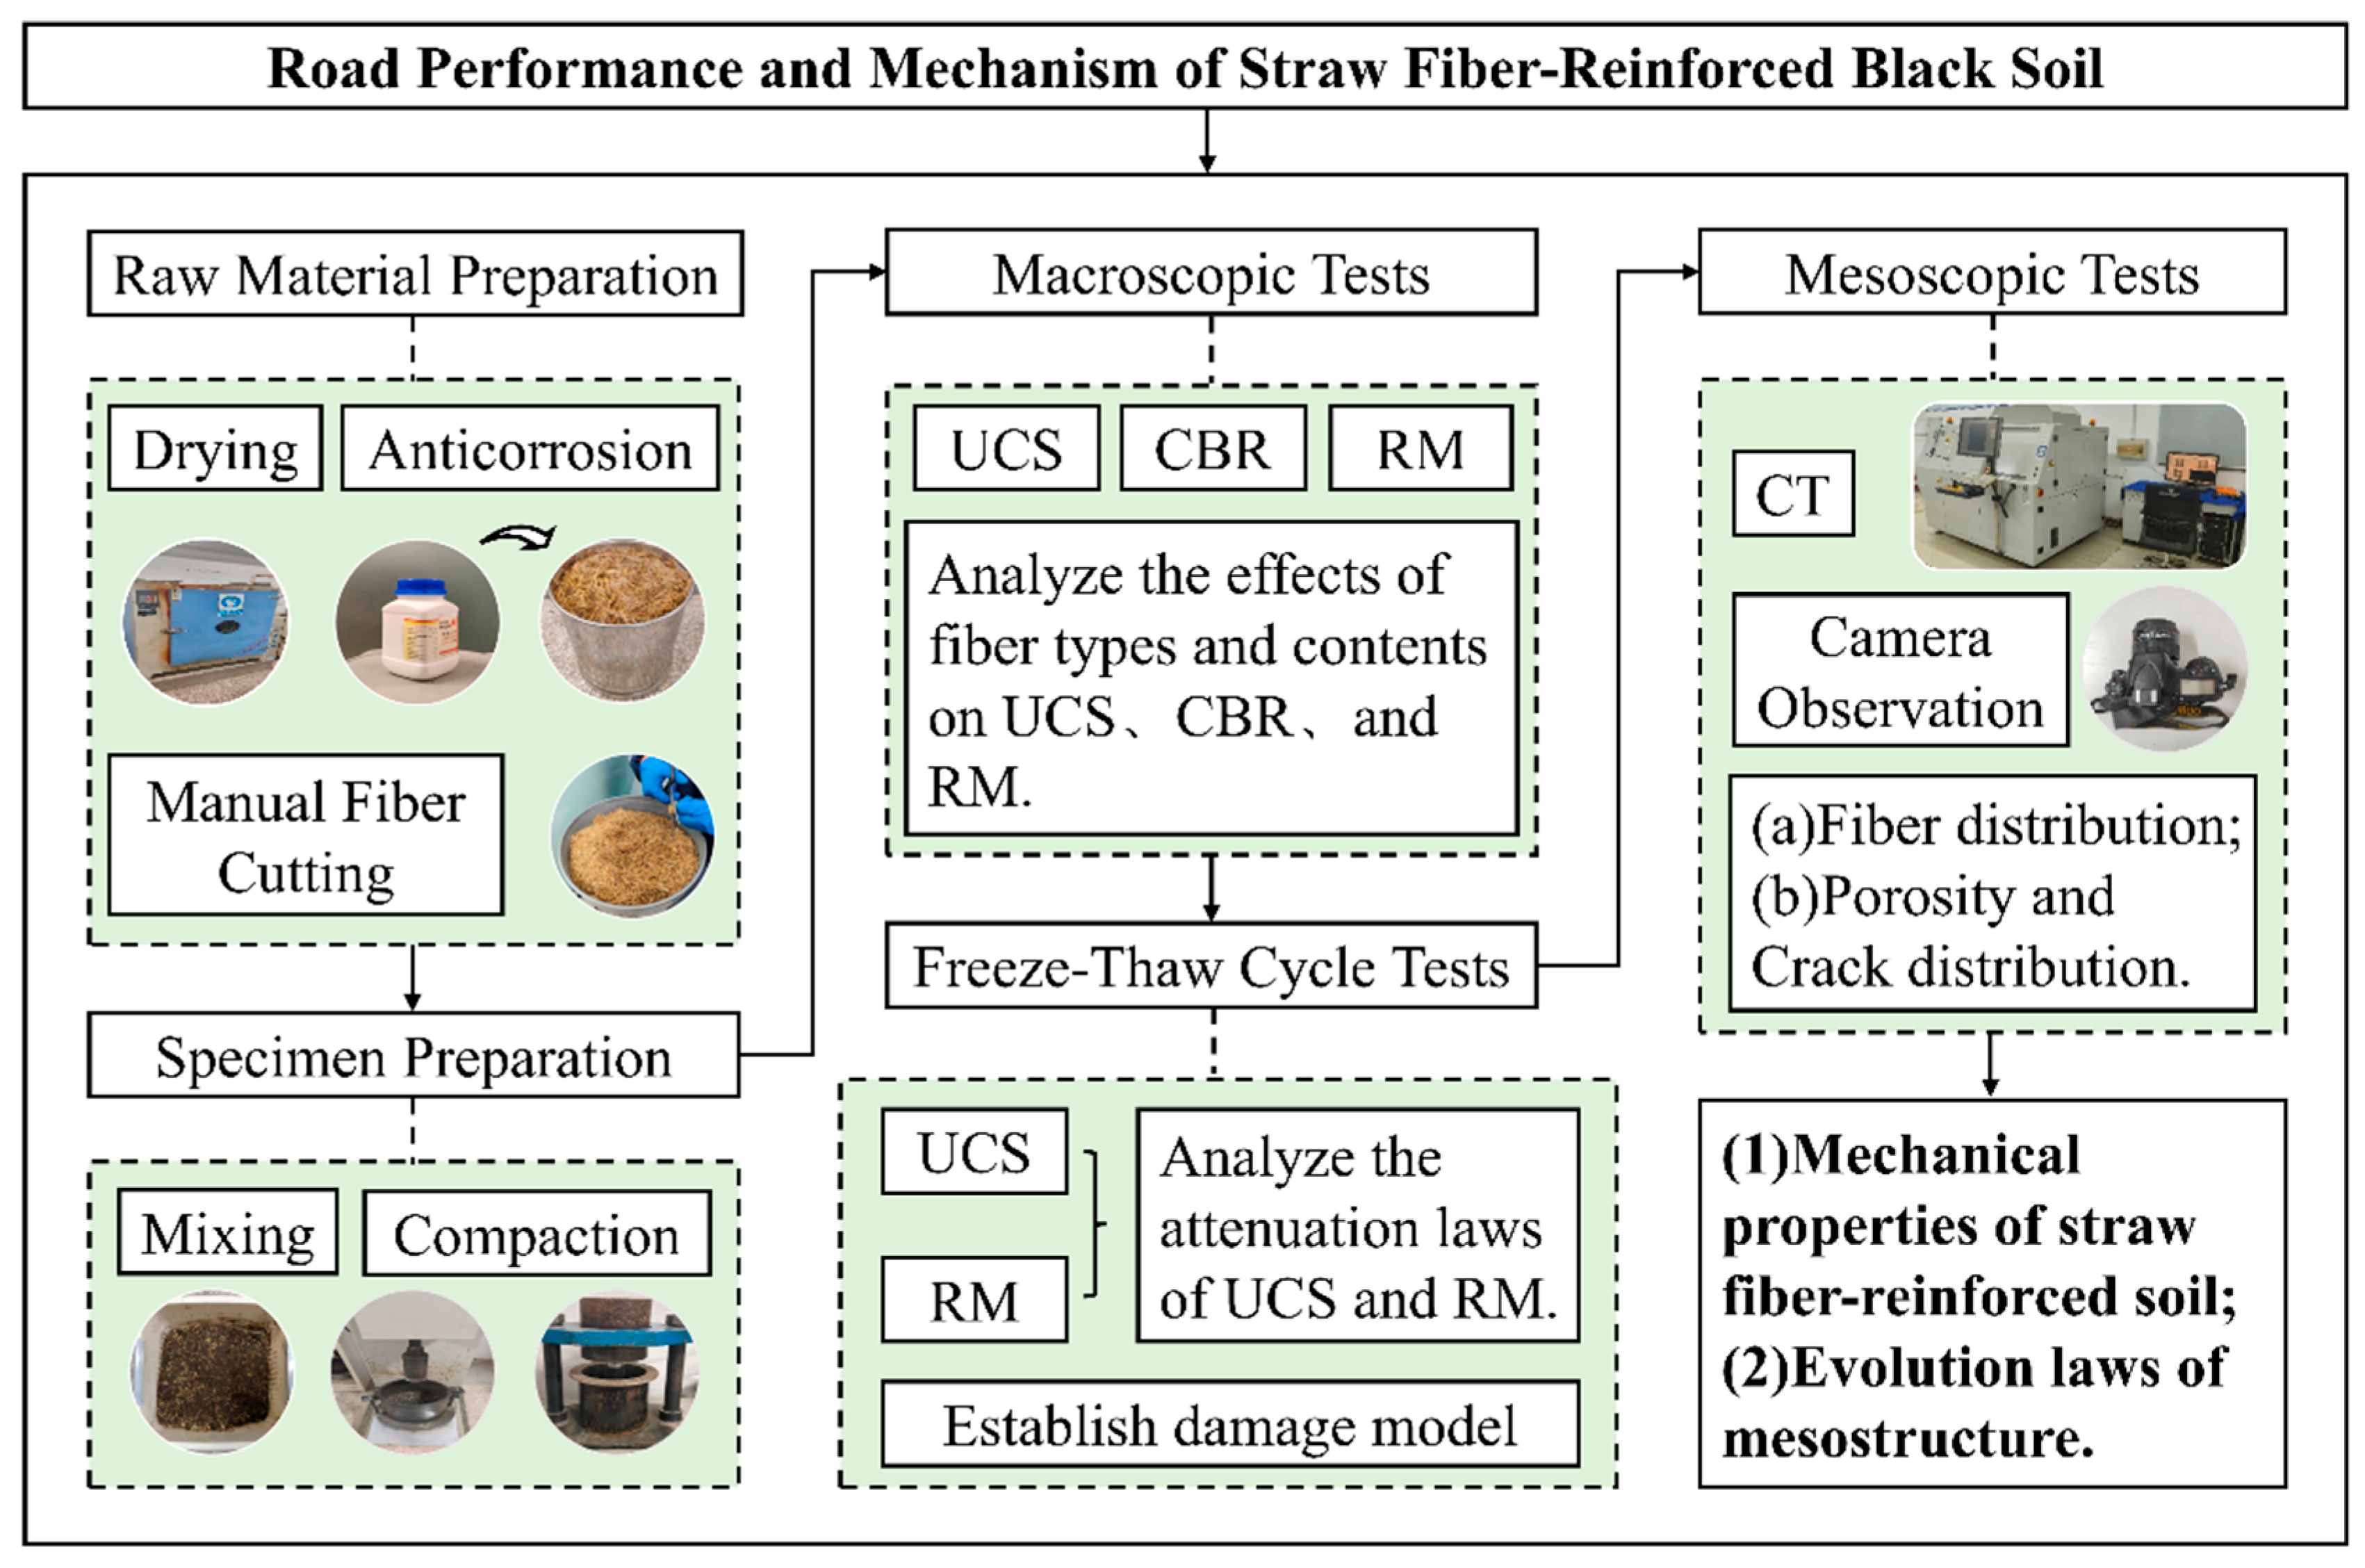
Figure 2 illustrates the experimental research process.
Figure 2.
Research flowchart.
3. Results and Discussion
3.1. Effect of Straw Fibers on the Road Performance of Reinforced Soil
3.1.1. Effect of Straw Fibers on UCS
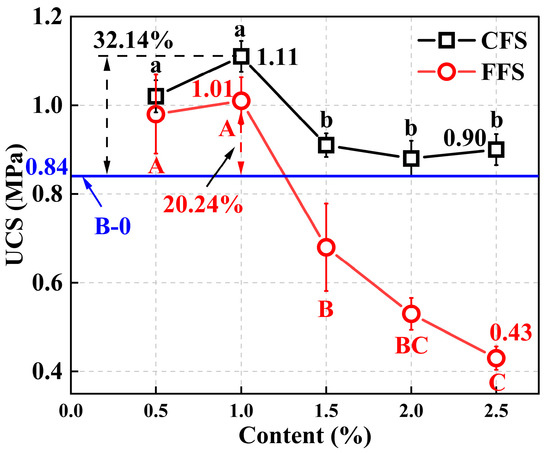
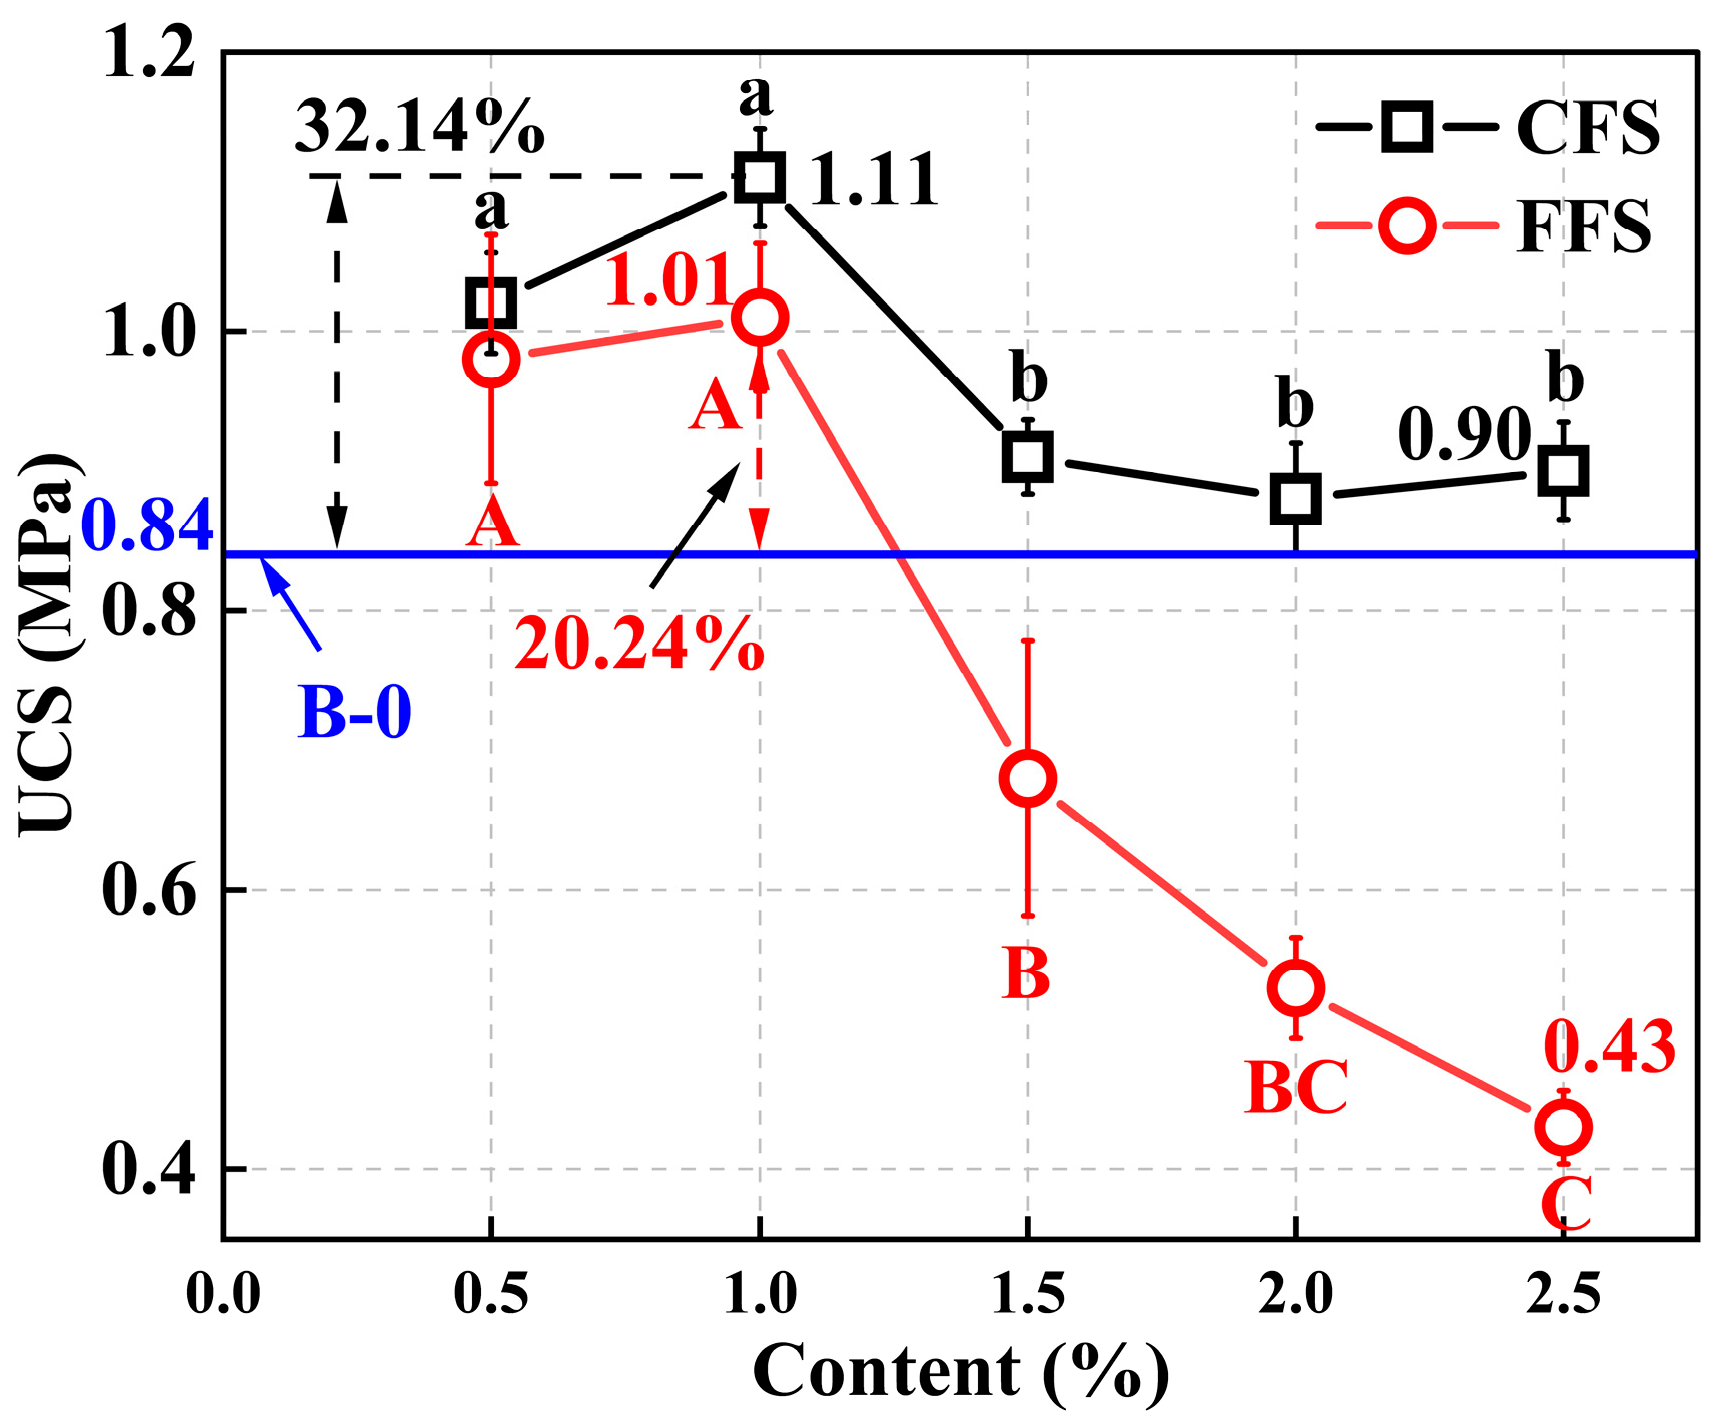
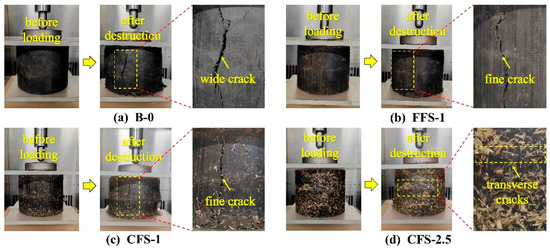
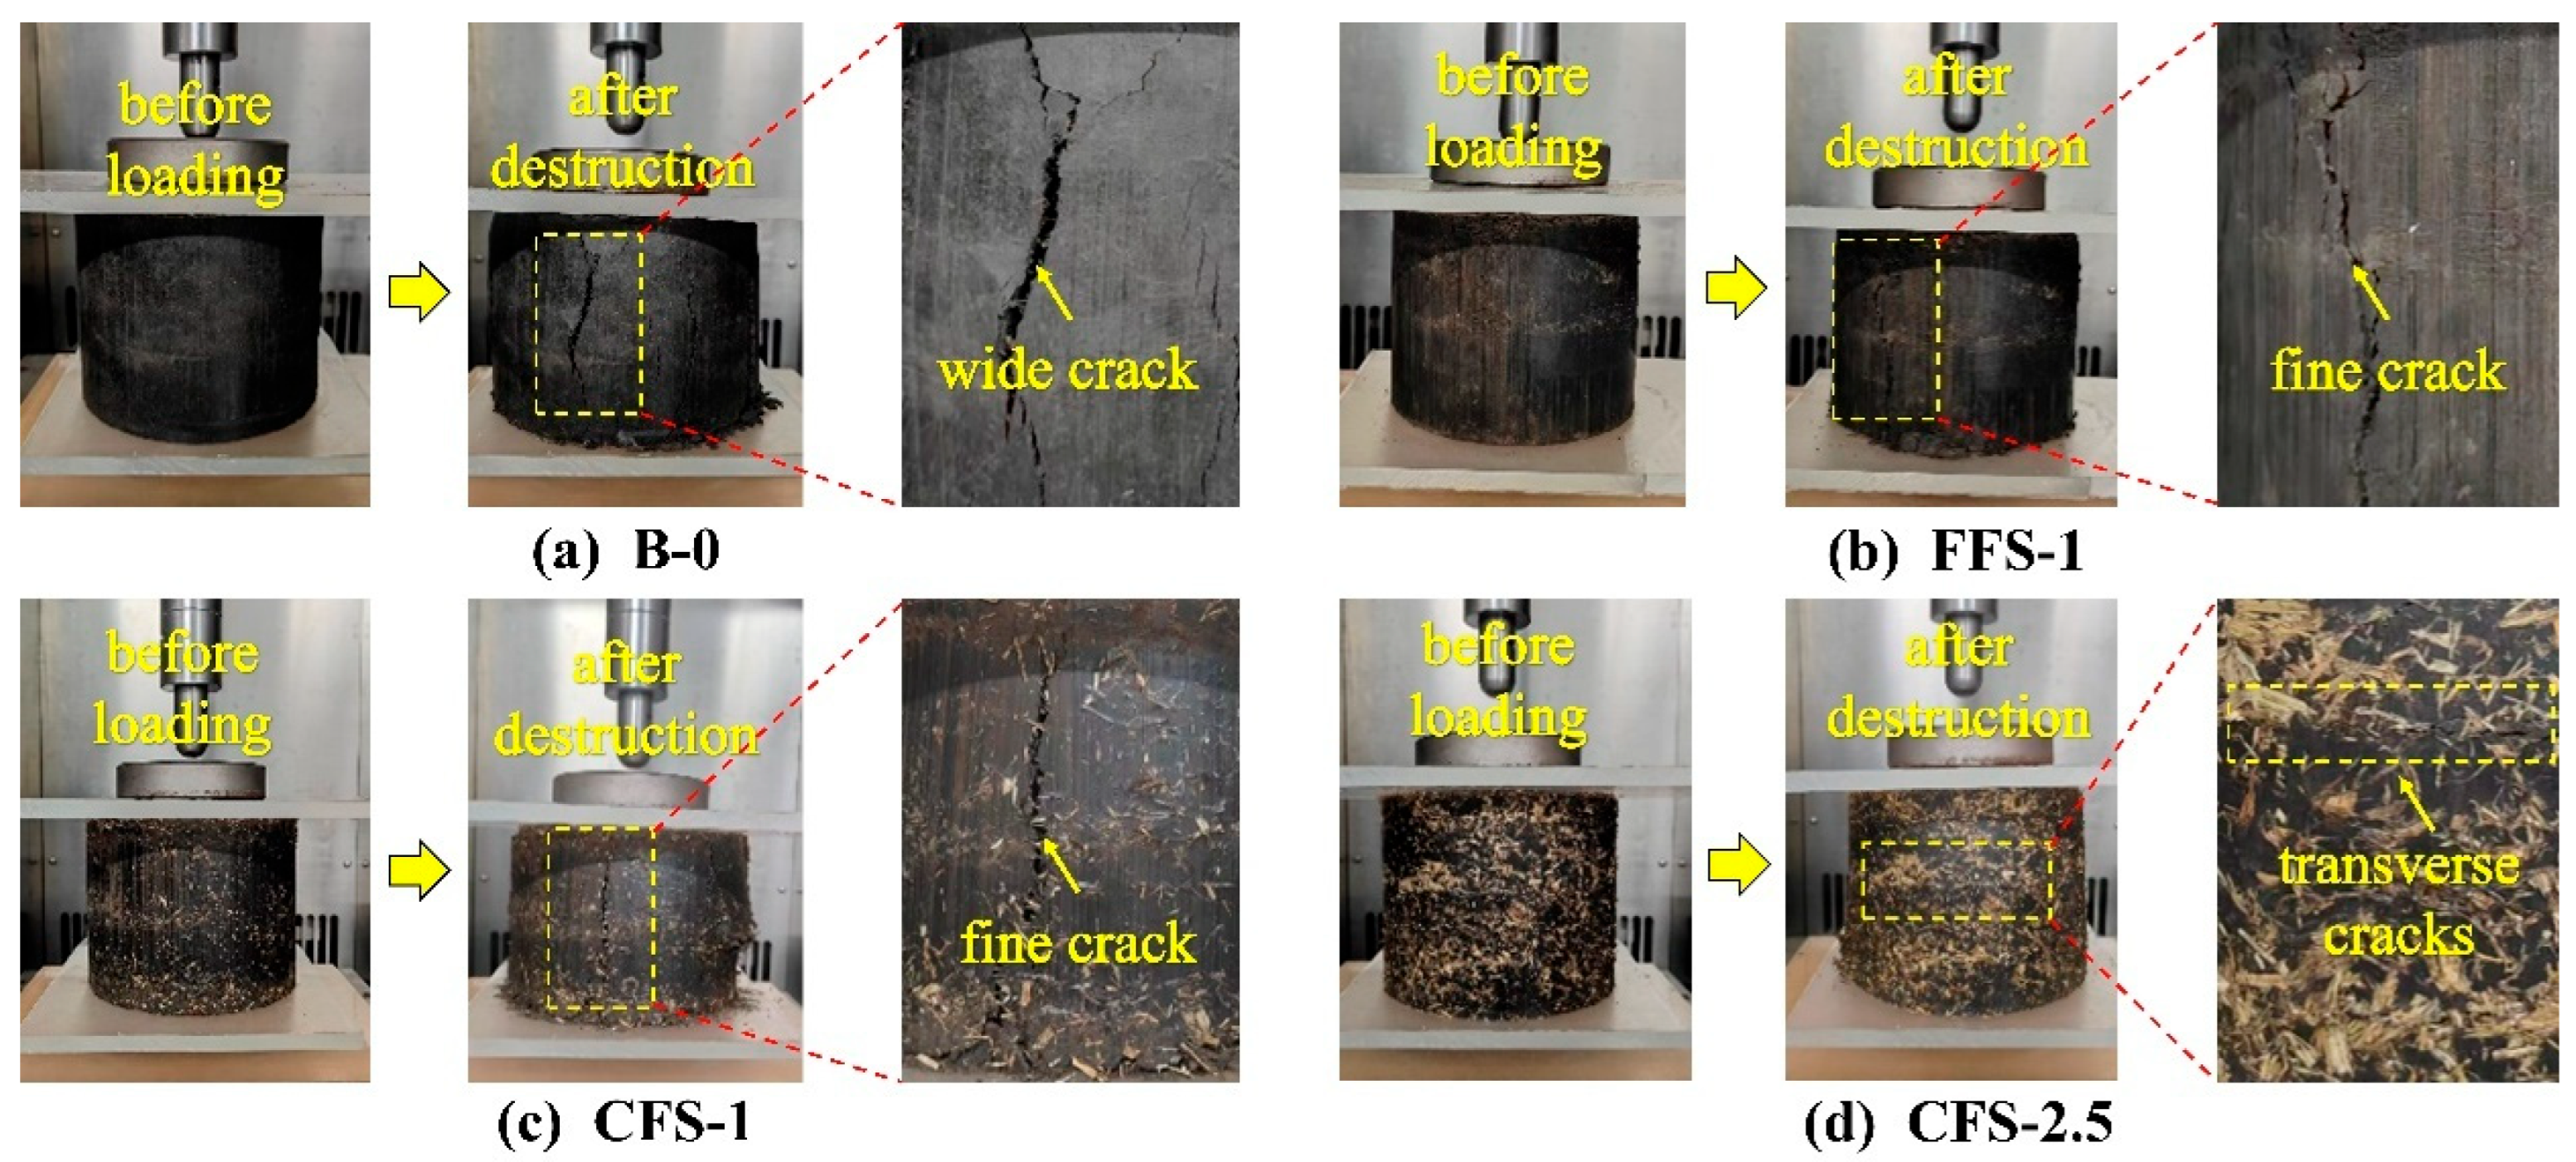
Figure 3 shows the variation in UCS of reinforced soil with different straw fiber contents. The UCS of the B-0 sample is 0.84 MPa. As fiber content increases, the UCS of both coarse and fine fiber-reinforced soils initially rises and then declines, peaking at 1% fiber content. At this peak, the UCS of the CFS-1 is 1.11 MPa, a 32.14% increase over B-0, while the FFS-1 reaches 1.01 MPa, a 20.24% rise compared to B-0. This trend occurs because, with fiber content below 1%, fibers distribute evenly within the soil, forming what appears to be a stable “skeleton–support” network that may effectively disperse stress [13]. Compared to the B-0 sample (Figure 4a), FFS-1 (Figure 4b) and CFS-1 (Figure 4c) exhibit narrower vertical cracks upon failure, indicating the fibers’ potential “binding effect” [22] that may constrain soil particle movement [20]. Thus, when fiber content is less than 1%, the UCS of reinforced soil increases with fiber content. Tukey’s post hoc test confirmed that for both CFS and FFS groups, the UCS values at 0.5% and 1.0% fiber contents were significantly higher than those at 1.5%, 2.0%, and 2.5% (p < 0.05). No significant difference was observed between 0.5% and 1.0% for either fiber type.
Figure 3.
UCS of reinforced soil with different straw fibers contents. Error bars represent standard deviation. Different lowercase letters (a, b) indicate significant differences (p < 0.05) among different contents for CFS. Different uppercase letters (A, B, C) indicate significant differences (p < 0.05) among different contents for FFS. Groups sharing the same letter are not significantly different.
Figure 4.
The failure mode of reinforced soil subjected to axial load.
When the fiber content exceeds 1%, the UCS begins to decline. At 2.5% fiber content, the UCS for CFS and FFS drops to 0.90 MPa and 0.43 MPa, decreases of 18.92% and 57.43% compared to the UCS at 1% fiber content, respectively. The decline is primarily due to fiber agglomeration within the soil, which enlarges weak zones. Consequently, under vertical loads, transverse cracks formed at these agglomeration sites and expand quickly (Figure 4d), destroying soil integrity and significantly reducing strength.
At the same content, CFS exhibits a higher UCS compared to FFS. This is primarily related to the larger diameter and macroscopic morphological differences of coarse fibers, as observed in the digital images. The coarser fibers tend to form a more stable spatial network structure, which may contribute to more effective stress dispersion.
3.1.2. Effect of Straw Fibers on CBR
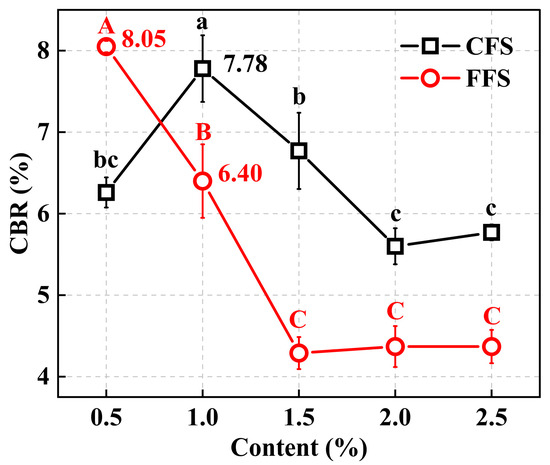
Figure 5 shows the CBR change curves for reinforced soil with varying straw fiber contents. The CBR of CFS initially increases, peaks at 7.78% with 1% fiber content, and then declines. Conversely, the CBR of FFS tended to decrease as fiber content rises, reaching a maximum of 8.05% at 0.5% fiber content. Tukey’s post hoc test confirmed that for the CFS group, the CBR value at 1.0% fiber content was significantly higher than those at 2.0% and 2.5% (p < 0.05). For the FFS group, the CBR value at 0.5% was significantly higher than those at 1.5%, 2.0%, and 2.5% (p < 0.05).
Figure 5.
CBR of reinforced soil with different straw fibers contents. Error bars represent standard deviation. Different lowercase letters (a, b, c) indicate significant differences (p < 0.05) among different contents for CFS. Different uppercase letters (A, B, C) indicate significant differences (p < 0.05) among different contents for FFS. Groups sharing the same letter are not significantly different.
The CBR indicates how well fiber-reinforced soil can resist local shear deformation. In FFS, the fibers are small, which increases the contact area with soil particles. At a low fiber content of 0.5%, local shear resistance improves. Conversely, at higher fiber content, fibers tend to agglomerate, reducing penetration resistance. This phenomenon may be related to the larger specific surface area and potentially stronger Van der Waals forces of fine straw fibers compared to coarse ones [23]. It should be emphasized that although the CBR of fine fiber-reinforced soil is the highest at 0.5%, the optimal fiber content of 1.0% is determined by comprehensively considering UCS, RM, and CBR indicators to achieve the overall optimal road performance.
3.1.3. Effect of Straw Fibers on RM
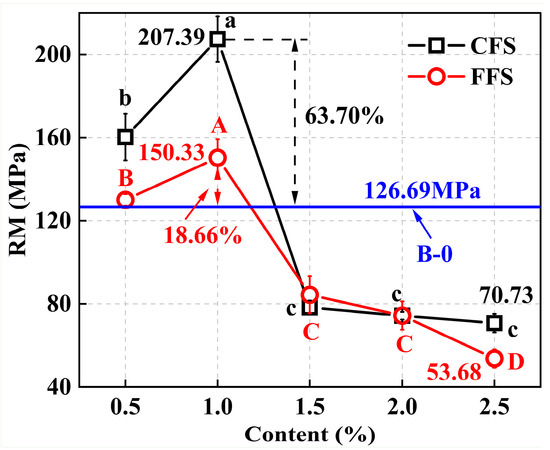
Figure 6 shows the variation curves of the RM of reinforced soil with different straw fiber contents. Initially, RM for both CFS and FFS increases with fiber content, peaking at 1%. At this point, CFS-1 achieves an RM of 207.39 MPa, a 63.70% increase over B-0, while FFS-1 reaches 150.33 MPa, an 18.66% increase. Beyond 1% fiber content, RM decreased and fell below that of B-0. At 2.5% fiber content, RM for CFS-2.5 and FFS-2.5 drops to 70.73 MPa and 53.68 MPa, respectively, representing decreases of 65.90% and 64.29% from CFS-1 and FFS-1. Overall, CFS consistently exhibits higher RM than FFS at equivalent fiber contents. Tukey’s post hoc test confirmed that for the CFS group, the RM value at 1.0% fiber content was significantly higher than those at 1.5%, 2.0%, and 2.5% (p < 0.05). For the FFS group, the RM value at 1.0% was significantly higher than those at all other contents, while the value at 2.5% was significantly lower than those at 0.5%, 1.0%, and 1.5% (p < 0.05).
Figure 6.
RM of reinforced soil with different straw fibers contents. Error bars represent standard deviation. Different lowercase letters (a, b, c) indicate significant differences (p < 0.05) among different contents for CFS. Different uppercase letters (A, B, C, D) indicate significant differences (p < 0.05) among different contents for FFS. Groups sharing the same letter are not significantly different.
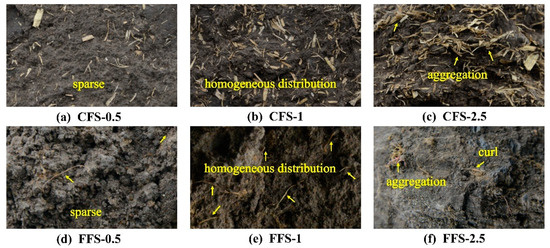
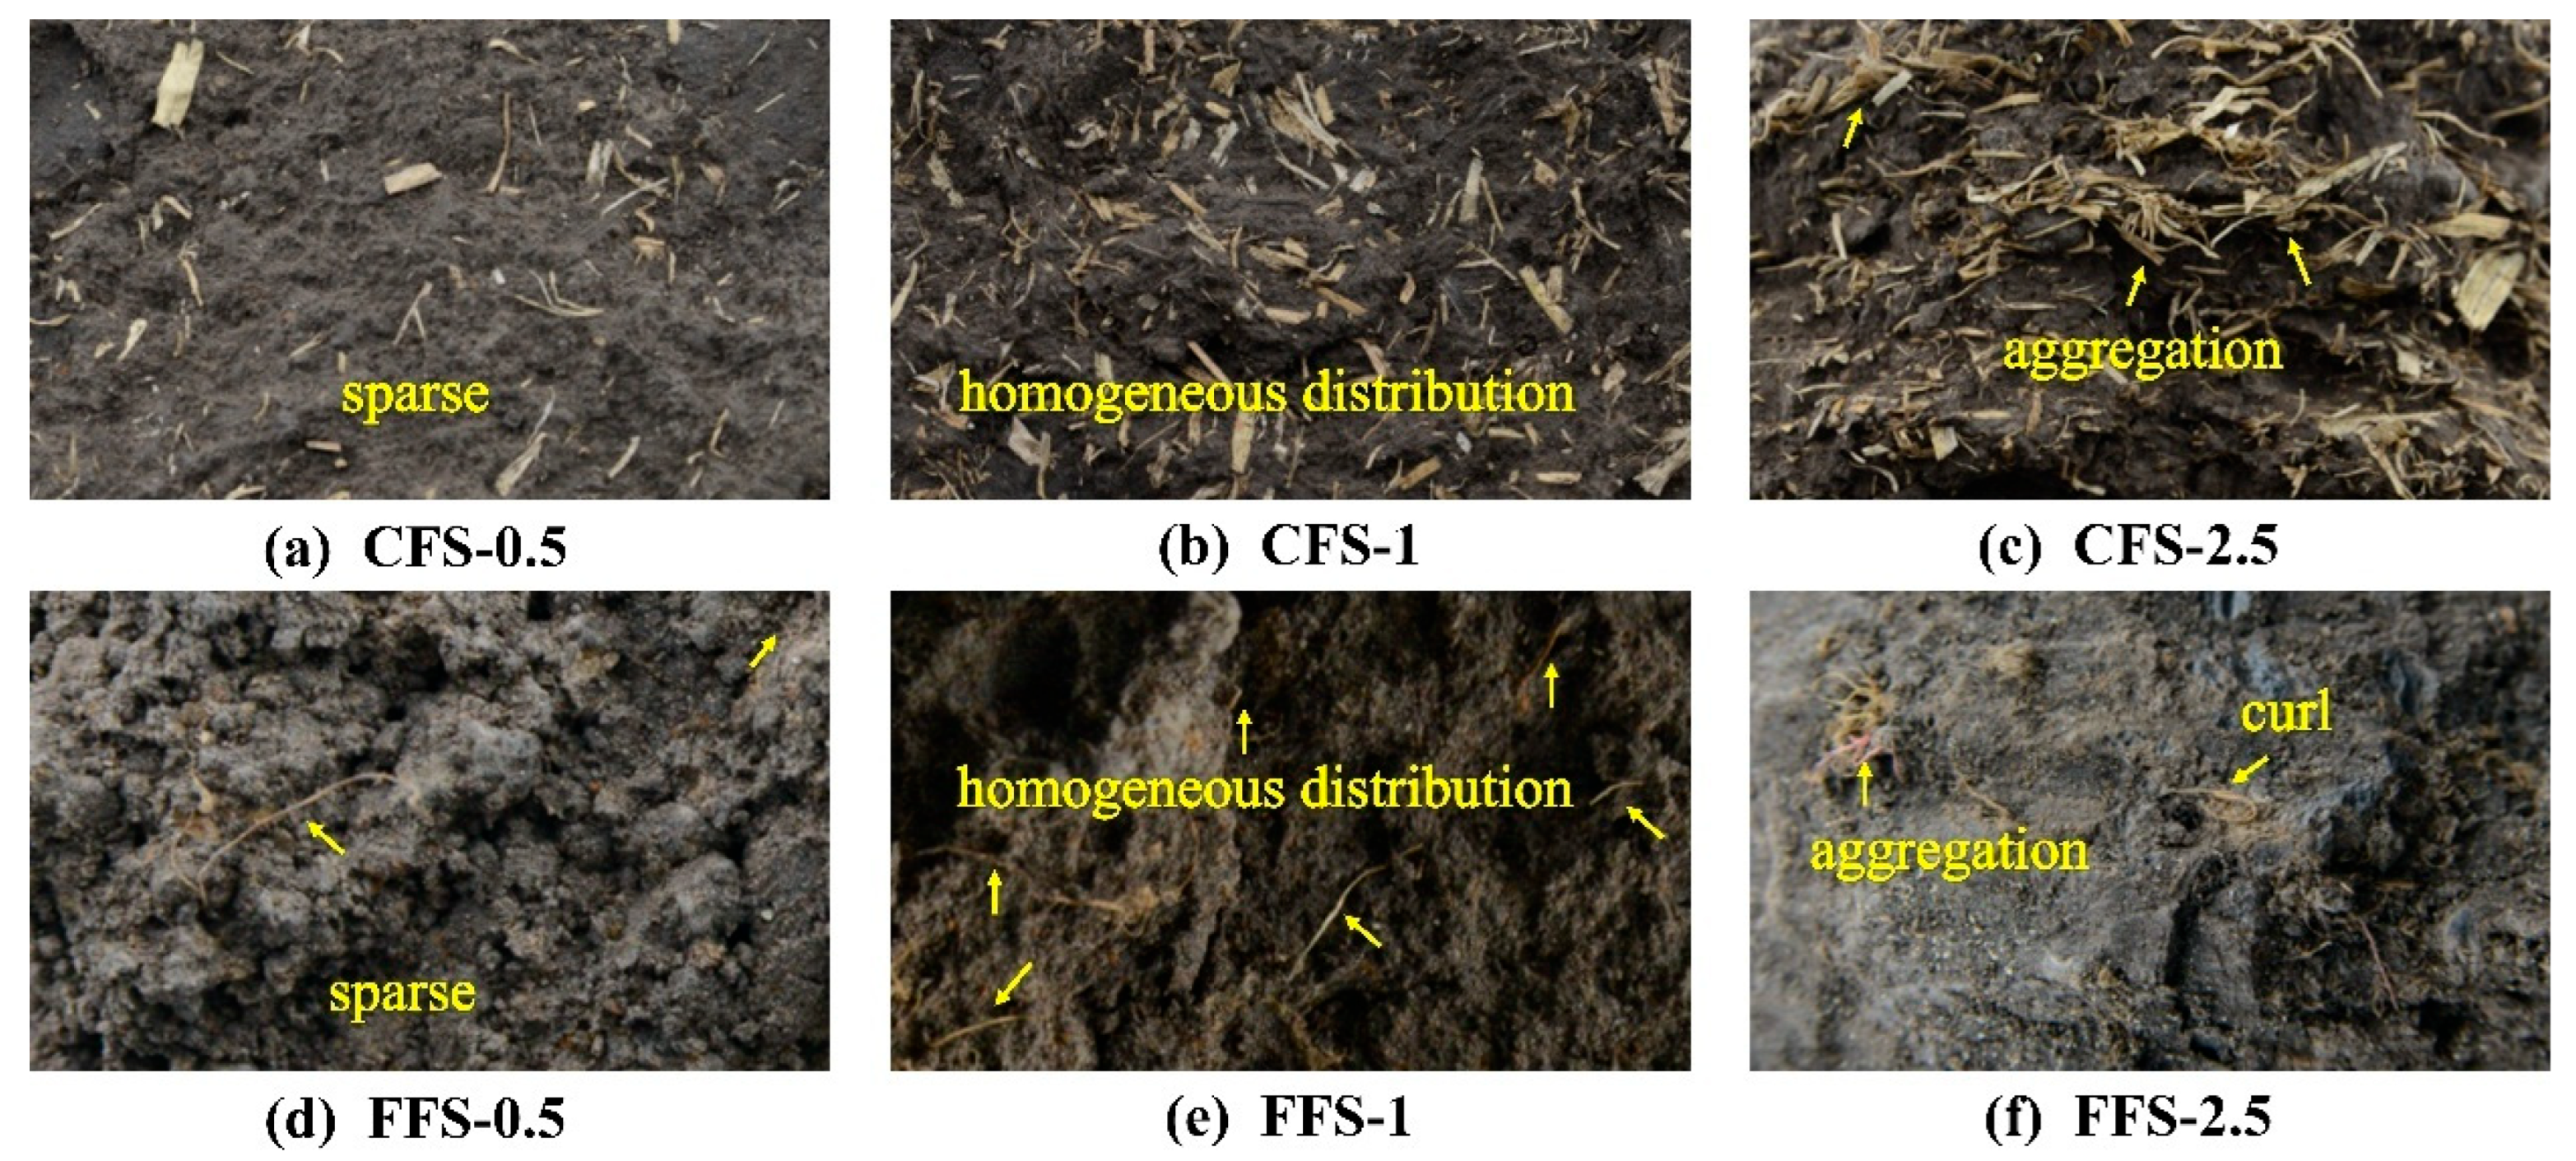
When the fiber content is 0.5% (Figure 7a,d), the fibers are sparsely distributed, resulting in an insignificant reinforcement effect. At 2.5% content (Figure 7c,f), fibers agglomerate within the soil, increasing internal voids and weakening reinforcement effect. However, with 1% content (Figure 7b,e), fibers are uniformly distributed, forming a network structure that effectively reduces plastic deformation. Consequently, the reinforced soil’s RM is highest at this content.
Figure 7.
Distribution of straw fibers in reinforced soil.
As observed in the fiber distribution images, coarse fibers provide more effective spatial support and interlocking structure under the same content, which may enhance the elastic deformation resistance of the soil. This contributes to the higher RM of CFS.
3.1.4. The Degree of Influence of Fiber Type and Content on the Road Performance of Reinforced Soil
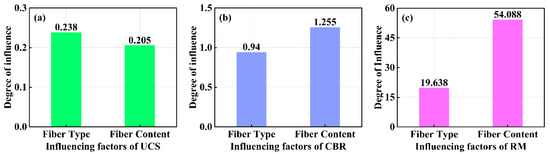
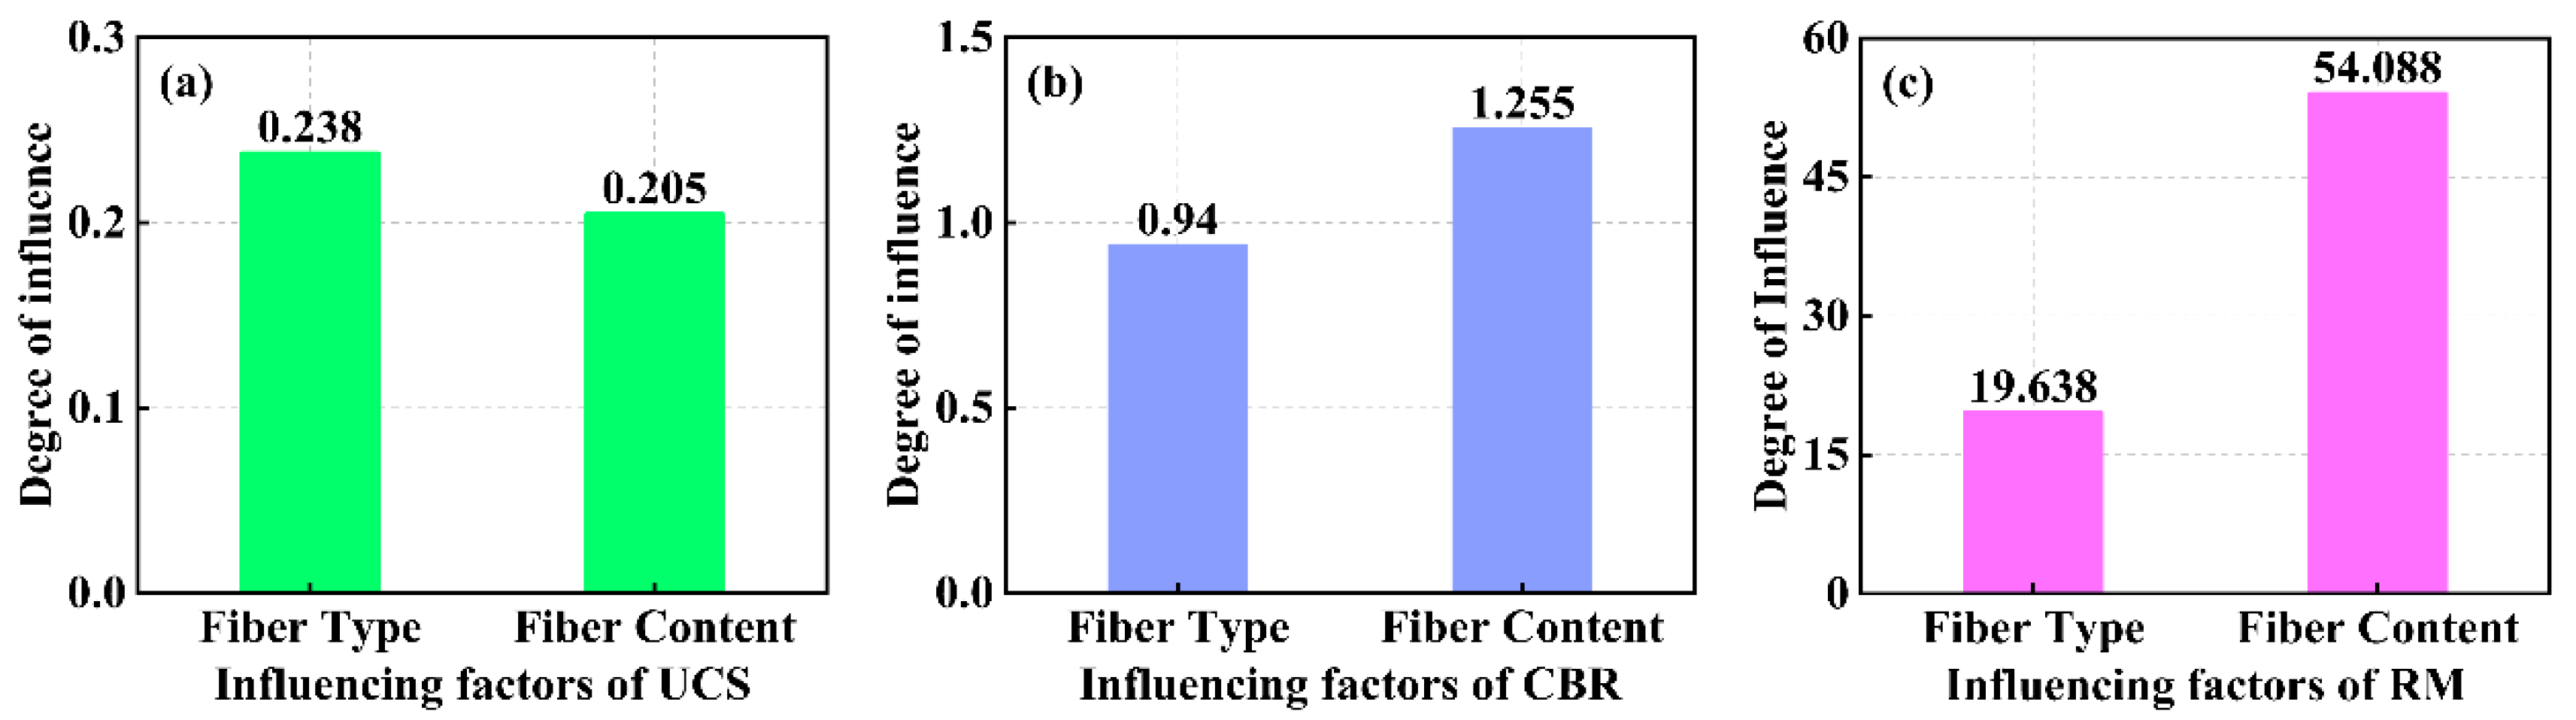
Although the mechanical properties exhibit a clear nonlinear trend (increasing first and then decreasing) with fiber content, a multiple linear regression model was adopted in this section only to compare the relative importance of fiber type and fiber content, rather than to fit the nonlinear relationship between fiber content and mechanical properties. The magnitude of influence was quantified by the absolute value of the standardized regression coefficients, and the results are presented in Figure 8.
Figure 8.
The degree of influence of fiber type and content on the mechanical properties: (a) UCS; (b) CBR; (c) RM.
For the UCS (Figure 8a), the impact of fiber type and content shows minimal difference, with a variance of just 0.033. However, for the CBR and RM (Figure 8b,c), fiber content significantly outweighs fiber type in influence, with differences of 0.315 and 34.45, respectively. This is because the CBR measures the soil’s resistance to local shear deformation, directly influenced by fiber content, which affects the “local” area size. RM indicates the material’s elastic deformation capacity; straw fibers, regardless of thickness, have much higher elastic moduli than soil particles. Thus, fiber content significantly impacts the RM of reinforced soil. In summary, fiber content has a more substantial effect on the road performance of reinforced soil compared to fiber type. This addresses the “research gap on fiber type modified black soil” highlighted in the introduction.
3.1.5. Correlation Among Fiber Content, UCS, CBR and RM
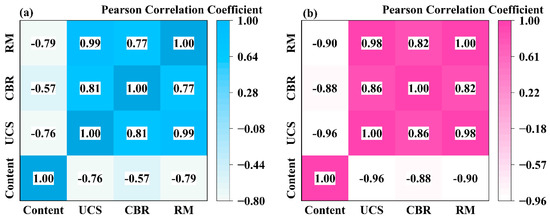
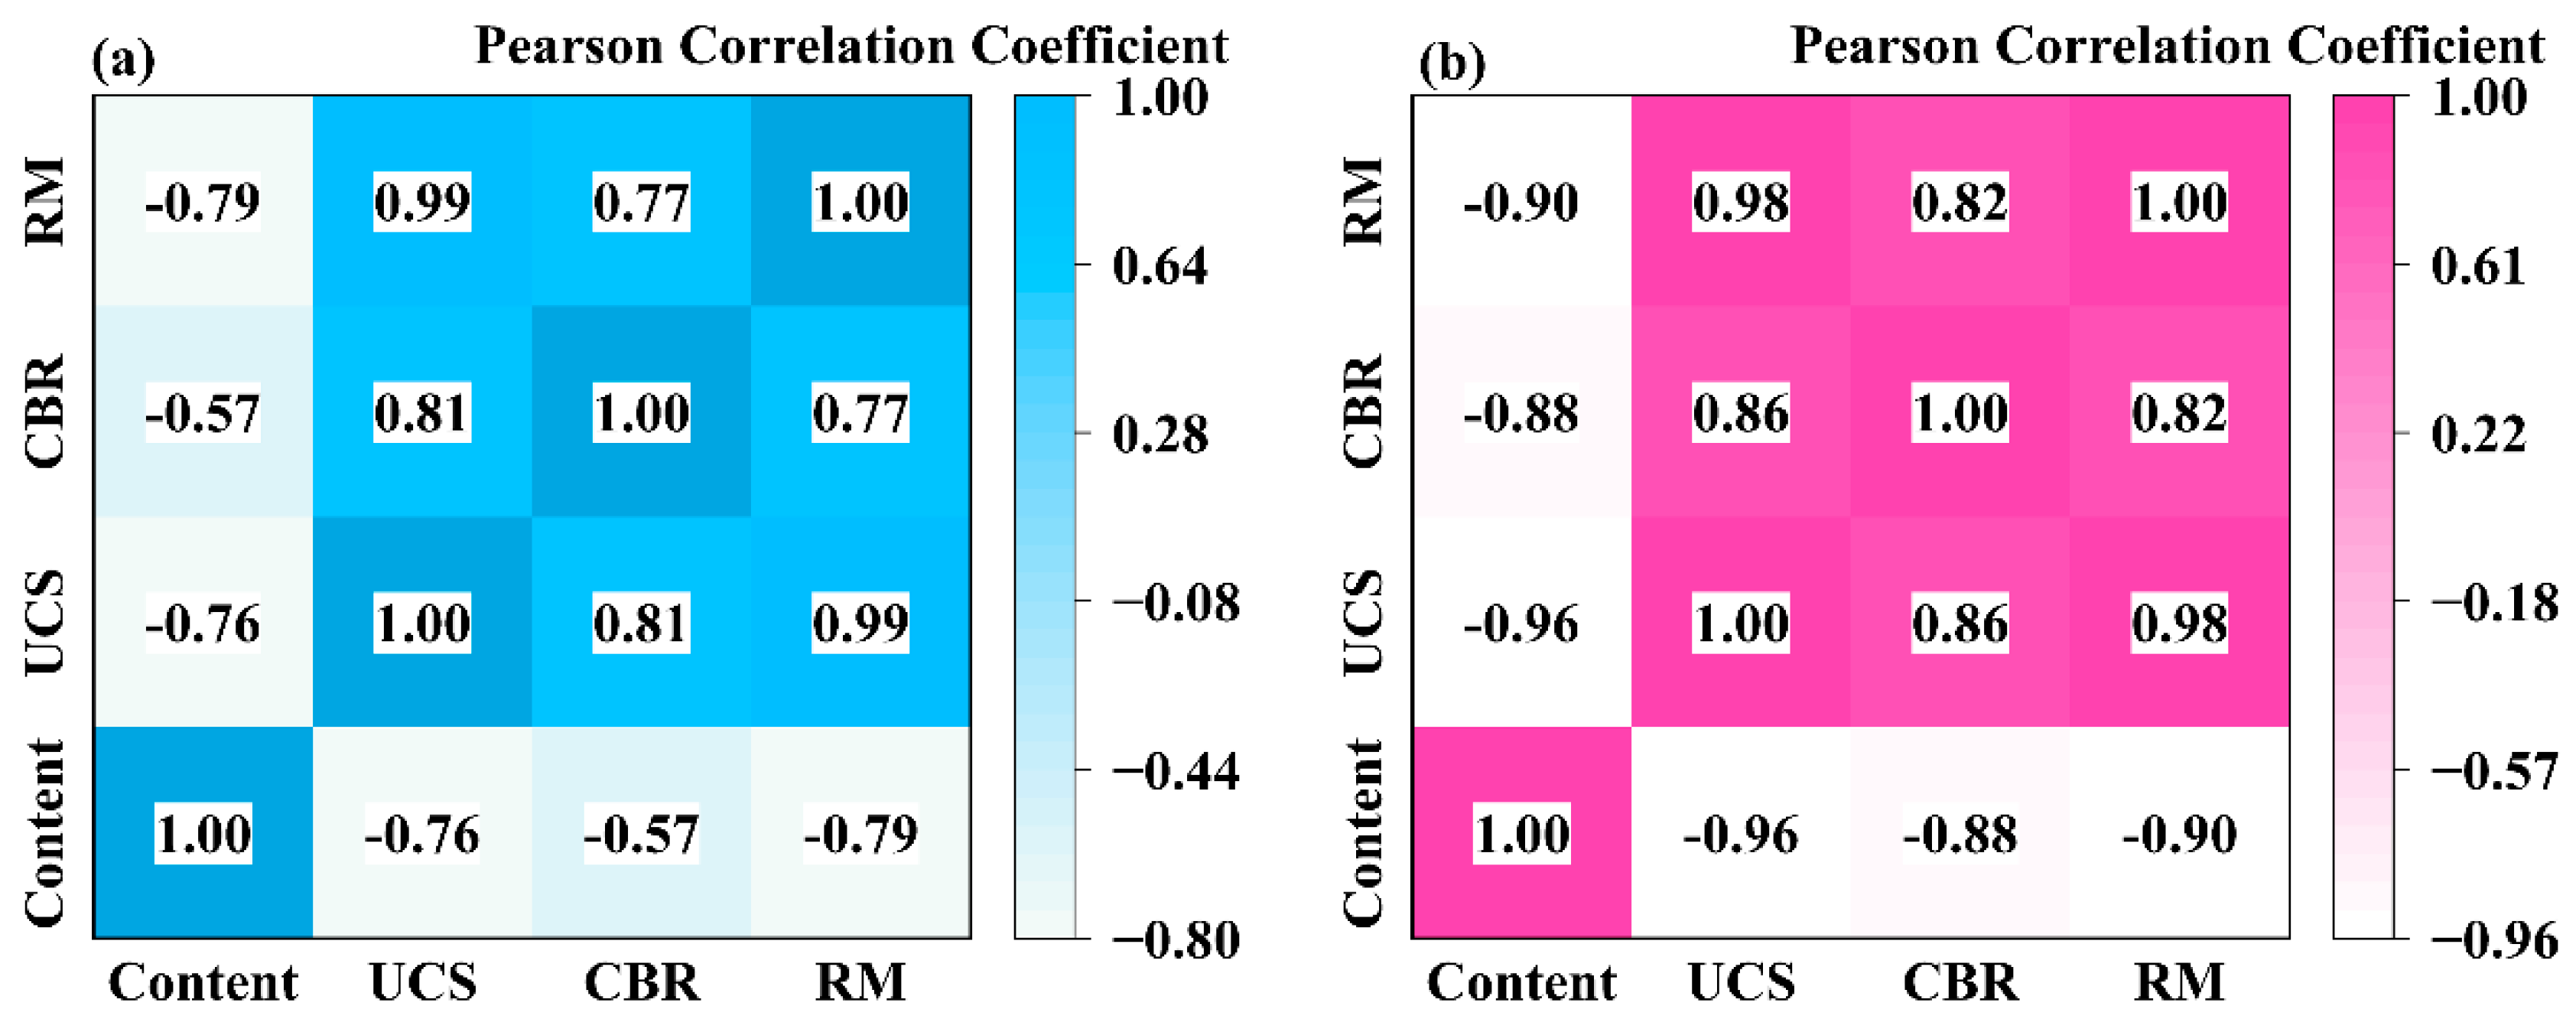
Based on the analysis results in Section 3.1.4, this study further examined the relationship between fiber content and the mechanical properties of reinforced soil. A correlation heatmap was generated to illustrate these findings. For CFS (Figure 9a), fiber content showed a negative correlation with UCS, CBR, and RM, with correlation coefficients of −0.76, −0.57, and −0.79, respectively. In FFS (Figure 9b), the negative correlations were even stronger, with coefficients of −0.96, −0.88, and −0.90. This indicates a strong negative correlation between excessive fine fiber content and the mechanical properties of reinforced soil.
Figure 9.
Correlation heatmap between content, UCS, CBR and RM: (a) CFS; (b) FFS.
A strong positive correlation exists among UCS, CBR, and RM. In the CFS, the correlation coefficient between UCS and RM was 0.99, between UCS and CBR was 0.81, and between CBR and RM was 0.77. In the FFS, these coefficients were 0.98, 0.86 and 0.82, respectively.
3.2. The Influence of Freeze–Thaw Cycles on the Performance Attenuation Laws of Reinforced Soil
3.2.1. Attenuation Laws of UCS and RM After Freeze–Thaw Cycles
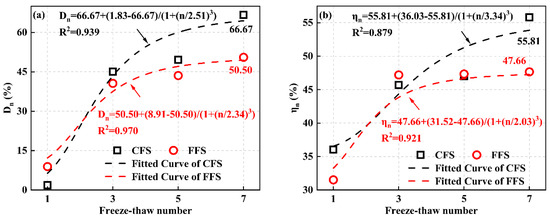
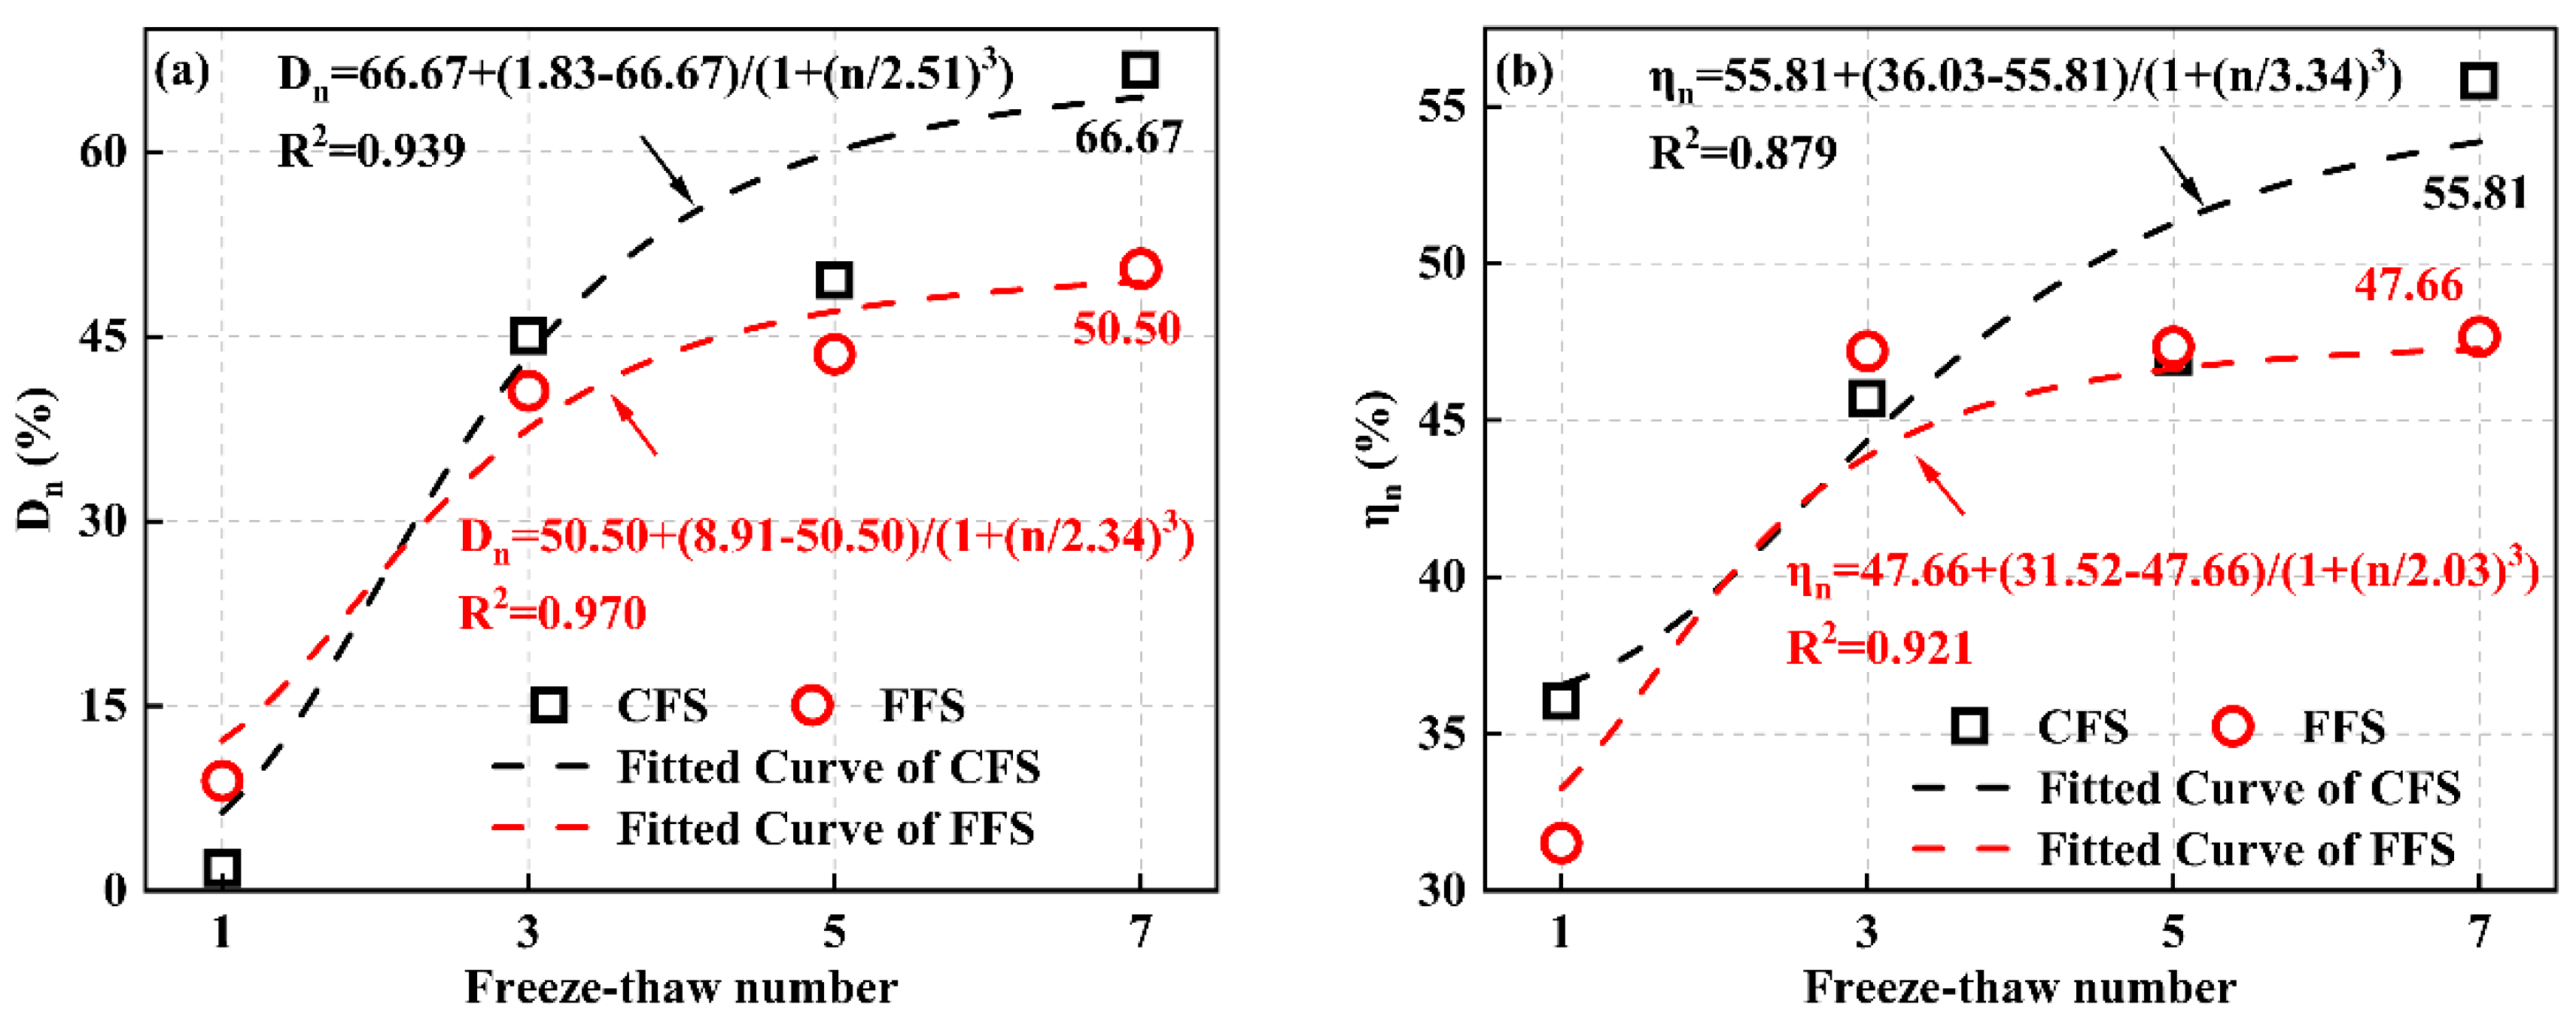
Figure 10 illustrates the relationship between UCS loss rate (Dn), RM loss rate (ηn) of soil reinforced with 1% fiber content, and freeze–thaw cycles.
Figure 10.
Relationship curves between performance attenuation and freeze-thaw cycles for fiber-reinforced soil. (a) Dn; (b) ηn.
Figure 10a shows that as the number of freeze–thaw cycles increases from 1 to 7, both CFS and FFS demonstrate a similar trend in Dn. Initially, Dn rises rapidly between 1 and 3 cycles, then continues to increase steadily from 3 to 7 cycles. However, FFS exhibits a slower growth rate compared to CFS. At n = 7, the Dn for CFS-1-F7 reaches 66.67%, markedly higher than the 50.50% observed for FFS. This indicates a stronger correlation between freeze–thaw cycles and the performance attenuation of CFS. This finding is consistent with relevant research on fiber-reinforced soils under freeze–thaw action. Coarser fibers tend to cause greater internal structural disturbance under repeated freezing and thawing, resulting in relatively higher strength loss.
Figure 10b shows that the ηn for both CFS and FFS rises with more freeze–thaw cycles. This aligns with the freeze–thaw damage mechanism in unsaturated soils [24]. Such cycles induce micro-cracks in the soil, which expand and weaken the soil structure, reducing its resilience modulus. During the initial freeze–thaw cycles (n = 1, 3), FFS exhibits a sharp increase in ηn, from 31.52% to 47.20%. In contrast, at medium to high cycles (n = 3, 5, 7), CFS shows a more pronounced increase in ηn, from 45.70% to 55.81%, while FFS stabilizes. The slower growth of ηn for FFS indicates that fine fibers can better inhibit the development of internal micro-cracks, thus showing better resistance to modulus degradation under freeze–thaw cycles.
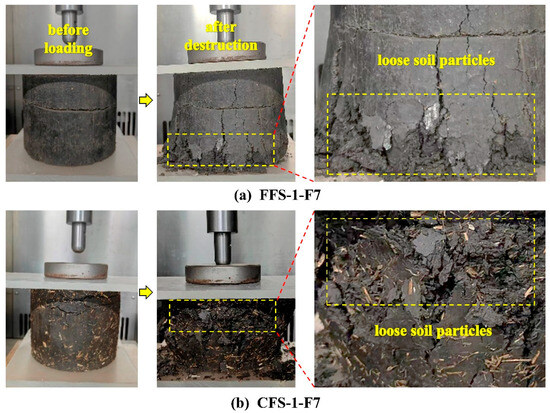
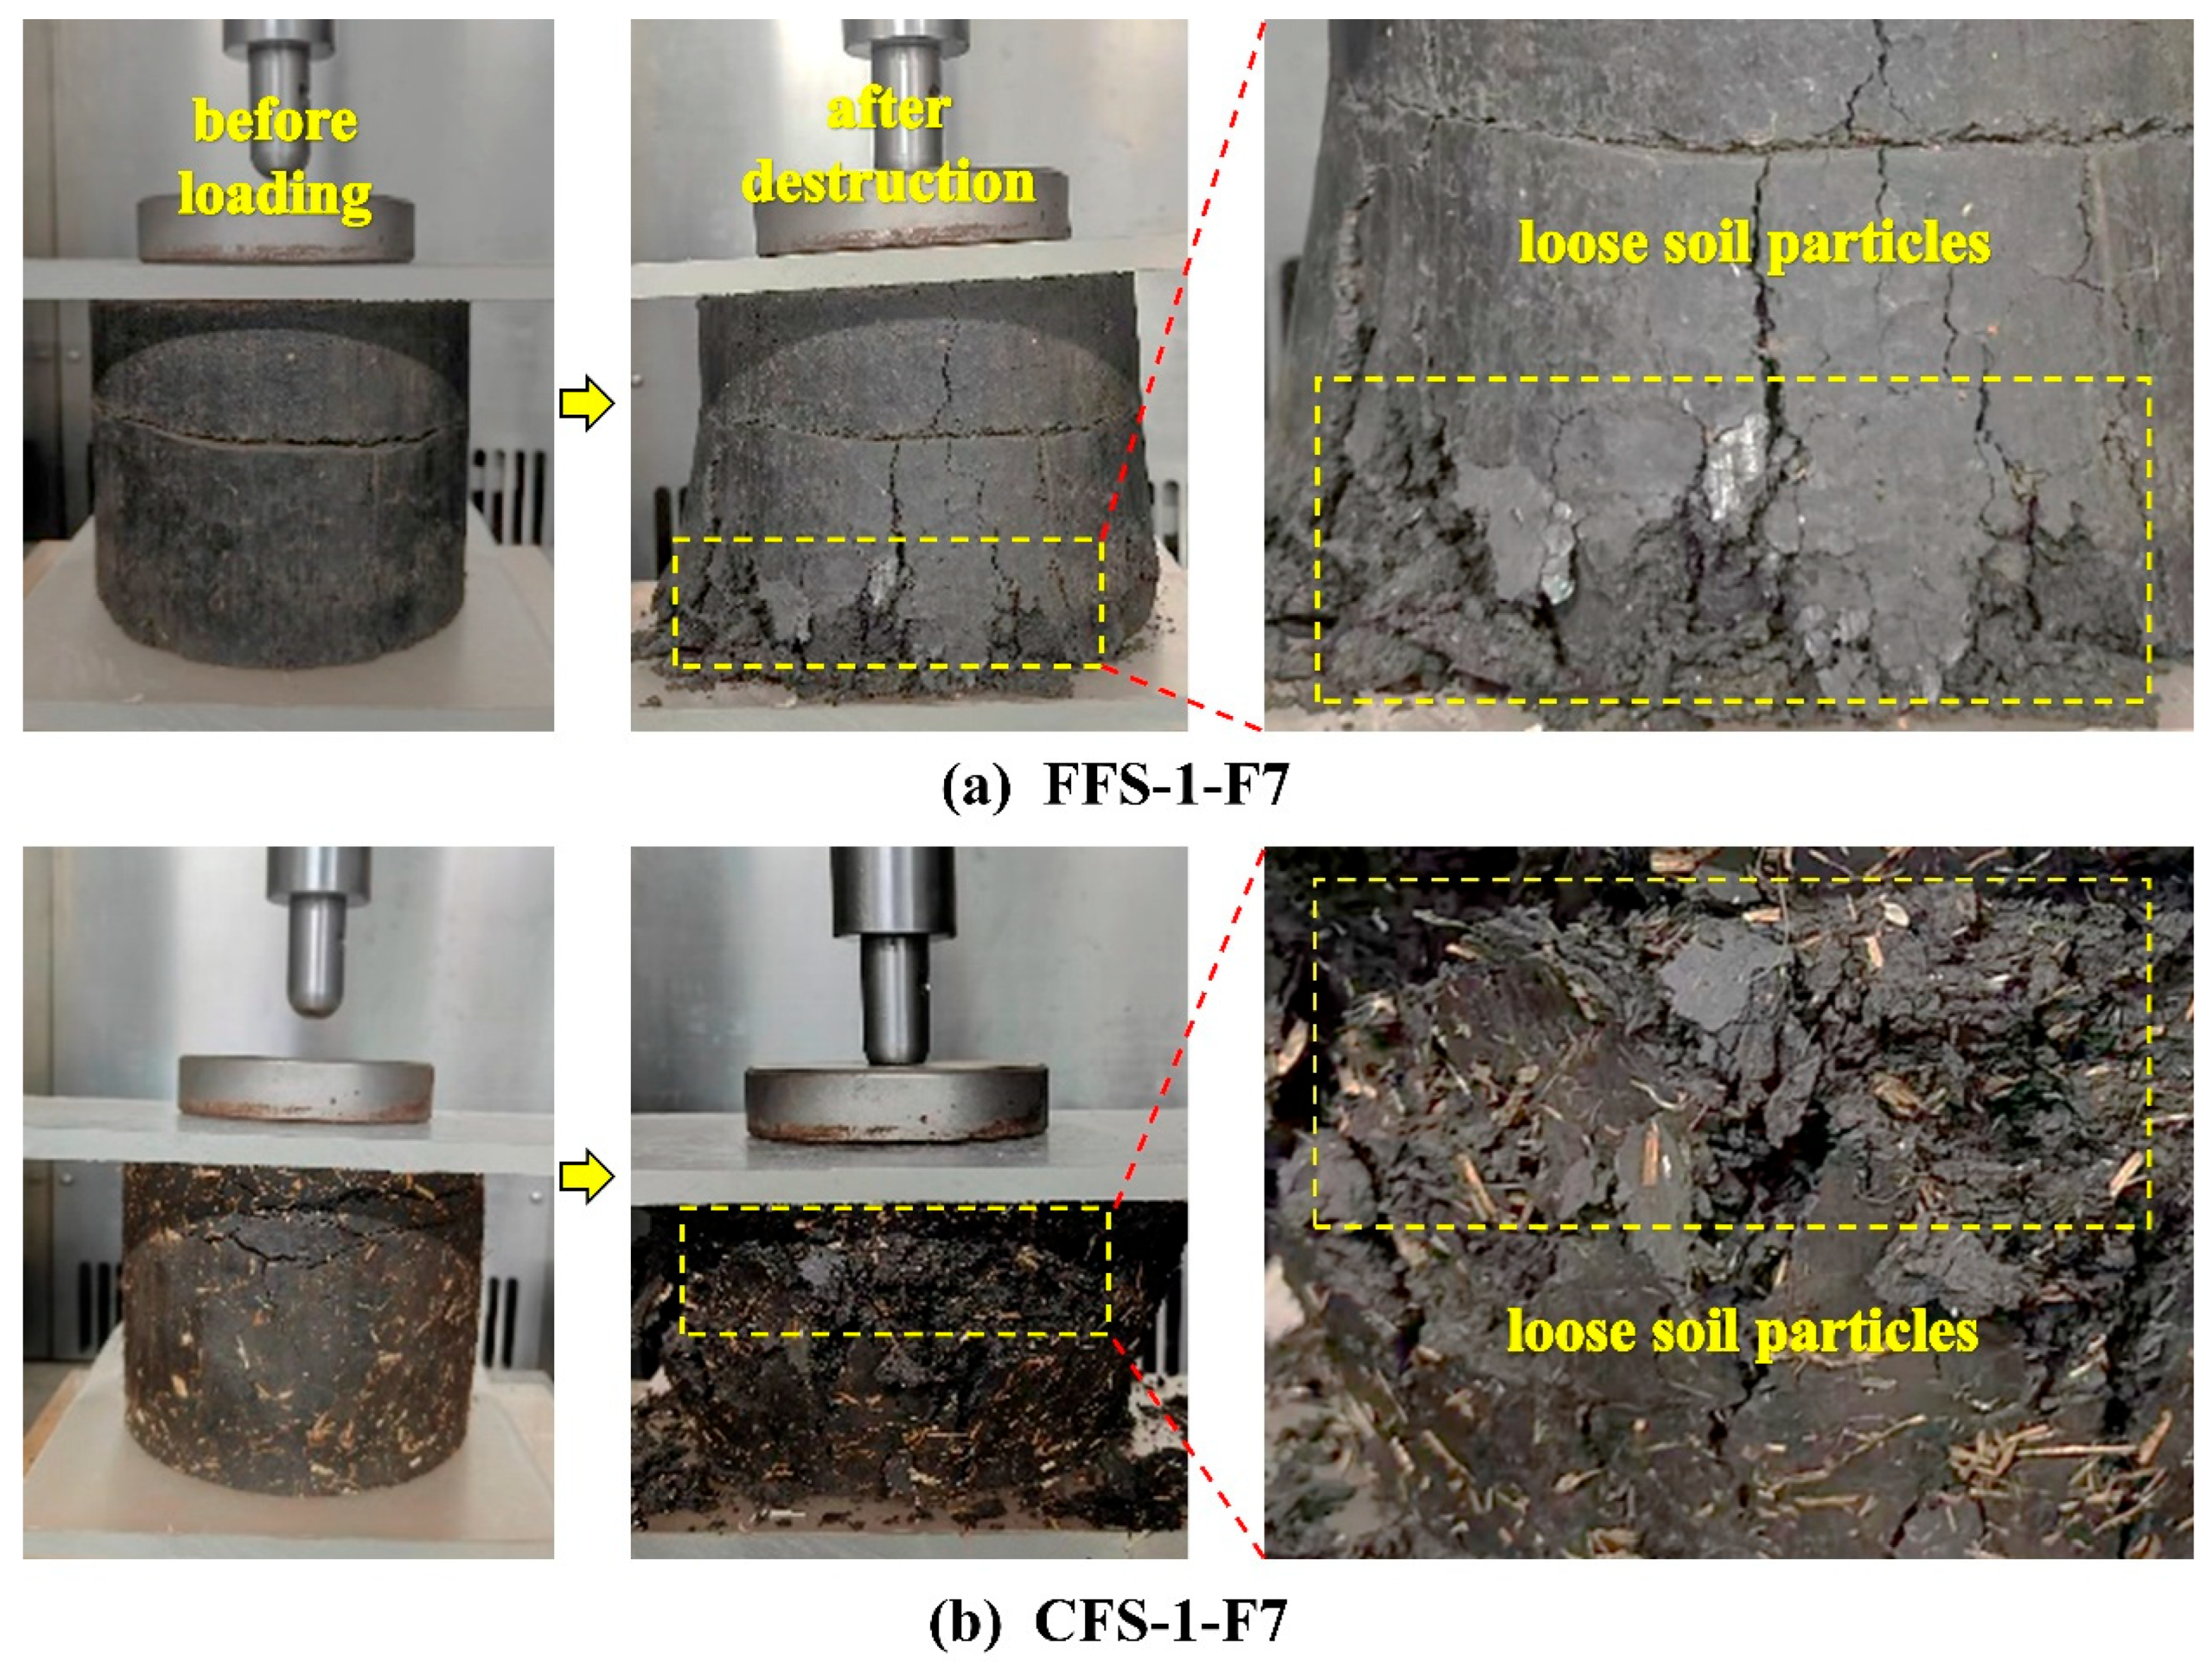
The primary reason is that while the interwoven distribution of fibers enhances soil mass integrity, it also introduces stress concentration points susceptible to damage accumulation during freeze–thaw cycles. Coarse fibers, due to their larger volume, are more affected by the expansion and contraction of pore water in this process. As illustrated in Figure 11, both CFS-1-F7 and FFS-1-F7 display similar failure patterns under stress, including multiple longitudinal and transverse wide cracks, loose soil particles, and signs of brittle failure [25]. However, these manifestations are more pronounced in CFS-1-F7. This macroscopic observation confirms that FFS demonstrates greater stability under freeze–thaw cycles. This further illustrates that fiber size plays an important role in the freeze–thaw stability of soil. Fine straw fibers contribute to more stable structural performance under cyclic freeze–thaw conditions.
Figure 11.
Failure mode of fiber-reinforced soil under axial load.
3.2.2. Freeze–Thaw Damage Evolution Equations
Formulas (5) and (6) were employed to analyze the fitting of Dn and ηn, as illustrated in Figure 8a,b. The fitting coefficient R2 > 0.85, demonstrating a strong fit.
where n is the freeze–thaw cycle number, while A, B, and C represent fitting parameters associated with factors such as fiber type and soil sample. Their values are presented in Table 2.
The freeze–thaw damage evolution equation developed in this study effectively predicts strength loss. Despite differences between the model developed in this study and Liu’s model [26], the research conclusions align, confirming the damage model’s reliability. These differences arise from the varied soil samples and fiber types used in the tests.
To assess the practicality of the freeze–thaw damage evolution equation (Dn) developed in this study, a fitting analysis was performed on data from relevant literature, with results presented in Table 2. The result reveals that all fitting coefficients R2 > 0.9, indicating a strong fit. This indicates that the proposed equation is reliable and applicable to straw fiber-reinforced black soil under the test conditions of this study.
Table 2.
Parameter values for fitting and practical verification of Dn.
3.2.3. Analysis of the Mechanism of Degradation of Reinforced Soil Road Performance Under Freeze–Thaw Cycles
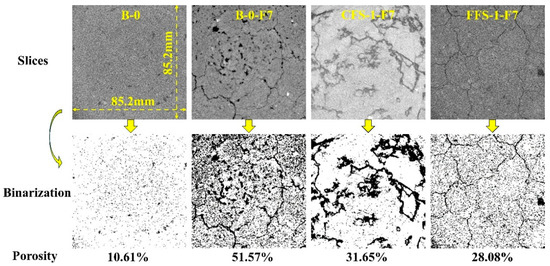
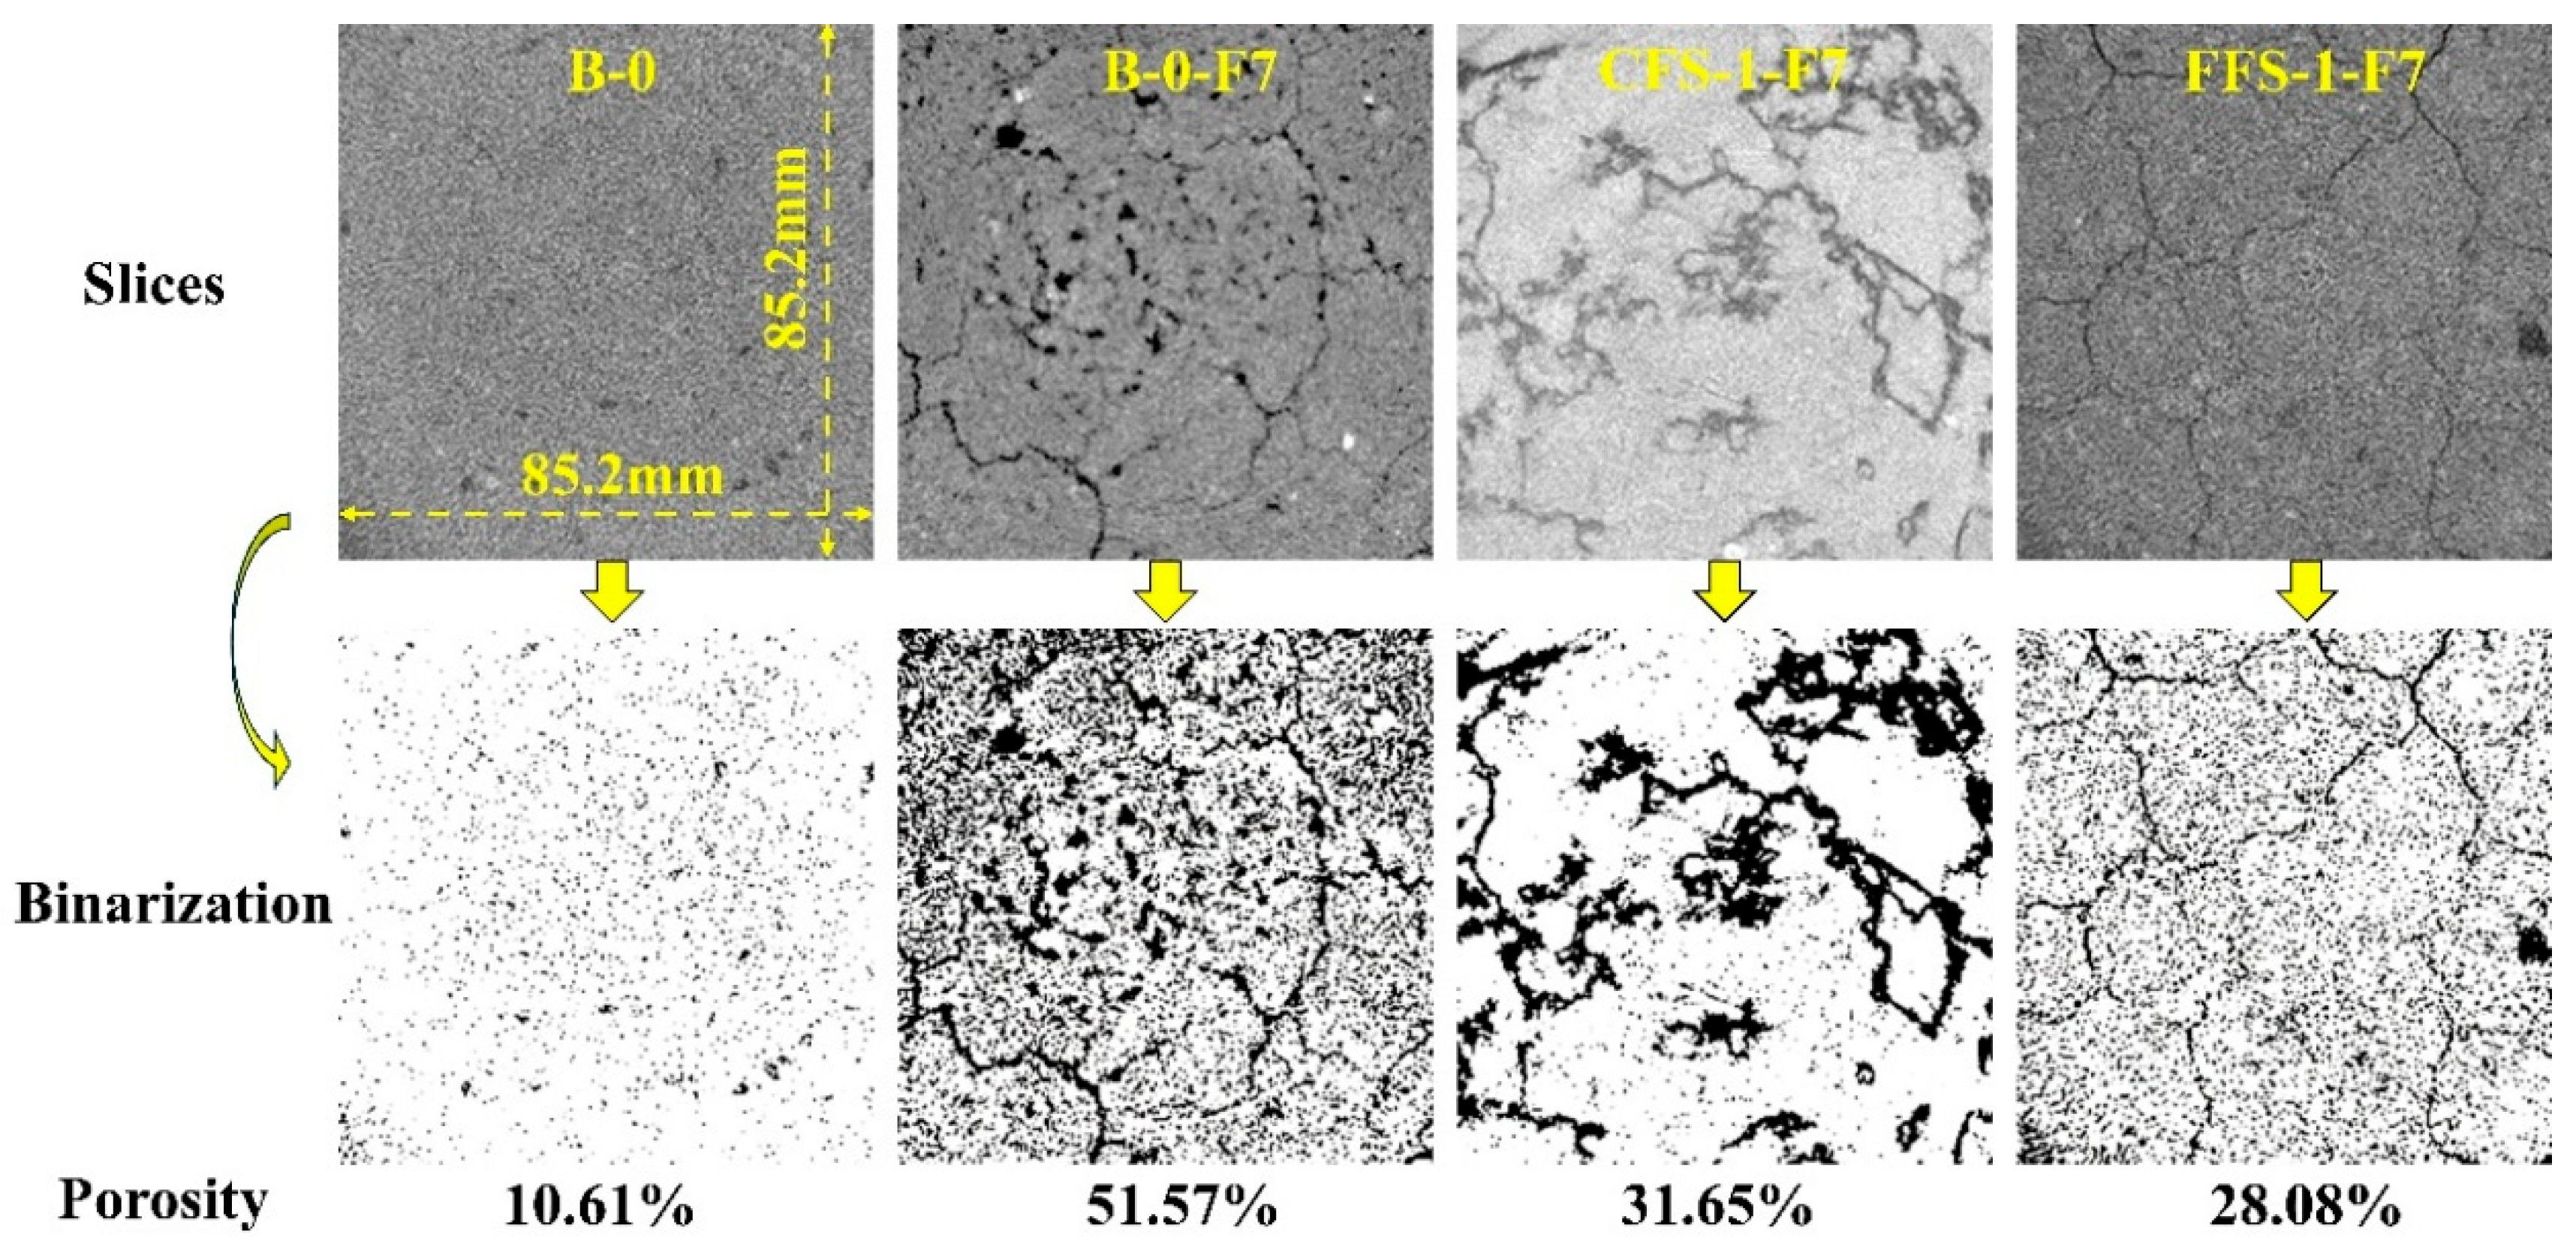
After 7 freeze–thaw cycles, CT scans were performed on specimens B-0, B-0-F7, CFS-1-F7, and FFS-1-F7, with results displayed in Figure 12.
Figure 12.
CT scanning results.
Figure 12 shows that after 7 freeze–thaw cycles, the soil without fiber (B-0-F7) developed numerous pores and cracks. The porosity of B-0-F7 increased 4.86 times that of B-0 (cracks considered as pores in this calculation). Introducing fibers to the soil reduced both porosity and the number of cracks. Specifically, the porosities of CFS-1-F7 and FFS-1-F7 decreased by 38.63% and 45.55%, respectively, compared to B-0-F7. FFS-1-F7 exhibited smaller porosity and fewer cracks than CFS-1-F7, indicating superior freeze–thaw resistance. These mesoscopic changes explain the macroscopic test results (in Section 3.2.1), where the Dn of FFS (50.50%) was lower than that of CFS (66.67%).
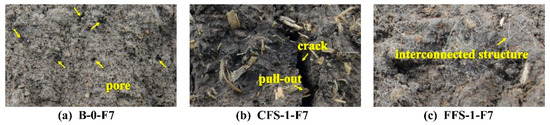
After seven freeze–thaw cycles, the soil particles in B-0-F7 (Figure 13a) became loose, exhibiting numerous pores and lacking a clear internal connection structure. In contrast, CFS-1-F7 (Figure 13b) developed wide internal cracks. with fibers being pulled out at these locations, mirroring the soil failure pattern depicted in Figure 11. The fragmentation in CFS was more pronounced than in FFS. Conversely, FFS-1-F7 (Figure 13c) displayed no significant cracks, fibers were tightly bonded with soil particles. This observation aligns with CT scan results, which showed FFS having smaller porosity and narrower cracks.
Figure 13.
Sample cross-sectional image.
In summary, the superior frost resistance of FFS may be attributed to the potential “pore filling” effect of fine fibers. These fibers fill the pores, reducing the ice expansion pressure from freezing pore water, which in turn inhibits the formation of new cracks. Conversely, the coarse straw fibers form a skeleton structure with larger pores. This structure allows for greater water migration and freezing expansion, leading to more significant structural damage. This aligns with Hewage et al.’s (2024) [31] conclusion that “fibers with large diameters are more sensitive to the expansion and contraction of pore water.”
The study delves deeper into the correlation between macroscopic properties (UCS and RM) and mesoscopic structures (pores and cracks) under freeze–thaw cycles. This approach surpasses the macroscopic analysis conducted by Xu Minpu et al. (2022) [15], and addresses the issue of “insufficient macro-mesoscopic correlation” highlighted in the introduction. Future research considers the extreme low temperatures in cold regions [32] to improve result applicability. Additionally, long-term follow-up tests are necessary to assess the effects of biodegradation and aging of straw fibers on roadbed service life. In this regard, it should be noted that straw fiber may undergo biological degradation over a long service period, which may gradually weaken the interfacial bonding and reinforcement effect. In actual engineering, the long-term performance can be improved by appropriate anti-corrosion treatment, fiber modification, or structural optimization. In this study, the straw fibers were soaked in 5% saturated lime water for anti-corrosion treatment, which can effectively delay degradation. Future research will further carry out long-term degradation tests to quantify the impact of fiber aging on the stability and durability of reinforced black soil.
4. Conclusions
This study comprehensively investigated the mechanisms of strength deterioration of straw fiber-reinforced black soil subjected to freeze–thaw cycles. Tests, including UCS, CBR, RM, alongside CT scanning analysis, were conducted after 0, 1, 3, 5, and 7 freeze–thaw cycles. The primary conclusions were
- (1)
- Straw fibers significantly improve the key road performances of black soil including UCS, CBR, and RM. With the optimal fiber content of 1%, the UCS of coarse fiber-reinforced soil (CFS-1) is increased by 32.14% and the RM is increased by 63.70% compared with the untreated sample; the UCS of fine fiber-reinforced soil (FFS-1) is increased by 20.24% and the RM is increased by 18.66%. The reinforcement mechanism is directly verified by CT scanning and failure morphology observation: fibers disperse stress, constrain soil particle movement, reduce porosity and inhibit crack development.
- (2)
- Based on the comprehensive evaluation of UCS, RM, and CBR, the optimal content for both coarse and fine straw fibers to enhance black soil is 1% within the scope of this study. At this content, the UCS, RM, and CBR of CFS were 1.11 MPa, 207.39 MPa, and 7.78%, respectively. For FFS, the UCS, RM, and CBR were 1.01 MPa, 150.33 MPa, and 6.40%, respectively.
- (3)
- Fiber content had a more substantial effect on the mechanical properties of reinforced soil compared to fiber type. UCS, CBR, and RM synergistically reflect the mechanical properties of straw fiber-reinforced black soil, and they mutually verified the superiority or inferiority of their performance.
- (4)
- FFS exhibits superior freeze–thaw resistance, making it ideal for cold regions with frequent freeze–thaw cycles.
- (5)
- The freeze–thaw damage evolution equation established in this study accurately predicted damage levels of straw fiber-reinforced black soil, providing a theoretical basis for designing and maintaining straw fiber-reinforced black soil subgrades in cold regions.
Author Contributions
Conceptualization, G.Y., D.F. and J.Y.; Methodology, G.L., S.Y. and G.Y.; Investigation, G.L. and S.Y.; Resources, G.L., G.Y., D.F. and J.Y.; Writing—original draft, S.Y.; Writing—review & editing, J.Y.; Supervision, J.Y.; Project administration, D.F. and J.Y.; Funding acquisition, D.F. and J.Y. All authors have read and agreed to the published version of the manuscript.
Funding
This research was funded by the Science and Technology Project of Heilongjiang Provincial Department of Transportation (Grant No. HJK2023B016-4) and the Postdoctoral Science Foundation of Heilongjiang Province (Grant No. LBH-Z24154).
Institutional Review Board Statement
Not applicable.
Informed Consent Statement
Not applicable.
Data Availability Statement
The original contributions presented in this study are included in the article. Further inquiries can be directed to the corresponding author.
Conflicts of Interest
Author Guannan Yu was employed by Longjian Road and Bridge Co., Ltd. The authors declare that they have no known competing financial interests or personal relationships that could have appeared to influence the work reported in this paper.
References
- Zhang, S.; Chen, W.; Li, J.; Liu, H. A preliminary study on dynamic response of cold-region tunnel systems considering the frozen soil in plastic zone. Sci. Rep. 2025, 15, 5893. [Google Scholar] [CrossRef] [Scilit] [PubMed]
- Cai, G.; Liu, Q.; Qin, Y.; Yin, F.; Li, J. Frost heave and water-heat behavior of coarse-grained fill in HSR subgrade considering vapor migration. Eng. Geol. 2025, 351, 108032. [Google Scholar] [CrossRef] [Scilit]
- Miao, Q.; Niu, F.; Lin, Z.; Luo, J.; Liu, M. Comparing frost heave characteristics in cut and embankment sections along a high-speed railway in seasonally frozen ground of Northeast China. Cold Reg. Sci. Tech. 2020, 170, 102921. [Google Scholar] [CrossRef] [Scilit]
- Wang, Z.; Zhang, Y.; Zhang, C.; Li, B. Revealing the melting mechanism of segregated ice in frozen soil based on visualizing mass transfer dynamics. Cold Reg. Sci. Tech. 2025, 239, 104558. [Google Scholar] [CrossRef] [Scilit]
- Wang, W.; Che, F.; Jin, H.; Li, S.; Tang, J.; Li, X.; Zhai, J.; Zhang, Z.; Huang, S.; Xue, G.; et al. Progress in studies on frost hazards along transport infrastructures in permafrost regions of northern Da Xing’anling Mountains in Northeast China (I): Thaw hazards. J. Glaciol. Geocryol. 2025, 47, 354–371. [Google Scholar]
- Chen, W.; Guo, J.; Li, L.; Peng, J.; Gong, Y. Research on Site Monitoring of Railway Subgrade Settlement in Permafrost Regions. Subgrade Eng. 2022, 5, 54–58. [Google Scholar] [CrossRef]
- Fan, Y. Evolution Law and Control Method of Subgrade Thaw-Settling Along Mohe-Beijicun Highway. Master’s Thesis, Harbin Institute of Technology, Harbin, China, 2019. [Google Scholar] [CrossRef]
- Ren, K.; Shi, M.; Liang, M. Strength and fractal damage characteristics of cement-coal slag stabilized soil under freeze-thaw cycles. Sci. Rep. 2025, 15, 27609. [Google Scholar] [CrossRef] [Scilit]
- Lu, Z.; Gao, S.; Zhao, M.; Su, A.; Wang, M.; Luo, X. Mechanical Properties of Black Soil Under Dry-Wet, Freeze-Thaw Cycles. Soil Eng. Found. 2024, 38, 1093–1098. [Google Scholar]
- Huang, H.-N.; Yang, Z.; Guo, Y.; Ma, J.-J.; Ming, B.-W.; Yang, J.; Guo, C.; Li, L.; Ou, C.-Q. Impact of agricultural straw open-field burning on concentrations of six criteria air pollutants in China. Environ. Pollut. 2025, 373, 126109. [Google Scholar] [CrossRef] [Scilit]
- Wei, L.; Chai, S.X.; Zhang, H.Y.; Shi, Q. Mechanical properties of soil reinforced with both lime and four kinds of fiber. Constr. Build. Mater. 2018, 172, 300–308. [Google Scholar] [CrossRef] [Scilit]
- Arabani, M.; Rahimabadi, M.M.; Shalchian, M.M. Combined Effects of Barley Fibers and Nanoclay on Clayey Soil Stabilization. Geotech. Geol. Eng. 2024, 42, 7553–7576. [Google Scholar] [CrossRef] [Scilit]
- Liu, S.; Wang, Y.; Tian, H.; Sun, S.; Zhang, L.; Zhou, R.; Han, C. Mechanical properties and toughening effect of rice straw fiber-reinforced soil. Case Stud. Constr. Mater. 2024, 21, e03511. [Google Scholar] [CrossRef] [Scilit]
- Meena, S.K.; Sahu, R.; Ayothiraman, R. Utilization of Waste Wheat Straw Fibers for Improving the Strength Characteristics of Clay. J. Nat. Fibers 2019, 18, 1404–1418. [Google Scholar] [CrossRef] [Scilit]
- Xu, M.; Sun, M.; Chang, C. Experimental Study on Compressive Strength of Straw Fiber-reinforced Soil Under Freeze-thaw Cycles. J. Yancheng Inst. Technol. (Nat. Sci. Ed.) 2021, 34, 6–10. [Google Scholar]
- Abbasi, M.; Hosseinpour, I.; Barari, A.; Mirmoradi, S.H. Mechanical Properties of Silty Sand Treated with MICP Technique Subjected to Freeze-Thaw Cycles. Transp. Infrastruct. Geotechnol. 2024, 12, 34. [Google Scholar] [CrossRef] [Scilit]
- Sun, S.; Liu, X.; Liu, H.; Shi, C.; Xu, L.; Huang, Z.; Sui, Y. Mechanical properties and acoustic emission characteristics of basalt fiber reinforced cemented silty sand subjected to freeze–thaw cycles. Sci. Rep. 2024, 14, 21888. [Google Scholar] [CrossRef] [Scilit]
- Shi, W.; Liu, J.; Sun, X.; Zhang, K. Response of soil detachment capacity to freeze-thaw process for five loess soils from the Loess Plateau of China. Int. Soil Water Conserv. Res. 2025, 13, 808–827. [Google Scholar] [CrossRef] [Scilit]
- Yang, X.; Hu, Z.; Wang, Y.; Wang, Z. Mechanical properties and environmental sustainability of loess reinforced with recycled zongzi-leaf fibers. Case Stud. Constr. Mater. 2025, 23, e05244. [Google Scholar] [CrossRef] [Scilit]
- Hao, J.; Huang, J.; Yao, J.; Zhang, Z.; Zhang, H. Unconfined compression strength and mesostructure of reinforced soil with wheat straw. Bull. Eng. Geol. Environ. 2021, 80, 9173–9183. [Google Scholar] [CrossRef] [Scilit]
- Yu, X.; Wu, X.; Zhu, P.; Liu, C.; Qiu, C.; Cai, Z. Mechanism of Strength Degradation of Fiber-Reinforced Soil Under Freeze–Thaw Conditions. Buildings 2025, 15, 842. [Google Scholar] [CrossRef] [Scilit]
- Liu, B.; Zhang, Z.; Huang, X.; Zhang, J.; Cai, Y.; Liu, X.; Tang, F. Effect of Straw Characterization on the Mechanical Behavior of Compacted Straw-Reinforced Soils. Buildings 2025, 15, 1543. [Google Scholar] [CrossRef] [Scilit]
- Beckman, I.; Lozano, C.; Freeman, E.; Riveros, G. Fiber Selection for Reinforced Additive Manufacturing. Polymers 2021, 13, 2231. [Google Scholar] [CrossRef] [Scilit]
- Han, Z.; Zhang, L.; Ding, L.; Zou, W.; Feng, H.; Ying, Z. Soil-water characteristics and dynamic responses of compacted clay under different moisture and temperature paths. Chin. J. Geotech. Eng. 2024, 46, 2591–2601. [Google Scholar]
- Zhang, Y.-Z.; Dong, Y.-Q.; Wang, J.-Z.; Wang, M.; Cui, Y.-H.; Kou, X.-K. Effects of freeze–thaw cycles on the deformation and microstructure of silt. Cold Reg. Sci. Tech. 2025, 239, 104605. [Google Scholar] [CrossRef] [Scilit]
- Liu, C.; Lv, Y.; Yu, X.; Wu, X. Effects of freeze-thaw cycles on the unconfined compressive strength of straw fiber-reinforced soil. Geotext. Geomembr. 2020, 48, 581–590. [Google Scholar] [CrossRef] [Scilit]
- Wu, Z. Experimental Study on the Mechanical Properties of Inorganic Fiber Reinforced Soil. Master’s Thesis, Jilin Jianzhu University, Changchun, China, 2024. [Google Scholar]
- Zhang, Y.; Xue, X.; Yang, X. Numerical simulation of fiber-reinforced expansive soil at low temperature. China Sci. 2022, 17, 1351–1357. [Google Scholar] [CrossRef]
- Wang, X. Study on Road Performance of Corn Straw Fiber Soil. Master’s Thesis, Jilin University, Changchun, China, 2024. [Google Scholar] [CrossRef]
- Bi, S. Experimental Study on Mechanical Properties of Natural Fiber Reinforced Soil. Master’s Thesis, Jilin Jianzhu University, Changchun, China, 2024. [Google Scholar]
- Hewage, S.A.; Roksana, K.; Tang, C.S.; Zhu, C. The Effects of Fiber Amendment on the Surface Crack Evolution on Clayey Soil under Freeze-Thaw Cycles. In Proceedings of the Geo-Congress on Bridging Government, Industry, and Academia for Resilient Mega-Communities, Vancouver, BC, Canada, 25–28 February 2024; pp. 565–574. [Google Scholar]
- Yang, M.; Gao, Q.; Li, T. Causes of Winter Persistent Extreme Cold Events in Northeastern China. Adv. Atmos. Sci. 2025, 42, 780–793. [Google Scholar] [CrossRef] [Scilit]

Disclaimer/Publisher’s Note: The statements, opinions and data contained in all publications are solely those of the individual author(s) and contributor(s) and not of MDPI and/or the editor(s). MDPI and/or the editor(s) disclaim responsibility for any injury to people or property resulting from any ideas, methods, instructions or products referred to in the content. |
© 2026 by the authors. Licensee MDPI, Basel, Switzerland. This article is an open access article distributed under the terms and conditions of the Creative Commons Attribution (CC BY) license.