


Highlights
What are the main findings?
- •
- Sol–gel coatings enabled real-time pH monitoring in microreactors;
- •
- BCG/BCP (1:3) showed strongest response at pH 11–12;
What are the implications of the main findings?
- •
- Hue analysis outperformed RGB for slug discrimination;
- •
- Droplet-level tracking achieved under dynamic flow;
- •
- Non-invasive, low-cost monitoring without altering chemistry.
Abstract
Sol–gel-based optical functional sensor coatings were developed for real-time monitoring of multiphase saponification reactions in microreactors. Various pH-sensitive indicator mixtures, including bromocresol green and bromocresol purple (BCG and BCP) and methyl red–methyl orange, were incorporated into sol–gel coatings and evaluated on test plates across pH range of 2–12. Coatings with BCG and BCP 1:3 demonstrated the most pronounced color change at high pH (11–12), with distinct hue (H) transitions providing a reliable measure of local pH. These optimized coatings were integrated into microreactor channels to track the passage of oil and NaOH slugs under varying flow rates. Hue analysis produced reproducible plateaus corresponding to NaOH-rich (H = 50°) and oil-rich (H = 41°) phases, enabling droplet-level resolution of slug flow and detection of flow-regime transitions. The sensor response was fully reversible, highlighting the robustness and reusability of the coatings. Unlike previous high-resolution fluorescence-based systems, this approach relies on simple visible-light imaging and low-cost data extraction, leaving the reaction chemistry unaltered. The results demonstrate that sol–gel coatings coupled with hue-based analysis provide a practical, noninvasive, and real-time monitoring strategy for multiphase reactions in microreactors, with potential for implementation in industrial or IoT-enabled process control systems.
1. Introduction
Microreactors have emerged as powerful tools for process intensification, offering superior control over mass and heat transfer, improved safety, and the potential for continuous operation on a compact scale. Their small internal volumes and high surface-to-volume ratios make them particularly advantageous for chemical processes where precise control of reaction conditions is essential [1,2]. Among these, saponification has often been employed as model reaction to study mixing behavior, residence time distribution, and reaction kinetics in microreactor systems due to its well-understood base-catalyzed mechanism and clear pH dependence [3]. For such systems, real-time monitoring of key parameters such as temperature, concentration, and pH is critical to ensure efficient operation and process understanding. However, implementing sensors in microreactors presents significant challenges. Conventional electrochemical pH electrodes are bulky, invasive, and difficult to integrate within narrow geometries of microchannels [4]. They also require direct contact with the reaction medium, which can disturb the flow or contaminate the system. These limitations have led to increasing interest in the development of non-invasive, miniaturized sensing strategies that can be directly integrated into microreactor components without affecting flow dynamics [4,5,6].
Recent advances in 3D printing, specifically fused filament fabrication (FFF), enable the fabrication of microreactors with complex geometries and integrated features, allowing for rapid prototyping and customization for specific chemical processes. This approach facilitates the creation of channels and structures optimized for both reaction performance and sensor integration [7,8]. Optical sensors, in particular, offer a promising route toward non-invasive in situ monitoring. Recent studies have demonstrated the potential of visible-light colorimetric sensing in microfluidic systems, where immobilized dyes or indicator reactions enable spatially resolved monitoring of chemical mass-transfer processes inside microchannels. These approaches often combine optical imaging with digital image analysis to extract quantitative information on concentration fields or reaction progress in microscale reactors. Such systems highlight the advantages of optical detection, including non-invasive operation, high spatial resolution, and compatibility with miniaturized devices [8,9,10]. By relying on colorimetric changes of immobilized indicators, optical pH sensors can provide continuous and reversible readouts directly from the reaction medium, without the need for sampling or invasive probes. When integrated as thin sol–gel coatings within the microreactor, these sensors interact with the fluid in situ, while the optical response can be captured externally. The color change is quantitatively evaluated by RGB analysis from images taken by a smartphone, enabling rapid, low-cost, and user-friendly monitoring [2,11,12]. Such approaches align with the principles of Industry 4.0 and the Internet of Things (IoT), where digital image acquisition and data processing could be integrated into automated and interconnected chemical process monitoring [13].
Among the available platforms for optical sensor fabrication, sol–gel technology offers a versatile and robust approach for immobilizing pH-sensitive indicators. The sol–gel process enables the formation of inorganic–organic hybrid networks that are optically transparent, chemically stable, and capable of entrapping functional molecules without significant leaching. The porous and tunable structure of sol–gel coatings allows for controlled interaction between the encapsulated indicators and the surrounding medium, providing a stable environment for reversible protonation–deprotonation reactions that form the basis of pH sensing [14,15]. Owing to these characteristics, sol–gel-based sensors have been successfully implemented in various analytical and environmental applications, where durability and optical clarity are essential. However, despite their advantages, sol–gel pH sensors often exhibit limited effective pH range because each indicator dye possesses a narrow transition interval defined by its pKa. This restriction becomes problematic for dynamic systems such as saponification, where the local pH can vary substantially over the course of the reaction. To overcome this limitation, a mixture of indicators can be used to achieve broader or shifted response ranges through overlapping color transitions. The combination of dyes with complementary pKa values enables more gradual and continuous color changes, enhancing both the sensitivity and versatility of the sensor [16,17]. In this work, several indicator mixtures were investigated to tailor the sensor response to the pH changes occurring during saponification. Specifically, bromocresol green and bromocresol purple were combined in 1:1 and 1:3 ratios, while additional mixtures included methyl orange with methyl red and bromocresol green with methyl red. These combinations were selected to systematically explore how the effective pH range and color transition of the sensors depend on the indicator ratio and composition. The approach allowed for a comparison of different formulations to identify the most suitable mixture for non-invasive monitoring in microreactor channels. These specific indicator combinations have been reported in the literature for colorimetric or solution-based sensing applications, providing guidance on their pH behavior and color transitions, but their immobilization in sol–gel coatings for microreactor-integrated sensing has not been explored, highlighting the novelty of the present study [18,19,20,21].
While sol–gel matrices provide a stable environment for immobilized indicators and indicator mixtures offer tunable pH responsiveness, their application in dynamic microreactor systems remains largely unexplored. Previous studies have characterized these mixtures in solution for their pH-dependent color changes, but the immobilization of such combinations in sol–gel functional coatings for real-time in situ monitoring of microreactor reactions has not been reported [22,23]. To address this gap, sol–gel coatings incorporating carefully selected pH indicator mixtures were developed for microreactor integration. Building upon our previous work with litmus, which had a limited detectable range, we tested combinations of bromocresol green (BCG) and bromocresol purple (BCP), as well as methyl orange (MO) and methyl red (MR), in different ratios. The goal was to determine which mixtures provided the most suitable pH response and whether the detectable range could be broadened for monitoring saponification reactions. By immobilizing these mixtures in the sol–gel matrix, mechanically stable functional coatings could be coated directly onto surfaces of 3D-printed microreactor channels, enabling non-invasive, in situ monitoring via RGB analysis of smartphone images.
This work is significant because it demonstrates the integration of sol–gel-immobilized pH indicator mixtures into 3D-printed microreactors for real-time monitoring of strongly alkaline reactions. By systematically testing multiple indicator combinations, the study identifies formulations that optimize the detectable pH range and assess the potential to broaden sensitivity compared to single-indicator systems. The combination of 3D-printed microreactors and integrated sol–gel pH coatings provides a practical approach for implementing embedded sensing in custom chemical reactors. Coupled with digital RGB readout via smartphones, this approach provides a low-cost, user-friendly method with strong potential for continuous-flow process monitoring, aligning with Industry 4.0 and IoT principles.
2. Materials and Methods
2.1. 3D Printing
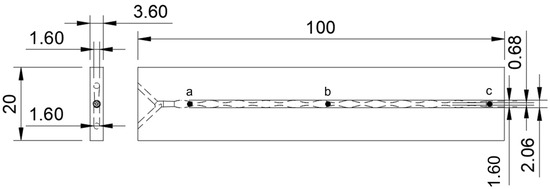
Microreactors and test plates were fabricated using fused filament fabrication (FFF) on a Bambu P1S 3D printer (Bambu Lab, Shenzhen, China) with transparent PETG filament (AzureFilm, Sežana, Slovenia). Both microreactors and test plates were printed flat on the build plate to maximize optical transparency and channel clarity. Printing was performed using a 0.08 mm layer height, 0.4 mm nozzle, 230 °C nozzle temperature, and 70 °C bed temperature. A 100% infill with an aligned rectilinear pattern was used to ensure optical clarity. The slicing was performed in Bambu Studio, and no post-processing was applied after printing. Channel dimensions and overall microreactor geometry are illustrated in Figure 1.
Figure 1.
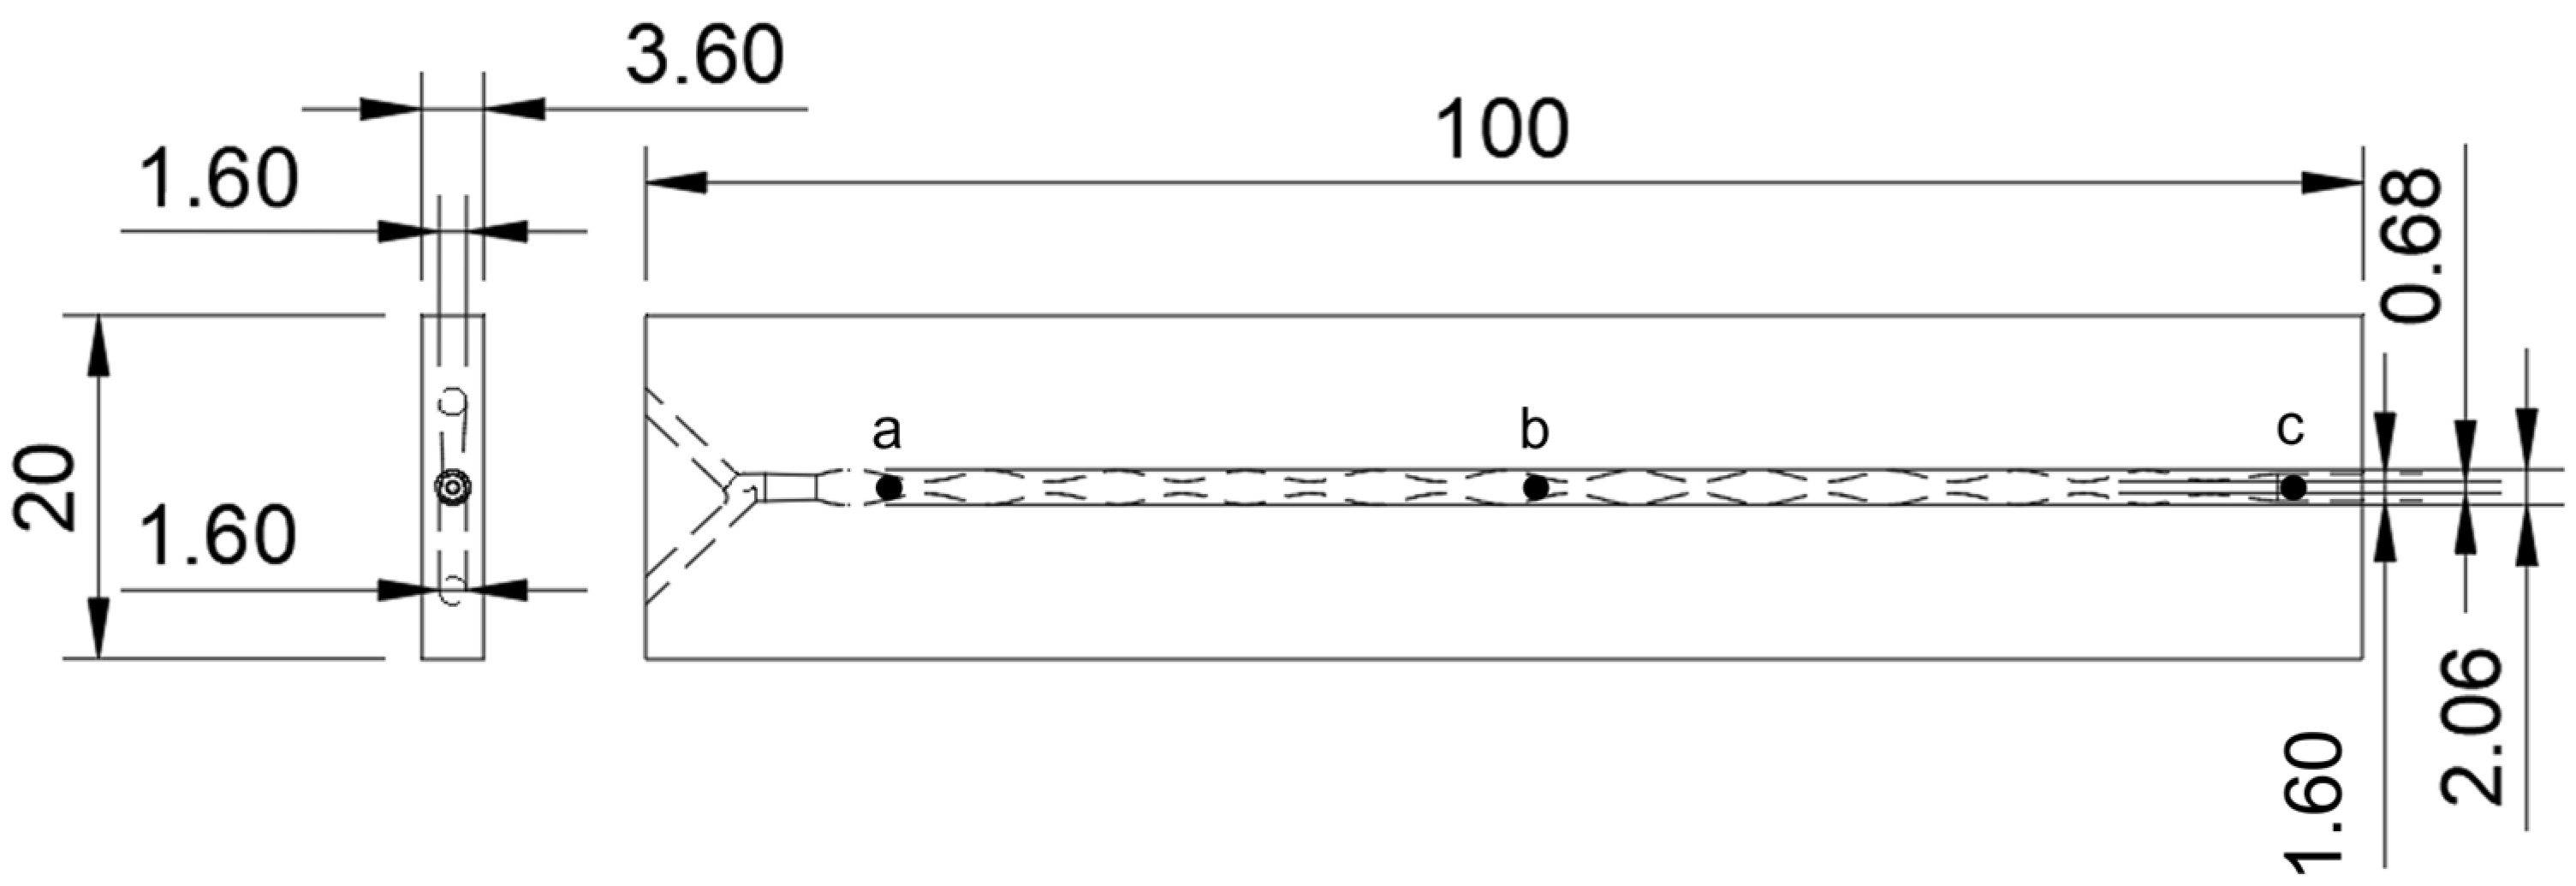
Channel dimensions and microreactor geometry, with black points representing zones where RGB and H values were measured.
2.2. Preparation of Indicator Mixtures
Prior to sol–gel synthesis, solutions of the pH indicator mixtures were prepared as follows. All indicators were purchased from Carl Roth, Karlsruhe, Germany.
- Bromocresol green (BCG) and bromocresol purple (BCP), 1:1 ratio: 0.2 g BCG and 0.2 g BCP were dissolved in a mixture of 50 mL deionized water and 50 mL 96% ethanol;
- BCG and BCP, 1:3 ratio: 0.1 g BCG and 0.3 g BCP were dissolved in the same water and ethanol mixture (50 mL water + 50 mL ethanol);
- Methyl orange (MO) and methyl red (MR), 1:1 ratio: 0.1 g MO and 0.1 g MR were dissolved in 80 mL ethanol and 20 mL deionized water;
- BCG and MR, 5:1 ratio: 0.1 g BCG and 0.02 g MR were dissolved in 100 mL ethanol.
All solutions were stirred until the indicators were fully dissolved, yielding homogenous stock solutions for subsequent incorporation into the sol–gel matrix.
2.3. Sol–Gel pH Sensor Coating Preparation
All pH sensor coatings were prepared using the sol–gel method, with tetraethoxysilane (TEOS, 99%, Gram-Mol, Zagreb, Croatia) and phenyltrimethoxysilane (PTMS, 97%, Sigma-Aldrich, St. Louis and Burlington, MA, USA) as precursors. Ethanol served as a solvent and hydrochloric acid (HCl, 0.1 M, BDH Prolabo, Leuven, Belgium) acted as a catalyst, and the previously prepared indicator mixtures were incorporated directly into the sol–gel matrix. For coating synthesis, the components were combined in a water bath at 60 °C with magnetic stirring at 300 rpm. For typical formulation, 2.4 mL of the indicator mixture solution, 1.7 mL TEOS, 0.3 mL PTMS, 0.3 mL ethanol, and 1.6 mL HCl were mixed for 2 h. The overall molar ratio of the precursors to water was maintained at n(TEOS + PTMS): n(H2O) = 0.072:1, based on our prior work [2]. Gelation occurred within 2 h. To enhance the optical response, 10 mg of TiO2 nanoparticles (trade name: AEROXIDE TiO2 P25, Evonik Industries, Essen, Germany) were added only to the final formulation selected for application in microreactors, which had demonstrated the best color intensity in preliminary tests [2]. The synthesis conditions for this formulation were identical, except that reaction time was shortened to 1 h 30 min. Microreactor channels were filled with the mixture using the syringe, and excess was expelled with an air compressor to obtain a thin, uniform coating. After application, the coatings were air dried for 7 days at room temperature. Application on test plates followed a similar procedure, without TiO2, to allow for comparison of optical responses among different indicator mixtures. Test plates were immersed in the sol–gel mixture for 3 s, excess sol was removed by gently touching the edges against a tissue, and the plates were left to air dry for 7 days at room temperature.
2.4. Characterization
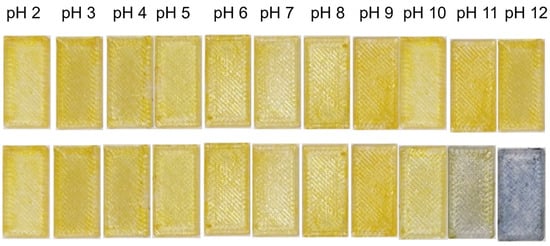
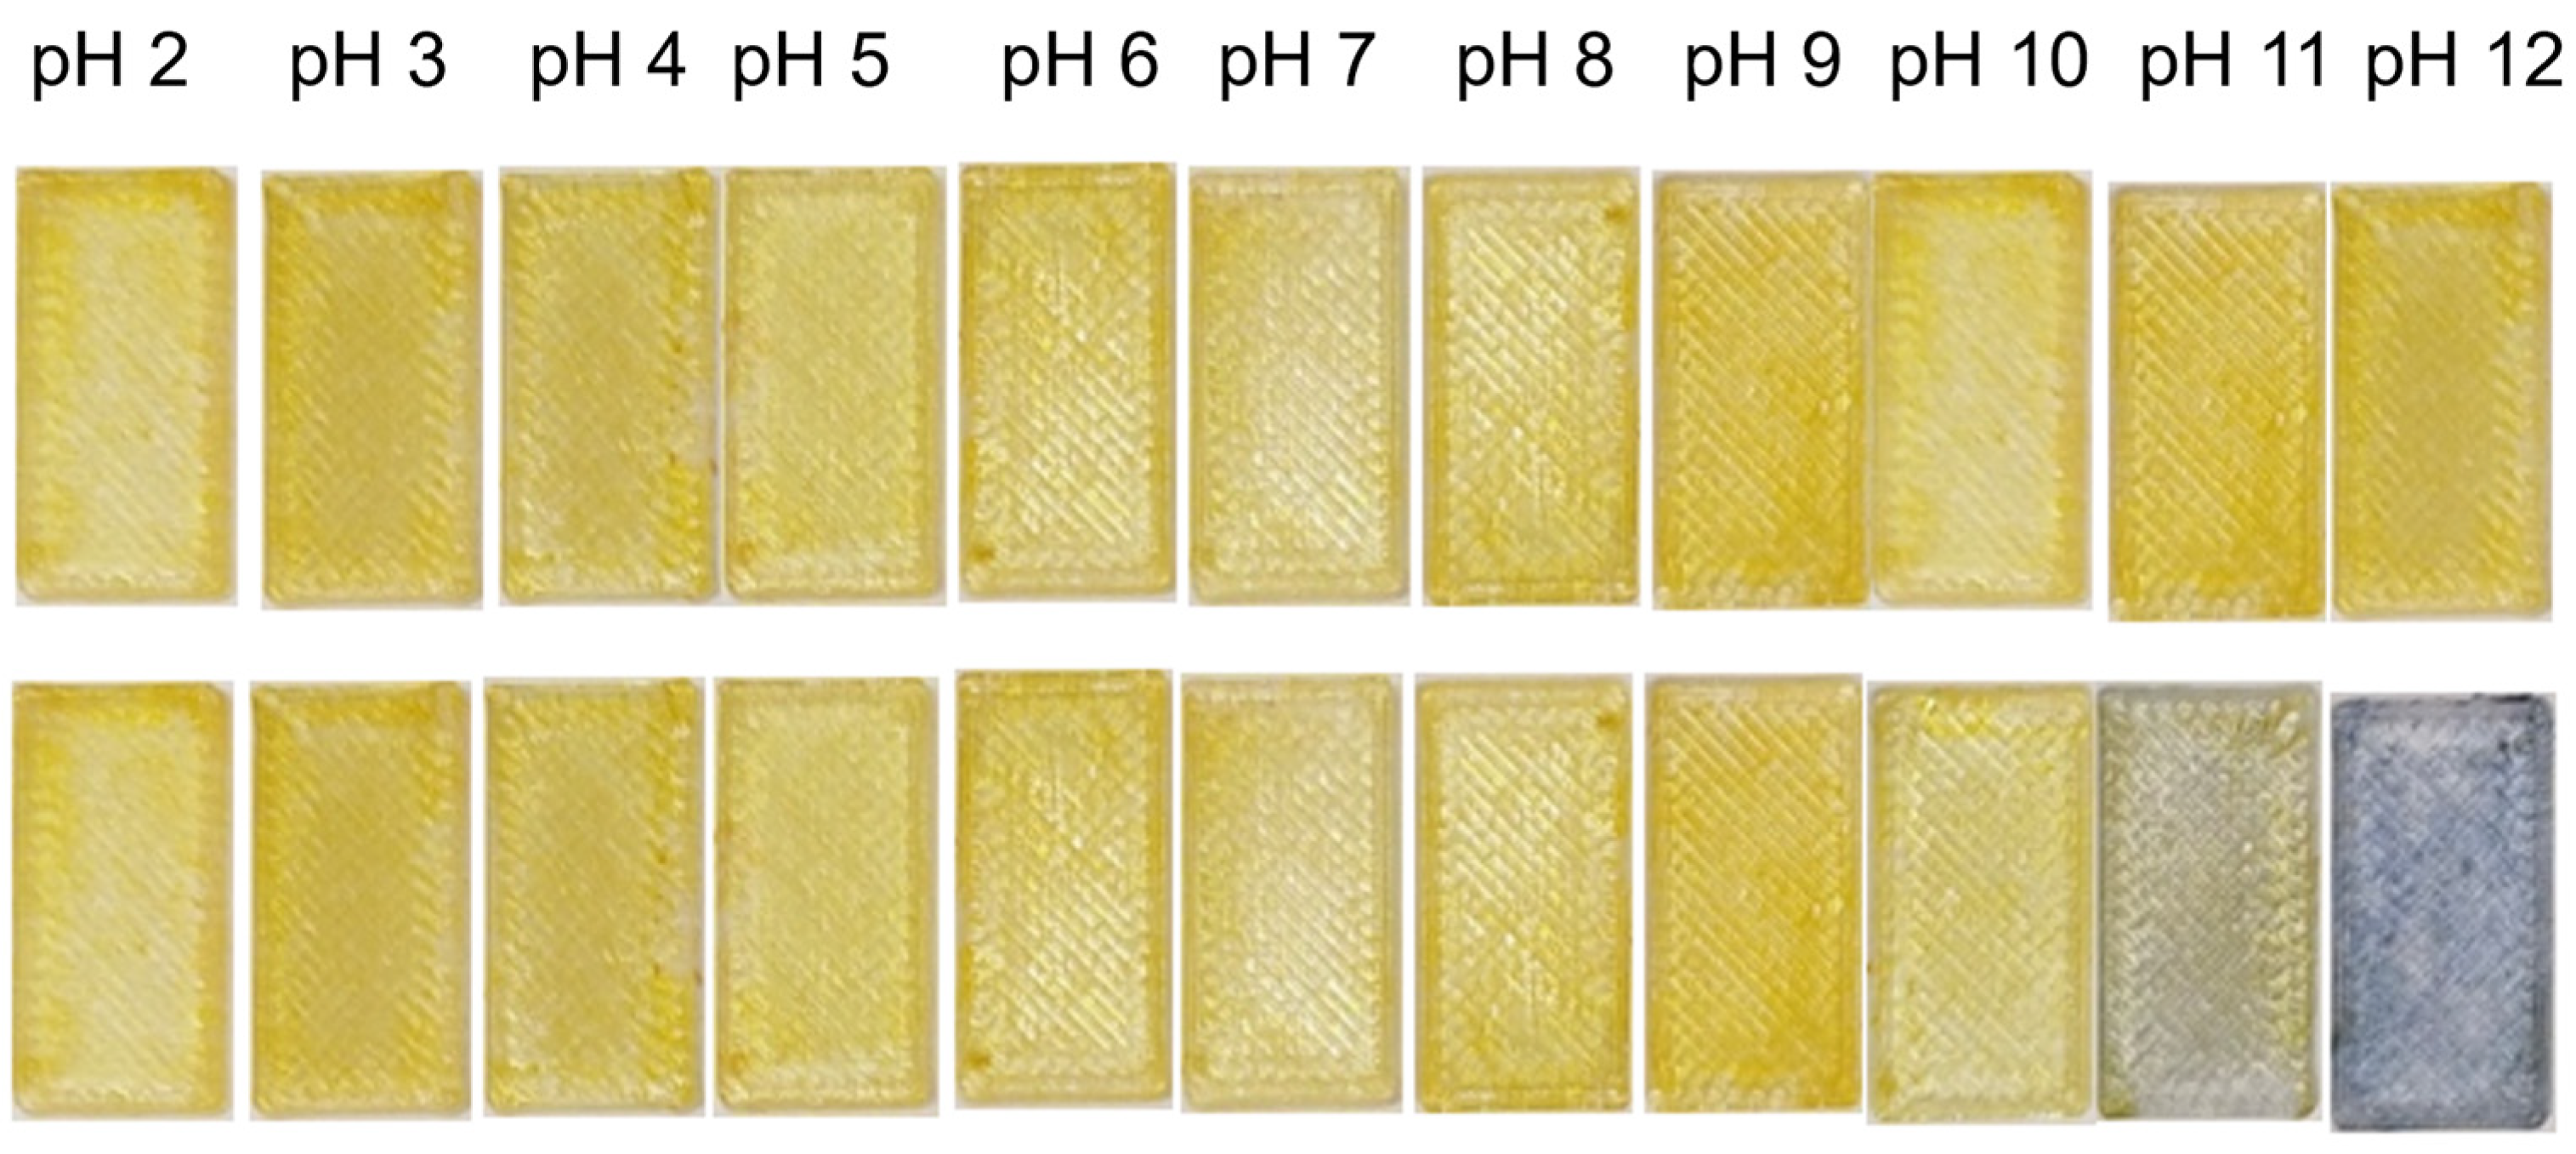
The thickness of the sol–gel coating was determined gravimetrically. First, the empty microreactor was weighed, and then it was filled with water and weighed again to calculate the water volume based on its known density. The difference in volume between the coated and uncoated microreactor was attributed to the sol–gel film. Dividing this volume by the total surface area of the microchannel walls provided an estimate of the average film thickness, which was found to be 38 µm. Representative SEM images of the coating were also obtained to confirm surface morphology and uniformity. The prepared test plates were first evaluated to determine the optical response and stability of the immobilized indicator mixtures. Each coated plate was immersed in a series of solutions with pH values ranging from 2 to 12 to assess the color transition range and reversibility of the coatings. The plates were kept in each solution for 1 min, after which photographs were taken under controlled lighting conditions inside a white light box to minimize reflections and variations in illumination. Images were captured using Samsung Galaxy S25 camera positioned at a fixed distance and angle relative to the samples. The resulting images were analyzed using Color Picker Palette Generator (v1.6.0:27, Appsvek) software, and the red, green, and blue (RGB) channel intensity values were extracted from test plates (Figure 2).
Figure 2.
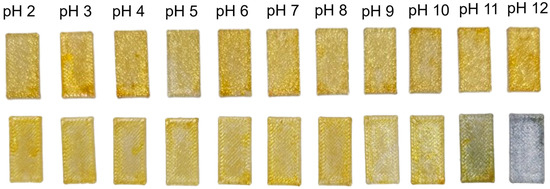
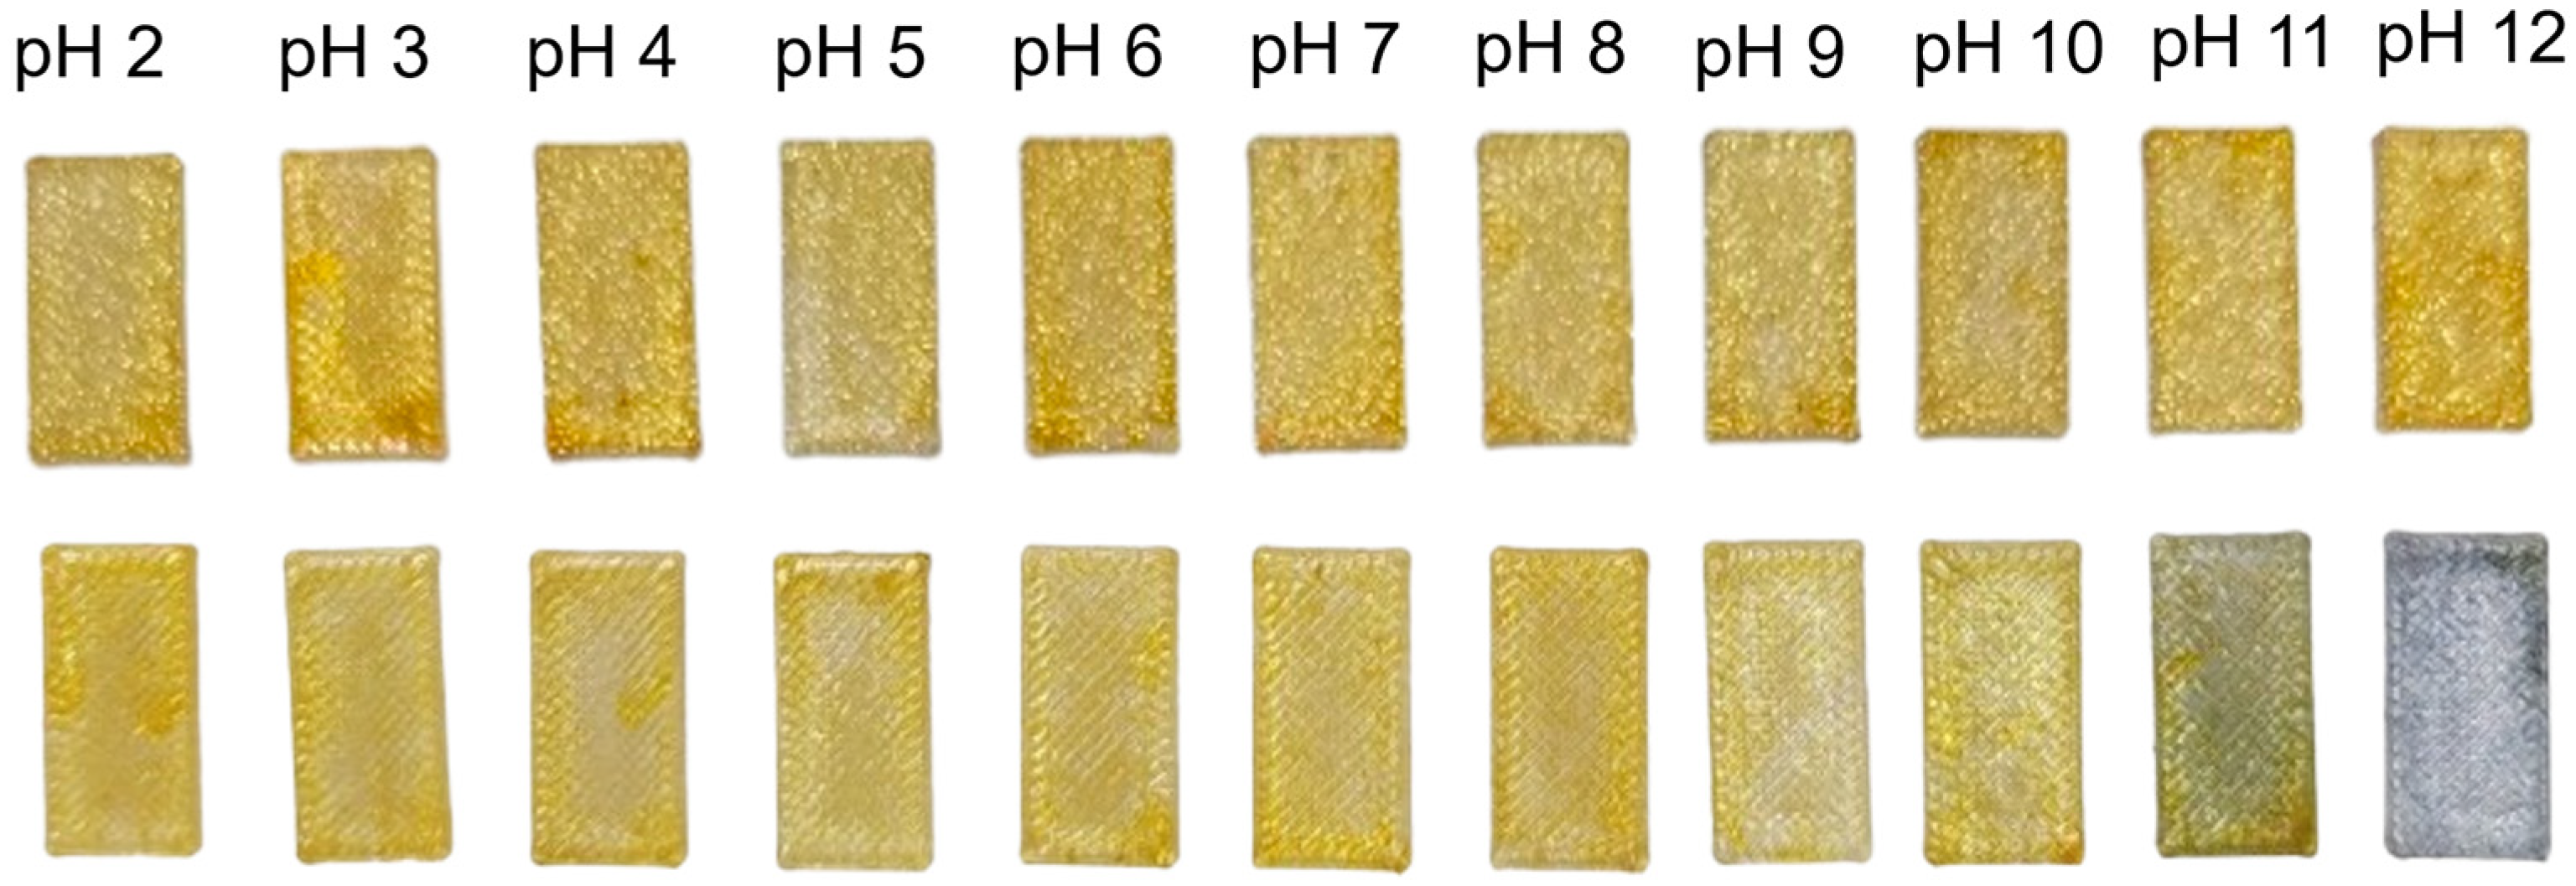
Test plates coated with BCG and BCP 1:1 sol–gel before (up) and after (down) being immersed in solution ranging from pH 2 to pH 12.
In addition to RGB values, the hue (H) component of the HSV color space was extracted for each region. Hue represents color as an angle from 0° to 360°on the color wheel, with specific angles corresponding to perceptible colors (e.g., 0° = red, 60° = yellow, 120° = green, 180° = cyan, 240° = blue, 300° = magenta), allowing for numeric H values to be directly interpreted as color changes. Hue provides a single parameter that more reliably reflects changes in color independent of lighting intensity or brightness variations, making it particularly suited for monitoring subtle and reversible color transitions along the sol–gel sensor coating. By tracking H values over time and along the microchannel, individual slugs of oil and NaOH could be distinguished and the local pH changes associated with the saponification reaction could be monitored in real time. The RGB and H values were analyzed and plotted as a function of pH and time to quantitatively evaluate the colorimetric response of each indicator mixture. The mixture that exhibited the highest optical contrast was selected for integration into 3D-printed microreactors. This optimized sol–gel formulation contained TiO2 nanoparticles, which improved the intensity and contrast of the recorded color changes.
The optimized sol–gel coating was applied inside the 3D-printed microreactors and evaluated for in situ pH monitoring during the saponification of sunflower oil (Zvijezda plus d.o.o., Zagreb, Croatia) with sodium hydroxide (NaOH, 0.1 M, Kemika, Zagreb, Croatia), chosen as a model reaction due to its well-defined kinetics and pronounced pH change during progress. Aqueous 0.1 M NaOH solution and sunflower oil were introduced into the microreactor through separate inlets using syringe pumps operating at constant flow rates (1 mL min−1, 2 mL min−1, and 5 mL min−1) to maintain laminar flow conditions. The color change of the immobilized indicator coating was observed along the microchannel as the reaction proceeded. Photographs were taken using a smartphone camera positioned above the transparent PETG microreactor inside a white light box, ensuring consistent illumination and background conditions. The camera operated at 30 frames per second (fps), giving a temporal resolution of 33 ms per frame, which defines the effective response time of the sensor under the experimental conditions. The images were analyzed using RGB extraction in Color Picker Palette Generator software, and the RGB values were plotted against time and position along the channel to monitor local pH changes. The initial calibration on flat plates does not capture the optical conditions inside the microchannel, including curvature, optical path length, reflections, and multiphase scattering. To perform in-channel calibration, solutions of known pH were prepared using controlled concentrations of HCl (pH = 2) and NaOH (pH = 11). Each solution was flowed through the microchannel, and the resulting hue was recorded under the same illumination conditions used in the microreactor. The hue for the NaOH solution (pH 11) was 50°, while the hue for the HCl solution (pH 2) was 40°.
In addition to monitoring the saponification reaction, the test plates coated with the sol–gel pH sensor coatings were characterized to evaluate surface properties. Surface wettability was assessed by contact angle measurements using a goniometer (OCA 20, DataPhysics, Filderstadt, Germany). The contact angle was determined 60–80 ms after droplet deposition, fitted using the Young–Laplace equation, and repeated at least three times for each liquid and test plate. Water, formamide, and diiodomethane were used as test liquids, and measurements were performed on uncoated plates and plates coated with the sol–gel containing indicator mixtures.
3. Results and Discussion
The key properties of the sol–gel coatings used in this study are summarized in Table 1, including composition, curing time, thickness and stability. These properties are consistent with those characterized in our prior work [2] and provide context for interpreting the pH response of the test plates.
Table 1.
Properties of sol–gel pH sensor coatings.
3.1. pH Test on Test Plates
The optical response of the sol–gel-coated test plates was evaluated by immersing the test plates in a series of aqueous solutions ranging from pH 2 to pH 12 for 1 min. After immersion, the plates were photographed inside a white light box under consistent illumination using a smartphone camera positioned at a fixed distance and angle. The images were analyzed using Color Picker Palette Generator software. The RGB values were plotted as a function to construct calibration curves for each indicator mixture, allowing for quantitative evaluation of the colorimetric response and the effective pH range of the coatings.
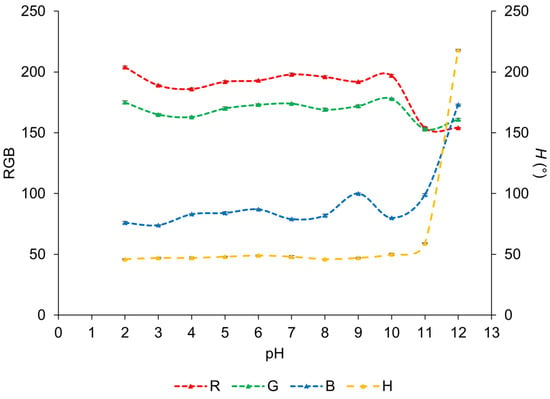
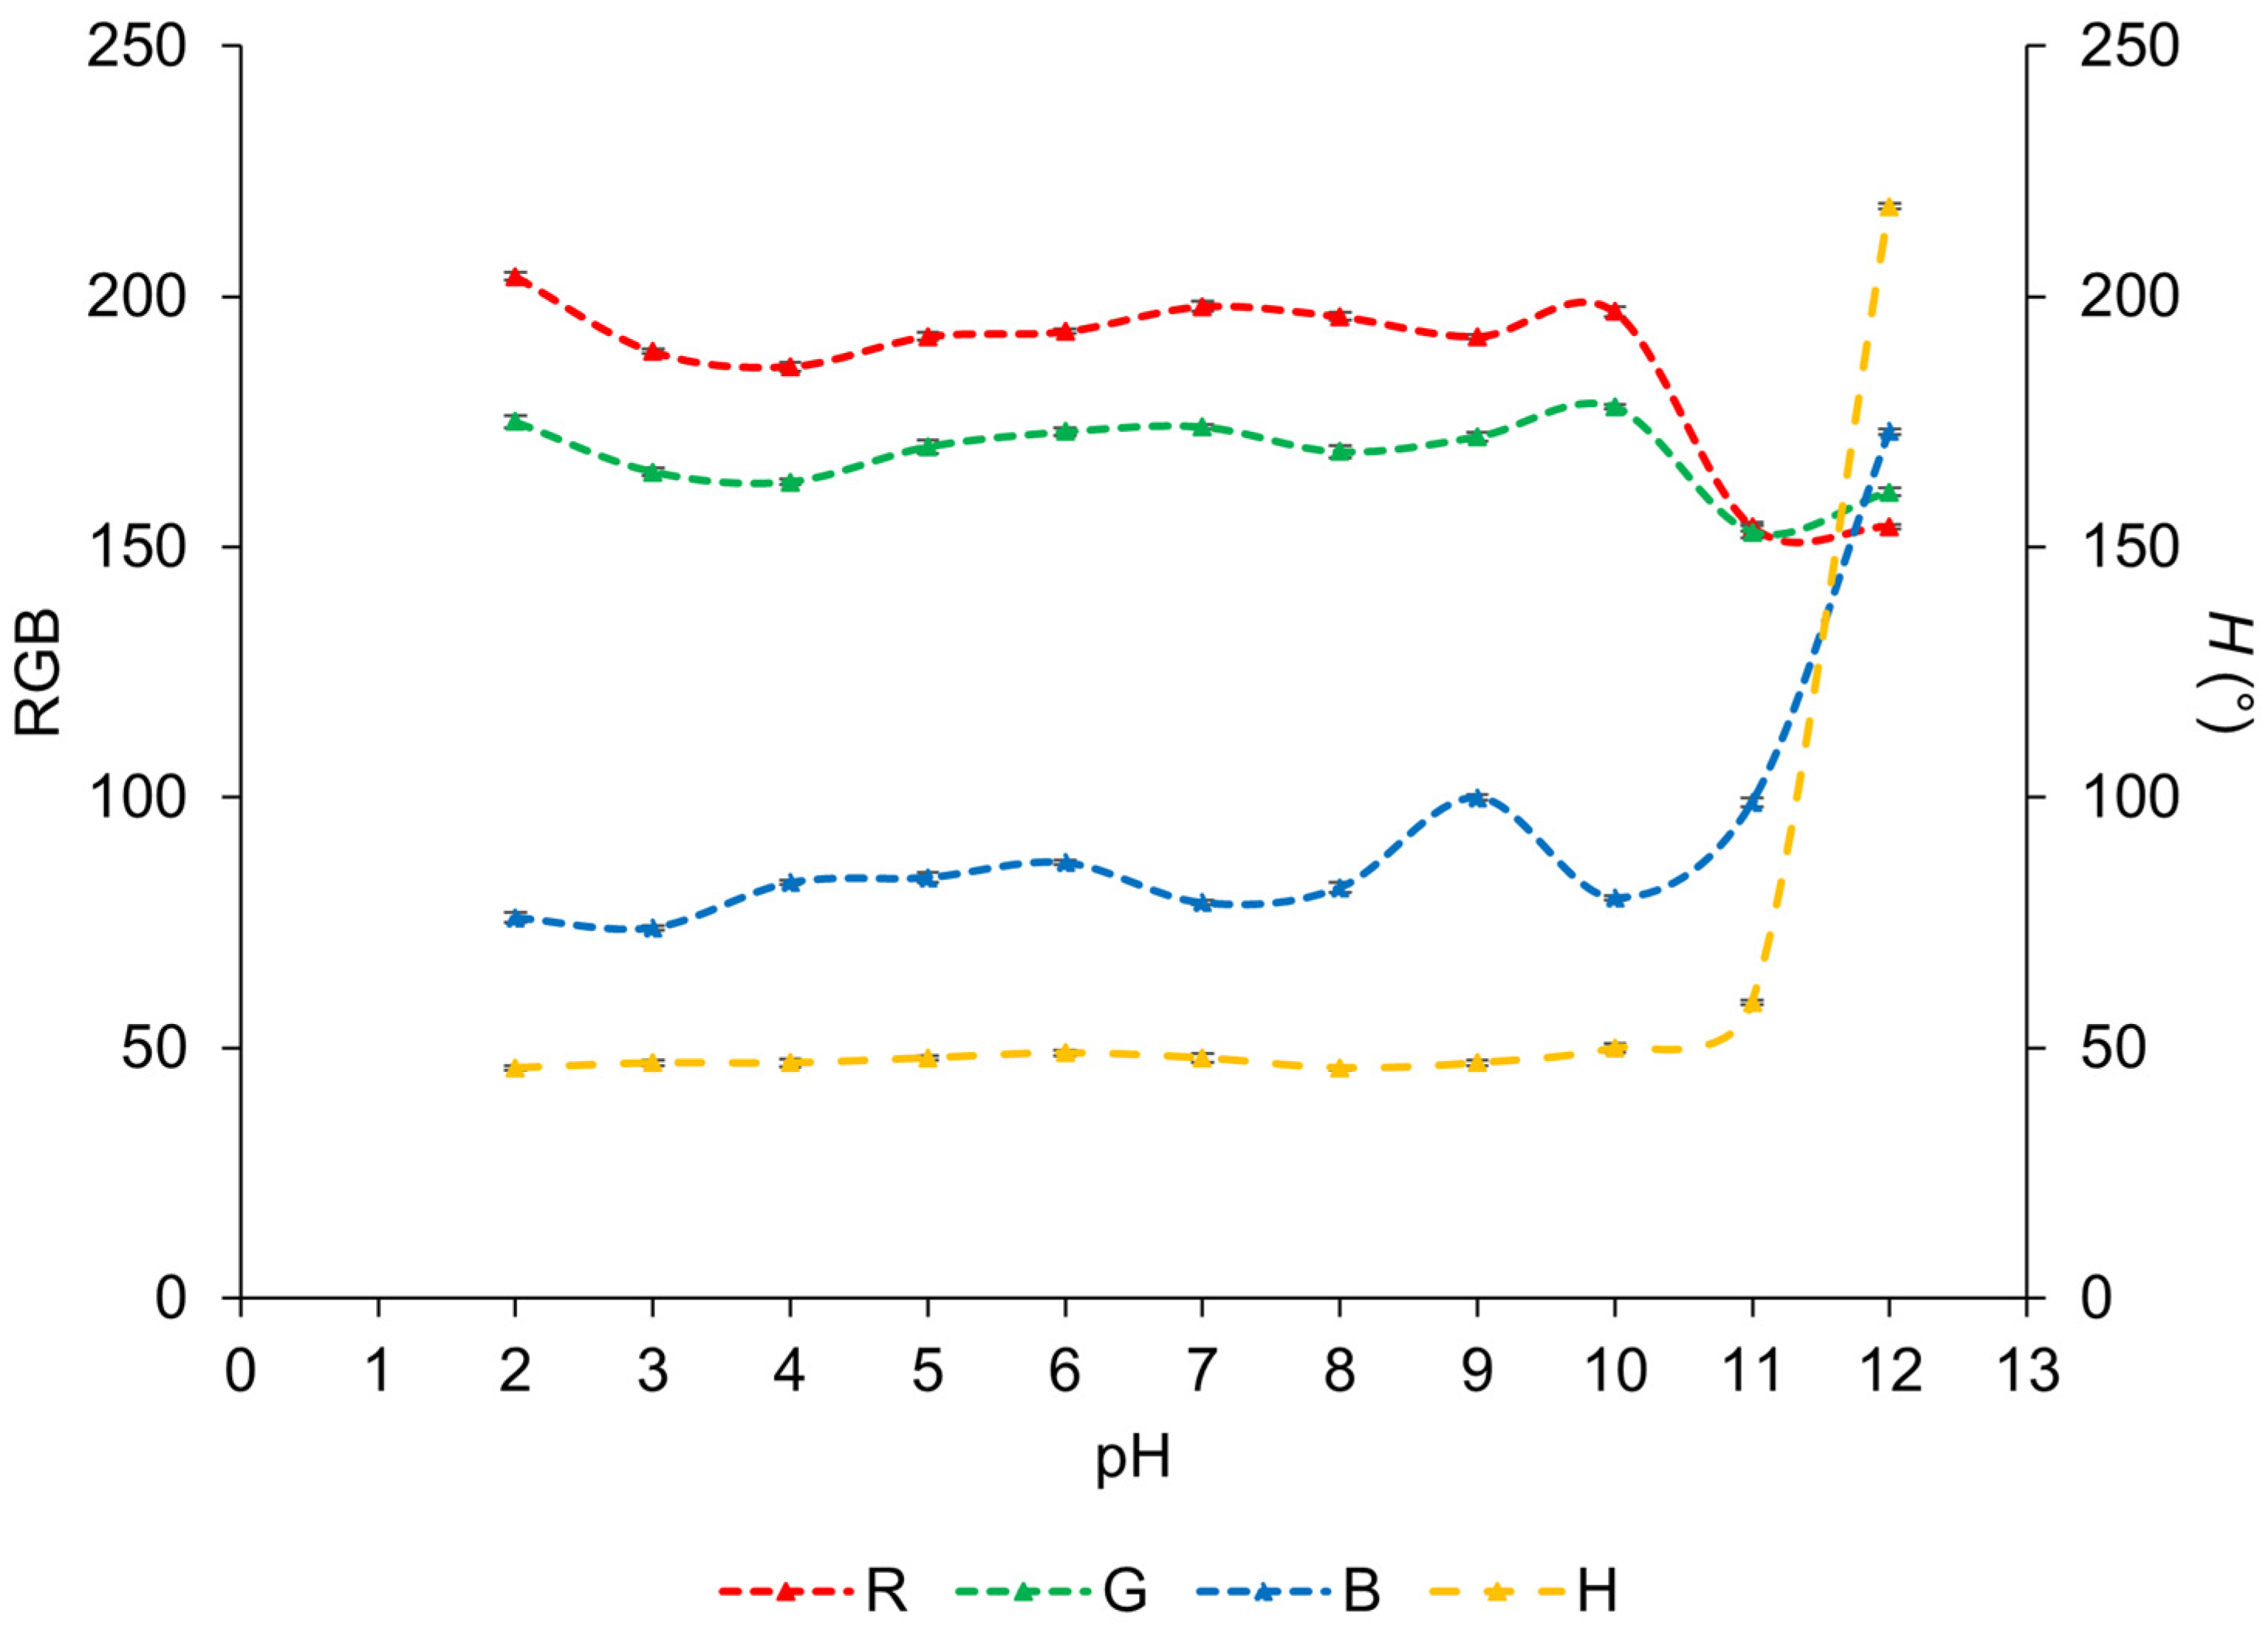
The results presented in Figure 2 and Figure 3 indicate that the color of the sensor coating, with incorporated BCG and BCP 1:1, changes after the test plates are immersed in the pH solutions. As shown in Figure 2, it is possible to see how the color change occurs on the entire surface of the test plates and is generally uniform, although minor variations can still be observed. The coatings exhibit a yellow coloration from pH 2 to pH 10, shift to greenish tone at pH 11, and become distinctly bluish at pH 12.
Figure 3.
RGB and H values measured on the test plates coated with BCG and BCP 1:1 sol–gel and the pH values of the solutions in which the test plates were immersed for 1 min.
The RGB values reflect these changes. The R value remains in the range of 204–186 from pH 2 to pH 10, then drops to 154 at pH 11. The G value is relatively stable between 178 and 161, only decreasing to 153 at pH 11. The B value remains low, between 74 and 100, before rising sharply to 173 at pH 12. The H value more clearly captures the trend as it remains between 46° and 48° from pH 2 to pH 9, increases slightly to 50° at pH 10, rises to 59° at pH 11, and jumps to 218° at pH 12. The sensor coating incorporates bromocresol green and bromocresol purple in a 1:1 ratio. Bromocresol green solution transitions from yellow at pH 3.8 to blue at pH 5.4, while bromocresol purple solution changes from yellow at pH 5.2 to blue-violet at pH 6.8. In the sol–gel coating, however, the most pronounced transition occurs over a shifted and wider pH range (pH 10–12). This shift may result from immobilization of the indicators in the coating or slower diffusion of ions to the indicator molecules, which can reduce responsiveness and increase response time.
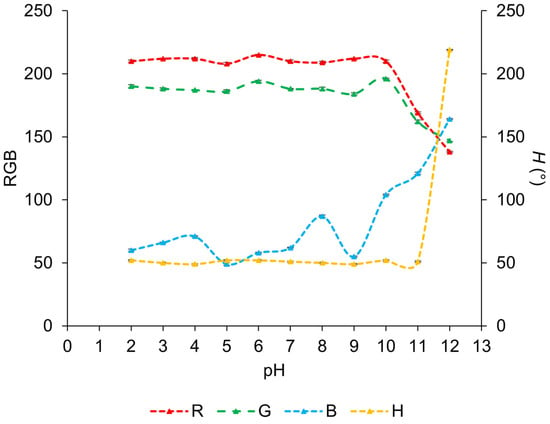
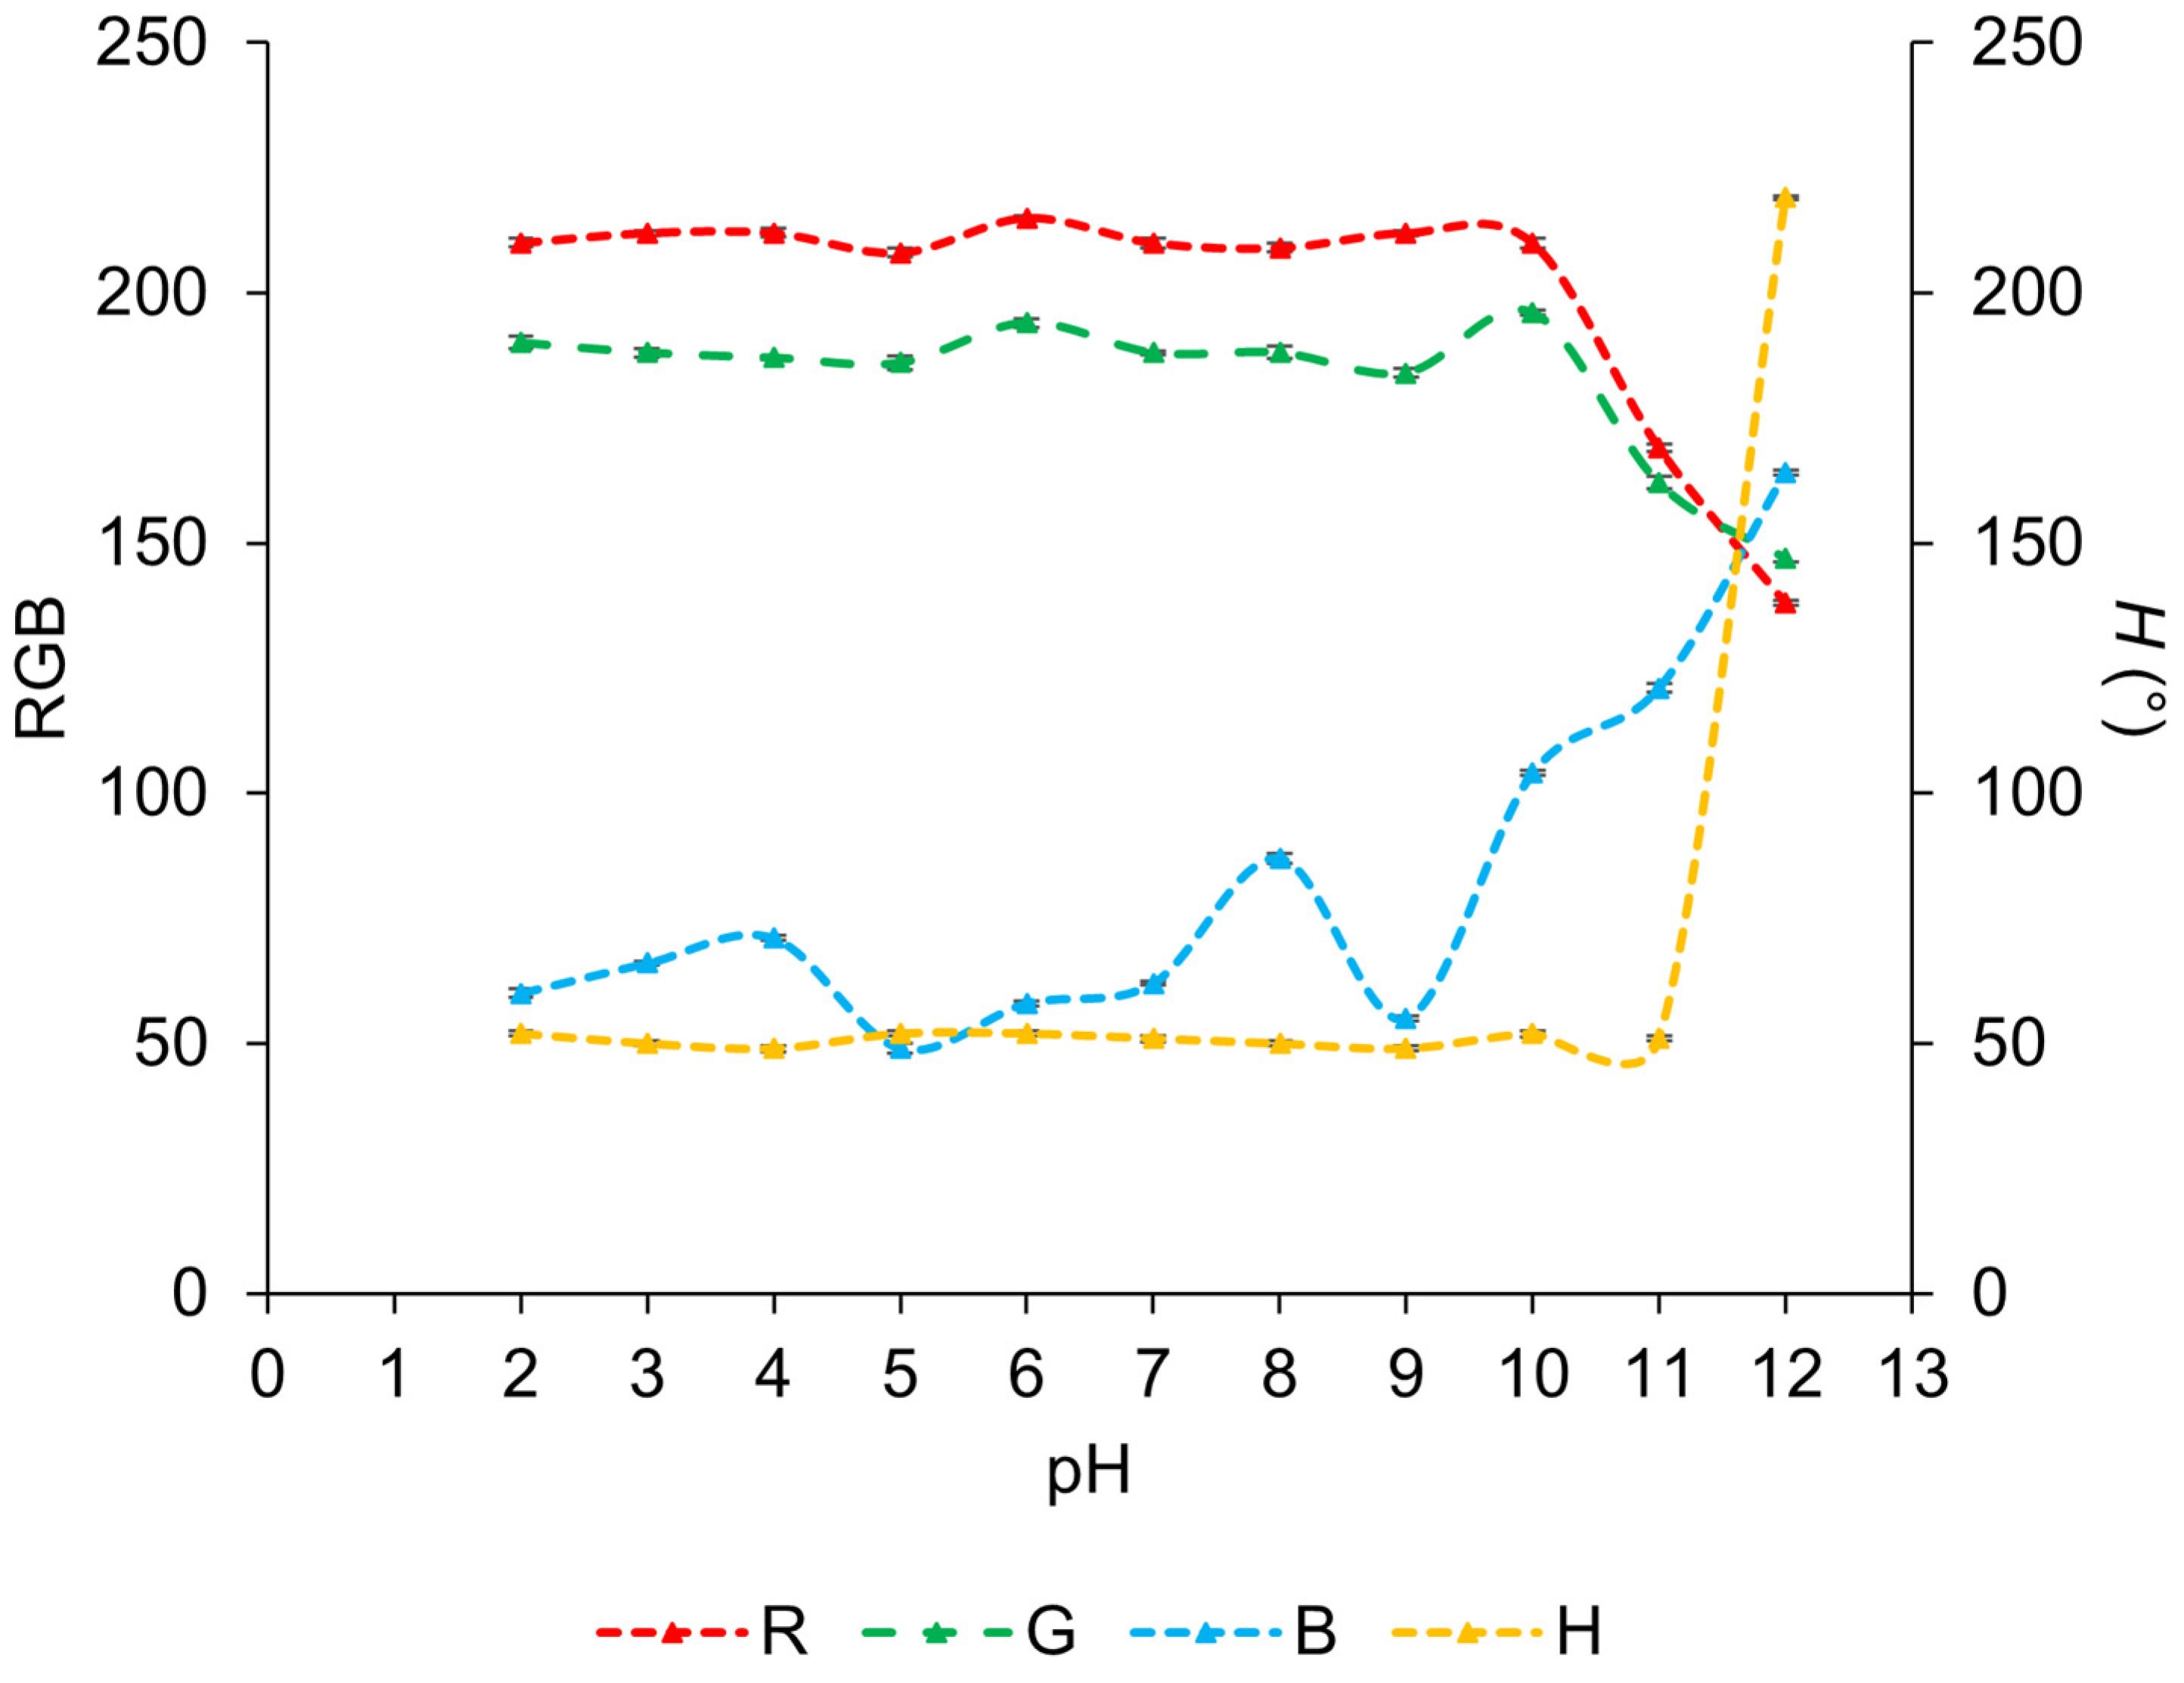
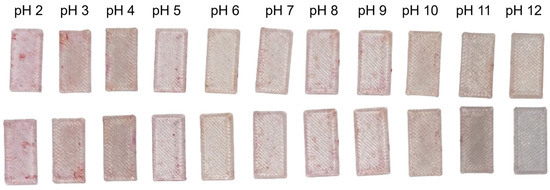
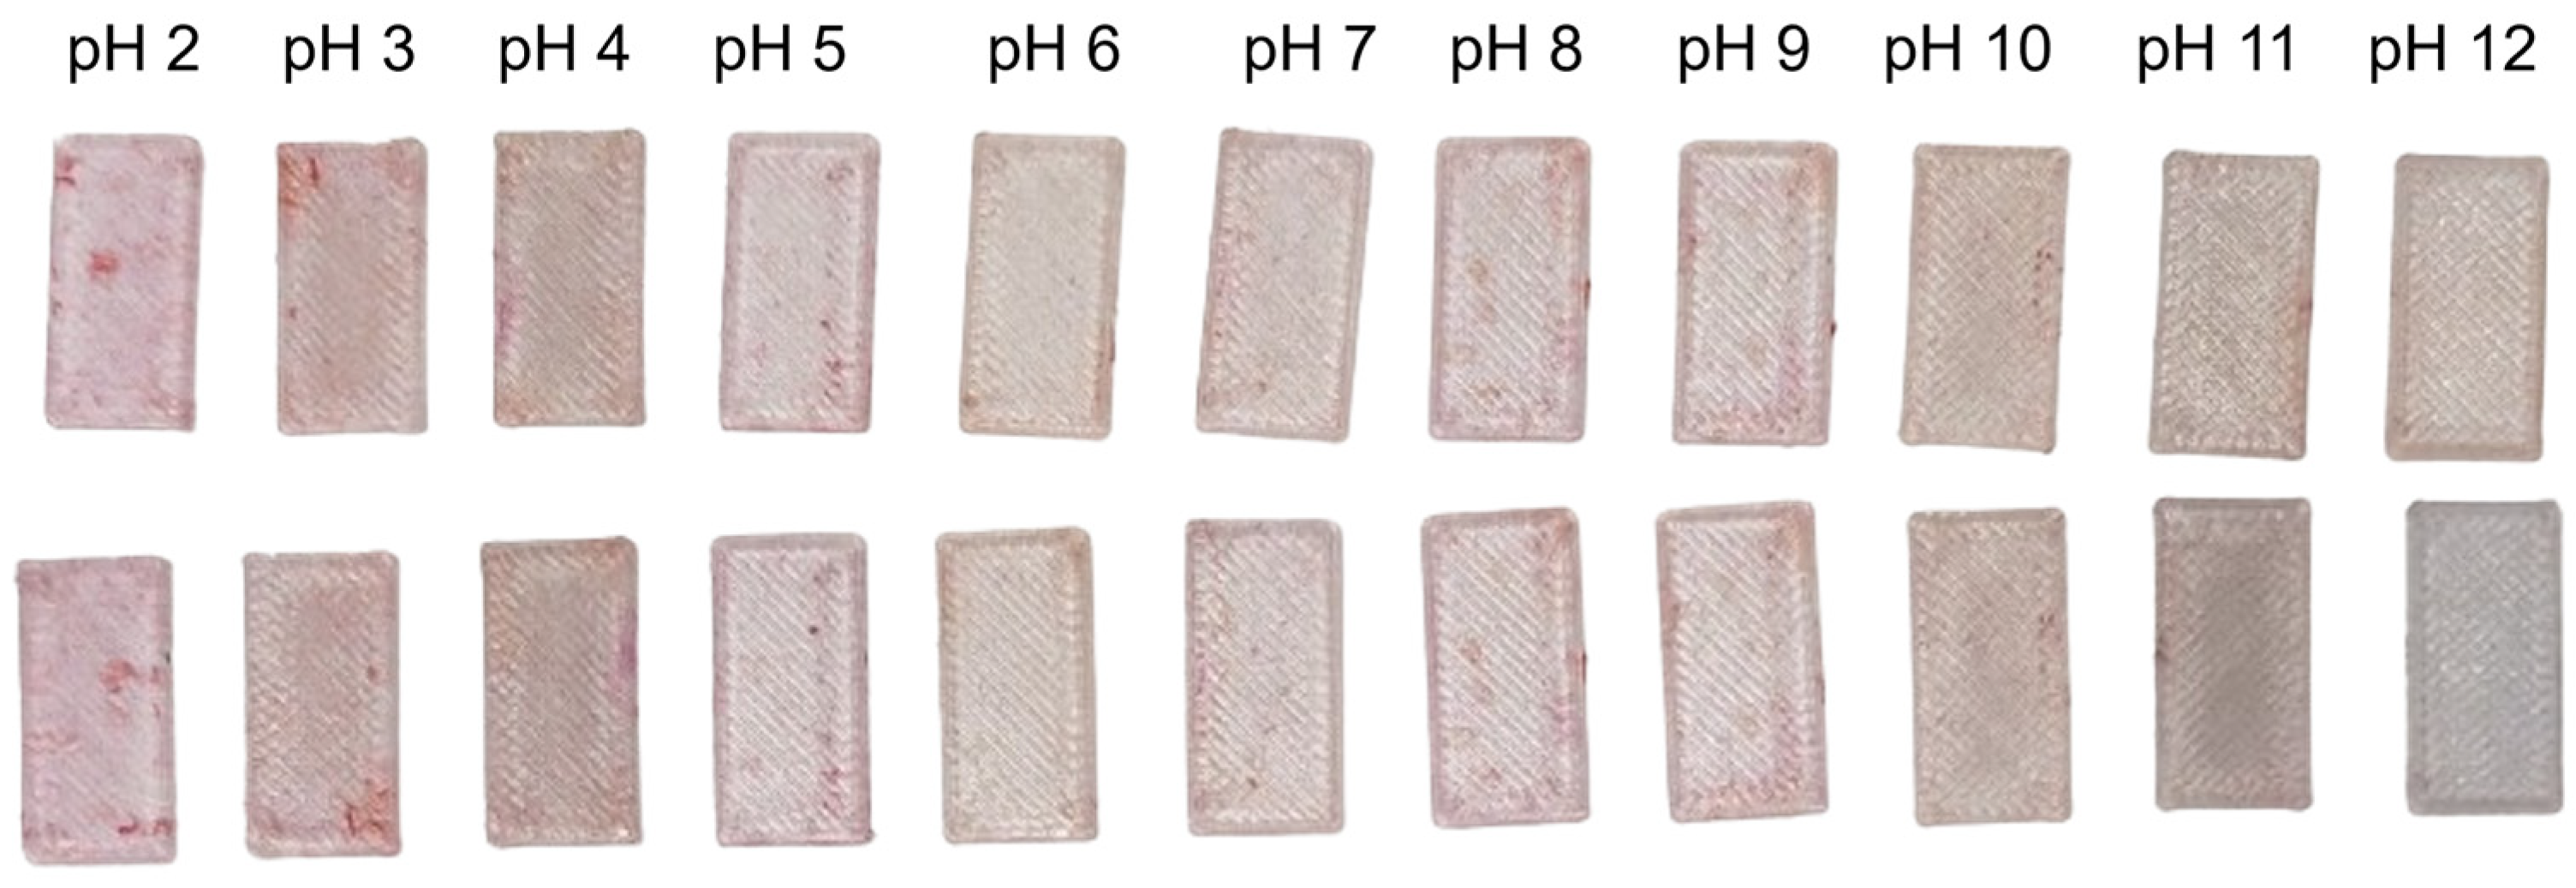
The sol–gel coating incorporating BCG and BCP in a 1:3 ratio also exhibited a pH-dependent color change across the plate surface that was generally uniform, as shown in Figure 4. From pH 2 to pH 10, the coatings appeared yellow, then transitioned to greenish, which was less intense than in the previous set, and turned bluish at pH 12. The RGB measurements reflect these changes quantitatively, as shown in Figure 5. The R value remained relatively high, between 210 and 215, from pH 2 to pH 10, then decreased to 169 at pH 11, and further to 138 at pH 12. The G value ranged from 184 to 196, dropping to 162 at pH 11 and 147 at pH 12. The B value was consistently low (49–53) until pH 12, when it sharply increased to 219. The H value remained around 50° up to pH 11, then surged to 219° at pH 12, clearly highlighting the major color transition at high pH values. Compared to the 1:1 coating, the 1:3 coating formulation shows a more abrupt response at pH 12, suggesting that higher bromocresol purple content enhances sensitivity in the alkaline region. As with the previous formulation, this shift toward higher pH values is likely associated with immobilization effects within the sol–gel matrix and diffusion limitations.
Figure 4.
Test plates coated with BCG and BCP 1:3 sol–gel before (up) and after (down) being immersed in solution ranging from pH 2 to pH 12.
Figure 5.
RGB and H values measured on the test plates coated with BCG and BCP 1:3 sol–gel and the pH values of the solutions in which the test plates were immersed for 1 min.
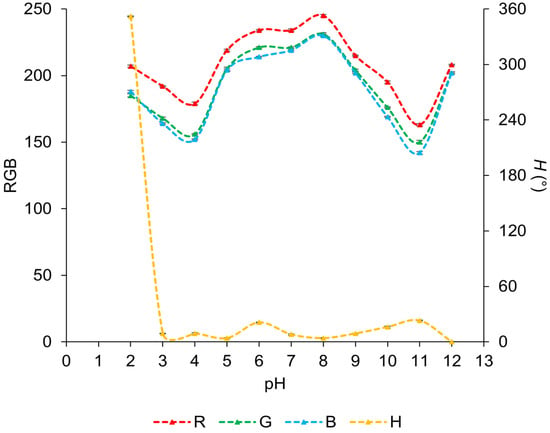
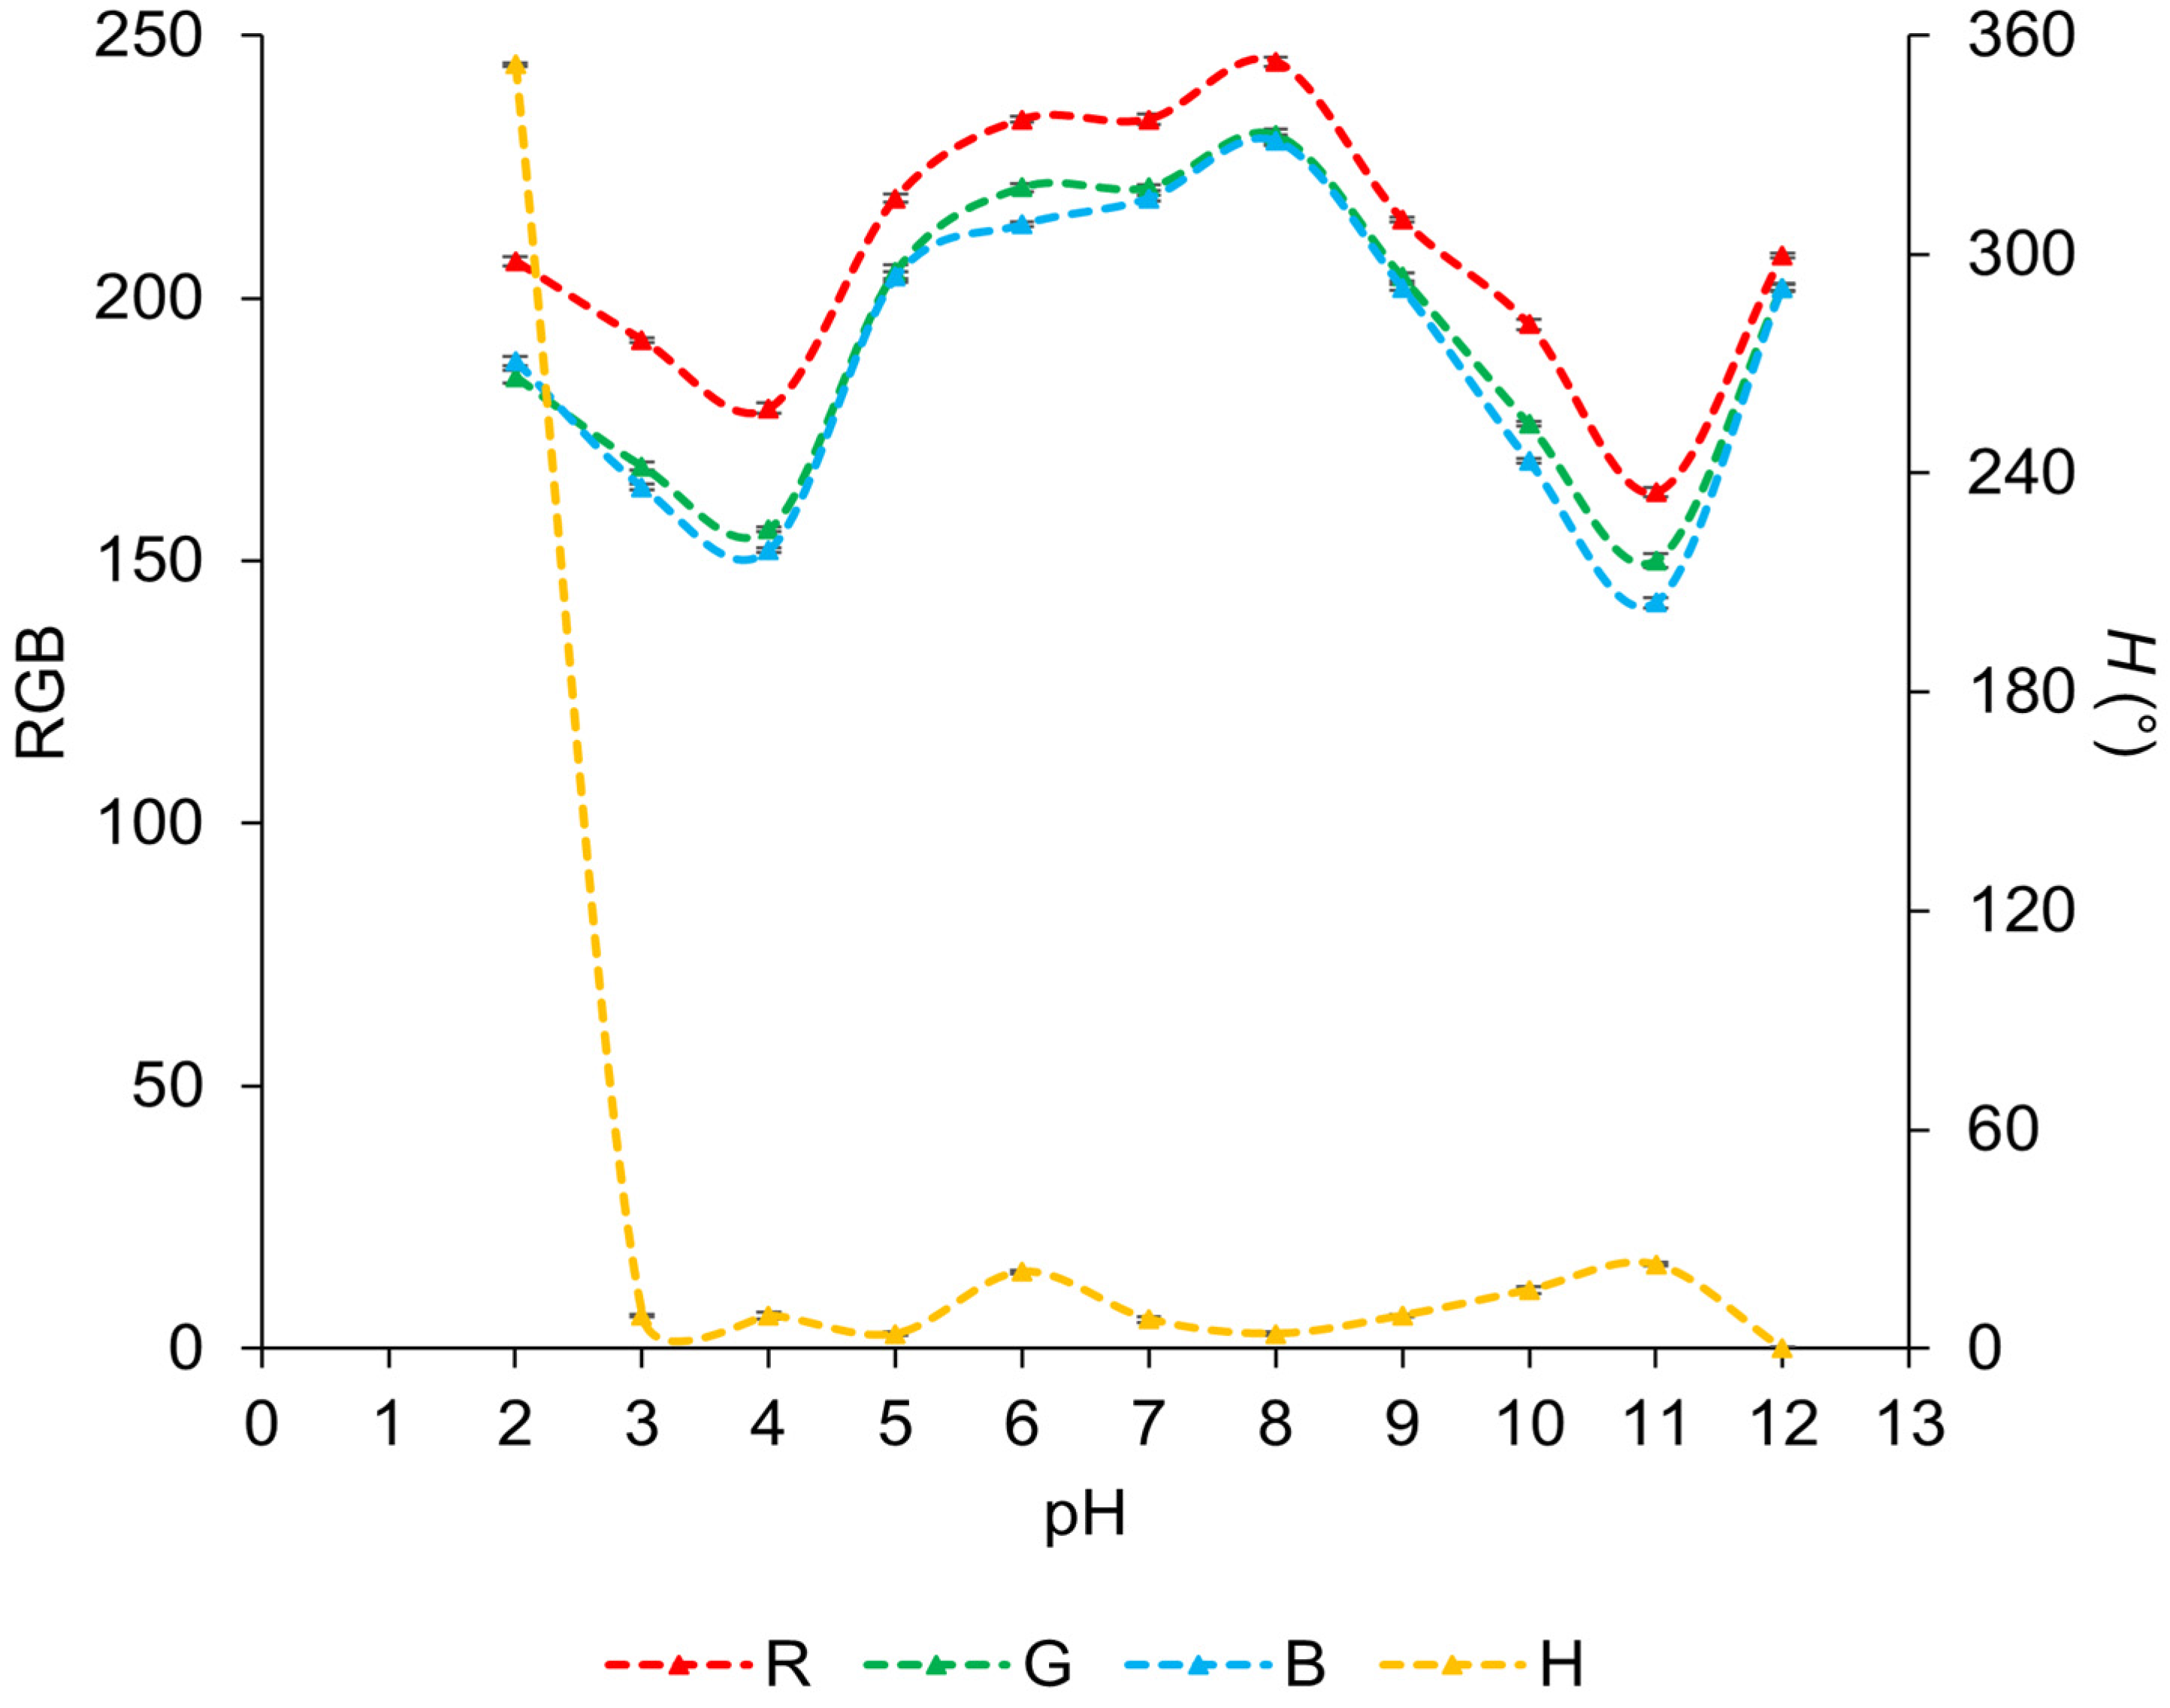
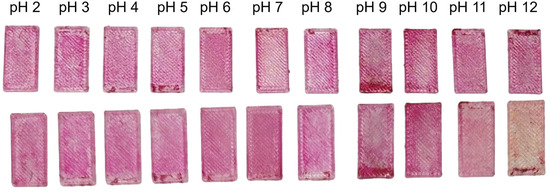
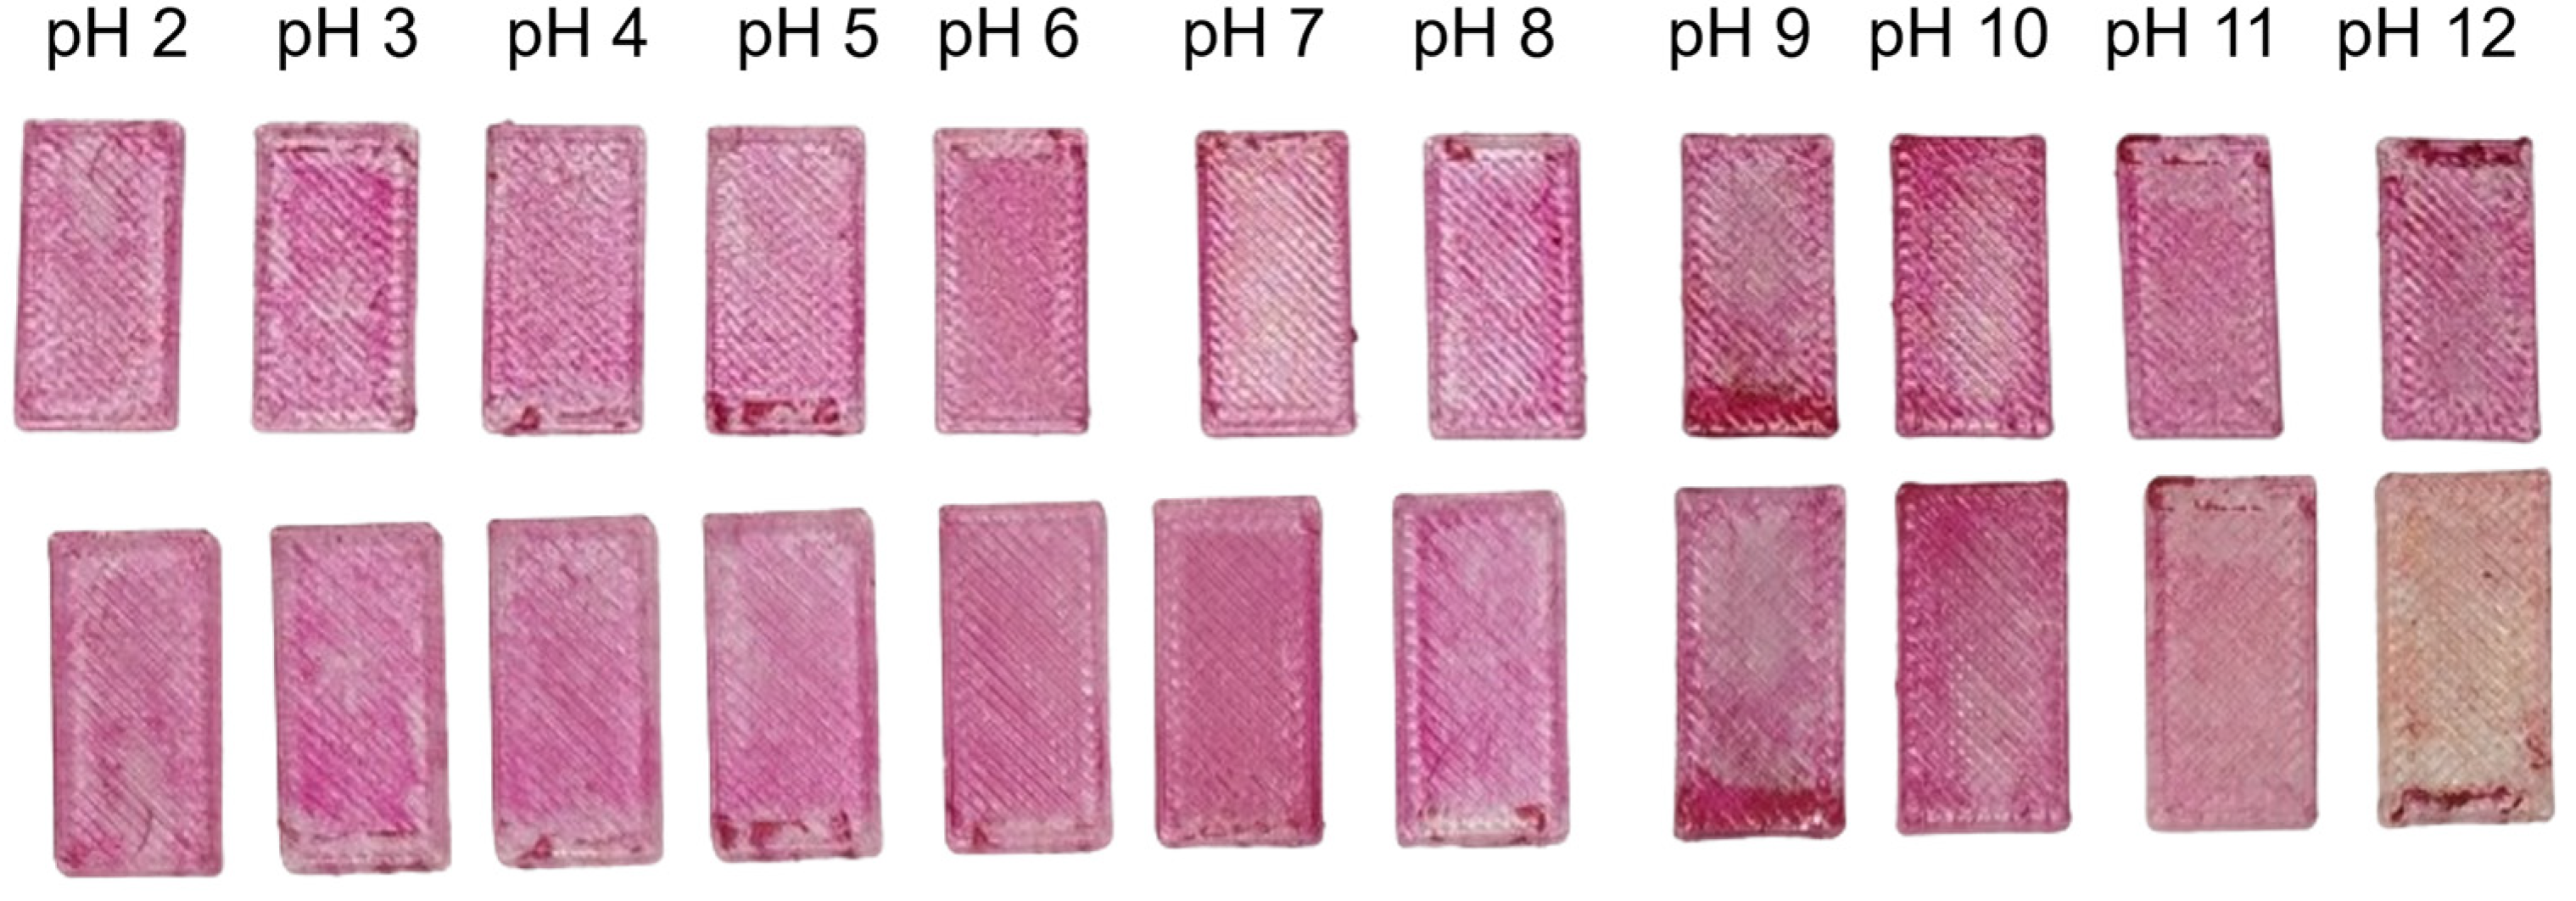
For sol–gel sensor coatings incorporating bromocresol green and methyl red in a 5:1 ratio, the overall color response is noticeably less pronounced than in the previous formulations, and visual differentiation between pH levels is more difficult (Figure 6). Across most of the pH range, only subtle color variations are observed. A clearly distinguishable color change occurs only at pH 12, where the test plates transition from a pinkish-purple appearance to a blue-gray tone. The RGB values reflect this muted response (Figure 7). The R value generally ranges from 163 to 208, forming a wide maximum at pH 8, where it reaches 245. A similar behavior is seen for the B value, which typically lies between 156 and 205 and reaches a maximum of 231 at pH 8. The G value follows the same trend, remaining in the range of 152 to 204 and displaying a rounded maximum of 230 at pH 8. The H value shows a markedly different behavior, starting at a high value of 352° at low pH and then decreasing sharply to 9°. Beyond this point, it remains relatively stable in the range from 9° to 20° across the remaining pH values. This behavior suggests that the principal hue transition occurs at very low pH, after which the response remains largely unchanged. Overall, the BCG and MR sol–gel coating exhibits low color contrast across the investigated pH range and only a single visually discernible transition at high pH, limiting its effectiveness as a pH sensor.
Figure 6.
Test plates coated with BCG and MR sol–gel before (up) and after (down) being immersed in solution ranging from pH 2 to pH 12.
Figure 7.
RGB and H values measured on the test plates coated with BCG and MR sol–gel and the pH values of the solutions in which the test plates were immersed for 1 min.
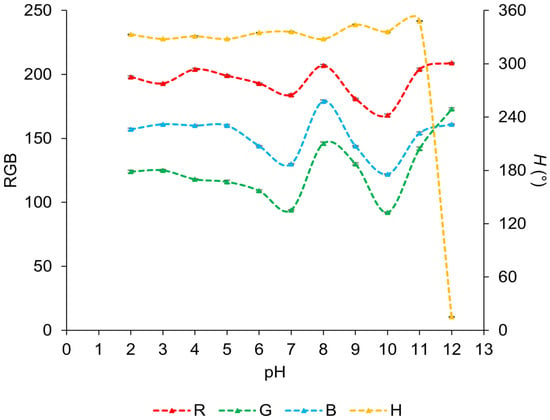
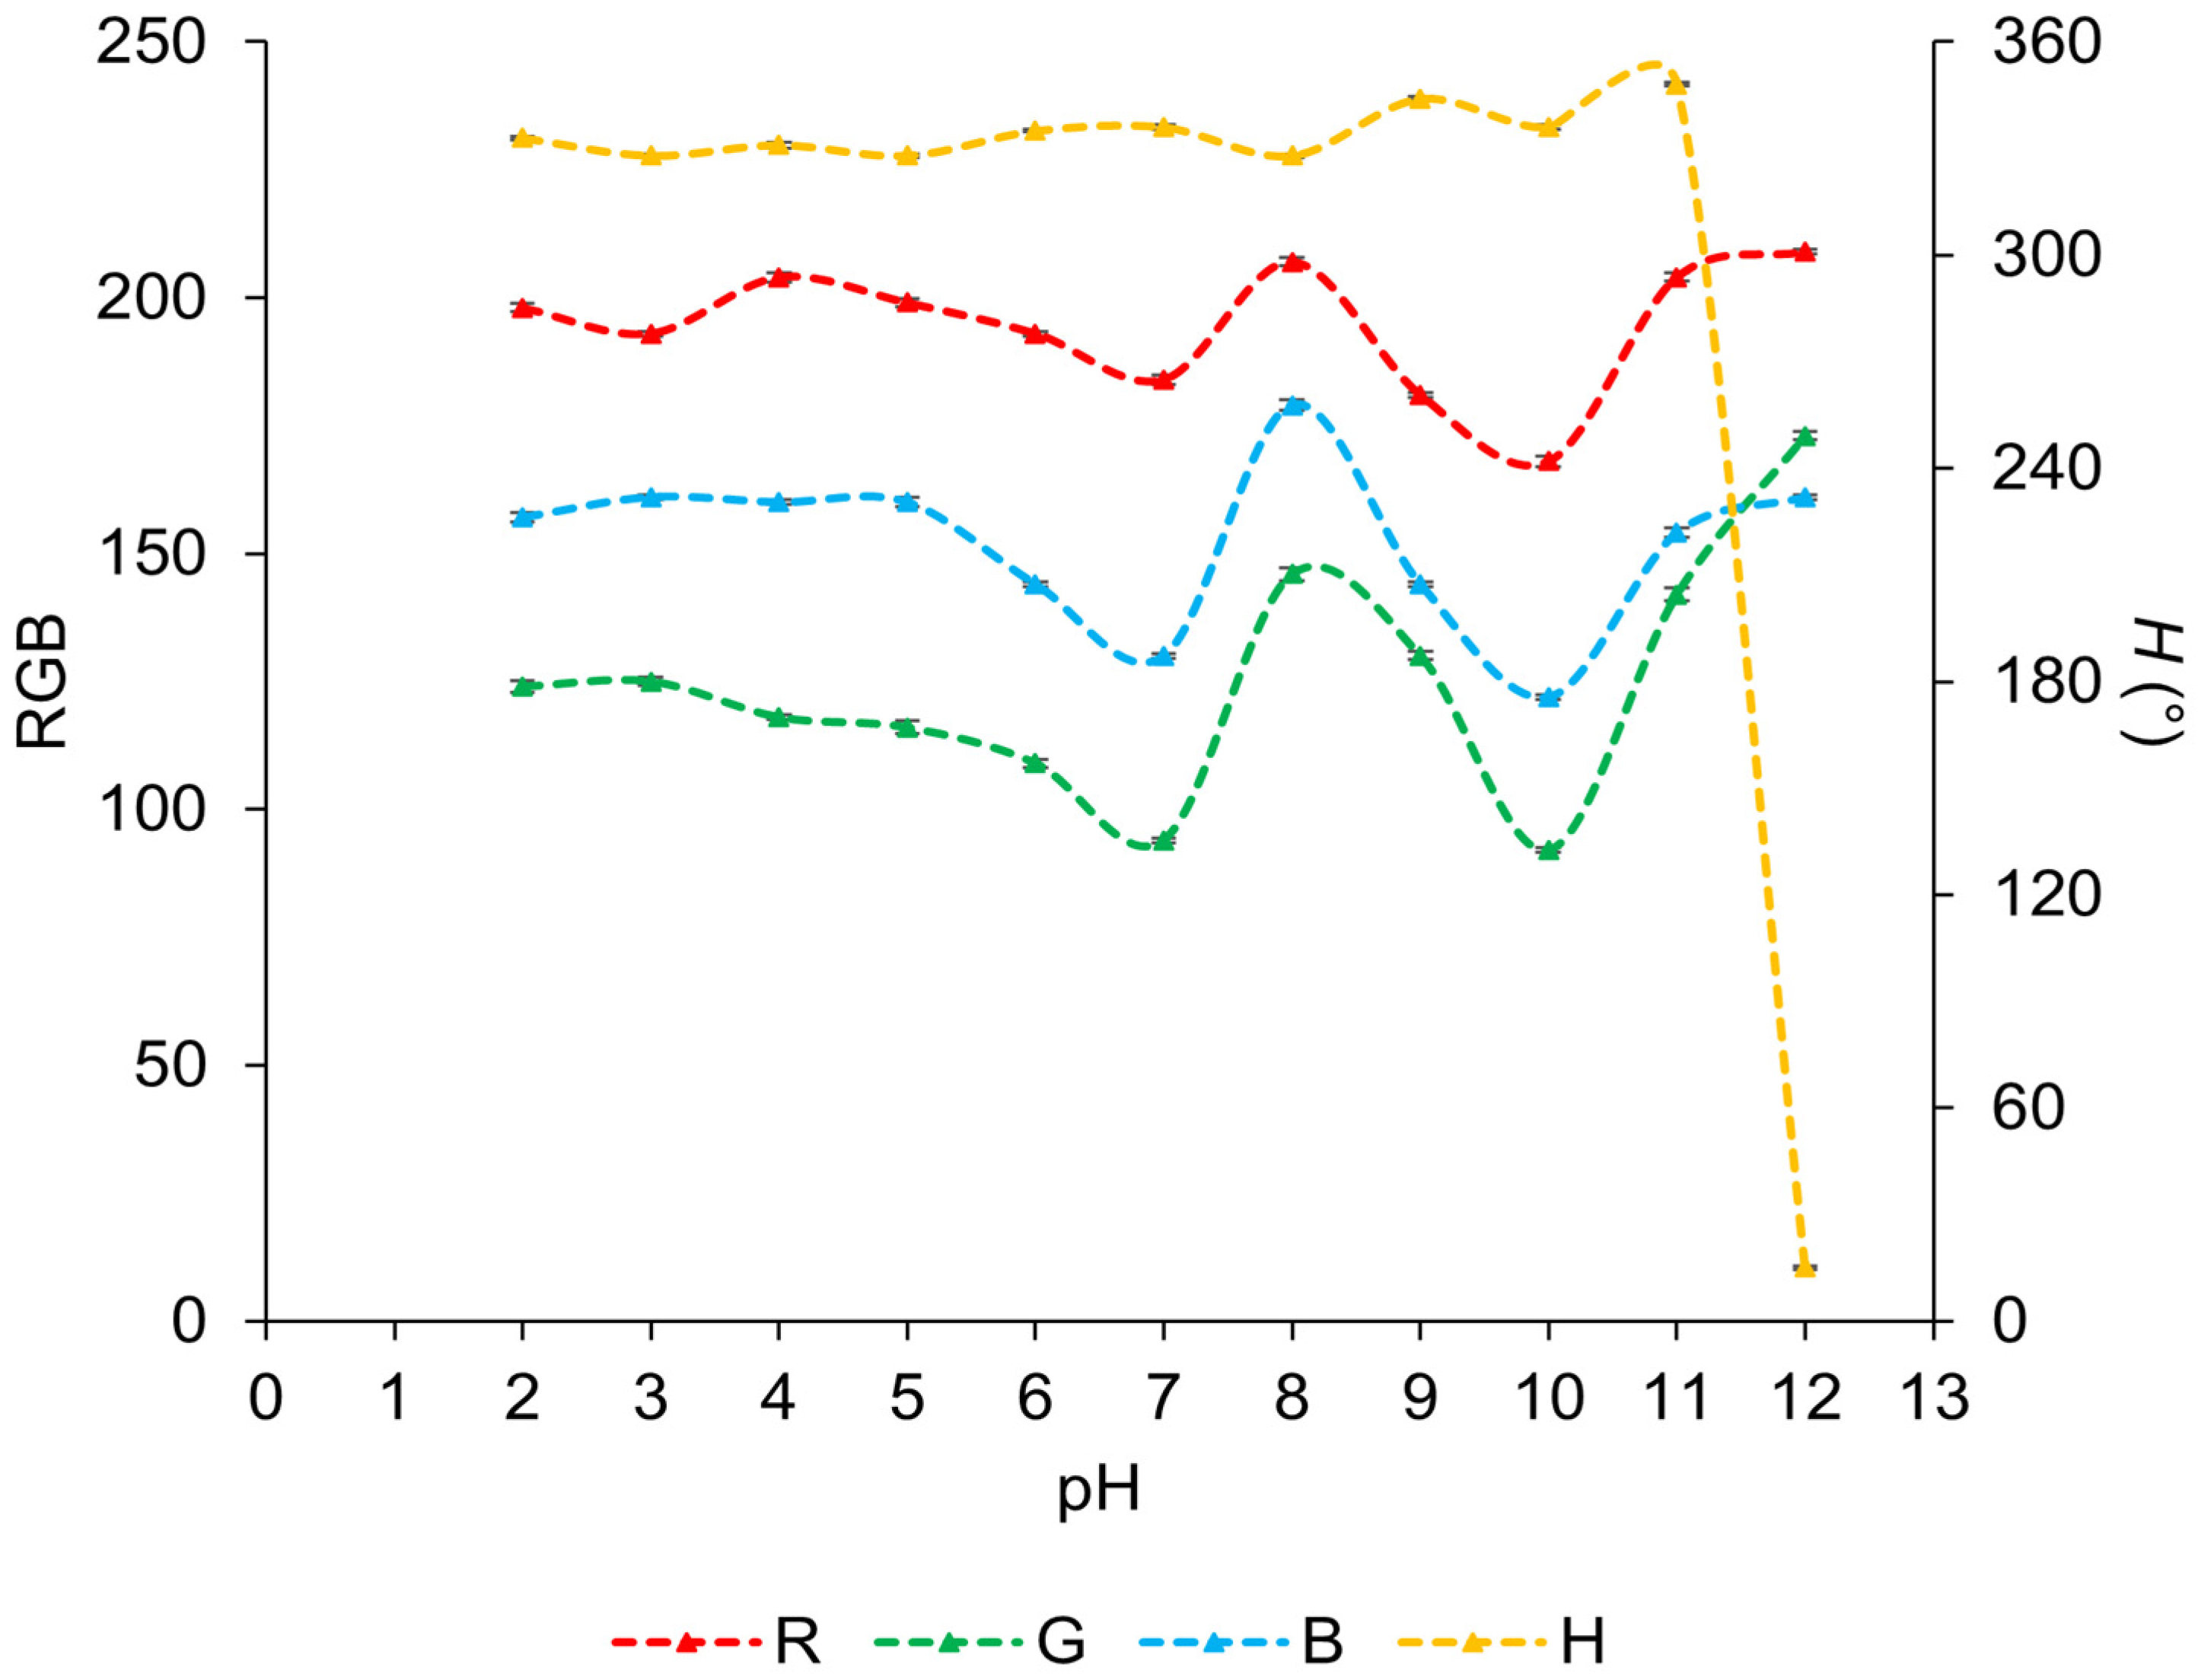
For the sol–gel sensor coating based on a mixture of methyl orange and methyl red, the overall color response is again relatively weak, with differences between pH levels being difficult to distinguish visually (Figure 8). Most test plates retain pink coloration across the investigated pH range. A gradual change is noticeable at pH 11, where the pink color becomes less saturated and appears less vivid. The most evident visual transition occurs at pH 12, where the plate almost completely loses its original coloration and adopts a pale orange tone, clearly differentiating it from the samples. The RGB analysis supports these observations but shows only modest variations (Figure 9). The R value fluctuates mainly around 200, reaching a minimum of 168 at pH 10 before increasing again, with a local maximum also observed at pH 8. The G value lies between 120 and 250, similarly peaking at pH 8 and reaching its minimum at pH 10, followed by an increase at higher pH values. The B value ranges from 150 to 170 and follows a comparable trend to R and G values. In contrast, the H value most accurately captures the observed color change, as it remains nearly constant from pH 2 to pH 11 and then it drops sharply from 348° to 15° at pH 12, corresponding to the pronounced visual change at high pH values. This formulation exhibits limited color contrast over most of the pH range, with meaningful differentiation occurring only under strongly alkaline conditions.
Figure 8.
Test plates coated with MO and MR 1:1 sol–gel before (up) and after (down) being immersed in solution ranging from pH 2 to pH 12.
Figure 9.
RGB and H values measured on the test plates coated with MO:MR 1:1 sol–gel and the pH values of the solutions in which the test plates were immersed for 1 min.
Based on the observations across all tested indicator systems, it can be concluded that the observed color changes are not primarily governed by the specific indicator mixtures incorporated into the coatings, but rather by the properties of the sol–gel coating matrix itself. Regardless of the indicator combination used, a clearly visible response consistently appears only at higher pH values, predominantly in the range from pH 11 to pH 12. This behavior suggests that the sol–gel composition plays a dominant role in determining the effective pH response of the sensor coatings. This interpretation is further supported by previously reported studies in which sol–gel coatings containing a single pH indicator exhibited comparable shifts in the color response toward alkaline pH changes, despite the use of different indicators [2,11]. To further investigate the surface properties of the coatings, contact angle measurements were performed on the test plates (Table 2).
Table 2.
Contact angle values of plates with immobilized indicators.
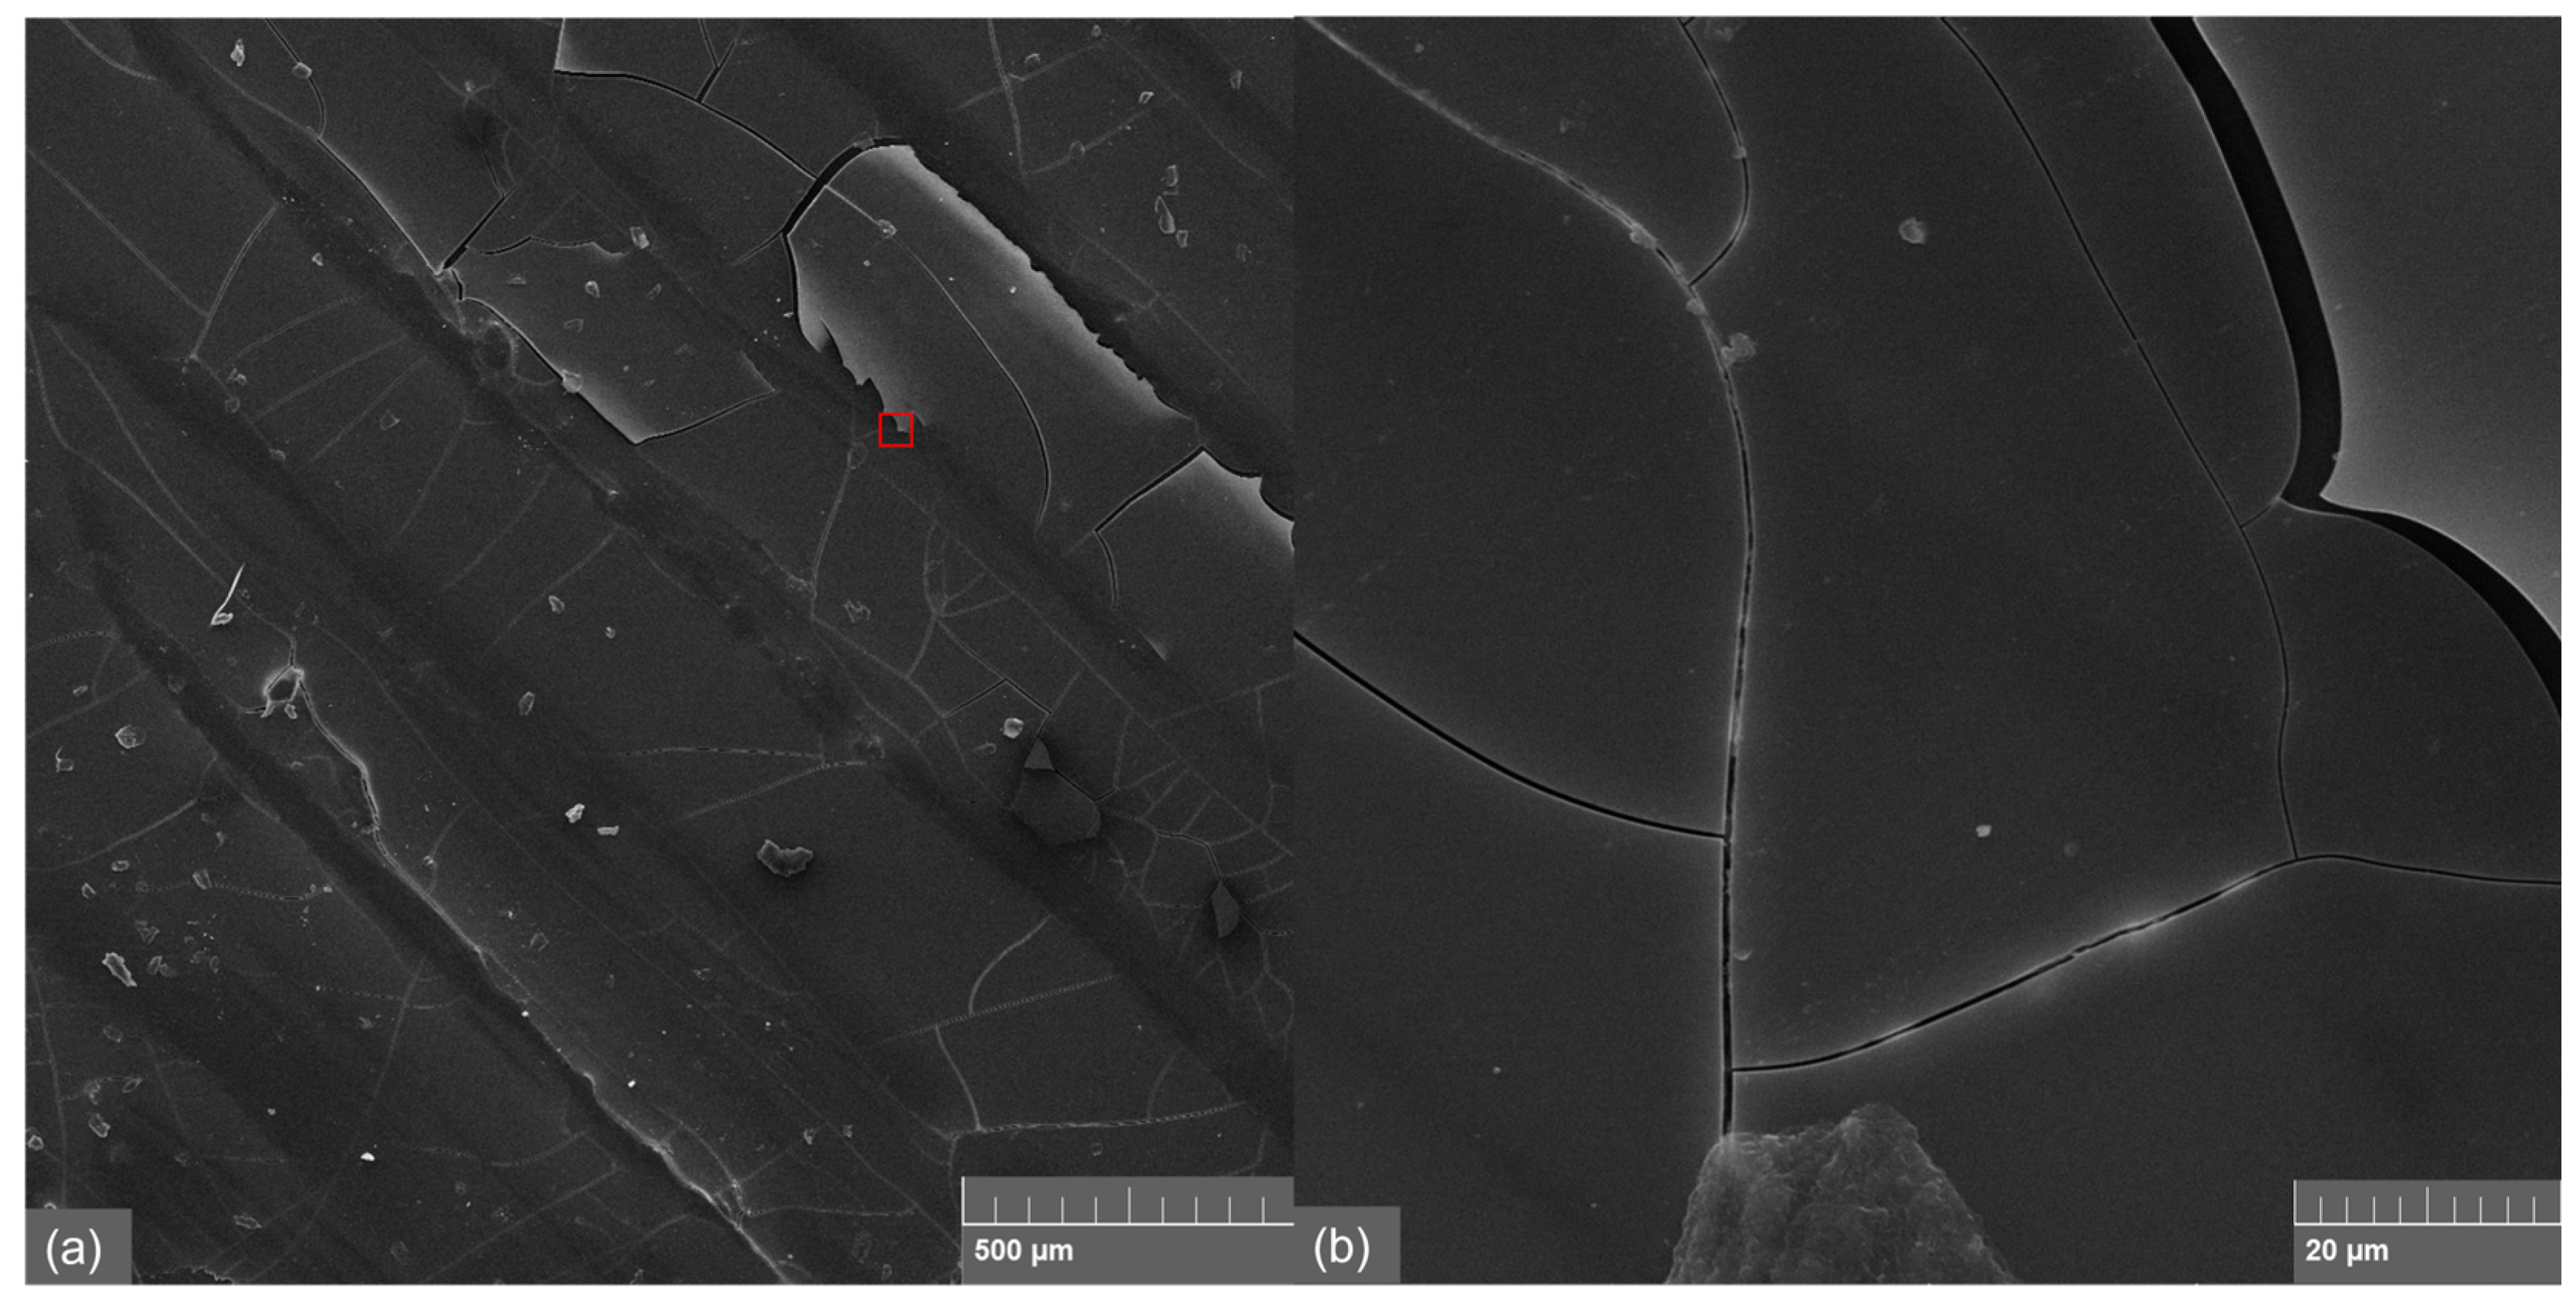
SEM and thickness characterization of the sol–gel coatings were performed to directly validate the films used in the current study. Representative SEM images of the coating are shown in Figure 10, confirming a generally uniform and compact coating, with minor surface cracks visible at higher magnification. These small cracks are typical for sol–gel films on 3D-printed PETG substrates and do not compromise the integrity of the coating or its optical performance. The average film thickness, measured gravimetrically by comparing the microreactor volume before and after coating and dividing by total channel surface area, was found to be 38 µm, with minor local variations expected due to channel geometry and coating process. These results confirm that the coating morphology and thickness are consistent with prior work [2,11], providing a reliable basis for interpreting the hue-based optical response observed during microreactor experiments. Adhesion and mechanical robustness of the coating were not assessed in this study and would require dedicated testing in future work.
Figure 10.
SEM images of the sol–gel coating on the test plates: (a) 100×, (b) 2000×.
The highest contact angle values were observed for the sample containing a BCG:BCP indicator mixture in a 1:1 ratio for all test liquids (water and diiodomethane (DIM)), indicating low surface energy and weak interaction with polar liquids. In contrast, samples containing MO and MR (1:1) and BCG and MR (5:1) indicators exhibit lower contact angle values, suggesting higher surface energy and a more pronounced affinity of the surface toward polar liquids, particularly water. According to the Owens–Wendt (OW) model, the lowest surface energy value is observed for the sample with BCG and BCP indicators (37.1 mJ m−2), while the highest value is obtained for the sample with MO and MR indicators (51.9 mJ m−2). The dispersive component dominates in all samples, which is typical for polymeric materials. However, the polar component increases significantly in the sample containing MR (8.7 mJ m−2 for MO and MR), whereas it is almost negligible for samples with BCG and BCP indicators (0.6 mJ m−2). This indicates that surface with a higher proportion of methyl red exhibit an enhanced capacity for polar interactions. The results obtained using the Wu model confirm the trends observed with the Owens–Wendt model. The total surface energy values are slightly higher in absolute terms, but the relative distribution among the samples remains similar. The sample with BCG and BCP indicators shows the lowest surface energy (39.3 mJ m−2), while the sample with MO and MR indicators exhibit the highest values (55.3 mJ m−2). Additionally, all coated samples exhibit higher water contact angles compared to pristine PETG, indicating that the applied indicator-containing coatings increase the hydrophobicity of the PETG surface.
Taken together, these surface property characteristics help explain the pH-dependent behavior of the sol–gel sensor coatings and indicate that they are particularly well-suited to monitoring processes under strongly alkaline conditions. Accordingly, for the saponification reaction, the BCG and BCP 1:3 indicator mixture was selected, as it exhibited the most pronounced and reliable color change among all tested formulations. The distinct color response in the pH range 11–12 enabled clear visual and colorimetric tracking of the reaction progress, demonstrating the practical applicability of these coatings despite their limited sensitivity at lower pH values.
3.2. pH Test in Microreactors
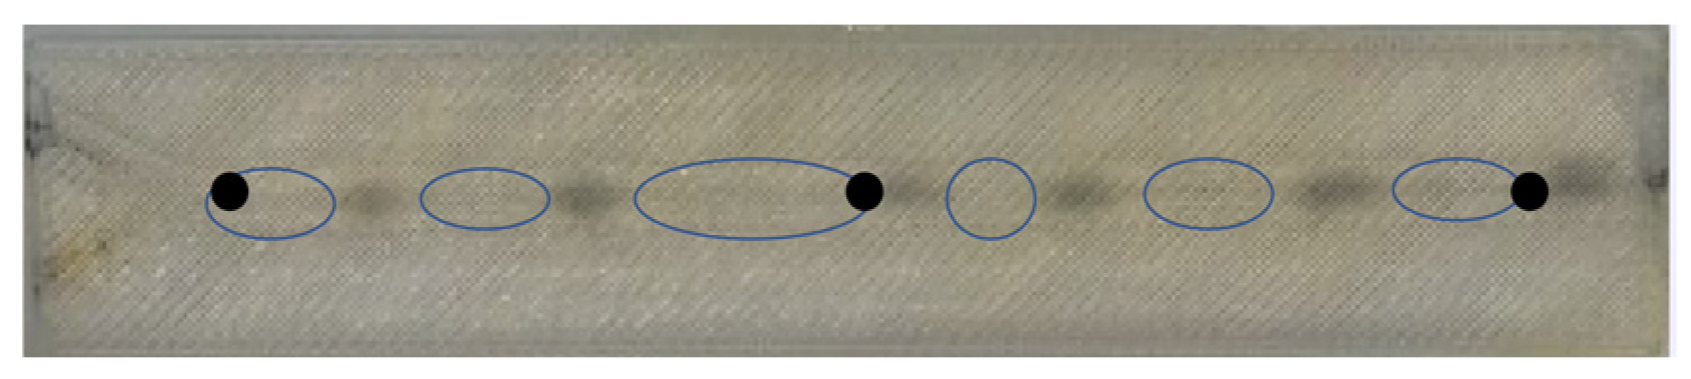
In the microreactor setup, the oil and NaOH solutions were connected to the respective inlets via tubing. To investigate the effect of flow rate on the sensor response, three different flow rates (1 mL min−1, 2 mL min−1, and 5 mL min−1) were applied for both streams. The RGB and H values of the sensor coating were measured at three distinct points along the outlet channel. This allowed us to assess of how the color response and sensor response time vary with flow rate and along the flow path within the microreactor. As shown in Figure 11, the sensor coating exhibits distinct coloration when in contact with oil versus the NaOH solution, providing a clear visual cue of phase identity. This visual difference is consistent with the optical signals quantified later using RGB and hue (H) values, confirming that the sensor can detect phase changes in real time. While the earlier images correspond to static immersion of the test plates in pH solution, the current microreactor configuration involves continuous flow over the sensor-coated channels. This convective transport markedly accelerates the sensor response.
Figure 11.
Microreactor flow visualization showing discrete oil slugs (circled) and NaOH slugs, which appear as darker spots due to the pH sensor coating’s blue color response to the basic solution. Black dots represent three distinct measurement points.
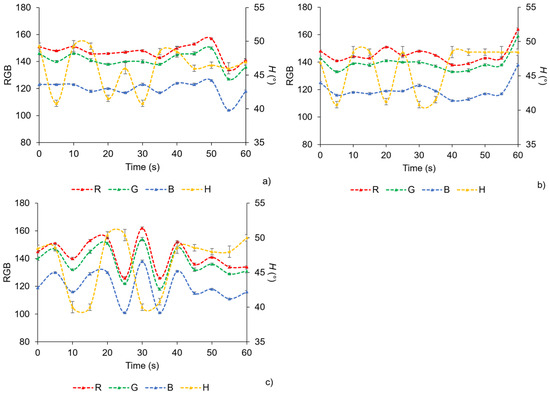
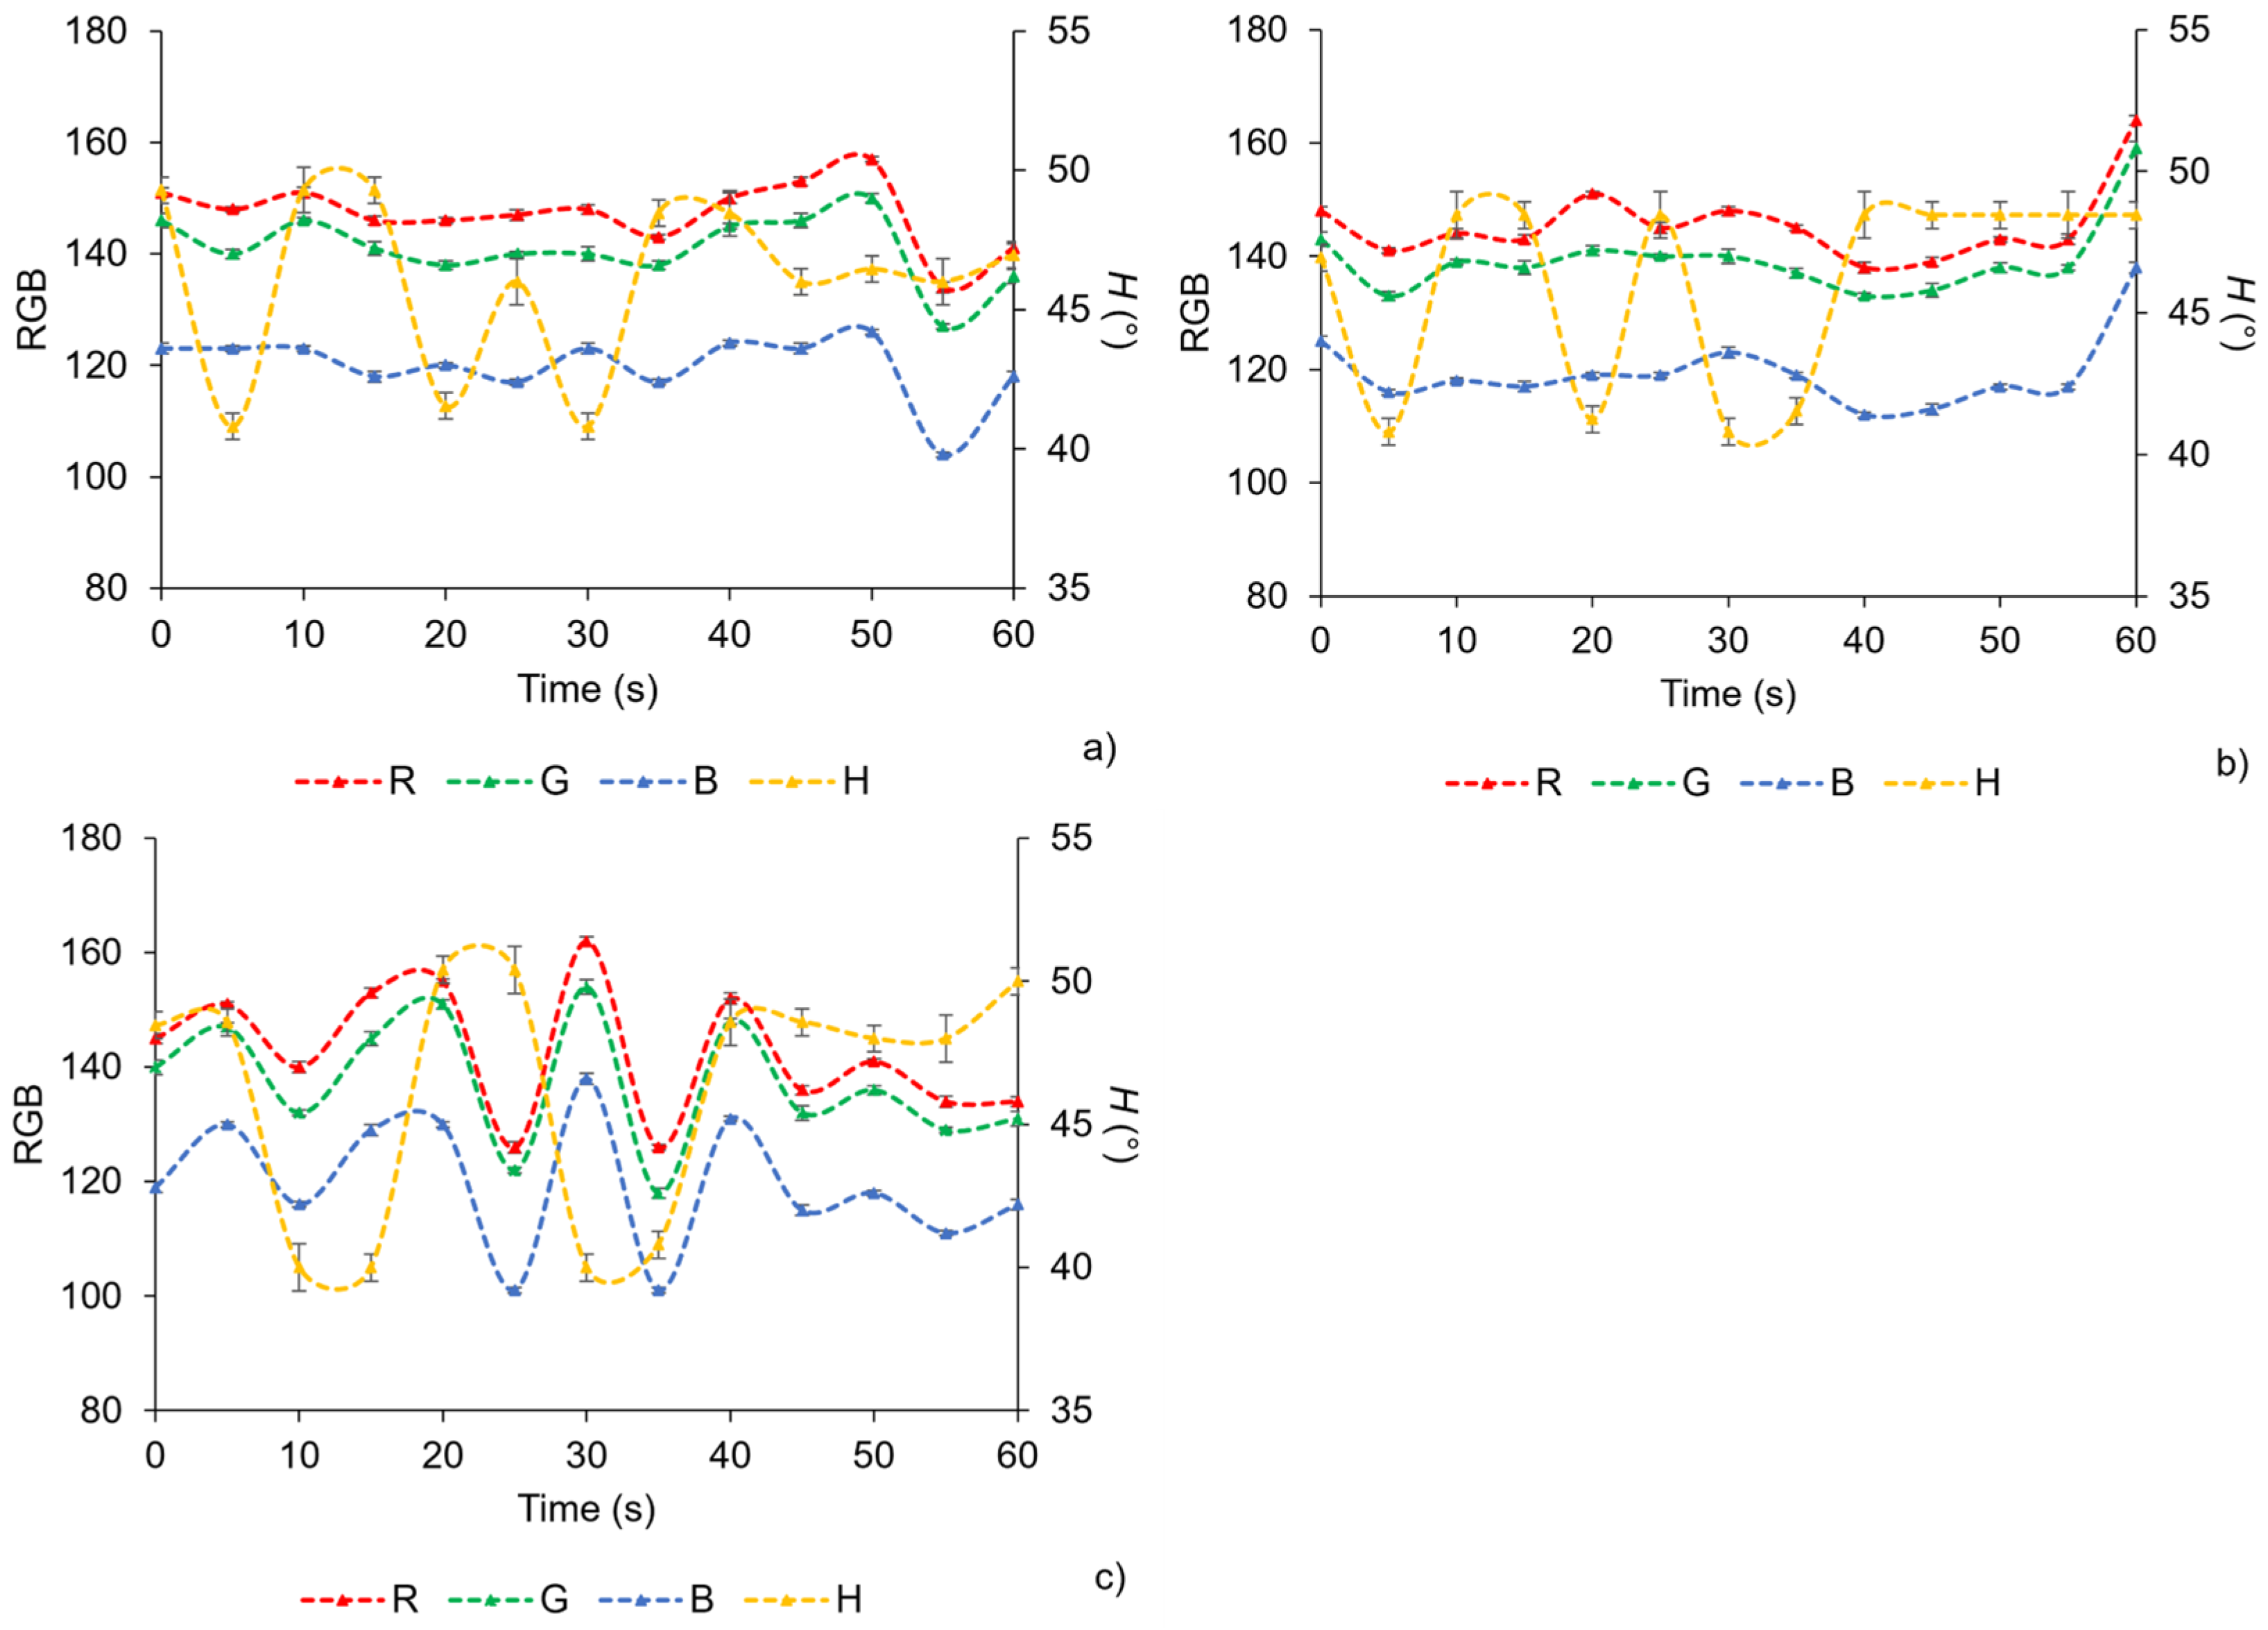
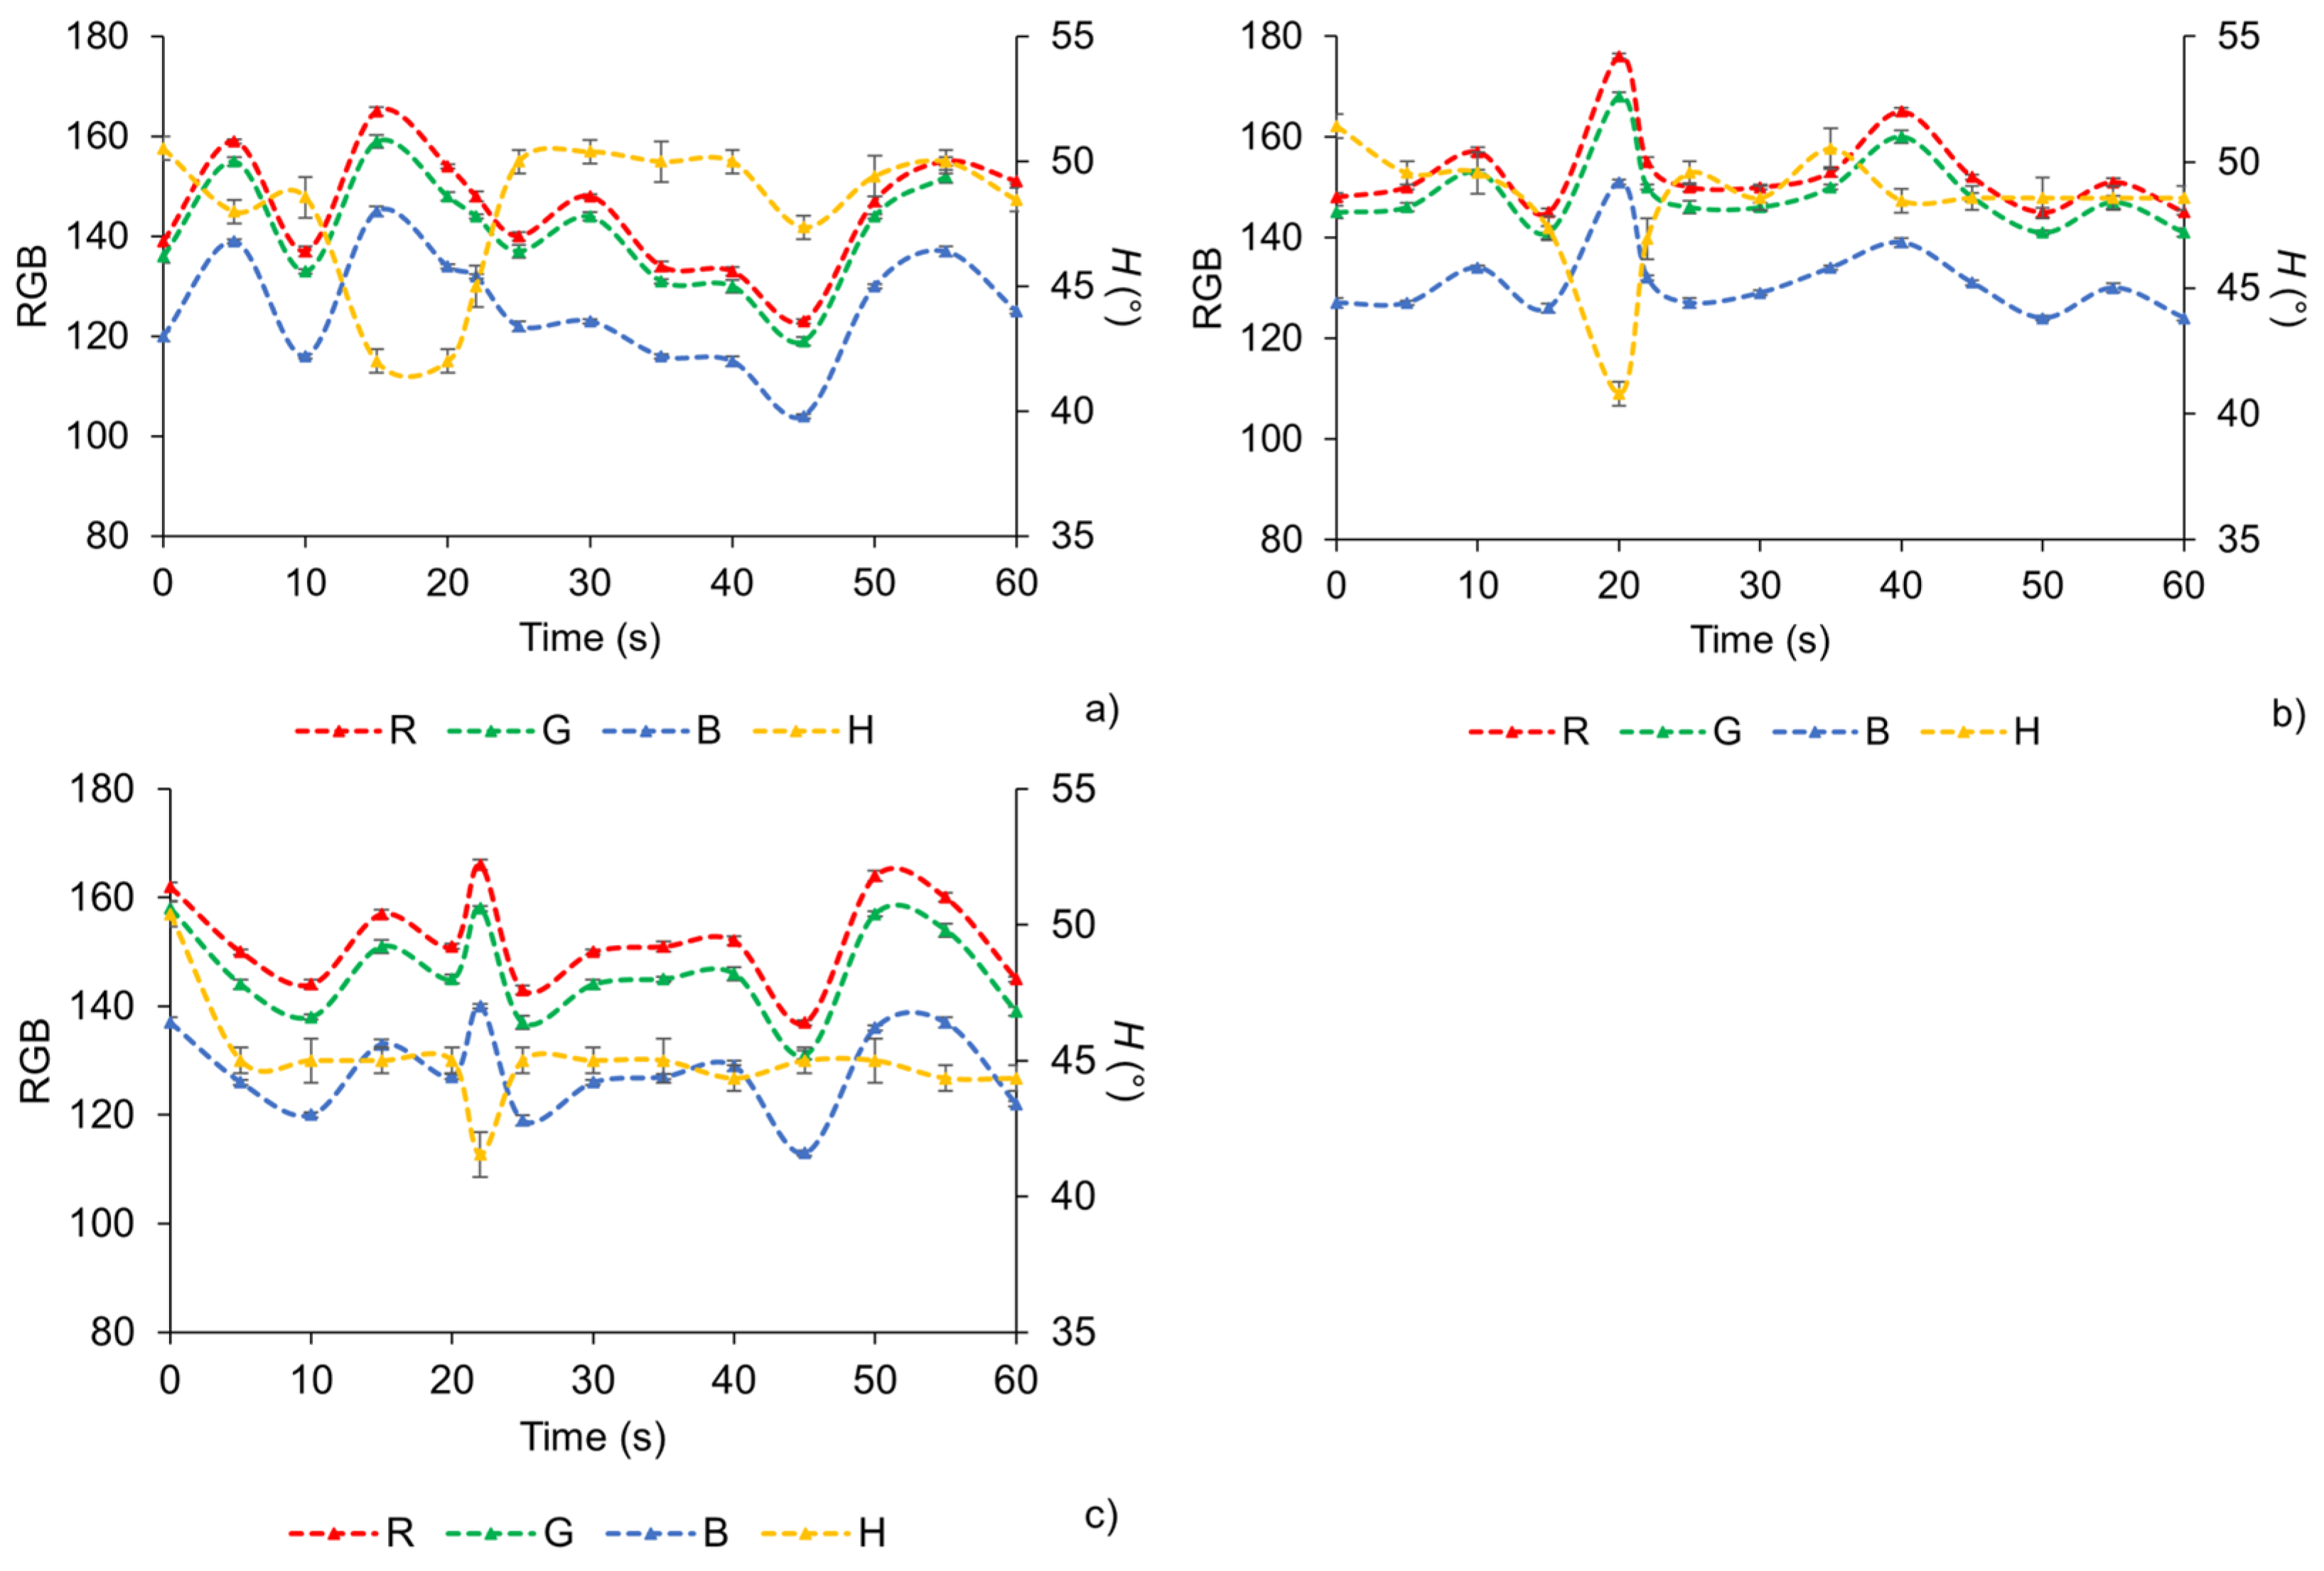
Figure 12 shows changes in the RGB and H values obtained from the optical sensor over time during saponification reactions performed in the microreactor at a flow rate of 1 mL min−1. The three graphs correspond to three distinct measurement locations within the microreactor, as indicated in Figure 1 The oil and NaOH phases were introduced simultaneously into the microfluidic channels, with a stable slug flow established at the beginning of the experiment. A distinct and immediate color change was observed in the sensor region as alternating slugs passed the detection zone, enabling optical monitoring of the reacting system. The individual RGB values did not exhibit a consistent or monotonic trend over time during saponification reaction. Although fluctuations in RGB components were observed as oil-rich and base-rich slugs passed through the channel, these variations overlapped significantly and did not provide a reliable basis for distinguishing between the reacting phases. This lack of consistency is attributed to the sensitivity of RGB values to optical reflections within the microchannel and local differences in slug geometry. In contrast, the H values extracted from the HSV color space exhibited a clear, repeatable, and phase-dependent response during the reaction. When NaOH-dominant slugs passed through the sensing region, the H value remained relatively stable at 50°. When oil-dominant slugs passed, the H value decreased sharply to 41°, producing a distinct and reproducible signal. The stability of the hue plateaus associated with each slug type demonstrates that hue is a robust parameter for monitoring phase changes at 1 mL min−1. The consistent separation of hue values between oil-rich and base-rich slugs demonstrates the effectiveness of color-based sensing for noninvasive, real-time monitoring of saponification reactions in slug-flow microreactors. Because the method relies solely on optical observation, it avoids the need for intrusive probes or sampling, preserving the hydrodynamics and reaction environment within the channel. Moreover, the repeatable color response enables accurate tracking of slug passage and reaction-related changes, even at relatively low flow rates where residence times are longer. By continuously monitoring hue, the progress and stability of the saponification process can be followed without interrupting operation.
Figure 12.
RGB and H values measured at outlet positions of the microreactor, flow rate: 1 mL min−1. (a) Hue as a function of time at point A; (b) hue as a function of time at point B; (c) hue as a function of time at point C.
Figure 13 presents the corresponding optical sensor response obtained during saponification in the microreactor at an increased flow rate of 2 mL min−1. As in the previous experiment, simultaneous introduction of the oil and NaOH phases resulted in the formation of a stable slug flow at the reactor inlet, producing periodic passage of alternating oil-rich and base-rich slugs through the channels. Despite the higher flow velocity and shorter residence time, the overall optical behavior of the system remained highly consistent with that observed at 1 mL min−1. The individual RGB components again displayed noticeable fluctuations as successive slugs traversed the detection zones. However, these variations overlapped substantially and did not follow a clear and reproducible trend, confirming that RGB signals remain unreliable indicators of phase identity under dynamic microfluidic conditions. In contrast, the H values exhibited the same distinct, repeatable, and phase-dependent response observed at the lower flow rate. When NaOH-dominant slugs passed through the sensing zones, the hue value remained stable at 50°, whereas the arrival of oil-dominant slugs produced a sharp and reproducible decrease in hue to 41°. This consistent reduction in H value upon entry of the oil-rich phase demonstrates that the hue parameter remains robust and insensitive to changes in flow rate within the investigated range. The preservation of clear hue plateaus for both phases at 2 mL min−1 further confirms the reliability of hue-based detection for real-time monitoring of multiphase reactions in slug-flow microreactors. Even under increased hydrodynamic stress and reduced residence times, the optical sensor maintained stable discrimination between reacting phases. These results validate the applicability of hue-based optical sensing for continuous, noninvasive monitoring of saponification processes across varying operational conditions, enabling accurate tracking of phase behavior and reaction progression without disturbing the microreactor environment.
Figure 13.
RGB and H values measured at outlet positions of the microreactor, flow rate: 2 mL min−1. (a) Hue as a function of time at point A; (b) hue as a function of time at point B; (c) hue as a function of time at point C.
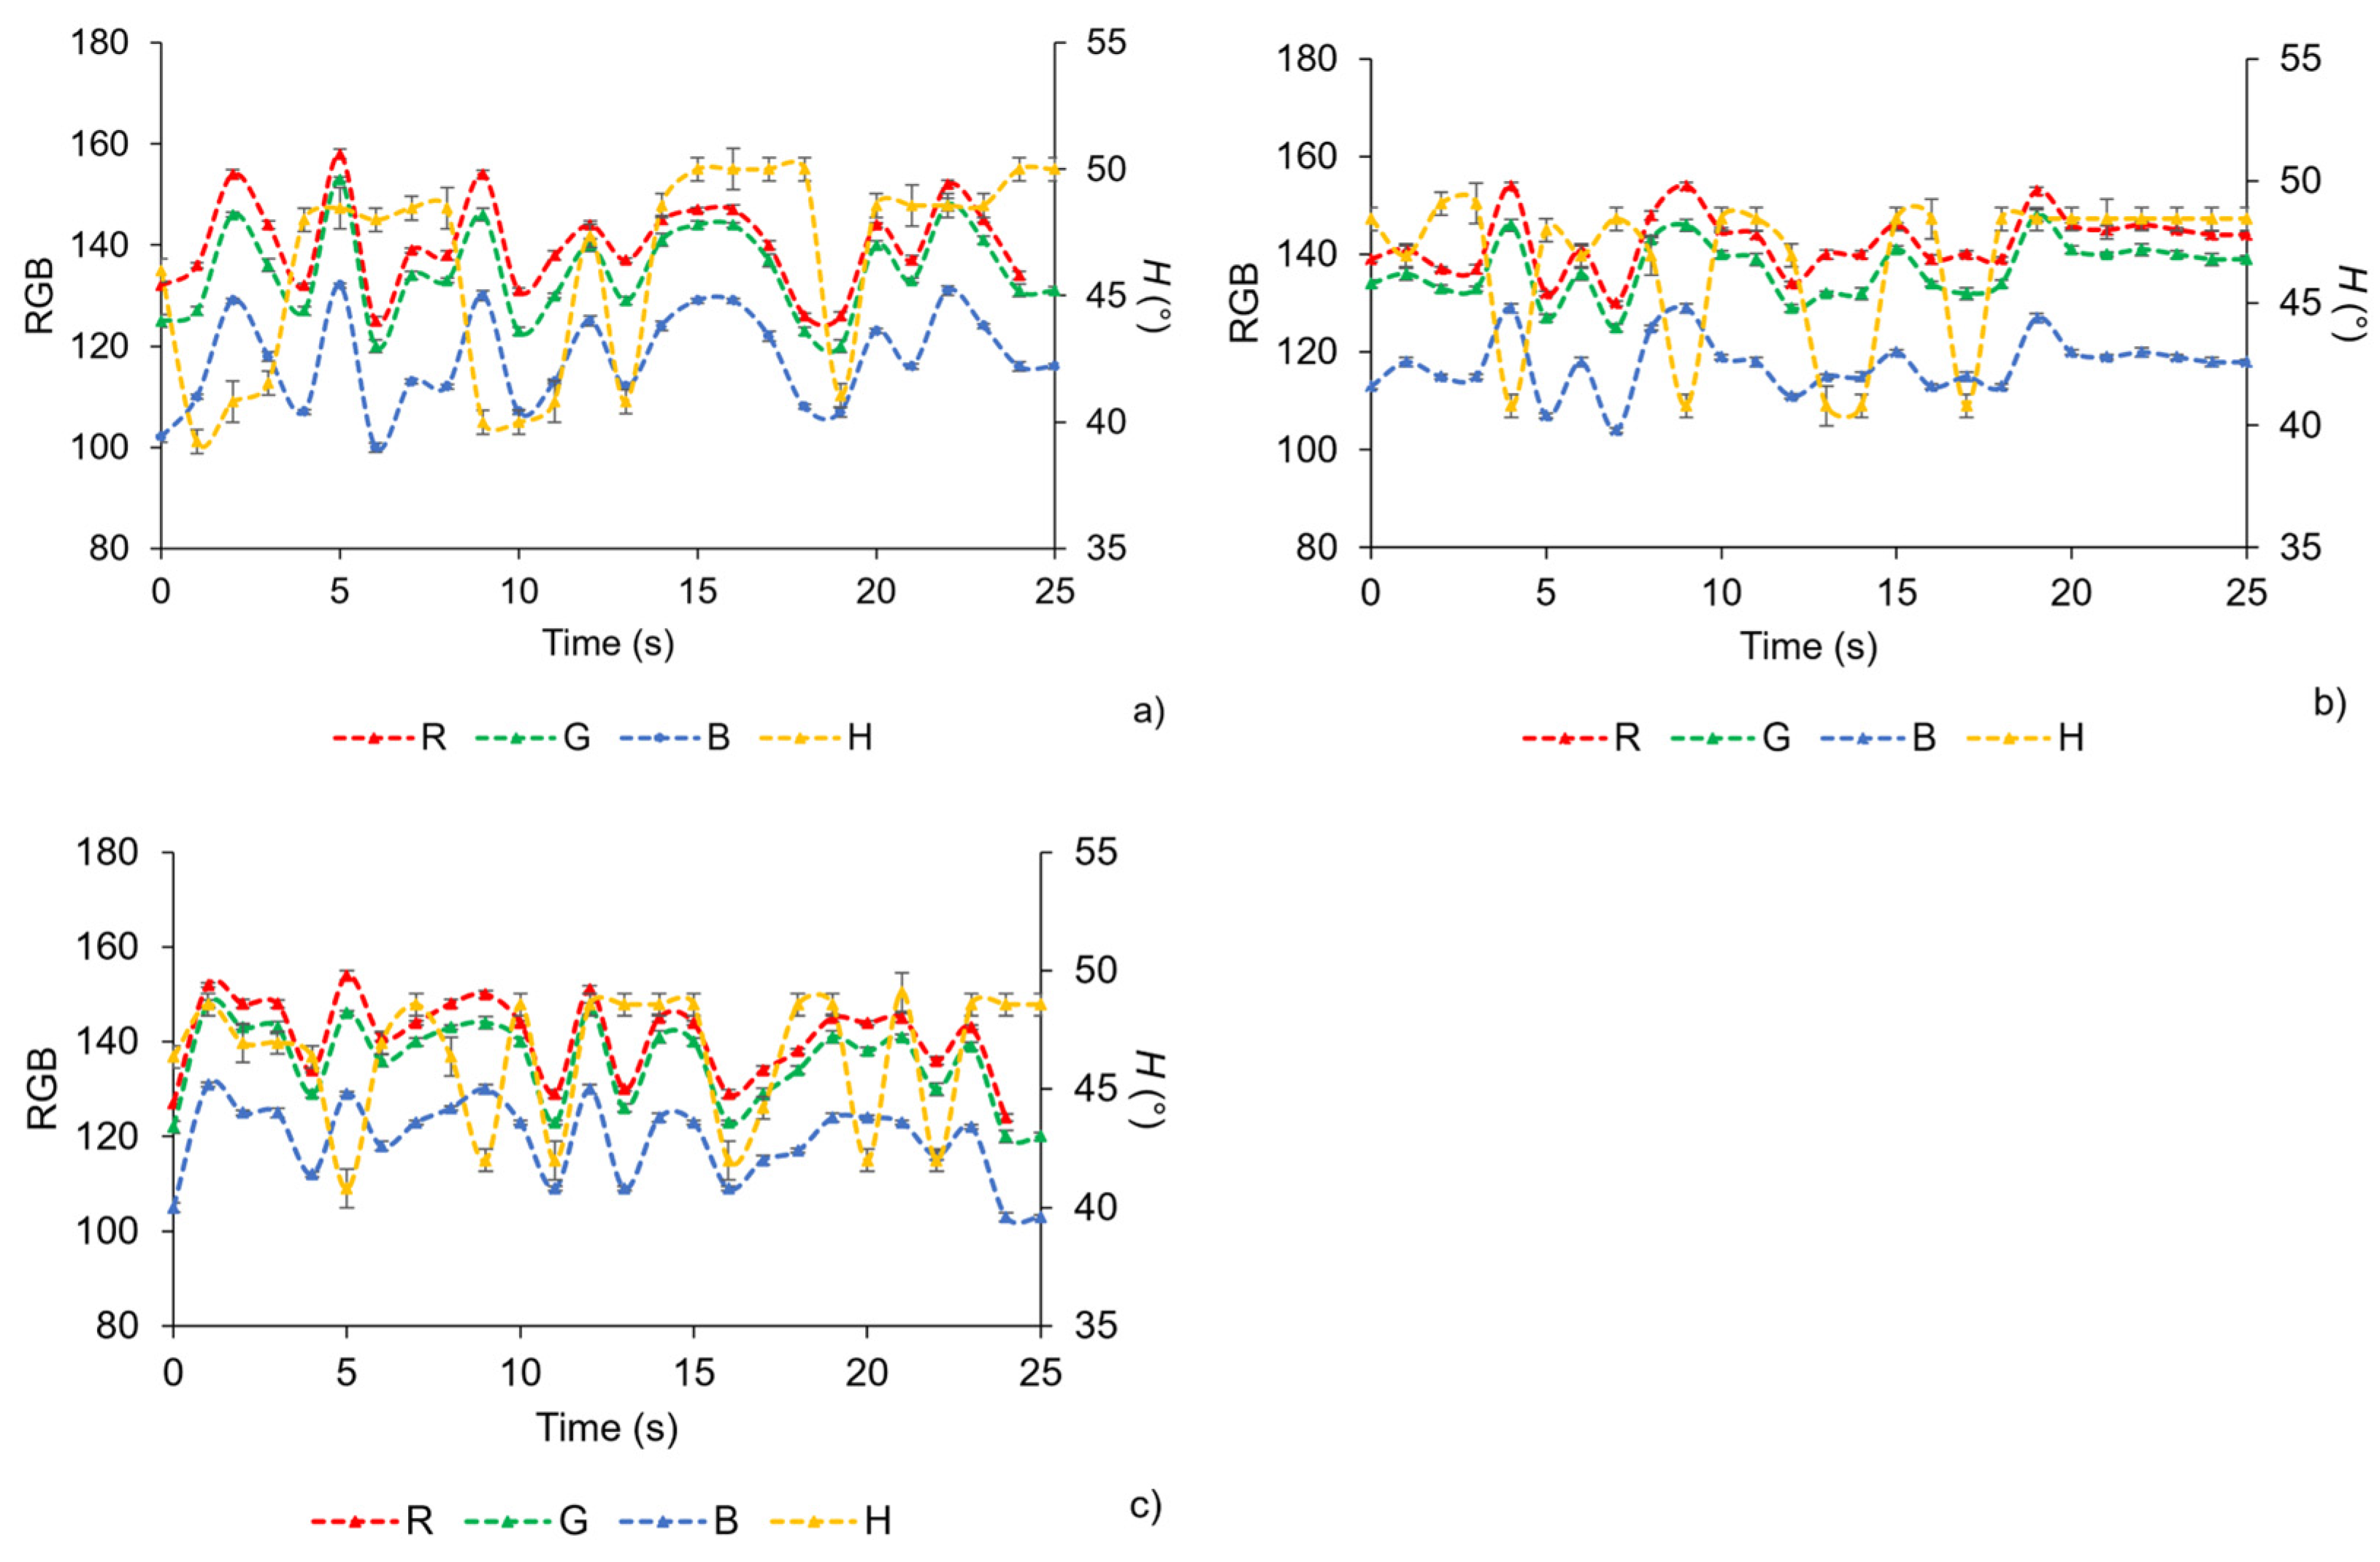
Figure 14 shows the optical sensor response at higher flow conditions, where slug flow was maintained for approximately 25 s before transitioning to parallel flow. During this period, stable hue plateaus were observed, with NaOH-rich slugs at 50° and oil-rich slugs at 41°, confirming that the hue parameter remains a robust indicator for differentiating phases even under increased flow rates. The shortened monitoring window reflects the onset of flow instability rather than sensor limitations. Across all flow rates tested, the hue signal reliably differentiated phases and provided indirect information on reaction progress at the oil–NaOH interfaces. The continuous alternation of phases also exposed the sensor to repeated chemical changes, demonstrating cyclic, reversible behavior and reinforcing its robustness for real-time monitoring. These results highlight the effectiveness of the sol–gel sensor while emphasizing that its practical utility is linked to the stability of the slug-flow regime.
Figure 14.
RGB and H values measured at outlet positions of the microreactor, flow rate: 5 mL min−1. (a) Hue as a function of time at point A; (b) hue as a function of time at point B; (c) hue as a function of time at point C.
Across the series of experiments presented in Figure 12, Figure 13 and Figure 14, the hue-based optical sensor consistently demonstrated robust, phase-dependent responses during slug-flow saponification, with NaOH-rich slugs maintaining H values around 50° and oil-rich slugs producing a sharp decrease to 41°. The method proved effective across a range of flow rates, from 1 mL min−1 up to higher values, with the primary limitation to monitoring duration arising from flow-regime stability rather than sensor performance. Importantly, during slug flow, the reaction primarily occurs at the interfaces between consecutive slugs, where the oil and NaOH phases are in direct contact. As a result, the H values not only reflect the spatial distribution of the phases but also provide indirect information on the reaction progress without disturbing the system. These observations highlight the reliability of hue as a noninvasive, real-time parameter for tracking multiphase reactions in slug-flow microreactors, while also illustrating that the effectiveness of this approach is inherently linked to the stability of the slug-flow regime (Table 3). Additionally, due to the continuous alternation of the two phases in slug flow, the sensor is inherently exposed to repeated chemical changes, effectively demonstrating cyclic and reversible behavior. This property further reinforces the robustness of the sensor for monitoring local chemical dynamics in real-time. Although the sensor responds near-instantaneously, the effective temporal resolution is 33 ms, limited by the frame capture rate of the imaging system (30 fps). It should be noted, however, that long-term stability of the sensor under continuous operation or over extended periods was not assessed in this study. While the presented experiments demonstrate consistent performance over the timescale tested, dedicated long-term testing would be required to fully establish the sensor’s stability under prolonged use.
Table 3.
Summary of sol–gel pH sensor performance: hue plateau (mean ± SD), response/recovery time, short-term stability, reversibility, and detection threshold.
A comparison with previously reported colorimetric microreactor studies further clarifies the scope and intent of the present approach. For example, Liu et al. [24] demonstrated a visually very clean and highly resolved colorimetric system for studying oxygen mass transfer using a resazurin–resorufin model reaction. Their methodology relies on a deliberately optimized dye system, carefully controlled concentrations, straightened glass capillaries, and high-speed microscopic imaging combined with extensive post-processing to extract spatially resolved concentration fields and mass transfer coefficients. While this approach provides detailed diagnostic insight, it requires modified reaction chemistry, specialized optical hardware, and non-trivial calibration procedures. In contrast, the present work targets a different application space. Rather than employing a model dye system, the sensor coatings are used to monitor a technically relevant saponification reaction involving oil and NaOH, with the sensor responding directly to the local chemical environment and phase distribution. The sensing principle relies on a solid, localized sol–gel coating embedded within the microreactor, leaving the bulk reaction chemistry unaltered. This approach is intentionally aligned with practical implementation, where monitoring can be achieved by simple imaging of the reactor channel and extraction of hue values to infer phase distribution, without the need for tracers, complex optics, or chemical modification of the process stream. Although the resulting images are visually less refined than those obtained using high-end microscopic systems, the extracted H value provides a compact, robust, and easily interpretable signal suited for industrial and Internet-of-Things-oriented monitoring. The H value consistently forms reproducible plateaus corresponding to NaOH-rich and oil-rich phases and clearly captures the passage of individual slugs, as well as changes in flow regime. Such a one-dimensional and reversible signal can be readily obtained from a single image or low-cost camera feed and is directly compatible with threshold-based analysis and automated decision-making, which is often more relevant for deployable process monitoring than spatially resolved concentration monitoring.
Compared to previous work [25], the present study demonstrated a significant advancement in both sensing capability and application scope. While the earlier system focused on pH monitoring using HCl and NaOH under comparatively simple and homogenous conditions, the current work extends the approach to a technically relevant biphasic oil–NaOH solution system. The introduction of oil as a reacting phase imposes additional optical and physicochemical challenges, including phase boundaries and transient interfacial effects, which are absent in single-phase acid-base systems. Despite this increased complexity, the sol–gel sensor coatings enable reliable identification of individual oil droplets as they pass through the microreactor. Importantly, the present results demonstrate that each droplet can be tracked reproducibly through reversible changes in the H value, highlighting improved temporal resolution compared to the earlier study. This ability to resolve individual slugs within the same reactor underscores both the reusability of the sensor coating and its suitability for dynamic multiphase reaction monitoring. Together, these findings show a clear evolution from static or quasi-steady pH sensing toward real-time tracking of discrete reaction events in microreactor environments.
Sol–gel-based sensors have previously been demonstrated for real-time monitoring in other chemical contexts, such as the fluorescent sol–gel sensor developed by Carballido et al. [26] to track carbonyl compounds during lipid oxidation. In that system, the silicate-based sensor coating was optimized for adsorption capacity and fluorescence response, and readout relied on classical fluorescence spectroscopy, typically in batch or simple flow cells. While this work illustrates the general concept of sol–gel sensors for real-time chemical monitoring, it differs significantly from the present study in terms of analyte, readout, and reactor integration. In the present work, the sensor coatings track phase identity, individual droplet passage, and flow-regime transitions within the microreactor. Unlike the fluorescence-based approach, monitoring is achieved via simple camera imaging and hue (H value) extraction, with explicit comparison of RGB versus HSV channels to identify robust signals. The optical signal forms two stable hue plateaus corresponding to oil-rich and NaOH-rich slugs, enabling real-time detection of both chemical and hydrodynamic changes, including the loss of slug flow at higher flow rates. Moreover, the sensor is embedded directly in the microreactor channel, operating under evolving multiphase hydrodynamics, whereas the system developed by Carballido et al. was tested in controlled cuvettes or simple flow configurations. This comparison underscores that, while sol–gel sensors are a proven tool for real-time monitoring, the novelty of the present work lies in its combination of solid-phase sensing, camera-based hue analysis, and application to a dynamic, multiphase reaction system, offering a low-cost, easily implementable alternative to fluorescence setups for inline process monitoring (Table 4).
Table 4.
Comparison of sensor approaches for microreactor monitoring, including method, detection type, cost, pH/analyte range, multiphase compatibility, complexity, and key advantages/limitations.
4. Conclusions
Functional sol–gel-based optical sensor coatings incorporating pH-sensitive indicators were successfully developed and applied for real-time monitoring of multiphase saponification reactions in microreactors. Among the formulations tested, the BCG and BCP 1:3 mixture provided the most pronounced and reliable colorimetric response at high pH, allowing for clear detection of NaOH- and oil-rich slugs. Hue (H) analysis proved to be a robust, reproducible, and reversible parameter, with near-instantaneous response (temporal resolution ≤ 33 ms), outperforming RGB measurements in resolving individual droplets and detecting flow-regime transitions across a range of flow rates. Integration of the coatings directly into microreactor channels enabled noninvasive, real-time monitoring without altering the bulk reaction chemistry, highlighting their practical applicability. Compared to previous approaches, this system achieves droplet-level tracking using simple visible-light imaging and low-cost data extraction, is visible to the naked eye, and offers a compact and scalable solution for process monitoring. It should be noted that the long-term stability of the sensor under continuous operation or extended use was not evaluated in this study. Future work will be required to fully assess sensor durability over prolonged periods. Overall, these findings demonstrate that sol–gel sensor coatings coupled with hue-based analysis are a versatile and effective tool for inline monitoring of multiphase reactions, with potential for deployment in automated, IoT-enabled microreactor systems.
Author Contributions
E.F.: Conceptualization, Data curation, Formal analysis, Investigation, Methodology, Validation, Visualization, Writing—original draft, Writing—review and editing. M.-P.M.: Formal analysis, Methodology, Supervision, Validation, Visualization, Writing—review and editing. D.V.: Conceptualization, Formal analysis, Funding acquisition, Methodology, Supervision, Validation, Visualization, Writing—review and editing. All authors have read and agreed to the published version of the manuscript.
Funding
This work was supported by the Croatian Science Foundation under the project numbers HRZZ-DOK-NPOO-2023-10-1144, HRZZ-DOK-2021-02-5999, and HRZZ-IP-2022-10-8004.
Institutional Review Board Statement
Not applicable.
Informed Consent Statement
Not applicable.
Data Availability Statement
The raw data supporting the conclusions of this article will be made available by the authors on request.
Conflicts of Interest
The authors declare no conflicts of interest.
References
- Zong, J.; Yue, J. Continuous Solid Particle Flow in Microreactors for Efficient Chemical Conversion. Ind. Eng. Chem. Res. 2022, 61, 6269–6291. [Google Scholar] [CrossRef] [Scilit]
- Forjan, E.; Marković, M.-P.; Kassal, P.; Vrsaljko, D. Development and Characterization of Litmus-Based pH sensor Coatings for Real-Time Monitoring in 3D Printed Microreactor Channels. J. Sol-Gel Sci. Technol. 2025, 115, 1–16. [Google Scholar] [CrossRef] [Scilit]
- Borovinskaya, E.; Khaydarov, V.; Strehle, N.; Musaev, A.; Reschetilowski, W. Experimental Studies of Ethyl Acetate Saponification Using Different Reactor Systems: The Effect of Volume Flow Rate on Reactor Performance and Pressure Drop. Appl. Sci. 2019, 9, 532. [Google Scholar] [CrossRef] [Scilit]
- Wang, S.; Ma, S.; Zhang, J.; She, M.; Liu, P.; Zhang, S.; Li, J. A Highly Sensitive and Selective Near-Infrared Fluorescent Probe for Imaging Hydrazine in Living Tissues and Mice. Sens. Actuators B Chem. 2018, 261, 418–424. [Google Scholar] [CrossRef] [Scilit]
- Wencel, D.; Kaworek, A.; Abel, T.; Efremov, V.; Bradford, A.; Carthy, D.; Coady, G.; McMorrow, R.C.N.; McDonagh, C. Optical Sensor for Real-Time pH Monitoring in Human Tissue. Small 2018, 14, e1803627. [Google Scholar] [CrossRef] [Scilit]
- Gruber, P.; Marques, M.P.C.; Sulzer, P.; Wohlgemuth, R.; Mayr, T.; Baganz, F.; Szita, N. Real-Time pH Monitoring of Industrially Relevant Enzymatic Reactions in a Microfluidic Side-Entry Reactor (μSER) Shows Potential for pH Control. Biotechnol. J. 2017, 12, 1600475. [Google Scholar] [CrossRef] [Scilit]
- Cingesar, I.K.; Marković, M.-P.; Vrsaljko, D. Integrating 3D Printed Microreactors and Microseparators for Efficient Biodiesel Production. Chem. Eng. Process. Process Intensif. 2025, 209, 110165. [Google Scholar] [CrossRef] [Scilit]
- Meng, Y.; Sun, D.; Widdicombe, B.; Jacob, D.T.; Yang, Y.; Gao, X.; Stewart, A.G.; Unnithan, R.R. Miniaturized multispectral imaging for microfluidic pH sensing. Sens. Bio-Sens. Res. 2025, 47, 100764. [Google Scholar] [CrossRef] [Scilit]
- Park, H.; Koh, Y.G.; Lee, W. Smartphone-based colorimetric analysis of structural colors from pH-responsive photonic gel. Sens. Actuators B Chem. 2021, 345, 130359. [Google Scholar] [CrossRef] [Scilit]
- Loima, T.; Yoon, J.-Y.; Kaarj, K. Microfluidic sensors integrated with smartphones for applications in forensics, agriculture, and environmental monitoring. Micromachines 2025, 16, 835. [Google Scholar] [CrossRef] [Scilit]
- Marković, M.-P.; Kassal, P.; Vrsaljko, D. Design and Fabrication of a pH Sensor-Coated Microreactor System. IEEE Sens. J. 2024, 24, 32090–32097. [Google Scholar] [CrossRef] [Scilit]
- Gotor, R.; Ashokkumar, P.; Hecht, M.; Keil, K.; Rurac, K. Optical pH Sensor Covering the Range from pH 0–14 Compatible with Mobile-Device Readout and Based on a Set of Rationally Designed Indicator Dyes. Anal. Chem. 2017, 89, 16. [Google Scholar] [CrossRef] [Scilit]
- Ntamo, D.; Lopez-Montero, E.; Mack, J.; Omar, C.; Highett, M.I.; Moss, D.; Mitchell, N.; Soulatintork, P.; Moghadam, P.Z.; Zandi, M. Industry 4.0 in Action: Digitalisation of a Continuous Process Manufacturing for Formulated Products. Digit. Chem. Eng. 2022, 3, 100025. [Google Scholar] [CrossRef] [Scilit]
- Figueira, R.B.; de Almeida, J.M.; Ferreira, B.; Coelho, L.; Silva, C.J.R. Optical Fiber Sensors Based on Sol–Gel Materials: Design, Fabrication and Application in Concrete Structures. Mater. Adv. 2021, 2, 7237–7276. [Google Scholar] [CrossRef] [Scilit]
- El-Ashgar, N.M.; El-Basioni, A.I.; El-Nahhal, I.M.; Zourob, S.M.; El-Agez, T.M.; Taya, S.A. Sol-Gel Thin Coatings Immobilized with Bromocresol Purple pH-Sensitive Indicator in Presence of Surfactants. Int. Sch. Res. Not. 2012, 2012, 604389. [Google Scholar] [CrossRef] [Scilit]
- Chen, W.-L.; Ho, T.Y.; Huang, J.-W.; Chen, C.-H. Continuous Monitoring of pH Level in Flow Aqueous System by Using Liquid Crystal-Based Sensor Device. Microchem. J. 2018, 139, 339–346. [Google Scholar] [CrossRef] [Scilit]
- Zhang, J.; Zhou, L. Preparation and Optimization of Optical pH Sensor Based on Sol–Gel. Sensors 2018, 18, 3195. [Google Scholar] [CrossRef] [Scilit]
- Funnekotter, B.; Mancera, R.L.; Bunn, E. A Simple but Effective Combination of pH Indicators for Plant Tissue Culture. Plants 2023, 12, 740. [Google Scholar] [CrossRef] [Scilit]
- Kuswandi, B.; Nurfawaidi, A. On-Package Dual Sensors Label Based on pH Indicators for Real-Time Monitoring of Beef Freshness. Food Control 2017, 82, 91–100. [Google Scholar] [CrossRef] [Scilit]
- Hosseini, M.; Heydari, R.; Alimoradi, M. A Novel pH Optical Sensor Using Methyl Orange Based on Triacetylcellulose Membranes as Support. Spectrochim. Acta A Mol. Biomol. Spectrosc. 2014, 128, 864–867. [Google Scholar] [CrossRef] [Scilit]
- Jia, H.; Wu, C.; Huang, M.; Zhu, Q.; Zhang, M. TTI and pH-Responsive Dual Colorimetric Sensor Arrays Combined with a Cascaded Deep Learning Approach for Dynamic Monitoring of Freshness of Fresh-Cut Fruits. Food Chem. 2025, 492, 145495. [Google Scholar] [CrossRef] [Scilit]
- Cichero, M.C.; dos Santos, J.H.Z. Encapsulated Bromocresol Purple-Based Sensitive Materials: The Role of the Nature and Distribution of Matrix Layers on Ammonia Sensing Performance. Appl. Surf. Sci. Adv. 2021, 4, 100078. [Google Scholar] [CrossRef] [Scilit]
- Inserra, B.; Hayashi, K.; Marchisio, A.; Tulliani, J.-M. Sol–gel-Entrapped pH Indicator for Monitoring pH Variations in Cementitious Materials. J. Appl. Biomater. Funct. Mater. 2020, 18, 1–12. [Google Scholar] [CrossRef] [Scilit]
- Liu, Y.; Yao, C.; Yang, L.; Yang, M.; Chen, G. A colorimetric technique to characterize mass transfer during liquid-liquid slug flow in circular capillaries. MethodsX 2021, 8, 101346. [Google Scholar] [CrossRef] [Scilit] [PubMed]
- Marković, M.-P.; Forjan, E.; Kassal, P.; Nosić, A.; Vrsaljko, D. Evaluation of the Performance of Static Mixers in 3D Printed Millireactors Using Integrated pH-Sensitive Coatings. Appl. Sci. 2025, 15, 2488. [Google Scholar] [CrossRef] [Scilit]
- Carballido, L.; Bou-Maroun, E.; Weber, G.; Bezverkhyy, I.; Karbowiak, T. A new sol-gel fluorescent sensor to track carbonyl compounds. Talanta 2024, 279, 126569. [Google Scholar] [CrossRef] [Scilit] [PubMed]

Disclaimer/Publisher’s Note: The statements, opinions and data contained in all publications are solely those of the individual author(s) and contributor(s) and not of MDPI and/or the editor(s). MDPI and/or the editor(s) disclaim responsibility for any injury to people or property resulting from any ideas, methods, instructions or products referred to in the content. |
© 2026 by the authors. Licensee MDPI, Basel, Switzerland. This article is an open access article distributed under the terms and conditions of the Creative Commons Attribution (CC BY) license.