Article

Experimental and Numerical Study on Discharge Mechanisms of Section Insulators at High Altitude with Structural and Surface Coating Optimization


1
School of Electrical Engineering, Beijing Jiaotong University, Haidian District, Beijing 100044, China
2
China Academy of Railway Science Group Co., Ltd., Haidian District, Beijing 100044, China
*
Author to whom correspondence should be addressed.
Coatings 2026, 16(3), 390; https://doi.org/10.3390/coatings16030390
Submission received: 28 February 2026 / Revised: 19 March 2026 / Accepted: 20 March 2026 / Published: 22 March 2026

Abstract

With the rapid development of electrified railways in high-altitude regions, section insulators in catenary systems frequently experience gap breakdown and surface flashover under low atmospheric pressure conditions, posing serious threats to safe train operation. This paper investigates the discharge mechanisms of section insulators in high-altitude environments and conducts research on discharge characteristics under extremely non-uniform electric fields, along with structural optimization. First, the physical mechanisms of gap discharge and surface flashover in section insulators are analyzed. A three-dimensional electric field simulation model of the section insulator is established, and numerical analysis is performed to reveal the electric field distribution characteristics. The results indicate that the electric field is predominantly concentrated at the junction between metal electrodes and insulators, as well as at the tip of the arcing horn. The local maximum field strength reaches 3.84 × 10⁵ V/m, exceeding the corona inception field strength of air, which readily induces discharge. Subsequently, power frequency and lightning impulse discharge tests are conducted in both plain region and regions at an altitude of 4300 m. The results show that under high-altitude conditions, the power frequency breakdown voltage decreases by 28%, and the 50% lightning impulse breakdown voltage decreases by 42%. The discharge voltages under standard atmospheric conditions are obtained through correction. Finally, optimization schemes involving arcing horn structural modification and surface coating application are proposed. Adjusting the arcing horn angle to 55° and adding a grading ring structure with a radius of 70 mm reduces the local maximum field strength by 26%. After applying an RTV insulating coating, the field strength at the junction decreases by 35.9%, effectively enhancing the insulation performance of section insulators in high-altitude regions.

1. Introduction

The construction of high-altitude electrified railways has entered a period of rapid development. As the sole power source for electric locomotives, the safe operation of the catenary system is directly related to train safety [1]. The section insulator, a key component of the catenary system, plays an important role in electrical isolation and mechanical connection. It enables segmented maintenance during catenary inspection, thereby reducing the scope of power outages [2]. The section insulator exhibits an extremely non-uniform electric field structure. Under high-altitude conditions, the insulation strength of air decreases, making discharge phenomena highly susceptible to occurrence, including arcing during pantograph passage, gap breakdown between electrodes, and surface flashover along the insulator [3]. Electric arc flashover on section insulators poses severe threats to the safe operation of electrified railway systems. When an arc discharge occurs across the section insulator, the resulting high-temperature arc plasma can cause localized ablation and erosion of the silicone rubber insulating sheath, carbonization of the fiberglass core rod, and pitting or melting of the metal electrode and arcing horn surfaces. Repeated arc damage progressively degrades the insulation performance, eventually requiring replacement of the entire section insulator assembly [4,5]. Furthermore, arc flashover between adjacent power supply sections can result in phase-to-phase short circuits or short-circuit faults between different supply zones, triggering protective relay tripping and causing unplanned traction power interruptions [6]. Therefore, suppressing arc flashover on section insulators is of critical importance for ensuring both the electrical reliability and the operational safety of high-altitude electrified railways. Currently, most research on catenary systems focuses on pantograph–catenary arcs and discharge incidents occurring when pantographs pass through anchor sections, with very limited studies addressing the discharge mechanisms of section insulators themselves and corresponding suppression methods. Moreover, relevant standards remain incomplete [7,8,9]. Only by elucidating the discharge mechanisms and discharge development characteristics under high-altitude environments can targeted optimization strategies be devised to ensure stable train operation in high-altitude regions.
The air gap between the arcing horns of the section insulator constitutes a discharge path, and its discharge process essentially belongs to gap discharge under extremely non-uniform electric fields [10]. To date, numerous scholars have conducted extensive research on gap discharge. Through numerical analysis and experimental studies, it has been demonstrated that in short-gap non-uniform electric field air discharge, streamer discharge dominates the process, and its development velocity and channel characteristics are highly consistent with experimental observations [11,12,13]. Regarding gap discharge measurement methods, Yang et al. investigated the influence of wavefront time on the breakdown voltage of long air gaps at high altitudes [14]. To address the measurement uncertainty of the fifty percent discharge voltage (U50), Jiang employed the “up-and-down method” to improve test accuracy, effectively enhancing the precision of gap discharge voltage measurements, and studied the breakdown characteristics of air gaps under different front times at high-altitude conditions [15,16]. Studies on rod–rod gaps indicated that under different impulse voltage waveforms, the discharge voltage variation patterns of gaps with lengths of 2–6 m were essentially consistent, with lightning impulse discharge voltage variations ranging from 1.4% to 3.0% [17]. High-altitude low-air-pressure environments significantly affect gap discharge characteristics [18,19]. Ding et al. found that the traditional g parameter has limitations in correcting high-altitude gap discharge [20], whereas the altitude correction method specified in the IEC 60060-1:2010 standard can comprehensively account for factors such as temperature and humidity, providing more accurate correction results [21]. Liao et al. studied the lightning impulse discharge characteristics of tunnel–catenary air gaps in high-altitude regions and found that as air pressure decreases, the 50% lightning impulse breakdown voltage decreases, exhibiting a power function relationship with relative air pressure [22]. The main insulation structure of section insulators consists of composite insulators, which present surface flashover risks under contaminated and humid conditions [23]. Research on insulators in low-air-pressure environments revealed that, compared with plain regions, the arc does not develop entirely along the insulator surface under low-air-pressure conditions but instead exhibits arc drifting phenomena [24]. Related studies also demonstrated that the flashover voltage of contaminated insulators decreases nonlinearly with decreasing air pressure [25,26], and that low air pressure reduces arc propagation speed while increasing arc temperature, thereby reducing flashover voltage [27]. Kawamura et al. conducted DC tests on contaminated insulators, investigating the influence of pressure on the DC breakdown voltage of contaminated porcelain insulators and glass models within a pressure range of 13–100 kPa [28]. Regarding insulation structure optimization, increasing the electrode curvature radius can reduce the maximum surface field strength and voltage distribution non-uniformity [29]. Grading rings, as a common electric field equalization measure, can effectively reduce field concentration at the junction between fittings and insulating sheaths [30,31]. Furthermore, suppressing electric field concentration and leakage current through coatings can improve flashover voltage and enhance the service life and effectiveness of insulators [32].
Existing research has achieved substantial results in the areas of air gap discharge and contamination flashover characteristics of insulators. However, studies on the discharge mechanisms of section insulators, which possess a unique composite structure, remain relatively scarce. In particular, systematic research on the discharge characteristics of section insulators under high-altitude conditions and the corresponding altitude correction methods is lacking. Unlike previous studies that focus on simple electrode configurations or conventional insulators, this work targets the section insulator with its unique composite structure comprising metal electrodes, silicone rubber insulators, and arcing horns. A three-dimensional electric field simulation model is established to reveal the electric field distribution characteristics and identify the critical field concentration locations specific to this complex geometry. Comparative power frequency and lightning impulse discharge tests are conducted on the same section insulator in both a plain region and at an altitude of 4300 m, providing first-hand experimental data on the altitude-dependent discharge behavior of section insulators. The altitude correction parameters are obtained following the CIGRE standard, filling the gap in altitude correction data specific to section insulator structures. Based on the combined simulation and experimental findings, a multi-measure optimization scheme is proposed, integrating arcing horn angle adjustment, grading ring installation, and RTV silicone rubber insulating coating application, providing a practical design reference for section insulators operating in high-altitude regions.

2. Structure and Discharge Characteristics of Section Insulators

2.1. Structure of Section Insulators

The main structure of a section insulator includes metal electrodes, silicone rubber insulators, insulating runners, metal runners, and arcing horns. Its advantage lies in that the pantograph does not directly contact the silicone rubber insulator but passes smoothly through the insulating runner, thereby reducing mechanical wear on the main insulation. To ensure electrical isolation between the two feeding arms, an air gap exists between the arcing horns of the section insulator, with the gap distance typically around 300 mm. The structure of the section insulator is shown in Figure 1.
Due to the composite structure of the section insulator, its discharge forms mainly include two types: breakdown discharge of the air gap between the arcing horns, and surface flashover along the silicone rubber insulator. In actual operation, these two discharge forms are often interrelated and act in concert. The tip of the arcing horn is an irregular metal structure with concentrated local field strength, making the gap between the arcing horns susceptible to breakdown. The contact between the metal electrode and the silicone rubber insulator is not perfectly tight, and small air gaps exist at the interface. Therefore, the initial arc of surface discharge is often induced by air gap discharge.

2.2. Gap Discharge Process

In gas discharge theory, Townsend discharge theory postulates that the primary cause of gas ionization is electron-impact ionization in the gas space, while the main factor sustaining gas discharge is the secondary electron emission caused by positive ions bombarding the cathode surface. However, Townsend theory does not account for the distortion effect of space charges on the electric field and is only applicable to situations involving uniform electric fields, low pressure, and short gaps. For the extremely non-uniform electric field structure of section insulators, the streamer discharge theory should be adopted for analysis under atmospheric pressure conditions.
According to streamer theory, gas discharge is sustained primarily by electron-impact ionization and spatial photoionization. At the arcing horn tip, where the electrode curvature is large, the local field strength reaches the critical inception value. Initial electrons accelerate under the strong electric field, and when the field strength at the avalanche head is sufficiently high to induce photoionization, secondary electron avalanches form streamer channels. The inception of initial corona at the arcing horn electrode tip requires that the number of positive space ions generated by the initial electron avalanche is sufficient to support the development of secondary electron avalanches. Therefore, the number of positive ions N generated by the initial electron avalanche satisfies the following equation:
ln N = R 0 R [ α ( E ) η ( E ) ] d l ) ln N c
where E is the electric field strength, α and η are the collision ionization coefficient and attachment coefficient, R is the curvature radius of the electrode, R0 is the boundary of the collision ionization region where α(Ex) equals η(Ex). The electric field strength Ex is the critical electric field at which the collision ionization coefficient exceeds the attachment coefficient, and can be taken as Ex = 28.5 kV/cm. R is the radius of curvature of the electrode, l is the distance from the electron avalanche head to the electrode surface, and Nx is the critical number of positive ions, which can be taken as 0.55 × 10⁸.

2.3. Surface Flashover Process

The main insulation structure of the section insulator is the silicone rubber insulator. During long-term operation, contaminants such as dust carried by high-speed trains adhere to the insulator surface. When the insulator surface accumulates contamination and becomes damp in humid environments such as fog or rain, the soluble salts in the contamination layer dissolve to form an electrolyte solution, resulting in a significant increase in surface conductivity and an increase in surface leakage current. As the leakage current flows through the contamination layer, Joule heating is generated, causing moisture in localized areas to evaporate and form dry bands. The dry bands exhibit higher resistance and bear higher voltage, leading to the generation of local arcs. The heat generated by local arcs causes further expansion of the dry bands. When the voltage across the dry band exceeds the critical value for air breakdown, the arc bridges the entire dry band. Multiple dry bands are successively broken down, ultimately resulting in complete flashover. The voltage equation of the classical contamination flashover model is expressed as follows:
U = A X I n + I R s
In the equation, U is the voltage applied to the section insulator, X is the arc length, Rs is the resistance of the remaining contamination layer, I is the current flowing through the surface, and A and n are the static arc characteristic constants. The contamination flashover mechanism is presented here for completeness; the experimental investigation in this paper focuses on clean insulator conditions.

3. Electric Field Distribution of Section Insulators

3.1. Simulation of Electric Field Distribution Characteristics

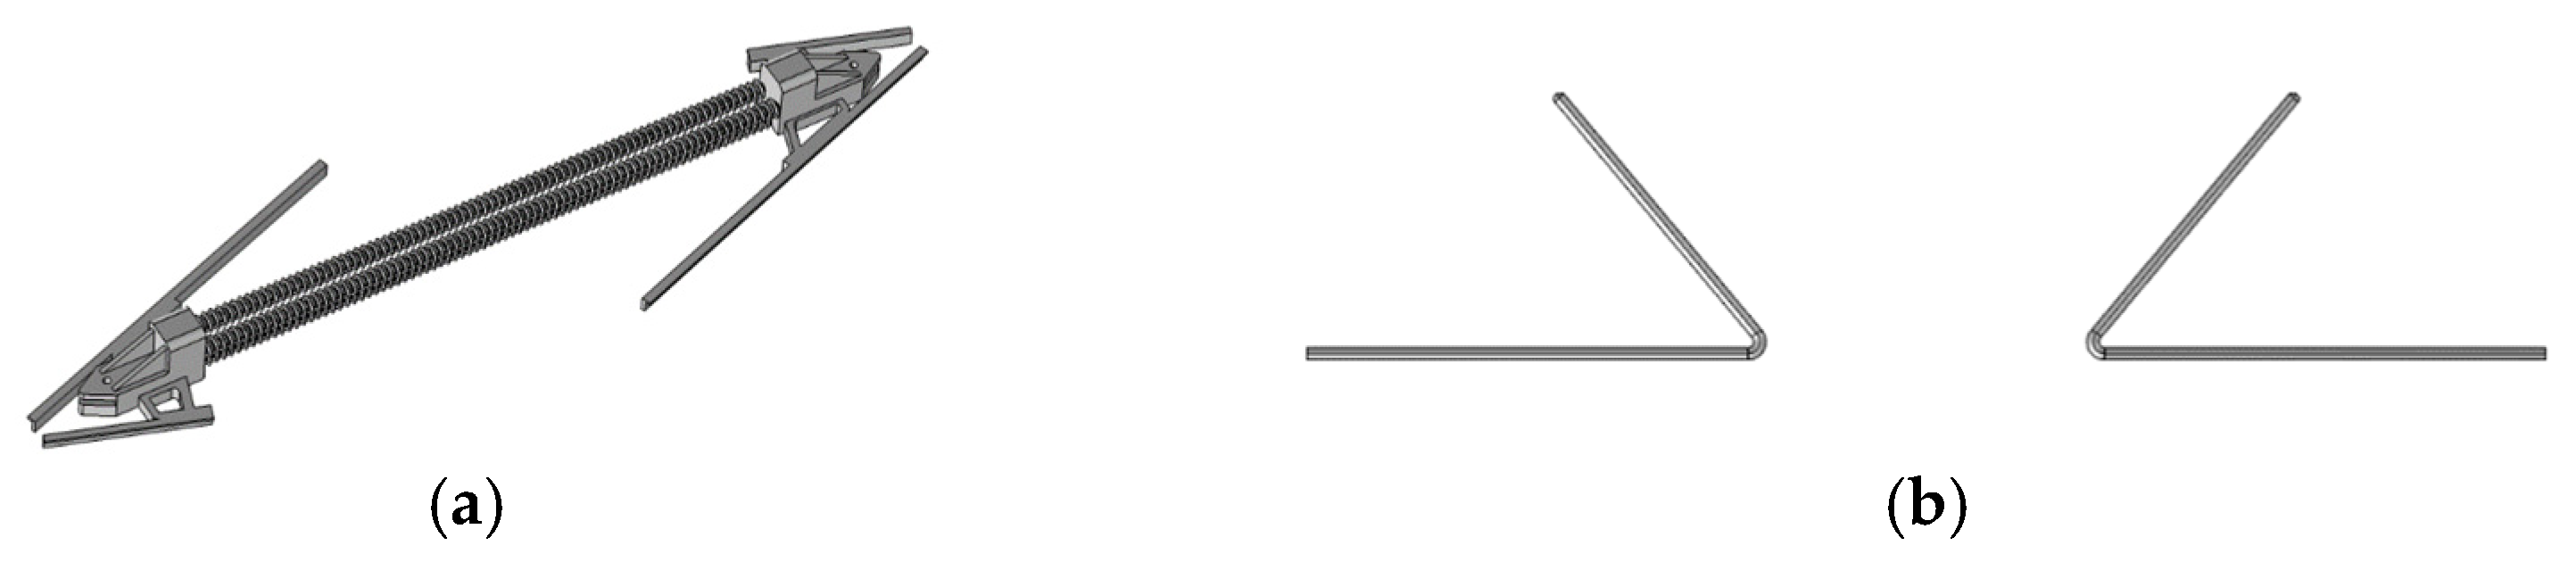
Taking the main insulation part of the section insulator and the metal conducting runner as the research objects, a three-dimensional model of the section insulator and the metal runner with arcing horns was established using Solidworks software, as shown in Figure 2.
The three-dimensional model was imported into COMSOL Multiphysics 6.4 for finite element analysis and meshed accordingly. Since the root-mean-square value of the operating voltage of the catenary system is single-phase 27.5 kV, the most severe electric field conditions during normal operation of the section insulator were considered. Therefore, the high-voltage side of the section insulator was set to 38.9 kV in the simulation.
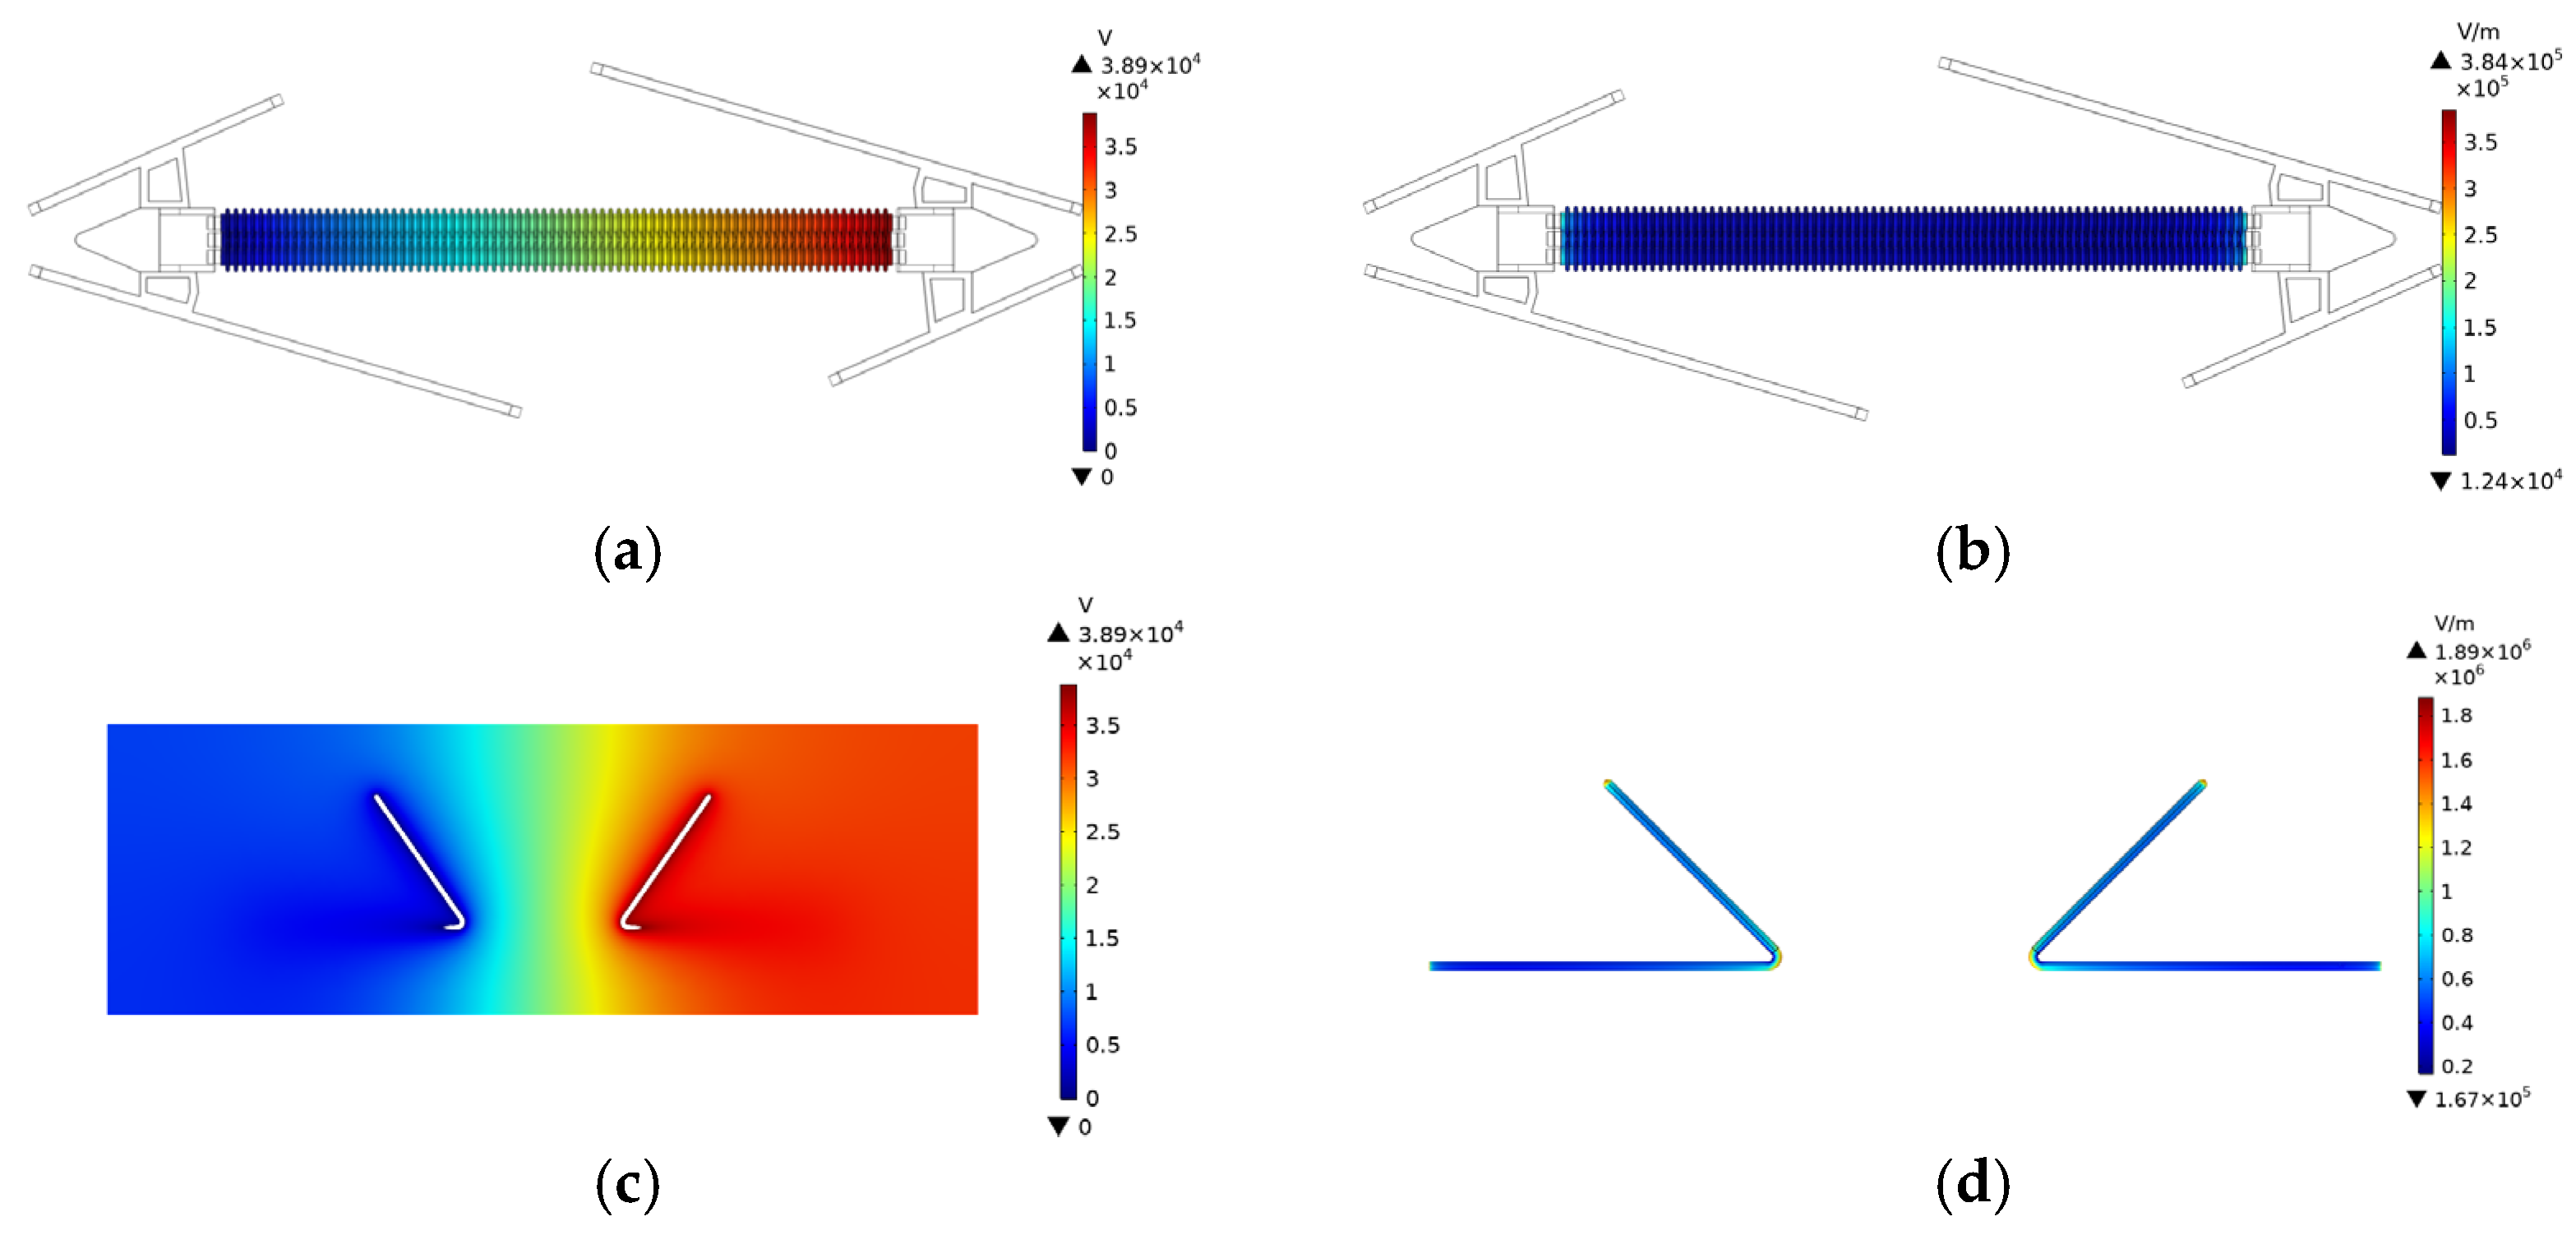
In the COMSOL simulation, the electrostatic physics interface was adopted. The high-voltage electrode of the section insulator was set to a fixed potential of 38.9 kV. The low-voltage side electrode was set to ground potential (0 V). The outer boundary of the surrounding air domain was set as a zero-charge boundary condition with a sufficiently large air domain radius of 3 m to minimize boundary effects on the near-field solution. The relative permittivity of silicone rubber was set to 3.4, the relative permittivity of the fiberglass core rod was set to 4.0, the relative permittivity of air was set to 1.0, and the relative permittivity of all metal components were set to 1 × 10¹⁰. The mesh was refined at the electrode–insulator junction and at the arcing horn tips, with a minimum element size of 0.5 mm in these critical regions, while a coarser mesh with a maximum element size of 50 mm was used in the far-field air domain. The potential distribution and electric field distribution of the section insulator body and arcing horns obtained from the simulation are shown in Figure 3.
From the simulation results, it can be observed that the electric field of the section insulator is mainly concentrated at the junction between the metal electrode and the main insulator, as well as at the arcing horn of the metal runner. The electric field concentration is the primary factor inducing discharge in the section insulator. At the junction between the metal electrode and the main insulator, the interface between materials with different dielectric constants—such as the metal electrode, the sheds, and the core rod of the insulator—leads to electric field concentration. As shown in Figure 3, the maximum field strength is 3.84 × 10⁵ V/m, which exceeds the corona inception field strength of air at 3.4 × 10⁵ V/m. This makes the junction prone to local corona or even arc generation. Meanwhile, if the surface of the section insulator is contaminated, the arc can easily develop along the insulator surface to form contamination flashover discharge, affecting the safe and stable operation of the section insulator. The prediction that corona should initiate at the electrode–insulator junction under rated voltage is consistent with the experimental observation in Section 4.1, where corona discharge was first observed at the arcing horn and electrode–insulator junction during power frequency tests. Regarding model sensitivity, parametric simulations varying the silicone rubber permittivity between 3.0 and 4.0 produced less than 5% change in peak field strength, indicating that geometric configuration dominates the field concentration. Variations in the arcing horn tip radius (±1 mm) produced 8%–12% changes in local peak field strength, confirming the importance of manufacturing tolerances at this critical location.
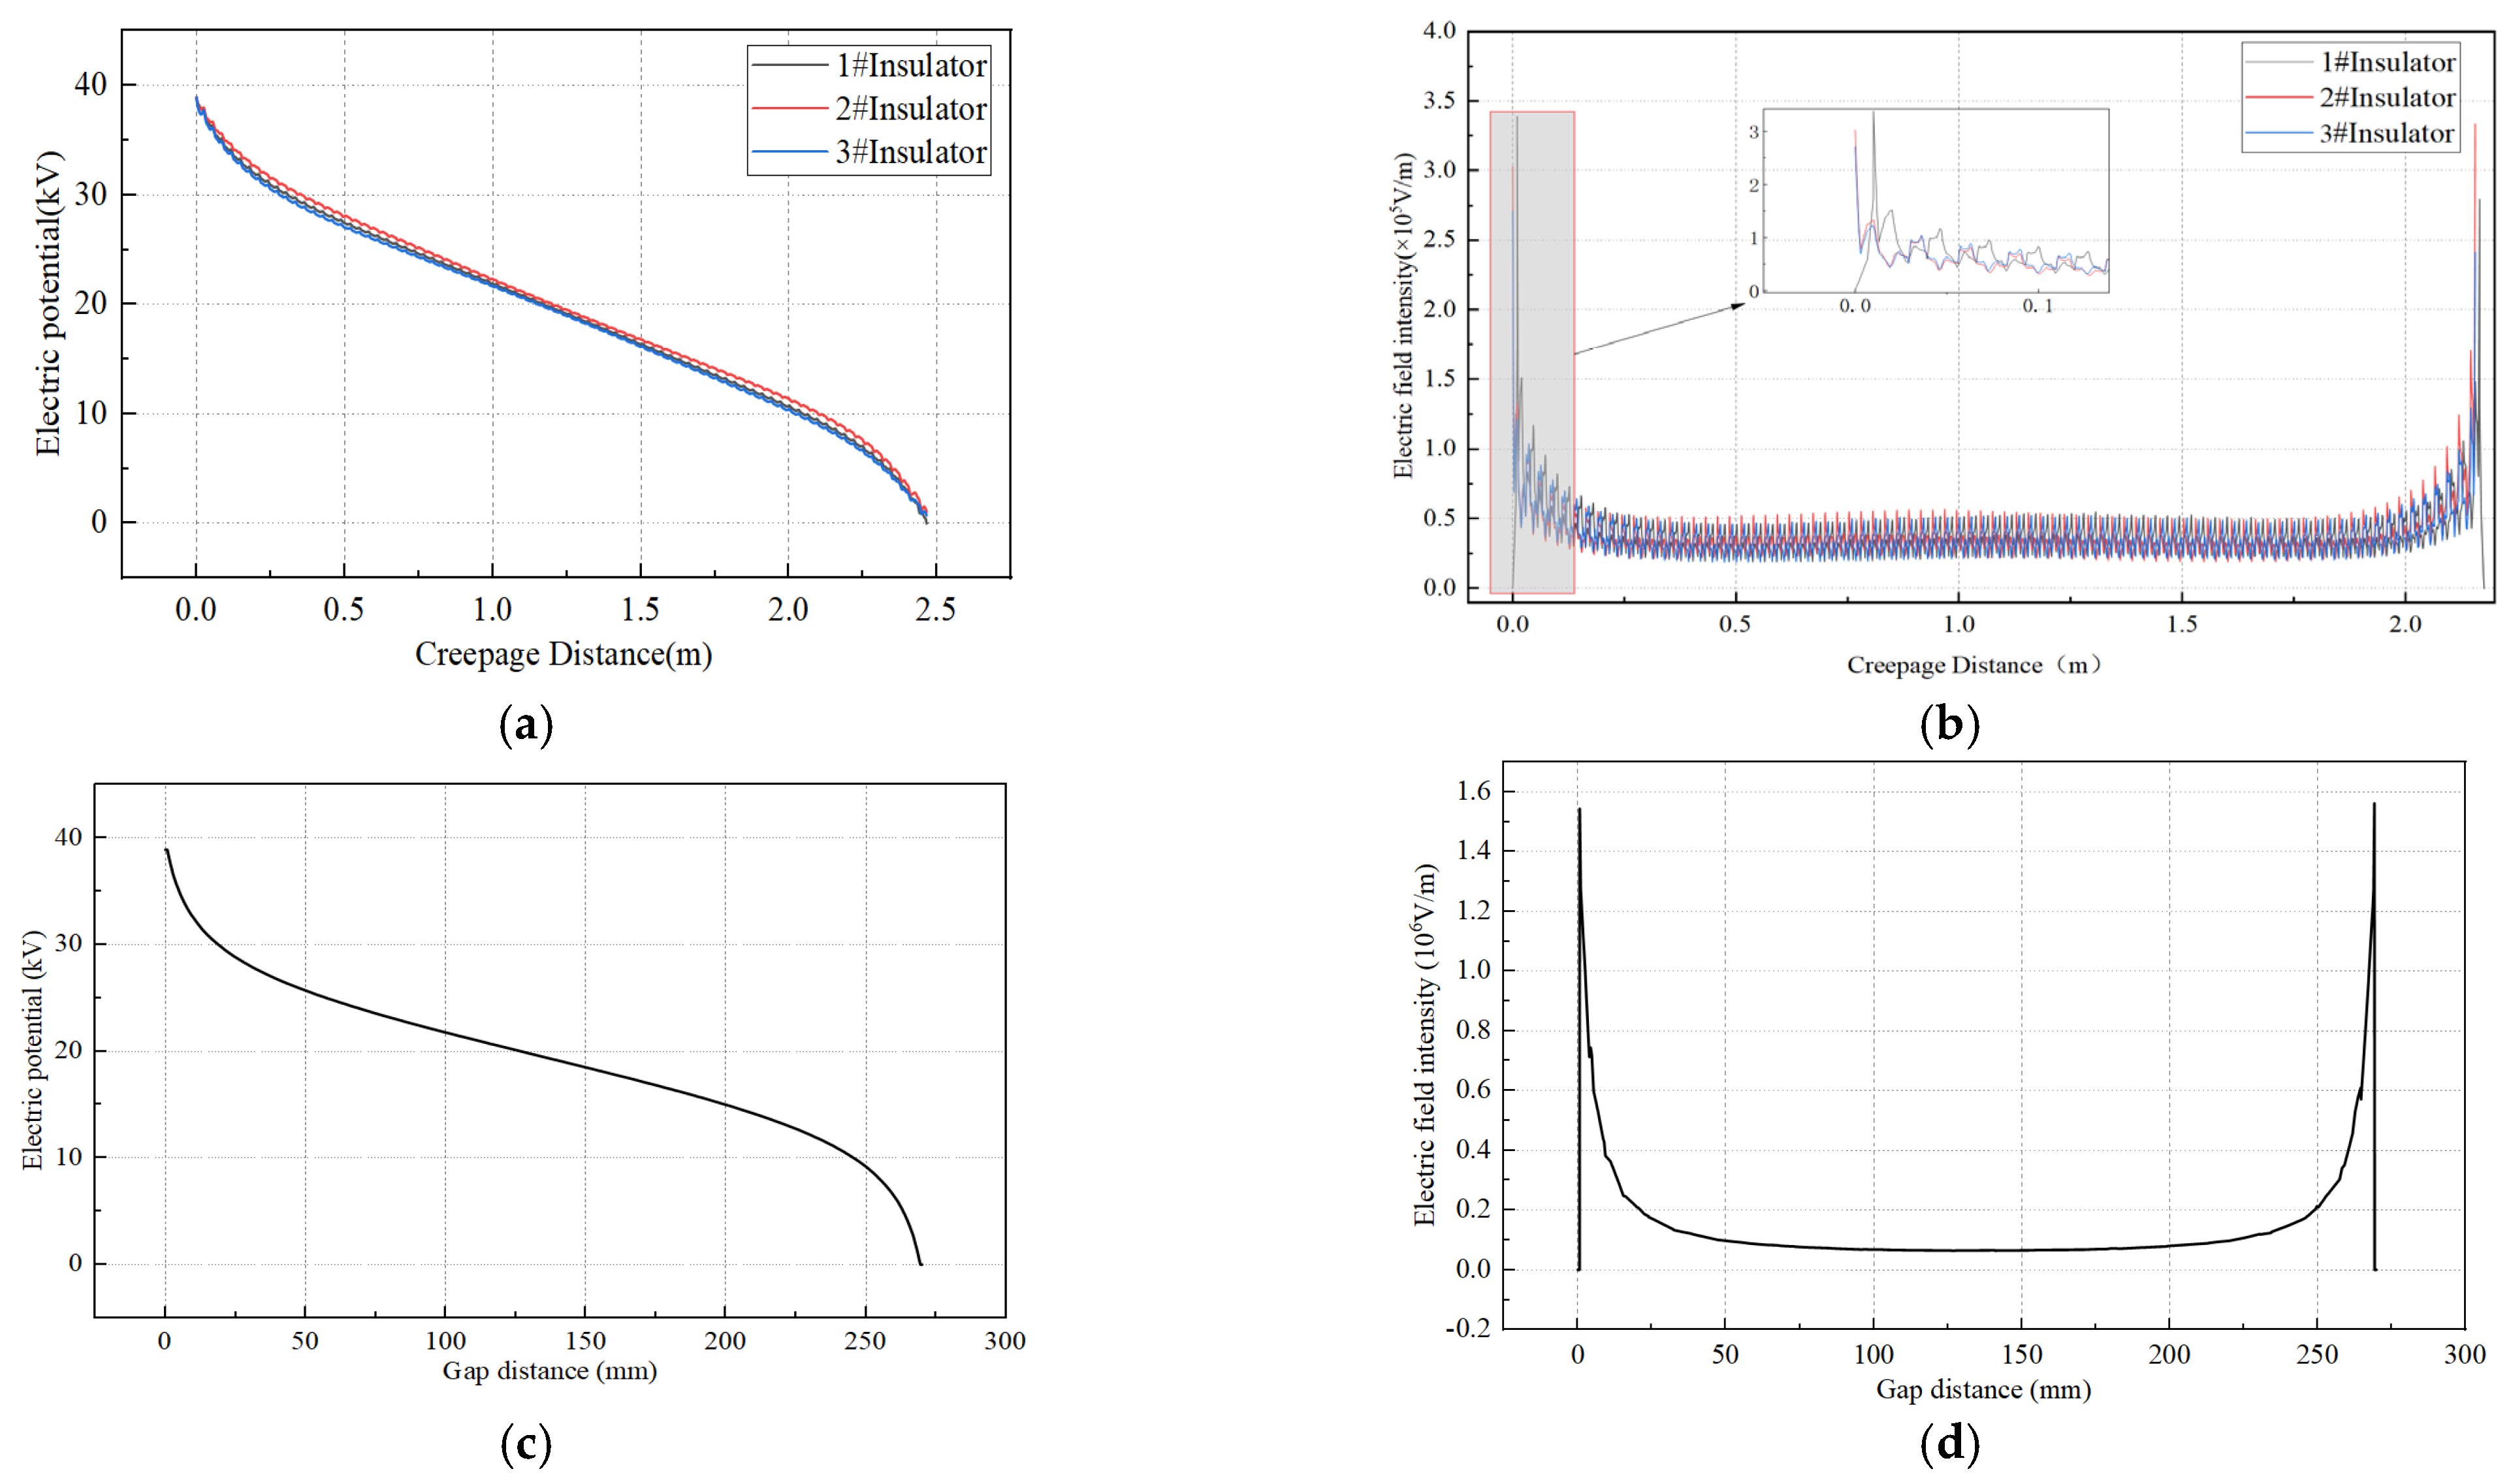
Potential variation is the primary cause of the electric field distribution pattern. To quantitatively analyze the potential variation in the insulator and arcing horn gap, based on the left view of the section insulator and according to their positional distribution, the three insulators located at the upper right, upper left, and lower positions are designated as insulator #1, insulator #2, and insulator #3, respectively. Simulation analysis was conducted using the creepage distance of the insulators and the air gap of the arcing horns as paths, yielding the potential and electric field distribution curves shown in Figure 4.
The potential variation trends along the surfaces of the three insulators of the section insulator are identical, and the potential distribution of the arcing horn gap also exhibits the same variation trend. For the insulators, the potential gradient is larger at the junction between the insulator and the metal electrode, while the minimum overall potential gradient occurs at the edges of the sheds. For the arcing horn gap, the potential gradient is larger at the arcing horns on both sides, and a minimum potential gradient exists in the middle of the air gap. In high-altitude regions where air density is lower, discharge incidents are highly prone to occur. When arc development is severe, it can cause burning of the runners and insulation, thereby degrading the electrical insulation performance of the section insulator.

3.2. Influence of High-Altitude Environment on Discharge Characteristics

Air pressure and air temperature jointly determine the gas molecule number density, which governs the electron mean free path and consequently the dielectric breakdown strength of air. At high altitudes, reduced air pressure leads to lower molecular density, longer electron mean free paths, and enhanced impact ionization, resulting in reduced breakdown voltage. To comprehensively account for both effects, the relative air density δ is introduced as a dimensionless parameter [33].
δ = T 0 P 0 P T = 2.9 P T
where δ is the relative gas density, referring to the ratio of the gas density to that under standard atmospheric conditions (P0 = 101.3 kPa, T0 = 293 K); P is the air pressure during the breakdown test, in kPa; and T is the temperature during the breakdown test, in K. The intuitive characteristic of high-altitude regions compared to plain region is the change in altitude. Therefore, the relative air density δ is expressed using altitude and temperature, and the empirical formula is as follows.
δ = ( 1 a H / T 0 ) 4.26
where a is the air temperature gradient, taken as 0.0065 °C/m; T0 is the absolute temperature under standard conditions, 293 K; and H is the altitude, in m.
When the relative air density decreases, the number of gas molecules per unit volume decreases and the mean free path of electrons increases, making it easier for electrons to reach the energy threshold required for ionizing gas molecules. Consequently, the discharge voltage decreases in low-pressure environments. The discharge inception of section insulators is closely related to their structural characteristics and surface contamination conditions. The electric field concentration at the junction between the metal electrode and the insulator is prone to inducing discharge. In humid environments, contamination on the insulator induces surface flashover. Under clean and dry conditions, gap discharge between the arcing horns is the dominant discharge form, while contamination flashover may become significant under polluted and humid conditions.

4. Discharge Tests of Section Insulators in High-Altitude Environment

4.1. Power Frequency Discharge Test

To compare the power frequency discharge voltage of section insulators between plain and high-altitude regions, power frequency discharge tests were conducted on the same section insulator in a plain region (altitude below 1000 m) and at an altitude of 4300 m, respectively. All discharge tests in this study were conducted under clean and dry conditions. During the tests, the ambient temperature in both locations was maintained at 18 °C. The continuous voltage rise method was adopted for the tests. First, voltage was continuously applied to the clean section insulator until discharge occurred to determine the approximate discharge voltage. Then, the voltage was raised again to approximately 80% of the discharge voltage value, after which the voltage rise rate was reduced, and the voltage was slowly increased until discharge occurred. During the test process, each voltage application was separated by a 5 min interval after flashover to eliminate the influence of residual charge. Meanwhile, the standard deviation formula was used to assess the rationality of the data, as follows:
U a = i = 1 n U i n
σ % = ( i = 1 n ( U i U a ) 2 / ( n 1 ) ) U a
where Ua is the arithmetic mean of the destructive test voltage; Ui is the measured discharge voltage of the i-th test; and n is the number of measurements.
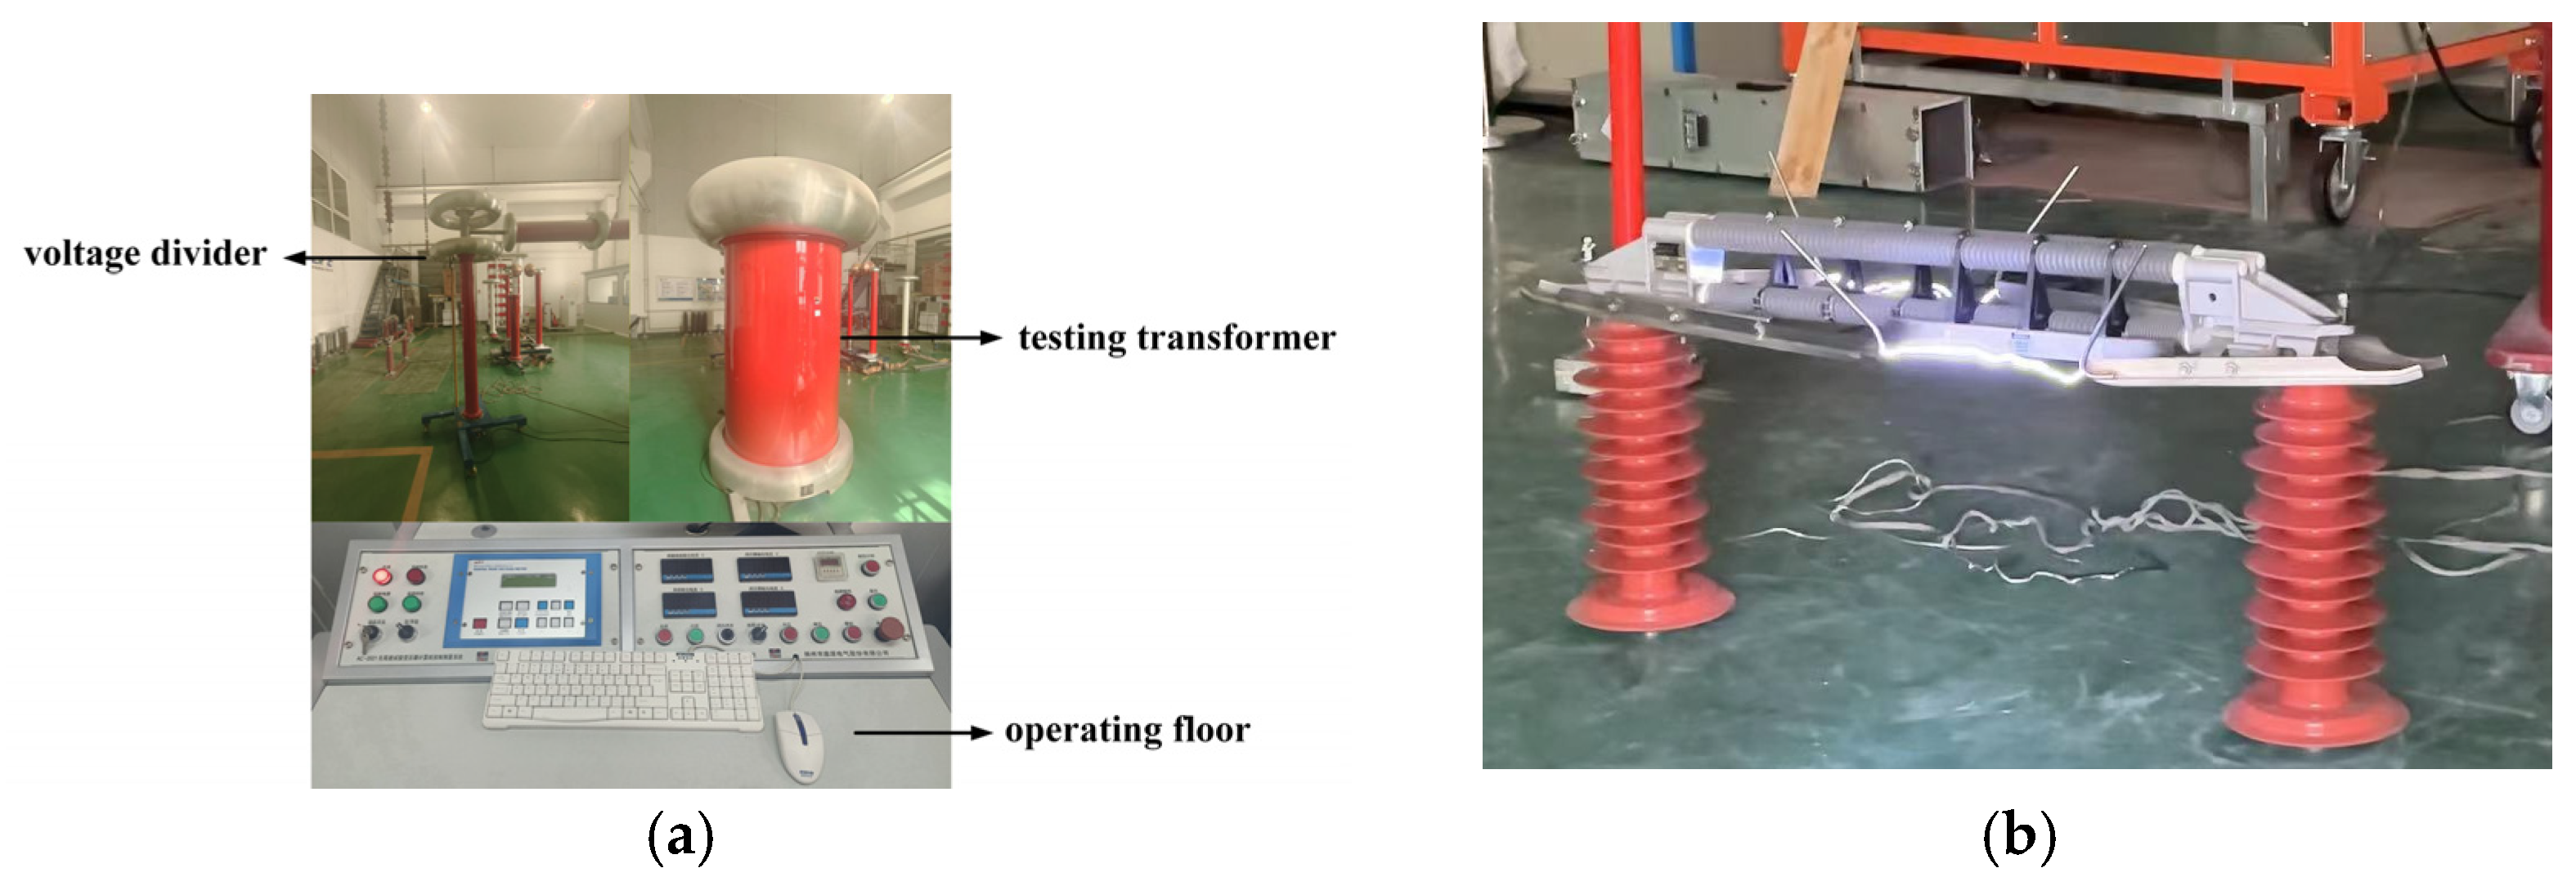
The dry flashover processes of section insulators in the plain and high-altitude regions are similar, as shown in Figure 5. The test results from the plain and high-altitude (4300 m) regions are presented in Table 1. As the voltage increases, corona discharge first occurs at the arcing horn of the section insulator, manifesting as a blue-violet corona. As the voltage continues to rise, the sound of air ionization is emitted, and small arcs appear between the arcing horns, forming streamer discharge channels. Finally, as the streamer thickens, a flashover channel bridging both ends of the arcing horns is formed.
The power frequency dry flashover voltage of the section insulator at an altitude of 4300 m decreased by 28% compared to that in the plain region. Therefore, the power frequency voltage conditions for section insulators operating at an altitude of 4300 m are considerably more severe, and their structure needs to be optimized to meet the requirements for safe operation in high-altitude regions. These data indicate that section insulators in high-altitude regions withstand a lower power frequency voltage threshold. Given the long service life of section insulators, the aging of insulation materials in high-altitude regions will further reduce their operational lifespan, thereby increasing maintenance and replacement costs. It should be noted that the present study employs a two-point comparison (plain region vs. 4300 m, δ = 0.99 vs. δ = 0.65) rather than a multi-altitude parametric study, due to limited access to high-altitude test facilities. The 28% reduction in power frequency flashover voltage is consistent with the nonlinear decreasing trend reported for contaminated insulators [25,26] and rod–rod gaps [17] under reduced air pressure. The 42% lightning impulse U50 reduction at δ = 0.65 also falls within the expected range of the power function relationship reported by Liao et al. [22] for tunnel–catenary gaps. The influence of temperature variation was not independently investigated, as both tests were conducted at 18 °C. Future work will aim to conduct tests at intermediate altitudes (e.g., 2000 m, 3000 m) and varying temperatures to establish a comprehensive Uδ characteristic specific to section insulators.

4.2. Lightning Impulse Discharge Test

Lightning impulse is one of the major threats to the operation of catenary systems in high-altitude regions. At higher altitudes, the distance to thunderclouds is shorter, making it easier to attract lightning to the catenary, posing a threat to section insulator operation and readily causing flashover tripping. In this section, lightning impulse tests were conducted on section insulators based on the standard lightning waveform of 1.2/50 μs. All discharge tests in this study were conducted under clean and dry conditions. First, positive and negative polarity lightning impulse withstand tests were conducted on the section insulator in the plain region to determine the polarity effect of the lightning impulse voltage. According to Chinese national standards, positive and negative polarity lightning impulse withstand tests were conducted on the section insulator 15 times each, with the number of flashovers not exceeding 2 at the applied voltage. The discharge location of the clean section insulator under lightning impulse was between the arcing horns, consistent with the power frequency discharge location, both being gap discharge. The test results are shown in Table 2, where “O” indicates withstand and “×” indicates breakdown.
The positive polarity lightning impulse withstand voltage of the section insulator in the plain region is approximately 15 kV lower than the negative polarity, indicating that the operating conditions of the section insulator under positive polarity lightning impulse are more severe. Therefore, 30 positive polarity lightning discharge tests were conducted on the section insulator in both the plain region and at an altitude of 4300 m, and the U50 discharge voltage was calculated. The comparison of the test results is shown in Table 3.
As can be seen from the above table, the lightning impulse U50 of the section insulator at an altitude of 4300 m decreased by nearly 42% compared to that in the plain region, seriously affecting the operation of the section insulator. The standard atmospheric conditions are temperature T0 = 20 °C, pressure P0 = 101.3 kPa, and absolute humidity h0 = 11 g/m3. The test results were corrected to standard atmospheric conditions to compare the degree of discharge voltage decrease. Substituting the environmental test data into Equations (3) and (4), the relative air densities of the plain region and high-altitude region during the test were obtained [34].
δ 1 = 100.6 101.3 × 273 + 20 273 + 18 = 0.99
δ 2 = ( 1 0.0065 × 4300 / 293 ) 4.26 = 0.65
The CIGRE standard satisfies the correction requirements for altitudes up to 4500 m [35]. The correction formula is as follows:
K t = δ n / H n
H = 1 + k ( 11 h )
where δ is the relative air density; n is the correction exponent, taken as 1 for lightning impulse and insulation distance less than 1 m; H is the humidity correction factor; and k is the correction coefficient, taken as 0.0125 for power frequency AC and 0.009 for lightning impulse. To compare the lightning impulse discharge voltage of section insulators at the two test locations, the test data of the section insulators were calculated using Equation (10) to obtain the lightning impulse discharge voltage under the corresponding standard atmospheric conditions. From the test data converted to standard atmospheric pressure, the lightning impulse voltage of the section insulator in the plain region is 236.16 kV, and the lightning impulse voltage of the section insulator at an altitude of 4300 m is 210.33 kV. From the test results, under standard atmospheric conditions, the lightning impulse discharge voltage of the section insulator at an altitude of 4300 m decreased by 11%. The ambient temperature during both sets of tests was maintained at approximately 18 °C. The influence of temperature variation on discharge characteristics was not independently investigated in this study and constitutes a direction for future research.

5. Optimization of Section Insulators

5.1. Structural Optimization

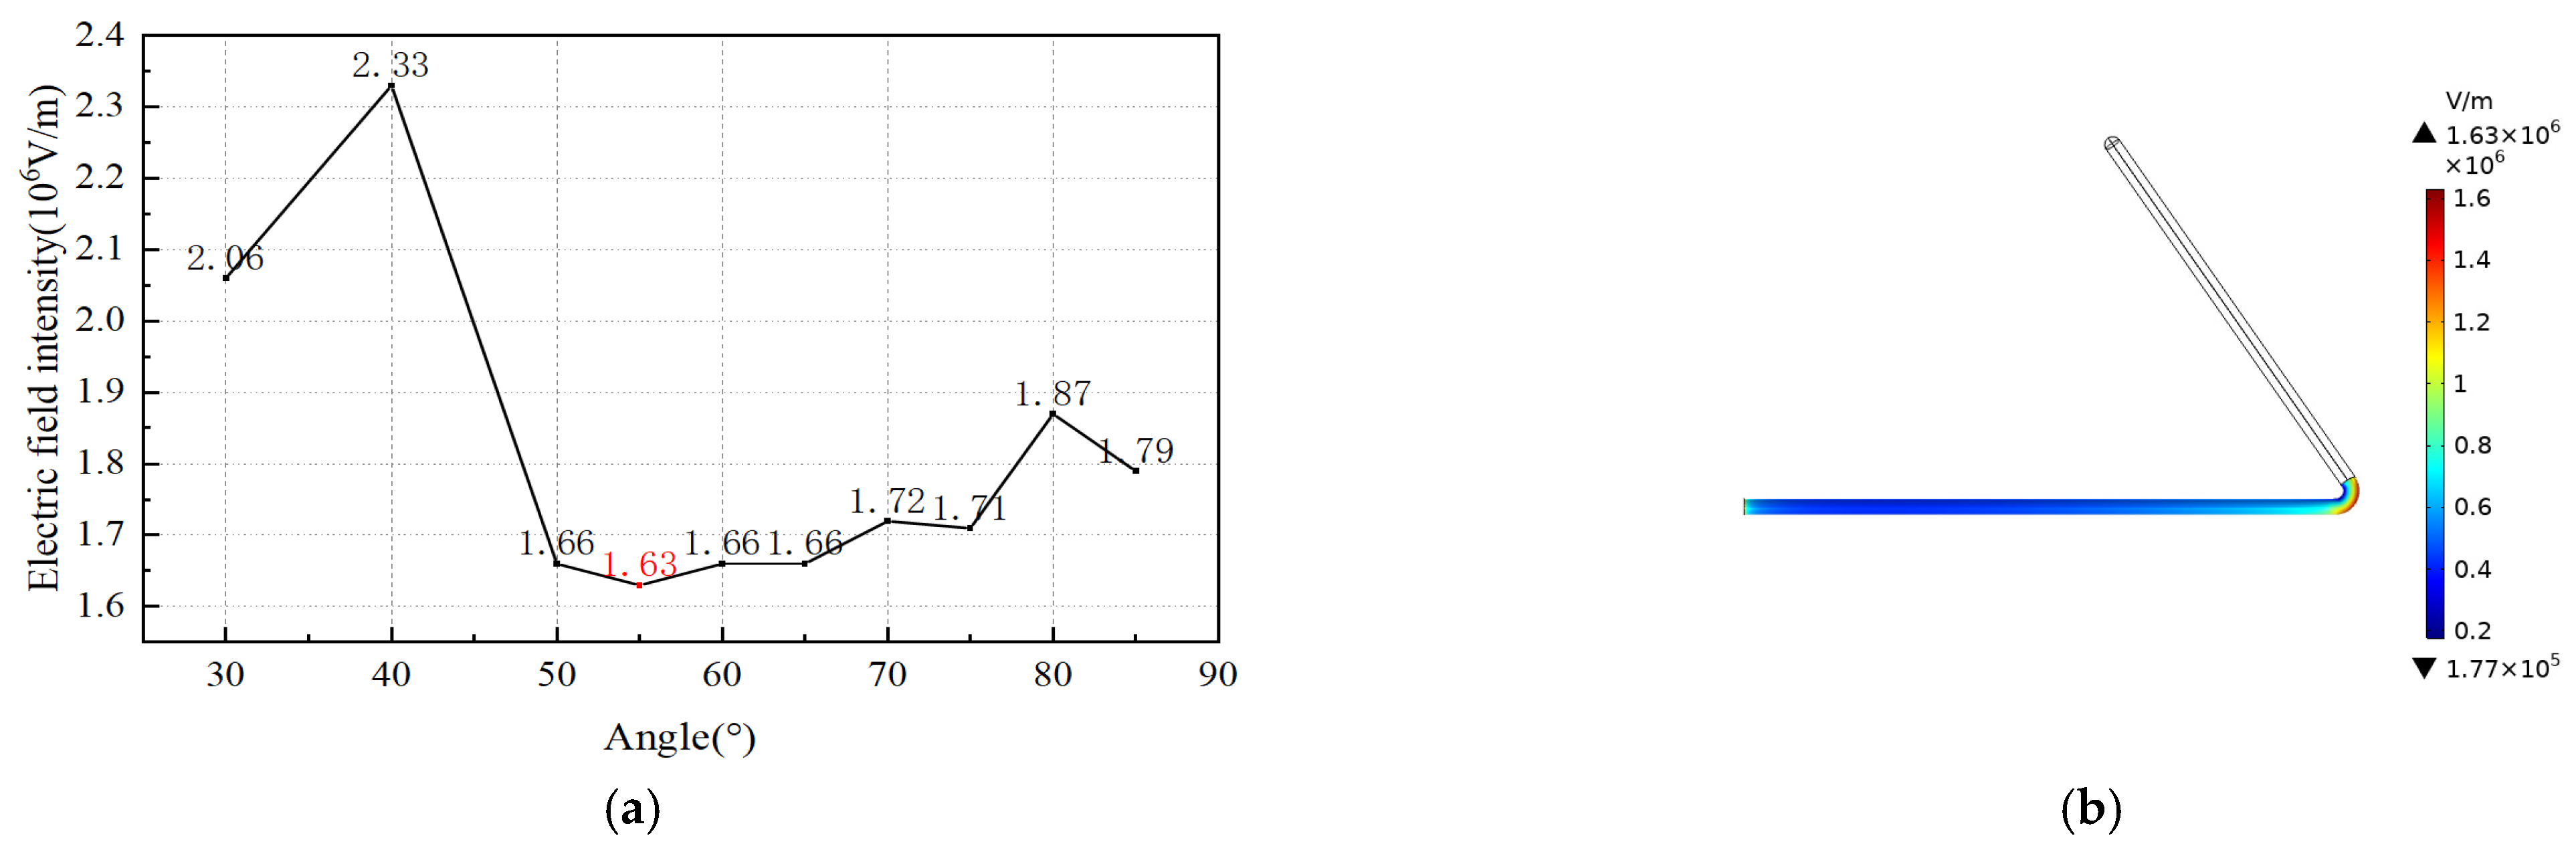
The electric field is concentrated at the arcing horn of the section insulator. In addition to the electric field distortion caused by the dielectric interface, field concentration is also related to the arcing horn angle. To determine the optimal arcing horn angle, the angle was systematically varied while recording the changes in field strength at the arcing horn bend. The arcing horn angle of the commonly used section insulator is 45°. As shown in Figure 3b, under the rated voltage condition, the local maximum electric field intensity obtained through simulation is 1.89 × 10⁶ V/m. The arcing horn angle was adjusted to 30°, 40°, 50°, 55°, 60°, 65°, 70°, 75°, 80°, and 85°, respectively. Electric field simulations under rated voltage were conducted for each configuration to study the variation pattern of the electric field in the arcing horn region and to determine the optimal arcing horn angle. The results are shown in Figure 6.
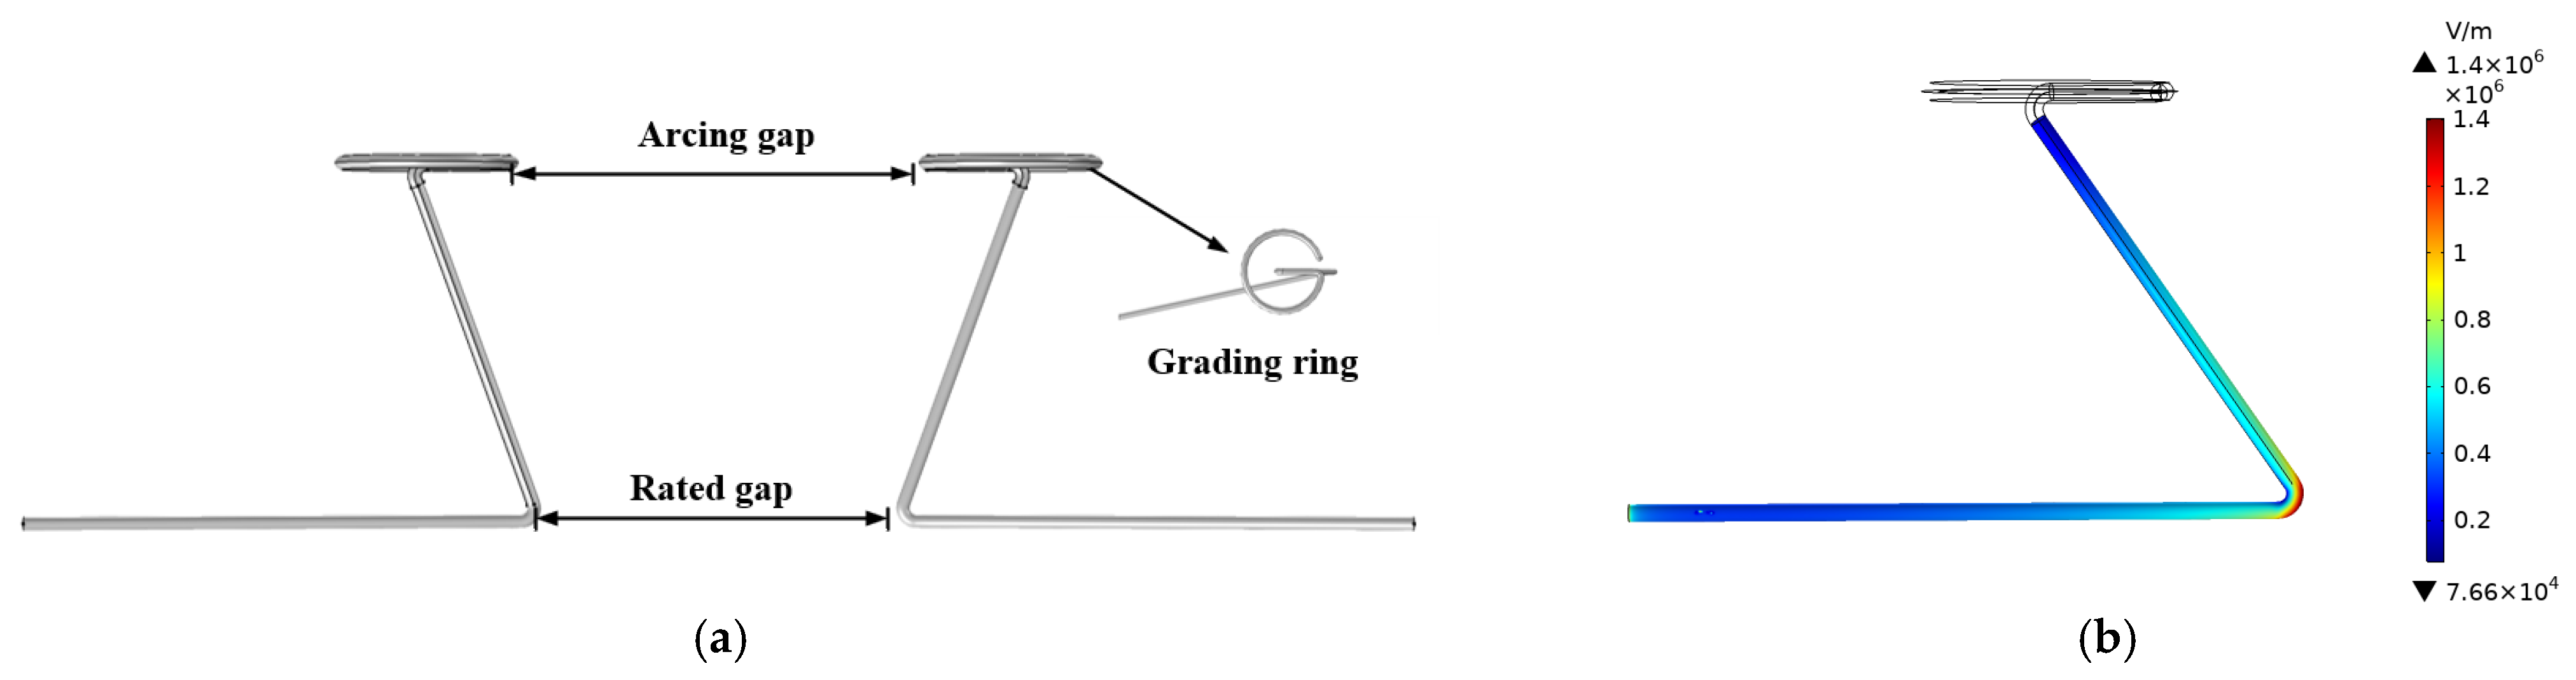
As shown in the figure, with the adjustment of the arcing horn angle, the maximum field strength in the arcing horn region generally exhibits a trend of first decreasing and then increasing. When the arcing horn angle is 55°, the field strength at the arcing horn reaches its minimum value of 1.63 × 10⁶ V/m, representing a 13.7% reduction compared to the maximum field strength at 45°. Therefore, it is recommended to design the arcing horn of the section insulator at 55° during manufacturing to reduce the maximum field strength. Based on the optimized 55° arcing horn, a grading ring structure was designed at the end of the arcing horn using finite element simulation software. Since adding an arc-guiding device at the top of the arcing horn would shorten the air gap at the maximum opening of the arcing horn, the radius of the grading ring must be limited so that the air gap at the maximum opening remains no smaller than the gap between the arcing horns on both sides. The schematic diagram of the air gap is shown in Figure 7a. Considering the gap constraint, grading rings with radii of 40 mm, 50 mm, 60 mm, and 70 mm were installed, and electric field simulations under rated voltage were conducted for each configuration, resulting in local field strengths at the arcing horn of 1.42 × 10⁶ V/m, 1.41 × 10⁶ V/m, 1.46 × 10⁶ V/m, and 1.40 × 10⁶ V/m, respectively. The 70 mm grading ring yielded the greatest reduction in local maximum field strength, approximately 26% lower than the original arcing horn structure. The electric field distribution of the arcing horn with an angle of 55° and a 70 mm grading ring is shown in Figure 7b.
From a practical standpoint, the proposed optimization measures offer significant benefits for the operational maintenance of section insulators in high-altitude railway catenary systems. Adjusting the arcing horn angle from 45° to 55° during manufacturing is a low-cost modification that does not alter the overall mechanical compatibility with existing catenary fittings yet achieves a 13.7% reduction in peak field strength. The addition of a 70 mm grading ring at the arcing horn end requires careful consideration of the pantograph clearance envelope; in the current design, the grading ring dimensions are constrained to ensure that the air gap at the maximum opening of the arcing horn remains no smaller than the gap between the arcing horns on both sides, thus preserving the rated insulation distance. Several additional practical factors merit consideration. First, changing the arcing horn angle to 55° increases the bending moment arm, which may affect fatigue life under repeated arcing; mechanical strength verification is recommended before deployment. Second, in tunnel sections where clearance margins are more restrictive, the dynamic clearance envelope between the grading ring and pantograph should be verified through kinematic analysis. Third, in icing-prone regions, the grading ring may serve as a preferential site for ice accumulation, potentially altering the effective insulation distance. These effects warrant evaluation through future icing and contamination tests on the optimized structure.

5.2. Surface Coating Optimization

At the junction between the metal electrode and the insulating component, the electric field protrusion caused by the dielectric interface is a weak point that induces insulation breakdown. The primary reason is the excessive electric field gradient at the triple-point interface of the three media: the metal electrode, air, and insulating material. To address the field strength concentration problem caused by the direct exposure of the metal electrode to air, this section proposes an optimization scheme of spraying a room temperature vulcanizing (RTV) silicone rubber insulating coating on the surface of the metal electrode. RTV silicone rubber coating is a functional coating material widely used for pollution flashover prevention on transmission line insulators. Its relative permittivity is approximately 2.7 to 3.0, which lies between those of air and the insulating material, and can effectively mitigate the abrupt change in permittivity at the dielectric interface.
The RTV silicone rubber insulating coating modeled in the simulation was assigned a relative permittivity of 2.8, a volume resistivity of 1.0 × 10¹² Ω·m, and a coating thickness of 2 mm. These values are representative of commercially available RTV silicone rubber coatings widely used for pollution flashover prevention on transmission line insulators [32]. The relative permittivity of 2.8 was selected because it lies between those of air (1.0) and the silicone rubber insulator sheds (3.4), which enables the coating to serve as a dielectric transition layer that mitigates the abrupt permittivity mismatch at the triple-point junction of the metal electrode, air, and insulating material. It should be noted that the current study focuses on the electric field optimization effect of the coating through numerical simulation. Experimental validation of the coating’s mechanical durability, adhesion strength, and long-term aging performance under high-altitude operating conditions is planned as part of future research and will be reported in a subsequent study.
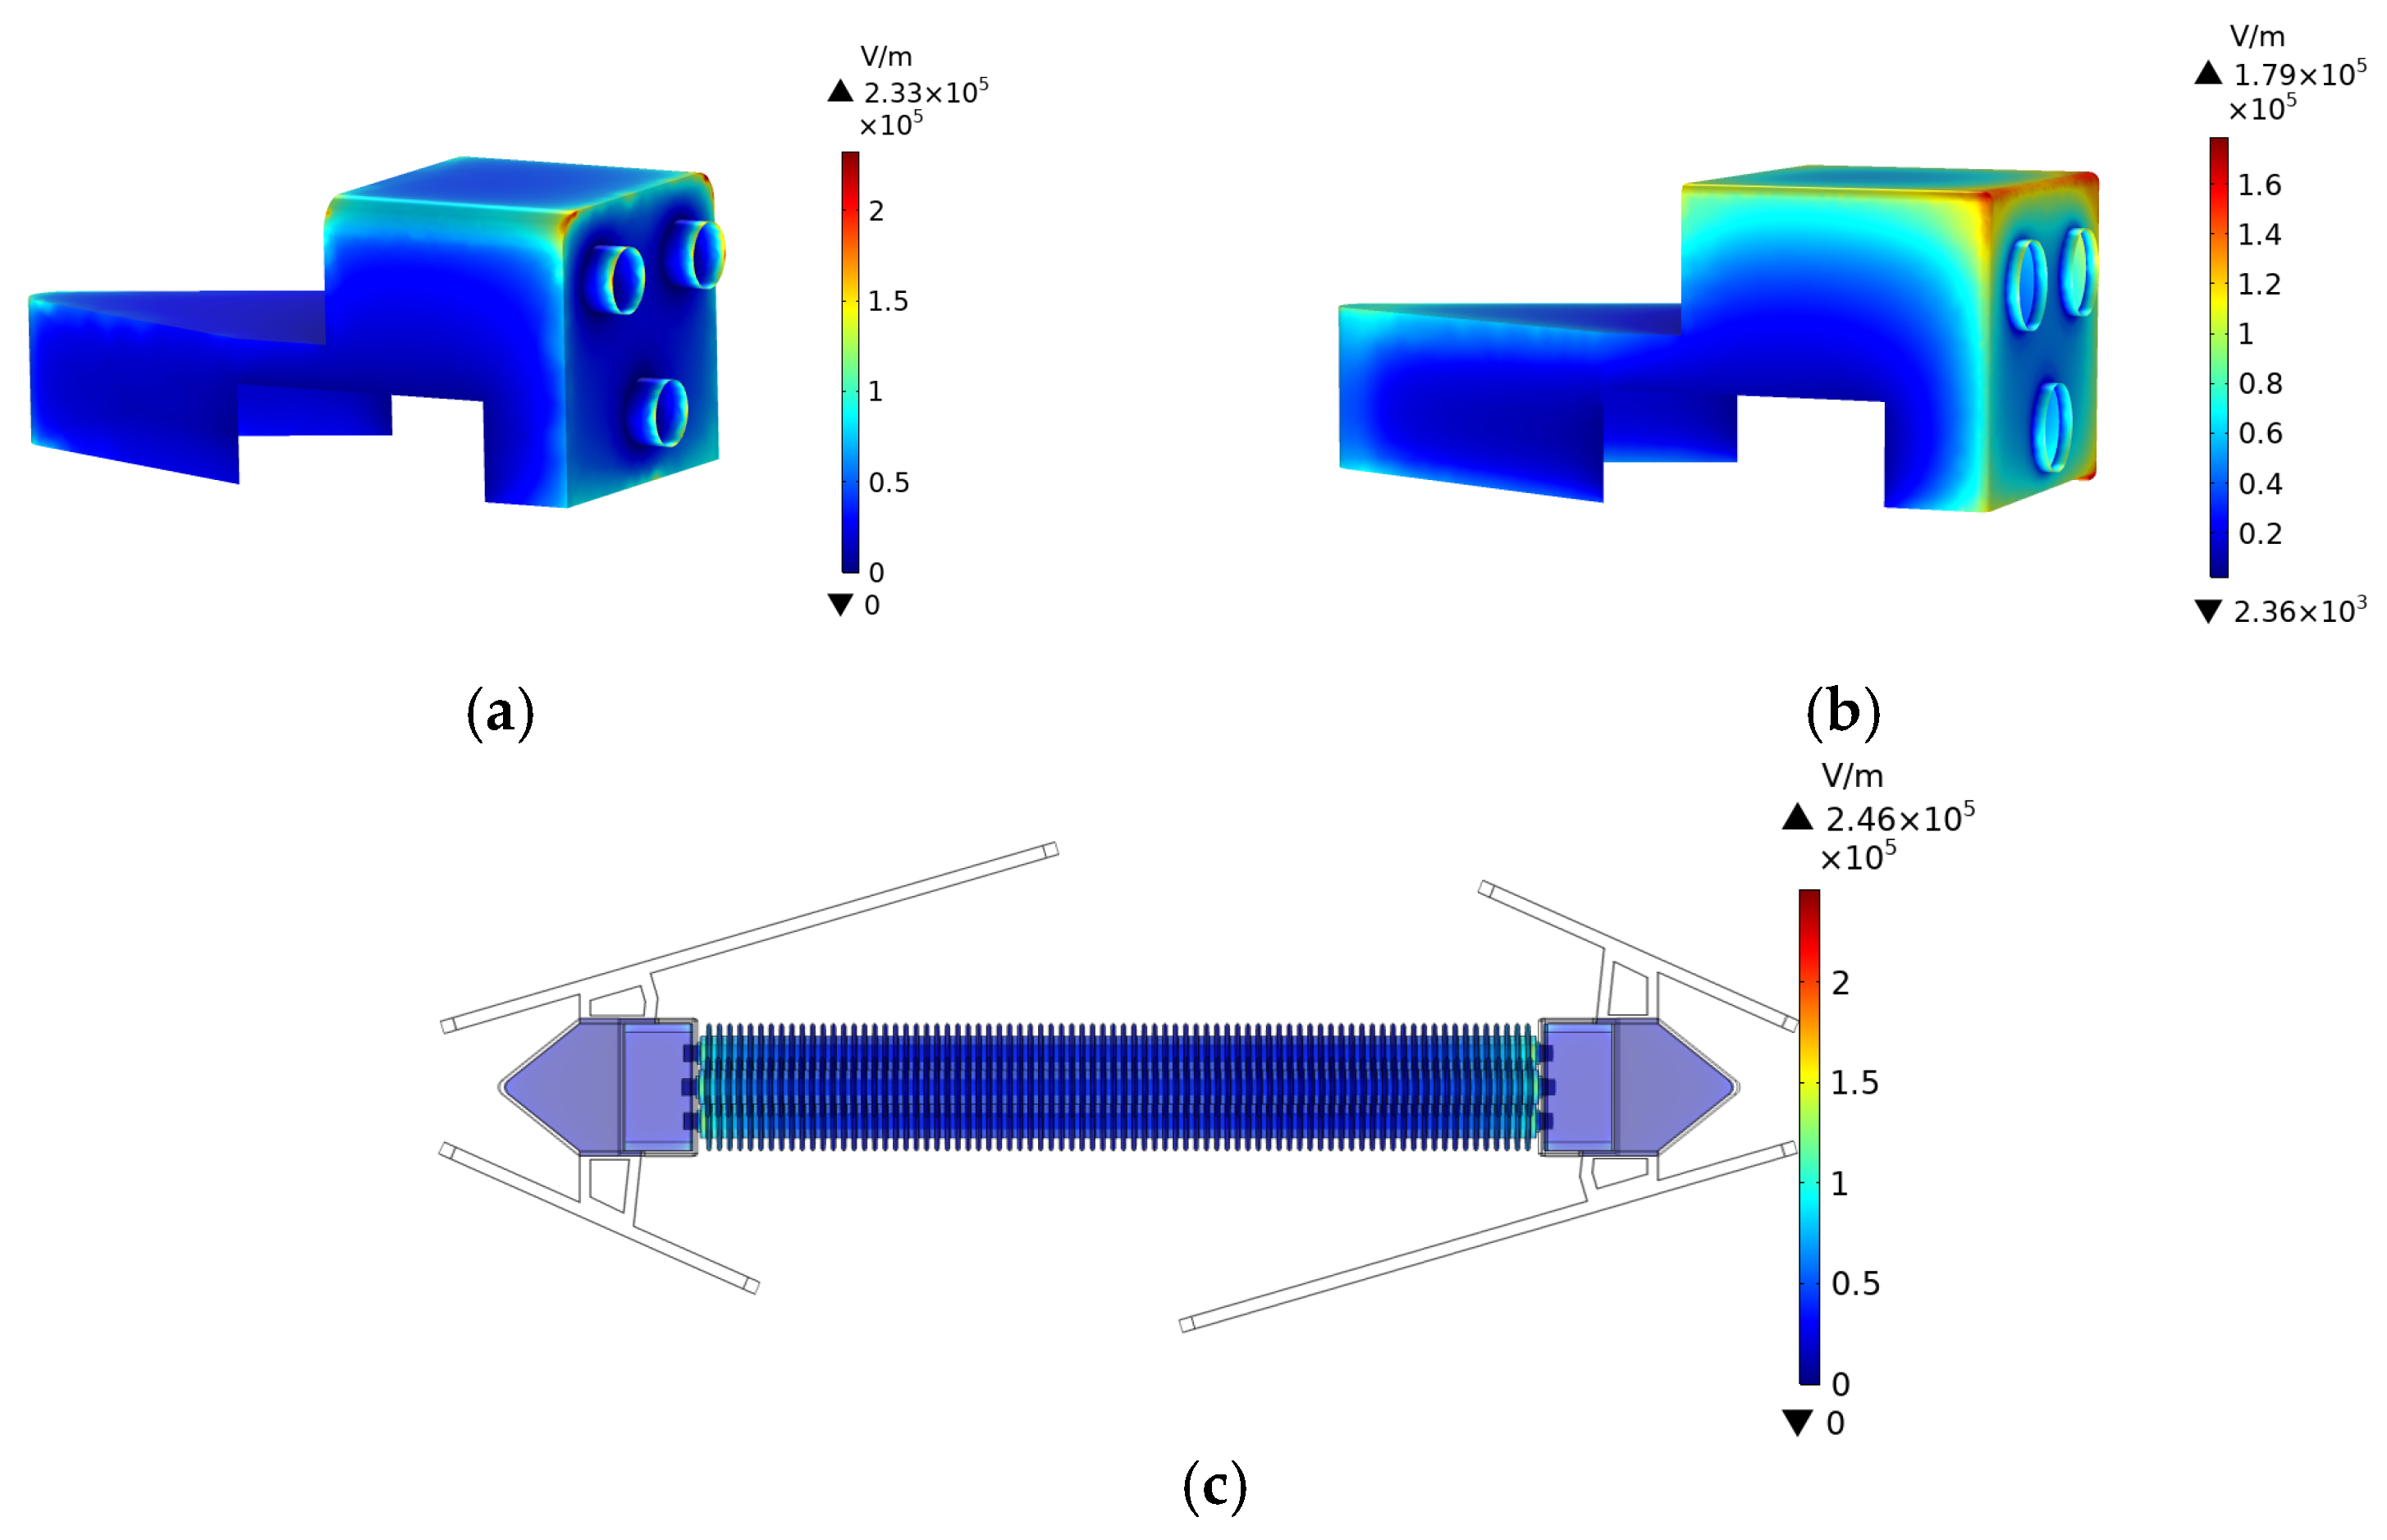
The changes in field strength distribution on the electrode surface under rated voltage conditions before and after applying the coating were analyzed using finite element simulation software. The surface electric field distributions of the section insulator before and after applying the RTV coating are shown in Figure 8a and b, respectively. The overall electric field distribution is shown in Figure 8c.
After coating, the field strength at the interface between the electrode and air decreased by 23% compared to the uncoated surface. The maximum surface field strength at the junction between the insulator and the metal electrode is 2.46 × 10⁵ V/m, representing a 35.9% reduction compared to the local maximum field strength at the junction in the original model. This value is lower than the corona inception field strength of air at 3.4 × 10⁵ V/m and can effectively prevent local corona generation on the section insulator.
The application of a 2 mm RTV silicone rubber coating on the metal electrode surface is readily implementable during scheduled maintenance intervals. RTV coatings have been widely adopted on transmission line insulators and have demonstrated sustained hydrophobicity and pollution resistance over service lives of 5–8 years under outdoor conditions [32]. For section insulators in high-altitude traction systems, the coating serves a dual function: it reduces the electric field strength at the electrode–insulator junction below the corona inception threshold and provides a hydrophobic barrier against surface contamination accumulation and moisture ingress. Since the coating is applied to the metal electrode surface rather than the pantograph contact surface, direct mechanical abrasion is avoided. It should be acknowledged that if an arc discharge occurs due to external causes such as lightning overvoltage or severe contamination, the high-temperature arc plasma can cause localized thermal damage to the coating, including surface carbonization and partial ablation. However, the primary role of the coating is preventive: by suppressing discharge initiation under normal operating conditions, it reduces the probability of damaging arc events rather than withstanding them. Under contaminated and humid conditions, discharge performance is expected to deteriorate further at high altitudes, as reduced air density lowers arc propagation voltage while contamination increases leakage currents [25,26,27]. The hydrophobic nature of the RTV coating is expected to partially mitigate contamination effects, but long-term degradation under the combined action of ultraviolet radiation, temperature cycling, sustained corona exposure, and intermittent arc erosion at high altitude requires field validation. Accelerated aging tests of the coating under arc exposure and contamination flashover experiments under controlled salt deposit density (SDD) and non-soluble deposit density (NSDD) conditions at both plain and high-altitude sites are planned as follow-up studies.

6. Conclusions

Based on the electric field simulation model of the section insulator and high-altitude discharge tests, the discharge mechanism and optimization scheme of section insulators in high-altitude and low-pressure environments were studied. The main conclusions are as follows:
(1).
The electric field of the section insulator is mainly concentrated at the junction between the metal electrode and the insulator and at the end of the arcing horn. Under the power frequency peak voltage of 38.9 kV, the local maximum field strength at the junction reaches 3.84 × 10⁵ V/m, which exceeds the corona inception field strength of air at 3.4 × 10⁵ V/m. The field strength in the arcing horn gap exhibits a distribution characteristic of being high at both ends and low in the middle. The non-uniform electric field is the primary factor inducing discharge in the section insulator.
(2).
The high-altitude and low-pressure environment significantly reduces the discharge voltage of section insulators. The power frequency dry flashover voltage at an altitude of 4300 m is 103.5 kV, a 28% decrease compared to 143.9 kV in the plain region. The 50% breakdown voltage under positive polarity lightning impulse is 128.3 kV, a 42% decrease compared to 221.99 kV in the plain region. After correction to standard atmospheric conditions, the lightning impulse discharge voltage at an altitude of 4300 m remains 11% lower than that in the plain region, indicating that the high-altitude environment has a significant impact on the insulation performance of section insulators.
(3).
By optimizing the arcing horn angle from 45° to 55°, the local maximum field strength decreased by 13.7%. On the basis of the 55° arcing horn, adding a 70 mm grading ring reduced the local maximum field strength by 26% under power frequency conditions compared to the original structure. Applying a 2 mm thick RTV silicone rubber insulating coating on the metal electrode surface reduces the field strength at the junction between the electrode and the insulator by 35.9% to 2.46 × 10⁵ V/m, which is lower than the corona inception field strength of air. This approach can effectively suppress local corona and discharge incidents on section insulators, providing a theoretical basis for the design and operational maintenance of section insulators in high-altitude regions.

Author Contributions

Conceptualization, J.S. and Y.L.; Methodology, T.X.; Software, K.Z.; Validation, J.T.; Formal analysis, D.L.; Investigation, J.W.; Resources, K.Z.; Data curation, Y.L.; Writing—original draft preparation, J.S. and J.T.; Writing—review and editing, J.S. and Y.L.; Visualization, T.X.; Supervision, J.S.; Project administration, K.Z.; Funding acquisition, J.S., Y.L. and D.L. All authors have read and agreed to the published version of the manuscript.

Funding

This work was supported by the Fundamental Research Funds for the Central Universities (KEYJS25002536), the Fundamental Research Funds for the Central Universities (KEJBMC24004536), National Natural Science Foundation of China (52377131), Science and Technology Project of National Energy Group (SHTL-21-08, SHSN-22-05, SHTL-2022-9, SNFZ23086).

Institutional Review Board Statement

Not applicable.

Informed Consent Statement

Not applicable.

Data Availability Statement

The authors confirm that the data supporting the findings of this study are available within the article.

Acknowledgments

The authors would like to thank reviewers for their pertinent comments that helped improve the quality of this paper.

Conflicts of Interest

Authors Dong Lei, Jiawei Wang and Tong Xing were employed by the company China Academy of Railway Science Group Co., Ltd. The remaining authors declare that the research was conducted in the absence of any commercial or financial relationships that could be construed as a potential conflict of interest.

References

  1. Wu, G.; Yang, K.; Gao, G. Analysis of the Electric Field Through Internal Gap of Electric Multiple Unit Roof Composite Insulator. High Volt. Eng. 2014, 40, 3252–3259. [Google Scholar]
  2. He, J.; Duan, R.; Dong, M.; Kao, Y.; Guo, G.; Liu, J. CNN-Transformer Bridge Mode for Detecting Arcing Horn Defects in Railway Sectional Insulator. IEEE Trans. Instrum. Meas. 2024, 73, 3513116. [Google Scholar] [CrossRef] [Scilit]
  3. Huang, K.; Lin, G.; Liu, Z.; Yang, Y. Research on Transient Over-Voltages of High-Speed Train Passing Articulated Split-Section Insulator. IEEE Trans. Transp. Electrif. 2022, 9, 1664–1682. [Google Scholar] [CrossRef] [Scilit]
  4. Konieczny, J.; Labisz, K. Damages of the Section Insulator Guide Caused by Electric Arc. Adv. Sci. Technol. Res. J. 2024, 18, 214–225. [Google Scholar] [CrossRef] [Scilit] [PubMed]
  5. Mariscotti, A.; Giordano, D. The Electrical Behaviour of Railway Pantograph Arcs. Energies 2023, 16, 1465. [Google Scholar] [CrossRef] [Scilit]
  6. Xu, Z.; Gao, G.; Wei, W.; Yang, Z.; Xie, W.; Dong, K.; Ma, Y.; Yang, Y.; Wu, G. Characteristics of Pantograph–Catenary Arc under Low Air Pressure and Strong Airflow. High Volt. 2022, 7, 369–381. [Google Scholar] [CrossRef] [Scilit]
  7. Ma, J.; Zhang, R.; Wang, X. Analysis of Sheath Breakdown Induced by Air Gap at the Interface Between Hardware and Sheath of Silicone Rubber Composite Insulator on the Roof of High-Speed Trains. IEEE Trans. Transp. Electrif. 2023, 10, 3828–3844. [Google Scholar] [CrossRef] [Scilit]
  8. Cao, G.; Cao, B. Research on the Wind-Resistant Structure of Composite Insulators for Overhead Contact System Cantilever Used Based on Fluid-Structure Interaction Method. In Proceedings of the 2016 IEEE International Conference on High Voltage Engineering and Application (ICHVE), Chengdu, China, 19–22 September 2016; pp. 1–4. [Google Scholar]
  9. Lutrakulwattana, B.; Konghirun, M.; Sangswang, A. Harmonic Resonance Assessment of 1 × 25 kV, 50 Hz Traction Power Supply System for Suvarnabhumi Airport Rail Link. In Proceedings of the 18th International Conference on Electrical Machines and Systems (ICEMS), Pattaya, Thailand, 25–28 October 2015. [Google Scholar]
  10. Gan, Y. Discussion on Operation Problems of Catenary Sectional Insulator. Electrif. Railw. 2018, 29, 19–24. (In Chinese) [Google Scholar]
  11. Les Renardieres Group. Research on Long Gap Discharges at Les Renardieres—1973 Results. Electra 1974, 35, 49–156. [Google Scholar]
  12. Les Renardieres Group. Positive Discharge in Long Air Gaps at Les Renardieres—1975 Results. Electra 1977, 53, 31–153. [Google Scholar]
  13. Les Renardières Group. Double Impulse Tests of Long Air-Gaps Part 2: Leader Decay and Reactivation. IEE Proc. A 1986, 133, 395–408. [Google Scholar]
  14. Yang, B.; Yao, X.; Su, Y.; Lu, Z.; Xie, S.; Jiang, L.; Ding, Y. Influence of Front Time on Long-Airgap Breakdown Voltage in High-Altitude Areas. IEEE Trans. Power Deliv. 2024, 39, 1474–1480. [Google Scholar] [CrossRef] [Scilit]
  15. Jiang, X.; Yuan, J.; Zhang, Z.; Hu, Q.; Cheng, A. Study on AC Pollution Flashover Performance of Composite Insulators at High Altitude Sites of 2800–4500 m. IEEE Trans. Dielectr. Electr. Insul. 2009, 16, 123–132. [Google Scholar] [CrossRef]
  16. Zhang, Z.; Jiang, X.; Chao, Y.; Chen, L.; Sun, C.; Hu, J. Study on DC Pollution Flashover Performance of Various Types of Long String Insulators Under Low Atmospheric Pressure Conditions. IEEE Trans. Power Deliv. 2010, 25, 2132–2142. [Google Scholar] [CrossRef] [Scilit]
  17. Pigini, A.; Rizzi, G.; Garbagnati, E.; Porrino, A.; Baldo, G.; Pesavento, G. Performance of Large Air Gaps Under Lightning Overvoltages: Experimental Study and Comparison of Various Predictive Methods. IEEE Trans. Power Deliv. 1989, 4, 1379–1392. [Google Scholar] [CrossRef]
  18. Wang, P.; Xiao, Z.; Wang, X.; Chen, Y.; Ding, Y.; Geng, J. Streamer Inception Time Delay Characteristics Under High Altitude Positive Switching Impulse Voltage. High Volt. Eng. 2022, 48, 857–864. [Google Scholar]
  19. Jiang, X.; Shu, L.; Hu, J.; Zhang, Z.; Wang, S.; Yuan, J. Positive Switching Impulse Discharge Performance and Voltage Correction of Rod-Plane Air Gap Based on Tests at High-Altitude Sites. IEEE Trans. Power Deliv. 2009, 24, 302–310. [Google Scholar] [CrossRef] [Scilit]
  20. Ding, Y.; Yao, X.; Gu, C.; Wang, X. Study on Clearance Optimisation and Altitude Correction of 750 kV AC Side for UHVDC Converter Transformer. J. Eng. 2019, 2019, 2480–2483. [Google Scholar] [CrossRef] [Scilit]
  21. IEC 60060-1:2010; High-Voltage Test Techniques – Part 1: General Definitions and Test Requirements. International Electrotechnical Commission (IEC): Geneva, Switzerland, 2010.
  22. Liao, Y.; Jiang, X.; Yang, G.; Hu, J.; Zhang, Z.; Hu, Q.; Tan, C.; Wu, H. High-Altitude Tunnel-Catenary Gap Impulse Discharge Characteristics and Breakdown Voltage Correction. High Volt. 2023, 8, 1285–1295. [Google Scholar] [CrossRef] [Scilit]
  23. Qiao, X.; Zhang, Z.; Jiang, X.; Sundararajan, R.; You, J. DC Pollution Flashover Performance of HVDC Composite Insulator Under Different Non-Uniform Pollution Conditions. Electr. Power Syst. Res. 2020, 185, 106351. [Google Scholar] [CrossRef] [Scilit]
  24. Mei, H.; Wang, L.; Guan, Z. Characteristics of the AC Arc Motion on the Ice Surface Under Low Air Pressure. IEEE Trans. Plasma Sci. 2013, 41, 2504–2510. [Google Scholar]
  25. Rudakova, V.M.; Tikhodeev, N.N. Influence of Low Air Pressure on Flashover Voltages of Polluted Insulators: Test Data, Generalization Attempts and Some Recommendations. IEEE Trans. Power Deliv. 1989, 4, 607–613. [Google Scholar] [CrossRef]
  26. Fierro-Chavez, J.L.; Ramirez-Vazquez, I.; Montoya-Tena, G. Dielectric Tests in Polluted Insulators at High Altitude. IEEE Trans. Dielectr. Electr. Insul. 1996, 3, 154–160. [Google Scholar]
  27. Dong, B.; Zhang, Z.; Xiang, N.; Yang, H.; Xu, S.; Cheng, T. Theoretical and Experimental Investigation of AC and DC Arc Propagation on Polluted Insulators Surface. IET Gener. Transm. Distrib. 2022, 16, 3514–3527. [Google Scholar] [CrossRef] [Scilit]
  28. Kawamura, T.; Ishii, M.; Akbar, M.; Nagai, K. Pressure Dependence of DC Breakdown of Contaminated Insulators. IEEE Trans. Electr. Insul. 1982, 17, 39–45. [Google Scholar] [CrossRef] [Scilit]
  29. Phillips, A.J.; Maxwell, A.J.; Engelbrecht, C.S.; Gutman, I. Electric-Field Limits for the Design of Grading Rings for Composite Line Insulators. IEEE Trans. Power Deliv. 2015, 30, 1110–1118. [Google Scholar] [CrossRef] [Scilit]
  30. M’hamdi, B.; Teguar, M.; Mekhaldi, A. Optimal Design of Corona Ring on HV Composite Insulator Using PSO Approach with Dynamic Population Size. IEEE Trans. Dielectr. Electr. Insul. 2016, 23, 1048–1057. [Google Scholar] [CrossRef] [Scilit]
  31. Ilhan, S.; Ozdemir, A.; Ismailoglu, H. Impacts of Corona Rings on the Insulation Performance of Composite Polymer Insulator Strings. IEEE Trans. Dielectr. Electr. Insul. 2015, 22, 1605–1612. [Google Scholar] [CrossRef] [Scilit]
  32. George, J.M.; Prat, S.; Lumb, C.; Virlogeux, F.; Gutman, I.; Lundengard, J.; Marzinotto, M. Field Experience and Laboratory Investigation of Glass Insulators Having a Factory-Applied Silicone Rubber Coating. IEEE Trans. Dielectr. Electr. Insul. 2014, 21, 2594–2601. [Google Scholar] [CrossRef] [Scilit]
  33. Lv, F.; Ding, Y.; Fan, D.; Li, Q.; Wang, X.; Yao, X. Characteristics and Altitude Correction of Rod-Rod Long Air Gap Impulse Discharge. In Proceedings of the 2016 IEEE International Conference on High Voltage Engineering and Application (ICHVE), Chengdu, China, 19–22 September 2016. [Google Scholar]
  34. Yang, Y.; Li, W.; Xia, Y. Research of AC and DC Discharge Characteristics of Long Gap Under Low Pressure. Trans. China Electrotech. Soc. 2018, 33, 1143–1150. [Google Scholar]
  35. CIGRE WG D1.50; Atmospheric and Altitude Correction Factors for Air Gaps and Clean Insulators. CIGRE: Paris, France, 2022.
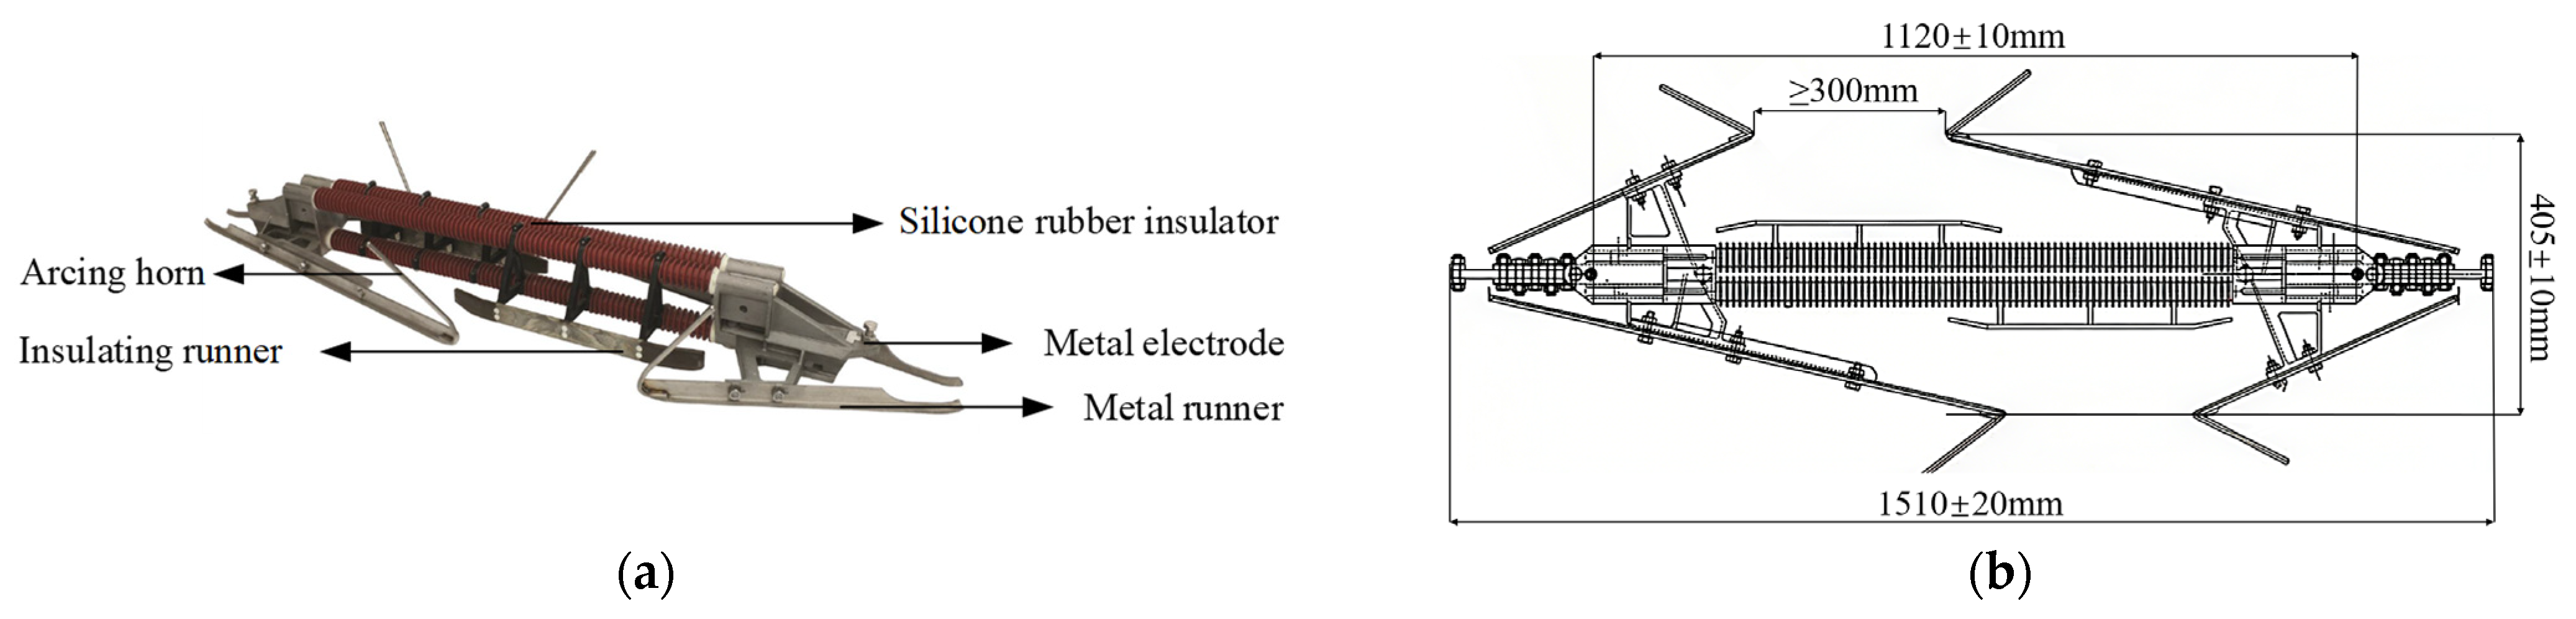
Figure 1. Structure of section insulator: (a) Structural Description (b) Structural Parameters.
Coatings 16 00390 g001
Figure 2. Three-dimensional model of section insulator: (a) main insulation structure; (b) arcing horn structure.
Coatings 16 00390 g002
Figure 3. Potential and electric field distribution of section insulator: (a) potential of main insulation structure; (b) electric field of main insulation structure; (c) potential of arcing horn; (d) electric field of arcing horn.
Coatings 16 00390 g003
Figure 4. Potential and electric field distribution curves: (a) potential along insulator surface; (b) electric field along insulator surface; (c) potential distribution of arcing horn gap; (d) electric field distribution of arcing horn gap.
Coatings 16 00390 g004
Figure 5. Discharge process of section insulator under power frequency conditions: (a) test equipment description; (b) discharge arc channel.
Coatings 16 00390 g005
Figure 6. Electric field at different arcing horn angles: (a) electric field variation at different angles (the value in red indicates the minimum electric field intensity at an angle of 55°); (b) electric field distribution at 55°.
Coatings 16 00390 g006
Figure 7. Electric field distribution after adding grading ring: (a) schematic diagram of air gap; (b) electric field distribution of arcing horn with 70 mm grading ring.
Coatings 16 00390 g007
Figure 8. Electric field distribution after applying coating: (a) electric field distribution of metal electrode without coating; (b) electric field distribution of metal electrode after coating; (c) overall electric field distribution.
Coatings 16 00390 g008
Table 1. Test results from plain and high-altitude regions.
Plain RegionAltitude 4300 m Region
Test No.Flashover Voltage
Ui/kV
Ua/kVRelative Standard Deviation σ%Test No.Flashover Voltage
Ui/kV
Ua/kVRelative Standard Deviation σ%
1143143.90.711103.2103.50.34
2142.72103.3
3144.33103.4
4144.94104.1
5144.85103.5
Table 2. Results of positive and negative polarity lightning impulse tests on section insulator in plain region.
Negative PolarityPositive Polarity
Test No.Hold-off Voltage
U/kV
Complete Discharge or NotTest No.Hold-off Voltage
U/kV
Complete Discharge or Not
1227.72O1211.42O
2226.06O2211.43O
3227.23O3211.89O
4227.75O4212.2×
5226.59O5211.99O
6226.8O6210.4O
7225.98O7212.65O
8227.65O8210.62O
9227.68×9212.09O
10226.87O10211.03O
11227.46O11211.41O
12226.79O12211.68O
13227.37O13212.97O
14227.06O14211.84O
15228.19×15211.54O
Table 3. Lightning impulse discharge U50 values in plain region and at altitude of 4300 m.
Test RegionImpulse Voltage
U50kV
Relative Standard Deviation
σ%
Plain region221.991.5
Altitude 4300 m region128.33.1
Disclaimer/Publisher’s Note: The statements, opinions and data contained in all publications are solely those of the individual author(s) and contributor(s) and not of MDPI and/or the editor(s). MDPI and/or the editor(s) disclaim responsibility for any injury to people or property resulting from any ideas, methods, instructions or products referred to in the content.