


Highlights
What are the main findings?
- FeCoNiMoCu was sulfidated by chemical vapor deposition (CVD).
- Its HER performance was assessed in four solutions: H2SO4, KOH, KOH+NaCl, and KOH+Na2S, delivering an overpotential of 53 mV at 10 mA·cm−2.
What are the implications of the main findings?
- CVD sulfidation provides an effective approach to prepare FeCoNiMoCu-based electrocatalysts.
- The catalyst exhibits excellent HER activity in a variety of electrolytes, and the results can provide useful references for other researchers in the design and fabrication of high-entropy alloy-based HER electrocatalysts.
Abstract
In this study, FeCoNiMoCu high-entropy alloy thin films were sulfided at different temperatures ranged from 250 °C to 450 °C by chemical vapor deposition, and the resultant sulfided Fe-Co-Ni-Mo-Cu-S alloys were characterized by means of XRD, SEM, XPS and EDS. HER performance tests were carried out in four electrolyte systems, namely 0.5 M H2SO4, 1 M KOH, 1 M KOH + 0.5 M NaCl and 1 M KOH + 1 M Na2S. The results indicated that the as-prepared electrodes exhibited low HER overpotentials in all four electrolytes, with the optimal catalytic performance consistently achieved at a sulfidation temperature of 350 °C. Among the tested systems, the electrode delivered the best HER activity in 0.5 M H2SO4, showing an overpotential of merely 53 mV and a Tafel slope of 86.72 mV dec−1 at a current density of 10 mA·cm−2. In 1.0 M KOH, the overpotential required to reach the same current density was 98 mV with a Tafel slope of 72.43 mV dec−1. For the mixed electrolyte of 1 M KOH and 0.5 M NaCl, the overpotential at 10 mA·cm−2 was 142 mV accompanied by a Tafel slope of 49.51 mV dec−1. In contrast, the 1 M KOH + 1 M Na2S electrolyte yielded an overpotential of 77 mV and a Tafel slope of 84.01 mV dec−1 at the identical current density. HER tests revealed that the sulfidation temperature exerts a significant influence on the formation and distribution of active phases of multi-metal sulfides (e.g., FeSx, CoSx, NiSx, MoS2) on the electrode surface. The electrodes prepared at an appropriate sulfidation temperature exhibit a larger specific surface area and enhanced hydrogen evolution reaction performance for water electrolysis. These findings may provide useful references for other researchers in the design and fabrication of high-entropy alloy-based HER catalysts.
1. Introduction
With the escalating global energy crisis and environmental challenges, the development of clean, efficient, and sustainable alternative energy solutions has become a worldwide consensus [1,2,3,4]. As an ideal clean fuel resource with high gravimetric energy density and pollution-free combustion products, hydrogen energy is regarded as a crucial component of the future energy system. Water electrolysis for hydrogen production, featuring high product purity and high hydrogen generation efficiency, is recognized as one of the most promising technologies with potential for large-scale application [5,6,7,8]. However, the hydrogen evolution reaction (HER) in water electrolysis suffers from a relatively high overpotential, necessitating efficient catalysts to reduce the reaction energy barrier. However, conventional noble metal catalysts such as Pt and Pd, are plagued by scarce reserves and exorbitant costs, which seriously hinder the industrialization of this technology. Therefore, the development of low-cost, high-activity non-precious metal HER catalysts has emerged as one of the important focuses of the current research [9,10,11,12].
Transition metal HEAs have been regarded as a new electrocatalytic material for water electrolysis in recent years, boasting exceptional comprehensive performance and broad application prospects. Compared with traditional alloy catalysts, HEAs exhibit not only outstanding physicochemical properties but also exceptional stability and catalytic activity [13,14,15,16]. From the perspective of current research progress, preliminary achievements have been made in the field of HEA-based catalysts for the HER. Jin et al. [17] prepared AlNiCoRuX HEA electrocatalysts (where X = Mo, Cu, V, Fe) for HER via a dealloying method. Electrochemical analyses demonstrated that the quinary AlNiCoRuMo HEA displayed electrocatalytic activity for HER comparable to that of commercial Pt/C catalysts. In a report by Zhang et al. [18], the MoNiCoFeCr HEA achieved overpotentials of 107 mV and 172 mV for HER in acidic and alkaline electrolytes, respectively, at a current density of 100 mA·cm−2.
Beyond quinary HEA systems, bimetallic sulfides and their heterostructures have also become research hotspots in the HER field, owing to their unique electronic structures, interfacial synergetic effects, and tunable catalytic active sites. Xi et al. [19] synthesized a heterostructured catalyst composed of bimetallic sulfide-coupled MoNi alloy (VMoS/MoNi) via hydrothermal and sulfidation routes toward high-performance alkaline water splitting. The results demonstrated that the catalyst afforded an ultra-low HER overpotential of 26 mV at a current density of 10 mA·cm−2. Yao et al. [20] fabricated a unique bimetallic sulfide composite (CoS2/WS2) through a hydrothermal approach. Appropriate dosage of thioacetamide (TAA) enabled the loading of WS2 nanoparticles on the CoS2 surface to be controlled below 5%, which maximized the exposure of active sites at the interface, effectively enhanced electrical conductivity, and reduced the hydrogen adsorption free energy (ΔGH*), thereby improving HER performance. In acidic media, the CoS2/WS2 composite achieved an overpotential of 79 mV and a Tafel slope of 52 mV dec−1. Huang et al. [21] realized the synthesis of interface-tunable Pt3Ni/NiS nanowires (NWs) through direct sulfidation of Pt-Ni NWs with high component segregation. Benefiting from the synergetic effect between Pt3Ni and NiS, the catalyst exhibited enhanced HER catalytic performance in alkaline solution compared with the pristine Pt3Ni2 NWs/C and commercial Pt/C catalysts. Specifically, it exhibited a current density of 37.2 mA·cm−2 at 0.07 V (pH = 14), representing a value 9.7 times higher than that of commercial Pt/C (3.83 mA·cm−2). Based on the aforementioned research status, both HEAs and sulfide-based catalysts represent promising directions for optimizing HER performance. Furthermore, the modulation of surface phase structure, elemental valence states, and active site distribution in HEAs via sulfidation modification is anticipated to yield a further enhancement in their HER catalytic performance.
In summary, using FeCoNiMoCu high-entropy alloys (HEAs) as the raw material, FeCoNiMoCu HEA thin films were first fabricated. Thereafter, the as-prepared thin films were subjected to sulfidation treatment at different temperatures via a one-step sulfidation process in a chemical vapor deposition (CVD) system. A combination of characterization techniques including XRD, SEM, XPS and EDS was employed to analyze the morphological features, phase structure and elemental valence states of the sulfided products. Finally, the effect of sulfided FeCoNiMoCu HEAs on HER catalytic activity was investigated in various electrolyte media.
2. Experimental Procedures
2.1. Preparation and Sulfidation of FeCoNiMoCu High-Entropy Alloys
FeCoNiMoCu powder was placed in a planetary ball mill for homogeneous mixing and collected after 48 h. Amounts of 8 g of the powder and 2 g of PVB were dissolved in 30 mL of ethanol, followed by heating at 50 °C with continuous stirring to obtain a homogeneous slurry. The slurry was uniformly coated on quartz glass with a dimension of 10 cm × 10 cm, allowed to stand for 2 h and then peeled off. It was subsequently transferred to a vacuum sintering furnace for sintering, and finally cooled naturally to room temperature in the furnace. The detailed preparation procedures and process parameters are provided in Ref. [22].
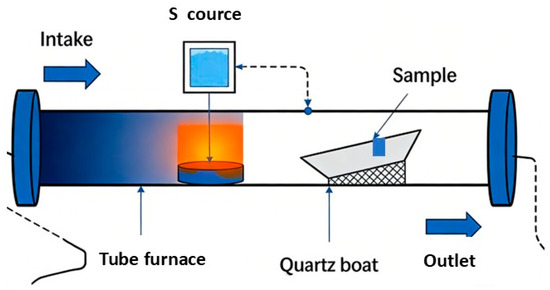
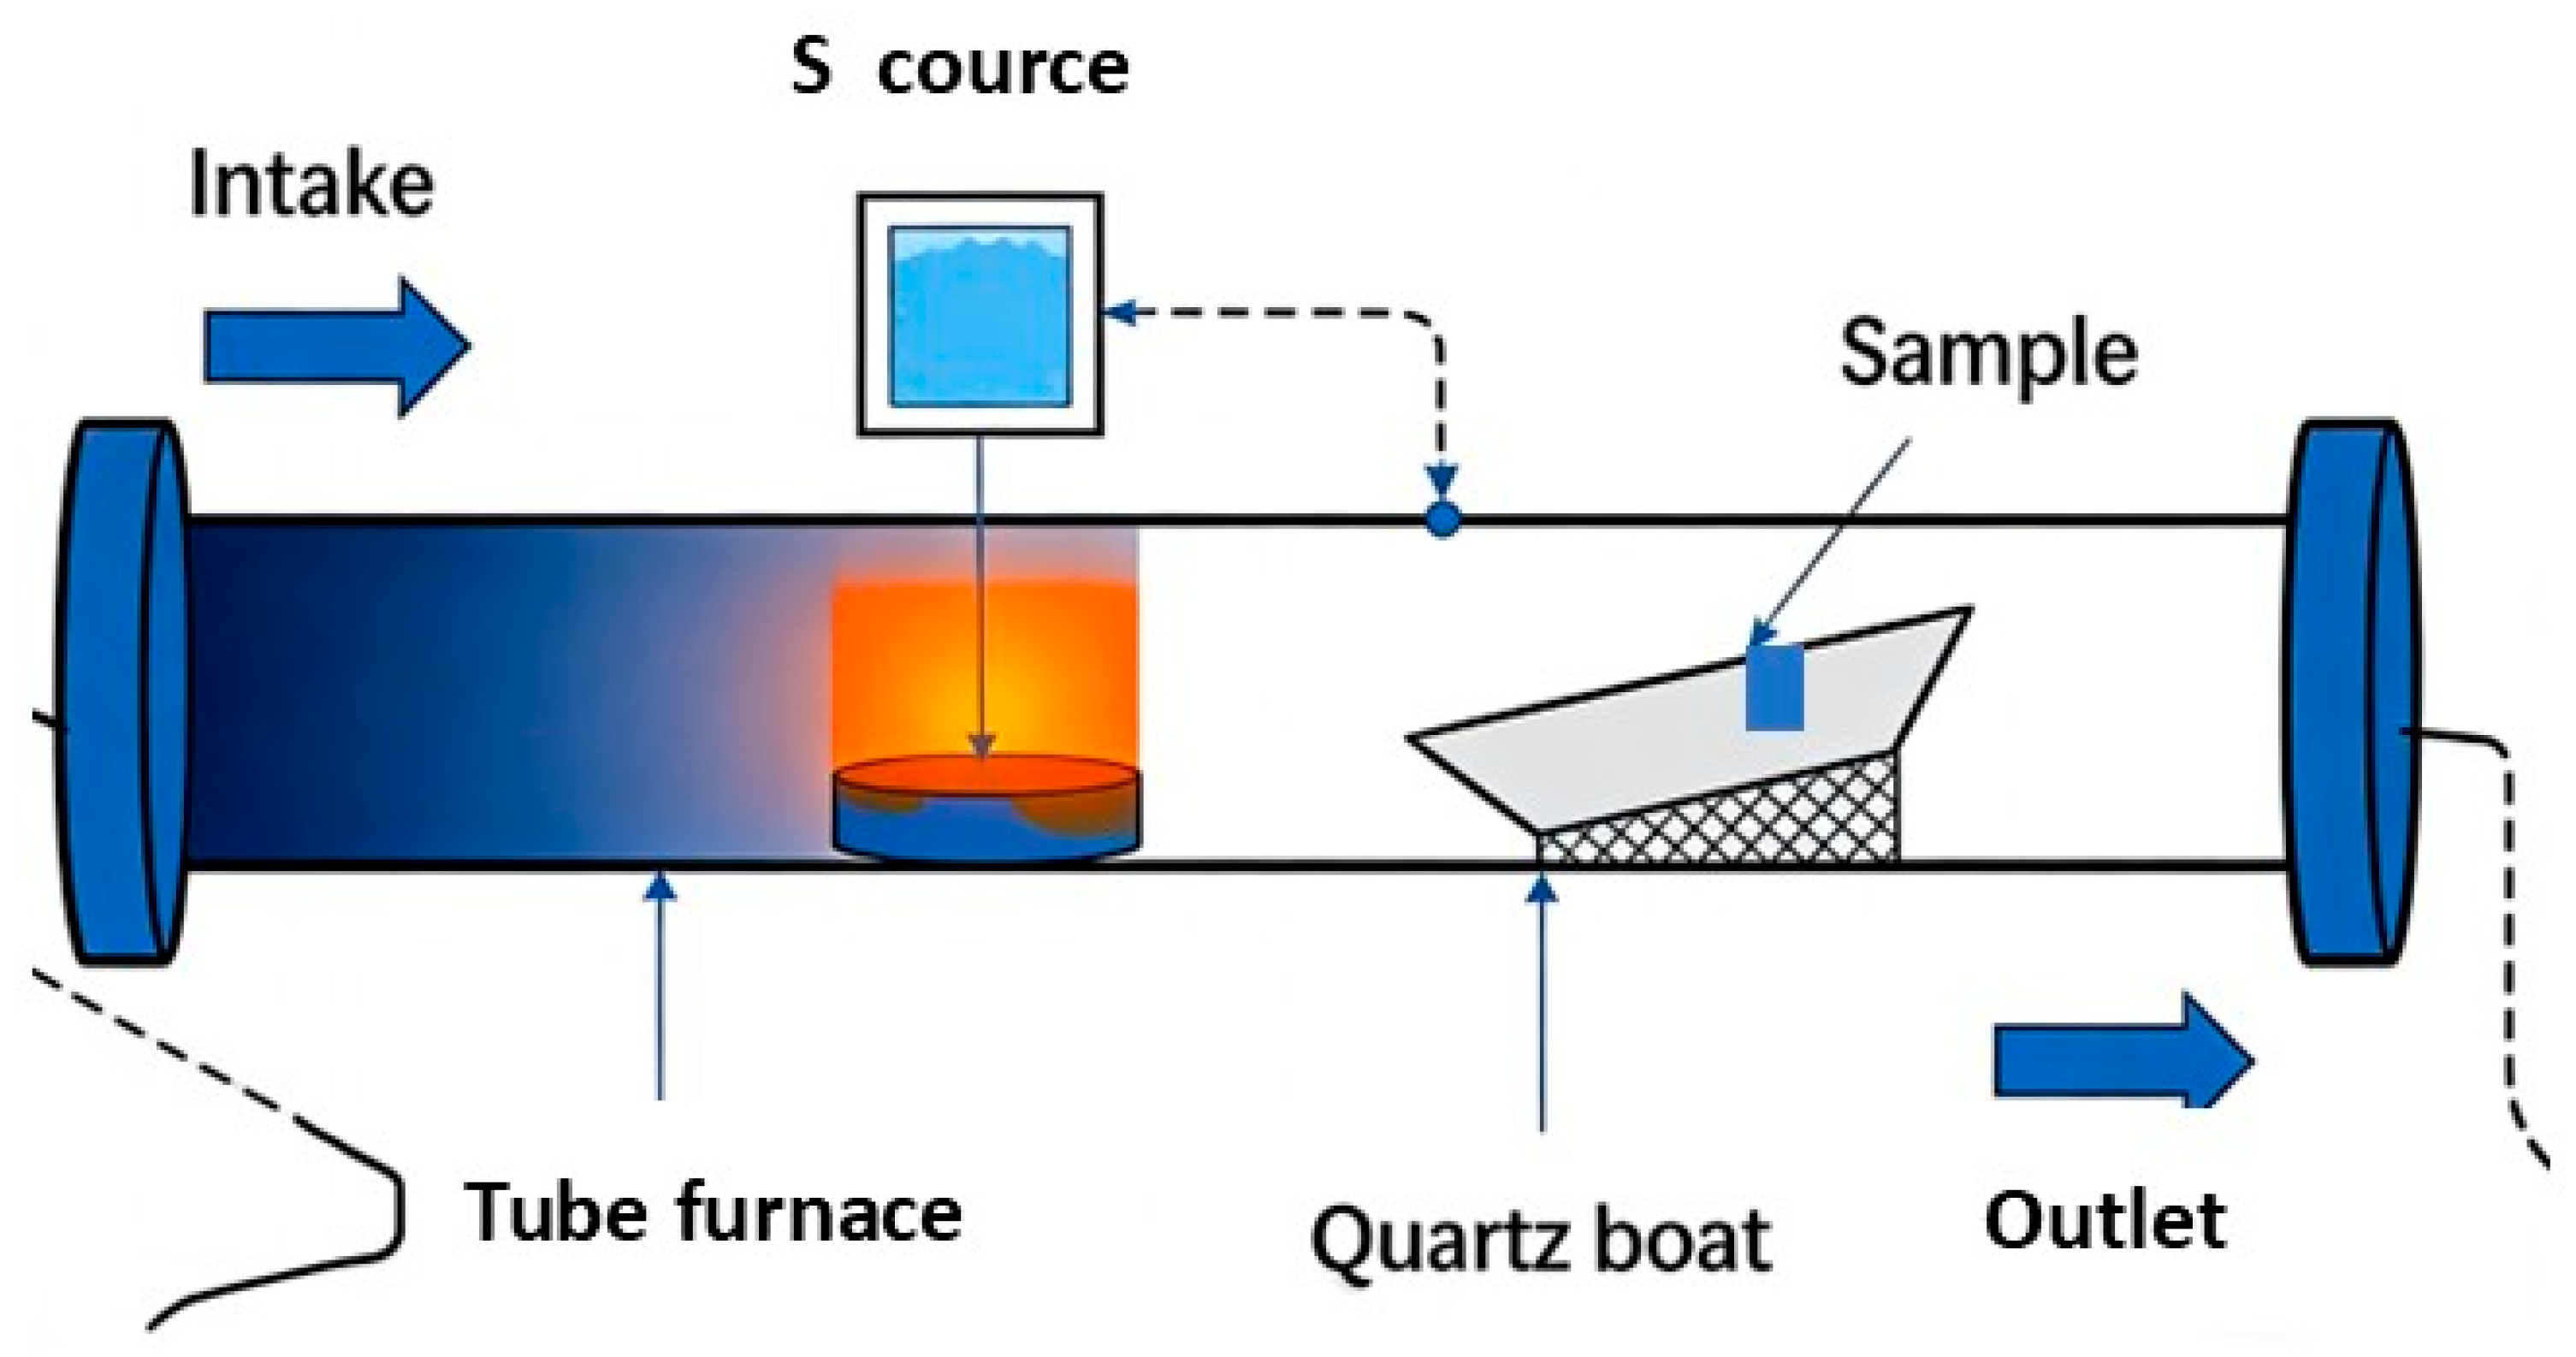
All electrodes were fabricated via a one-step sulfidation process using a chemical vapor deposition (CVD) system, following the detailed procedure below: First, the as-prepared HEA thin-film electrodes, cut into dimensions of 1 cm × 1 cm, were immersed in a 1.0 M hydrochloric acid (HCl) solution for 30 min to remove surface oxides. Subsequently, the electrodes were rinsed alternately with ultrapure water and anhydrous ethanol three times, dried with argon gas, placed in a quartz boat, and then transferred to the central constant-temperature zone of a tube furnace. A total of 0.2 g of sulfur powder was placed upstream of the thin films relative to the carrier gas flow direction, as illustrated in Figure 1. Subsequently, the heating program of the tube furnace was set for target sulfidation temperatures of 250, 350, and 450 °C. The furnace temperature was first raised to 120 °C at a constant heating rate of 10 °C min−1 and held for 30 min to remove residual moisture. Afterward, the temperature was increased to the predetermined sulfidation temperature and maintained for 3 h to allow the sulfidation reaction to proceed completely. After the reaction was completed, the system was allowed to cool naturally to room temperature together with the furnace, while the argon gas flow rate was maintained at a constant value of 60 mL·min−1 during the whole process. Once the furnace temperature dropped to room temperature, the as-prepared samples were taken out and ultrasonically cleaned in a 2 wt% sodium hydroxide (NaOH) solution for 5 min to remove unreacted elemental sulfur residues after sulfidation. The samples were then rinsed repeatedly with ultrapure water and absolute ethanol until the rinse solution reached neutral pH. Finally, the cleaned samples were dried at 60 °C for 2 h in an inert gas atmosphere. The dried samples were directly used for subsequent material characterization and hydrogen evolution reaction (HER) performance tests.
Figure 1.
Schematic Diagram of Sulfidation.
2.2. Electrochemical Performance Testing
All electrochemical measurements in this study were carried out on a CHI660E electrochemical workstation supplied by Chenhua Instrument Co., Ltd., Shanghai, China. A standard three-electrode system was adopted for all tests, with a platinum sheet as the counter electrode and the as-prepared thin-film electrode directly functioning as the working electrode. When performing hydrogen evolution reaction (HER) tests in 0.5 M H2SO4, a saturated calomel electrode (SCE) was used as the reference electrode. A mercury/mercury oxide (Hg/HgO) electrode was selected as the reference electrode in 1.0 M KOH electrolyte. For 0.5 M NaCl + 1 M KOH and 1 M Na2S + 1 M KOH mixed electrolytes, a silver/silver chloride (Ag/AgCl) electrode was applied as the reference electrode. All potentials acquired from electrochemical tests were converted to values versus the reversible RHE by the equation below [23].
E (RHE) = E (SCE) + 0.241 + 0.0592 pH
E (RHE) = E (Hg/HgO) + 0.098 + 0.0592 pH
E (RHE) = E (Ag/AgCl) + 0.197 + 0.0592 pH
Linear Sweep Voltammetry (LSV) Measurements: To evaluate the hydrogen evolution reaction (HER) performance of the prepared materials, LSV measurements were conducted at a constant scan rate of 10 mV s−1. The Tafel slopes derived from the obtained LSV curves enabled the determination of the hydrogen evolution rate and the underlying HER mechanism of the materials.
Electrochemical Active Surface Area (ECSA) Measurements: The electrochemical active surface area of the electrodes could be determined via cyclic voltammetry (CV) measurements, following the procedure described below: First, the as-prepared thin-film electrodes were subjected to CV scanning within a potential window of ±0.05 V relative to the open-circuit potential (OCP), with scan rates ranging from 2 to 50 mV s−1 (the specific scan rates employed were 5, 10, 20, 30, and 40 mV s−1). To ensure the stability of the CV curves, the number of scan cycles was set to 6 in this study. Subsequently, a plot was constructed where the y-axis represented half the difference in current density between the anodic and cathodic scans at the OCP, and the x-axis represented the scan rate. The slope obtained from linear fitting of this plot corresponded to the double-layer capacitance (Cdl) of the measured thin-film electrodes. The value of Cdl is proportional to the electrochemical active surface area (ECSA) of the electrodes.
Electrochemical Impedance Spectroscopy (EIS) Measurements: EIS measurements of the as-prepared electrodes were conducted under the overpotential condition at the OCP. The test frequency range spanned from 100 kHz to 10 mHz, and the amplitude of the AC signal was uniformly set to 5 mV. The corresponding impedance spectra were acquired using the electrochemical workstation, followed by fitting and analysis with the ZView 3.5 software.
2.3. Characterization
XRD analysis of the sample powders was performed using an X-ray diffractometer (Model: Dmax 2500VB, Rigaku Corporation, Akishima, Tokyo, Japan) equipped with Cu Kα radiation (λ = 1.541 Å). The morphology of the samples was characterized by a scanning electron microscope (SEM model: JSM-5600LV, JEOL Ltd., Akishima, Tokyo, Japan). Sulfided FeCoNiMoCu high-entropy alloy thin film samples with a size of 5 mm × 5 mm were cut using a blade to ensure that the sample surface had no obvious damage. The sampled samples were placed in a vacuum drying oven, dried at a set temperature of 60 °C for 2 h, and then naturally cooled to room temperature after drying. The dried samples were fixed on an SEM sample stage and sputter-coated with gold using an ion sputter coater, with the sputtering current set to 15 mA, sputtering time set to 60 s, and the gold coating thickness controlled at 5–10 nm to ensure a uniform conductive layer was formed on the sample surface. During the test, the magnification was adjusted according to the sample morphology to obtain clear micro-morphology images. The elemental composition of the samples was analyzed using a scanning electron microscope equipped with an energy-dispersive X-ray spectroscopy (EDS) detector (Model: AMICUS, Kratos Analytical (a Shimadzu Group Company), Manchester, UK).
3. Results and Discussion
3.1. Characterization of the FeCoNiMoCu High-Entropy Alloy
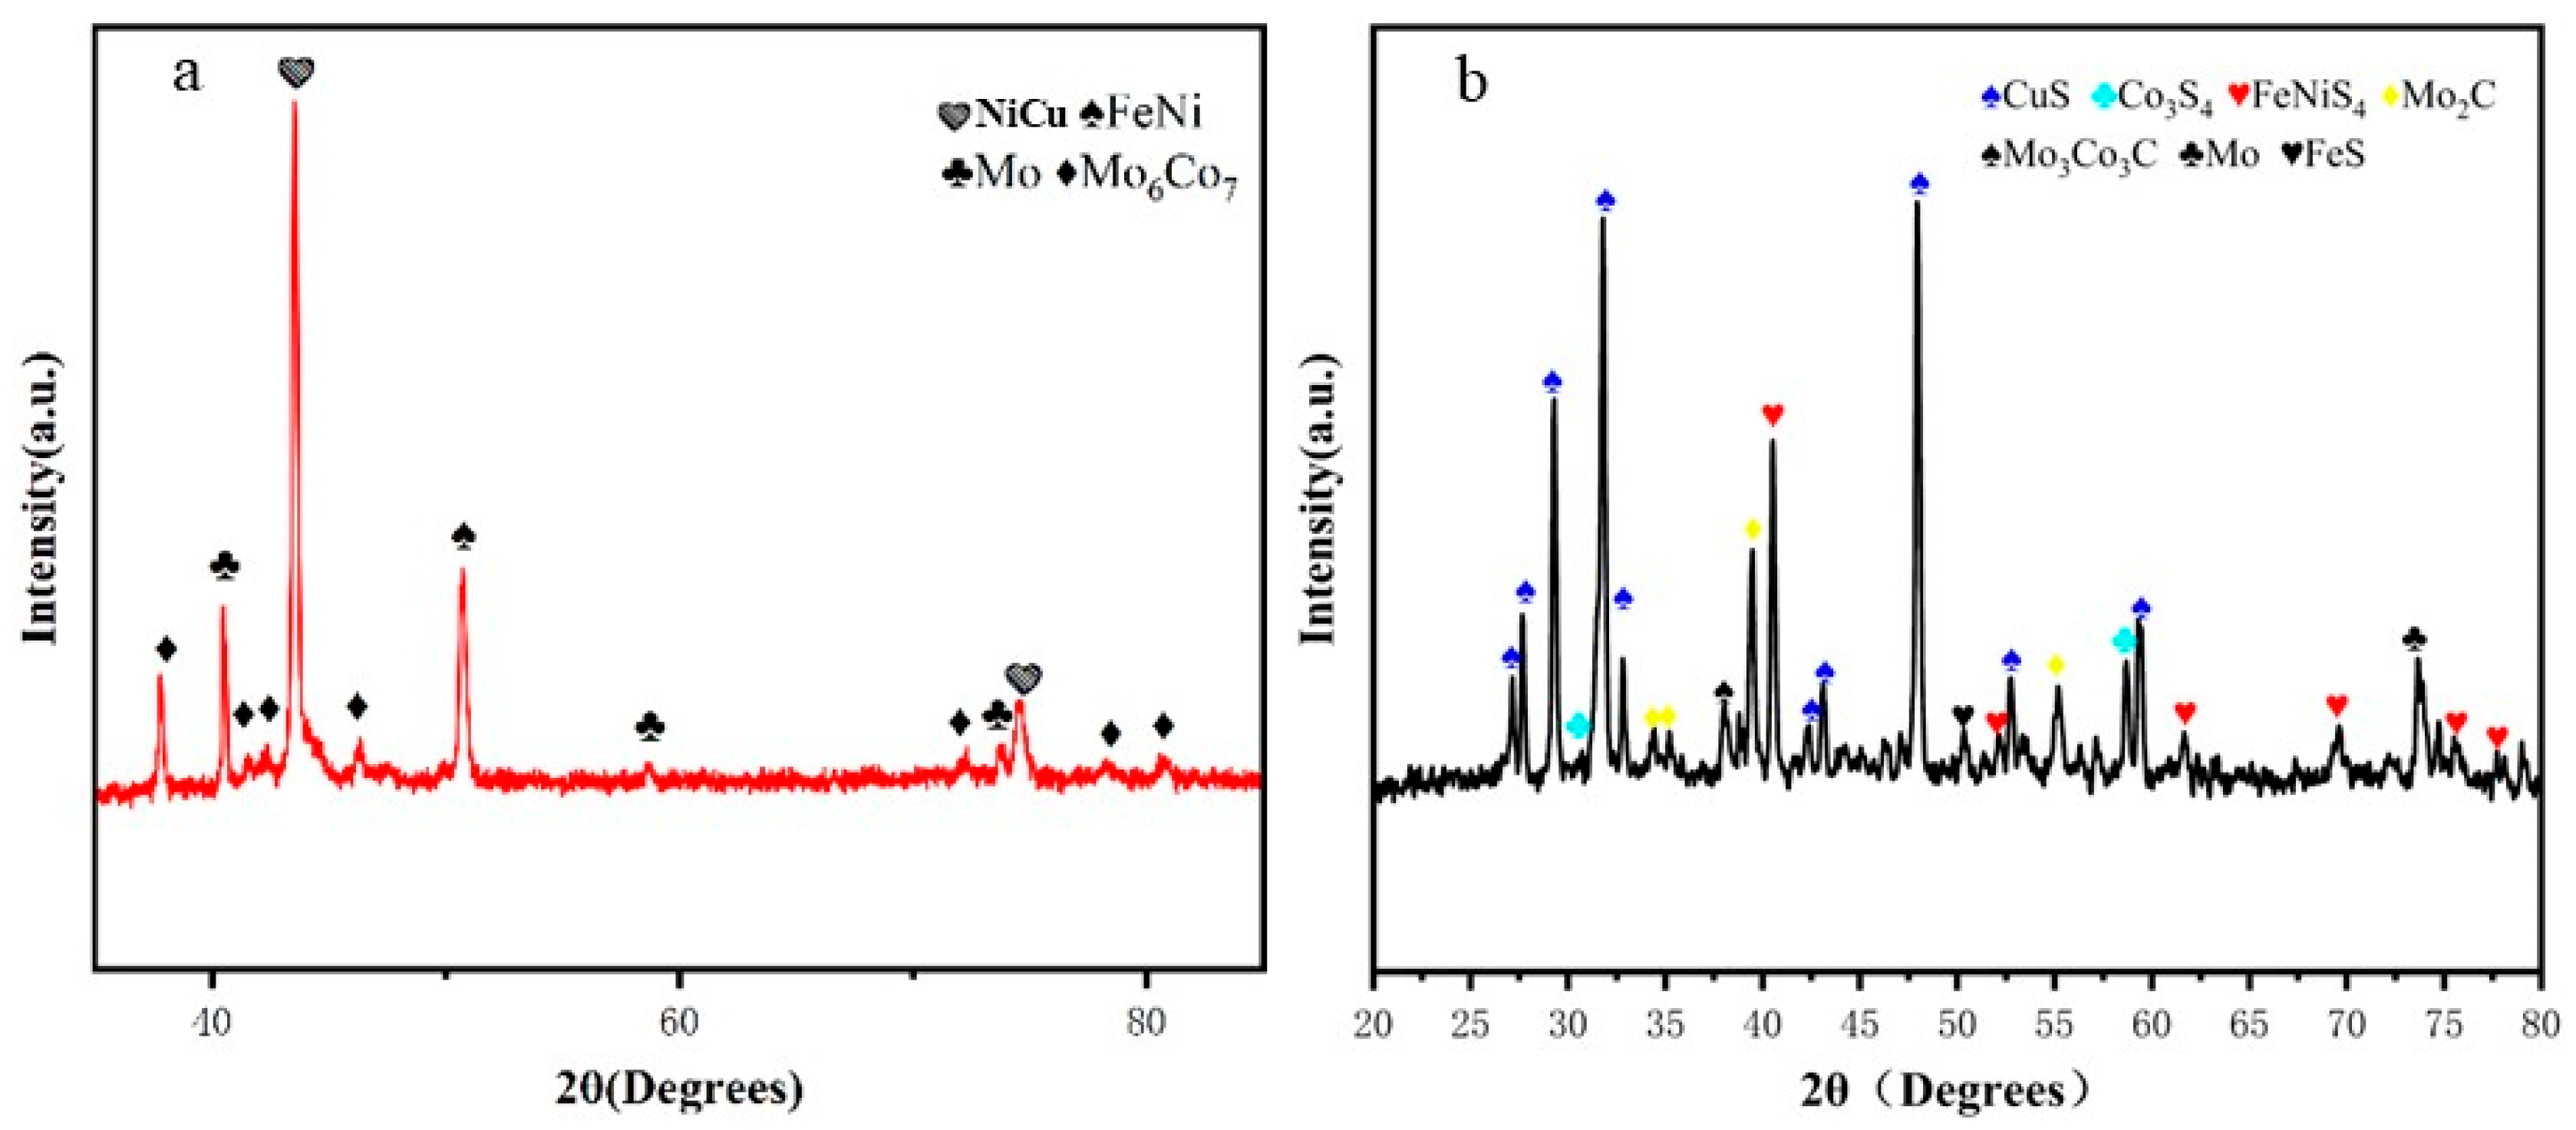
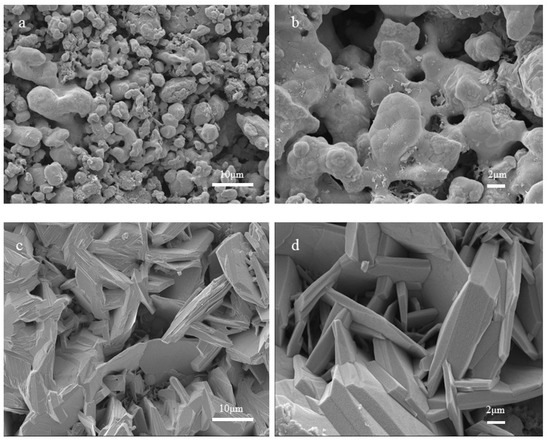
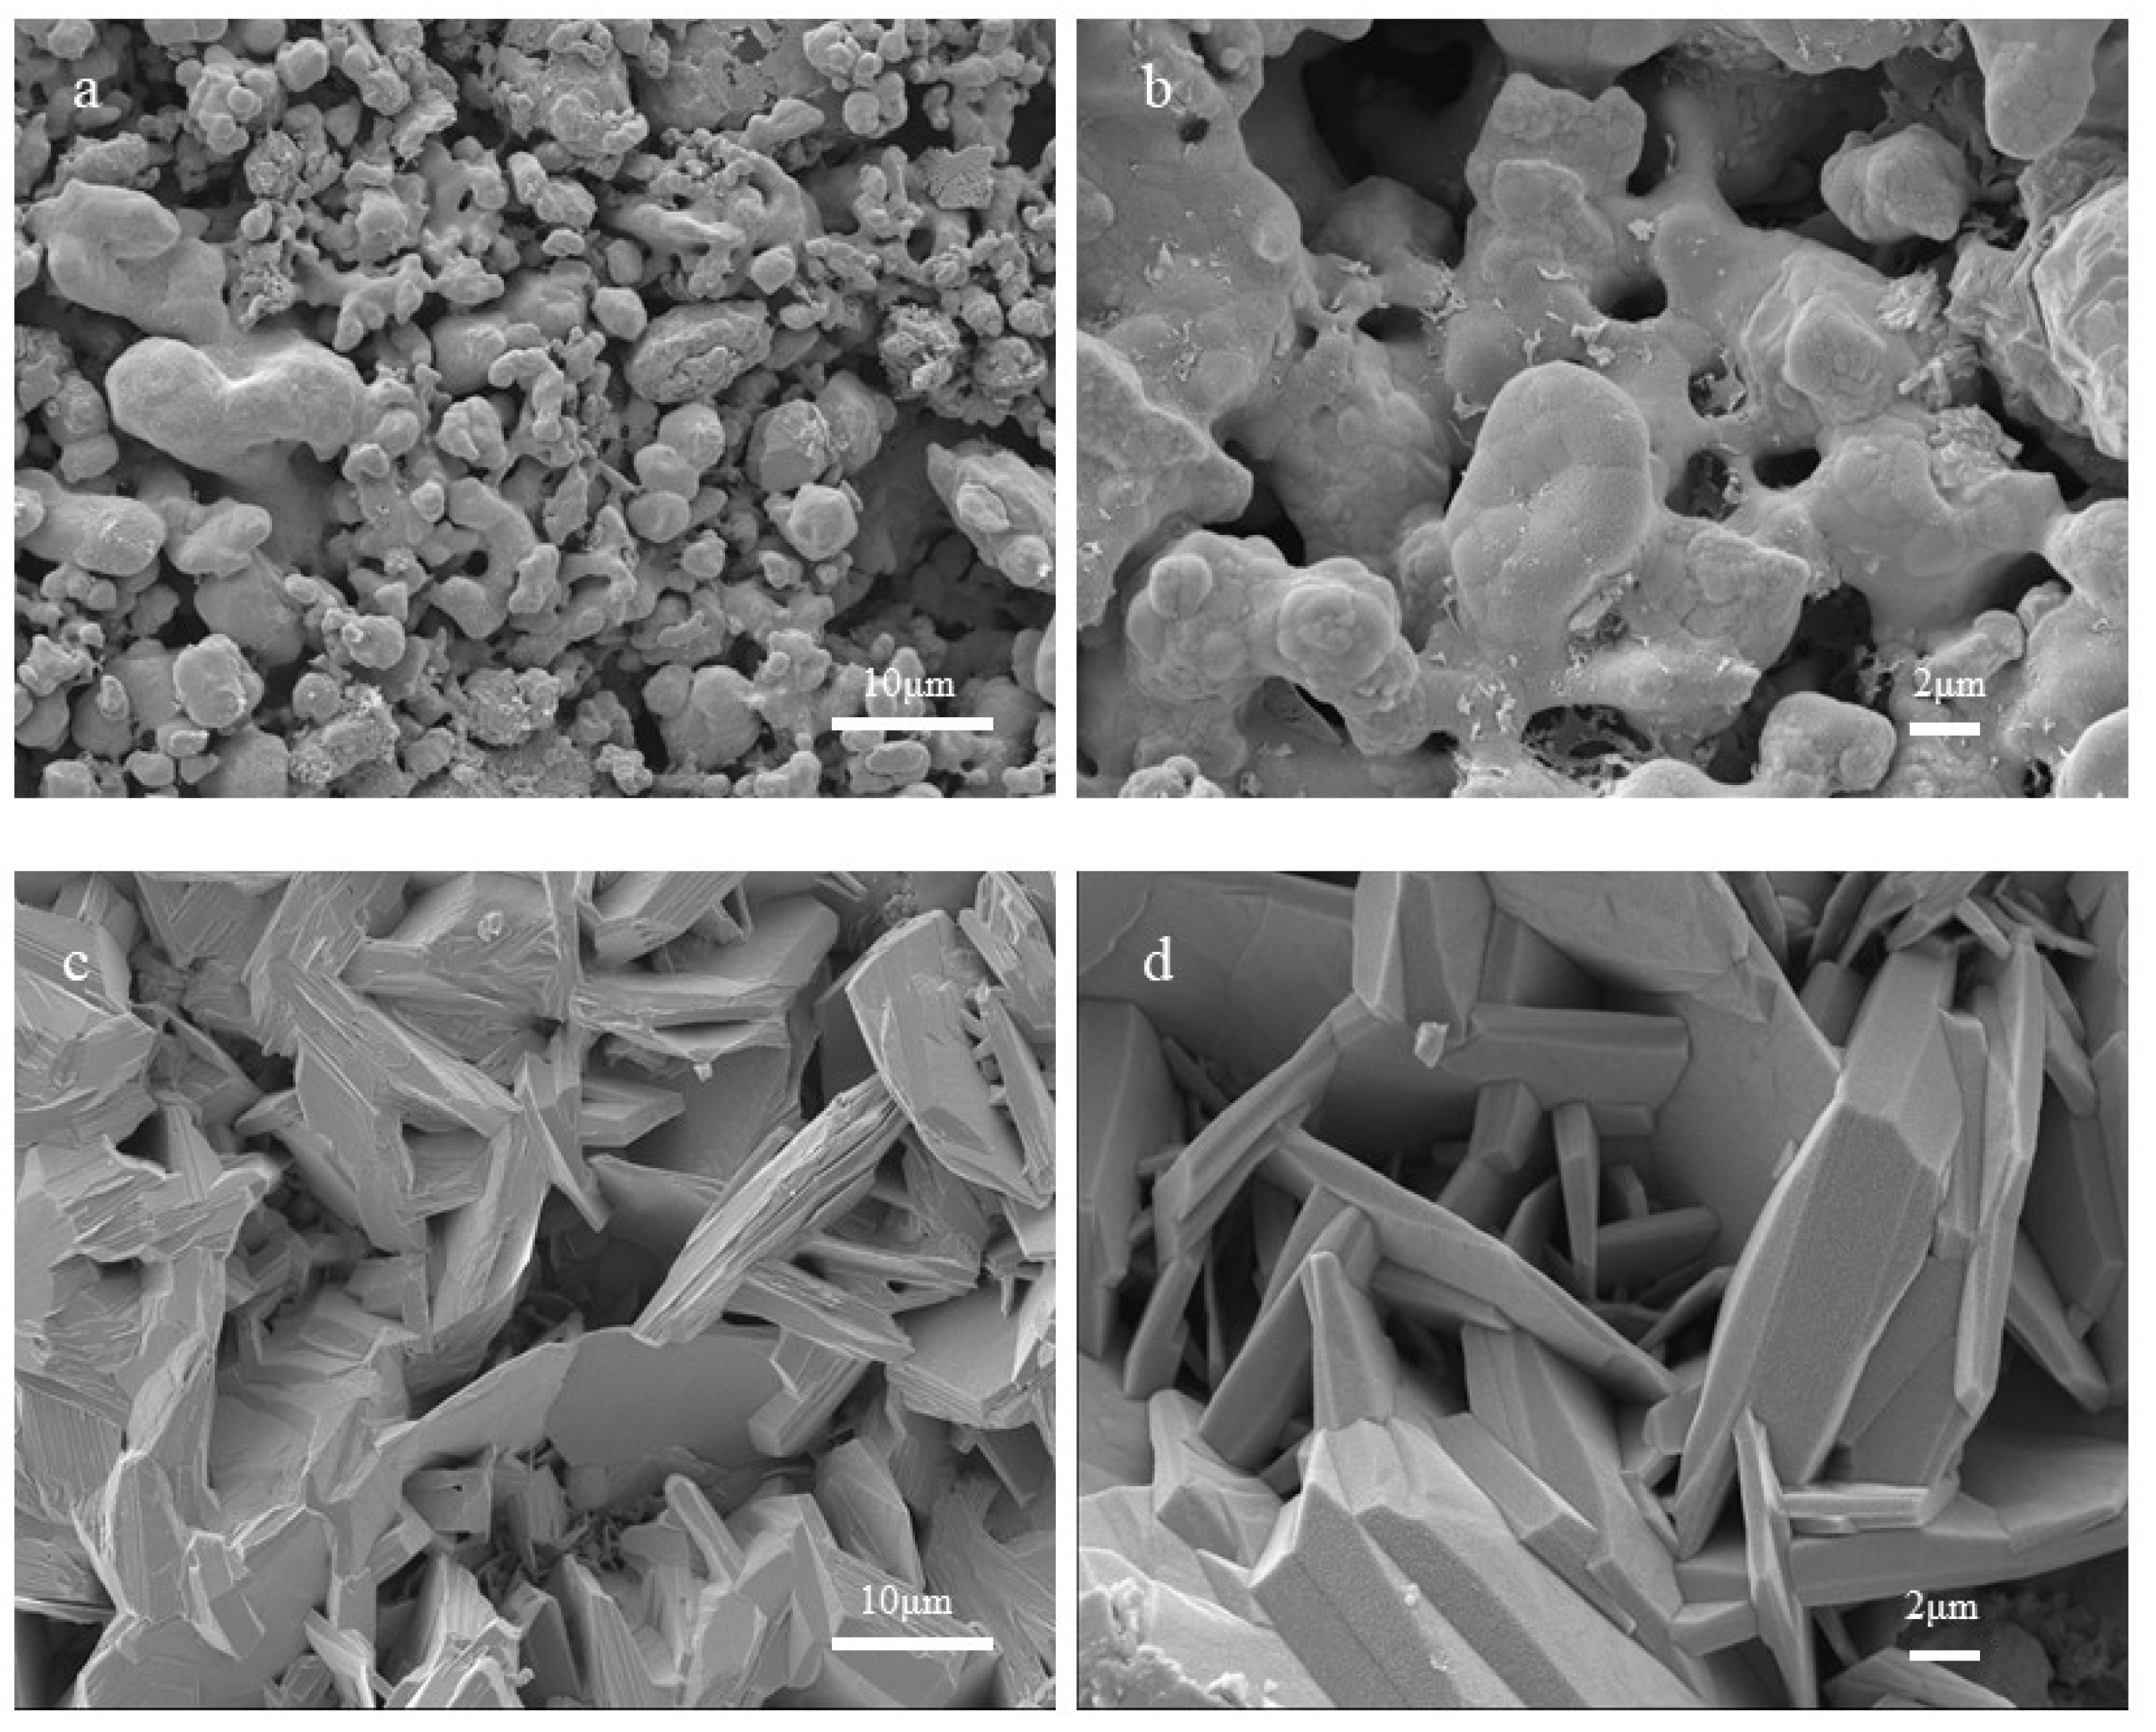
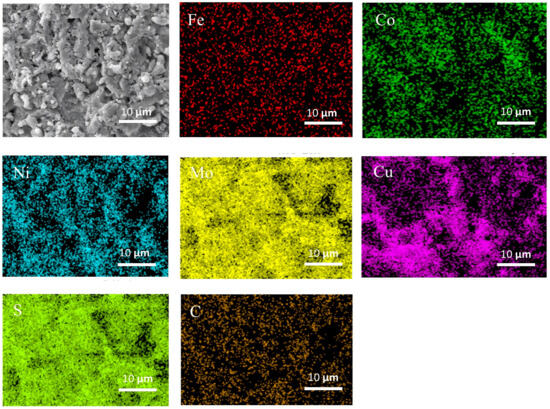
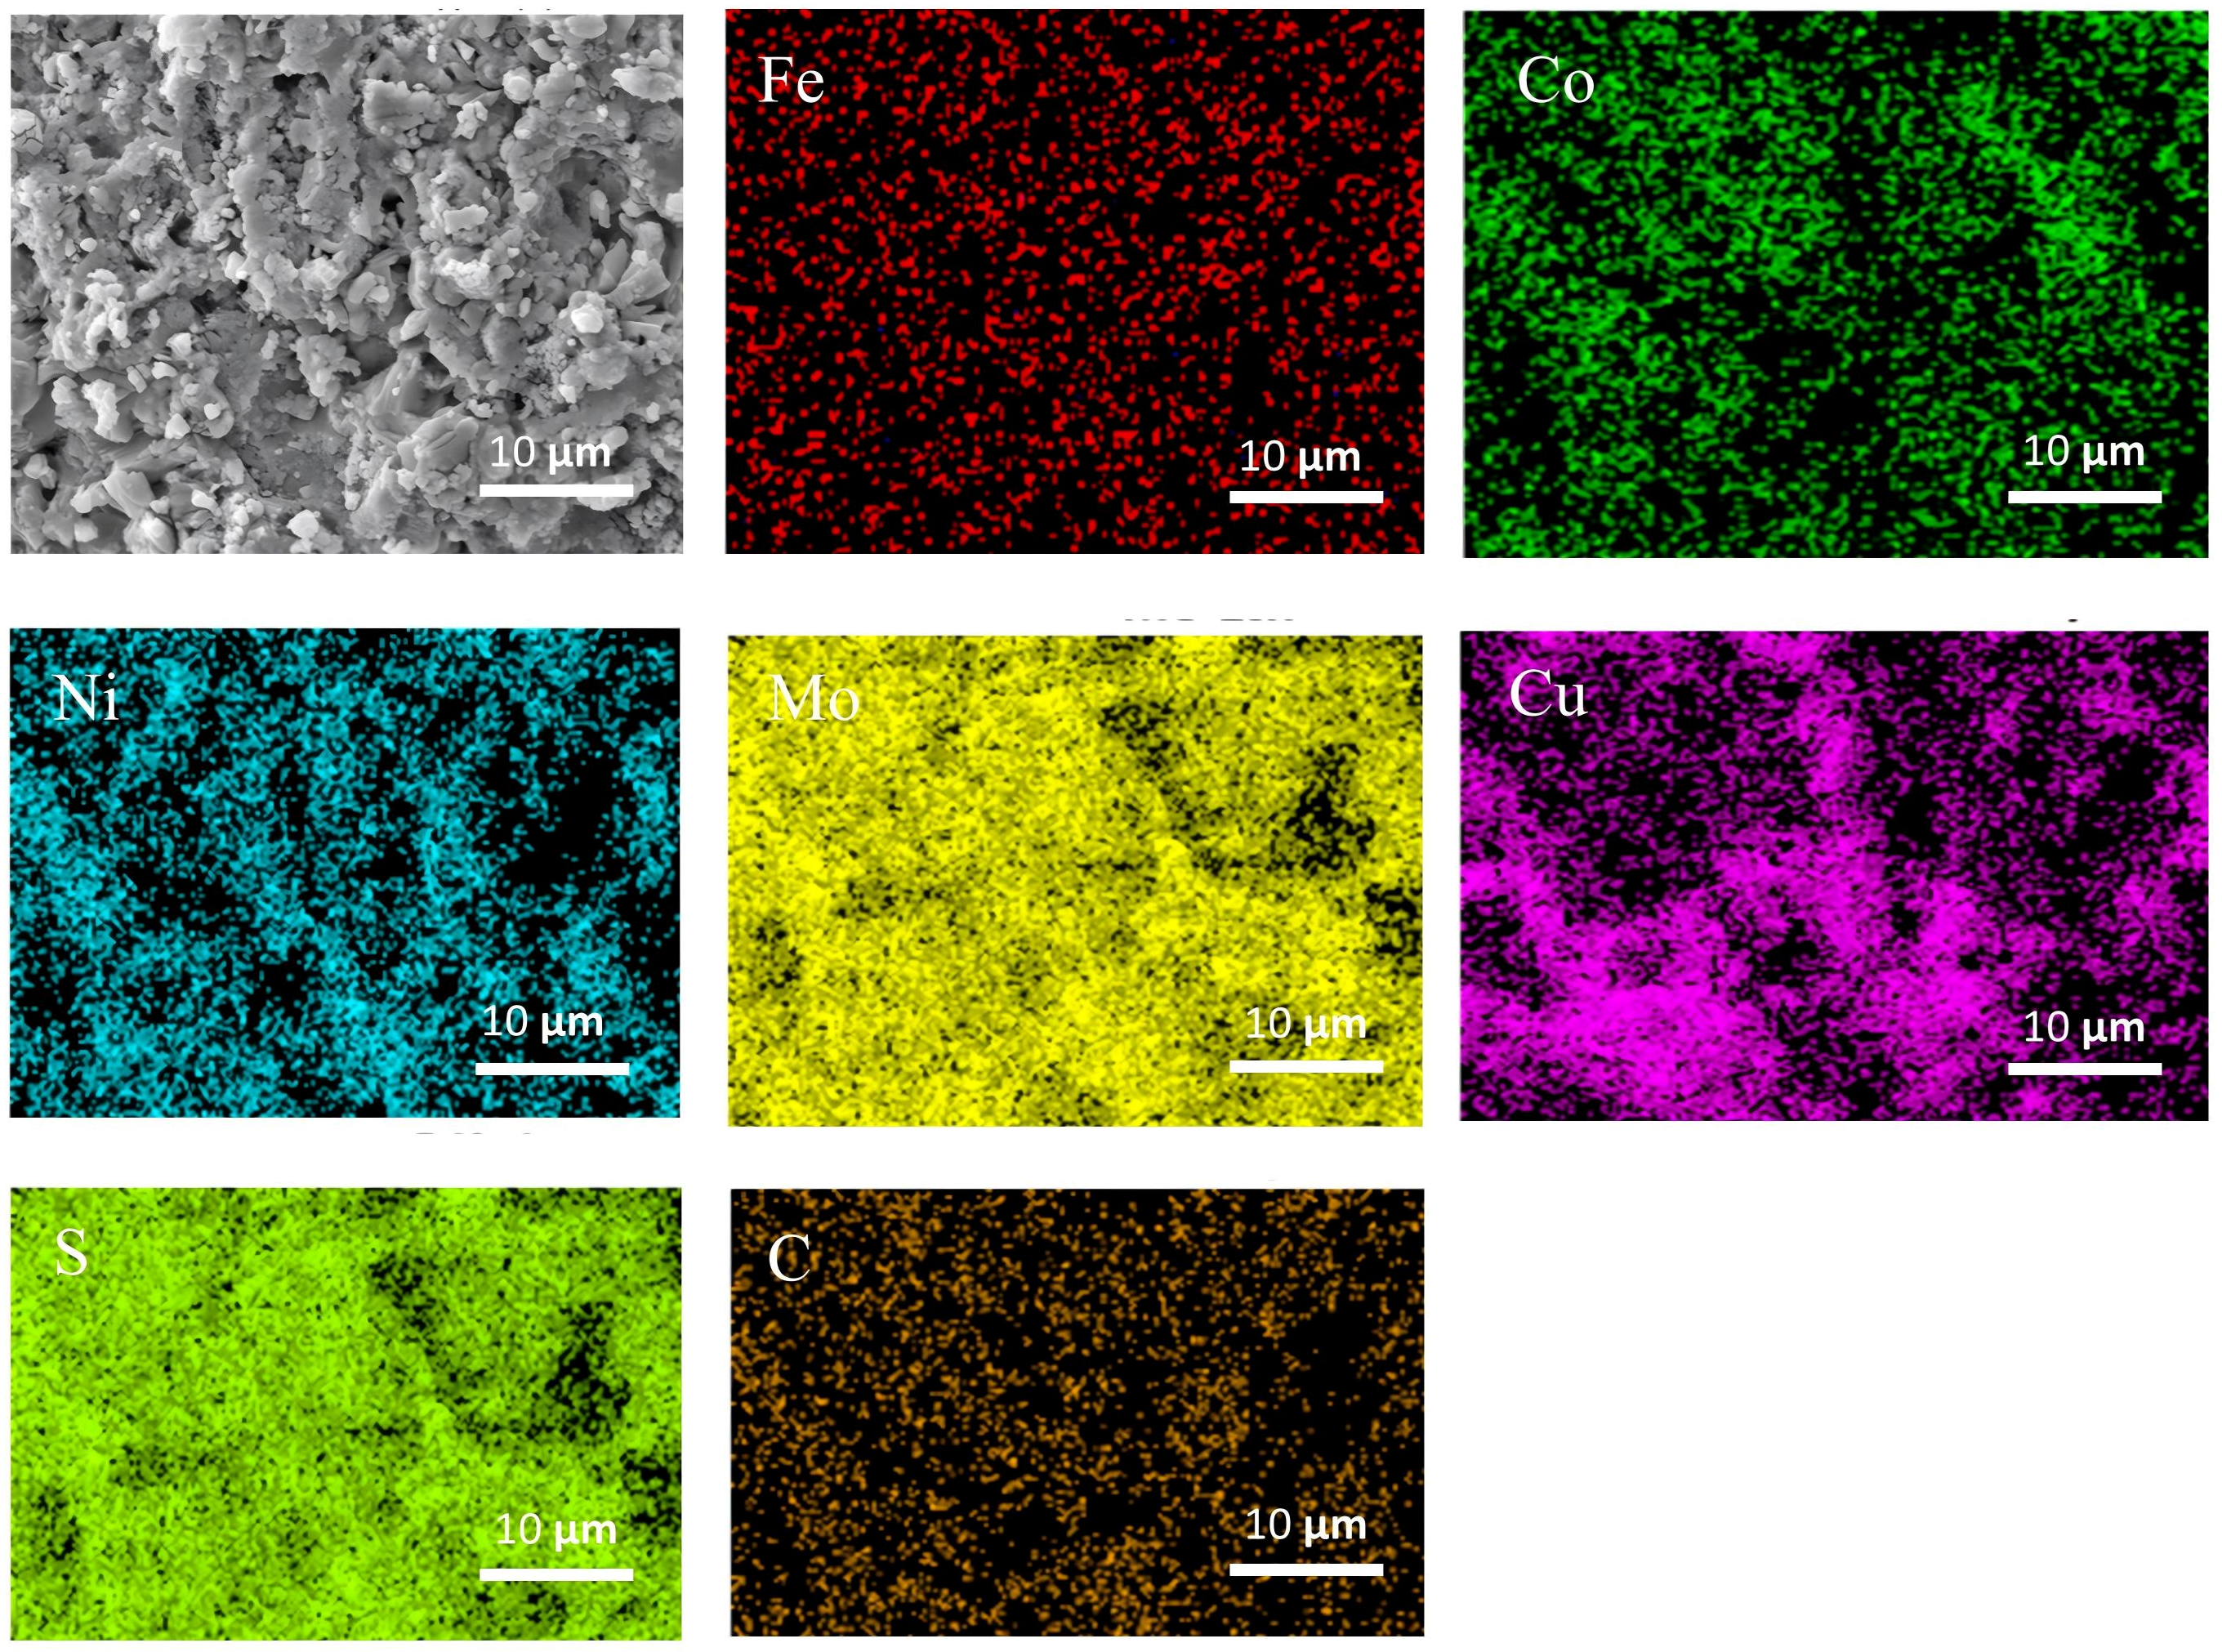
Figure 2 presents the XRD patterns of the FeCoNiMoCu high-entropy alloy (HEA), where Figure 2a shows the XRD pattern of HEA alloy before sulfidation and Figure 2b displays that after sulfidation. As illustrated in Figure 2a, besides elemental Mo, the alloy system also contains the Mo6Co7 intermetallic compound [24]. Figure 2b shows that a series of transition metal sulfides are formed after sulfidation, indicating the presence of sulfides on the alloy surface. Figure 3 shows the SEM images of the FeCoNiMoCu HEA samples before and after sulfidation. Specifically, Figure 3a,b correspond to the SEM images of the as-prepared alloy prior to sulfidation, while Figure 3c,d represent those after sulfidation. Figure 3a,b clearly exhibit a well-defined three-dimensional (3D) porous structure with uniformly distributed particles and abundant pores. The pristine sample exhibits an integrated porous structure with uniformly dispersed voids across its morphology. The particles are tightly interconnected, and the pore sizes range from the nanometer to micrometer scale, presenting diverse shapes with complex geometric characteristics. In contrast to the relatively dense and smooth surface of the pristine sample, the sulfidated HEA (Figure 3c,d) displays a large number of irregular flake-like structures stacked in a 3D manner on its surface, with edges showing serrated fractal features. This morphological transformation may be associated with the thermal decomposition reaction between the metal precursors and the sulfur source during the high-temperature sulfidation process. The phase analysis from the XRD pattern in Figure 2b further corroborates that this structure corresponds to the typical layered crystal growth mode of transition metal sulfides (e.g., CuS, NiS, MoS2). Figure 4 displays the elemental mapping images EDS of the sulfidated FeCoNiMoCu HEA, confirming the presence of six elements, namely Fe, Co, Ni, Mo, Cu, and S, in the product. No obvious elemental segregation or enrichment regions are observed in the scanning images, which verifies the homogeneous distribution of all elements within the alloy.
Figure 2.
(a) XRD Pattern of FeCoNiMoCu HEA Before Sulfidation; (b) XRD Pattern of FeCoNiMoCu HEA After Sulfidation.
Figure 3.
SEM Images of the FeCoNiMoCu High-Entropy Alloy (HEA) Before and After Sulfidation: (a,b) Before Sulfidation, (c,d) After Sulfidation.
Figure 4.
EDS Elemental Mapping Images of the FeCoNiMoCu HEA.
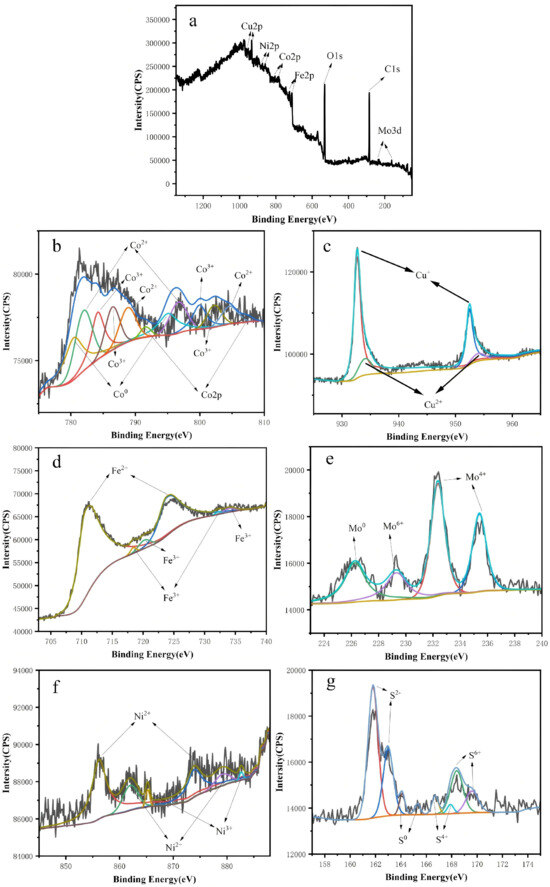
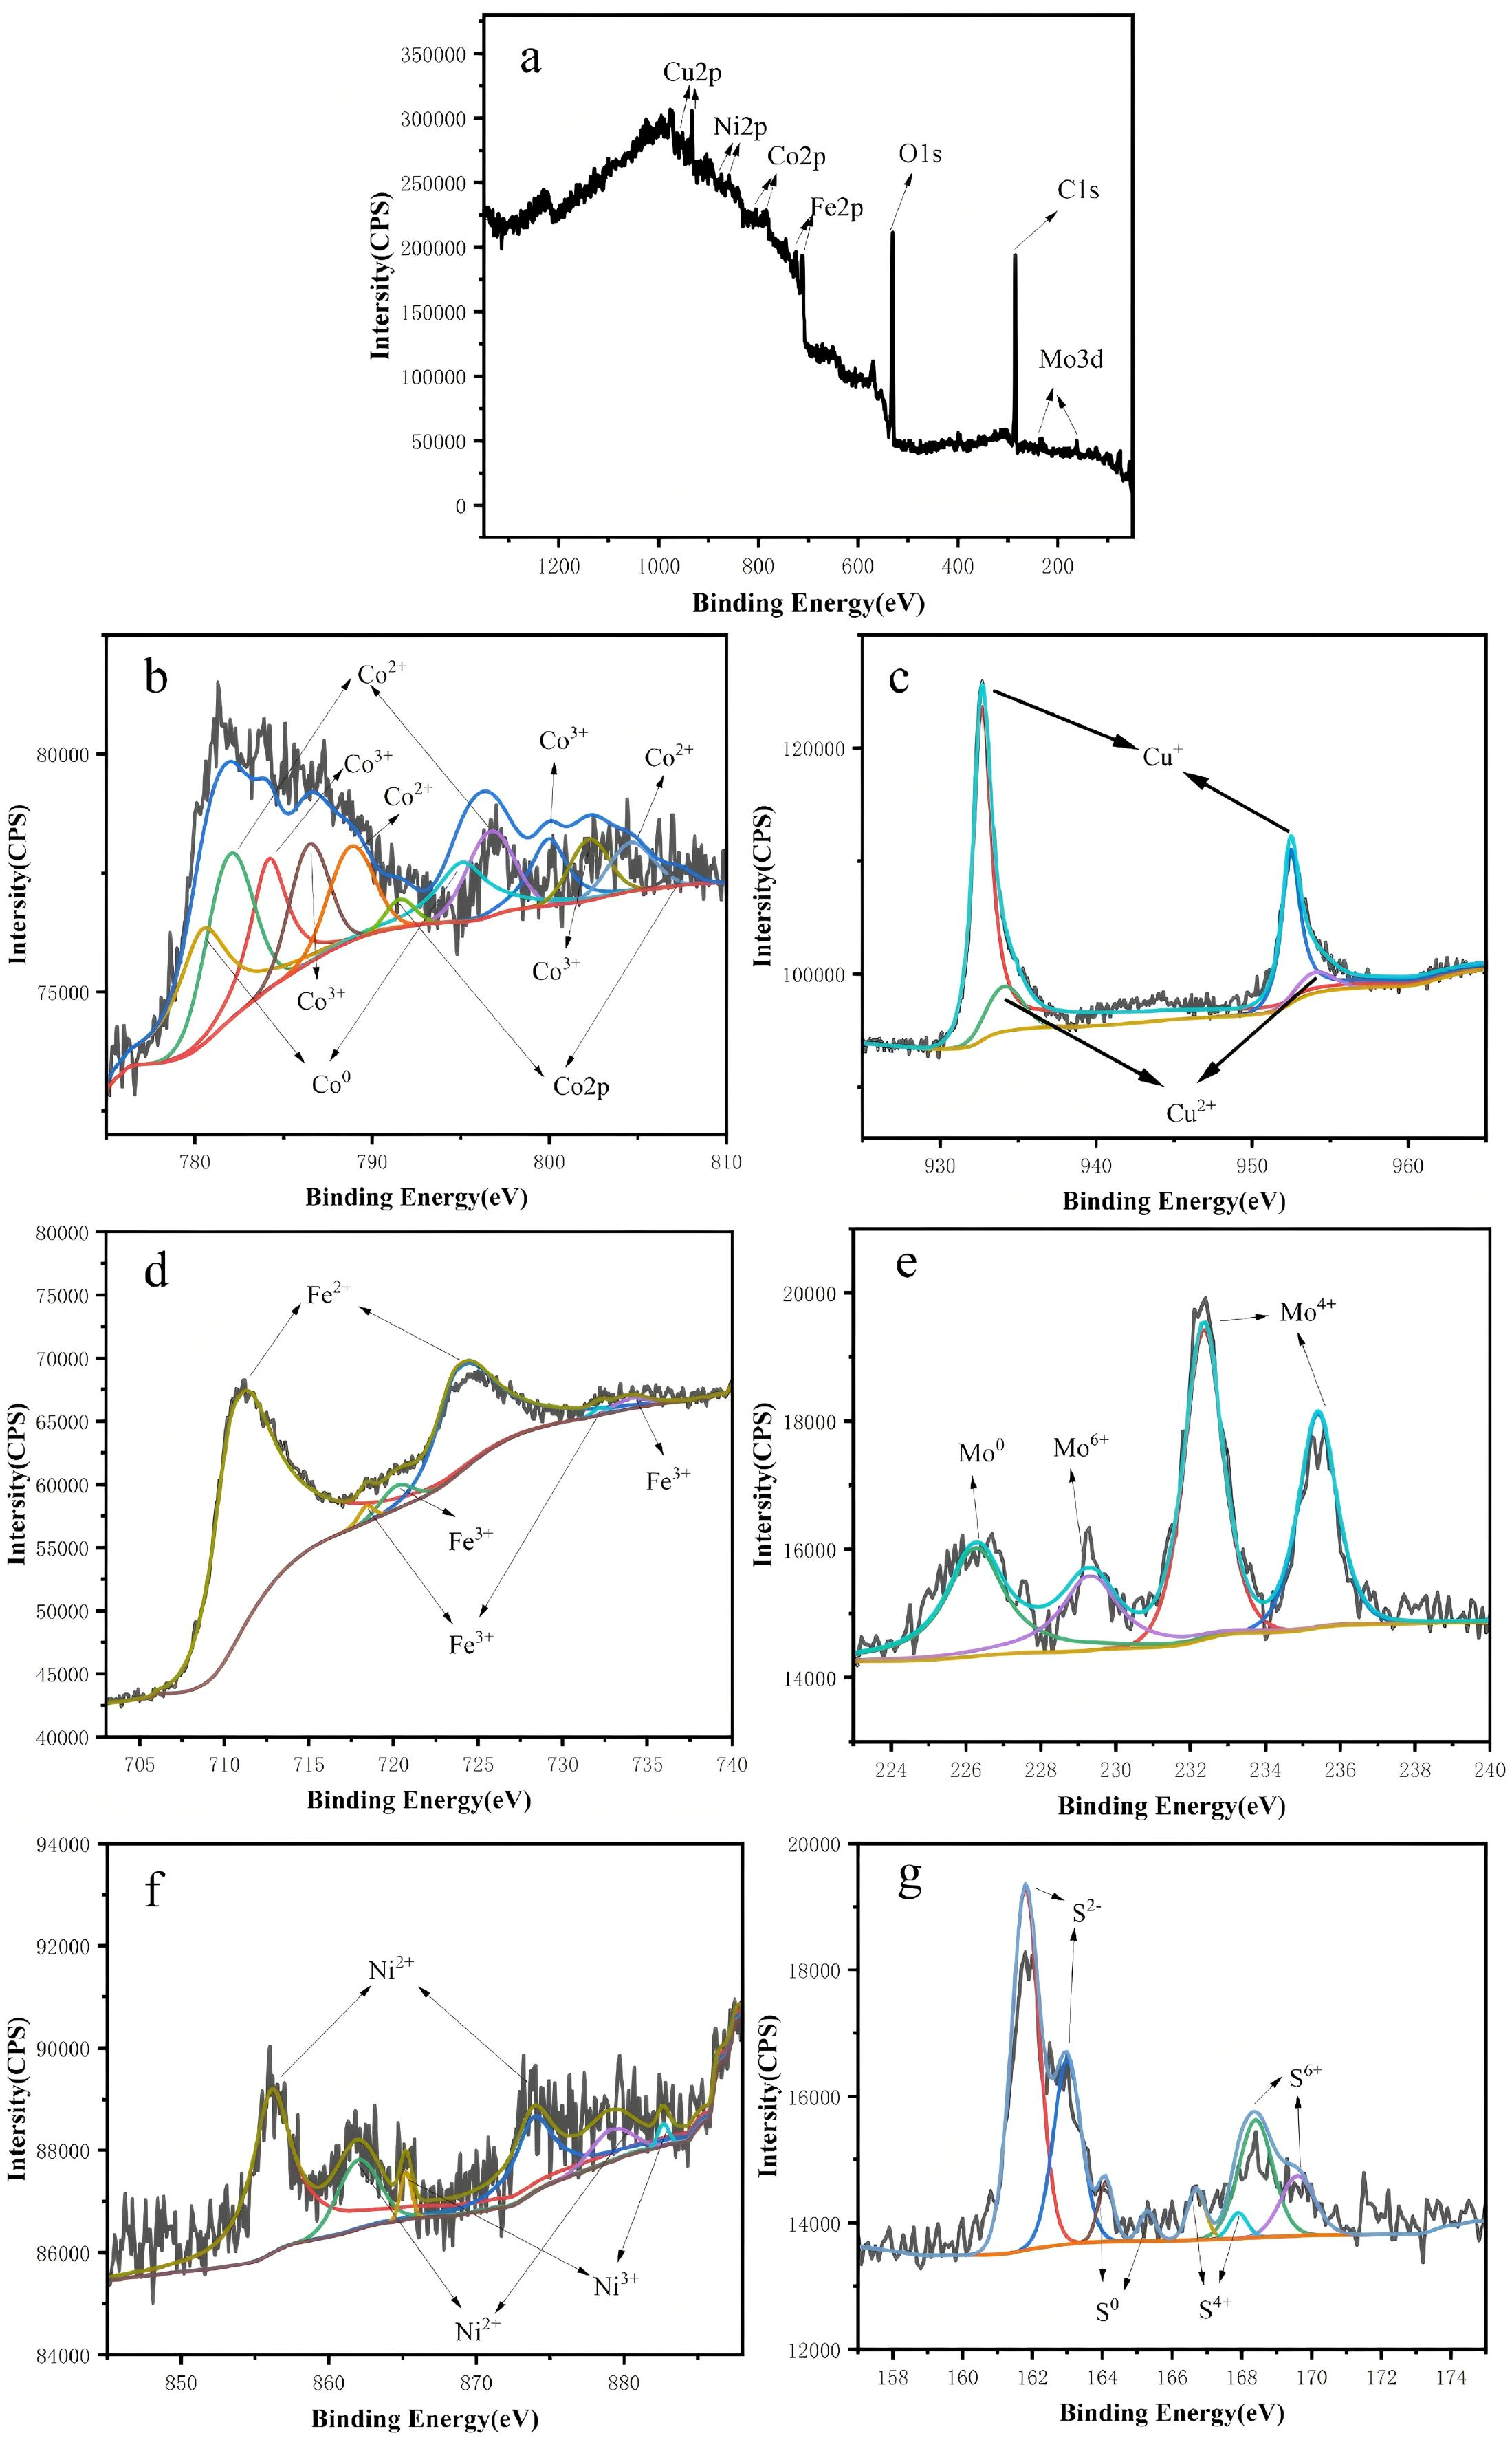
Figure 5a displays the survey spectrum of the sulfidated FeCoNiMoCu high-entropy alloy (HEA), confirming the presence of Fe, Mo, Ni, Cu, Co, and S elements on the surface, which is consistent with the results obtained from energy-dispersive X-ray spectroscopy (EDS) characterization. Figure 5b presents the Co 2p spectrum, with peaks corresponding to Co3+ (oxidized state), Co2+ (sulfide state), Co0 (metallic state), along with the presence of satellite peaks. This indicates the existence of surface oxides (Co2O3) in the sample, where the sulfide species is identified as CoS, and the metallic state originates from the unreacted Co elements in the HEA. Figure 5c shows the fitted Cu 2p spectrum, with peaks assigned to Cu+ (sulfide state) and Cu2+ (oxidized state). After sulfidation, Cu primarily exists as Cu+ in the form of Cu2S, with minor oxidation observed on the sample surface. Figure 5d illustrates the fitted Fe 2p spectrum, where two main peaks at 711.2 eV and 724.2 eV correspond to Fe2+, representing the dominant chemical state of Fe after sulfidation treatment. Additional peaks at 720.3 eV and 734.2 eV are attributed to the Fe 2p3/2 and Fe 2p1/2 core levels of Fe3+, which are associated with the surface oxidation product Fe2O3. This confirms the presence of slight oxidation on the sulfidated sample surface, accompanied by satellite peaks at 718.4 eV and 732 eV. In Figure 5e, the peaks correspond to Mo 3d, with chemical states including Mo4+ (sulfide state), Mo6+ (oxidized state), and Mo0 (metallic state). The peaks at 232.4 eV and 235.4 eV are assigned to sulfidation products such as MoS2 [20], while the peak at 226.1 eV corresponds to Mo 3d5/2, originating from unreacted Mo in the alloy. The peak at 229.3 eV is attributed to the oxidized state of Mo, further indicating minor surface oxidation of the sample. Figure 5f shows the Ni 2p spectrum, with peaks corresponding to Ni2+, Ni3+ (oxidized state), and satellite peaks associated with Ni2+. The main sulfidation products of the HEA are identified as NiS and Ni3S2, and similar to other elements, slight oxidation is observed on the sample surface. Figure 5g presents the fitted S 2p spectrum, with peaks assigned to S2− (sulfide state), S6+, S4+, and S0/S22−. After sulfidation, various sulfides formed by the reaction between sulfur and the HEA are generated on the sample surface, with S2− being the dominant chemical state. The peaks corresponding to S6+ and S4+ are associated with surface oxides and intermediate products from the oxidation of S2− to S6+, which are present in low contents. The peaks for S0/S22− correspond to elemental sulfur or polysulfides, which are incomplete products of the sulfidation reaction.
Figure 5.
XPS Spectra of FeCoNiMoCu HEA: (a) Survey Spectrum; (b) Co 2p; (c) Cu 2p; (d) Fe 2p; (e) Mo 3d; (f) Ni 2p; (g) S 2p.
3.2. Hydrogen Evolution of Transition Metal Sulfide Electrodes in Acidic Solution
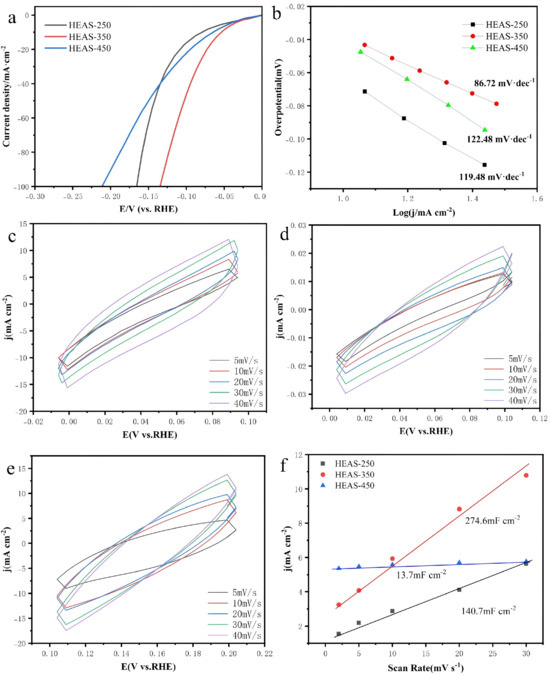
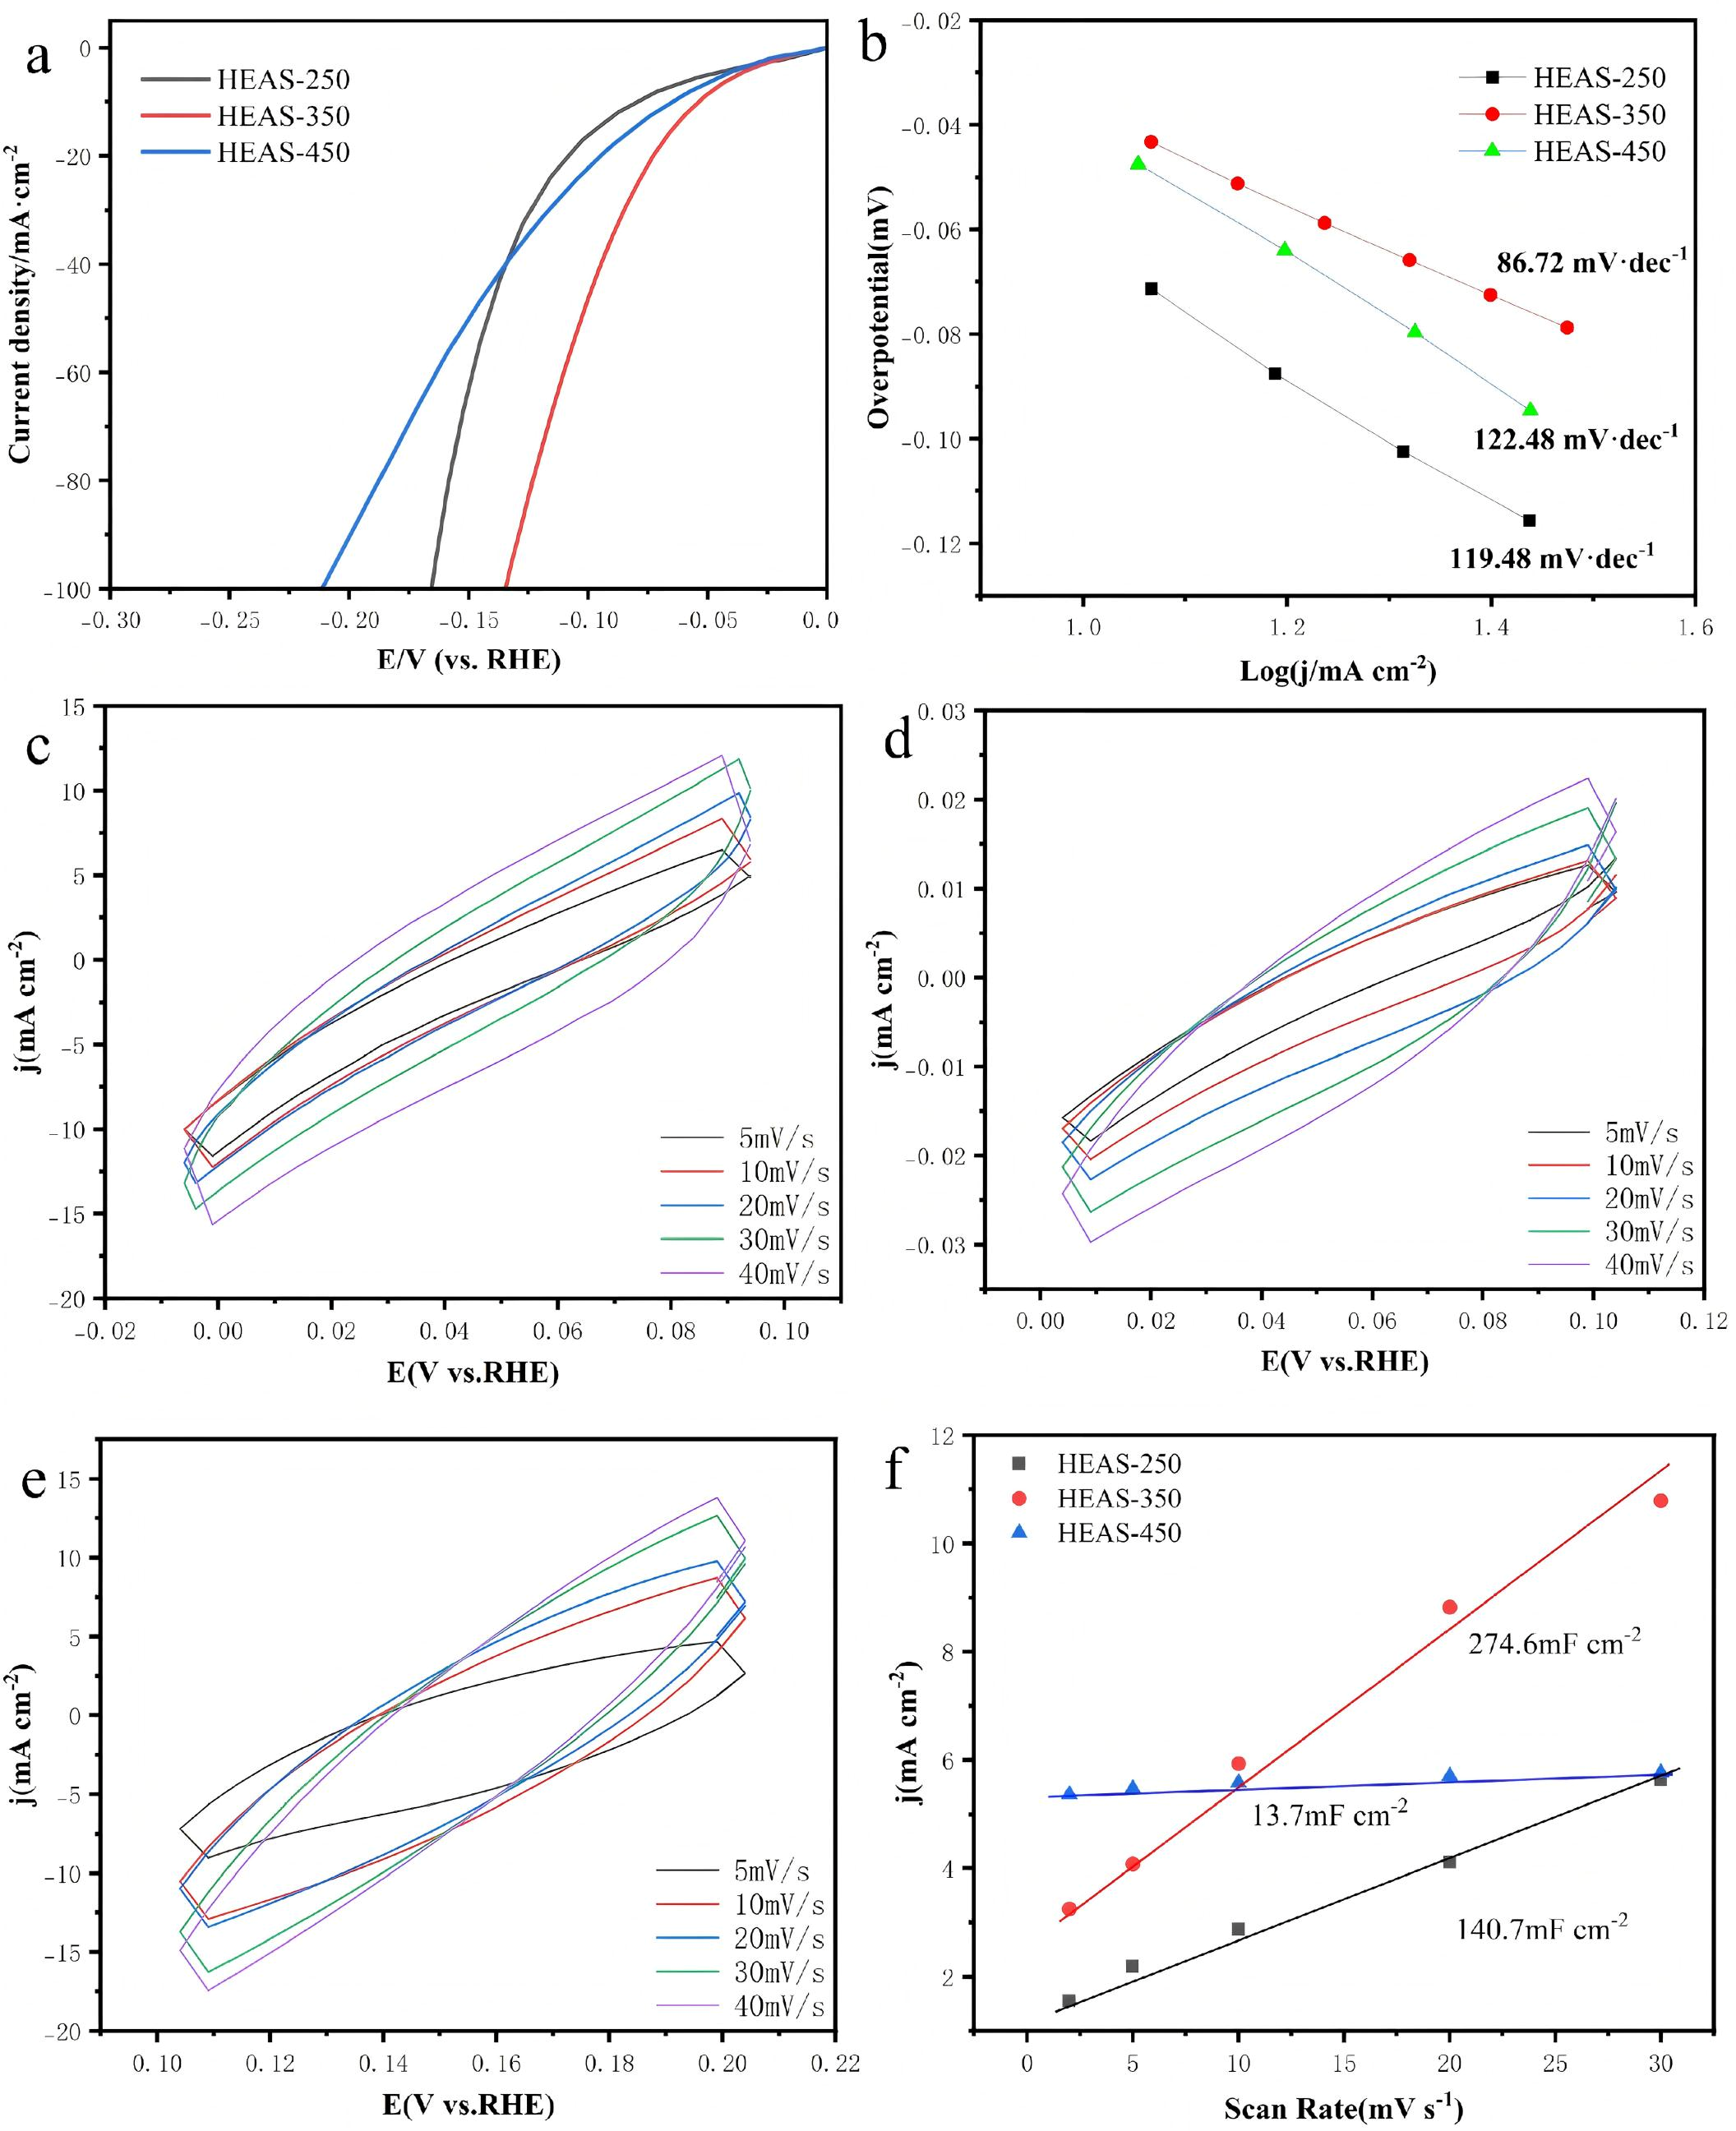
Electrochemical HER performance tests were conducted on FeCoNiMoCu high-entropy alloys (HEAs) sulfidized at different temperatures in a 0.5 M H2SO4 electrolyte, with the test results displayed in Figure 6. Figure 6a presents the LSV curves of the samples after sulfidation at various temperatures. The results demonstrated that at a current density of 10 mA cm−2, the overpotentials of FeCoNiMoCu HEAs sulfidized at 250 °C (HEAS-250), 350 °C (HEAS-350) and 450 °C (HEAS-450) were 79 mV, 53 mV and 65 mV, respectively. Among these samples, the one sulfidized at 350 °C exhibited the optimal HER performance, with HEAS-250 showing an overpotential 26 mV higher than that of HEAS-350. At a current density of 100 mA cm−2, the corresponding overpotentials of the HEAs sulfidized at 250 °C, 350 °C and 450 °C were 165 mV, 134 mV and 210 mV, respectively. A comparison of the LSV curves of the samples sulfidized at different temperatures confirmed that sulfidation modification effectively enhanced the hydrogen evolution activity of the material. This improvement is presumably attributed to the exposure of more highly active sites by sulfidation products (e.g., metal sulfides including MoS2 and CuS). Meanwhile, Figure 6b displays the Tafel plots obtained by fitting the polarization regions of the LSV curves, which were employed to investigate the hydrogen evolution reaction (HER) kinetics of the catalysts. The Tafel slope of HEAS-350 is determined to be 86.72 mV dec−1. The coefficient of determination (R2) values for HEAS-250, HEAS-350, and HEAS-450 are 0.9995, 0.9994, and 0.9989, respectively. Theoretically, the rate-determining step (RDS) of the HER is the Tafel step when the Tafel slope is less than 30 mV dec−1; the Heyrovsky-Tafel step dominates for Tafel slopes ranging from 30 to 40 mV dec−1, and the Heyrovsky-Volmer step is the RDS for slopes in the range of 40 to 120 mV dec−1 [25]. Figure 6c–f show the CV curves at different scan rates and the quantification of the electrochemical active surface area (ECSA) of the materials by calculating the double-layer capacitance (Cdl). The ECSA is linearly and positively correlated with Cdl: a larg-er Cdl value corresponds to a larger ECSA and a greater number of exposed active sites. By comparing the electrode materials sulfidated at different temperatures, the Cdl value is 140.7 mF cm−2 for sulfidation at 250 °C, decreases to 13.7 mF cm−2 at 450 °C, and increases to 274.6 mF cm−2 at 350 °C. The corresponding coefficients of determination (R2) derived from the linear fitting for HEAS-250, HEAS-350, and HEAS-450 are 0.9992, 0.9995, and 0.9990, respectively. These results confirm that HEAS-350 possesses the largest active surface area.
Figure 6.
(a) HER Polarization Curves of the Electrodes in 0.5 M H2SO4; (b) Corresponding Tafel Curves of the Electrodes; (c) CV Curves of the HEAS-250 Electrode; (d) CV Curves of the HEAS-350 Electrode; (e) CV Curves of the HEAS-450 Electrode; (f) Cdl Plots of the Electrodes.
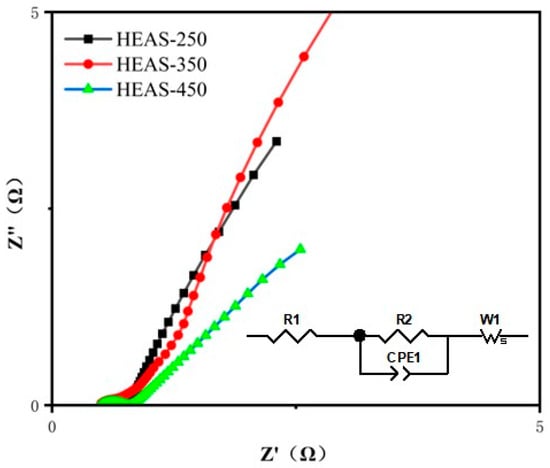
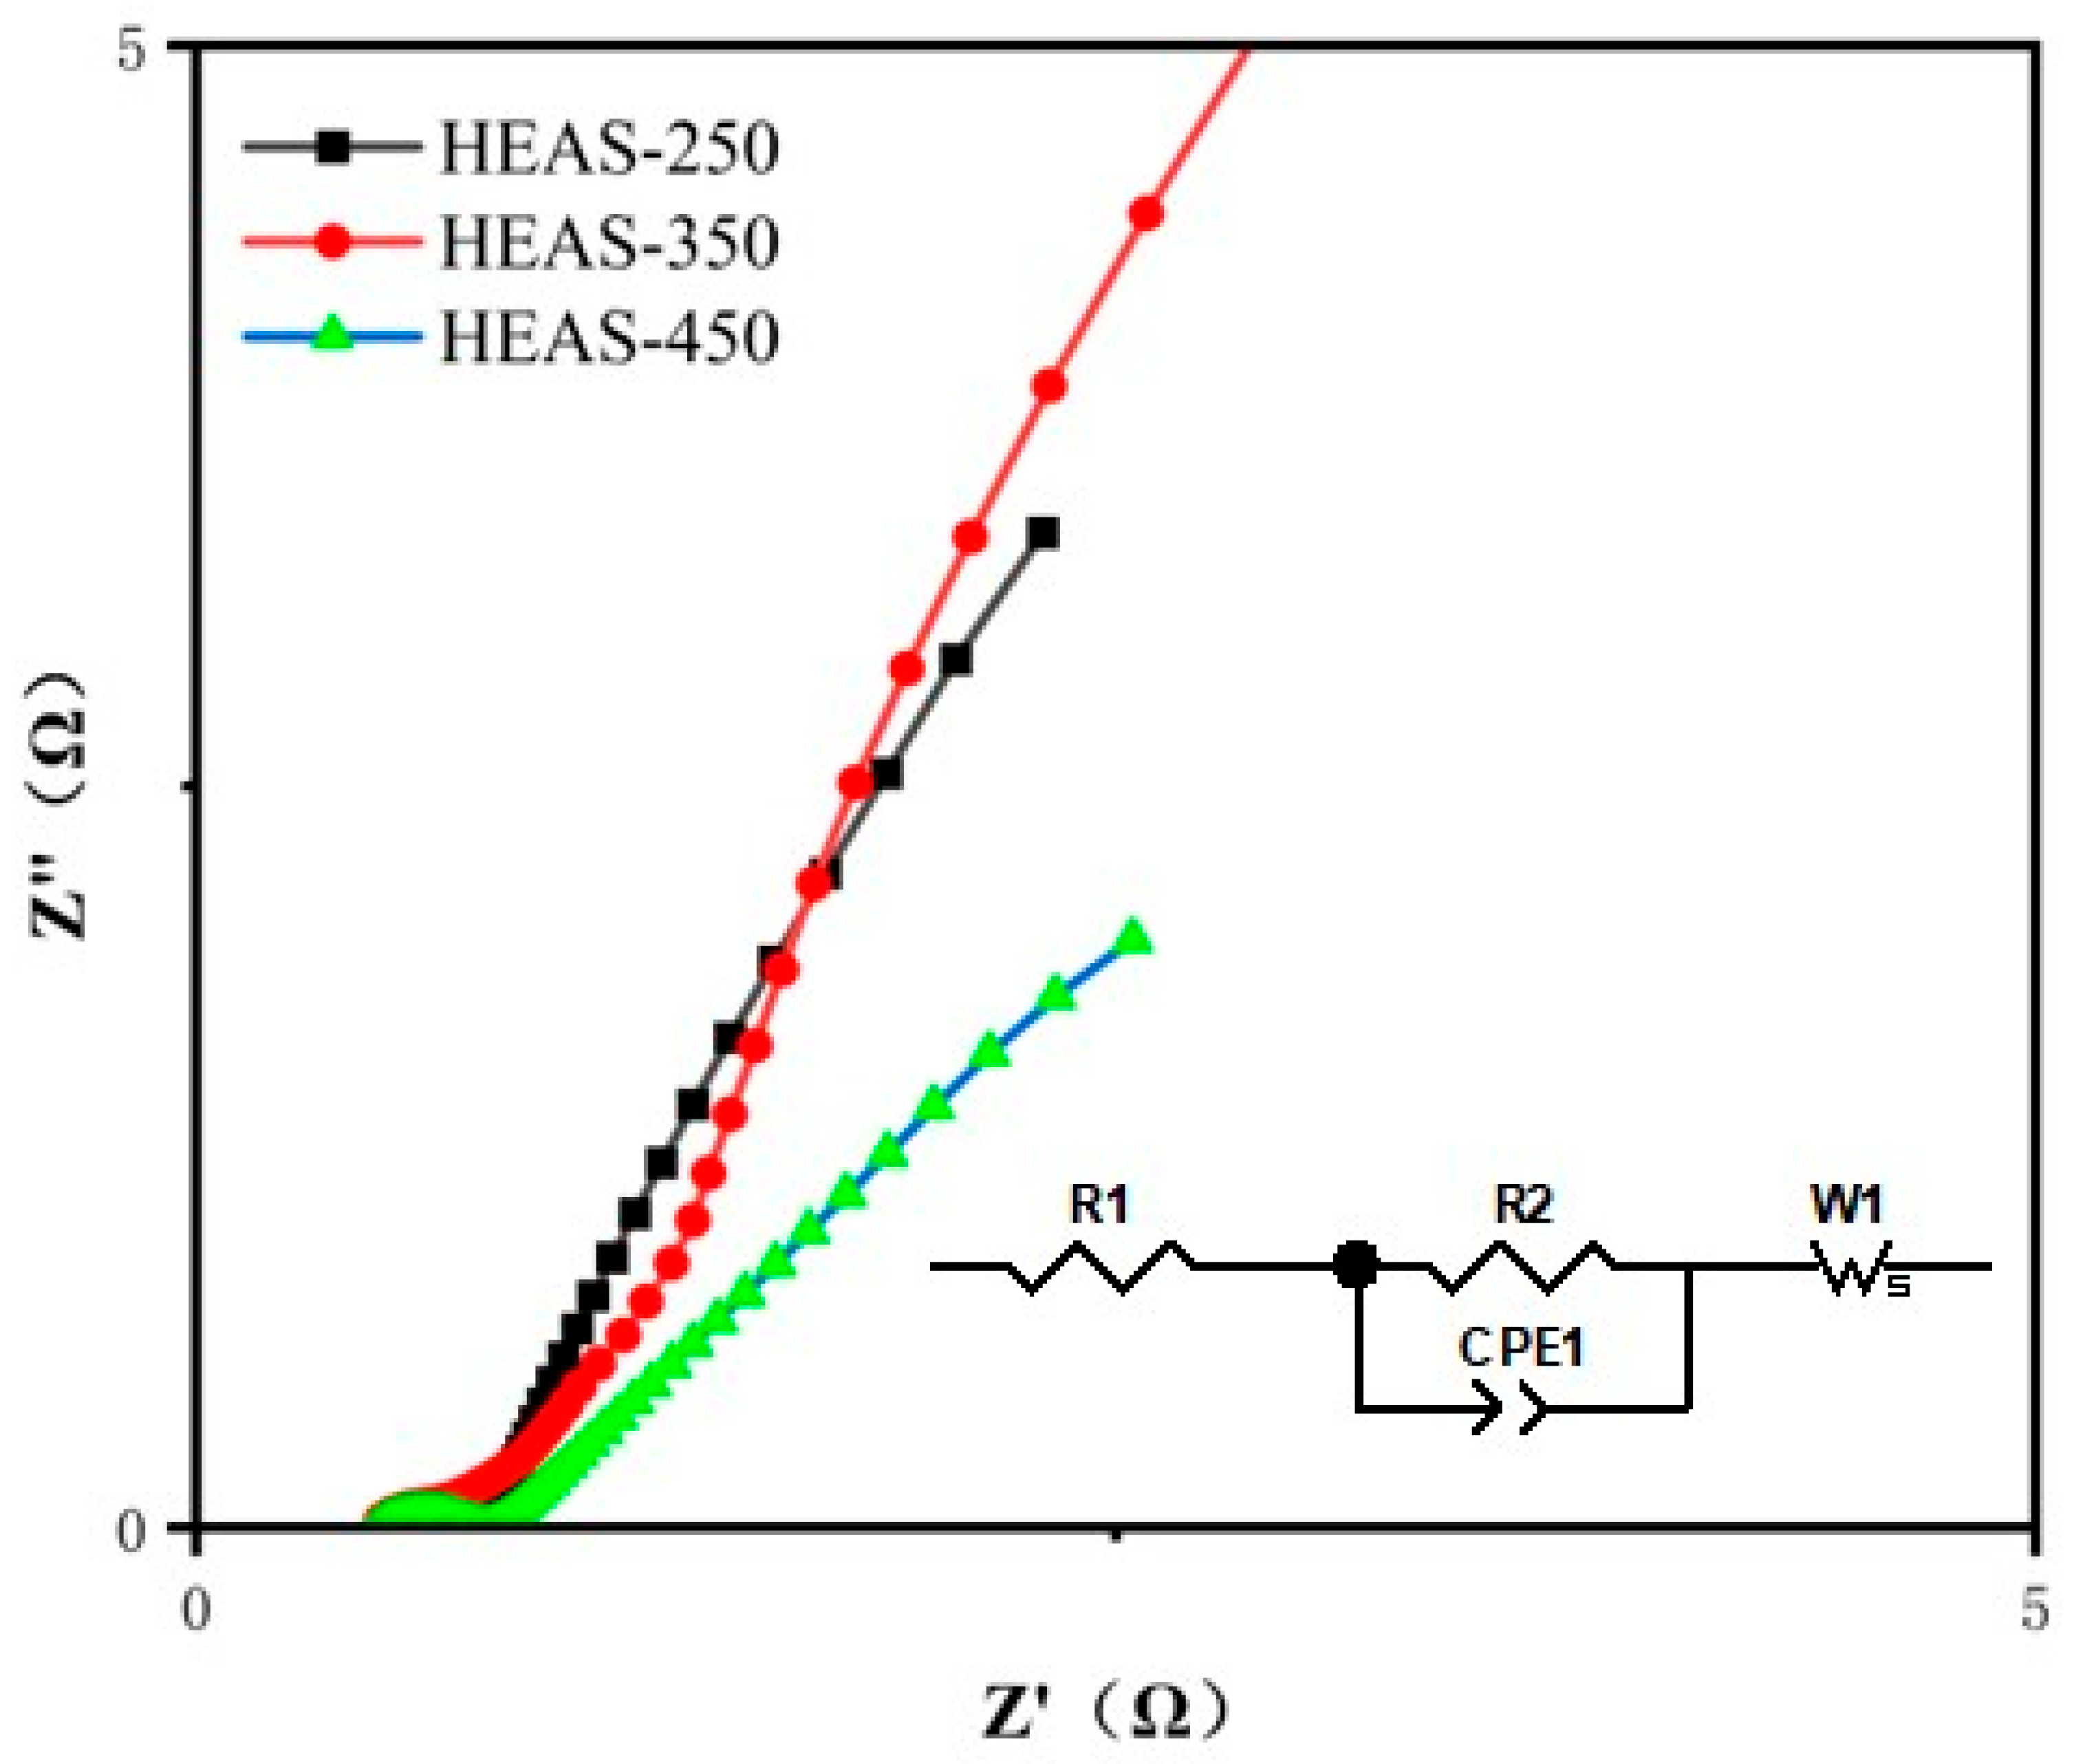
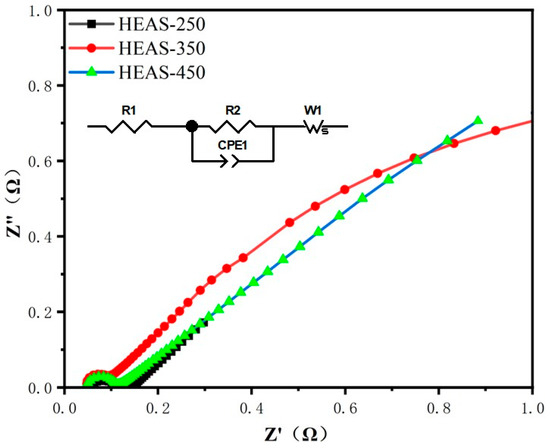
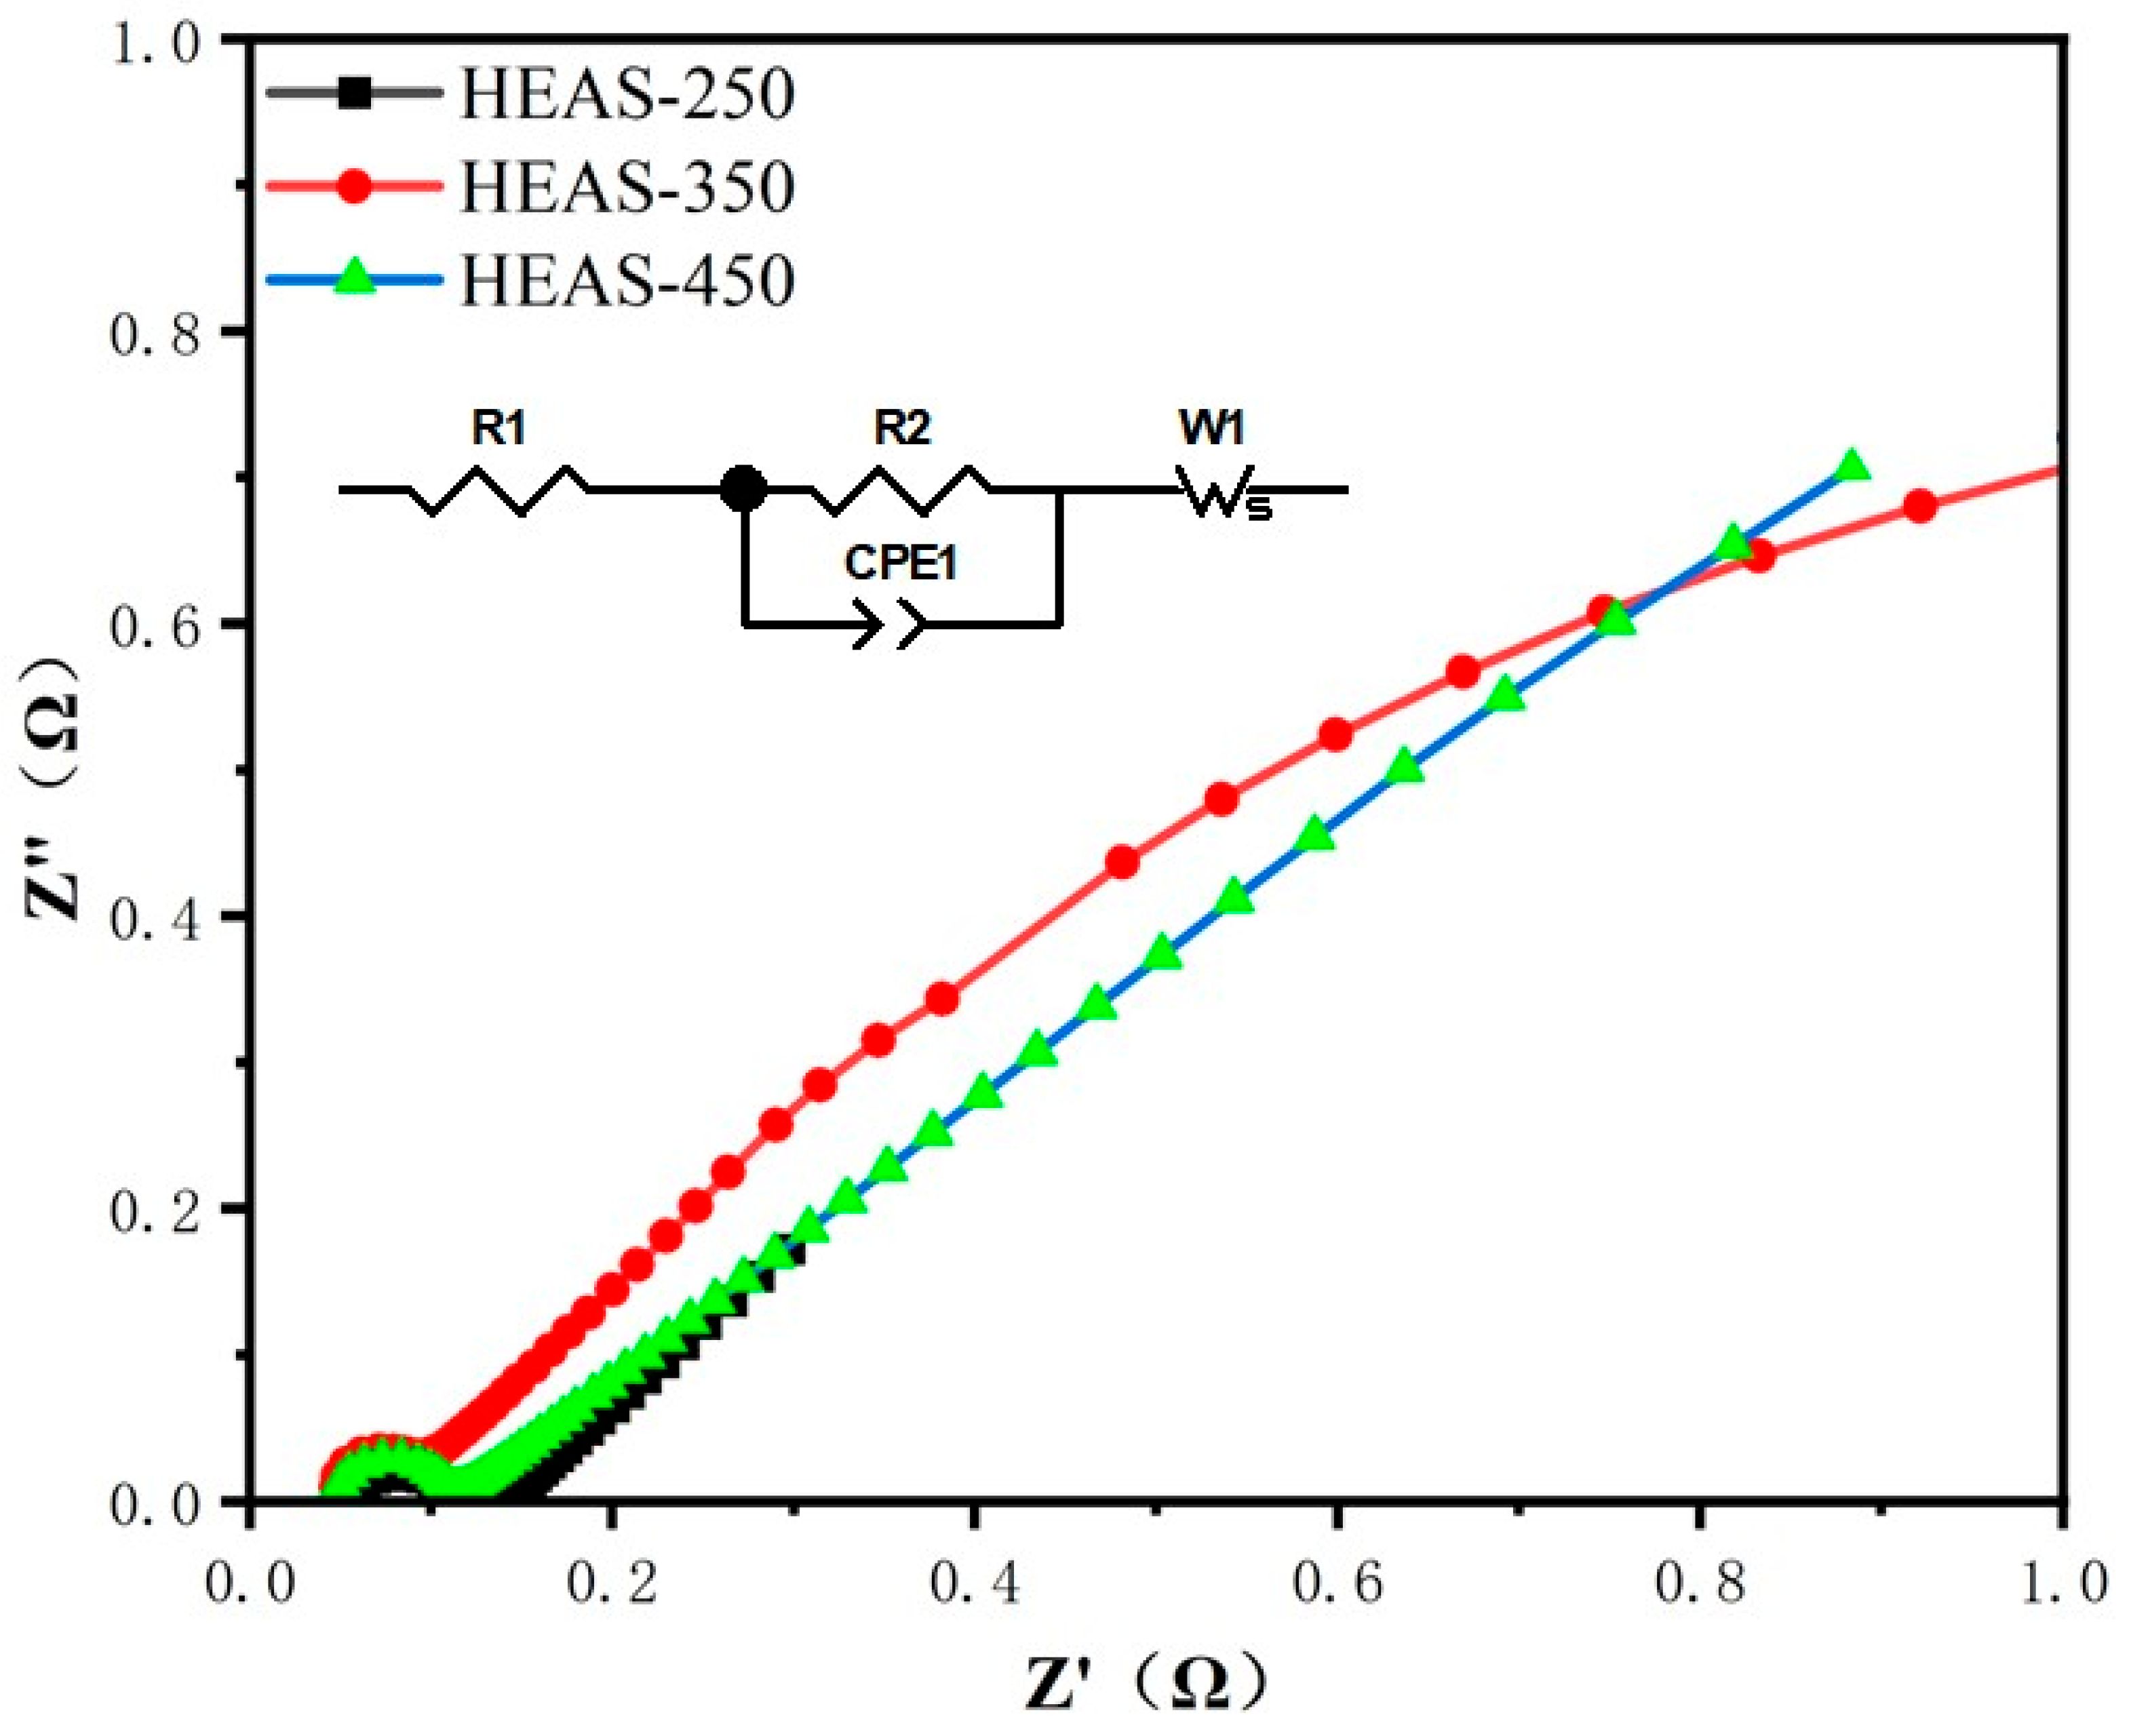
Electrochemical Impedance Spectroscopy (EIS) is a commonly employed method for evaluating hydrogen evolution reaction (HER) kinetics. Figure 7 presents the Nyquist impedance spectra and corresponding equivalent circuit of FeCoNiMoCu HEAS at open-circuit potential in 0.5 M H2SO4 solution under different sulfidation temperatures. All three curves consist of a semicircle in the high-frequency region and an approximate linear diffusion arc in the low-frequency region, which are closely associated with the reaction kinetic characteristics of the electrode [26]. Among them, the semicircle diameter of HEAS-350 is the smallest, that of HEAS-450 is the largest, and HEAS-250 lies between the two, which intuitively reflects the differences in charge-transfer resistance under different sulfidation temperatures. Table 1 displays the fitting data corresponding to the Nyquist plot in Figure 7. From the perspective of parameter variations: R1 is the smallest for HEAS-450 (0.104 Ω), indicating the optimal ohmic transport efficiency of the solution, while R2 (charge-transfer resistance) decreases to 0.136 Ω for HEAS-350 (significantly lower than 0.235 Ω for HEAS-250 and 0.397 Ω for HEAS-450), suggesting the weakest resistance for HER kinetics [27]. In summary, sulfidation temperature significantly affects the charge transfer and diffusion processes of HER by regulating the composition, structure, and morphology of surface sulfides. An appropriate sulfidation temperature can form a suitable amount of active sulfide phases, optimize the surface electronic structure and distribution of active sites, while maintaining favorable interfacial uniformity, thereby effectively reducing charge-transfer resistance and enhancing HER kinetics.
Figure 7.
Nyquist impedance spectra of FeCoNiMoCuS at different temperatures under OCP in 0.5 M H2SO4 solution and the corresponding equivalent circuits.
Table 1.
Fitting Results of EIS for FeCoNiMoCu HEAS Sulfidated at Different Temperatures.
3.3. Hydrogen Evolution of Transition Metal Sulfide Electrodes in Alkaline Solution
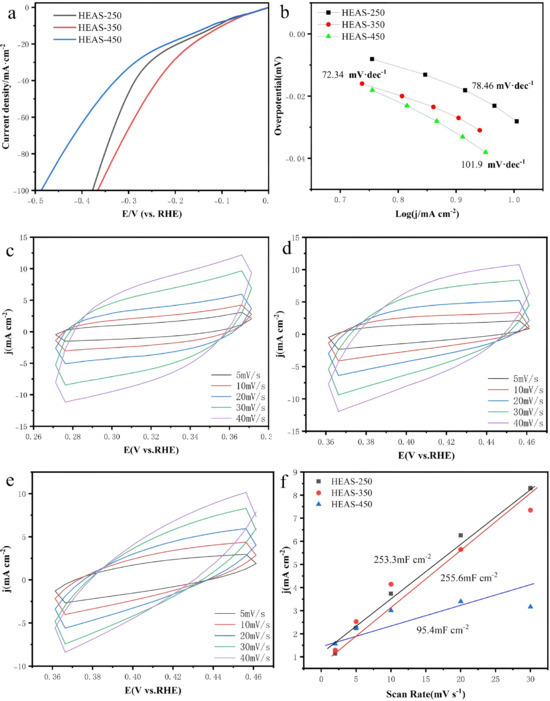
Figure 8 presents the results of electrochemical hydrogen evolution reaction (HER) performance tests conducted on FeCoNiMoCu high-entropy alloys (HEAs) sulfidated at different temperatures in a 1 M KOH solution. For comparative analysis, the HER performance of electrodes prepared at sulfidation temperatures of 250 °C, 350 °C, and 450 °C was evaluated under identical conditions. Figure 8a displays the LSV curves of the electrodes after sulfidation at different temperatures. The results show that HEAS-350 exhibits the optimal HER catalytic performance: at a current density of 10 mA·cm−2, the overpotential of HEAS-350 is 98 mV, which is significantly lower than that of HEAS-250 (110 mV) and HEAS-450 (124 mV). This clearly demonstrates that HEAS-350 possesses superior HER performance in the alkaline medium. By examining the Tafel slope plots corresponding to the LSV curves (as shown in Figure 8b), the Tafel slope of HEAS-350 is determined to be 72.34 mV dec−1, lower than that of HEAS-250 (78.46 mV dec−1) and HEAS-450 (101.9 mV dec−1). Figure 8c–f illustrate the CV curves obtained at different scan rates and the quantification of the ECSA of the materials by calculating the double-layer capacitance (Cdl). The ECSA of each electrode material was evaluated by measuring the Cdl in the non-Faradaic potential region for both the target electrodes and reference electrodes: first, CV curves of the target and reference electrodes were acquired at various scan rates (5, 10, 20, 30 and 40 mV s−1) via the CV method (Figure 8c–e); subsequently, a plot was constructed with half the difference in current density at a given potential as the y-axis and the scan rate as the x-axis. The slope of the fitted linear line corresponds to the Cdl value of each electrode material (Figure 8f). The results indicate that the HEAS-350 electrode exhibits the largest Cdl value of 255.6 mF cm−2, which is higher than that of HEAS-250 (253.3 mF cm−2) and HEAS-450 (95.4 mF cm−2). This confirms that HEAS-350 possesses the largest active surface area.
Figure 8.
(a) HER Polarization Curves of the Electrodes in 1 M KOH; (b) Corresponding Tafel Curves of the Electrodes; (c) CV Curves of the HEAS-250 Electrode; (d) CV Curves of the HEAS-350 Electrode; (e) CV Curves of the HEAS-450 Electrode; (f) Cdl Plots of the Electrodes.
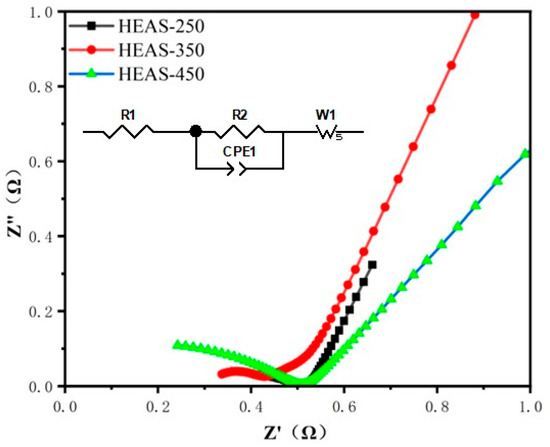
Figure 9 presents the Nyquist impedance spectra and corresponding equivalent circuit of FeCoNiMoCu HEAS after sulfidation treatment at different temperatures, measured at open-circuit potential in 1 M KOH solution. EIS was employed to evaluate the charge transfer kinetics during the hydrogen evolution reaction (HER). As observed from the Nyquist plots, the impedance spectra of all samples exhibit a typical feature consisting of a semicircle in the high-frequency region and an approximate linear diffusion arc in the low-frequency region. The diameter of the high-frequency semicircle directly corresponds to the charge transfer resistance (R2), which reflects the intrinsic catalytic activity of the electrode surface for HER and serves as a core indicator for evaluating HER kinetics. A lower R2 value indicates higher intrinsic catalytic activity of the active sites on the electrode surface. The linear segment in the low-frequency region corresponds to the Warburg impedance (W1), which is related to the diffusion behavior of OH− or H2O on the electrode surface. Combined with the fitting data in Table 2, the charge transfer resistance R2 of HEAS-350 is 0.157 Ω, which is significantly lower than that of HEAS-250 (0.187 Ω) and HEAS-450 (0.347 Ω), indicating faster charge transfer kinetics. This is closely related to the optimized distribution of surface active sites and enhanced electron transport efficiency [28].
Figure 9.
Nyquist impedance spectra of FeCoNiMoCuS at different temperatures under OCP in 1 M KOH solution and the corresponding equivalent circuits.
Table 2.
Fitting Results of EIS for FeCoNiMoCu HEAS Sulfidated at Different Temperatures.
3.4. Hydrogen Evolution of Transition Metal Sulfide Electrodes in Seawater Solution
To investigate the HER properties of the catalysts in a simulated seawater electrolysis environment, a three-electrode system was also employed in the experiments, and a composite electrolyte system consisting of 1 M KOH and 0.5 M NaCl was constructed. For performance comparison, the HER performance of electrodes prepared at different sulfidation temperatures (250 °C, 350 °C, and 450 °C) was also tested under the same conditions.
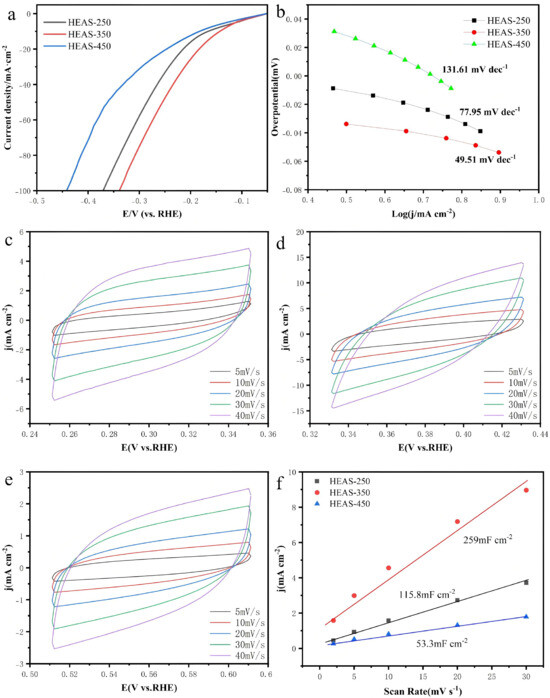
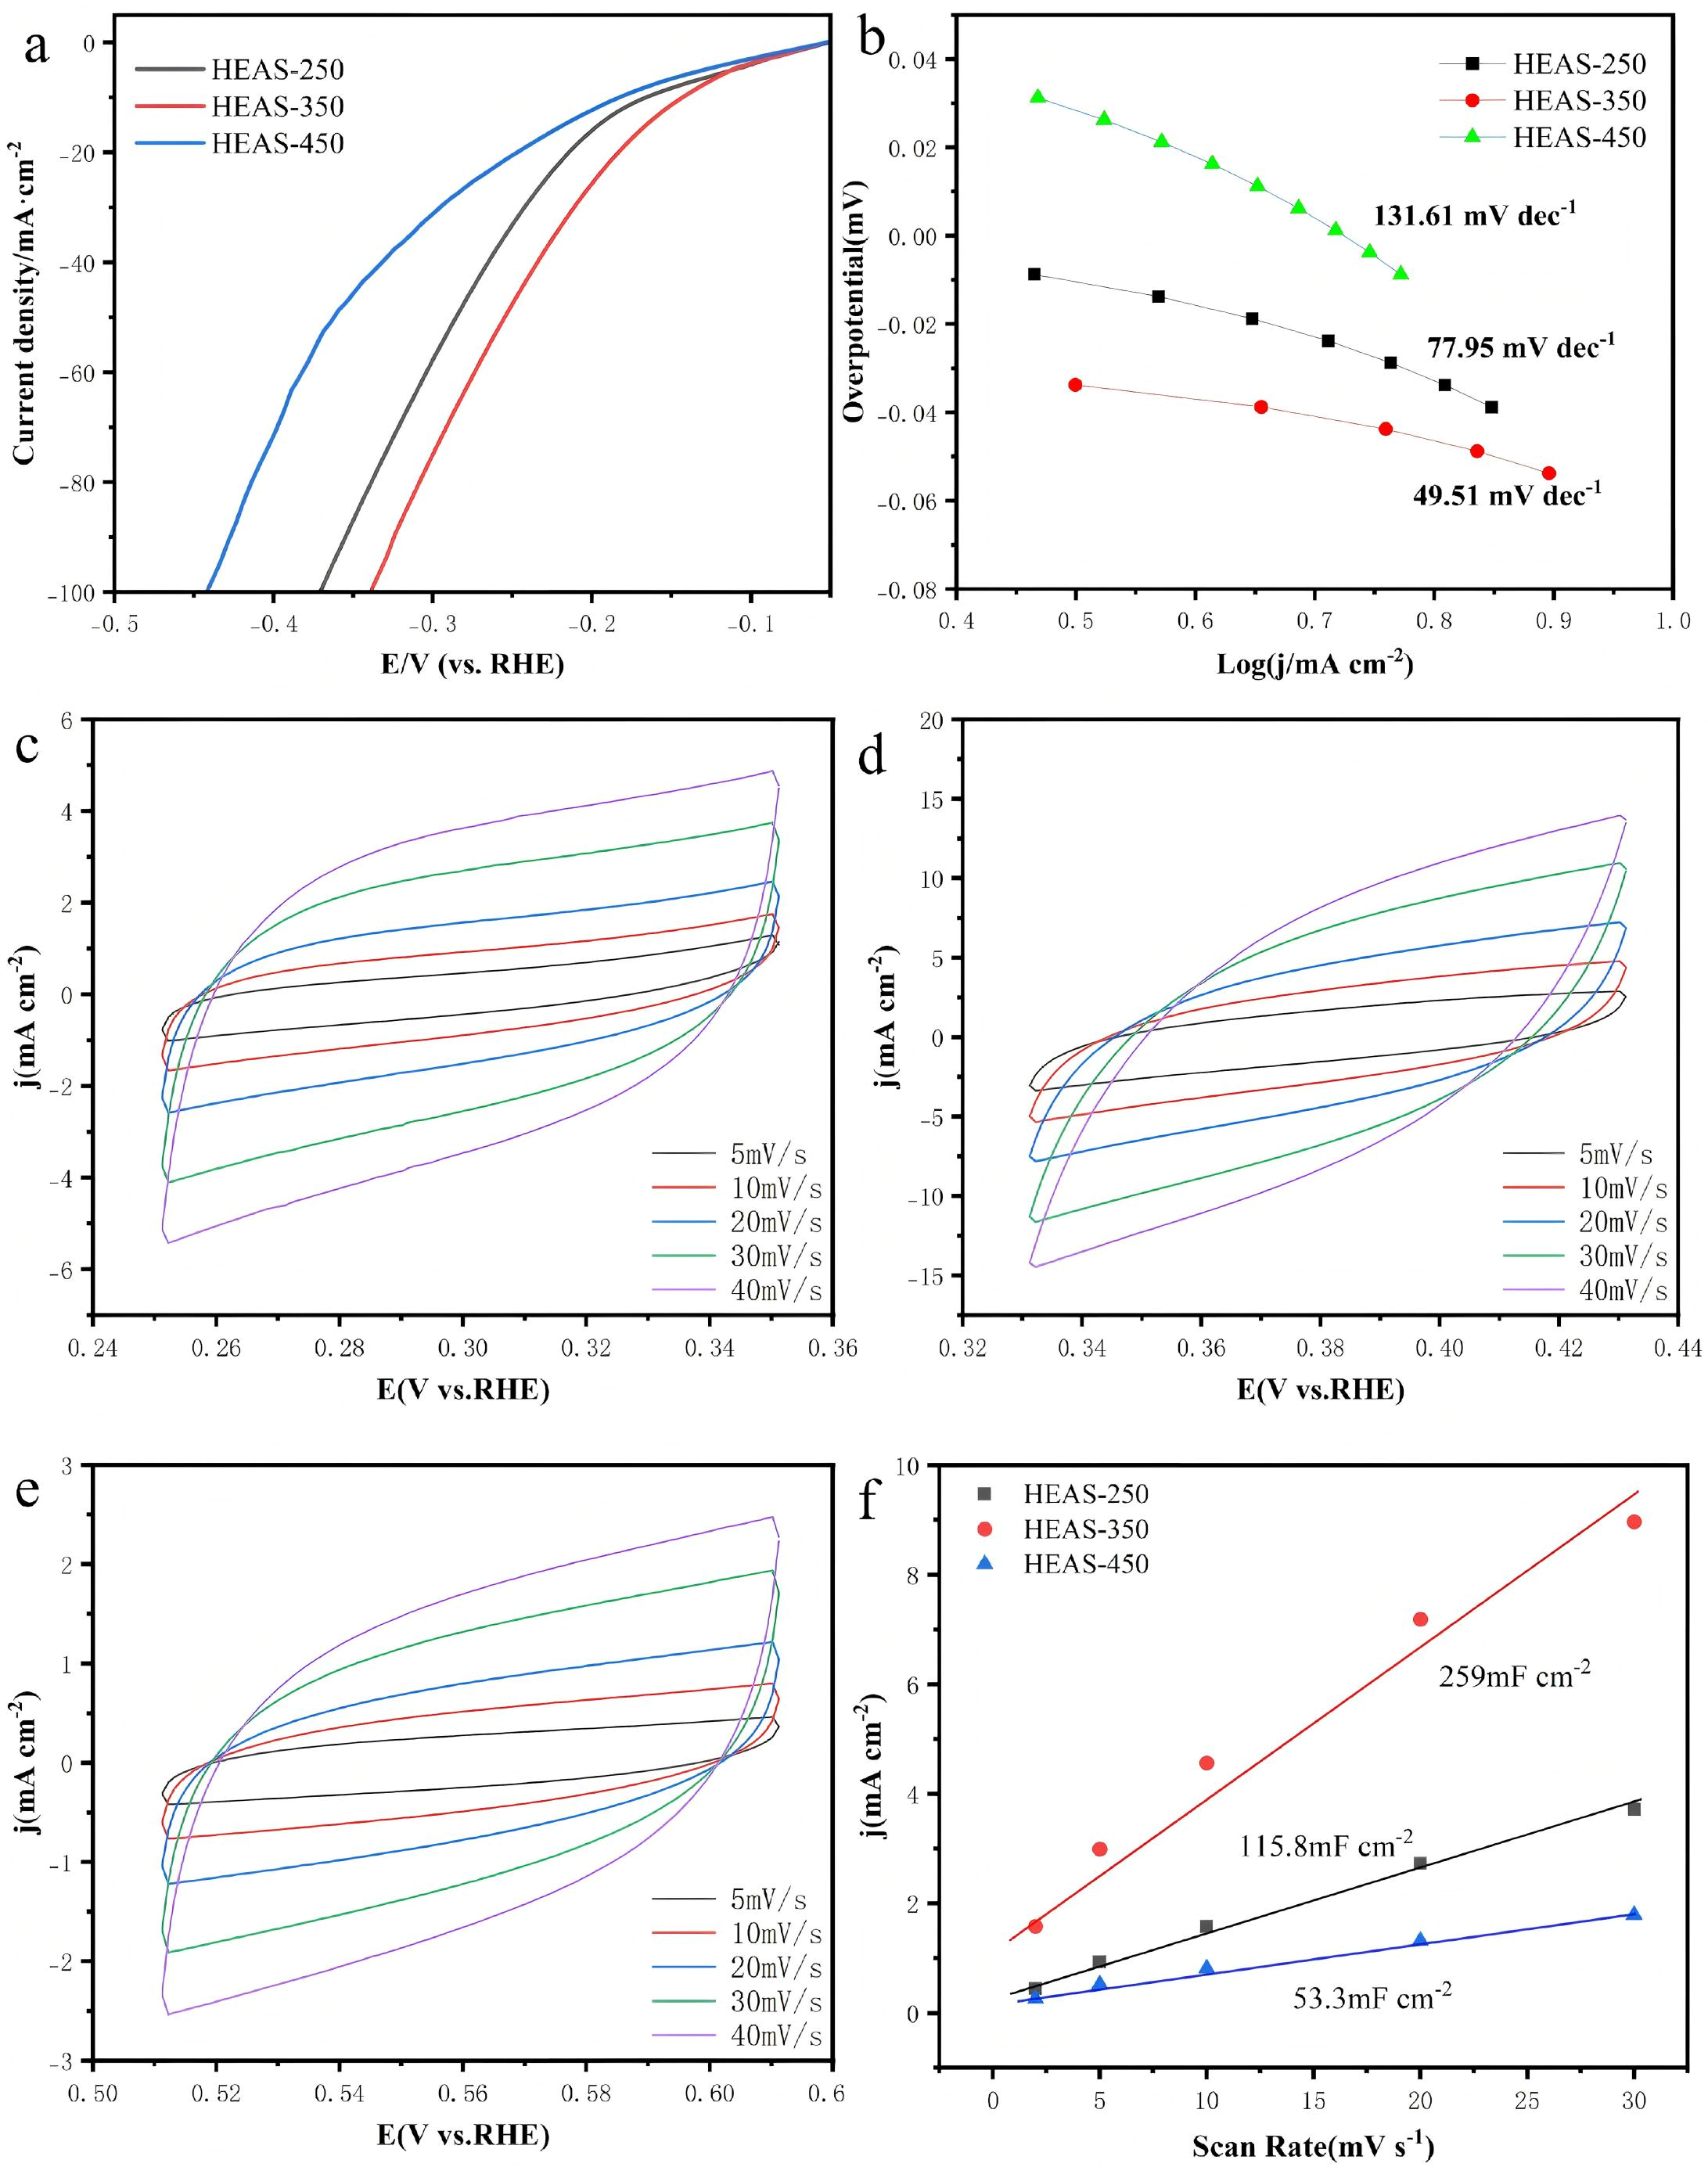
Figure 10 presents the hydrogen evolution reaction (HER) test results in the 1 M KOH + 0.5 M NaCl composite electrolyte. Similar to the results obtained in the acidic medium, the catalyst sulfidated at 350 °C exhibits the optimal HER catalytic activity. At a current density of 10 mA·cm−2, the overpotential required for this catalyst is only 142 mV, which is significantly lower than that of HEAS-250 (166 mV) and HEAS-450 (183 mV). This indicates that the HEAS-350 electrode possesses superior HER performance in the simulated seawater medium. Figure 10b shows the Tafel slope plots corresponding to the LSV curves. It is found that the Tafel slope of the HEAS-350 electrode is 49.51 mV dec−1, which is lower than that of the electrodes sulfidated at 250 °C (77.95 mV dec−1) and 450 °C (131.61 mV dec−1). Figure 10c–f illustrate the CV curves acquired at different scan rates and the quantification of the ECSA of the materials by calculating the Cdl. The ECSA is linearly and positively correlated with Cdl: a larger Cdl value corresponds to a larger ECSA and a greater number of exposed active sites. By comparing the electrode materials sulfidated at different temperatures, the Cdl value is 115.8 mF cm−2 for sulfidation at 250 °C, decreases to 53.3 mF cm−2 at 450 °C, and increases to 259 mF cm−2 at 350 °C. These results demonstrate that HEAS-350 possesses the largest active surface area among the samples sulfidated at different temperatures. This may be one of the key factors contributing to its excellent catalytic performance. A larger ECSA implies more active sites available for the reaction, thereby enhancing the catalytic efficiency of the electrode.
Figure 10.
(a) HER Polarization Curves of the Electrodes in 1 M KOH + 0.5 M NaCl Composite Electrolyte; (b) Corresponding Tafel Curves of the Electrodes; (c) CV Curves of the HEAS-250 Electrode; (d) CV Curves of the HEAS-350 Electrode; (e) CV Curves of the HEAS-450 Electrode; (f) Cdl Plots of the Electrodes.
Figure 11 presents the Nyquist impedance spectra and corresponding equivalent circuit of FeCoNiMoCu HEAS at open-circuit potential in 1 M KOH + 0.5 M NaCl solution under different sulfidation temperatures. EIS was employed to evaluate the charge transfer rate during the HER. Similarly, the impedance spectra consist of a semicircle in the high-frequency region and an approximate straight line in the low-frequency region. Visually from the figure, the semicircle diameter of HEAS-350 is the smallest, while that of HEAS-450 is the largest, which preliminarily indicates that 350 °C is the optimal sulfidation temperature for this system. Table 3 presents the corresponding EIS results in the mixed solution of 1 M KOH and 0.5 M NaCl. Combined with the fitting data, the R1 value decreases with the increase in sulfidation temperature. The data show that R1 is the smallest for HEAS-450 (0.253 Ω), indicating the optimal solution ohmic transport efficiency, whereas R2 (charge transfer resistance) decreases to 0.375 Ω for HEAS-350, which is significantly lower than 0.523 Ω for HEAS-250 and 0.847 Ω for HEAS-450, suggesting the weakest resistance for HER kinetics.
Figure 11.
Nyquist impedance spectra of FeCoNiMoCuS at different temperatures under OCP in 1 M KOH + 0.5 M NaCl solution and the corresponding equivalent circuits.
Table 3.
Fitting Results of EIS for FeCoNiMoCu HEAS Sulfidated at Different Temperatures.
3.5. Hydrogen Evolution of Transition Metal Sulfides in Sodium Sulfide Solution
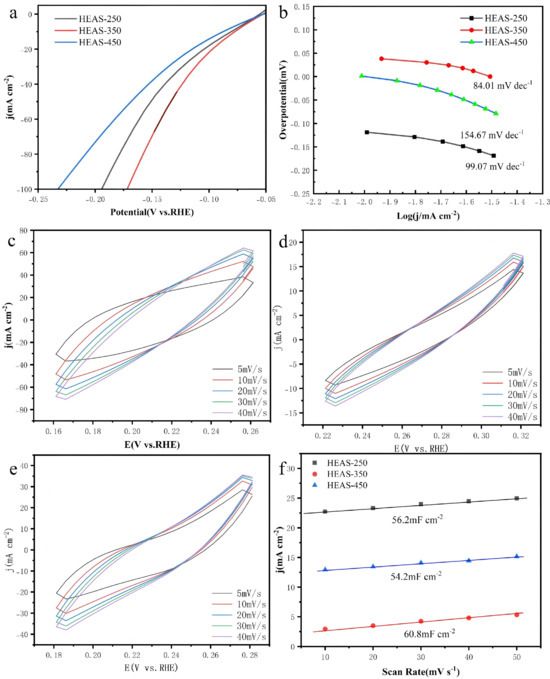
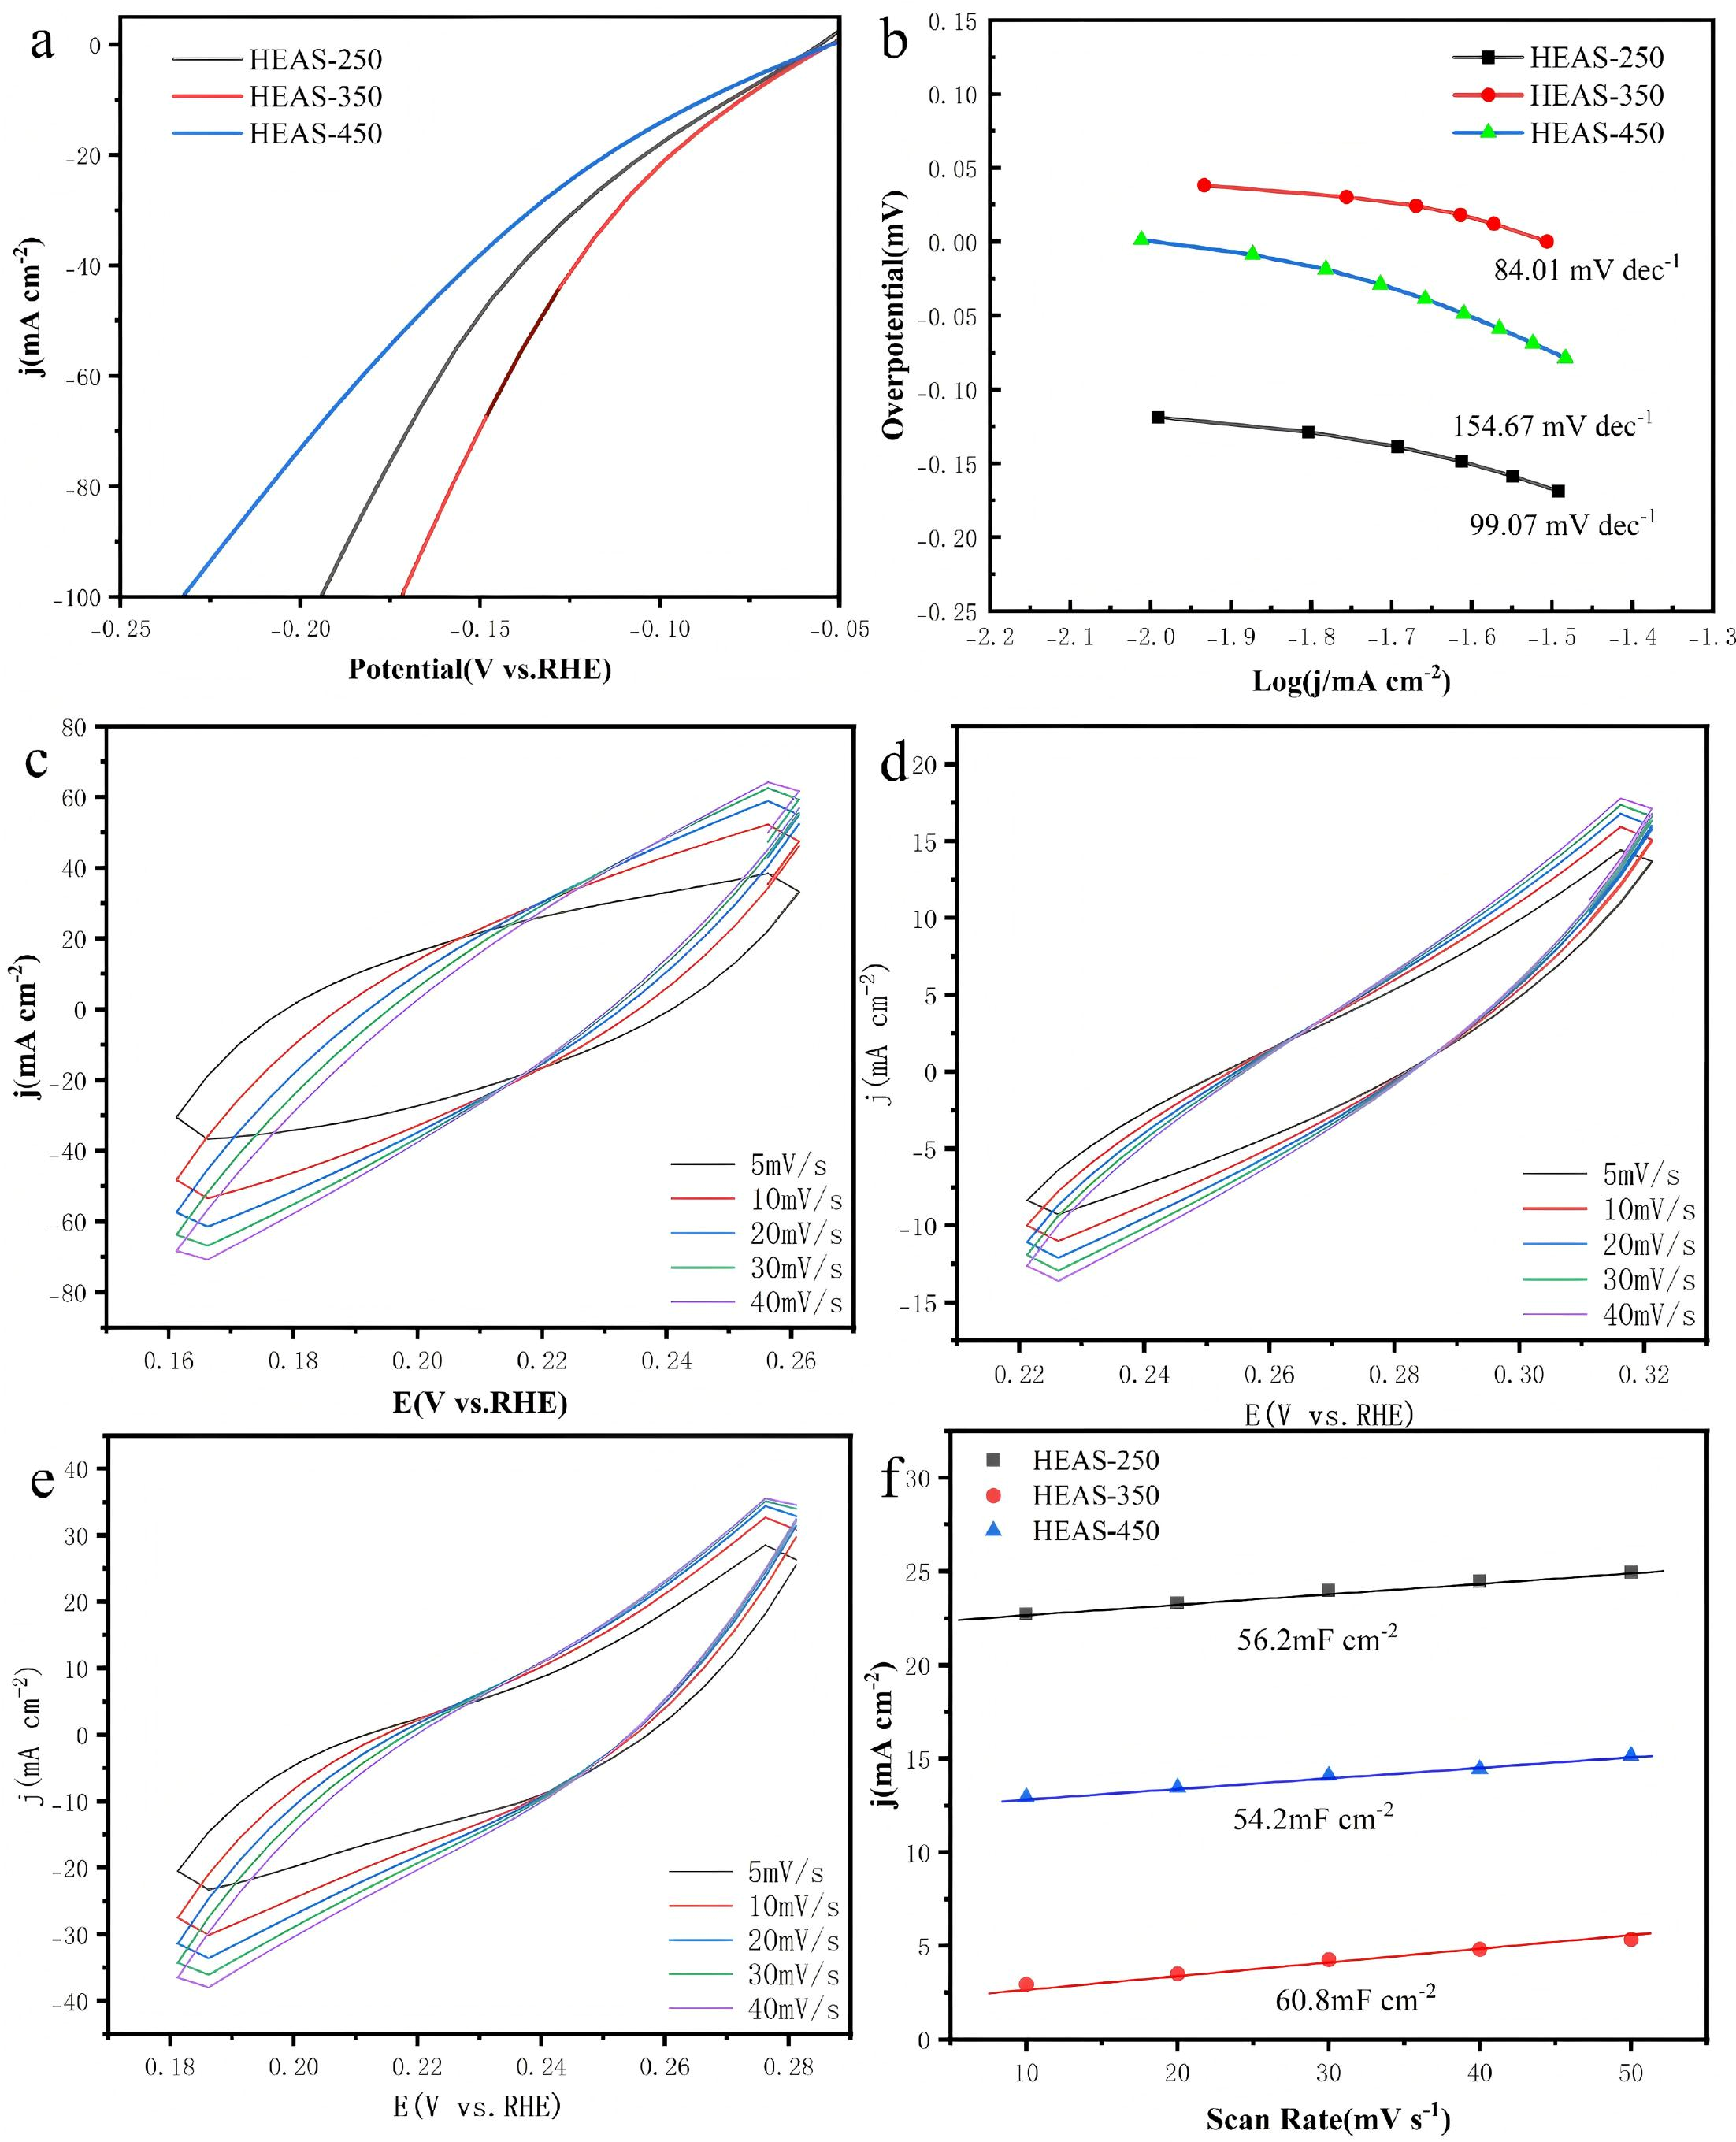
Figure 12 shows the HER performance test results of transition metal sulfides in sodium sulfide solution, which investigates the HER characteristics of the catalysts in the presence of sulfide ions (S2−). The electrolyte used in the tests was prepared as 1 M KOH + 1 M Na2S. Similarly, the HER performance of the electrodes fabricated at different sulfidation temperatures (250 °C, 350 °C and 450 °C) was tested under the same conditions. The LSV results in Figure 12a demonstrate that, consistent with the HER test results in acidic medium, HEAS-350 exhibits the optimal hydrogen evolution catalytic activity. To achieve a current density of 10 mA cm−2, this catalyst requires an overpotential of only 77 mV, which is significantly lower than those of HEAS-250 (80 mV) and HEAS-450 (87 mV). This result clearly indicates that the HEAS-350 electrode possesses superior HER performance in the sodium sulfide mixed electrolyte. Figure 12b presents the Tafel slope plots corresponding to the LSV curves, where the Tafel slope reflects the HER kinetics for water electrolysis. The results show that the Tafel slope of the HEAS-350 electrode is only 84.01 mV dec−1, which is remarkably lower than those of the electrodes sulfidized at 250 °C (99.07 mV dec−1) and 450 °C (154.67 mV dec−1). Meanwhile, the HER process of HEAS-350 follows the Volmer-Tafel mechanism [29]. Figure 12c–e display the CV curves of the prepared electrode and other reference electrodes obtained via CV measurements at various scan rates. Linear fitting was conducted for the different scan rates (5, 10, 20, 30 and 40 mV s−1) to calculate the double-layer capacitance (Cdl values of each electrode material. As shown in Figure 12f, the electrode treated at 350 °C exhibits the maximum Cdl value of 60.8 mF cm−2, which is higher than those of HEAS-250 (56.2 mF cm−2) and HEAS-450 (54.2 mF cm−2). This result confirms that the electrode treated at 350 °C possesses the largest electrochemical active surface area (ECSA). Similarly, a larger ECSA means more active sites are available for the HER reaction to occur, thereby enhancing the catalytic efficiency of the electrode.
Figure 12.
(a) HER Polarization Curves of the Electrodes in 1 M KOH + 1 M Na2S; (b) Corresponding Tafel Curves of the Electrodes; (c) CV Curves of the HEAS-250 Electrode; (d) CV Curves of the HEAS-350 Electrode; (e) CV Curves of the HEAS-450 Electrode; (f) Cdl Plots of the Electrodes.
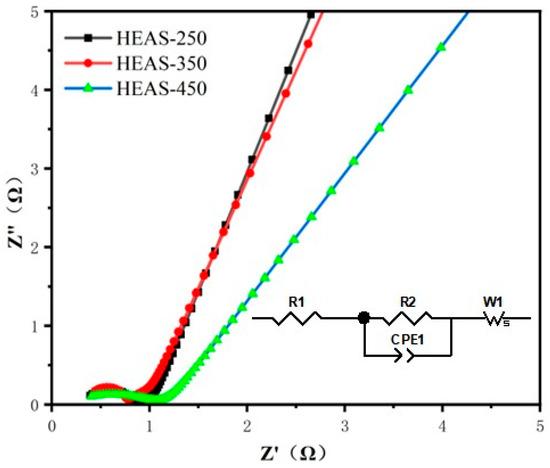
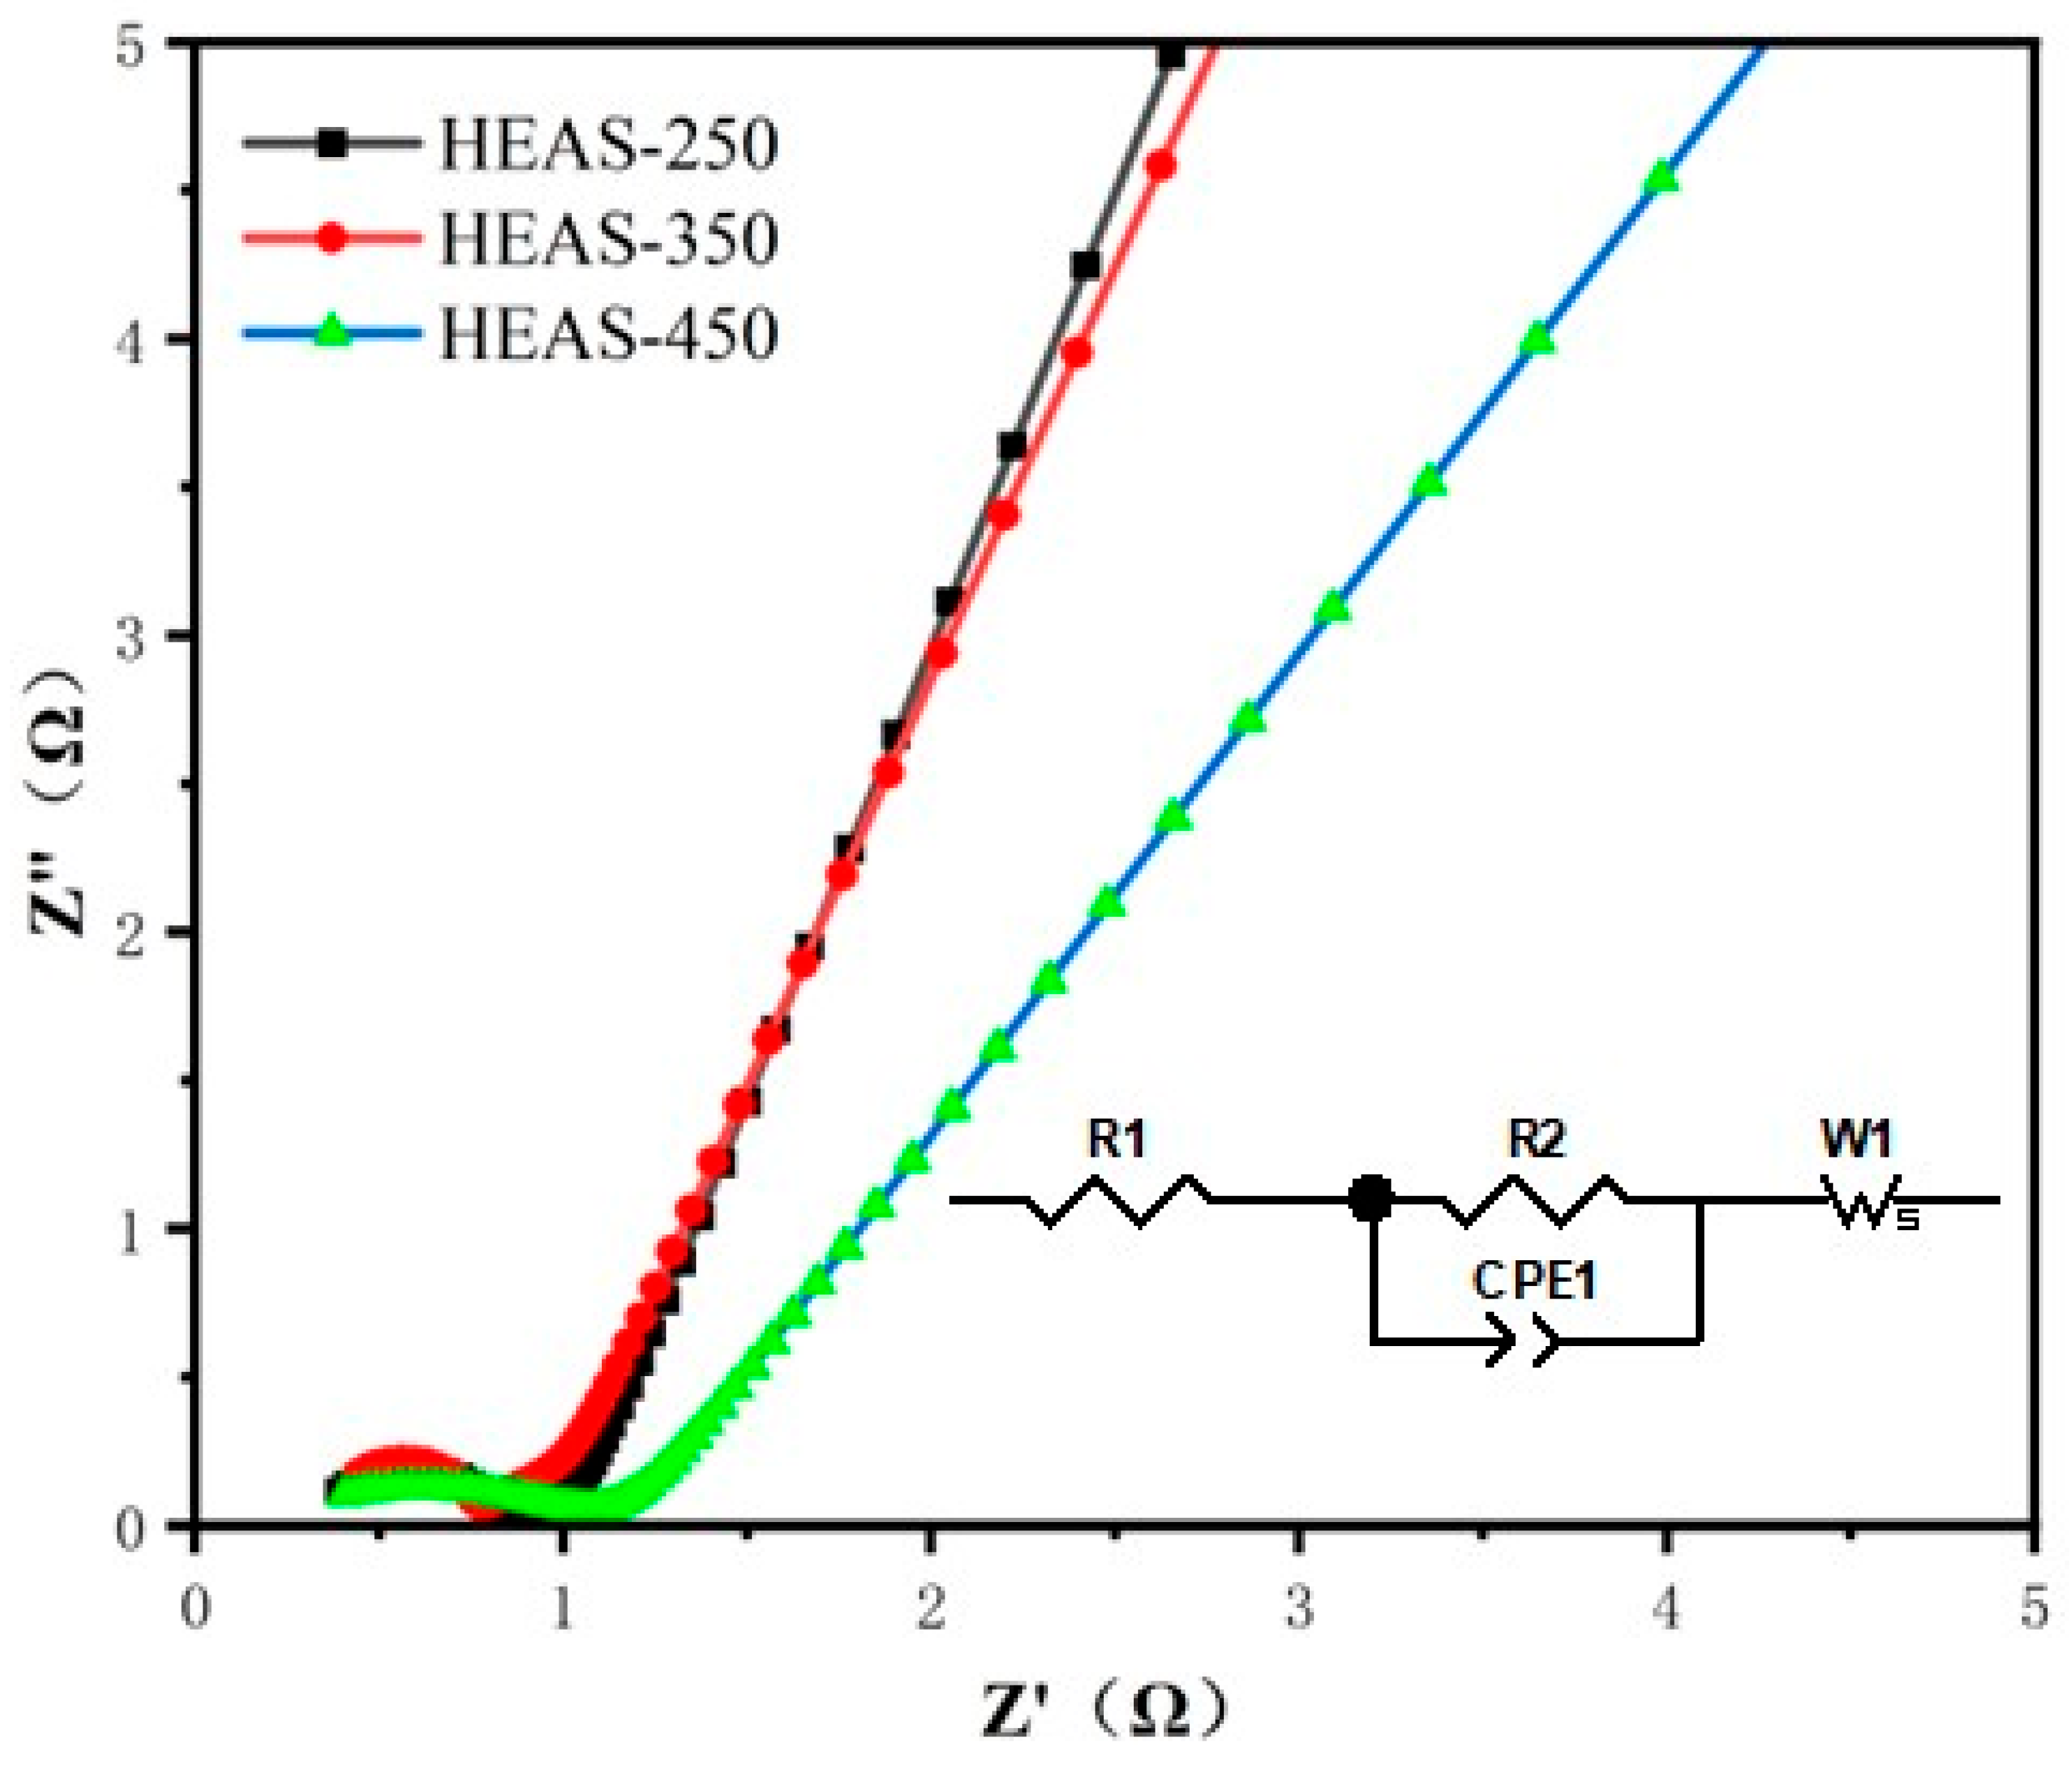
Figure 13 presents the Nyquist impedance spectra and corresponding equivalent circuit of FeCoNiMoCu HEAS at open-circuit potential in 1 M KOH + 1 M Na2S solution under different sulfidation temperatures. Similarly, from the Nyquist impedance spectra, all impedance curves exhibit the typical characteristic of a semicircle in the high-frequency region and an approximate straight line in the low-frequency region. The diameter of the high-frequency semicircle directly corresponds to the charge transfer resistance (R2), which reflects the intrinsic catalytic activity of the electrode surface for the hydrogen evolution reaction (HER). The straight line in the low-frequency region corresponds to the Warburg impedance (W1), which is closely related to the diffusion behavior of OH−, H2O, and S2− on the electrode surface. Visually, the semicircle diameter of HEAS-350 is the smallest, followed by HEAS-450, and that of HEAS-250 is the largest, preliminarily indicating that the sample sulfided at 350 °C possesses the optimal charge transfer kinetics in the sulfur-containing electrolyte. Table 4 lists the corresponding EIS fitting results for the FeCoNiMoCu high-entropy alloy in the 1 M KOH + 1 M Na2S mixed solution. The data show that the R1 values of the three groups of samples (0.048~0.052 Ω) exhibit minor differences, indicating similar ohmic transport efficiencies of the solution. The R2 value of HEAS-350 is 0.042 Ω, which is significantly lower than that of HEAS-250 (0.081 Ω) and HEAS-450 (0.060 Ω), demonstrating that the HEAS-350 catalyst exhibits faster charge transfer capability.
Figure 13.
Nyquist impedance spectra of FeCoNiMoCuS at different temperatures under OCP in 1 M KOH + 1 M Na2S solution and the corresponding equivalent circuits.
Table 4.
Fitting Results of EIS for FeCoNiMoCu HEAS Sulfidated at Different Temperatures.
4. Conclusions
By subjecting Fe-Co-Ni-Mo-Cu HEA to sulfidation treatment at different temperatures, the phase composition, morphology and other properties of the sulfided products were characterized by a series of analytical techniques, and the corresponding HER performances were evaluated in four different electrolytes. The influence of sulfidation temperature on the HER activity of the electrodes was revealed.
The results show that the electrode sulfided at 350 °C exhibits the optimal HER performance in all four electrolytes. At a current density of 10 mA cm−2, the best performance is achieved in 0.5 M H2SO4, with an overpotential of only 53 mV and a Tafel slope of 86.72 mV dec−1. In 1.0 M KOH, 1 M KOH + 0.5 M NaCl, and 1 M KOH + 1 M Na2S electrolytes, the overpotentials are 98 mV, 142 mV, and 77 mV, with Tafel slopes of 72.43, 49.51, and 84.01 mV dec−1, respectively.
In summary, the systematic investigation on Fe-Co-Ni-Mo-Cu high-entropy alloys sulfided at different temperatures and tested in various electrolytes may provide a useful reference for the development of low-cost and widely adaptable HER catalysts.
Author Contributions
Conceptualization, J.Y. and Y.F.; methodology, Y.F., Y.L. and H.C.; software, Z.H.; validation, Y.F.; formal analysis, Y.F.; investigation, Y.L. and Y.F.; resources, J.Y. and H.T.; data curation, Z.H. and Y.L.; writing—original draft preparation, Y.L. and Y.F.; writing—review and editing, Y.L.; funding acquisition, J.Y. and H.T. All authors have read and agreed to the published version of the manuscript.
Funding
This research was funded by the Guangdong S&T program (2023B0101200001) and the National Natural Science Foundation of China (51704221 and 52371074).
Institutional Review Board Statement
Not applicable.
Informed Consent Statement
Not applicable.
Data Availability Statement
Data are contained within the article.
Conflicts of Interest
The authors declare no conflict of interest.
References
- Yu, Z.Y.; Duan, Y.; Feng, X.Y.; Yu, X.; Gao, M.R.; Yu, S.H. Clean and affordable hydrogen fuel from alkaline water splitting: Past, recent progress, and future prospects. Adv. Mater. 2021, 33, 2007100. [Google Scholar] [CrossRef] [Scilit]
- Li, H.; Chen, S.; Zhang, Y.; Zhang, Q.; Jia, X.; Zhang, Q.; Gu, L.; Sun, X.; Song, L.; Wang, X. Systematic design of superaerophobic nanotube-array electrode comprised of transition-metal sulfides for overall water splitting. Nat. Commun. 2018, 9, 2452. [Google Scholar] [CrossRef] [Scilit]
- Abe, J.O.; Popoola, A.; Ajenifuja, E.; Popoola, O.M. Hydrogen energy, economy and storage: Review and recommendation. Int. J. Hydrogen Energy 2019, 44, 15072–15086. [Google Scholar] [CrossRef] [Scilit]
- Amin, M.; Shah, H.H.; Fareed, A.G.; Khan, W.U.; Chung, E.; Zia, A.; Farooqi, Z.U.R.; Lee, C. Hydrogen production through renewable and non-renewable energy processes and their impact on climate change. Int. J. Hydrogen Energy 2022, 47, 33112–33134. [Google Scholar] [CrossRef] [Scilit]
- Li, X.; Zhao, L.; Yu, J.; Liu, X.; Zhang, X.; Liu, H.; Zhou, W. Water splitting: From electrode to green energy system. Nano-Micro Lett. 2020, 12, 131. [Google Scholar] [CrossRef] [Scilit]
- Chatenet, M.; Pollet, B.G.; Dekel, D.R.; Dionigi, F.; Deseure, J.; Millet, P.; Braatz, R.D.; Bazant, M.Z.; Eikerling, M.; Staffell, I. Water electrolysis: From textbook knowledge to the latest scientific strategies and industrial developments. Chem. Soc. Rev. 2022, 51, 4583–4762. [Google Scholar] [CrossRef] [Scilit] [PubMed]
- Zhang, Y.; Zhang, B.; Sun, J. Research Progress in Water Electrolysis Hydrogen Production Technology and Its Catalysts. J. Petrochem. Univ./Shiyou Huagong Gaodeng Xuexiao Xuebao 2022, 35, 19–27. [Google Scholar]
- Salam, M.A.; Ahmed, K.; Akter, N.; Hossain, T.; Abdullah, B. A review of hydrogen production via biomass gasification and its prospect in Bangladesh. Int. J. Hydrogen Energy 2018, 43, 14944–14973. [Google Scholar] [CrossRef] [Scilit]
- Wang, S.; Gao, X.; Hang, X.; Zhu, X.; Han, H.; Liao, W.; Chen, W. Ultrafine Pt nanoclusters confined in a calixarene-based {Ni24} coordination cage for high-efficient hydrogen evolution reaction. J. Am. Chem. Soc. 2016, 138, 16236–16239. [Google Scholar] [CrossRef] [Scilit]
- Staszak-Jirkovský, J.; Malliakas, C.D.; Lopes, P.P.; Danilovic, N.; Kota, S.S.; Chang, K.-C.; Genorio, B.; Strmcnik, D.; Stamenkovic, V.R.; Kanatzidis, M.G. Design of active and stable Co–Mo–S x chalcogels as pH-universal catalysts for the hydrogen evolution reaction. Nat. Mater. 2016, 15, 197–203. [Google Scholar] [CrossRef] [Scilit]
- Sutra, P.; Igau, A. Emerging Earth-abundant (Fe, Co, Ni, Cu) molecular complexes for solar fuel catalysis. Curr. Opin. Green Sustain. Chem. 2018, 10, 60–67. [Google Scholar] [CrossRef] [Scilit]
- Manzotti, A.; Robson, M.J.; Ciucci, F. Recent developments in membraneless electrolysis. Curr. Opin. Green Sustain. Chem. 2023, 40, 100765. [Google Scholar] [CrossRef] [Scilit]
- Lv, Z.; Liu, X.; Jia, B.; Wang, H.; Wu, Y.; Lu, Z. Development of a novel high-entropy alloy with eminent efficiency of degrading azo dye solutions. Sci. Rep. 2016, 6, 34213. [Google Scholar] [CrossRef] [Scilit]
- George, E.P.; Raabe, D.; Ritchie, R.O. High-entropy alloys. Nat. Rev. Mater. 2019, 4, 515–534. [Google Scholar] [CrossRef] [Scilit]
- Li, H.; Lai, J.; Li, Z.; Wang, L. Multi-sites electrocatalysis in high-entropy alloys. Adv. Funct. Mater. 2021, 31, 2106715. [Google Scholar] [CrossRef] [Scilit]
- Zhang, Y.; Wang, D.; Wang, S. High-entropy alloys for electrocatalysis: Design, characterization, and applications. Small 2022, 18, 2104339. [Google Scholar] [CrossRef] [Scilit] [PubMed]
- Jin, Z.; Lyu, J.; Zhao, Y.-L.; Li, H.; Lin, X.; Xie, G.; Liu, X.; Kai, J.-J.; Qiu, H.-J. Rugged high-entropy alloy nanowires with in situ formed surface spinel oxide as highly stable electrocatalyst in Zn–air batteries. ACS Mater. Lett. 2020, 2, 1698–1706. [Google Scholar] [CrossRef] [Scilit]
- Zhang, G.; Ming, K.; Kang, J.; Huang, Q.; Zhang, Z.; Zheng, X.; Bi, X. High entropy alloy as a highly active and stable electrocatalyst for hydrogen evolution reaction. Electrochim. Acta 2018, 279, 19–23. [Google Scholar] [CrossRef] [Scilit]
- Xi, M.; Chen, A.-R.; Yang, L.-F.; Long, Y.-Y.; Zhang, H.; An, X.-G.; Xiao, Q.-Z.; Sun, T.; Xiao, X.-C.; Xu, P. Effective hydrogen evolution enabled by heterogeneous interface engineering in bimetallic sulfide with MoNi alloy. Rare Met. 2025, 44, 3094–3106. [Google Scholar] [CrossRef] [Scilit]
- Yao, C.; Wang, Q.; Peng, C.; Wang, R.; Liu, J.; Tsidaeva, N.; Wang, W. MOF-derived CoS2/WS2 electrocatalysts with sulfurized interface for high-efficiency hydrogen evolution reaction: Synthesis, characterization and DFT calculations. Chem. Eng. J. 2024, 479, 147924. [Google Scholar] [CrossRef] [Scilit]
- Wang, P.; Zhang, X.; Zhang, J.; Wan, S.; Guo, S.; Lu, G.; Yao, J.; Huang, X. Precise tuning in platinum-nickel/nickel sulfide interface nanowires for synergistic hydrogen evolution catalysis. Nat. Commun. 2017, 8, 14580. [Google Scholar] [CrossRef] [Scilit] [PubMed]
- Huang, W.; Yang, J.; Jiang, W.; Tan, H. Preparation of FeCoNiMoCu High-Entropy Alloy Thin Film Electrode and Its Water Splitting Performance. Coatings 2025, 15, 1409. [Google Scholar] [CrossRef] [Scilit]
- Isse, A.A.; Gennaro, A. Absolute potential of the standard hydrogen electrode and the problem of interconversion of potentials in different solvents. J. Phys. Chem. B 2010, 114, 7894–7899. [Google Scholar] [CrossRef] [Scilit]
- Yang, Y.; Deng, R.; Wang, C.; Sun, J.; Iyer, A.K.; Laing, C.C.; Yao, H.; Ma, S.; Kanatzidis, M.G. Electrocatalytic Activity of the Brewer Intermetallic Phases Mo6Co7, W6Co7, and W6Fe7 for Hydrogen and Oxygen Evolution Reactions. Chem. Mater. 2024, 36, 2566–2576. [Google Scholar] [CrossRef] [Scilit]
- Exner, K.S. A universal descriptor for the screening of electrode materials for multiple-electron processes: Beyond the thermodynamic overpotential. ACS Catal. 2020, 10, 12607–12617. [Google Scholar] [CrossRef] [Scilit]
- Zhai, W.; Ma, Y.; Chen, D.; Ho, J.C.; Dai, Z.; Qu, Y. Recent progress on the long-term stability of hydrogen evolution reaction electrocatalysts. InfoMat 2022, 4, e12357. [Google Scholar] [CrossRef] [Scilit]
- Karmodak, N.; Andreussi, O. Catalytic activity and stability of two-dimensional materials for the hydrogen evolution reaction. ACS Energy Lett. 2020, 5, 885–891. [Google Scholar] [CrossRef] [Scilit]
- Dong, Y.; Deng, Z.; Zhang, H.; Liu, G.; Wang, X. A highly active and durable hierarchical electrocatalyst for large-current-density water splitting. Nano Lett. 2023, 23, 9087–9095. [Google Scholar] [CrossRef] [Scilit]
- Kim, H.K.; Jang, H.; Jin, X.; Kim, M.G.; Hwang, S.-J. A crucial role of enhanced Volmer-Tafel mechanism in improving the electrocatalytic activity via synergetic optimization of host, interlayer, and surface features of 2D nanosheets. Appl. Catal. B Environ. 2022, 312, 121391. [Google Scholar] [CrossRef] [Scilit]

Disclaimer/Publisher’s Note: The statements, opinions and data contained in all publications are solely those of the individual author(s) and contributor(s) and not of MDPI and/or the editor(s). MDPI and/or the editor(s) disclaim responsibility for any injury to people or property resulting from any ideas, methods, instructions or products referred to in the content. |
© 2026 by the authors. Licensee MDPI, Basel, Switzerland. This article is an open access article distributed under the terms and conditions of the Creative Commons Attribution (CC BY) license.