


Highlights
What are the main findings?
- •
- Phase Composition Change: Diamond addition alters the CoCuNiTi HEAC phase from FCC to BCC dominant, enhancing crystallinity.
- •
- Microstructural Refinement: Dendritic structure is refined with diamond inclusion, eliminating hole defects and enhancing elemental distribution uniformity.
- •
- Wear & Corrosion Performance: 1.0 wt.% diamond improves wear resistance significantly; 0.5 wt.% diamond optimizes corrosion resistance by forming a dense passivation film.
What are the implications of the main findings?
- •
- Material Design Guideline: Provides insights for designing high-performance CoCuNiTi-based HEACs with tailored diamond content for specific industrial applications requiring enhanced wear and corrosion resistance.
- •
- Surface Engineering Strategy: Demonstrates the effectiveness of laser cladding with diamond reinforcement as a surface modification technique to extend the service life of engineering components in harsh environments.
- •
- Alloy Development Pathway: Highlights the importance of balancing diamond content to achieve optimal microstructure and properties, guiding future research in high-entropy alloy composite coatings.
Abstract
CoCuNiTi HEACs reinforced by different diamond contents were prepared on the surface of 45 steel substrate by laser cladding. Their phase composition, microstructure, elemental composition, and wear/corrosion resistance were investigated using XRD, OM, SEM, EDS, a friction and wear testing machine, and an electrochemical workstation, respectively. The results show that after adding diamond, the phase composition of the sample transforms from the original dual-phase structure of the FCC main phase and BCC to the dual-phase structure of the BCC main phase and FCC. With an increase in the diamond content, the diffraction peak intensity of the alloy phases first increases and then decreases. This behavior is related to the significant enhancement of the alloy phase crystallinity with low diamond addition and the intensified crystal lattice distortion caused by excessive diamond addition. The CoCuNiTi + x Diamond (C) (x = 0, 0.5, and 1.0 wt.%) high-entropy alloys have a dendritic structure. After the addition of diamond, no hole defects were observed in the microstructure, and the dendritic structure was significantly refined. Ti and C are enriched in the primary phase, Cu is enriched in the interdendrite regions, and Co exhibits the highest concentration in the dendrite regions. The segregation coefficients of Ni in all three alloys are relatively small. As the diamond content increases, the friction coefficient of the samples decreases significantly. The 1 wt.% diamond sample exhibits the best wear resistance, primarily owing to the combined effects of superhard phase strengthening, solid solution strengthening, and fine grain strengthening resulting from diamond addition. The sample with 0.5 wt.% diamond addition has the lowest self-corrosion current density, highest polarization resistance, and lowest annual corrosion rate, indicating the best corrosion resistance. This performance is mainly attributed to the refinement of the microstructure, reduction in defects, and formation of a dense passivation film caused by the addition of a small amount of diamond.
1. Introduction
In the equipment manufacturing industry, 45 steel plays a key role, owing to its good comprehensive mechanical properties, outstanding machinability, and high-performance price ratio [1]. However, due to its insufficient wear and corrosion resistance, the application range and service life of 45 steel in harsh environments are severely restricted [2]. With the rapid development of industrial technology, the surface properties of materials face unprecedented challenges to meet increasingly stringent working conditions. In recent years, with the continuous expansion of high-entropy alloy (HEA) systems and research scope, these alloys have gradually become a research hotspot in the field of surface engineering because of their excellent properties, such as high strength and wear resistance [3,4], tempering softening resistance [5], oxidation resistance [6], and corrosion resistance [7,8].
Laser cladding is widely used to prepare high-entropy alloy coatings (HEACs) because of its extremely high heating and cooling rates, small heat-affected zone, and atomic-level metallurgical bonding with the substrate [9,10]. Diamond, the hardest material known in nature, is commonly used as a superhard phase additive in laser cladding coatings [11,12]. The introduction of diamond particles not only significantly enhances the hardness and wear resistance of the coating but also alters the phase composition and microstructure of the alloy [13,14,15,16]. Zhang et al. [13] employed laser cladding to deposit (FeNiCoCrTi0.5)Cx HEACs with different diamond contents on the surface of a 45 steel substrate. The diamond-containing coating had no pores or cracks and exhibited strong metallurgical bonding with the substrate. The addition of diamond destabilizes the body-centered cubic (BCC) solid solution and promotes the precipitation of carbide. The hardness of the alloy increased with increasing diamond content. When the diamond content is 12 wt.%, the alloy hardness is four times that of the 45-steel substrate. Chen et al. [14] successfully fabricated a FeCoCrNiAl0.5 HEA/diamond@ W/Ni composite coating via laser cladding. The addition of diamond particles can accelerate the solidification of the local melt and form pores around the diamond particles or adjacent to, but separate from, the diamond. The high thermal conductivity of diamond causes localized undercooling and accelerated solidification of the melt. The heat flow coupling mechanism formed by pores can improve the interface integrity of low-defect HEA/diamond coatings. Bu et al. [15] prepared diamond-reinforced FeCoCrNiAl0.5Ti0.5Si0.2 -carbonized HEACs with BCC1 and BCC2 dual-phase structures. The dilution rate of the coating decreased with the addition of diamond. After the addition of diamond, TiC and Cr23C6 phases appeared in the coating. When the diamond content was 12 wt.%, the hardness of the alloy was approximately three times that of the TC4 substrate. The addition of diamond transformed the wear mechanism of the coating from adhesive to abrasive wear. Compared with the substrate, the wear loss of the sample containing 12 wt % diamond was reduced by 64.4%. Peng et al. [16] prepared Ti-coated diamond/HEA composites. The TiC layer can prevent direct contact between the diamond particles and HEA elements, thereby inhibiting diamond graphitization and enhancing the interfacial bonding strength. Some Ti in the Ti layer diffused into the HEA matrix, aggravating the lattice distortion and producing a solid solution strengthening effect. Using first-principles simulations, it was proven that the in situ formed TiC acts as a diffusion barrier between the diamond and HEA matrix, resulting in a decrease in the sp2 hybridization of diamond and an increase in the interfacial bonding strength. Typically, there is no simple linear relationship between the amount of diamond added and performance. During laser cladding, diamond particles may be graphitized or react with the molten alloy to form carbides [16], which affect the microstructure and properties of the coating. Therefore, it is necessary to optimize specific high-entropy alloy systems to achieve optimal performance.
CoCuNiTi HEA is a relatively novel alloy system. Current research on this alloy mainly focuses on rare-earth oxide doping [17], element substitution or addition [18,19], element concentration change [20], and reinforcement phase strengthening [21]. The addition of 1 wt.% CeO2 to the CoCuNiTi alloy can transform its phase structure from the original face-centered cubic (FCC) main phase and BCC dual-phase structure to the BCC main phase and FCC dual-phase structure. This phase structure evolution is primarily due to the fact that CeO2 can help improve the temperature gradient during the solidification of the alloy melt and reduce the nucleation resistance and diffusion distance. The addition of 1 wt.% CeO2 can reduce the primary dendrite width from 8.10 to 6.51 μm and significantly improve its corrosion resistance [17,22]. Jiang et al. [18] prepared CoCrNiTi alloy films with Cr replacing Cu using magnetron sputtering. The crystallinity of the alloy film is positively correlated with the bias voltage, whereas the roughness is negatively correlated with the bias voltage. This is mainly because the bias voltage enhances the bombardment and diffusion abilities of the particles. At a bias voltage of −150 V, the prepared alloy film has the highest hardness and toughness, along with the lowest wear rate. Mohanty et al. [19] employed mechanical alloying to synthesize a single-phase FCC CoCuFeNiTi alloy with equimolar Fe addition. This FCC phase is metastable, and phase separation occurs during high-temperature sintering. Initially, it is separated into Ti-rich BCC and Co-/Cu-/Ni-rich FCC phases. Subsequently, the Co-/Cu-/Ni-rich FCC phase further separates into two new FCC phases. Li et al. [20] prepared CoCrNiTi films composed of FCC and amorphous phases. The proportion of the amorphous phase can be changed by adjusting the Ti content of the alloy. The hardness, toughness, and adhesion strength of the alloy increase first and then decrease with increasing Ti content. When the Ti content is 12.5 at. %, the alloy exhibits the maximum hardness, toughness, and bonding strength, along with the lowest wear rate. As the Ti content increases, the alloy film becomes denser. When the Ti content reaches 23.4 at. %, the alloy film exhibits optimal corrosion resistance. Wang et al. [21] prepared FeCoCrNi-Mo HEA/diamond composite coatings using high-speed laser cladding. When the cladding power is 3000 W and the scanning speed is 50 mm/s, the composite coating exhibits a uniform microstructure, the lowest dilution rate, and the best wear resistance. Although the addition of diamond improves the wear resistance of the composite coating, it increases the probability of microcrack formation.
To date, no studies on diamond-reinforced CoCuNiTi HEACs have been found. In this study, CoCuNiTi + x Diamond (C) (x = 0, 0.5, and 1.0 wt.%) HEACs with different diamond additions were prepared on the surface of a 45-steel substrate by laser cladding. This study thoroughly examines the influence of diamond content on the phase composition, microstructure, element distribution, and wear/corrosion resistance of CoCuNiTi, elucidating the underlying mechanisms. This study contributes to enriching and refining the theoretical framework of CoCuNiTi-based high-entropy alloys, providing essential data for their potential applications and future investigations.
2. Materials and Methods
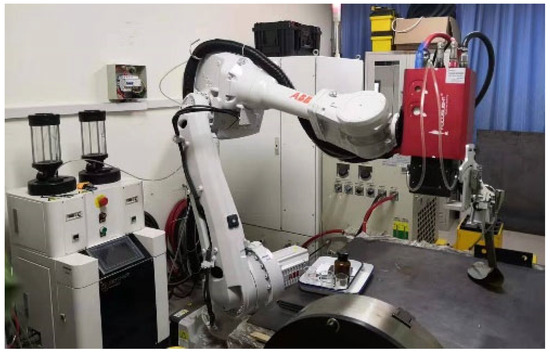
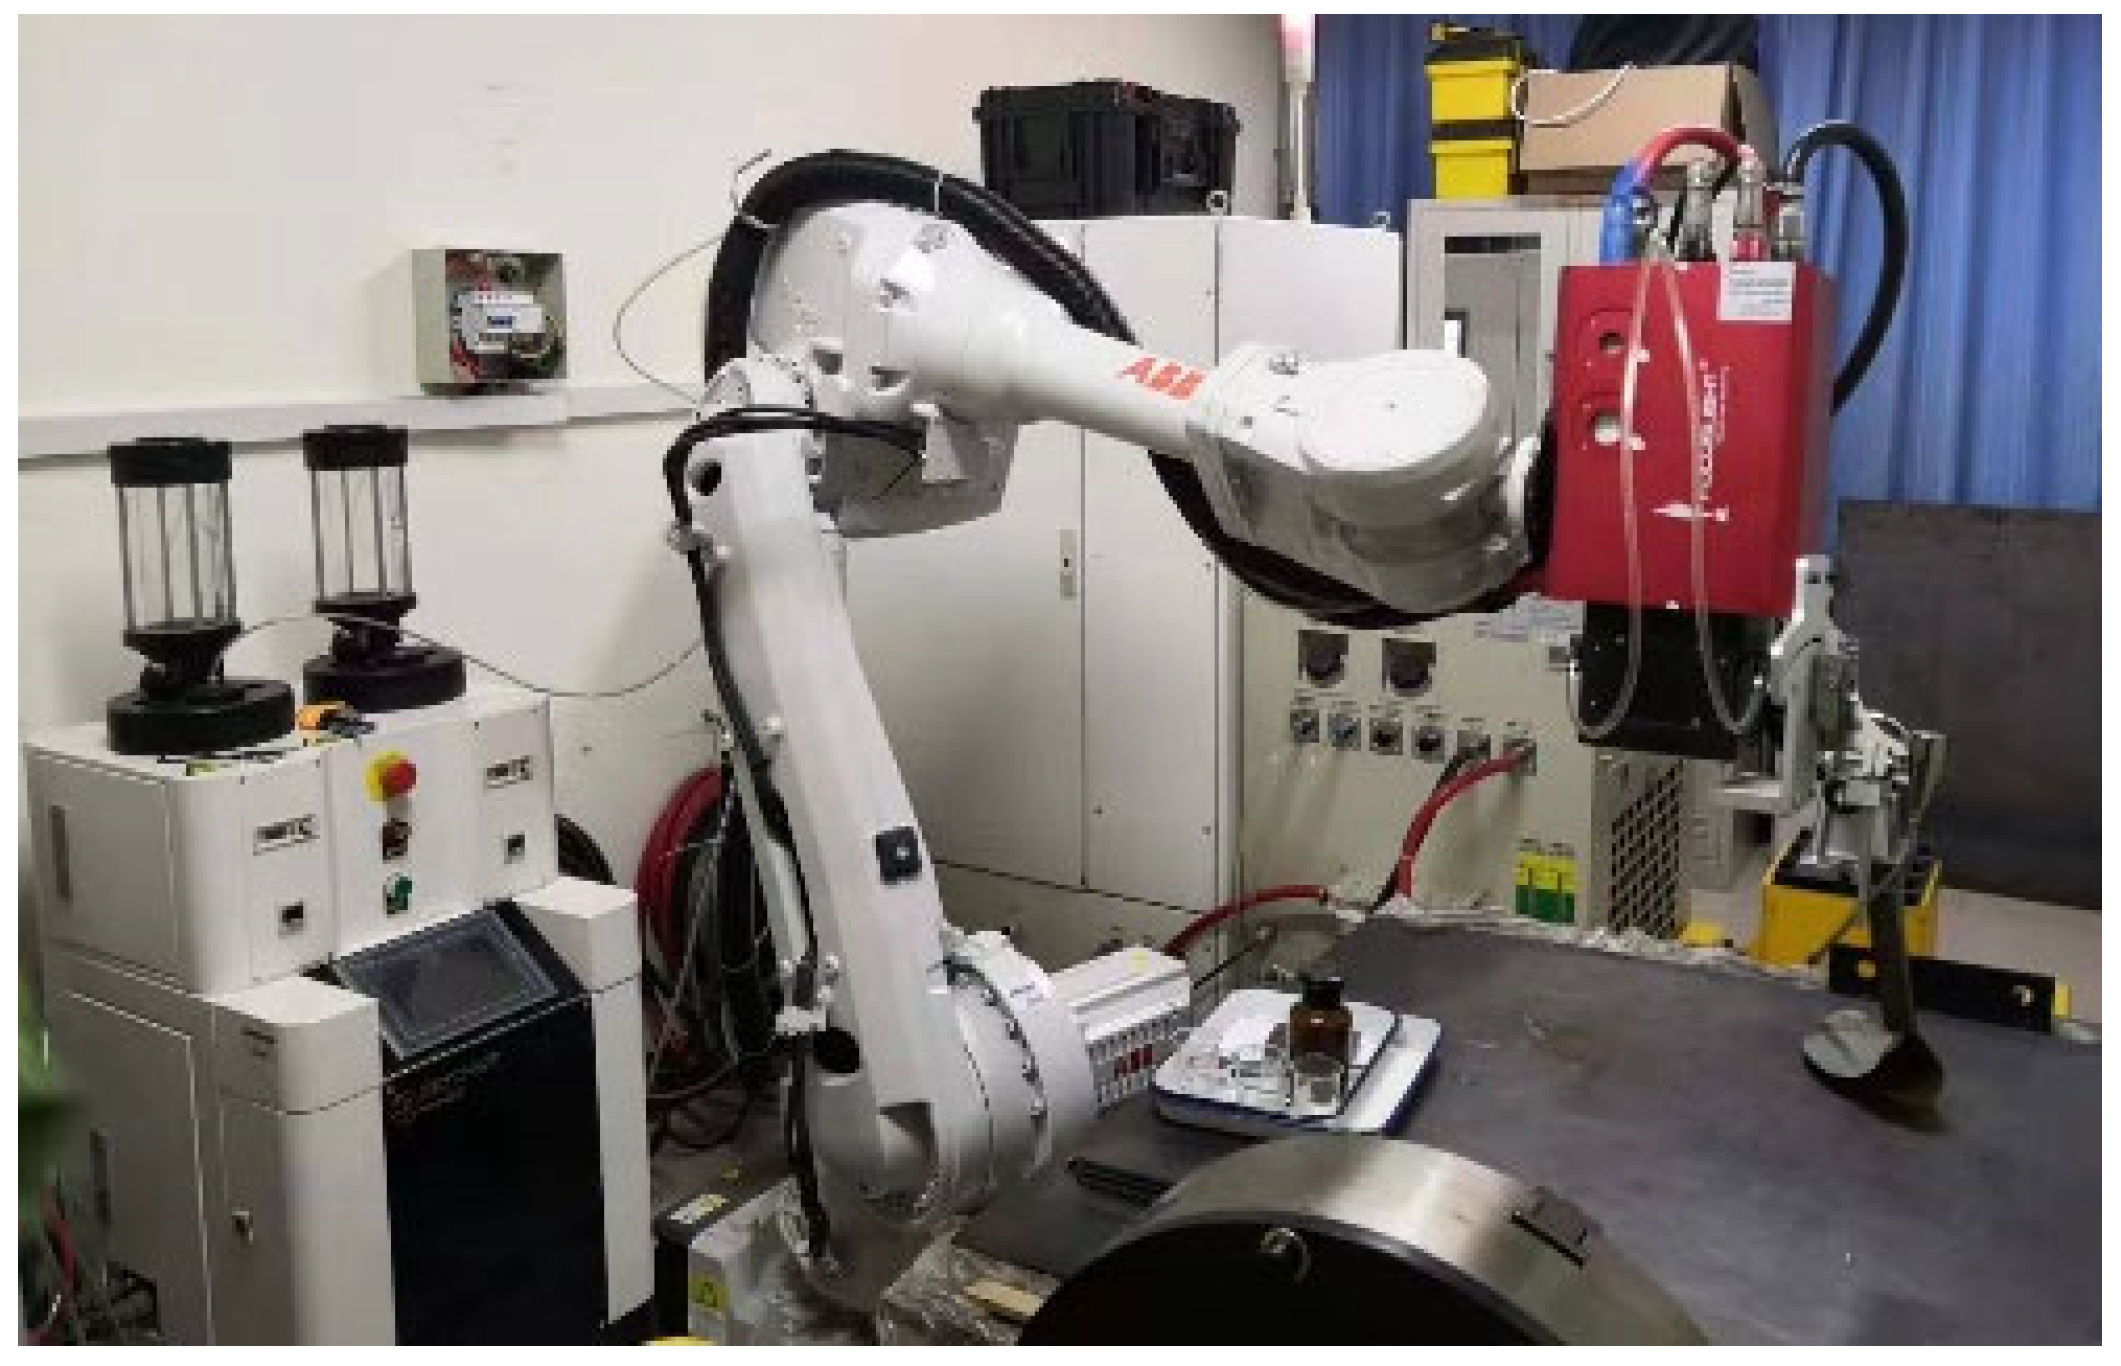
CoCuNiTi alloys with equal molar ratios were prepared by laser cladding, followed by the preparation of samples containing 0.5 wt.% and 1.0 wt.% diamond additions under identical process parameters. The reasons for selecting 0.5 wt.% and 1.0 wt.% as the diamond addition levels are as follows: (1) Excessive diamond addition significantly increases the tendency for particle agglomeration and microcrack formation [21]. (2) Diamonds generally have a lower density than metallic elements and tend to accumulate at the top of the cladding layer. Excessive addition significantly increases the graphitization tendency [16] and the tendency for interface weakening between diamonds and high-entropy alloys [14]. (3) Excessive diamond addition causes significant internal stress owing to its large thermal expansion coefficient difference from the alloy coating. (4) Appropriate diamond addition not only enhances the probability of non-uniform nucleation at higher temperatures but also achieves solid-solution strengthening by diffusing into the lattice structure of the alloy phase [16]. (5) Excessive diamond content readily generates carbides [13,15] that degrade the performance while significantly increasing the costs, thereby limiting the industrial-scale adoption. (6) Although increasing the diamond content can significantly enhance hardness, excessive addition leads to reduced corrosion resistance and toughness [13]. The required quantities of pure metal powder (200 mesh particle size, purity greater than 99.5%) and diamond particles (80 mesh particle size, purity greater than 99%, uncoated) were weighed according to the specified ratio. The mixture was ground in a mortar for 30 min. The cladding substrate was 45 steel after grinding, cleaning, and drying. Using an FL-DLight3-4000 laser (Focuslight Technologies Inc., Xi’an, China, see Figure 1) under argon gas protection, CoCuNiTi + x Diamond (C) (x = 0, 0.5, and 1.0 wt.%) HEACs were fabricated on the substrate surface. The preparation process parameters were as follows: laser power of 3 kW, scanning speed of 5 mm/s, spot diameter of 6 mm, and laser distance of 30 cm from the cladding surface. The prepared samples were single-layer structures completed in a single laser-cladding pass. High-purity argon gas was used as the shielding gas, with a gas pressure of 1.1 GPa and a gas flow rate of 15 L/min. Finally, the prepared samples were cut into metal blocks measuring 10 mm × 10 mm × 5 mm in size. The tested surface was ground in the order of 180, 360, 400, 600, 800, 1000, 1200, and 1500 # metallographic sandpaper. The samples were polished with a W1.5 diamond grinding paste for approximately 20 min. After polishing, aqua regia was used for corrosion, and the time was approximately 3 s. The samples were then immediately rinsed with alcohol and blow-dried.
Figure 1.
Photograph of FL-DLight3-4000 laser equipment used for CoCuNiTi + x Diamond (C) (x = 0, 0.5, and 1.0 wt.%) cladding layer.
The phase structure of CoCuNiTi + x Diamond (C) (x = 0, 0.5, and 1.0 wt.%) samples were characterized using an Ultima IV X-ray diffractometer (XRD, Rigaku Corporation, Tokyo, Japan) at an operating voltage and current of 40 kV and 20 mA, respectively. Microstructural analysis was performed using a DMM-150C optical microscope (OM, Carl Zeiss Management Co., Ltd., Oberkochen, Germany) and a PHENOM PROX scanning electron microscope (SEM, Funa scientific instruments Co., Eindhoven, The Netherlands). The wear behavior was evaluated using an MFT-R4000 reciprocating friction (Lanzhou Huahui Instrument Technology Co., Ltd., Lanzhou, China) and wear tester at room temperature, employing a 6 mm diameter tungsten carbide ball as the friction pair under a load of 10 N and a reciprocating frequency of 5 Hz. The stroke length was 5 mm, resulting in a total sliding distance of 4500 m (calculated as stroke length × 2 × frequency × time). The test duration was 900 s. Each test was repeated three times, and the friction pair was cleaned after each test to ensure the reliability of the data. Elemental analysis of different regions was performed using Aztec X-Max 90 energy-dispersive spectrometry (EDS, Oxford Instruments, Oxford, UK). The corrosion behavior was evaluated in a three-electrode system using a CHI 760E electrochemical workstation (Shanghai Chenhua Science Technology Corp., Shanghai, China). Except for the test surface, all other surfaces of the sample were encapsulated with 703 silicone to ensure that only the test surface was in contact with the NaCl solution during electrochemical testing. After sample preparation, the specimens were left for 24 h to allow the 703 silicone to fully cure. To ensure electrochemical stability, the test samples were pre-soaked in a 3.5% NaCl solution for approximately 20 min before testing, allowing the open circuit potential to stabilize. The test specimen served as the working electrode, with a saturated calomel electrode (SCE) as the reference electrode and a Pt electrode as the auxiliary electrode. Polarization curve testing was subsequently conducted over a scanning range of −1.5 to 0.5 V at a scanning rate of 2 mV/s. EIS testing was performed over a frequency range of 100,000–0.01 Hz with an amplitude of 5 mV. EIS circuit fitting was performed using ZSimDemo 3.30d software, with the circuit fitted to an R(QR) model. All tests were performed at room temperature.
3. Results and Discussion
3.1. Phase Structure
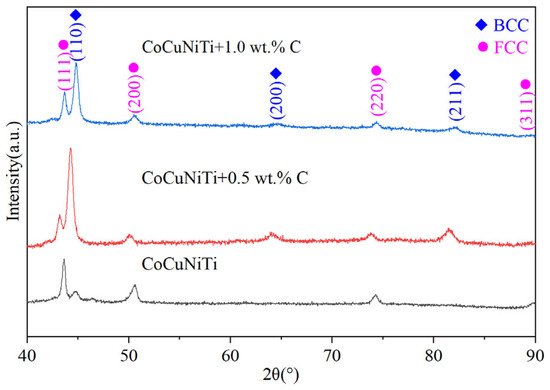
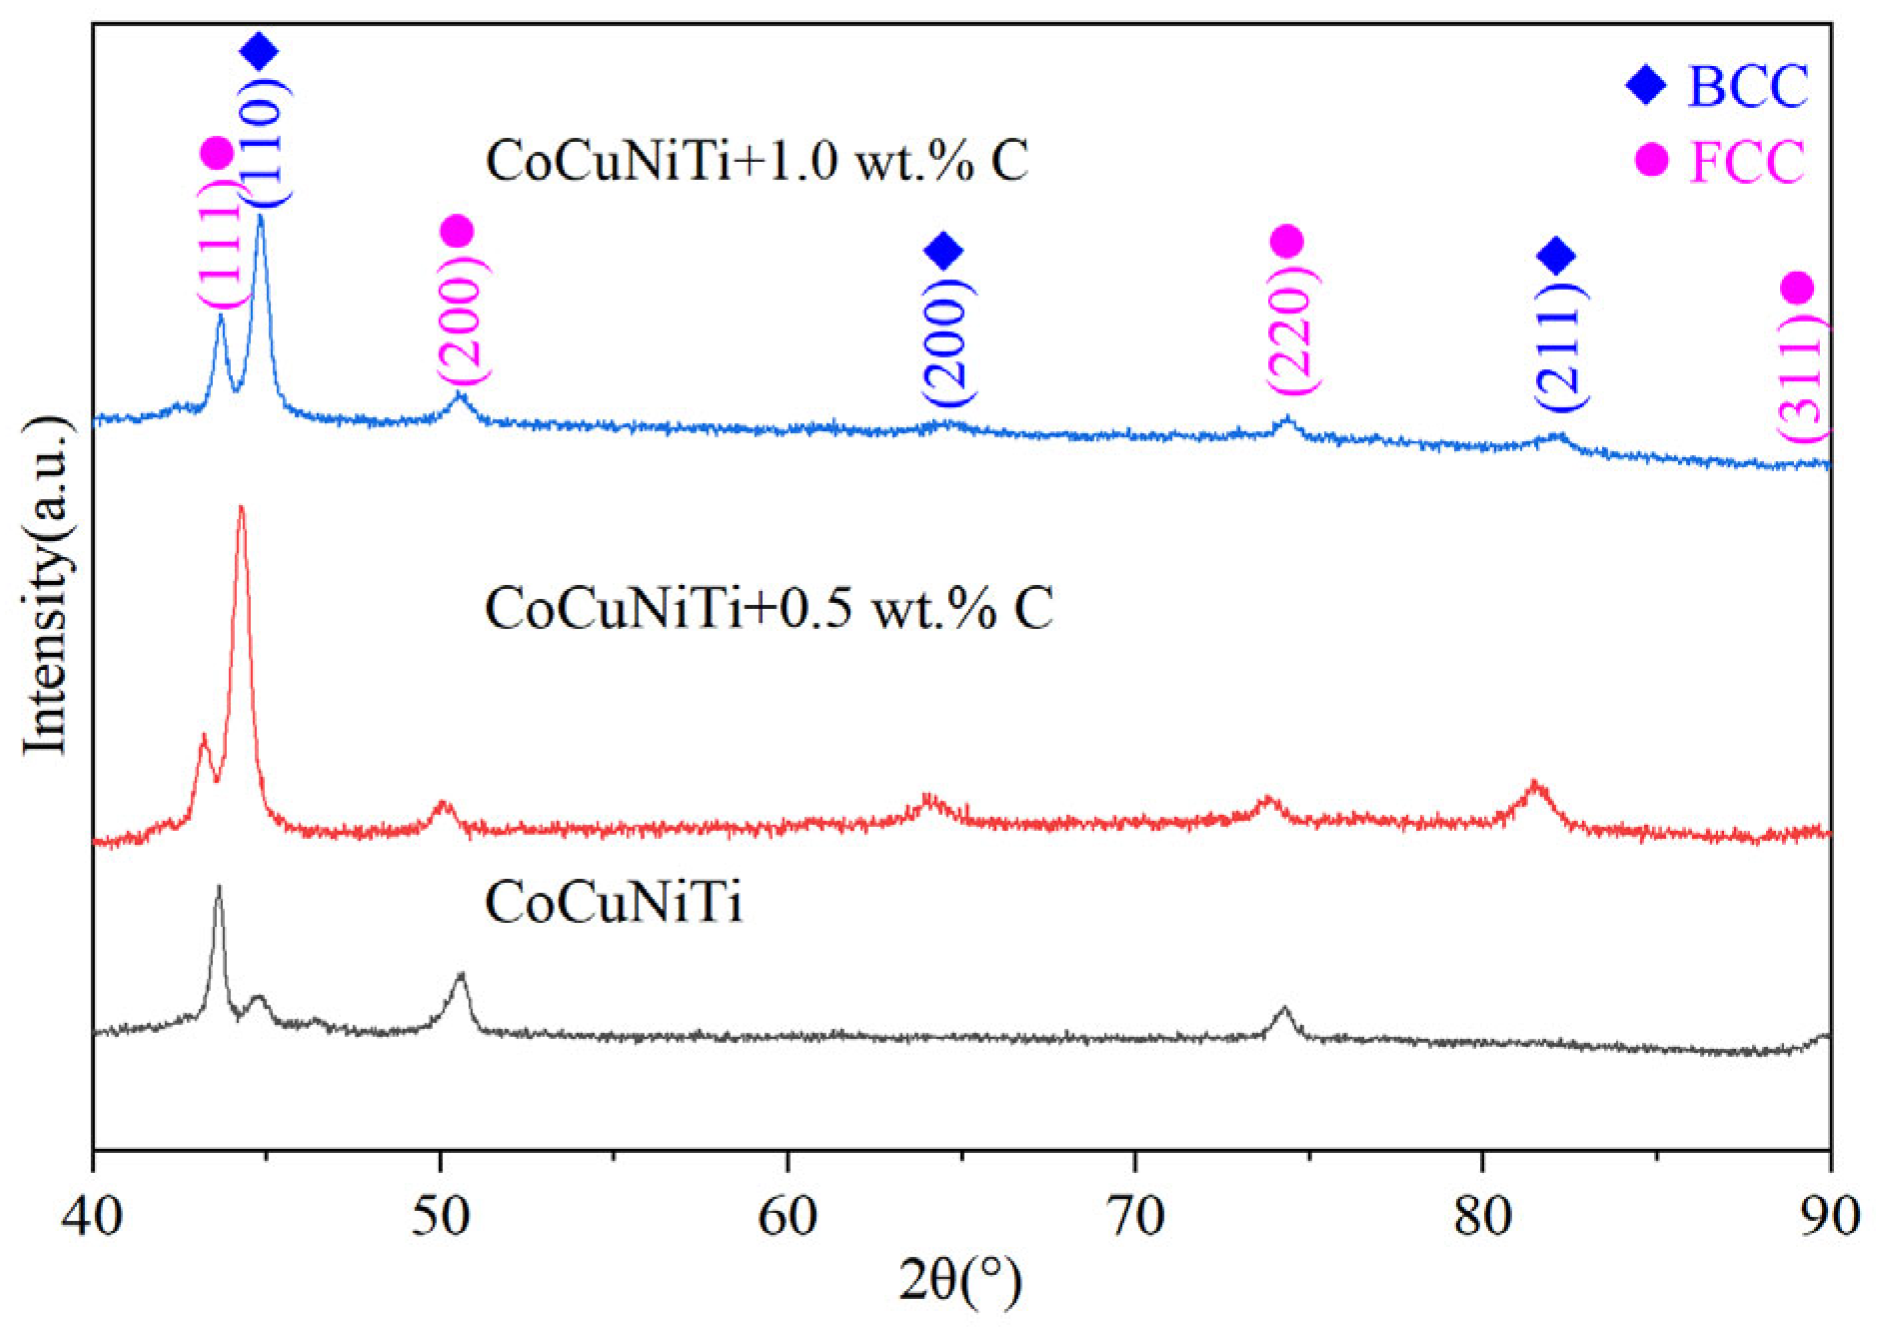
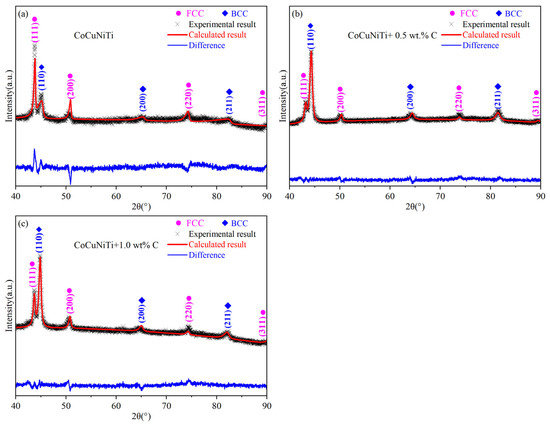
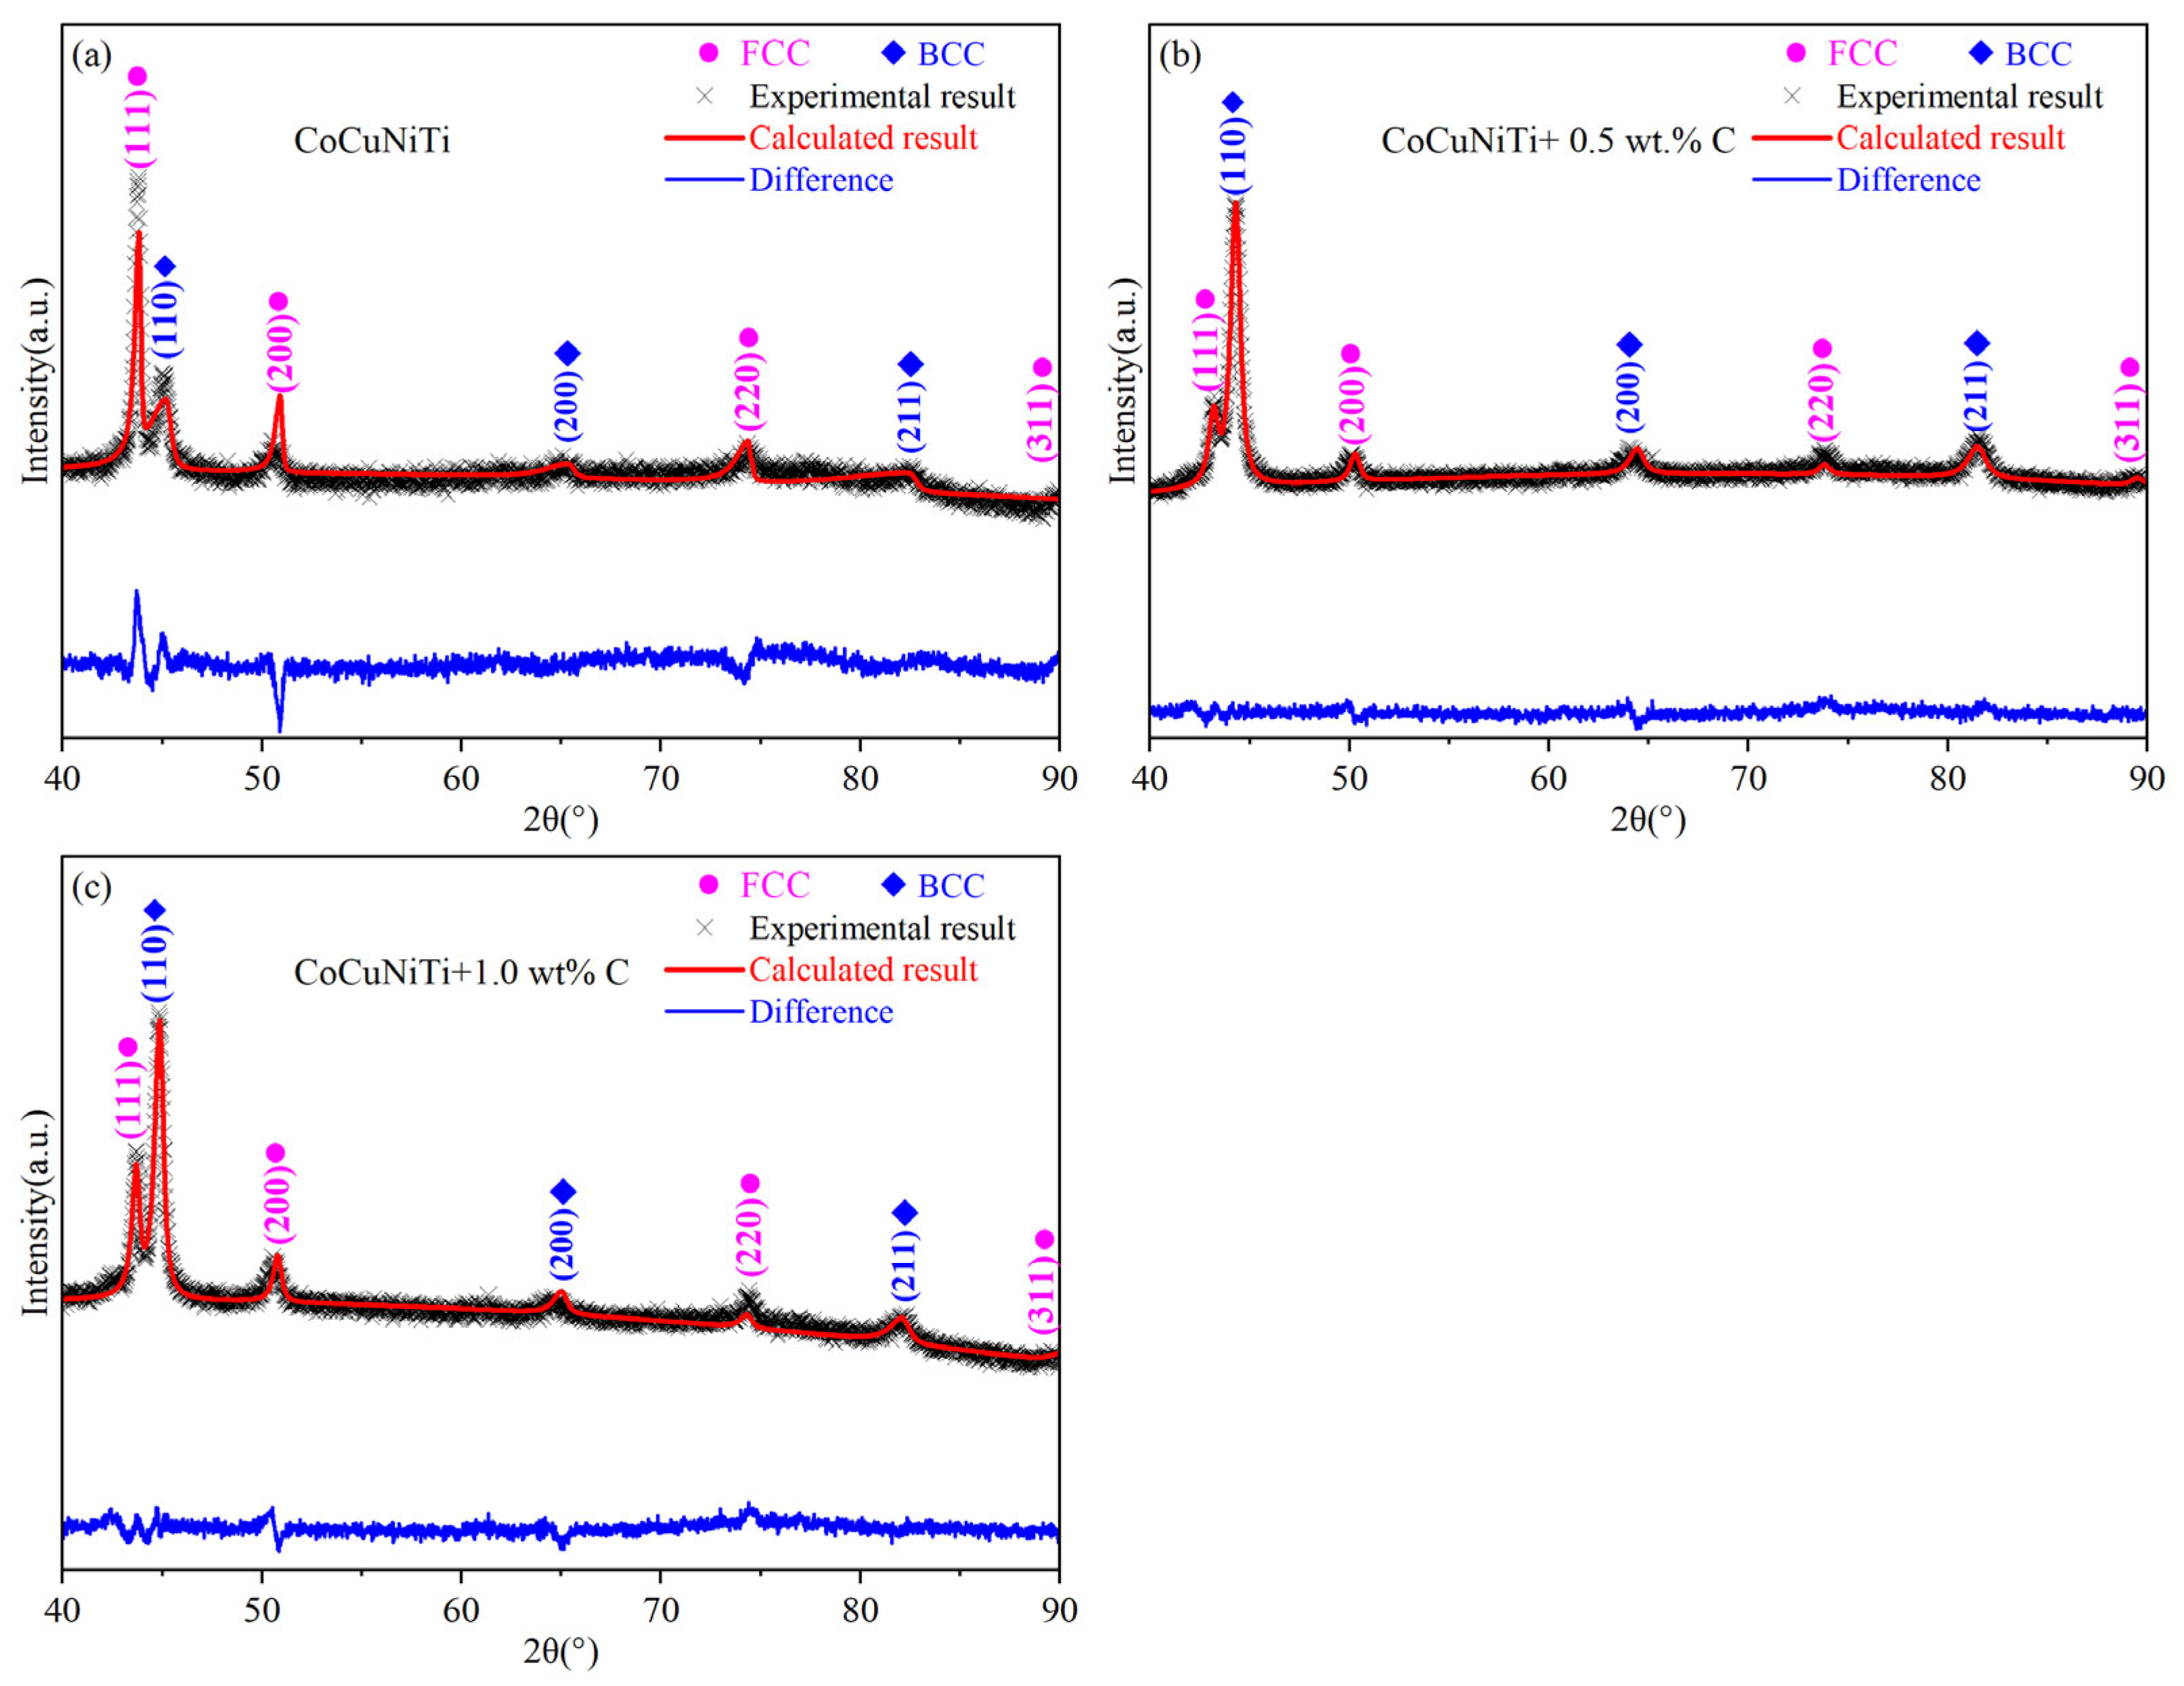
Figure 2 shows the XRD patterns of CoCuNiTi + x Diamond (C) (x = 0, 0.5, and 1.0 wt.%) samples. The ratios of Sin2θ marked as the diffraction peak angles of FCC and BCC in CoCuNiTi + x Diamond (C) (x = 0, 0.5, and 1.0 wt.%) alloys were calculated to be 3.00:3.98:7.92:10.85 and 2.00:4.02:5.99, 3.00:3.97:7.99:11.00 and 2.00:3.96:5.98, 3.00:3.97:7.91:10.84 and 2.00:3.98:5.95, respectively. According to the extinction law of lattice structures [23], the diffraction peaks labeled FCC and BCC in the above three alloys correspond to the face-centered cubic and body-centered cubic phases, respectively. The diffraction peaks of the FCC and BCC phases correspond to the crystal planes (111), (200), (220), (311), and (110), (200), (211), respectively. To better understand the space groups, lattice constants, cell volumes, and relative contents of each alloy phase in CoCuNiTi + x Diamond (C) (x = 0, 0.5, and 1.0 wt.%) alloys, the whole pattern fitting and Rietveld refinement (WPFRR) analysis of the X-ray diffraction data in Figure 2 yielded the results shown in Figure 3. The refinement weighting factors (R) for the CoCuNiTi + x Diamond (C) (x = 0, 0.5, and 1.0 wt.%) alloys are 6.82%, 1.70%, and 2.63%, respectively. The refinement results are presented in Table 1. No carbide diffraction peak was observed in the XRD pattern of diamond, which may be due to the low addition amount of diamond and the fast-cooling rate, which resulted in only light graphitization [24]. In addition, the weight factor of the diamond-containing sample refinement is small, indicating that the refinement results are highly reliable. As shown in Table 1, the CoCuNiTi + x Diamond (C) (x = 0, 0.5, and 1.0 wt.%) alloys all exhibit a dual-phase structure composed of FCC and BCC. However, upon the addition of diamond, the alloy phase transforms from the original FCC main phase to the BCC main phase. This is because the temperature of laser cladding is generally lower than 3000 °C [25], whereas the melting point of diamond is 3550 °C (see Table 2). Table 2 lists the characteristic parameters of each alloying element in CoCuNiTi + x Diamond (C) (x = 0, 0.5, and 1.0 wt.%) samples. The heat source temperature during laser cladding is higher than that of all the metal elements in the CoCuNiTi alloy but is still lower than the melting point of diamond. During the cooling process of the alloy melt, to reduce nucleation resistance, Ti (1660 °C) with a higher melting point may preferentially adhere to the surface of unmelted solid diamond particles for heterogeneous nucleation. Ti typically has an HCP phase (α phase) structure at room temperature and a BCC structure (β phase) above 882 °C [26]. Compared with the sample without diamond, this greatly increases the precipitation and growth rates of Ti with a BCC structure at the same solidification temperature, which is beneficial for increasing the BCC phase content in the melt. In addition, compared with the CoCuNiTi alloy, the lattice constant and unit cell volume of the diamond-containing samples are smaller. This is primarily due to the addition of diamond particles, which significantly reduces the degree of undercooling required for solid phase precipitation from the melt. More solid-phase crystal billets in the alloy melt precipitate at higher temperatures, which is beneficial for increasing the diffusion rate and reducing the diffusion distance, thereby significantly improving the crystallinity of the alloy phase. This finding aligns with the test results shown in Figure 2, where the diamond-containing samples exhibit higher peak intensities in their diffraction patterns. The higher the crystallinity, the more regular the atomic arrangement, that is, the closer it approaches the ideal state (with a lower refinement weight factor), which can produce strong coherent diffraction of X-rays. This facilitates the formation of sharper and more intense diffraction peaks.
Figure 2.
X-ray diffraction patterns of CoCuNiTi + x Diamond (C) (x = 0, 0.5, and 1.0 wt.%) alloys.
Figure 3.
WPFRR patterns of CoCuNiTi + x Diamond (C) (x = 0, 0.5, and 1.0 wt.%) alloys. (a) x = 0 wt.%; (b) x = 0.5 wt.%; (c) x = 1.0 wt.%.
Table 1.
WPFRR results of CoCuNiTi + x Diamond (C) (x = 0, 0.5, and 1.0 wt.%) alloys.
Table 2.
Characteristic parameters of CoCuNiTi + x Diamond (C) (x = 0, 0.5, and 1.0 wt.%) alloying elements.
CoCuNiTi + x Diamond (C) (x = 0, 0.5, and 1.0 wt.%) alloys form a two-phase structure due to the high-entropy effect in multi-component alloys. To determine the thermodynamic stability of these alloys, the Gibbs free energy (ΔGmix) was calculated for each alloy at room temperature (298.15 K) using Equations (1)–(3) [27,28]. The results are presented in Table 3.
where ΔHmix is the mixing enthalpy (kJ/mol), T is the thermodynamic temperature (K), ΔSmix is the mixing entropy (J/(K·mol)), R is the gas constant, N is the number of components of the alloy, ci is the molar percentage of component i, and is the enthalpy of mixing between components i and j. Table 4 presents the enthalpy of mixing between any two elements in CoCuNiTi + x Diamond (C) (x = 0, 0.5, and 1.0 wt.%) alloys, sourced from the literature [29]. As shown in Table 3, with increasing diamond content, the alloy exhibits a more negative mixing enthalpy and a more positive mixing entropy. This trend favors a reduction in Gibbs free energy, indicating greater stability in the alloy system. According to the relevant literature on the phase formation of high-entropy alloys, the atomic radius difference (δ), the valence electron concentration (VEC), and the phase formation parameter (Ω) can be expressed by the following equations [30,31]:
where ri denotes the atomic radius of component i and represents the average atomic radius of the alloy elements. Using Equations (4)–(7), the values of δ, VEC, and Ω for CoCuNiTi + x Diamond (C) (x = 0, 0.5, and 1.0 wt.%) alloys were calculated, with the results shown in Table 3. The atomic radius difference between the elements in Table 4 was obtained using Equation (4). The Ω phase formation theory [32] states that when Ω > 1.0, solid solution phase structures are readily formed; conversely, intermetallic compounds are more likely to form. As shown in Table 3, the Ω values of CoCuNiTi + x Diamond (C) (x = 0, 0.5, and 1.0 wt.%) alloys are obviously greater than 1.0, indicating that these three alloys can more easily form solid solution phase structures. According to the formation law of the VEC phase [30], when VEC > 8, the FCC phase can exist stably. When VEC < 6.87, the BCC phase tends to be stable. That is, a smaller VEC favors the formation of the BCC phase, whereas a larger VEC favors the formation of the FCC phase. After adding diamond, the VECs of the samples are gradually reduced, indicating that it is helpful in the formation of the BCC phase. This aligns with the refinement results in Table 1, which show a significant increase in the BCC phase content of the diamond-containing samples. However, when the diamond content reaches 1 wt.%, although VEC still has a small decrease (1.19%), δ increases significantly (20.00%). Table 4 also reveals that carbon exhibits the largest atomic radius difference with all other alloying elements. According to the theory of solid-solution formation [33], a greater atomic radius difference between the alloying elements in a sample is detrimental to the formation of stable solid-solution phases and hinders the reduction in lattice distortion within the alloy phases. Under the same conditions, an increase in the degree of unit cell distortion leads to a decrease in the intensity of the alloy phase diffraction peaks, which is consistent with the XRD results shown in Figure 2.
Table 3.
Thermodynamic parameters of CoCuNiTi + x Diamond (C) (x = 0, 0.5, and 1.0 wt.%) alloys.
Table 4.
Atomic radius difference δ and mixed enthalpy between the various elements in CoCuNiTi + x Diamond (C) (x = 0, 0.5, and 1.0 wt.%) alloys.
3.2. Microstructure
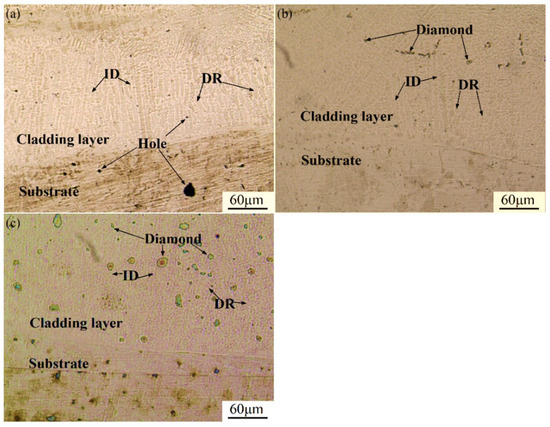
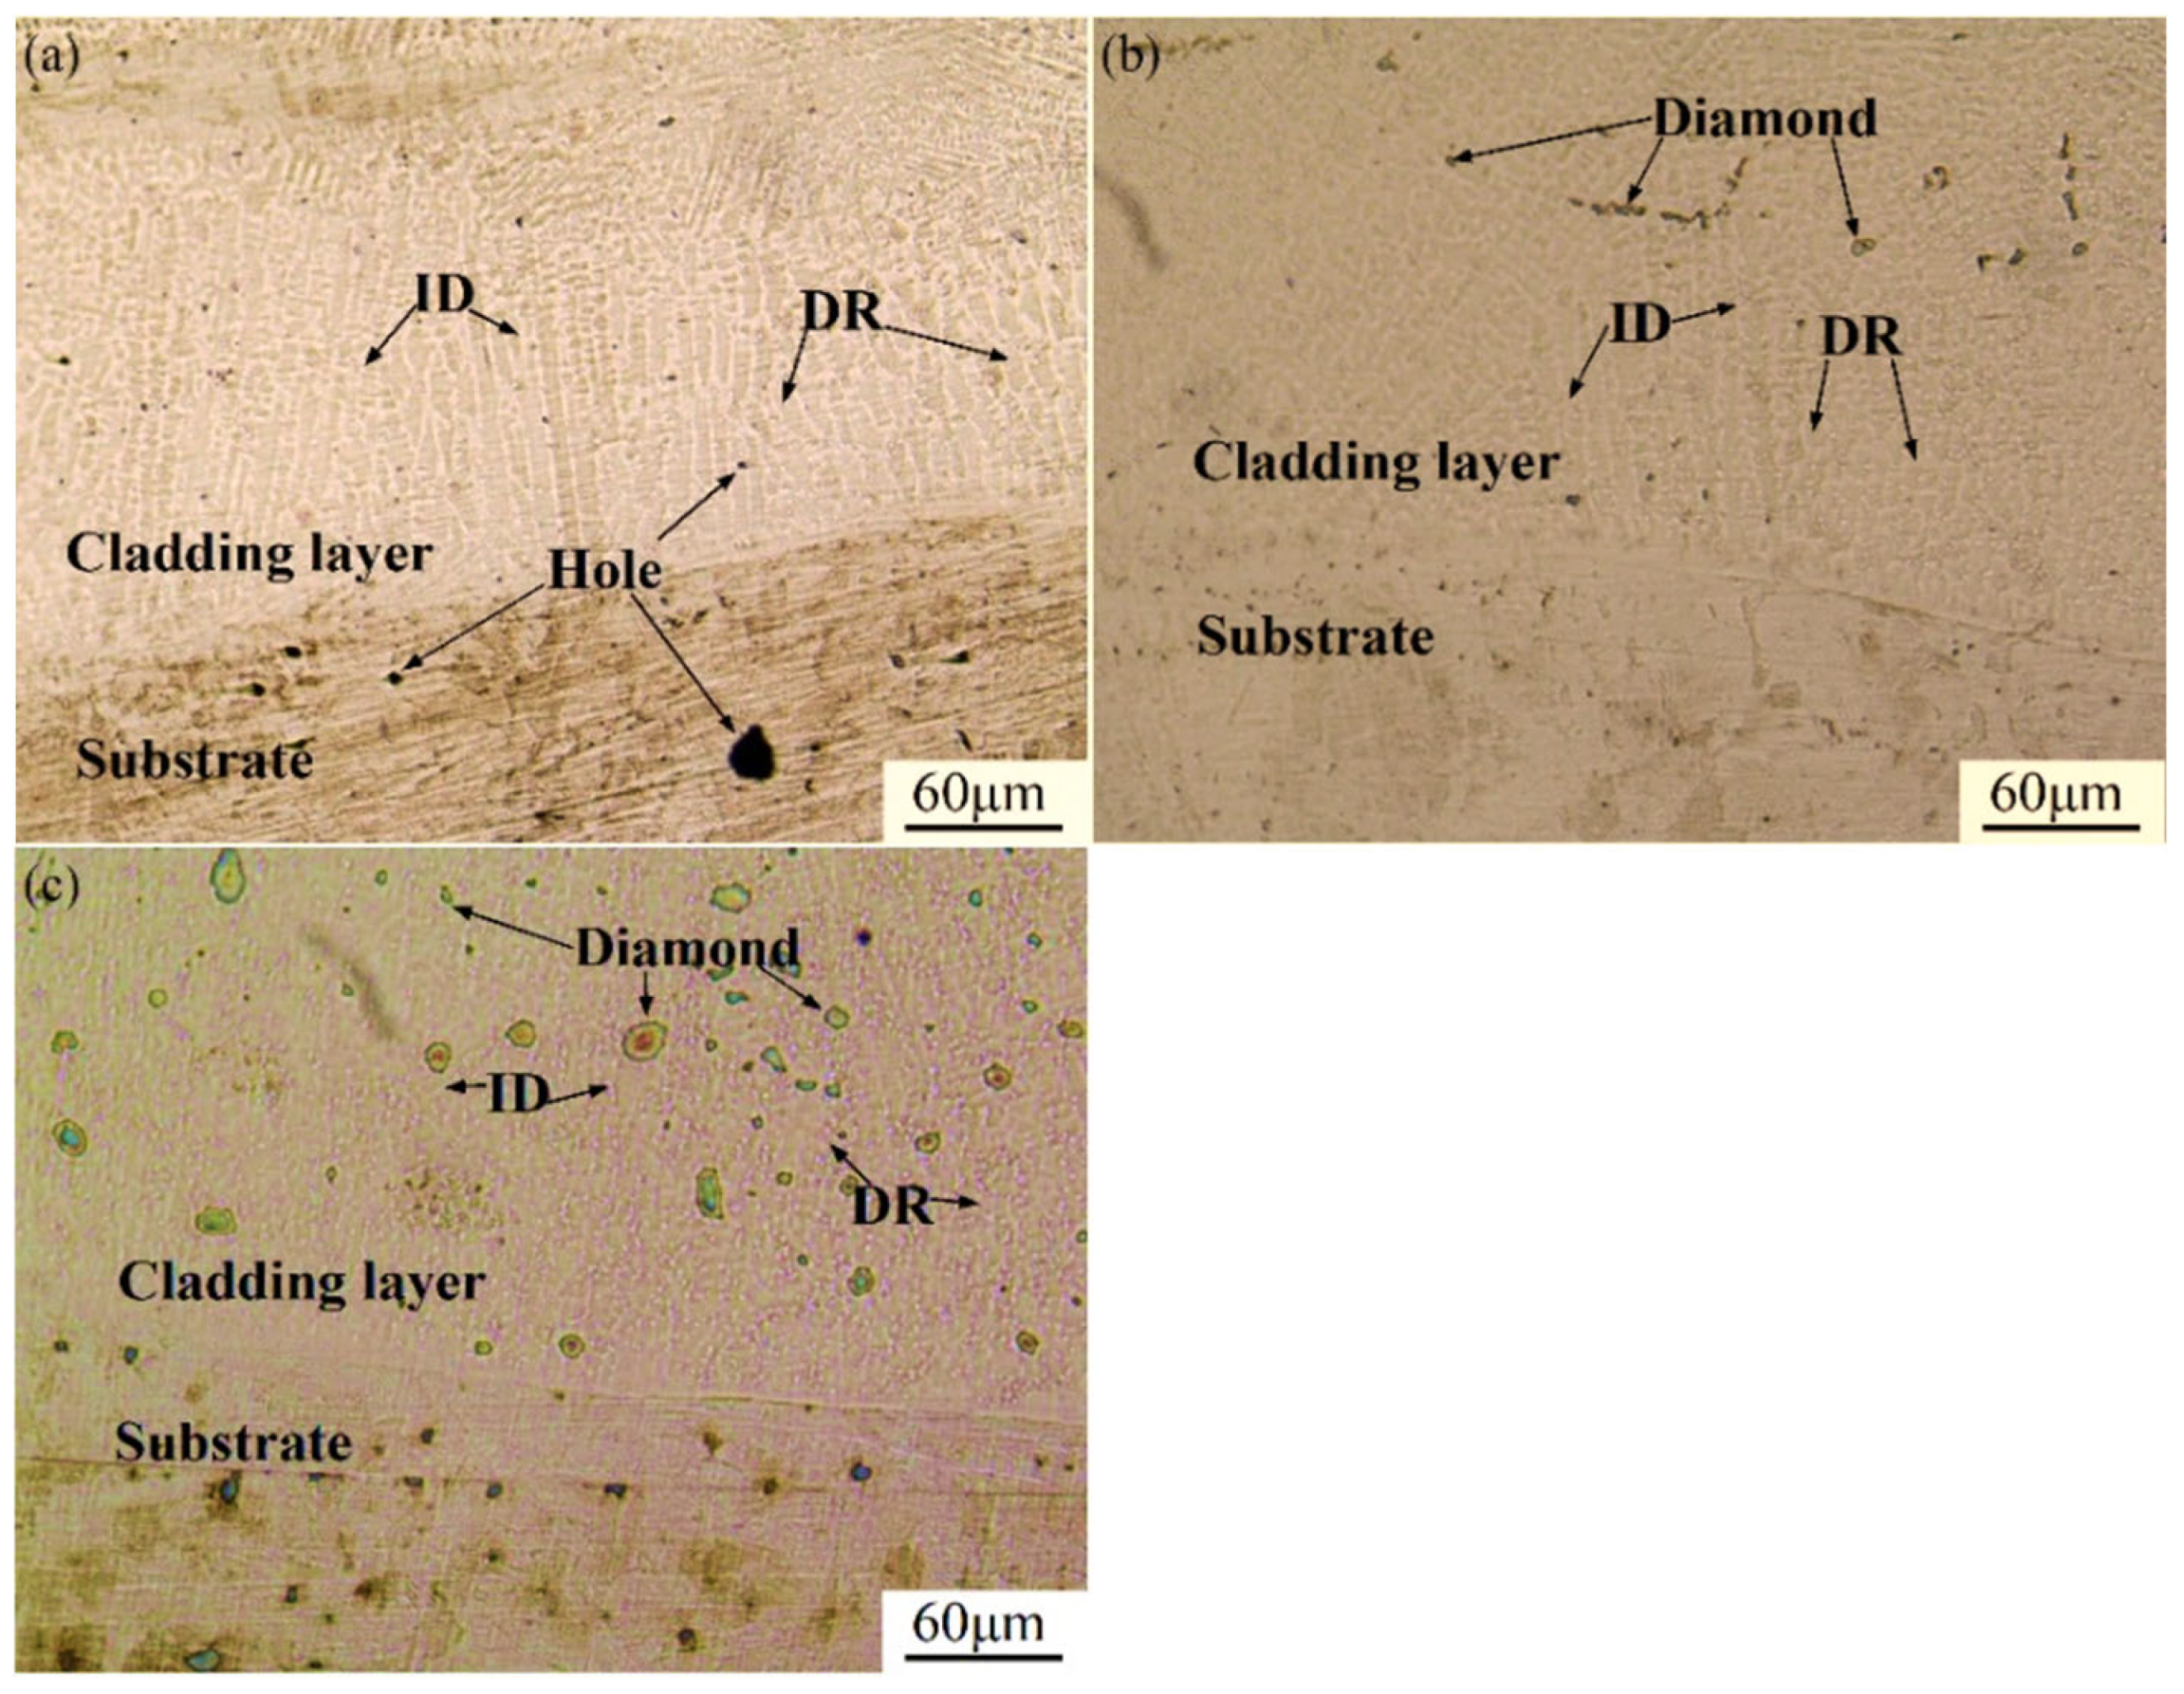
Figure 4 shows metallographic micrographs of the cross-sections of CoCuNiTi + x Diamond (C) (x = 0, 0.5, and 1.0 wt.%) HEAs. As shown in Figure 4, CoCuNiTi + x Diamond (C) (x = 0, 0.5, and 1.0 wt.%) HEAs exhibit typical dendritic structures. The growth direction of the dendrites is nearly perpendicular to the fusion line, which is mainly related to the maximum temperature gradient in the direction perpendicular to the fusion line. Before adding diamonds, there are obvious hole defects in the cross-section of the alloy sample. No holes are observed in the diamond-containing samples, and distinct diamond particles are embedded in the cladding layer. Furthermore, the dendrite spacing in the samples decreases significantly with increasing diamond content, consistent with the analysis, indicating that the addition of C substantially enhances the ability of the alloy melt to undergo heterogeneous nucleation.
Figure 4.
Metallographic photographs of the cross-sections of CoCuNiTi + x Diamond (C) (x = 0, 0.5, and 1.0 wt.%) samples: (a) 0 wt.%, (b) 0.5 wt.%, (c) 1.0 wt.%.
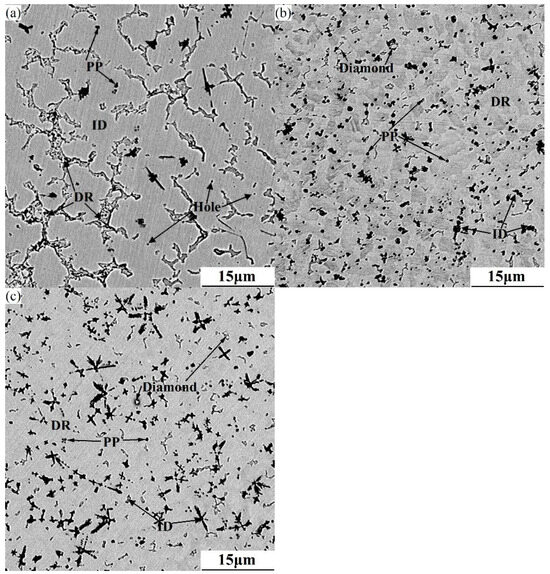
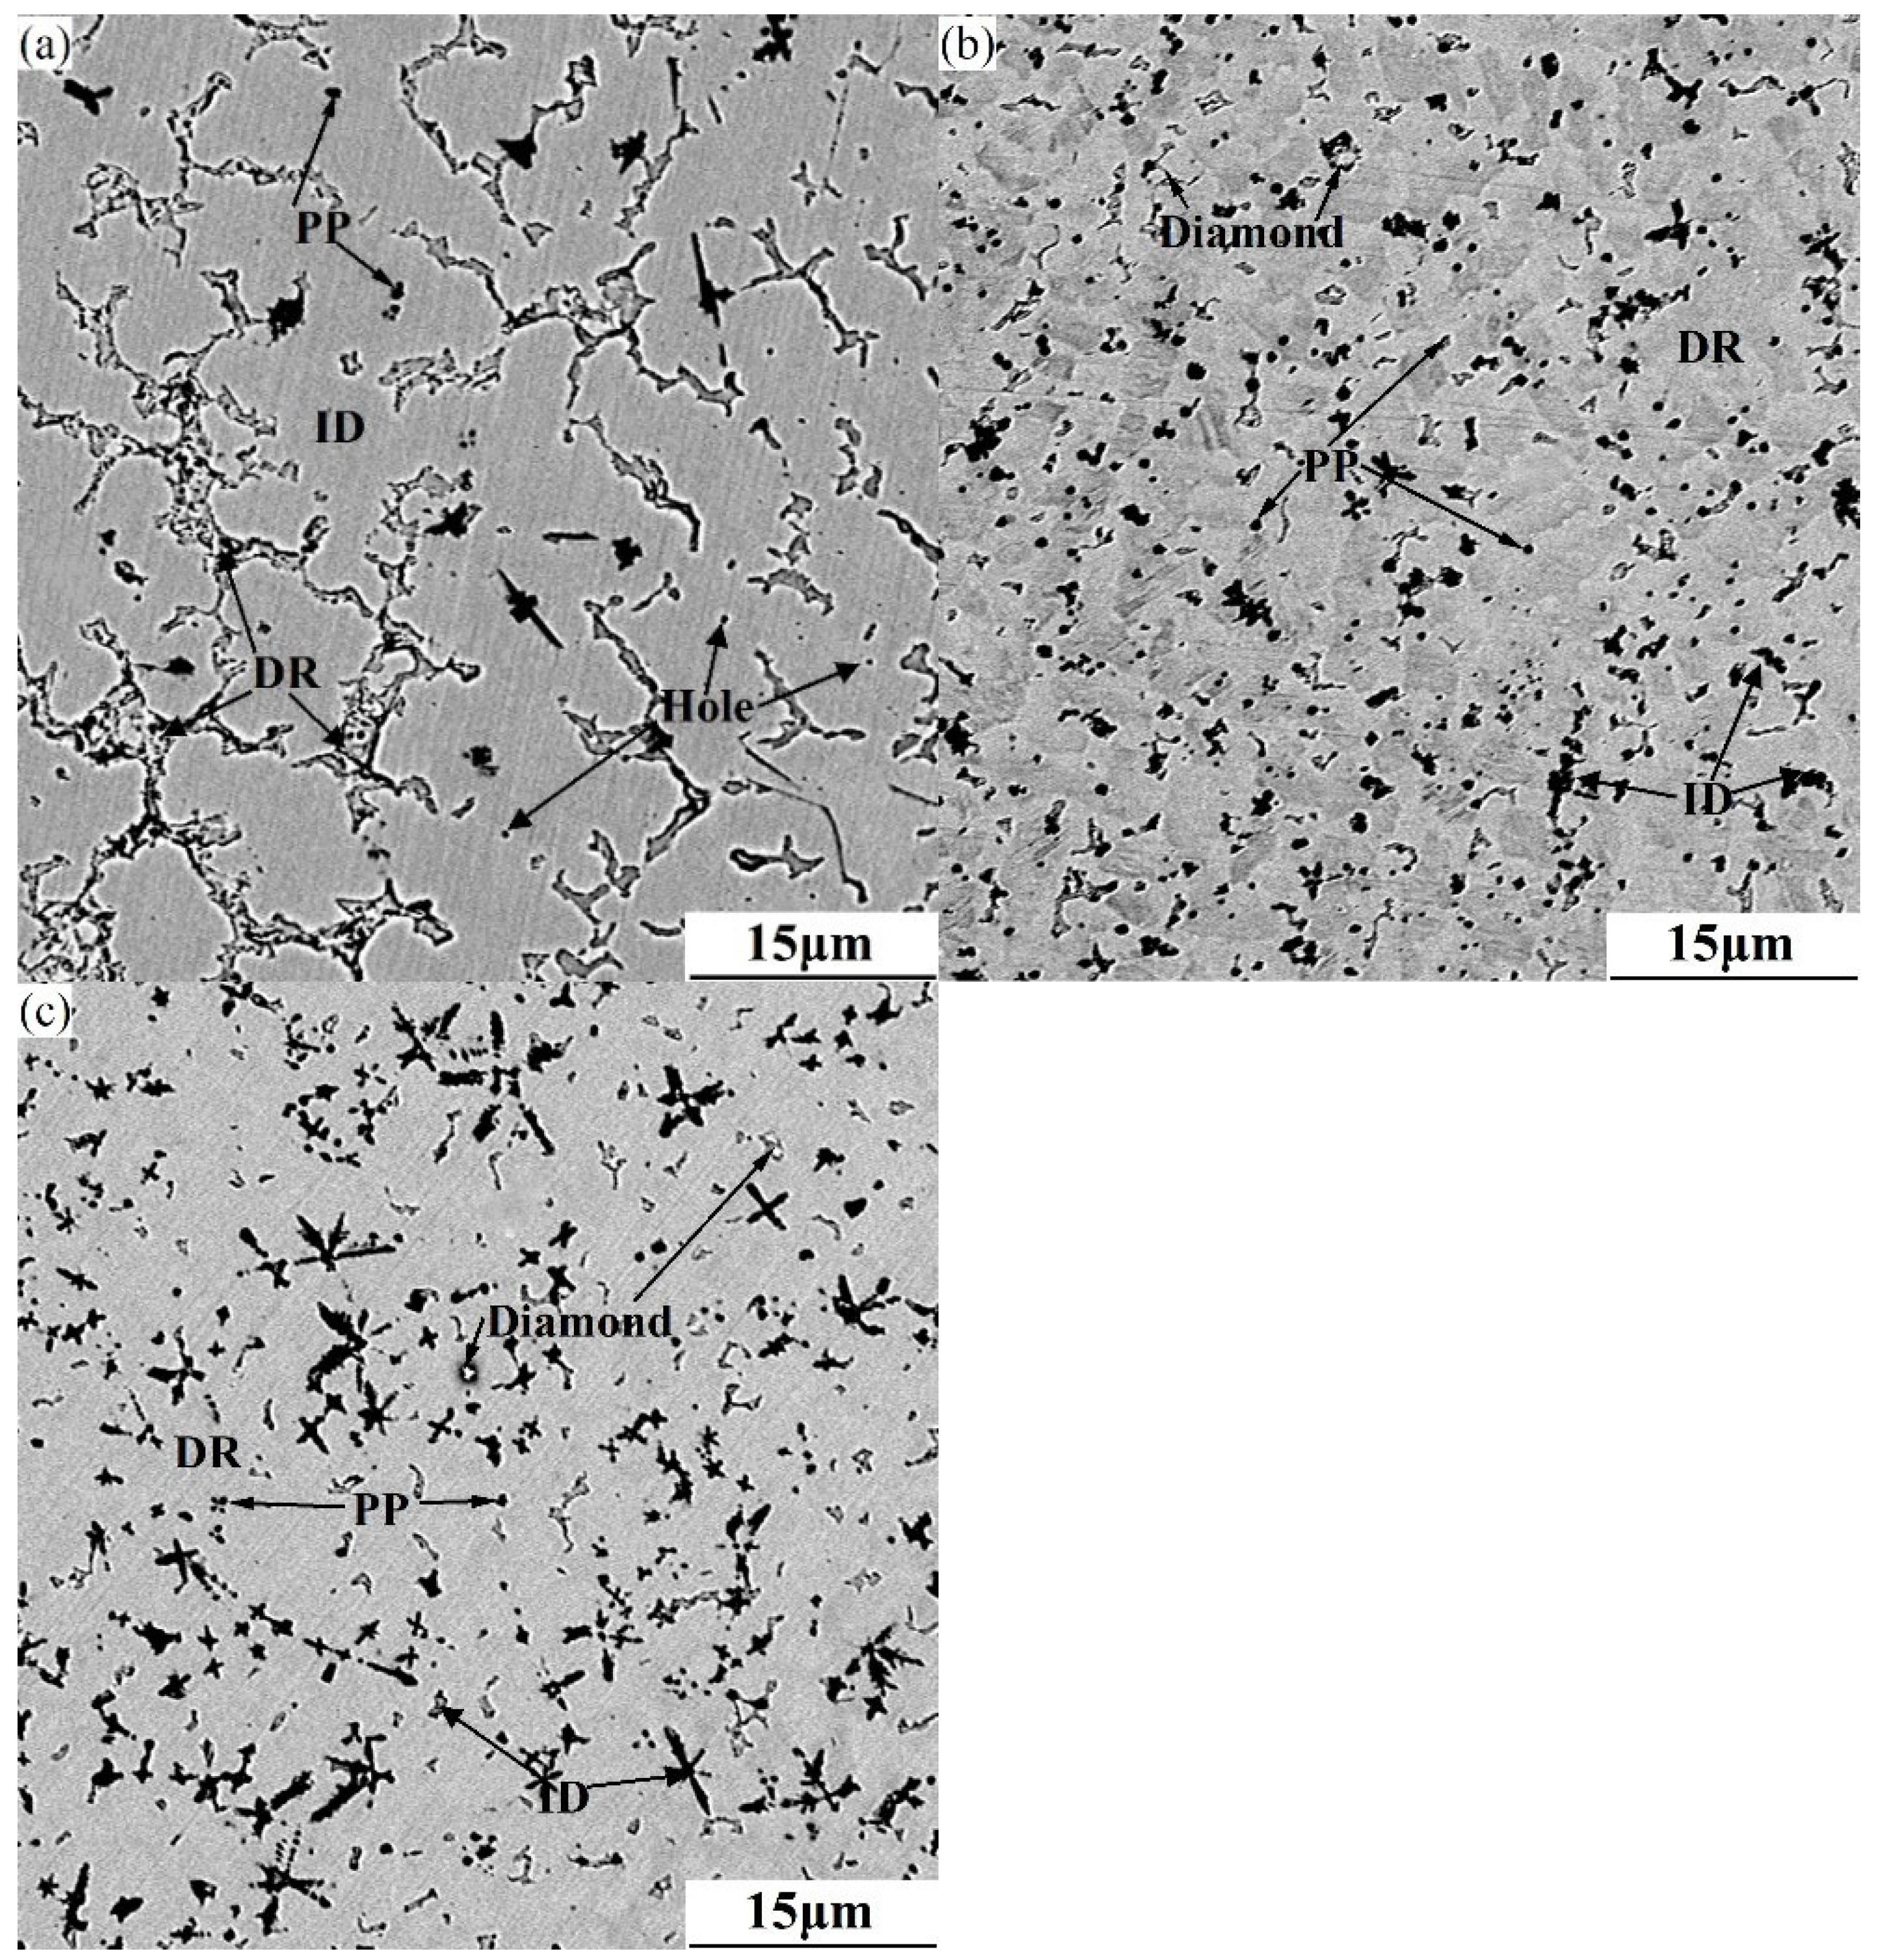
Figure 5 shows the SEM images of CoCuNiTi + x Diamond (C) (x = 0, 0.5, and 1.0 wt.%). As shown in Figure 5, the three alloys are composed of primary phase (PP), dendrite (DR), and interdendrite (ID) regions. There are hole defects in CoCuNiTi alloy, which is consistent with the metallographic observation results. To mitigate the impact of the “digging effect” in the cladding process, the EDS analysis results after deducting the substrate composition are presented in Table 5. As shown in Table 5, the primary phase of all three alloys exhibits the highest Ti content. This is mainly attributed to Ti having the highest melting point among the metallic elements (see Table 2) and its earlier precipitation during solidification. The Ti content in the dendrite region of CoCuNiTi is slightly higher than that of the primary phase (5.33%), whereas the Ti content in the dendrite region of diamond-containing samples is significantly lower (≤195.24%) than that of the primary phase. The reason for the significant increase in Ti content in the primary phase region after adding diamond is that the solid-phase diamond particles in the alloy melt can significantly increase the heterogeneous nucleation rate of the Ti-rich primary phase and reduce the degree of undercooling required for nucleation. The Ti-rich primary phase can be precipitated and nucleated in large quantities at higher temperatures, which is also conducive to the rapid diffusion of alloying elements. This leads to a significant increase in the Ti concentration in the primary phase of the diamond-containing samples. Compared to the 0.5 wt.% sample, the concentration difference in each element in the dendrite region of the 1.0 wt.% diamond sample is significantly lower than that of the primary phase. This is mainly attributed to the increase in the number of solid-phase diamond particles. The increase in the number of diamond solid particles in the molten pool is similar to the increase in the number of suspension particles in “suspension casting,” which contributes to the refinement of the solidification structure [34]. As the temperature of the alloy melt further decreases, the subsequent precipitation of other alloying elements will preferentially adhere to the surfaces of neighboring Ti-rich primary-phase billets for heterogeneous nucleation. This can significantly reduce the diffusion resistance and distance and is conducive to the full diffusion of each element in the liquid metal. Additionally, the dendrite region can nucleate and grow around the primary phase at a lower degree of undercooling. This also means that the dendrite region growing closely around the primary phase can undergo solid-state diffusion at a higher temperature, which is conducive to the reduction in the concentration gradient of the same element between different regions of the alloy. To evaluate the segregation of the same element in the DR and ID regions, the segregation coefficient (K) is introduced [26],
where ξ denotes the direction coefficient, where ξ = 1 when the same element is enriched in the DR region and ξ = −1 otherwise. CID and CDR represent the concentrations of the same elements in the ID and DR regions, respectively. A positive or negative K value indicates enrichment in the DR or ID region, respectively. A larger absolute value of K indicates a more severe segregation. The segregation coefficients of each element in CoCuNiTi + x Diamond (C) (x = 0, 0.5, and 1.0 wt.%) samples are calculated in Table 5. From Table 5, the Co content of the three alloys is the highest in the dendrite region. This is because among all metallic elements, Co exhibits the largest negative mixing enthalpy with Ti and readily forms tightly bound atomic clusters with Ti in the alloy melt. Furthermore, the melting point of Co is only adjacent to and lower than that of Ti, and Co can be attached to the surface of Ti-rich billets for heterogeneous nucleation during precipitation. The concentration of Ti in the primary phase is the highest; therefore, the concentration of Co in the dendrite region around the primary phase is the highest. The Cu element is enriched in the interdendrite region, mainly because the melting point of Cu is the lowest and the degree of undercooling required for precipitation is larger, which is easily enriched in the interdendrite region with late solidification. This is in line with the phenomenon reported in the literature [35] for Cu-containing high-entropy alloys. The segregation of Ni in different regions of the three alloys is relatively small. This is because Ni exhibits no negative mixing enthalpy with either Co or Cu, which have melting points adjacent to those of Ni. In the alloy melt, Ni struggles to form close atomic clusters with Co and Cu, and it is easily squeezed to the edge of the atomic clusters. With a decrease in the solidification temperature, the formation of a large number of solid phases rapidly increases the viscosity of the unsolidified melt and significantly reduces the diffusion rate. Consequently, it readily precipitates at the end of the growth of the Co-rich dendrite region and the initial stage of the Cu-rich interdendrite region, resulting in a relatively small segregation coefficient of Ni. Compared with CoCuNiTi, when the diamond content is 0.5 wt.%, it can be seen from Table 5 that the segregation coefficient of Ni in the interdendrite region changes from −11.82 at% to −5.65 at%, indicating that the segregation degree of Ni in the dendrite and interdendrite regions is significantly reduced. This is because the diamond-containing samples can precipitate in large quantities at higher temperatures and form Co-rich dendrite regions, which also helps reduce the precipitation resistance of Ni and the undercooling required for nucleation. When the diamond content is further increased, the element of Ni precipitating at a higher temperature can be more fully diffused. Due to the maximum positive mixing enthalpy between Ni and Cu, the element of Ni can be easily diffused to the dendrite region, so that the segregation coefficient of Ni is 6.30 at%. Because the melting point of diamond is significantly higher than that of metal elements and diamond provides a heterogeneous nucleation substrate during the alloy melt solidification, the concentration of the element C in the primary phase is the highest.
Figure 5.
SEM images of CoCuNiTi + x Diamond (C) (x = 0, 0.5, and 1.0 wt.%) samples: (a) 0 wt.%, (b) 0.5 wt.%, (c) 1.0 wt.%.
Table 5.
EDS results of CoCuNiTi + x Diamond (C) (x = 0, 0.5, and 1.0 wt.%) HEACs.
3.3. Wear Resistance
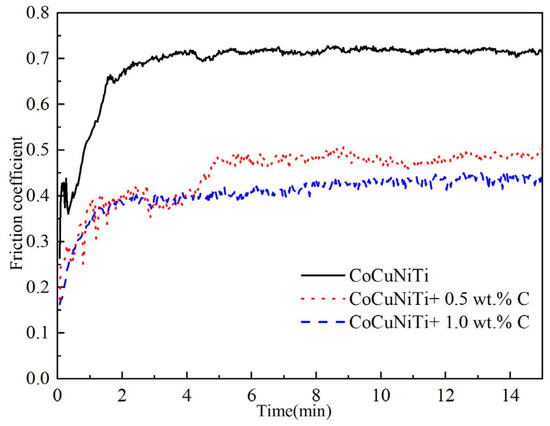
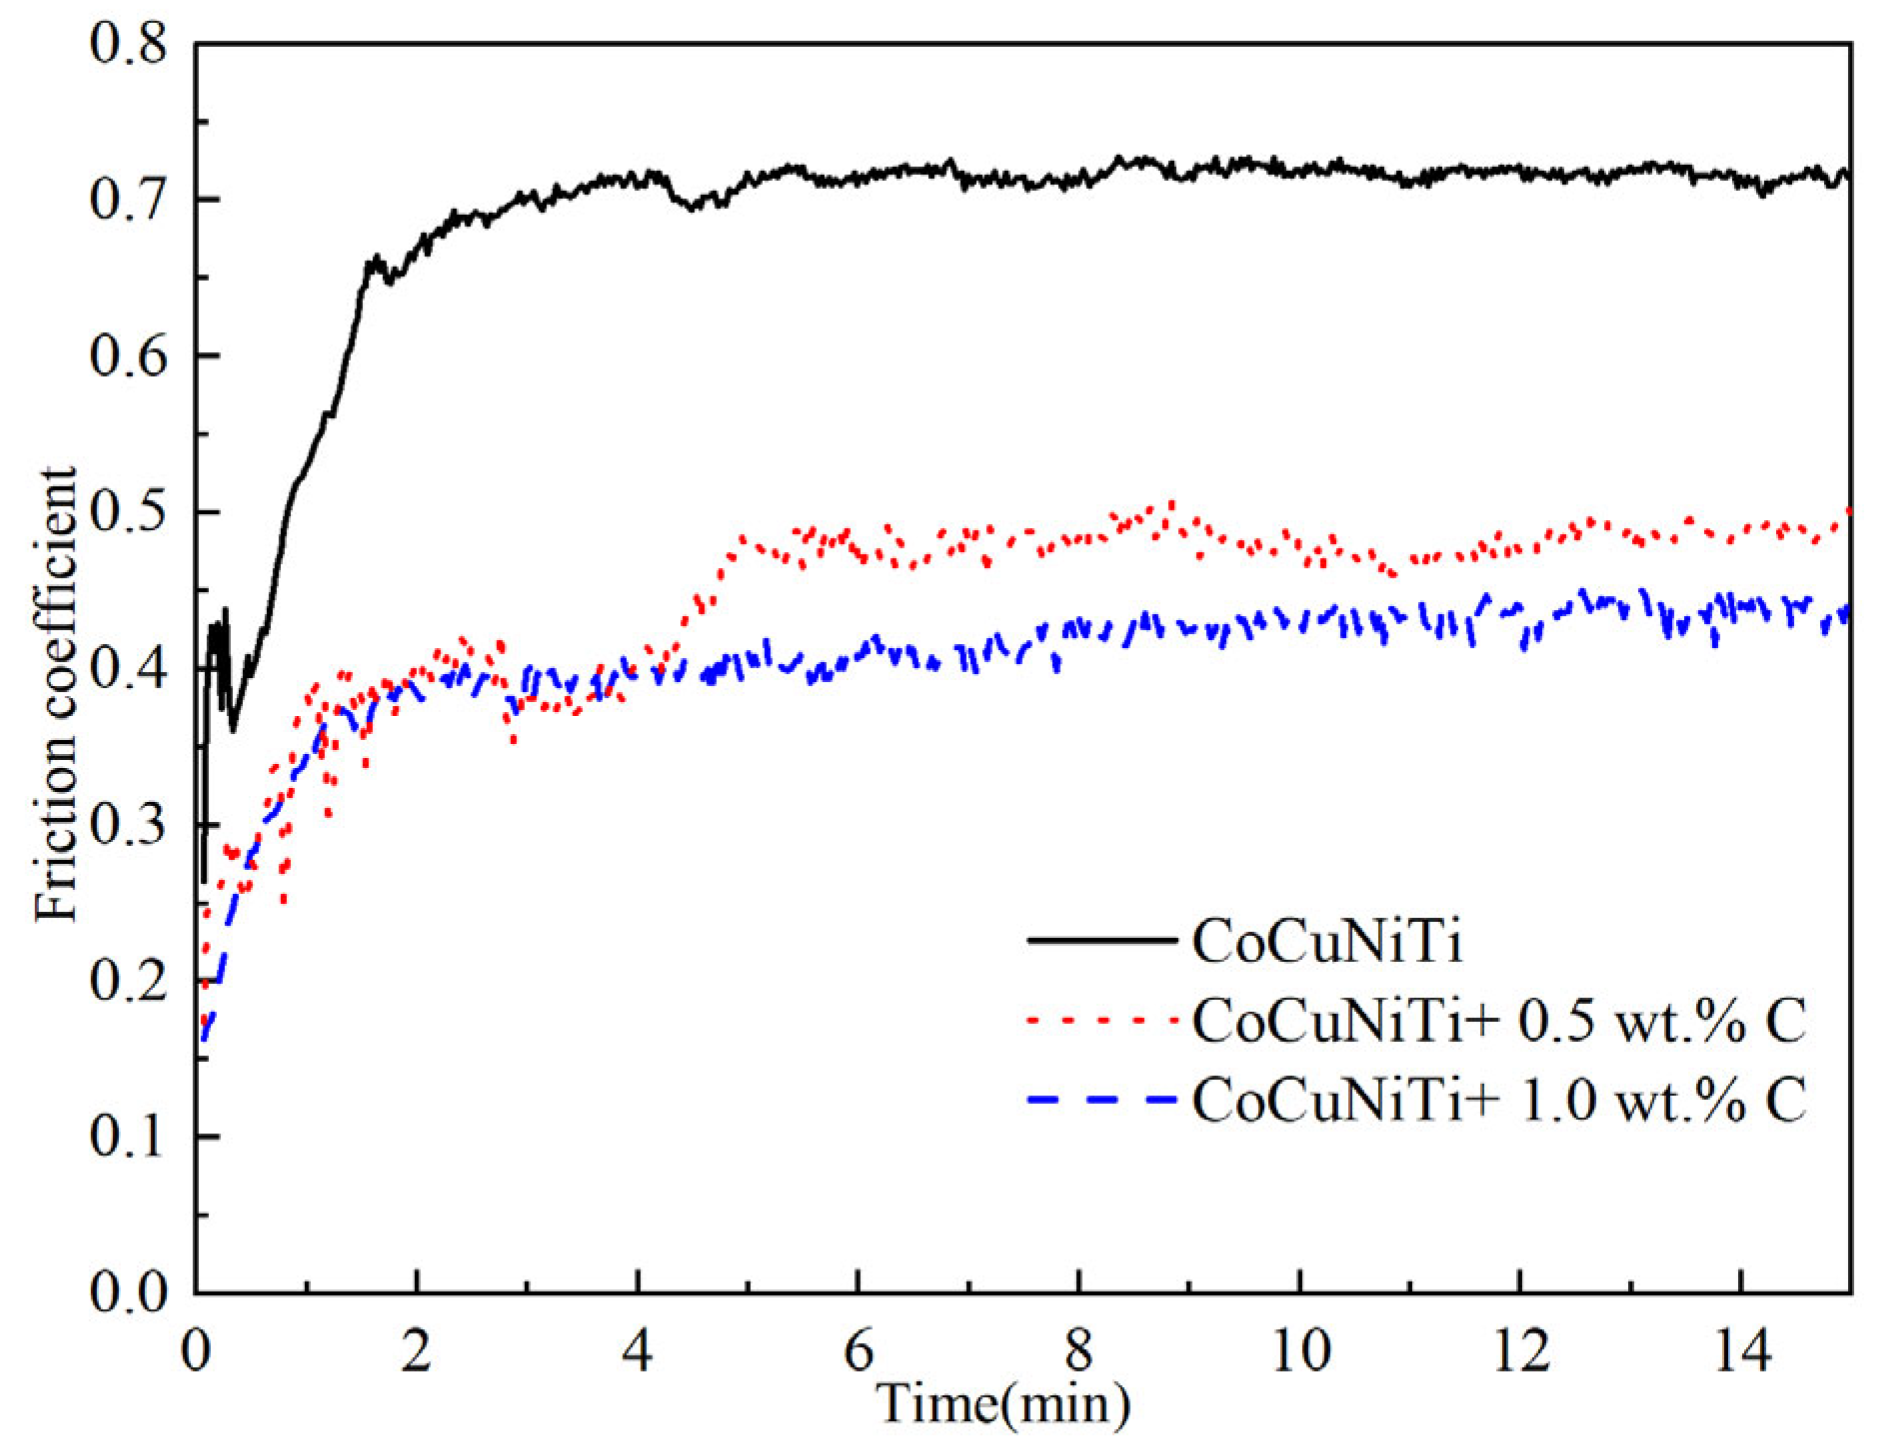
Figure 6 shows the relationship between the friction coefficient of CoCuNiTi + x Diamond (C) (x = 0, 0.5, and 1.0 wt.%) alloys and time. As shown in Figure 6, the friction coefficient of the three alloys increases gradually with an increase in the friction time and then tends to stabilize. This is because, in the early stage of wear, the local contact between the coating surface and the friction pair is points, lines, peaks, and other micro-convex modes. The actual contact area between the two surfaces is relatively small, resulting in a large pressure on the unit contact area. During this stage, the wear rate is high, and the friction coefficient rises rapidly. As the wear continues, the abovementioned micro-convex surface is gradually smoothed, the depth of wear marks on the surface of the coating gradually increases, and the growth rate of the friction coefficient gradually slows down and tends to be stable; that is, it enters a stable wear stage. The friction coefficients of CoCuNiTi + x Diamond (C) (x = 0, 0.5, and 1.0 wt.%) alloys are 0.6913, 0.4367, and 0.3808, respectively. It can be observed that the friction coefficient of the samples decreases significantly with increasing diamond content. This is because: (1) Diamond, as the hardest known material, is consolidated on the substrate surface by the high-entropy alloy. During the wear process, it mainly bears the normal load and shear stress generated by the friction pair [15,36]. This greatly reduces the direct contact area and plastic deformation of the high-entropy alloy coating, resulting in the improvement of the wear resistance of the diamond-containing sample. (2) During laser cladding, the carbon atoms produced by partial diamond decomposition easily enter the alloy phase in the form of interstitial atoms [13], which aggravates the degree of cell distortion (consistent with the above XRD results) and produces a strong solid-solution strengthening effect. (3) Diamond particles can act as a substrate for heterogeneous nucleation during the solidification of the alloy melt, promoting the refinement of the alloy microstructure (consistent with the above SEM observation results). This induces a grain refinement strengthening effect, enhancing both the strength and wear resistance. The improvement in wear resistance caused by diamond addition is the result of the combined effect of superhard phase strengthening, solid solution strengthening, and fine grain strengthening.
Figure 6.
Wear curves of CoCuNiTi + x Diamond (C) (x = 0, 0.5, and 1.0 wt.%) HEACs.
3.4. Corrosion Behavior
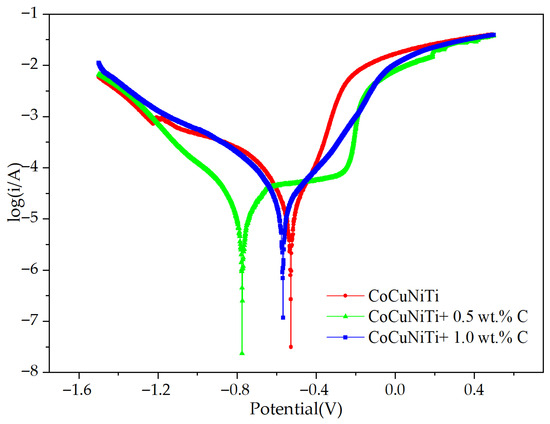
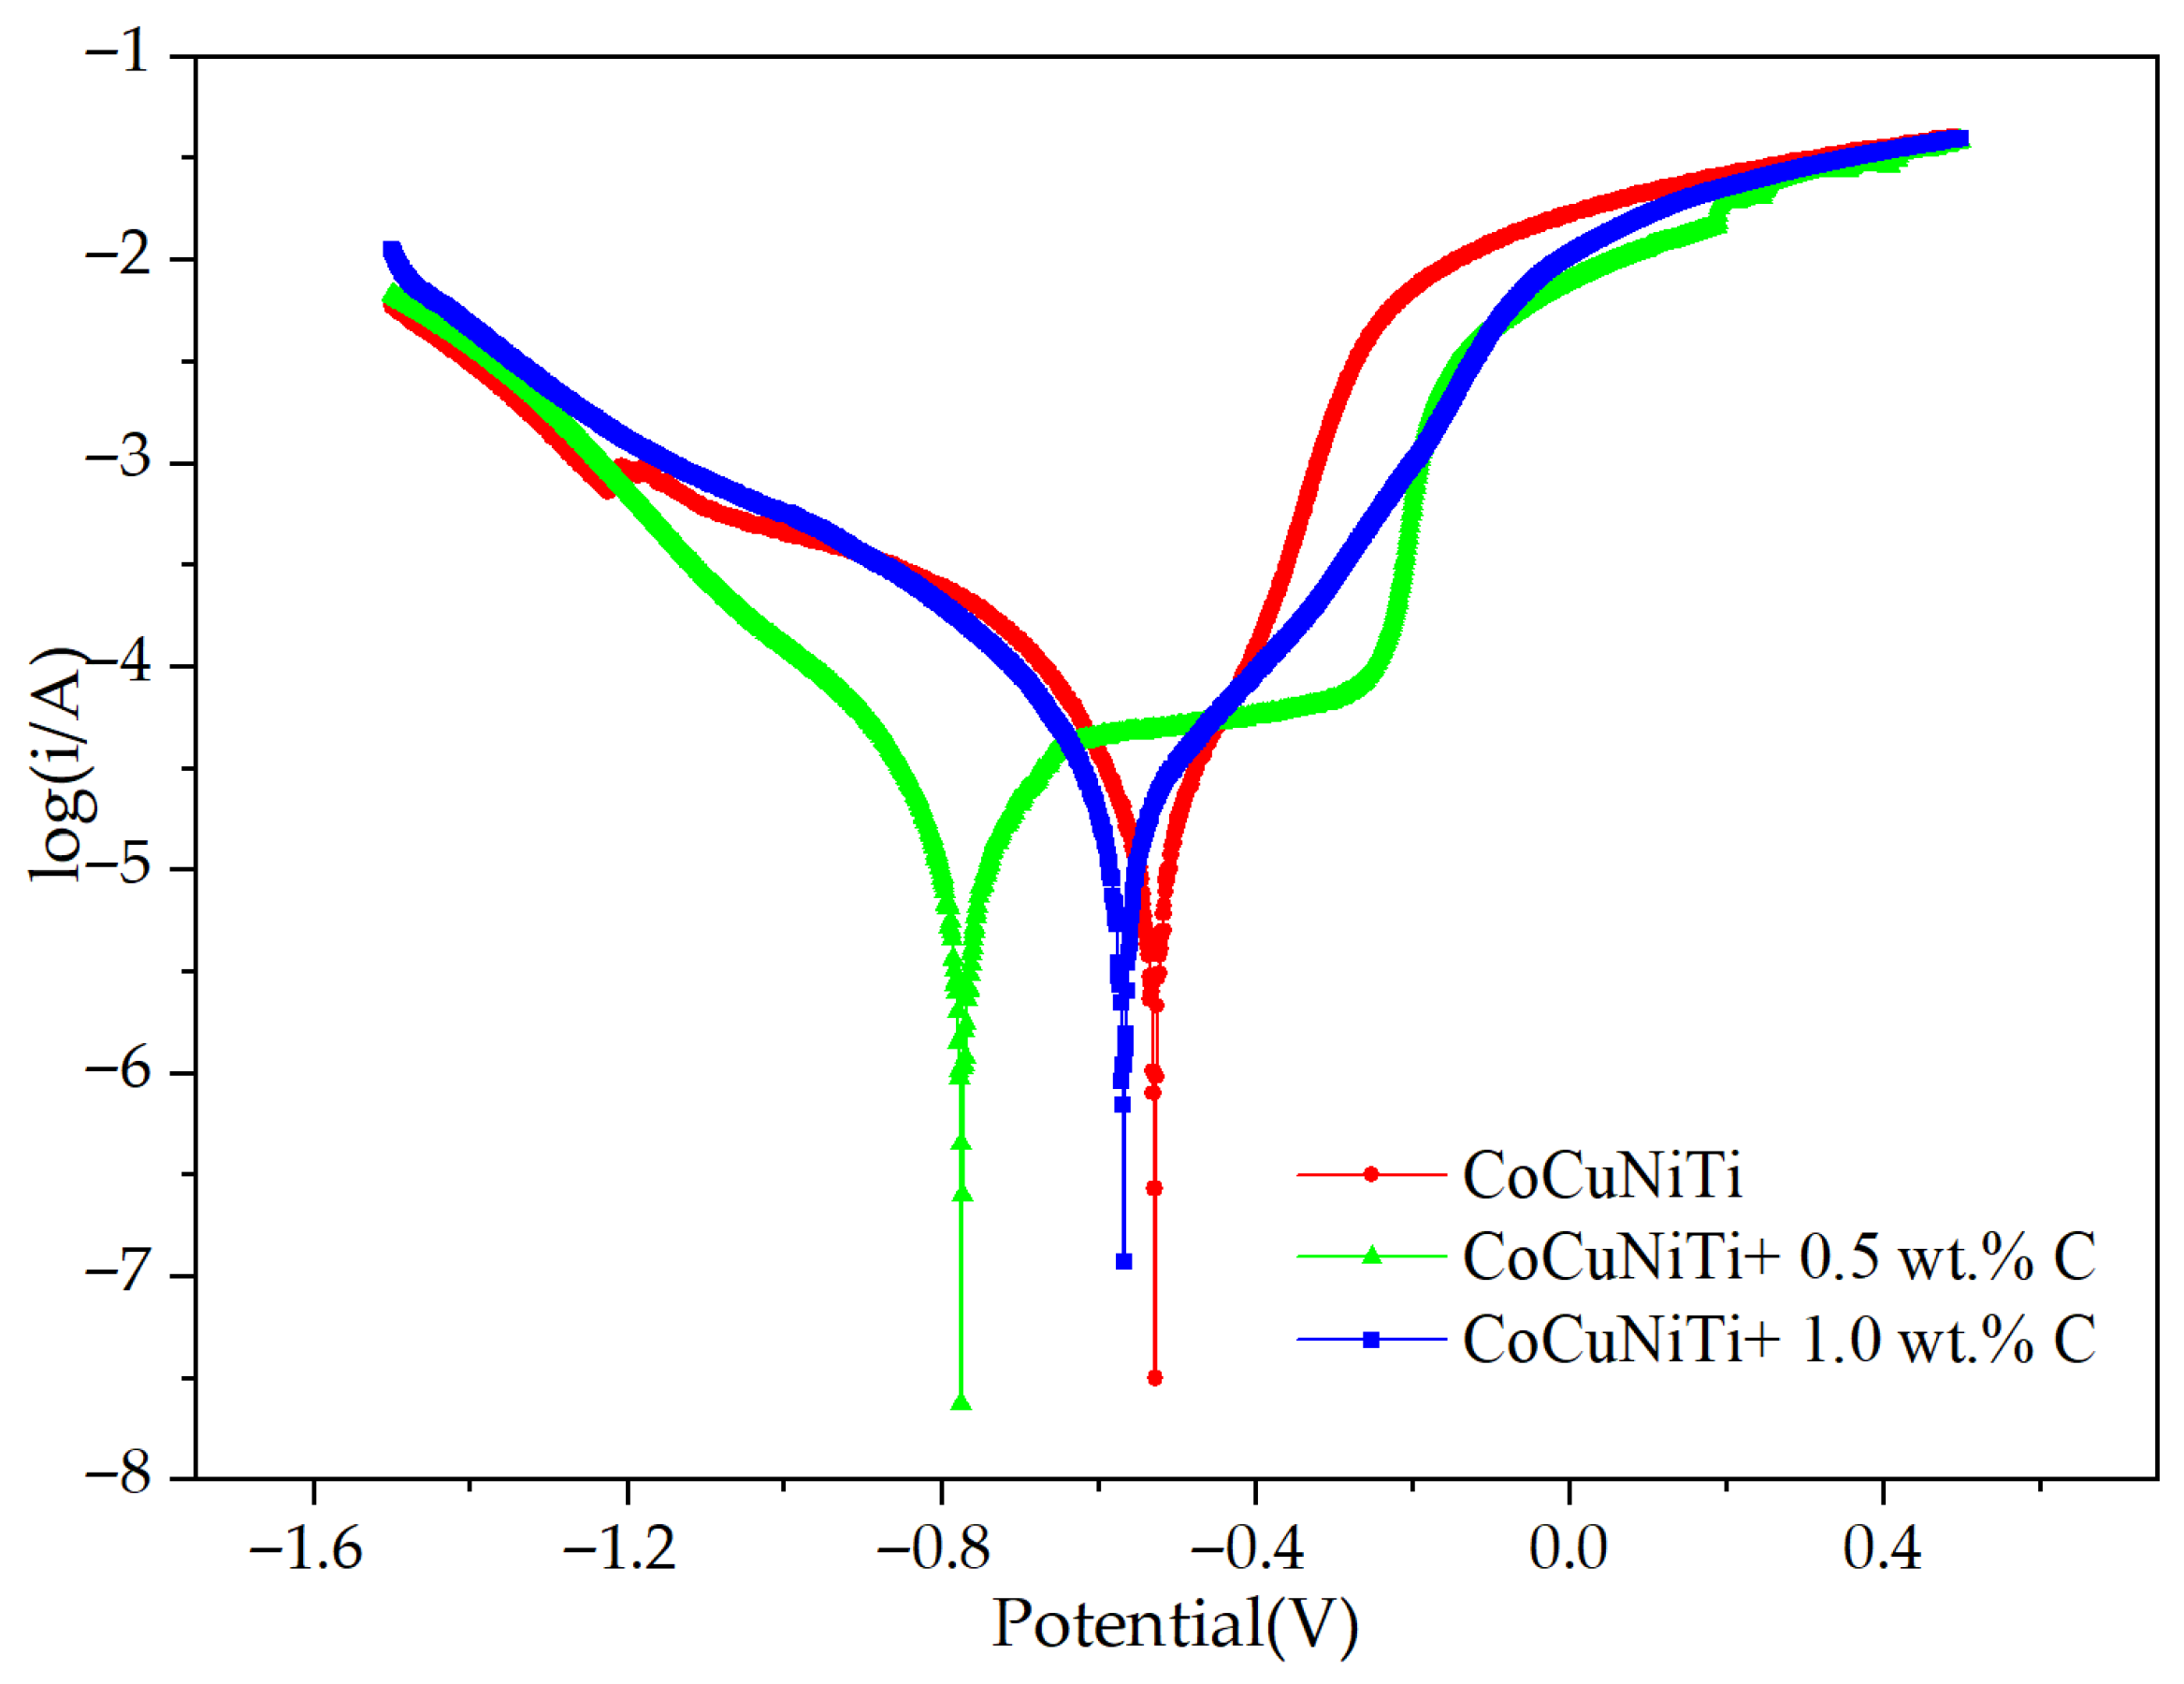
Figure 7 shows the polarization curves of CoCuNiTi + x Diamond (C) (x = 0, 0.5, and 1.0 wt.%) in a 3.5% NaCl solution. As shown in Figure 7, the CoCuNiTi coating exhibits no distinct passivation zone, indicating active dissolution. This is because the cladding layer contains hole defects, which readily allow corrosive Cl− ions to adsorb on the surface and penetrate the cladding layer, causing continuous corrosion. The sample containing 0.5 wt.% diamond exhibits a distinct passivation zone, indicating that a dense passivation film formed on its surface during polarization, reducing the corrosive effect of the electrolyte. When the diamond content reaches 1.0 wt.%, no significant passivation zone appears in its polarization curve. The self-corrosion current density (icorr), self-corrosion potential (Ecorr), anodic slope (βa), and cathodic slope (βc) in Table 6 were obtained by extrapolation from the polarization curves of CoCuNiTi + x Diamond (C) (x = 0, 0.5, and 1.0 wt.%) HEACs. The polarization resistance (Rp) can be calculated using the following equation:
Figure 7.
Potentiodynamic polarization curves of CoCuNiTi + x Diamond (C) (x = 0, 0.5, and 1.0 wt.%) HEACs in 3.5% NaCl solution.
Table 6.
Electrochemical parameters of CoCuNiTi + x Diamond (C) (x = 0, 0.5, and 1.0 wt.%) HEACs.
Compared with CoCuNiTi, the icorr of the sample with 0.5 wt.% diamond decreases, indicating that its corrosion tendency decreases. When the amount of diamond added reaches 1.0 wt.%, the icorr of the sample increases significantly, demonstrating markedly heightened corrosion tendency in this alloy. The self-corrosion potential of the sample with 0.5 wt.% diamond is the smallest, mainly because the addition of a small amount of diamond can not only refine the microstructure and reduce the defects (see Figure 3 and Figure 4) but also greatly reduce the probability of stress concentration and interface defects caused by excessive diamond [16,36]. This is helpful in enhancing corrosion resistance. When the diamond content is further increased, although the mass added is not very significant at the macroscopic level, the absolute number of particles is greatly increased because the molar mass of C is much smaller than that of the other metal elements. Diamond particles tend to agglomerate, resulting in defects such as microcracks inside the cladding layer. This allows corrosive media to penetrate directly into the cladding layer through these defects, thereby reducing its corrosion resistance. This phenomenon is consistent with the literature [36,37].
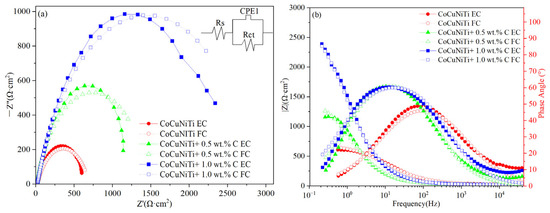
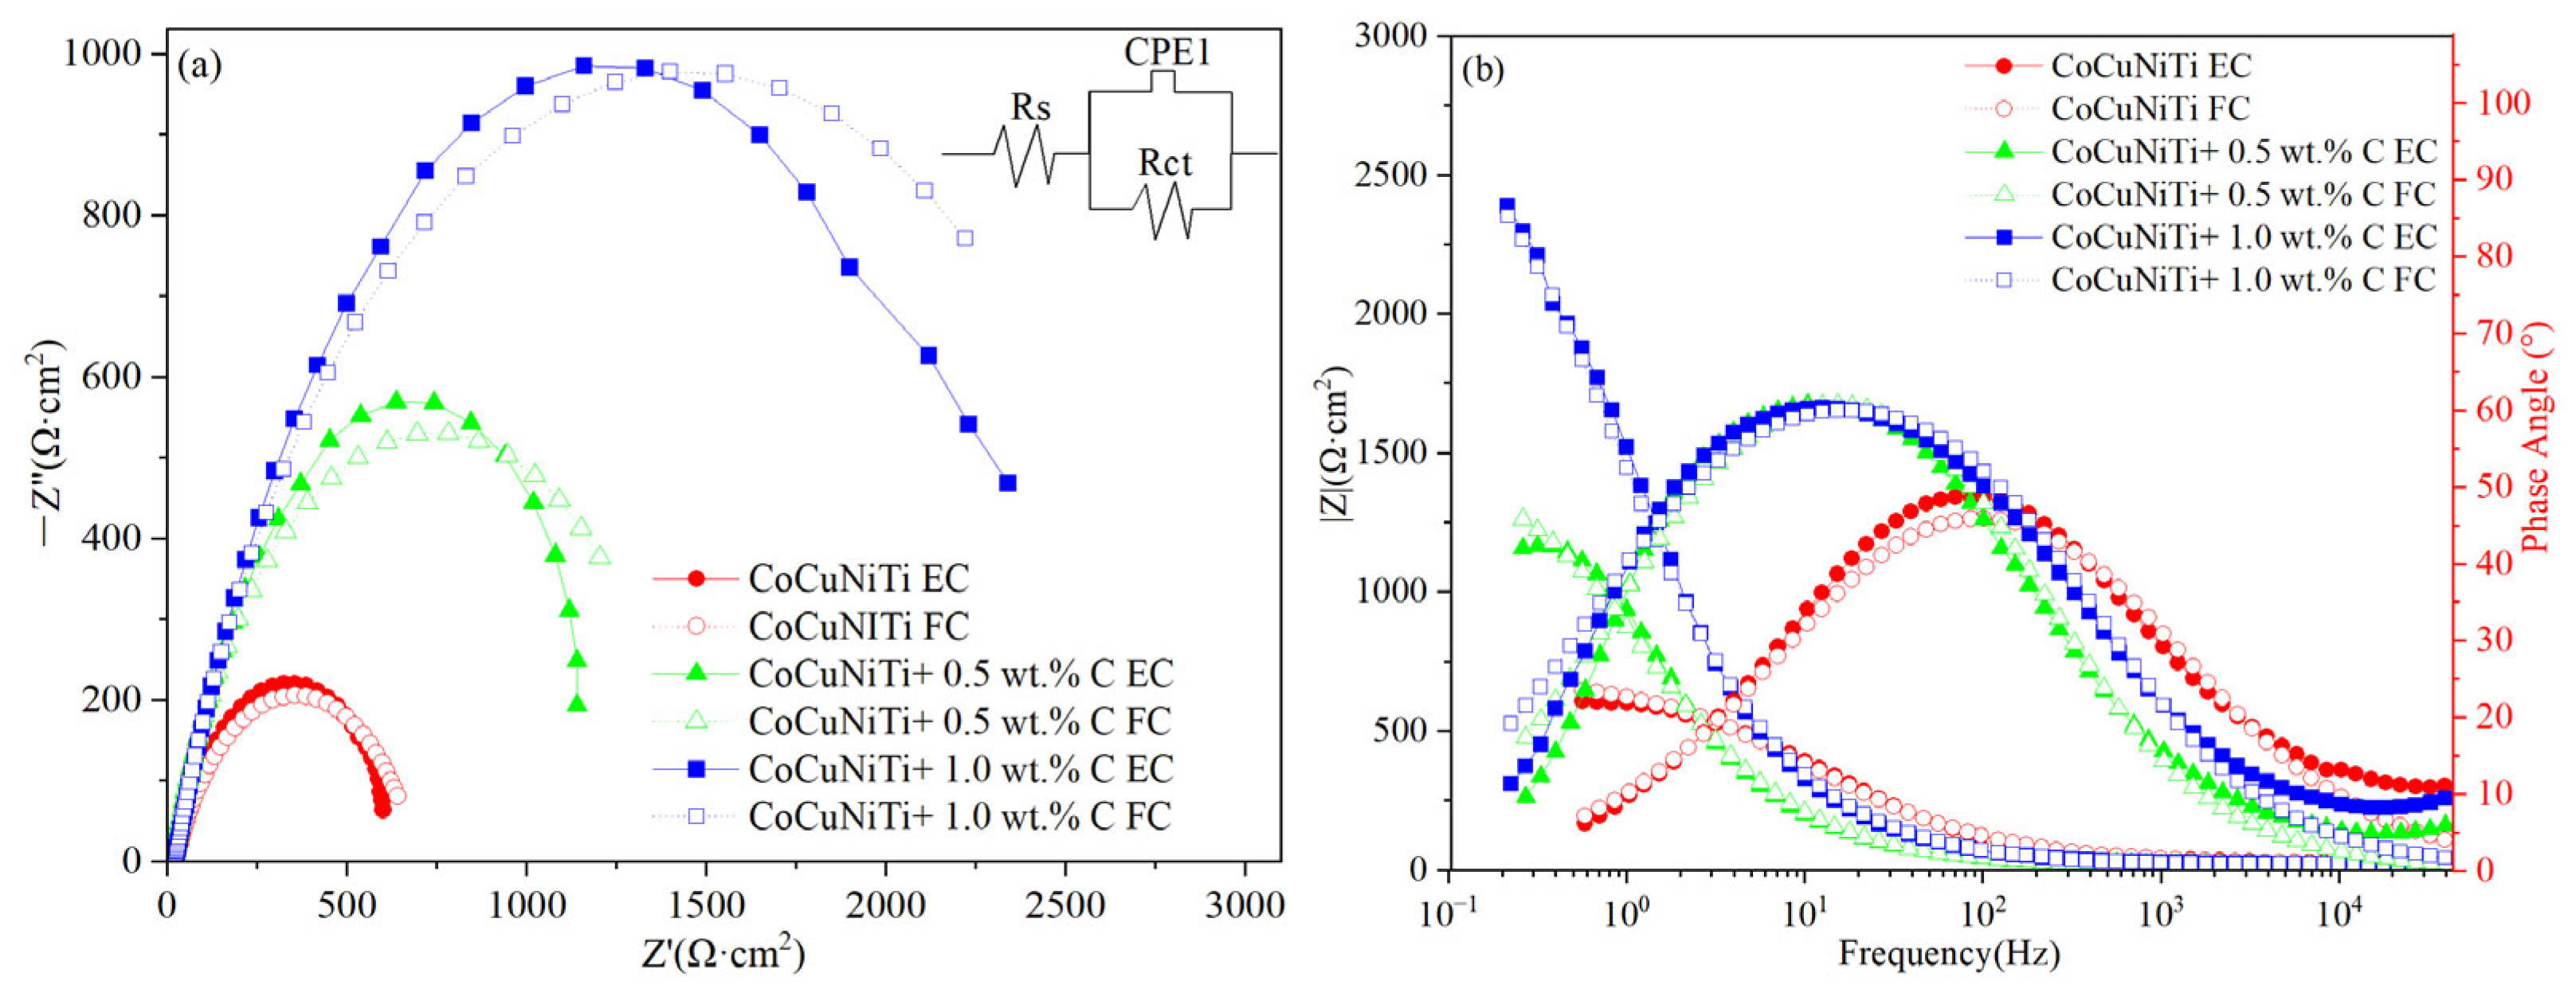
Figure 8 shows the EIS plots of CoCuNiTi + x Diamond (C) (x = 0, 0.5, and 1.0 wt.%) cladding layers in a 3.5% NaCl solution. The Nyquist plots of the three coatings exhibit compressed semicircular arcs, indicating that charge is transferred between the sample surface and the corrosive solution, forming a double layer with an uneven electric field distribution. Table 7 presents the EIS data obtained by fitting the circuit illustrated in Figure 8. The fitting results are marked in Figure 8 using a combination of dotted lines and hollow symbols. The data obtained from the experiments are marked by a combination of solid lines and symbols. The fitting curve (FC) was close to the experimental curve (EC). Rct is charge transfer resistance; CPE1 represents a constant phase angle element, whose impedance ZCPE is calculated using the expression [22,38]
where Y0 is the proportionality factor, j is the imaginary unit, ω is the angular frequency, and m is the phase shift. As shown in Figure 8a, the radius of the capacitive arc increases with increasing diamond content. The capacitive arc radius of the sample with 1.0 wt.% diamond is the largest, which is inconsistent with the corrosion tendency indicated by the previous polarization curve tests. This phenomenon is more common in the literature reports of excessive addition of diamond reinforcements [39,40,41]. It is due to the combined result of the kinetic corrosion mechanism dominated by the negative effect (primarily reflected in icorr) [39,42] and the impedance characteristic mechanism dominated by the surface barrier layer (primarily reflected in Rct) [40,43] caused by the addition of more diamond particles. The kinetic corrosion mechanism dominated by the negative effect is mainly caused by the easy formation of microcracks between diamond particles, which easily agglomerate, serving as rapid penetration pathways for corrosive media [40]. In addition, although diamond is an insulator, the reaction products or interface phases formed at the interface may possess different electrochemical potentials. The potential difference between the interfacial phases at this interface forms localized galvanic couples, thereby triggering preferential corrosion [42]. For the above reasons, the corrosive solution easily penetrates the direct substrate, which significantly increases the self-corrosion current density. The impedance characteristic mechanism dominated by the surface barrier layer is due to the increase in diamond content, which forms a highly covered physical barrier layer on the surface of the coating. This insulating barrier layer can effectively block the penetration of corrosive medium and electron conduction, thus exhibiting an extremely high interface impedance in the EIS test [41,44]. Additionally, when the diamond content increased from 0.5 wt.% to 1.0 wt.%, the corrosion mechanism of the samples also changed from uniform corrosion to localized corrosion (pitting). The formation of a self-catalytic environment in the corrosion pits leads to an increase in icorr, while the passivation film formed on the outer surface of the pits maintains a relatively high overall resistance Rct for the sample, consistent with the situation reported in the literature [41,44]. To evaluate the corrosion resistance of the sample, the annual corrosion rate (Kcorr) can be expressed by the following equation:
where q is a constant (≈3272 mm/(A·cm·year)), EW is the electrode equivalent (g), ρ is the mass density (g·cm−3), fi is the mass fraction of the i-th alloying element, ni is the number of electrons exchanged by the i-th alloying element (mol−1), and Ai is the atomic mass of the i-th alloying element (g/mol). The calculated annual corrosion rates of CoCuNiTi + x Diamond (C) (x = 0, 0.5, and 1.0 wt.%) are shown in Table 6. Table 6 indicates that the sample containing 0.5 wt.% diamond exhibits the lowest icorr (10.94 μA/cm2), highest Rp (3471 μA/cm2), and smallest annual corrosion rate (10.03 × 10⁻² mm/year), demonstrating the best corrosion resistance. This aligns with the common practice of using icorr as a direct indicator to evaluate corrosion rates. The icorr value for the 1.0 wt.% sample (16.83 μA/cm2) is even higher than that of the CoCuNiTi coating (11.78 μA/cm2) and the 0.5 wt.% sample (10.94 μA/cm2), indicating that excessive diamond actually deteriorates the corrosion resistance of the coating, which is a common phenomenon in the hard particle reinforced alloy systems [45,46,47]. In addition, when m = 1, the ZCPE represents pure capacitance [48]. The larger the difference between m and 1, the greater the influence of the porous structure on the electrode surface. The CoCuNiTi alloy exhibits the smallest m value (0.6964), indicating that this sample is most affected by the porous structure. This is also consistent with the analysis results of the holes observed in the microstructure (see Figure 3 and Figure 4). The m-value of the sample containing 0.5 wt.% diamond is closest to 1 (see Table 7), indicating that the surface of this sample is the densest and closest to the ideal capacitance behavior. As the diamond content is further increased, the m value decreases, indicating a reduction in the surface density. This aligns with the previous analysis that excessive diamond addition tends to induce microcrack defects in the cladding layers.
Figure 8.
EIS plots of CoCuNiTi + x Diamond (C) (x = 0, 0.5, and 1.0 wt.%) HEACs. (a) Nyquist plots, (b) Bode plots.
Table 7.
EIS parameters of CoCuNiTi + x Diamond (C) (x = 0, 0.5, and 1.0 wt.%) HEACs.
4. Conclusions
CoCuNiTi + x Diamond (C) (x = 0, 0.5, and 1.0 wt.%) HEACs were successfully prepared on the surface of 45 steel substrate by laser cladding. The effects of different diamond contents on the phase evolution, microstructure, and wear/corrosion resistance of the alloys were investigated. The main conclusions are as follows:
- (1)
- CoCuNiTi + x Diamond (C) (x = 0, 0.5, and 1.0 wt.%) HEACs exhibit a dual-phase structure composed of FCC and BCC phases. The addition of diamond promotes the alloy phase from the original FCC main phase to the BCC main phase, primarily because the diamond particles can significantly reduce the precipitation resistance of the Ti-rich primary phase with a BCC structure. The space group, lattice constant, cell volume and relative content of each alloy phase in CoCuNiTi + x Diamond (C) (x = 0, 0.5, and 1.0 wt.%) HEACs were calculated by whole pattern fitting and Rietveld refinement, and their refinement weight factors are 6.82%, 1.70% and 2.63%, respectively. CoCuNiTi + x Diamond (C) (x = 0, 0.5, and 1.0 wt.%) HEACs exhibit dendritic structures composed of primary phase, dendrite, and interdendrite regions. Evident hole defects were observed in the samples without diamond. The Ti content in the primary phase of the three alloys is the highest. Co and Cu were enriched in the dendrite and interdendrite regions, respectively. The segregation of Ni in different regions of the three alloys is relatively small.
- (2)
- The friction coefficients of CoCuNiTi + x Diamond (C) (x = 0, 0.5, and 1.0 wt.%) HEACs gradually increase with the increase in friction time and then tend to be stable, and their friction coefficients are 0.6913, 0.4367, and 0.3808, respectively. As the diamond content increases, the friction coefficient gradually decreases. Specifically, the alloy with 1.0 wt.% diamond exhibits the lowest friction coefficient (0.3808) and the best wear resistance, mainly due to the combined effects of superhard phase strengthening, solid solution strengthening, and fine grain strengthening provided by the diamond particles.
- (3)
- There is no obvious passivation zone in the polarization curve of CoCuNiTi, which indicates active dissolution. The sample containing 0.5 wt.% diamond demonstrates the best corrosion resistance, characterized by the lowest self-corrosion current density of 10.94 μA·cm−2, the highest polarization resistance of 3471.10 Ω·cm2, and the smallest annual corrosion rate of 0.1003 mm/year, which is attributed to the densest passivation film. As the diamond content further increases and reaches 1.0 wt.%, its corrosion resistance decreases, mainly due to the combined effect of the kinetic corrosion mechanism dominated by the negative effect and the characteristic impedance mechanism dominated by the surface barrier layer caused by the excessive addition of diamonds.
- (4)
- Design guideline: For applications prioritizing wear resistance, 1.0 wt.% diamond is optimal; for those prioritizing corrosion resistance, 0.5 wt.% diamond is recommended.
Author Contributions
Conceptualization, M.M., Z.W., C.L. and D.Z. (Deliang Zhang); methodology, M.M., Z.W., C.Z., L.Z. and D.Z. (Dachuan Zhu); software, M.M., R.G., Y.D., C.L. and L.Z.; validation, M.M., R.G., Z.W. and L.Z.; formal analysis, R.G., Y.D., C.L. and L.Z.; investigation, M.M., Z.W., Y.D., C.L. and L.Z.; resources, Z.W., C.Z., D.Z. (Deliang Zhang) and D.Z. (Dachuan Zhu); data curation, M.M., C.L. and L.Z.; writing—original draft preparation, M.M. and L.Z.; writing—review and editing, R.G., Z.W., Y.D., C.Z., C.L. and D.Z. (Dachuan Zhu); visualization, M.M., C.L. and L.Z.; supervision, Z.W., C.Z., Y.D., D.Z. (Dachuan Zhu) and (Deliang Zhang); project administration, M.M., Z.W. and C.Z.; funding acquisition, M.M., Z.W., Y.D. and C.Z. All authors have read and agreed to the published version of the manuscript.
Funding
This work was supported by the Henan Province Science and Technology Research Project (252102221051, 252102231020), Henan Province University-Enterprise Collaborative Innovation Program (26AXQXT016), and Key Scientific Research Projects of Henan Province (25A510001).
Institutional Review Board Statement
Not applicable.
Informed Consent Statement
Not applicable.
Data Availability Statement
The original contributions presented in this study are included in this article. Further inquiries can be directed to the corresponding authors.
Conflicts of Interest
The authors declare no conflicts of interest.
References
- Gu, T.; Zhang, S.X.; Zhao, Y.H.; Yang, Y.R.; Liu, H.F.; Wu, L.; Liu, J.H.; Hou, H. Novel Method to Improve the Microstructure and Mechanical Properties of 45 Steel. Met. Mater. Int. 2022, 28, 833–840. [Google Scholar] [CrossRef] [Scilit]
- Liu, B.X.; Fan, K.Y.; Yin, F.X.; Feng, J.H.; Ji, P.G. Effect of Caliber Rolling Reduction Ratios on the Microstructure and Mechanical Properties of 45 Medium Carbon Steel. Mater. Sci. Eng. A 2020, 774, 138954. [Google Scholar] [CrossRef] [Scilit]
- Pacchioni, G. Designing Ductile Refractory High-Entropy Alloys. Nat. Rev. Mater. 2025, 10, 1. [Google Scholar] [CrossRef] [Scilit]
- Khan, M.A.; Brechtl, J.; Li, J.Y.; Radhika, N.; Zhang, Y.; Liaw, P.K.; Liao, W.B.; Afifi, M.A. High Strength and Ductility in a Lightweight AlTiNbZrTa Refractory High-Entropy Alloy Enabled by Nanophase Precipitation and Solute Segregation. Matter 2025, 8, 102204. [Google Scholar] [CrossRef] [Scilit]
- Kumar, P.; Cook, D.H.; Wang, W.Q.; Payne, M.; Borges, P.P.P.O.; Minor, A.M.; Asta, M.; Ritchie, R.O. Fracture Behavior of High-Entropy Alloys: Resistance to Fracture from Strain Hardening and Softening. Matter 2025, 8, 102042. [Google Scholar] [CrossRef] [Scilit]
- Wang, Z.W.; Li, Y.C.; Dong, H.; Wang, Y. Achieving Considerable Wear Resistance in New Ti-Based High-Entropy Alloys Through Microstructural Hardening by Adding Nb. Tribol. Int. 2025, 202, 110379. [Google Scholar] [CrossRef] [Scilit]
- Gou, J.M.; Liu, G.X.; Yang, T.Z.; Liu, X.L.; Pan, Y.; Liu, C.; Qian, Y.; Liu, Y.; Chen, Y.; Zhang, X.F.; et al. A High-Entropy Alloy Showing Gigapascal Superelastic Stress and Nearly Temperature-Independent Modulus. Nat. Commun. 2025, 16, 1227. [Google Scholar] [CrossRef] [Scilit]
- Cui, K.; Zhang, Y. High-Entropy Alloy Films. Coatings 2023, 13, 635. [Google Scholar] [CrossRef] [Scilit]
- Song, C.X.; Zhao, W.; Bi, J.P.; Li, S.; Gao, H.R.; Zhang, H.; Gao, S.; Lv, Y.X.; Rao, W.F. Effect of V Addition on the Microstructure and Wear Resistance of CoCrFeNiNb High-Entropy Alloy Laser Cladding Layers. Intermetallics 2025, 179, 108654. [Google Scholar] [CrossRef] [Scilit]
- Zhao, W.; Song, C.X.; Wang, L.; Zhang, H.; Lv, Y.X.; Xiao, G.C.; Rao, W.F. Microstructure and Properties of In-Situ TiN-Reinforced AlxCoCrFeNiTi High-Entropy Alloy Laser Cladding Layers. Surf. Coat. Technol. 2025, 518, 132881. [Google Scholar] [CrossRef] [Scilit]
- Huang, H.Z.; Huang, C.; Tu, J.; Deng, L.; Turkevych, D.; Liu, H.; Luo, J.W.; Fang, S.Y.; Yang, L.; Xie, C.; et al. Enhanced Wear Resistance of CuSn19Ti10/Ni-Coated Diamond Composite Coatings Prepared by Laser Cladding: Influence of Nickel Plating on Diamond Retention and Microstructure. Int. J. Refract. Met. Hard Mater. 2025, 128, 107066. [Google Scholar] [CrossRef] [Scilit]
- Jin, T.T.; Shi, Y.S.; Ding, J.W.; Wang, Y.; Hu, S.H.; Zhang, W.; Peng, Y.B. Laser Cladding of Diamond Reinforced Composite Coatings on the Rotary Tiller Blade with Complex Curved Surface: Cladding Paths and Residual Stress. Surf. Coat. Technol. 2025, 516, 132734. [Google Scholar] [CrossRef] [Scilit]
- Zhang, Y.; Han, T.F.; Xiao, M.; Shen, Y.F. Tribological Behavior of Diamond Reinforced FeNiCoCrTi0.5 Carbonized High-Entropy Alloy Coating. Surf. Coat. Technol. 2020, 401, 126233. [Google Scholar] [CrossRef] [Scilit]
- Chen, J.R.; Zhang, W.; Chen, Y.X.; Gao, Y.; Fang, Y.J.; Lei, W.H.; Ma, Q.Y.; Hu, S.H.; Zhang, Y.L. Regulating Diamond-Induced Pores in Laser-Cladded HEA/Diamond Coatings by Thermal-Fluid Coupling. Diam. Relat. Mater. 2025, 160, 113034. [Google Scholar] [CrossRef] [Scilit]
- Bu, F.; Li, C.G.; Shen, C.; Zhang, X.J.; Sun, X.G.; Feng, X.S. Microstructures and Wear Resistance of Diamond-Reinforced FeCoCrNiAl0.5Ti0.5Si0.2-Carbonized High-Entropy Alloy Coatings by Laser Cladding. Trans. Indian Inst. Met. 2022, 75, 1967–1978. [Google Scholar] [CrossRef] [Scilit]
- Peng, Y.B.; Kong, Y.; Zhang, W.; Zhang, M.Y.; Wang, H.J. Effect of Diffusion Barrier and Interfacial Strengthening on the Interface Behavior Between High Entropy Alloy and Diamond. J. Alloys Compd. 2021, 852, 157023. [Google Scholar] [CrossRef] [Scilit]
- Ma, M.X.; Zhao, L.; Wang, Z.X.; Li, S.Z.; Dong, C. Effect of CeO2 Doping on the Microstructure and Corrosion Behavior of CoCuNiTi High-Entropy Alloy Coatings. Mater. Technol. 2021, 55, 861–869. [Google Scholar] [CrossRef] [Scilit]
- Jiang, W.; Ju, J.H.; Li, Z.L.; Wang, Z.Y.; Wang, E.H.; Zhao, F. Synergetic Effect of Bias Voltage on Tribological Properties and Corrosion Behavior of CoCrNiTi Medium Entropy Alloy Films Deposited by Magnetron Sputtering. Surf. Coat. Technol. 2025, 512, 132380. [Google Scholar] [CrossRef] [Scilit]
- Mohanty, S.; Katiyar, N.K.; Ahlawat, S.; Bhattacharya, S.; Sen, D.; Biswas, A.; Biswas, K. Hierarchical Phase Separation of Equiatomic CoCuFeNiTi High-Entropy Alloy During Spark Plasma Sintering. J. Mater. Sci. 2025, 60, 1424–1438. [Google Scholar] [CrossRef] [Scilit]
- Li, Z.L.; Jiang, W.; Liu, Y.; Wang, E.H.; Wang, Z.Y.; Zhao, F.; Dai, H.B. Wear and Corrosion Performance of CoCrNiTi Medium Entropy Alloy Films: A Magnetron Sputtered Architecture from Crystal to Amorphous. Surf. Coat. Technol. 2026, 519, 132931. [Google Scholar] [CrossRef] [Scilit]
- Wang, H.; Zhang, W.; Peng, Y.; Zhang, M.; Liu, S.; Liu, Y. Microstructures and Wear Resistance of FeCoCrNi-Mo High Entropy Alloy/Diamond Composite Coatings by High Speed Laser Cladding. Coatings 2020, 10, 300. [Google Scholar] [CrossRef] [Scilit]
- Ma, M.; Wang, Z.; Zhu, C.; Dong, Y.; Liu, L.; Zhao, L.; Cui, Q.; Zhu, D.; Zhang, D. Effect of Mn Doping on Microstructure and Corrosion Behavior of CoCuNiTi High-Entropy Alloy Coatings. Crystals 2025, 15, 29. [Google Scholar] [CrossRef] [Scilit]
- Ma, M.X.; Zhu, D.C.; Wang, Z.X.; Liang, C.; Zhou, J.C.; Zhang, D.L. Microstructure and Wear Resistance of AlCoCrCuFe High-Entropy Alloy. Adv. Eng. Sci. 2018, 50, 208–216. [Google Scholar] [CrossRef]
- Peng, Y.; Jin, T.; Ding, J.; Shi, Y.; Wang, Y.; Zhang, W. Integrated Manufacturing of Heterogeneous-Material Tillage Wear-Resisting Parts Based on Selective Laser Melting. J. Alloys Compd. 2025, 1014, 178723. [Google Scholar] [CrossRef] [Scilit]
- Bi, G.J.; Gasser, A.; Wissenbach, K.; Drenker, A.; Poprawe, R. Identification and Qualification of Temperature Signal for Monitoring and Control in Laser Cladding. Opt. Lasers Eng. 2006, 44, 1348–1359. [Google Scholar] [CrossRef] [Scilit]
- Ma, M.X.; Wang, Z.X.; Zhou, J.C.; Liang, C.; Zhu, D.M.; Zhang, D.L. Effect of Ti Doping on Microstructure and Wear Resistance of CoCrCuFeMn High-Entropy Alloys. J. Mech. Eng. 2020, 56, 110–116. [Google Scholar] [CrossRef] [Scilit]
- Liu, C.; Dong, F.Y.; Zhang, Y.; Yuan, X.G.; Wang, B.B.; Luo, L.S.; Su, Y.Q.; Cheng, J.; Liaw, P.K. Morphology, Microstructure, and Mechanical Properties of TiZrTa0.7NbMo Refractory High-Entropy Alloy Spherical Powder Prepared by Ultrasonic Atomization. Intermetallics 2025, 187, 109019. [Google Scholar] [CrossRef] [Scilit]
- Wang, G.Y.; Hsu, W.C.; Huang, Z.W.; Yeh, J.W.; Tsai, C.W. The Growth Activation Energy of Sigma Phase in Nonequal Molar CoCrFeNiV Low Entropy and High Entropy Alloys. J. Alloys Compd. 2025, 1017, 178863. [Google Scholar] [CrossRef] [Scilit]
- Takeuchi, A.; Inoue, A. Classification of Bulk Metallic Glasses by Atomic Size Difference, Heat of Mixing and Period of Constituent Elements and Its Application to Characterization of the Main Alloying Element. Mater. Trans. 2005, 46, 2817–2829. [Google Scholar] [CrossRef] [Scilit]
- Guo, S.; Liu, C.T. Phase Stability in High Entropy Alloys: Formation of Solid-Solution Phase or Amorphous Phase. Prog. Nat. Sci.-Mater. Int. 2011, 21, 433–446. [Google Scholar] [CrossRef] [Scilit]
- Ma, M.X.; Zhu, D.C.; Wang, Z.X.; Li, S.Z.; Dong, C. Effect of Zr Addition on Microstructure and Wear Properties of CoCrCuFeMn High-Entropy Alloy. Adv. Eng. Sci. 2021, 53, 204–210. [Google Scholar] [CrossRef]
- Zhang, Y.; Lu, Z.P.; Ma, S.G.; Liaw, P.K.; Tang, Z.; Cheng, Y.Q.; Gao, M.C. Guidelines in Predicting Phase Formation of High-Entropy Alloys. MRS Commun. 2014, 4, 57–62. [Google Scholar] [CrossRef] [Scilit]
- Ren, M.X.; Li, B.S.; Fu, H.Z. Formation Condition of Solid Solution Type High-Entropy Alloy. Trans. Nonferrous Met. Soc. China 2013, 23, 991–995. [Google Scholar] [CrossRef] [Scilit]
- Lu, K.; Kessler, C.S.; Davis, R.M. Optimization of a Nanoparticle Suspension for Freeze Casting. J. Am. Ceram. Soc. 2006, 89, 2459–2467. [Google Scholar] [CrossRef] [Scilit]
- Ma, M.X.; Wang, Z.X.; Lu, J.J.; Zhou, J.C.; Liang, C.; Zhu, D.C.; Zhang, D.L. Effect of CeO2 Doping on Microstructure and Wear Resistance of CoCrCuFeMn High-Entropy Alloy. Trans. Mater. Heat Treat. 2019, 40, 50–56. [Google Scholar] [CrossRef]
- Jia, W.R.; Zheng, K.; Han, X.L.; Wang, J.W.; Wu, Y.X.; Gao, J.; Yu, S.W.; Gong, Y.P. Construction of Biomimetic Micro-Nano Composite Structured Refractory High-Entropy Alloys/Diamond Composite Modified Layer on 316L Stainless Steel: A Comprehensive Study on Wear Property, Corrosion Resistance, and Biological Behavior. Chem. Eng. J. 2025, 522, 168024. [Google Scholar] [CrossRef] [Scilit]
- Lowe, M.A.; Fischer, A.E.; Swain, G.M. Formation of a Crack-Free and Debonding-Resistant Boron-Doped Diamond Thin Film on Titanium Using a Dual-Coating Strategy. J. Electrochem. Soc. 2006, 153, B506. [Google Scholar] [CrossRef] [Scilit]
- Allagui, A.; Balaguera, E.H.; Wang, C.L. On the Distributed Resistor-Constant Phase Element Transmission Line in a Reflective Bounded Domain. J. Electrochem. Soc. 2025, 172, 056502. [Google Scholar] [CrossRef] [Scilit]
- He, T.; Zhang, S.H.; Kong, X.W.; Wu, J.J.; Liu, L.L.; Wu, D.Y.; Su, Z. Influence of Diamond Parameters on Microstructure and Properties of Copper-Based Diamond Composites Manufactured by Fused Deposition Modeling and Sintering (FDMS). J. Alloys Compd. 2023, 931, 167492. [Google Scholar] [CrossRef] [Scilit]
- Yu, J.S.; Liu, C.C. Microfabricated Thin Film Impedance Sensor & AC Impedance Measurements. Sensors 2010, 10, 5845–5858. [Google Scholar] [CrossRef] [Scilit]
- Ren, P.W.; Tang, X.Y.; Qin, Z.A.; Wang, Y.H.; Cai, J.J. Coupling Effect of Hydrostatic Pressure and Erosion on Corrosion Behavior of X70 Steel in Simulated Seawater. ACS Omega 2022, 7, 44033–44046. [Google Scholar] [CrossRef] [Scilit] [PubMed]
- Liu, T.; Lyu, W.M.; Li, Z.C.; Wang, S.K.; Wang, X.; Jiang, J.X.; Jiang, X.S. Recent Progress on Corrosion Mechanisms of Graphene-Reinforced Metal Matrix Composites. Nanotechnol. Rev. 2023, 12, 20220566. [Google Scholar] [CrossRef] [Scilit]
- Zeng, A.; Liu, E.; Annergren, I.F.; Tan, S.N.; Zhang, S.; Hing, P.; Gao, J. EIS Capacitance Diagnosis of Nanoporosity Effect on the Corrosion Protection of DLC Films. Diam. Relat. Mater. 2002, 11, 160–168. [Google Scholar] [CrossRef] [Scilit]
- Ge, H.J.; Bai, Y.H.; Zhang, H.; Yuan, H.R.; Zhu, Z.J.; Liu, P.; Zeng, Y.X.; Wang, J.Y. Role of Crevice Size Induced Microenvironment Variation Within the Gap in Initiating Crevice Corrosion of 201 Stainless Steel. Front. Mater. 2025, 11, 1543536. [Google Scholar] [CrossRef] [Scilit]
- Peng, G.G.; Liang, Y.L.; Ren, X.L. The Performance of Nano-Y2O3-Reinforced ZK60 Matrix Nanocomposites Prepared by Powder Metallurgy. Mater. Des. 2023, 236, 112492. [Google Scholar] [CrossRef] [Scilit]
- Lv, X.; Deng, K.K.; Wang, C.J.; Nie, K.B.; Shi, Q.X.; Liang, W. The Corrosion Properties of AZ91 Alloy Improved by the Addition of Trace Submicron SiCp. Mater. Chem. Phys. 2022, 286, 126143. [Google Scholar] [CrossRef] [Scilit]
- Qiu, F.; Tong, H.T.; Shen, P.; Cong, X.S.; Wang, Y.; Jiang, Q.C. Overview: SiC/Al Interface Reaction and Interface Structure Evolution Mechanism. Acta Metall. Sin. 2019, 55, 87–100. [Google Scholar] [CrossRef]
- Geiderman, K.; Lee, L.; Donne, S.W. Flat-Band Potential of a Semiconductor: Using the Mott–Schottky Equation. J. Chem. Educ. 2007, 84, 685. [Google Scholar] [CrossRef] [Scilit]

Disclaimer/Publisher’s Note: The statements, opinions and data contained in all publications are solely those of the individual author(s) and contributor(s) and not of MDPI and/or the editor(s). MDPI and/or the editor(s) disclaim responsibility for any injury to people or property resulting from any ideas, methods, instructions or products referred to in the content. |
© 2026 by the authors. Licensee MDPI, Basel, Switzerland. This article is an open access article distributed under the terms and conditions of the Creative Commons Attribution (CC BY) license.