


Abstract
Polyurethane (PU) mixtures exhibit superior mechanical performance compared to traditional asphalt mixtures, owing to the excellent engineering properties of the PU binder. This study investigates the dynamic rheological properties of an open-graded polyurethane mixture (PUM–OGFC) in comparison with a dense-graded polyurethane mixture (PUM–AC). The time–temperature superposition principle and three rheological models (Standard Logistic Sigmoid (SLS), Generalized Logistic Sigmoid (GLS), and Havriliak–Negami (HN)) were employed to construct and analyze master curves. The results show that while PUM–AC possesses a higher dynamic modulus, PUM–OGFC exhibits a lower phase angle, indicating a more elastic response. Critically, PUM–OGFC demonstrated superior rutting resistance, as evidenced by its higher rutting parameter (|E*|/sin δ). Aggregate gradation significantly influenced all rheological properties. The master curve analysis further revealed that PUM–OGFC exhibits greater temperature sensitivity than PUM–AC. The SLS and GLS models provided excellent fits for both dynamic modulus and phase angle data, whereas the HN model was suitable only for dynamic modulus. In summary, the open-graded structure, when combined with a PU binder, creates a high-performance composite with an exceptional balance of elasticity and rutting resistance, showcasing its potential for demanding pavement applications.
1. Introduction
Water or rain accumulates on the surface of traditional dense gradation asphalt pavement, creating several hazards to driving safety and structural integrity: (a) hydroplaning risk, water buildup can form a film that reduces tire–pavement surface contact, increasing skidding risk [1,2,3,4,5,6,7,8,9,10,11,12,13,14]; (b) water mist and glare, water spray from water buildup impairs driver visibility and increases the risk of glare [1,2,5,9,10,12,13,15,16,17,18]; (c) increased braking distance, the water film decreases the skid coefficient between the tire and pavement, leading to longer braking distance [19,20]; (d) reduced durability, water penetrating the pavement structure accelerates asphalt aging and can induce freeze–thaw damage, raveling, and other moisture-related distresses [1,3,5,10,12,14,21,22,23,24]; (e) freezing risk, water buildup freezes at low temperature, creasing ice layers that further increase skidding risk; and (f) reduced skid resistance, water erosion accelerates asphalt binder stripping and aging, which decreases skid resistance [25]. Porous asphalt mixture, commonly known as an open-graded friction course (OGFC), is designed to mitigate these water-related issues and enhance overall pavement performance. OGFC consists of a coarse aggregate skeleton with stone-on-stone contact, bonded by a high-viscosity asphalt film (≥8 μm), and is designed with a high air void content of 15%–25% [1,3,4,5,9,10,26]. OGFC offers several advantages: (a) rapid drainage, water on the pavement surface drains rapidly through the pores, minimizing water spray, splash, and glare [1,2,4,5,6,9,10,11,12,15,17,18,26], thereby significantly enhancing driver visibility; (b) anti-slip and wear-resistance, the exposed coarse aggregates create a significant macro-structure (mean profile depth, MPD > 1.5 mm) and yield a higher British Pendulum Number (BPN > 60), reducing accident risk in wet conditions [1,5,8,10,12,14,17,20,24,26,27,28,29,30,31]; (c) noise reduction, the high air void content absorbs tire–pavement interaction noise, typically reducing sound levels by 3–5 dB compared to dense-graded pavements, thereby improving driving comfort [1,2,4,5,10,15,16]; (d) rutting resistance, the stone skeleton enhances shear strength and provides greater high-temperature dynamic stability compared to dense-graded asphalt pavement [29,32,33,34,35]; (e) performance in special climates, OGFC is particularly suitable for rainy regions and areas prone to winter freezing [34,36,37]; and (f) environmental benefit, OGFC reduces runoff pollution, mitigates urban flooding, and aids in underwater recharge [1,12,24,27,32].
However, the widespread application of conventional OGFC is often limited by its mechanical performance, particularly at elevated temperatures. The dynamic modulus of OGFC is highly dependent on the coarse aggregate skeleton and the asphalt binder. As temperature rises, the asphalt binder softens, significantly weakening skeletal support and leading to a substantial reduction in dynamic modulus and rutting resistance [14,22,28,34,35,38]. This inherent temperature susceptibility underscores the need for advanced binder technologies to unlock the full, durable potential of porous pavement structures. For instance, the dynamic modulus at 60 °C is reduced by 40%–50% compared to that at 25 °C [39,40]. The dynamic modulus of epoxy asphalt OGFC at −10 °C is three to four times greater than that at 20 °C, but it is reduced by 75%–80% at 60 °C [39]. As the asphalt binder softens, the supporting function of coarse aggregate is weakened. The phase angle, which reflects the temperature sensitivity of OGFC, increases with rising temperature due to the enhanced viscous effect of the asphalt binder. The phase angle decreases at low temperature or high frequency, where the elastic properties of the asphalt binder dominate. Conversely, it increases at high temperature or low frequency, where the viscous property dominates [39,41]. The dynamic modulus values of OGFC also increase with loading frequency [8,12,38]. This occurs because the aggregate skeleton dominates the response at high frequency, while the viscosity of the asphalt binder dominates at low loading frequency, which is the characteristic of a viscoelastic material [39]. At high loading frequency, OGFC exhibits a high elastic modulus due to its frequency-dependent behavior, which helps reduce rutting damage [19,34,42]. For epoxy asphalt OGFC at 20 °C, the dynamic modulus increases from 2000 MPa at 0.1 Hz to 12,000 MPa at 25 Hz [39]. The dynamic modulus of OGFC can reduce tensile strain at the bottom of the asphalt layer by 12%–18% and pressure strain on the soil base by 10%–15%, thereby mitigating fatigue and rutting damage. For example, in the Mechanistic–Empirical Pavement Design Guide (MEPDG), the addition of an OGFC layer reduces bottom tensile strain by 15%–20%. The dynamic modulus is dominated by the coarse aggregate skeleton [43]. OGFC with a medium aggregate gradation (15%–25% passing the 4.75 mm sieve) composes more aggregate skeleton contact points; consequently, its dynamic modulus is greater than that of OGFC with a coarse aggregate gradation [44,45]. When the air void content in OGFC exceeds 22%, the aggregate skeleton and dynamic modulus decrease, which can induce raveling damage [5,46]. The dynamic modulus of OGFC decreases by 23.5% when the air void content increases from 18% to 24%, as the increased air void weakens the aggregate skeleton [47,48,49].
To address this limitation, the performance of OGFC can be significantly enhanced by using high-performance binders, such as crumb rubber-modified asphalt (CRMA) or polyurethane (PU). The performance of the OGFC mixture can be significantly enhanced by using high-viscosity asphalt binders (with a dynamic viscosity at 60 °C typically ≥20,000 Pa·s, according to ASTM D3381/D3381M), such as crumb rubber-modified asphalt (CRMA) and polyurethane (PU)-modified asphalt (PUMA), which improve durability and reduce temperature sensitivity [7,12,17,26,27]. CRMA improves the adhesive strength and fatigue resistance of OGFC mixtures. Similarly, PUMA enhances the durability and water damage resistance of porous polyurethane-modified asphalt mixture (PPAM) [29]. Blockage and permeability tests indicate that PPAM exhibits superior resistance to blockage compared to traditional OGFC [29]. Freeze–thaw tests demonstrate that PPAM possesses greater low-temperature stability than traditional OGFC; for instance, the dynamic modulus of OGFC decreased by 20%–35% after the test, whereas PPAM declined by less than 10% [34]. Furthermore, the Hamburg wheel-track test and dynamic modulus test reveal that PPAM offers greater resistance to deformation and fatigue [29,35]. The dynamic modulus values of PPAM exhibit a positive correlation with its rutting resistance and serve as an indicator of its viscoelastic property. Consequently, the dynamic modulus test can be utilized as a tool for selecting high-performance porous mixtures [34,35] and optimizing mixture design [50,51].
Notably, when PU replaced asphalt as the binder, the dynamic modulus of the PU mixture was greater than that of the corresponding asphalt mixture at elevated temperatures (>40 °C). For instance, the dynamic modulus of a stone matrix polyurethane mixture (SMPU–13) exceeded 8000 MPa at 60 °C, whereas the corresponding asphalt mixture dropped to 156 MPa at 50 °C [29]. The PU mixture also demonstrated a higher rutting factor, indicating superior resistance to permanent deformation at high temperatures [41]. Furthermore, the PU mixture exhibited a more stable phase angle and excellent viscoelastic properties [29]. The dynamic modulus of the asphalt mixture was significantly influenced by temperature and loading frequency, decreasing dramatically at high temperatures. In contrast, a Superpave polyurethane mixture (SUPU–20) maintained significantly higher dynamic modulus values under the same conditions [29]. Wang Huoming [52,53,54] found that porous PU mixture (PPM) with an open-graded structure exhibits superior performance, including deformation, fatigue, corrosion, and light/heat aging resistance, compared to both dense-graded and open-graded asphalt mixtures. Chen et al. [55] reported that PPM exhibits greater resistance to clogging from infiltrating soil suspended solids than OGFC. Cong et al. [56] found that PPM possesses a Marshall stability three times greater and a fatigue life one order of magnitude higher than those of OGFC. Sun [57] demonstrated that PPM exhibits superior resistance to high-temperature rutting, low-temperature cracking, and moisture damage. Similarly, Li [58] found that PPM offers improved resistance to high-temperature deformation, cracking, and moisture compared to traditional open-graded asphalt mixtures. While these studies confirm the outstanding macro-mechanical performance of PPM, a comprehensive understanding of their fundamental dynamic rheological behavior—the very basis for mechanistic design and performance prediction—remains less explored. Specifically, there is a lack of comparative studies that systematically evaluate how aggregate gradation (open-graded vs. dense-graded) influences the viscoelastic properties, rutting potential, and model-predicted responses of PU-based composites.
To bridge this knowledge gap, this study presents a comparative investigation into the fundamental dynamic rheological behavior of polyurethane mixtures with open-graded (PUM–OGFC, OGFC–13) and dense-graded (PUM–AC, AC–13) structures. Dynamic modulus and phase angle were characterized across a spectrum of temperatures and loading frequencies. The time–temperature superposition principle was applied to construct master curves, which were fitted using three rheological models (SLS, GLS, HN). Furthermore, the Kramers–Kronig (K–K) relations were employed to derive and evaluate corresponding phase angle master curves. This work aims to elucidate how aggregate gradation governs the viscoelastic response and performance potential of PU-based composites, providing critical insights for the mechanistic design of high-performance, sustainable porous pavements.
2. Materials and Methods
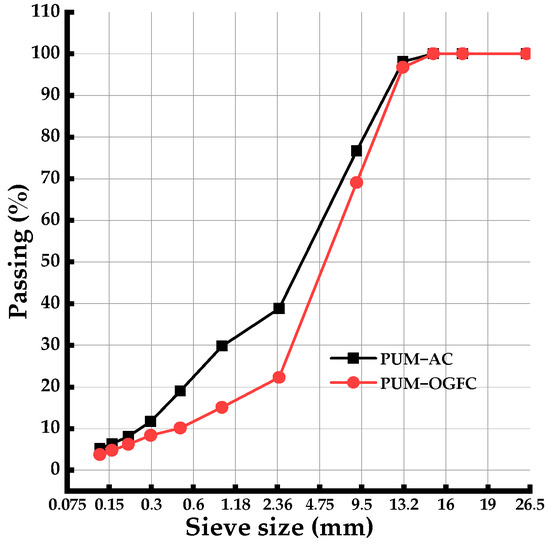
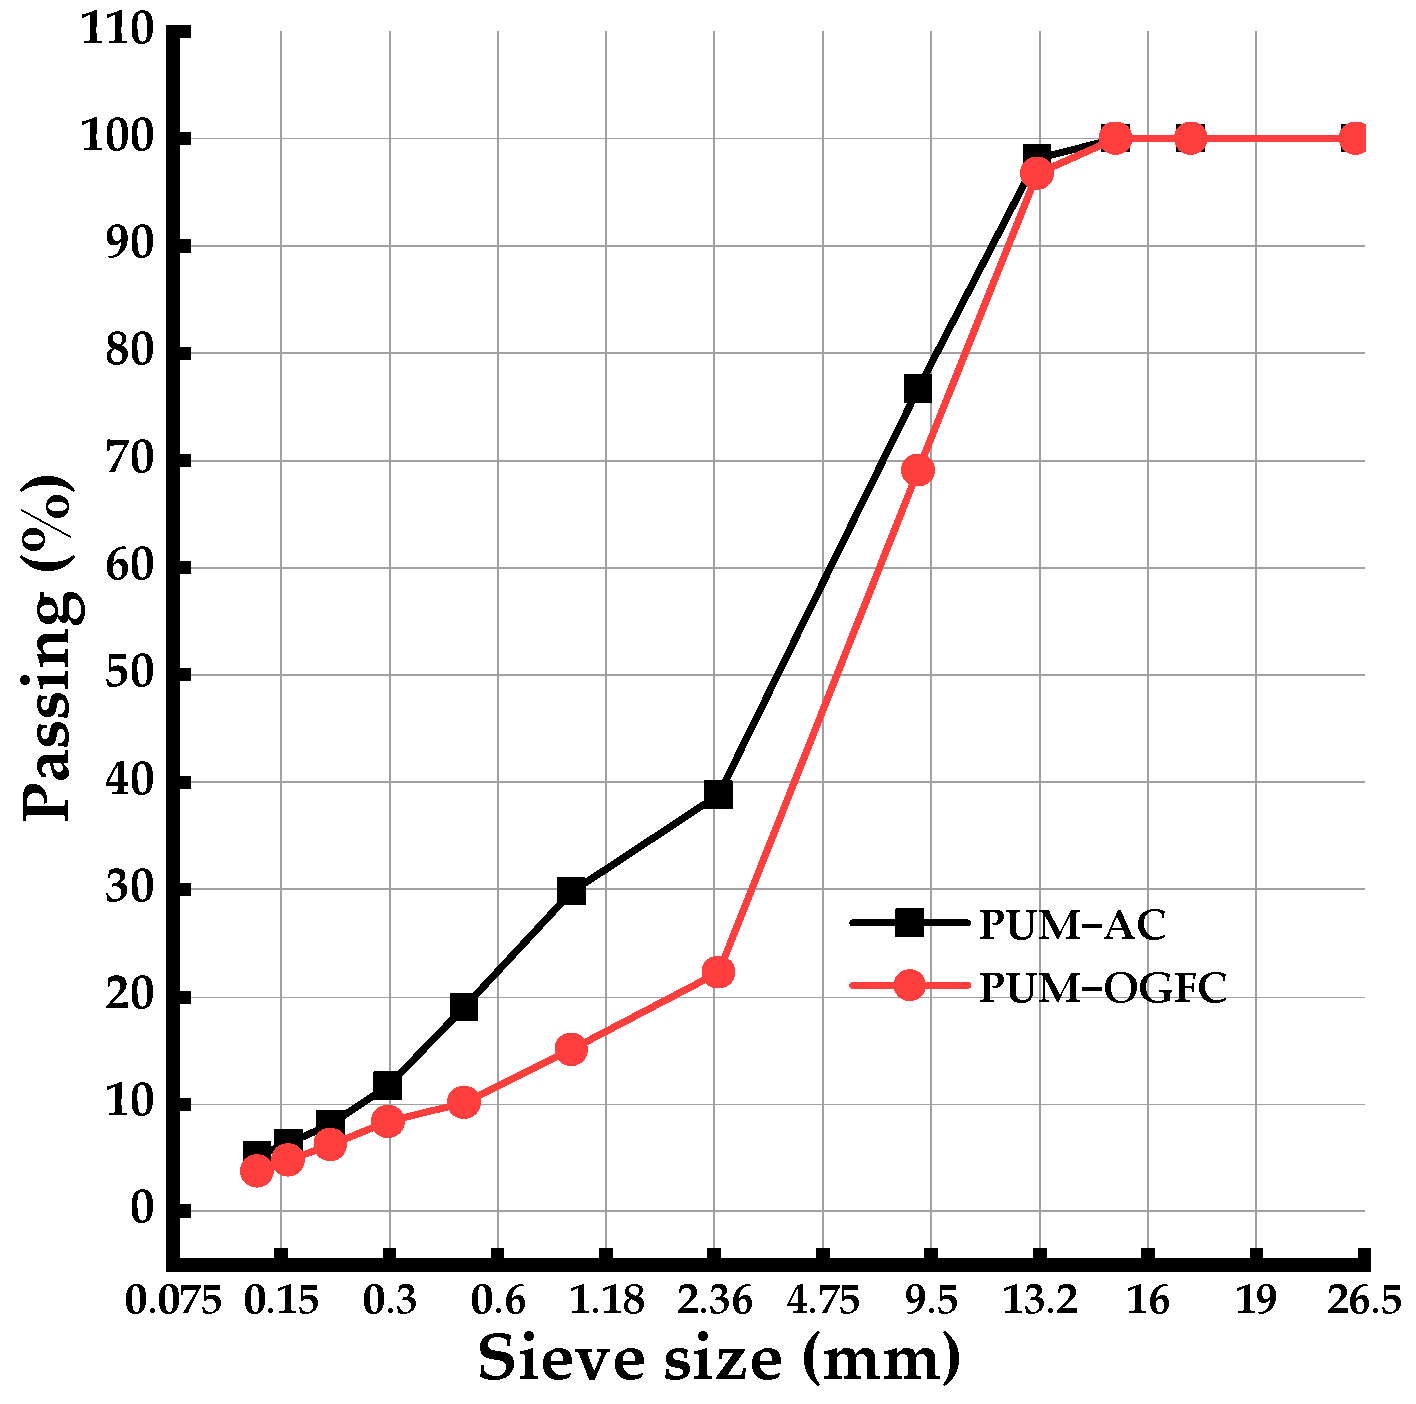
Two aggregate gradations were selected for mixture preparation. The first was a conventional dense-graded asphalt concrete (AC–13) gradation, representing a standard, continuously graded structure. The second was an open-graded friction course (OGFC–13) gradation, characterized by a gap-graded design with a high proportion of coarse aggregate and limited fine content to create an interconnected air void network. These corresponding aggregate gradations were plotted in Figure 1. The binder, which was provided by Wanhua Chemical Group Co., Ltd. (Yantai, China), was one kind of wet-setting PU binder; the optimum PU binder contents were determined by the Marshal method for asphalt mixture. The optimum PU binder contents were 4.9% and 4.7% for PUM–OGFC and PUM–AC, respectively.
Figure 1.
Aggregate gradation for PUM–OGFC and PUM–AC.
After the aggregate gradation and optimum PU binder content were determined, specimens would be compacted by the Superpave gyratory compactor (SGC) to a size of 175 mm in height and 150 mm in diameter. The specimens would be kept in a certain environment (35 °C and 70% RH) for 7 days. After the setting process, the specimens were cut into special sizes for the dynamic modulus test, which was 150 mm in height and 100 mm in diameter. A dynamic modulus test was performed on selected conditions (5 °C, 15 °C, 25 °C, 35 °C, 45 °C, 55 °C, and 25, 20, 10, 5, 2, 1, 0.5, 0.2, 0.1 Hz for each test temperature) by the asphalt mixture performance tester (UFA102QK00, Controls S.p.A., Milan, Italy). All specimens of PUM–OGFC and PUM–AC were tested at the same test temperature and loading frequency; average values for three duplicates for each PU mixture were adopted for the following analysis.
Scholars developed various master curve models for analyzing dynamic modulus test results: the SLS model [59], the GLS model [60], and the HN model [61], selected in this paper for analyzing dynamic modulus test results. These three models were listed in Equations (1)–(3).
where |E*|—dynamic modulus (MPa); fr—load frequency at the reference temperature (Hz); δ, α, β, and γ—fitting parameters.
where δ′, α′, β′, and γ′–fitting parameters; λ–added parameter to account for the asymmetric shape of the function.
where i2 = −1; ω0 = 1/τ0; ω—angular frequency; τ0—determines the horizontal position of the real or imaginary part of the dynamic modulus along the frequency axis; |E∞|—dynamic modulus as ω approaches ∞; |E0|—dynamic modulus as ω approaches 0; and α″ and β″—fitting parameters.
There were no determined models developed for fitting phase angle data, but the Hilbert integral transforms [62] can be introduced to transform dynamic modulus master curve models to fit corresponding phase angle data; this process is known as the K–K relation, which is shown in Equation (4) [63].
Using Equation (4), the SLS, GLS, and HN models in Equations (1)–(3) can be transformed into corresponding mathematical models for the phase angle, which are shown in Equations (5)–(7).
Based on the time–temperature superposition principle (TTSP), measured data points at different test temperatures can be shifted to the selected temperature to build a smooth master curve, which can be used to characterize the viscoelastic property of different asphalt mixtures. The shift factor is used as the shifted distance between the measured data point at different temperatures and master curves at the reference temperature, as shown in Equation (8).
where log(f)—frequency in experiment temperature; log(fr)—reduced frequency in reference temperature; and αT—shift factor.
The temperature shift factor αT at temperature T can be calculated using the Williams–Landel–Ferry (WLF) [64,65,66,67] empirical equations. The equation is described in Equation (9):
where C1 and C2—constants; T—test temperature; and T0—reference temperature (20 °C in this paper).
The master curve fitting process is to minimize the error between experimental data points and predicted data points using different models. The error-minimizing process is performed by the nonlinear regression process, as shown in Equations (10) and (11).
where E*Exp—experimental dynamic modulus; E*Pre—predicted dynamic modulus using different mathematical models; δExp—experimental phase angle; and δPre—predicted phase angle using different mathematical models.
Indexes, including Se/Sy (the ratio of the standard error (Se) to the standard deviation (Sy)) minimization, R2, SSE (Sum of Squared Error), and Error2, were introduced to estimate the regression accuracy, shown in Equations (12)–(16).
where xi—measured dynamic modulus; —predicted dynamic modulus; and —mean value of the measured dynamic modulus.
where n—sample size, and p—number of parameters to be estimated.
3. Results
3.1. Dynamic Modulus and Phase Angle Results of Two PU Mixtures
3.1.1. Dynamic Modulus Results
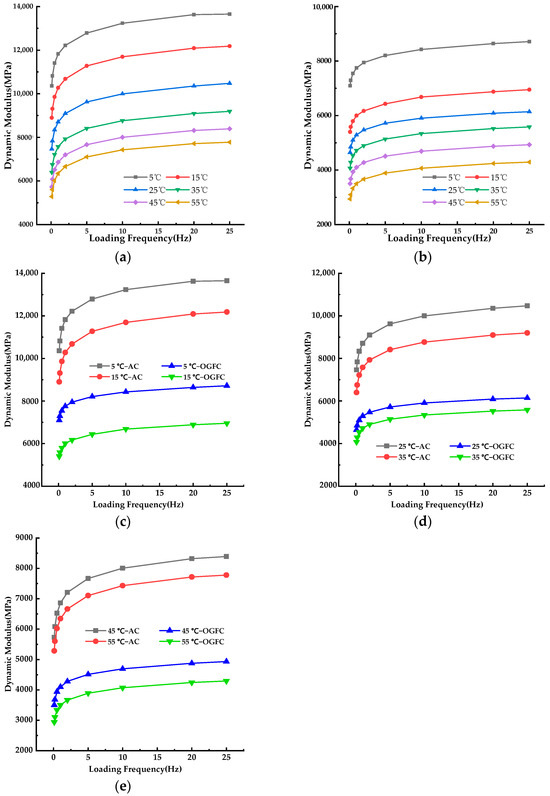
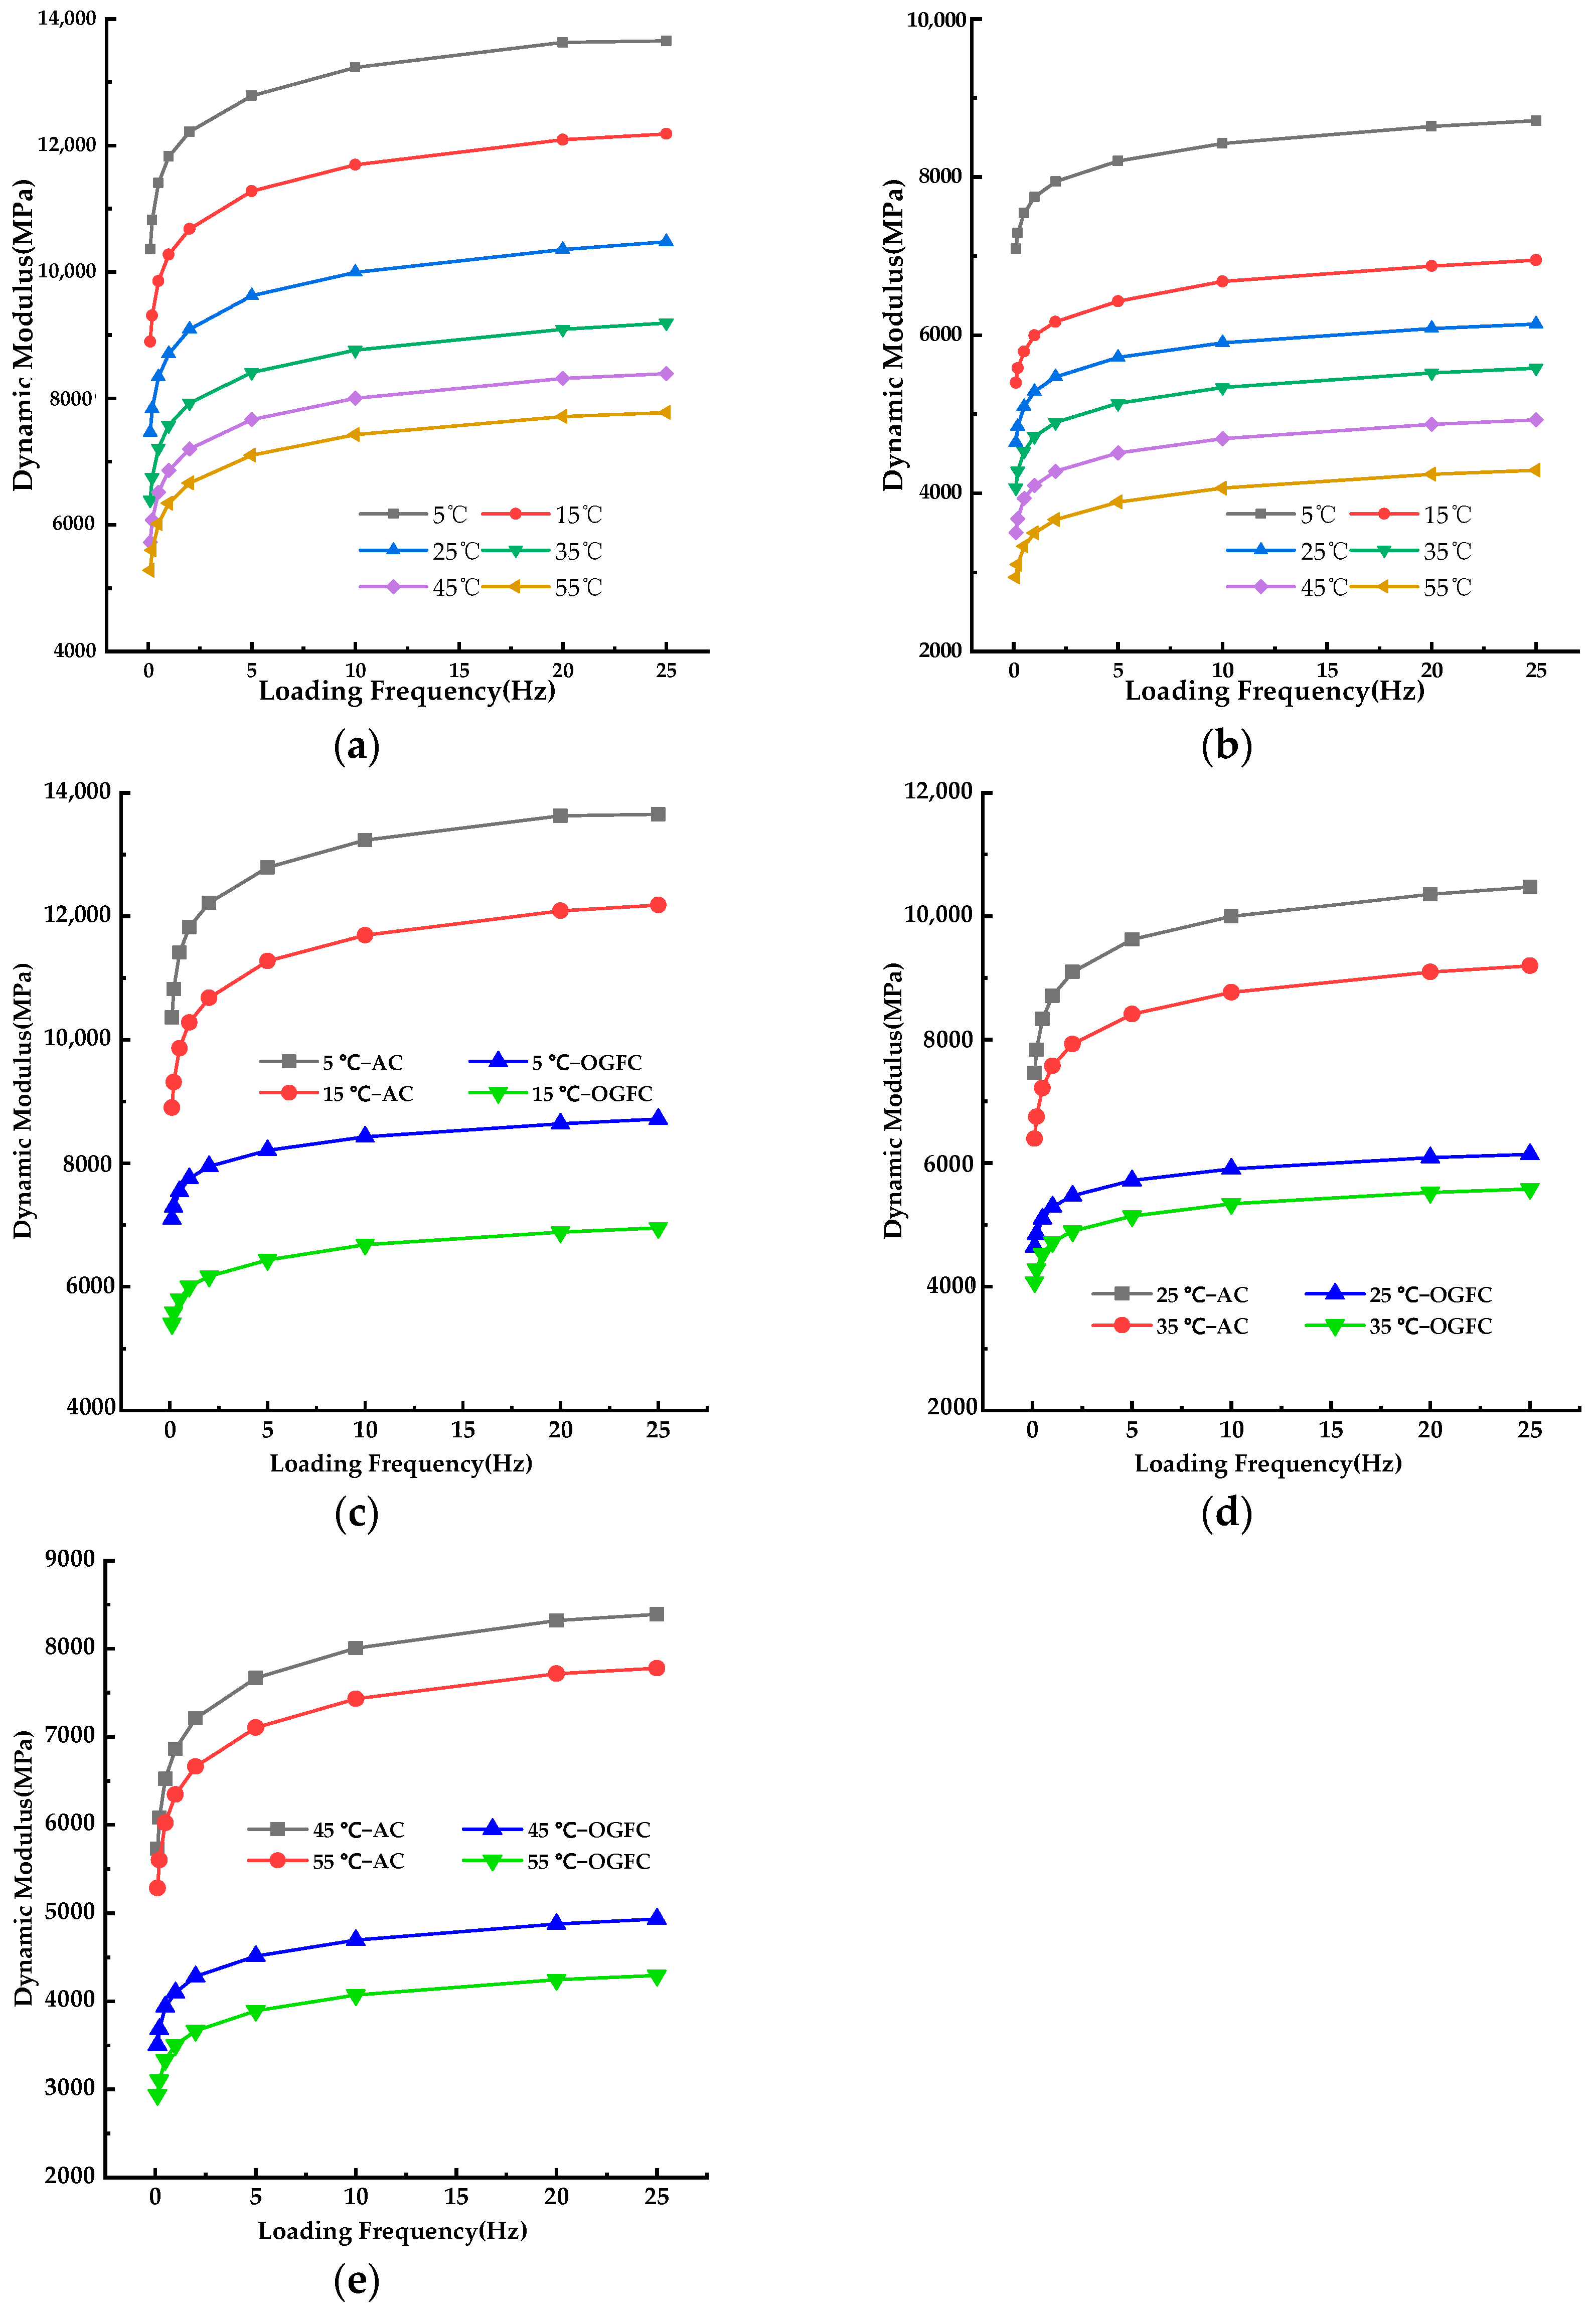
The dynamic modulus results of PUM–OGFC and PUM–AC under different test temperatures and loading frequencies were plotted separately in Figure 2a,b, and the dynamic modulus results at the same test temperatures for PUM–OGFC and PUM–AC were shown together in Figure 2c–e.
Figure 2.
Dynamic modulus |E*| values for PUM–OGFC and PUM–AC. (a) |E*| of PUM–AC across various test temperatures; (b) |E*| of PUM–OGFC across various test temperatures; (c) comparison |E*| of PUM–OGFC and PUM–AC at 5 °C and 15 °C; (d) comparison |E*| of PUM–OGFC and PUM–AC at 25 °C and 35 °C; (e) comparison |E*| of PUM–OGFC and PUM–AC at 45 °C and 55 °C.
3.1.2. Phase Angle Results
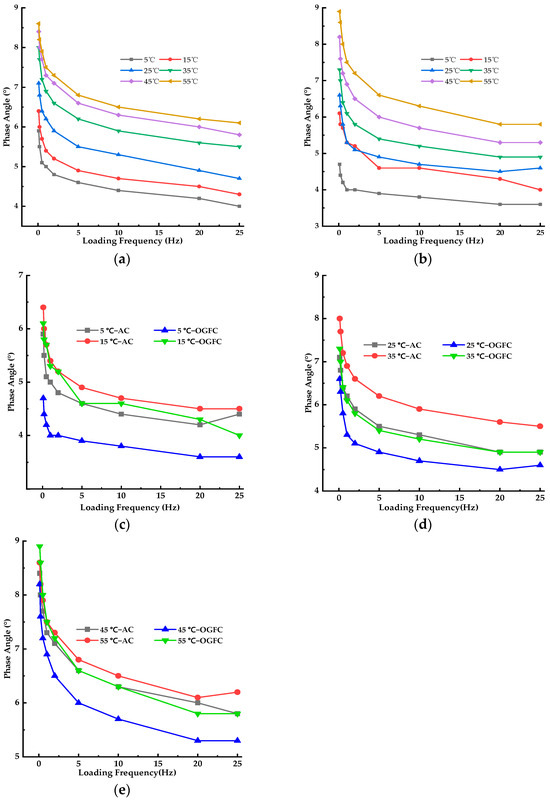
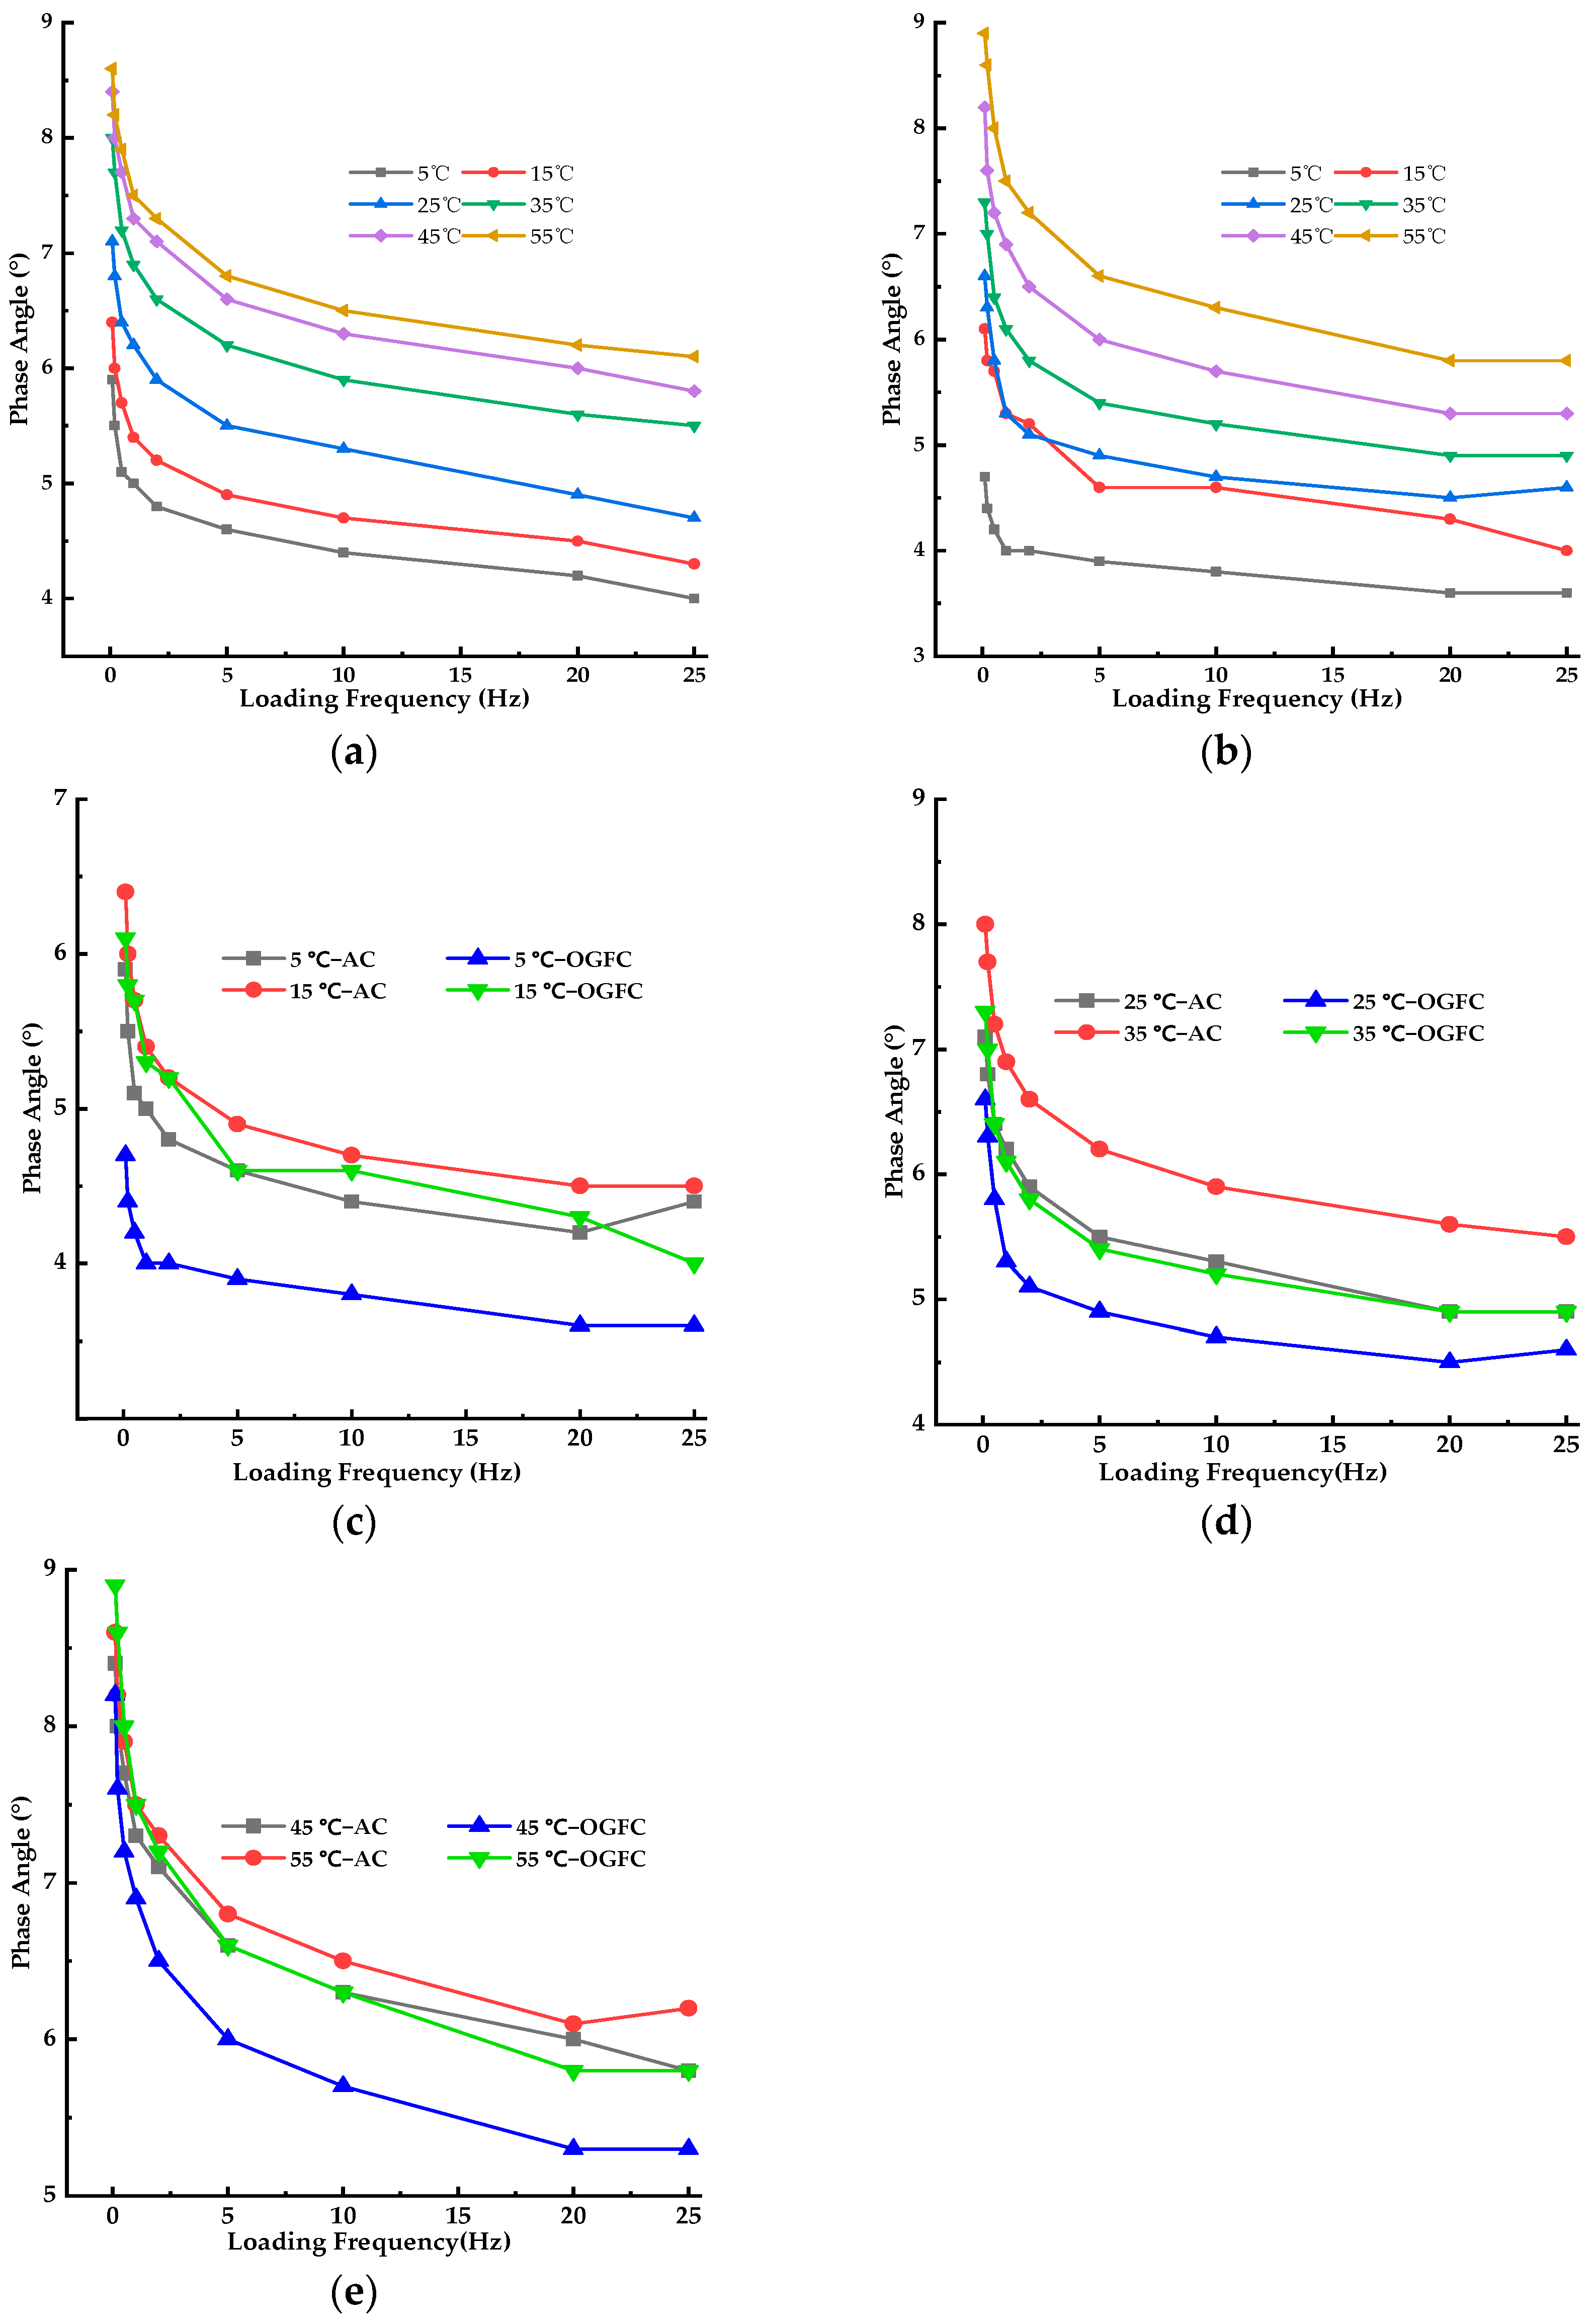
The phase angle results of PUM–OGFC and PUM–AC under different test temperatures and loading frequencies were plotted separately in Figure 3a,b, and the phase angle results at the same test temperatures for PUM–OGFC and PUM–AC were shown together in Figure 3c–e.
Figure 3.
Phase angle (δ) values for PUM–OGFC and PUM–AC. (a) δ of PUM–AC across various test temperatures; (b) δ of PUM–OGFC across various test temperatures; (c) comparison of δ of PUM–OGFC and PUM–AC at 5 °C and 15 °C; (d) comparison of δ of PUM–OGFC and PUM–AC at 25 °C and 35 °C; (e) comparison of δ of PUM–OGFC and PUM–AC at 45 °C and 55 °C.
3.2. Rutting Parameter (|E*|/sin(δ)) Results
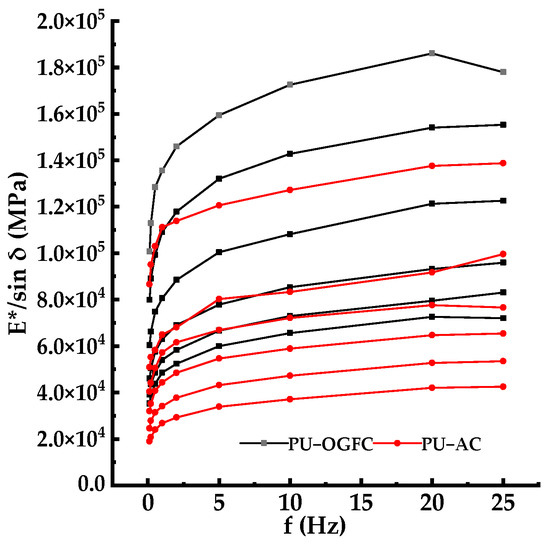
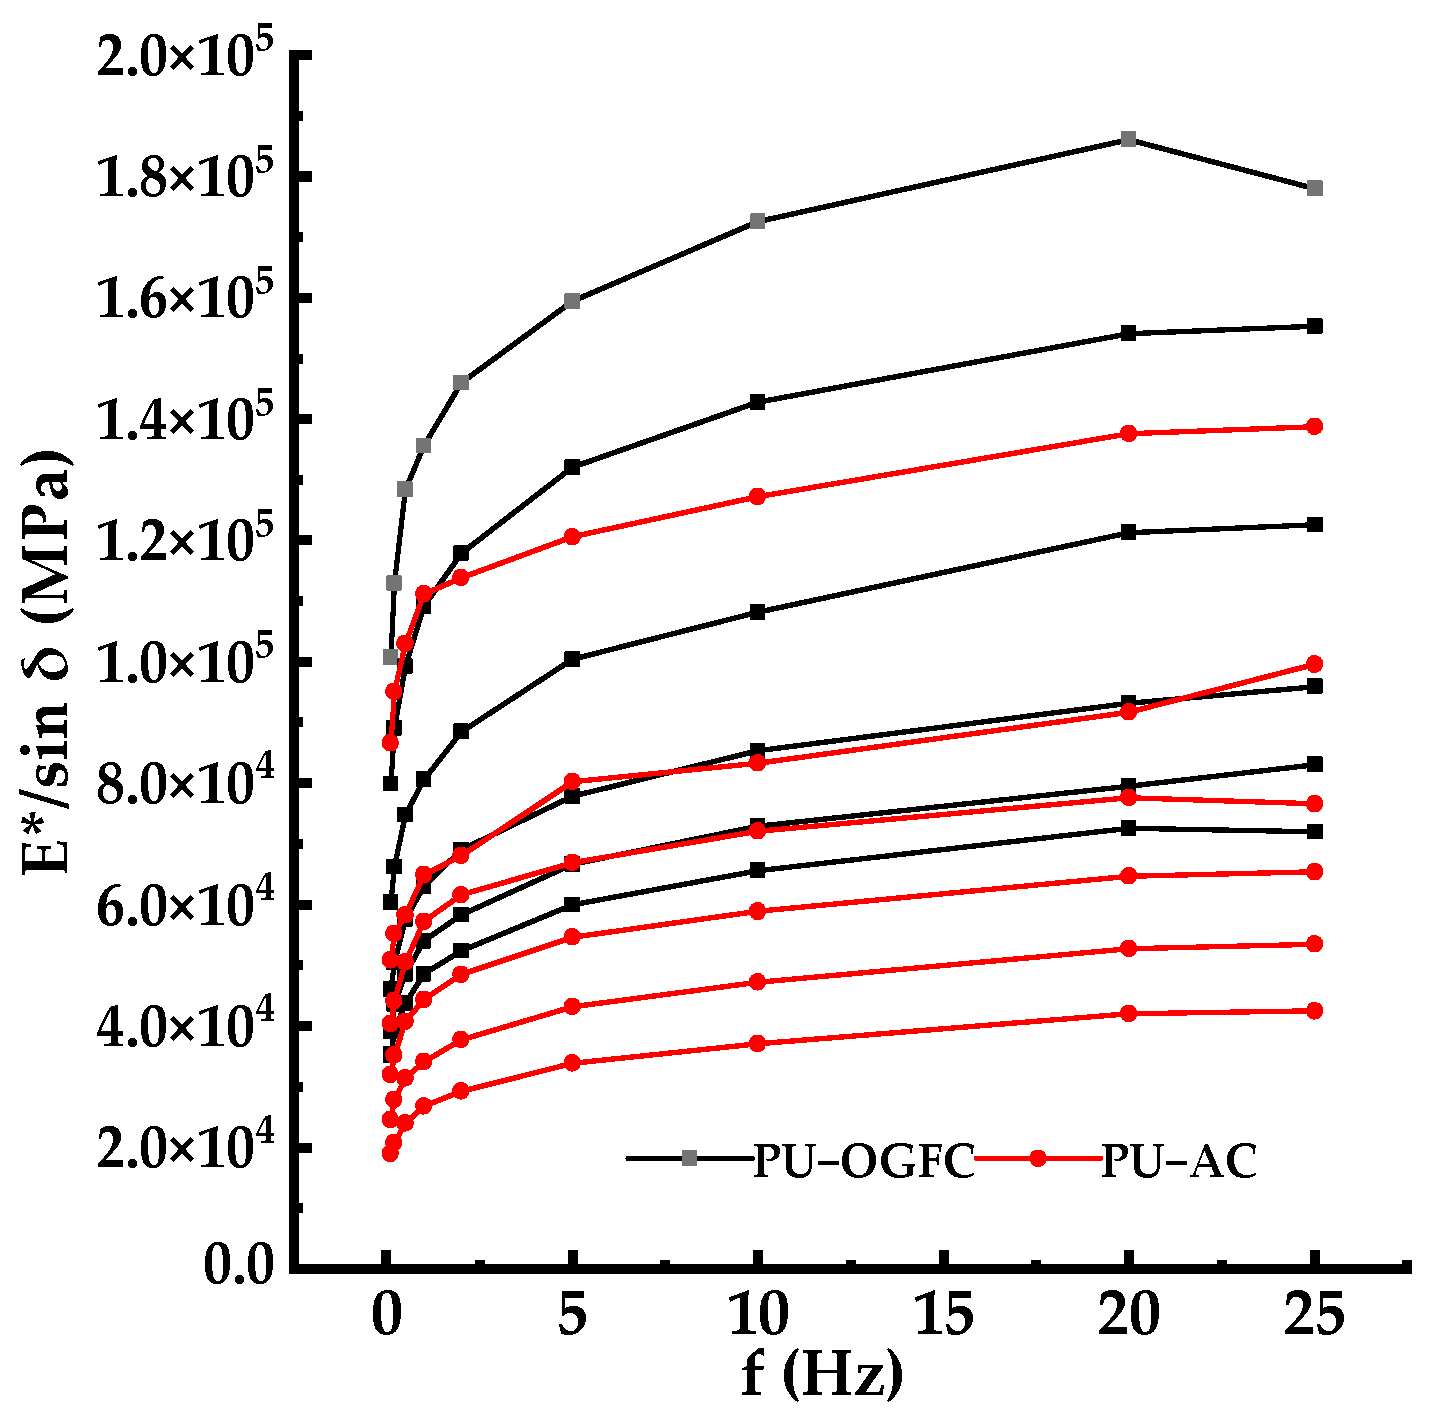
The parameter |E*|/sin(δ) represents the rutting resistance of asphalt mixtures, respectively. Values of rutting parameters for the PUM–OGFC and PUM–AC, obtained across various test temperatures and loading frequencies, are presented separately in Figure 4.
Figure 4.
Rutting parameters results for the PUM–OGFC and PUM–AC.
3.3. Black Space Diagram Results
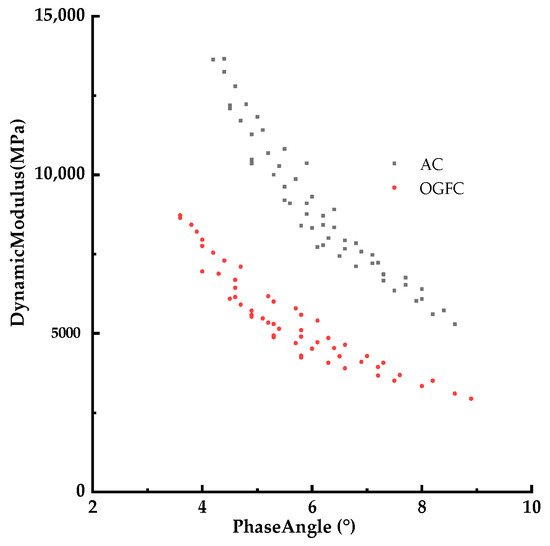
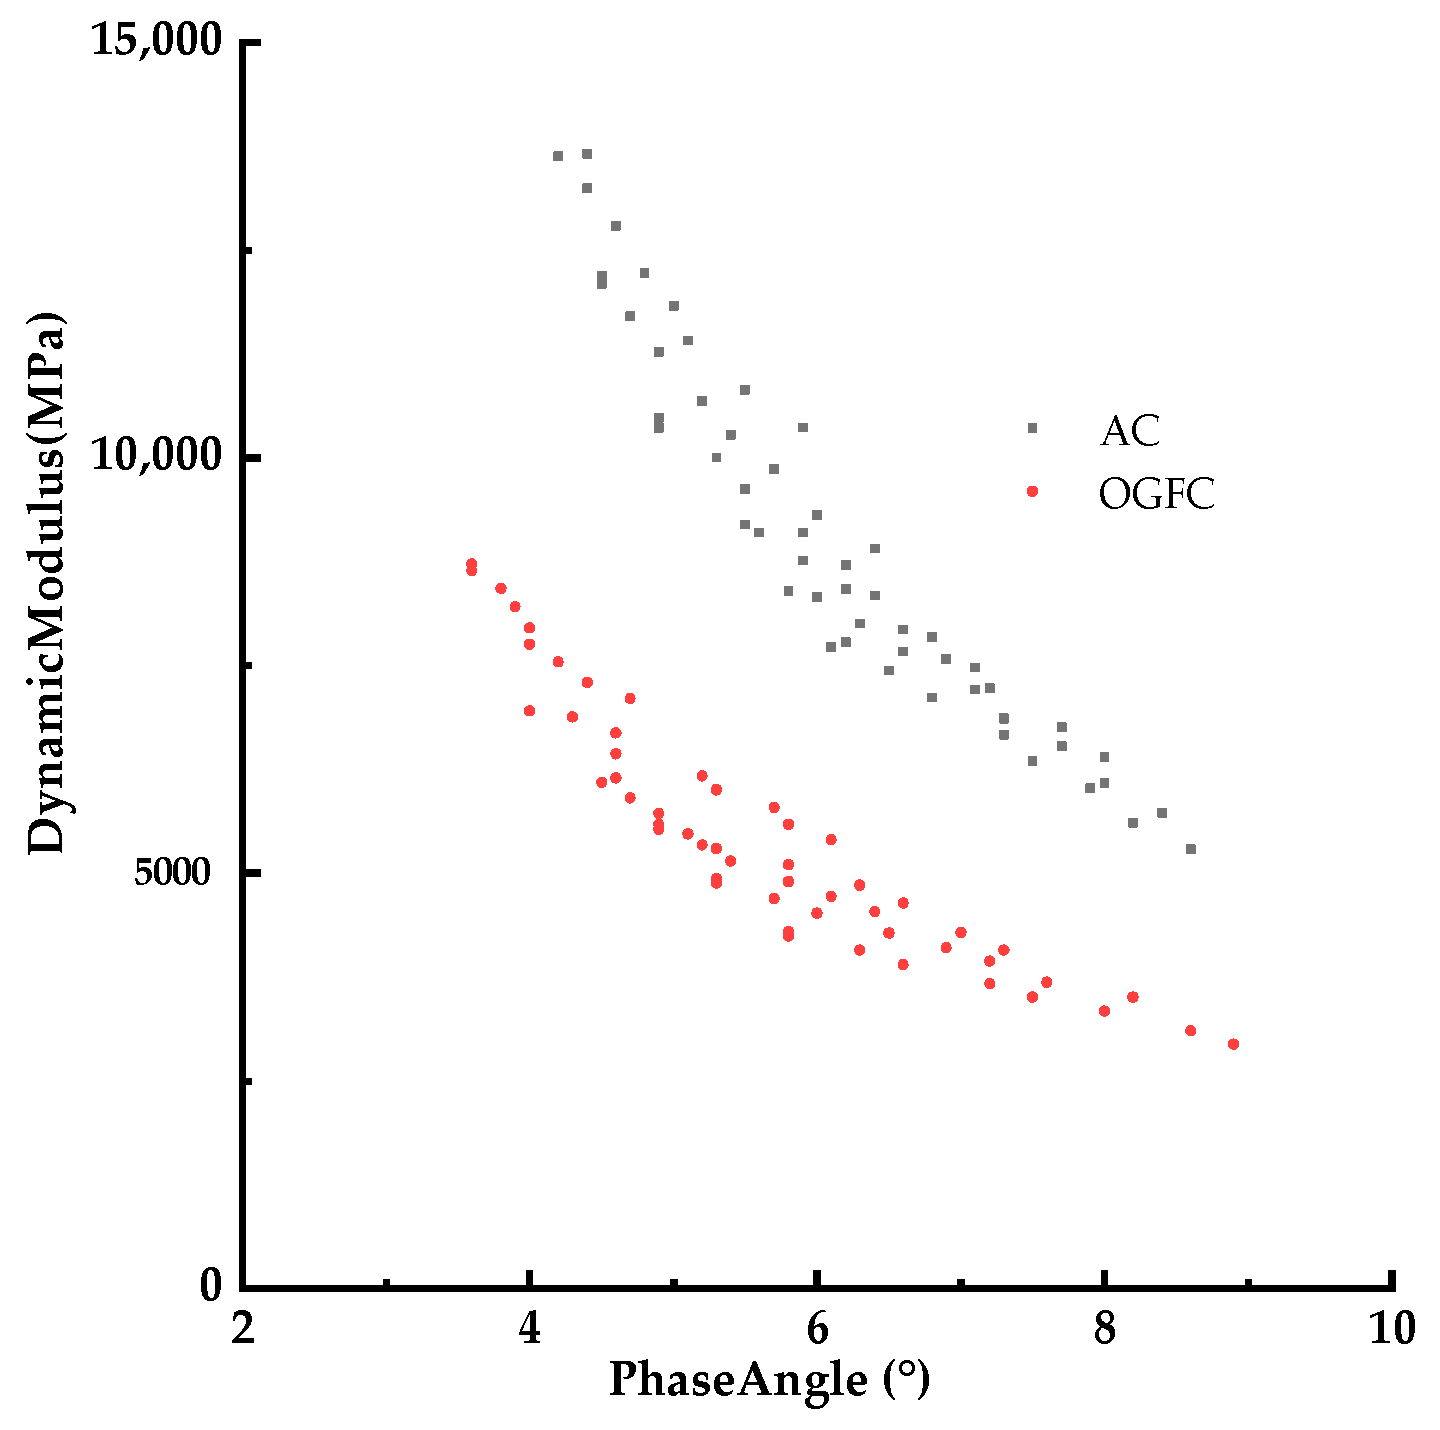
The black space diagrams for the PUM–OGFC and PUM–AC were plotted in Figure 5.
Figure 5.
The black space diagrams for the PUM–OGFC and PUM–AC.
3.4. Master Curves Model Results
3.4.1. Dynamic Modulus Master Curve
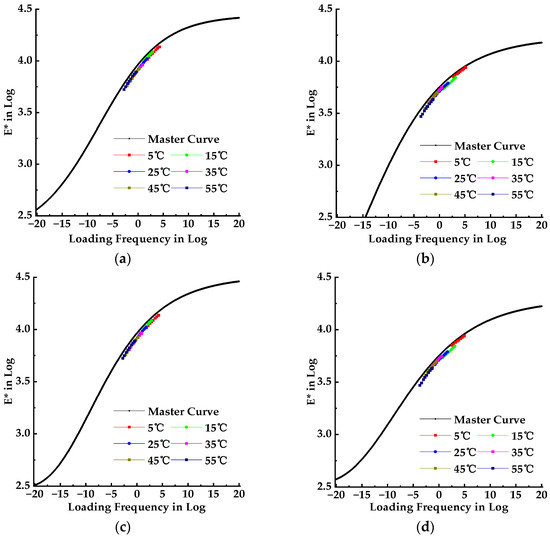
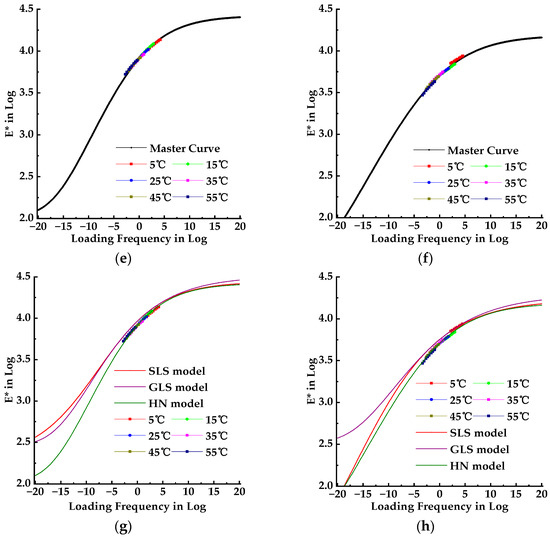
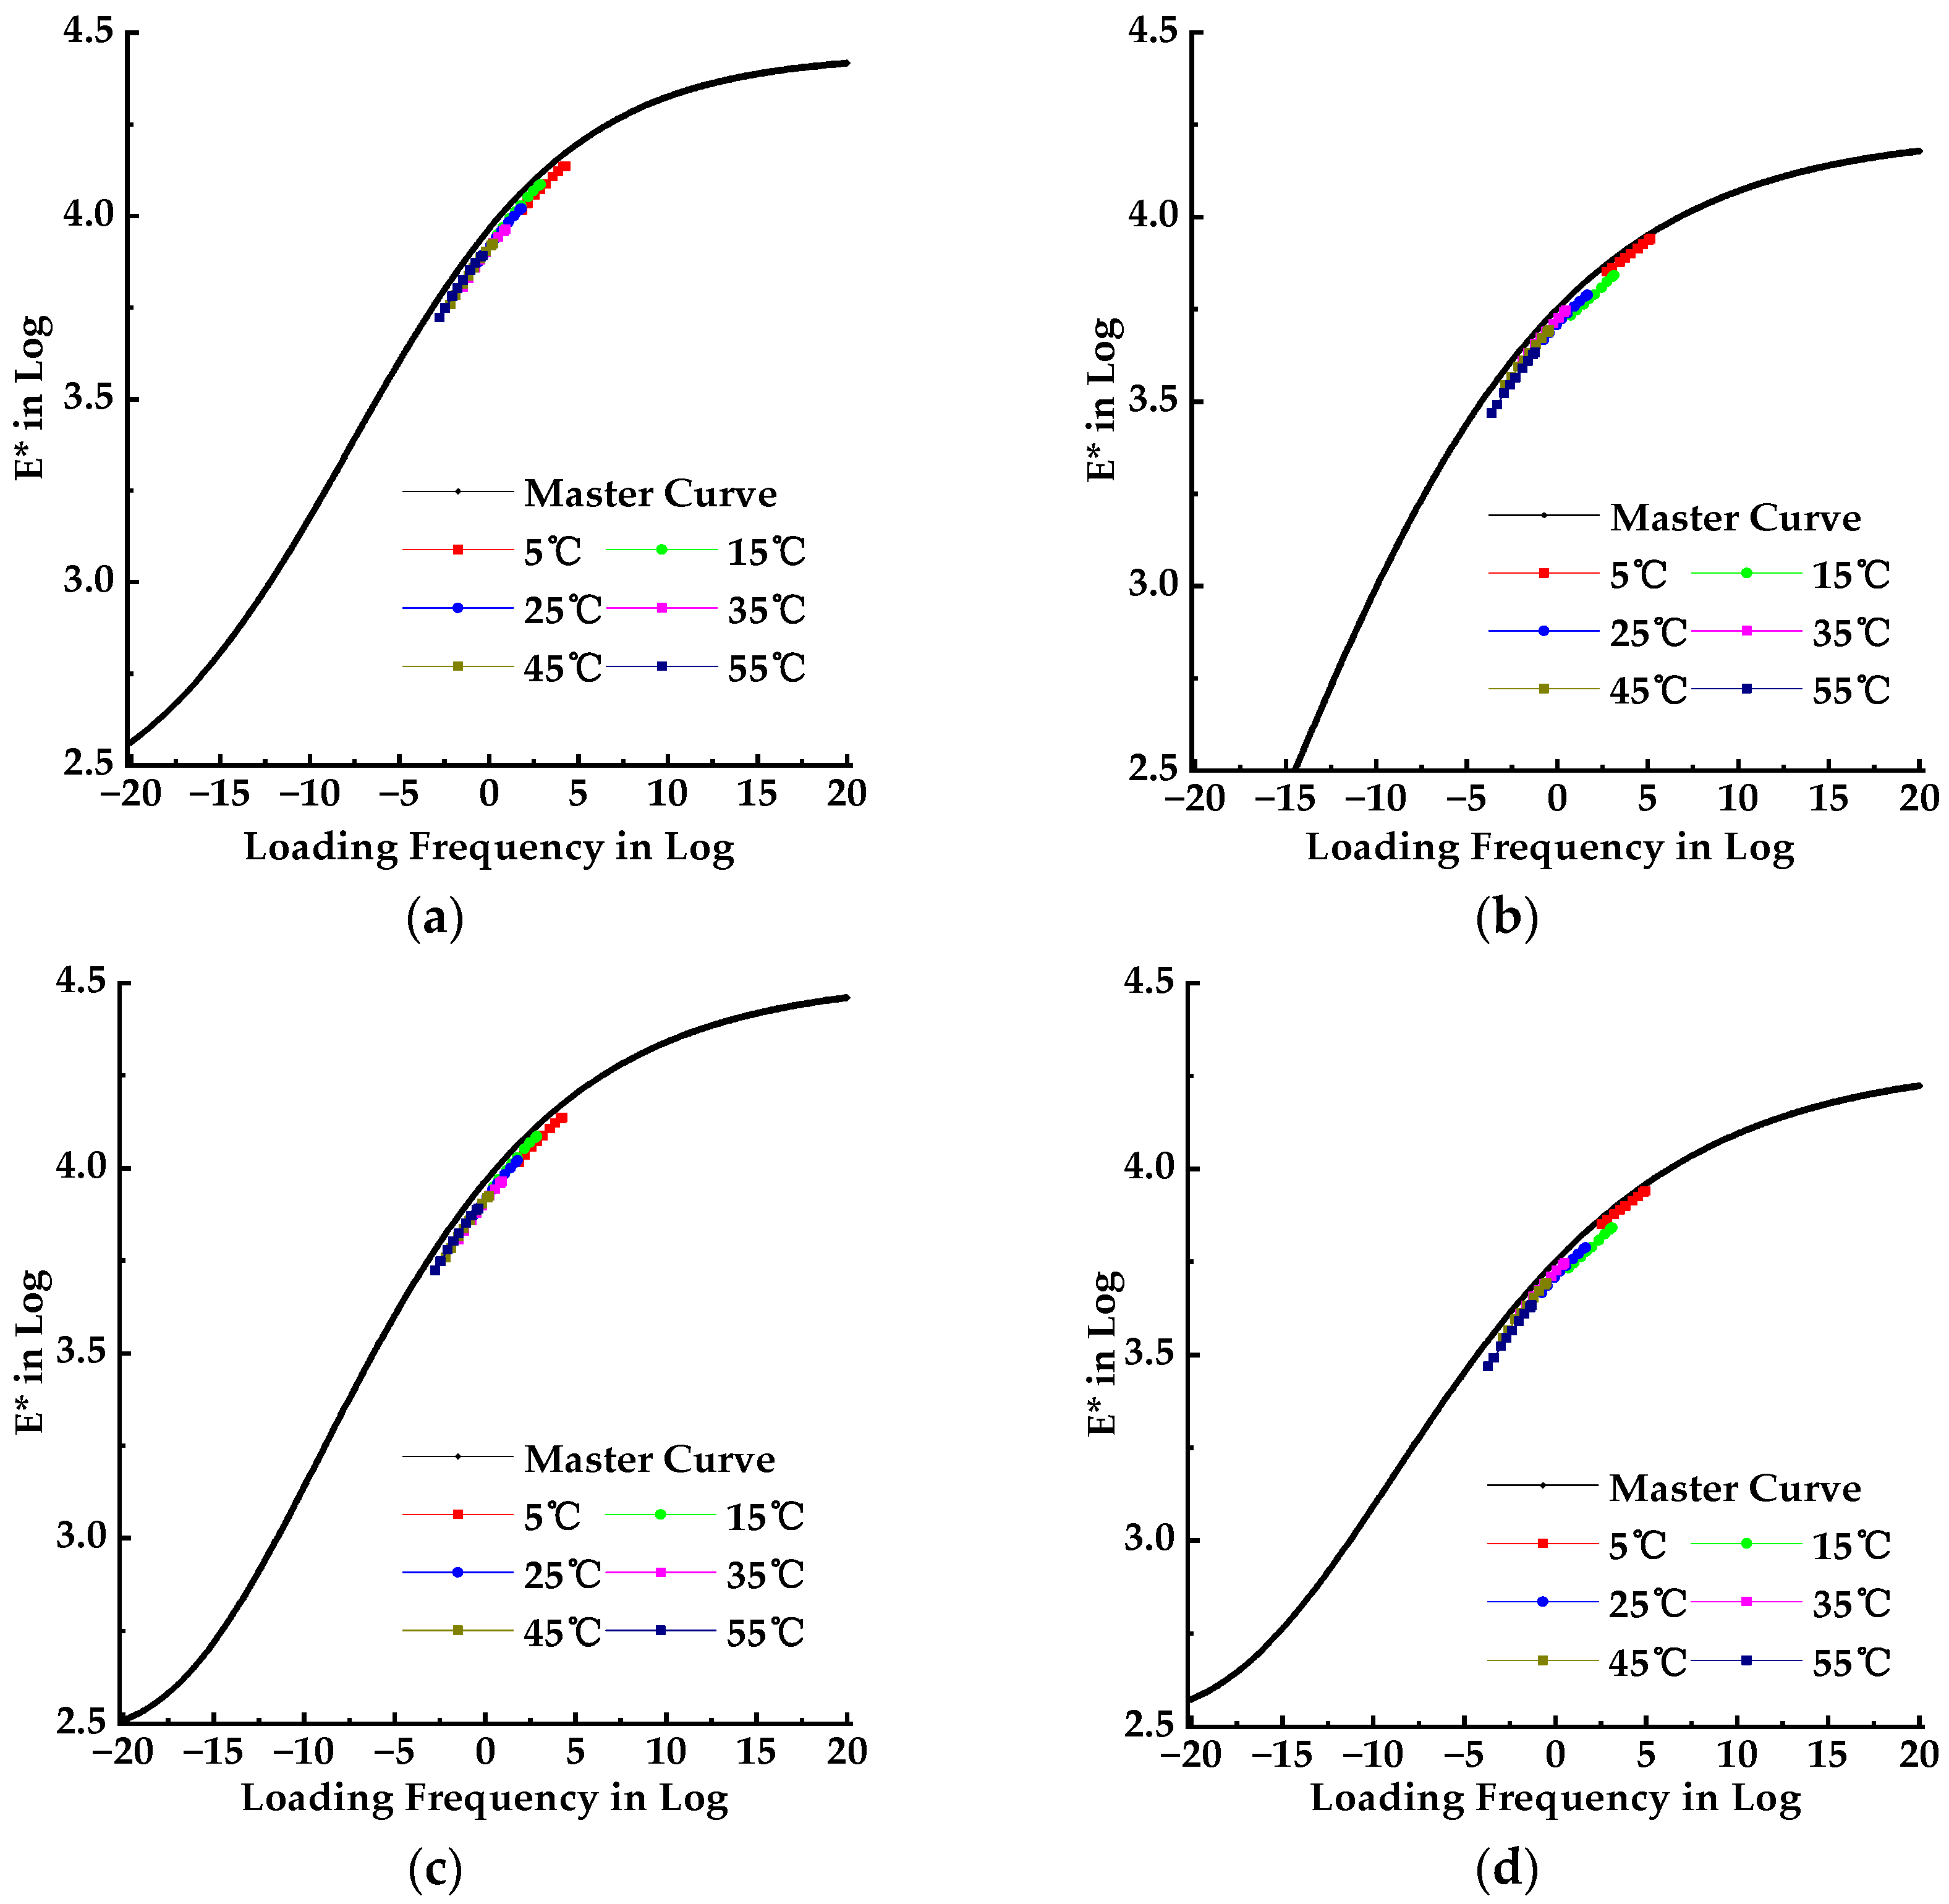
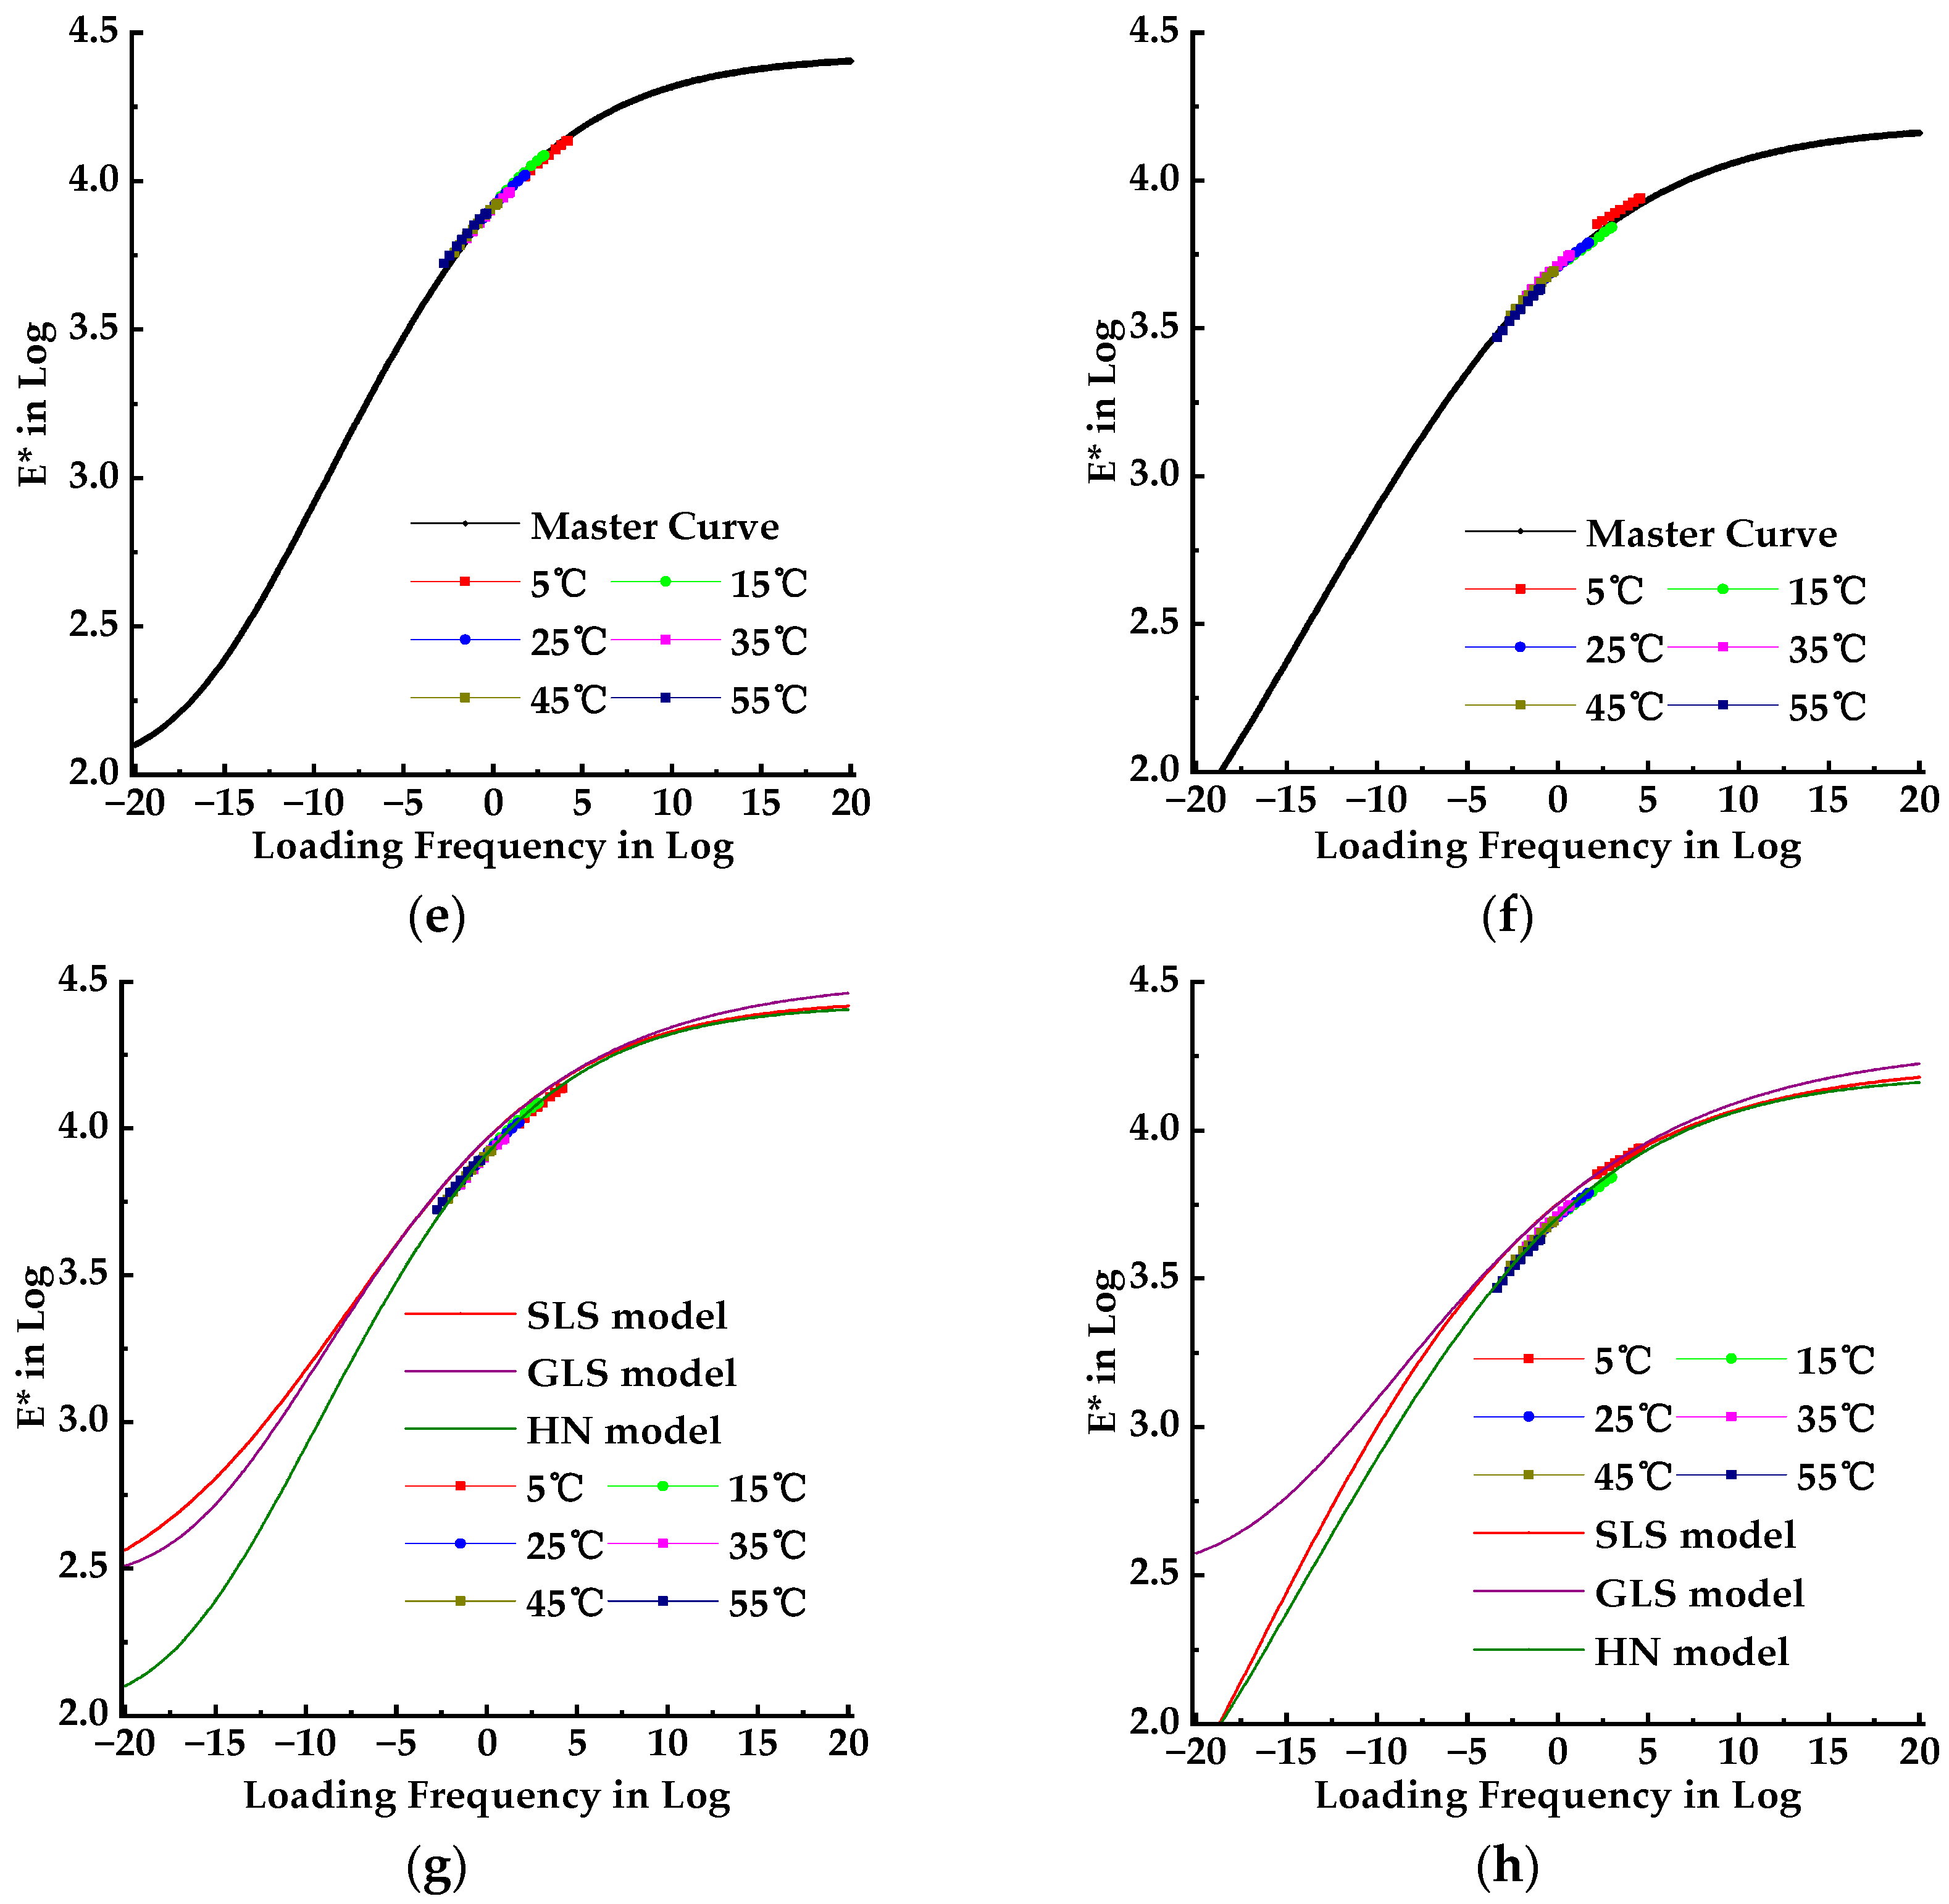
The master curves of the dynamic modulus |E*| for PUM–OGFC and PUM–AC, constructed using SLS, GLS, and HN models with shifted measured dynamic modulus data, are presented in Figure 6a–f, respectively. A comparison of the three master curves for each PU mixture is shown in Figure 6g,h.
Figure 6.
Master curves of dynamic modulus for PUM–OGFC and PUM–AC constructed using different models. (a) PUM–AC with SLS model; (b) PUM–OGFC with SLS model; (c) PUM–AC with GLS model; (d) PUM–OGFC with GLS model; (e) PUM–AC with HN model; (f) PUM–OGFC with HN model; (g) model comparison for PUM–AC; (h) model comparison for PUM–OGFC.
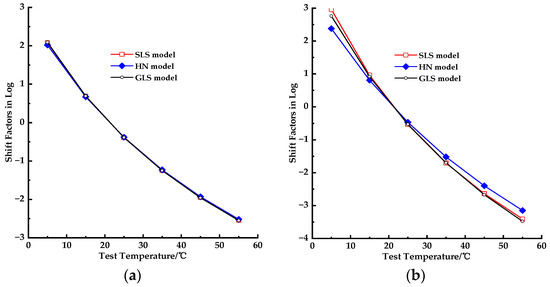
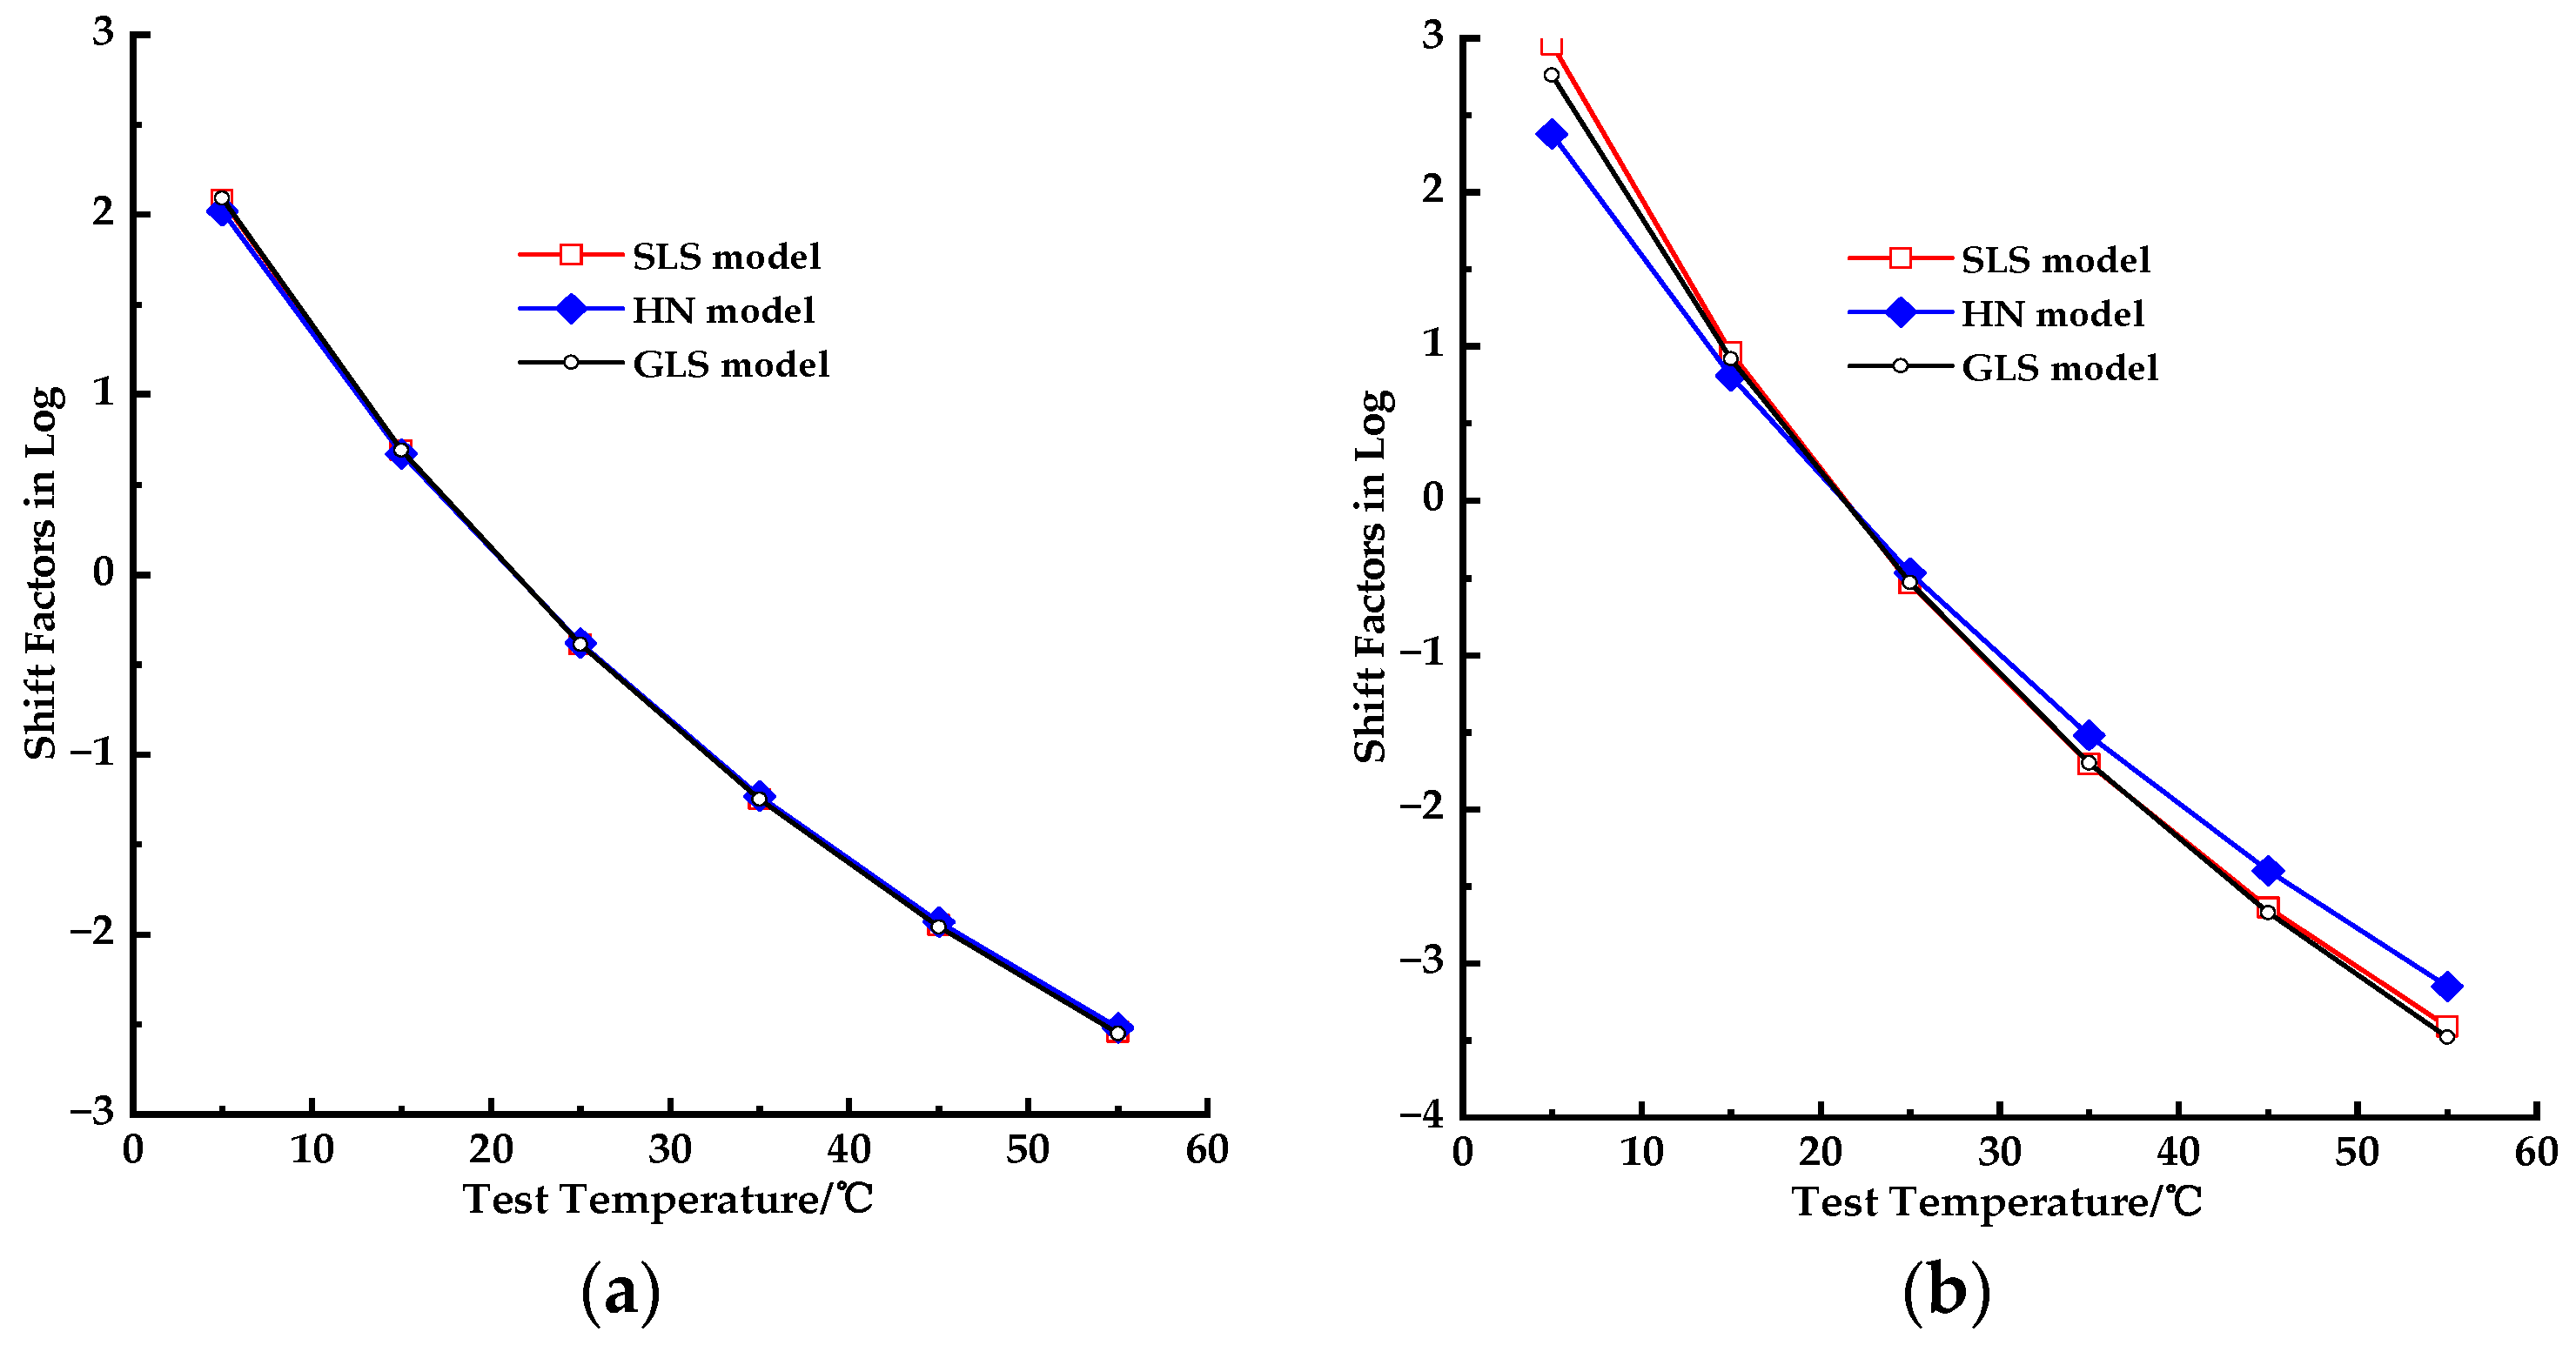
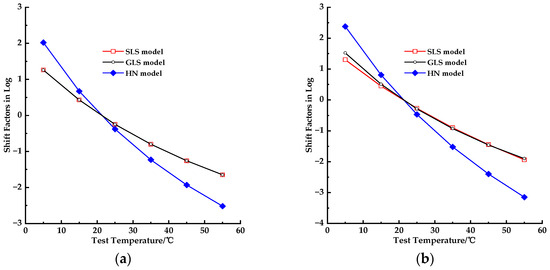
The shift factors used to generate the master curves for PUM–OGFC and PUM–AC are presented in Figure 7a,b, respectively.
Figure 7.
Shift factors for the dynamic modulus master curves of PUM–OGFC and PUM–AC. (a) PUM–AC; (b) PUM–OGFC.
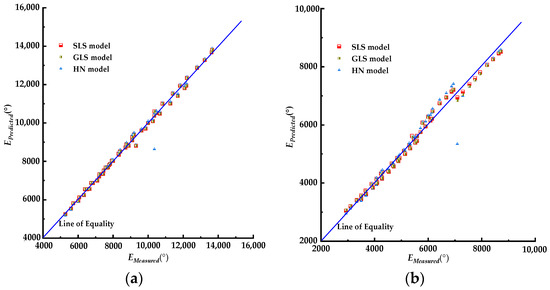
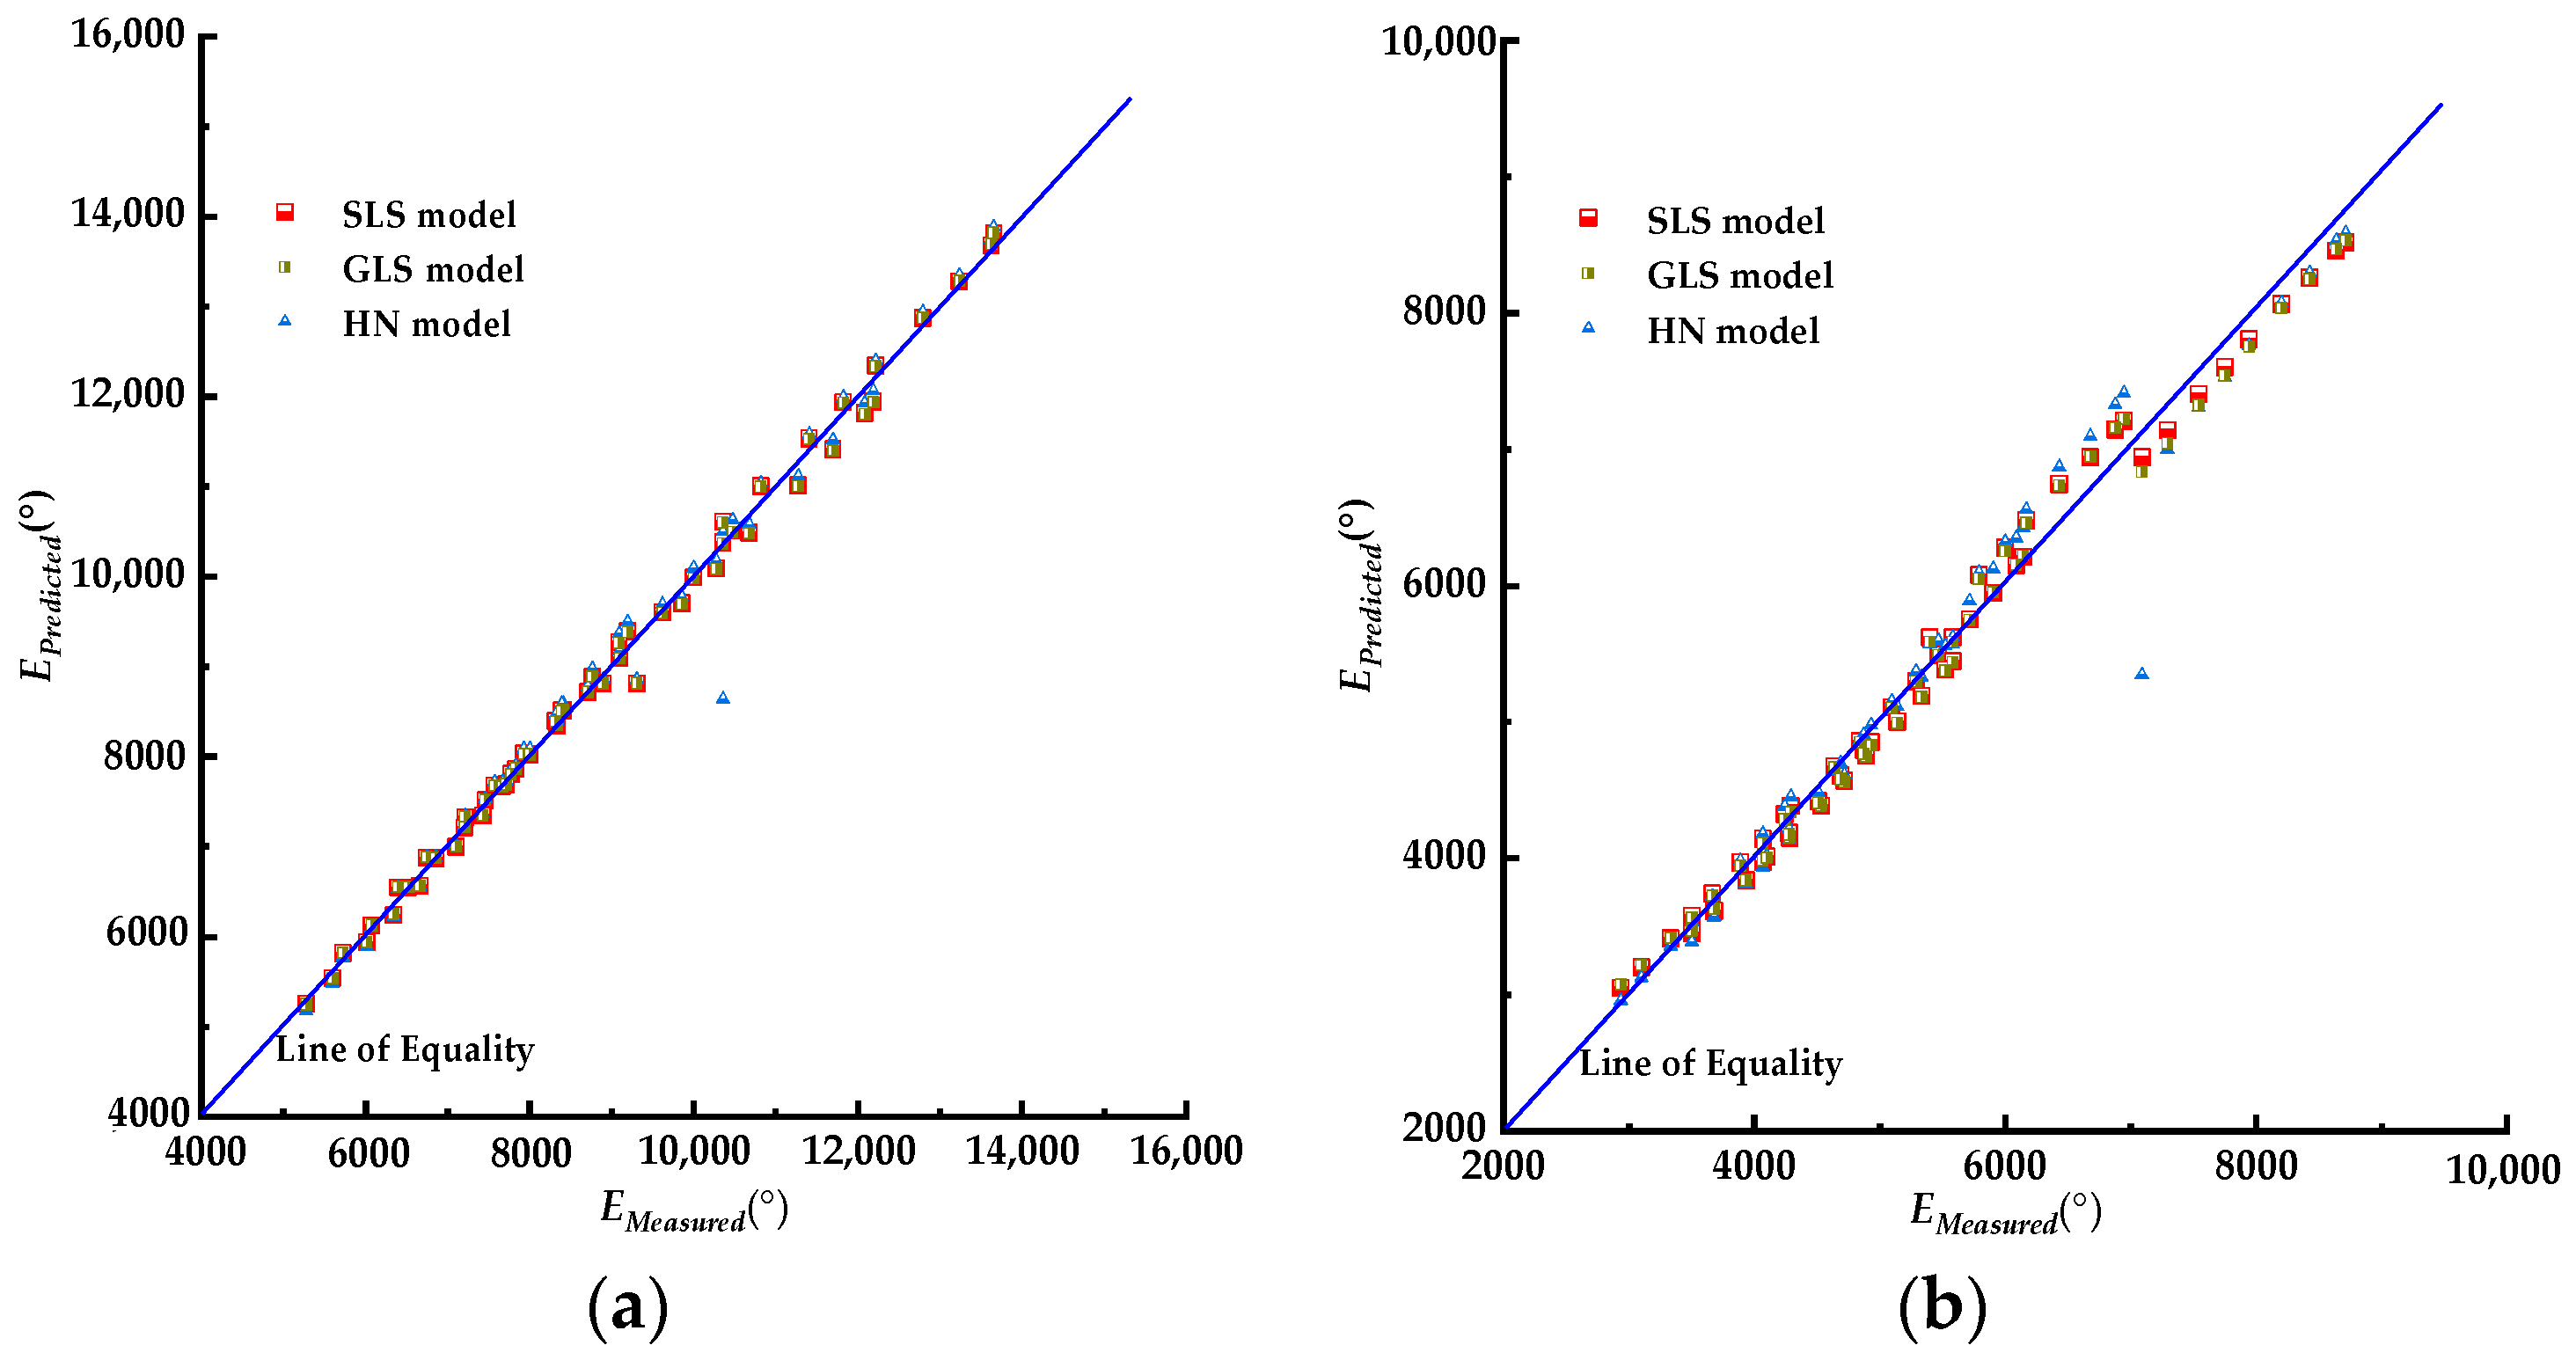
A comparison of the predicted and measured dynamic modulus |E*| data for PUM–OGFC and PUM–AC is presented in Figure 8a,b, respectively. The corresponding linear regression parameters are summarized in Table 1 and Table 2.
Figure 8.
Comparison of predicted and measured dynamic modulus |E*| for PUM–OGFC and PUM–AC. (a) PUM–AC; (b) PUM–OGFC.
Table 1.
Linear regression parameters between predicted and measured |E*| for PUM–AC.
Table 2.
Linear regression parameters between predicted and measured |E*| for PUM–OGFC.
3.4.2. Phase Angle Master Curve
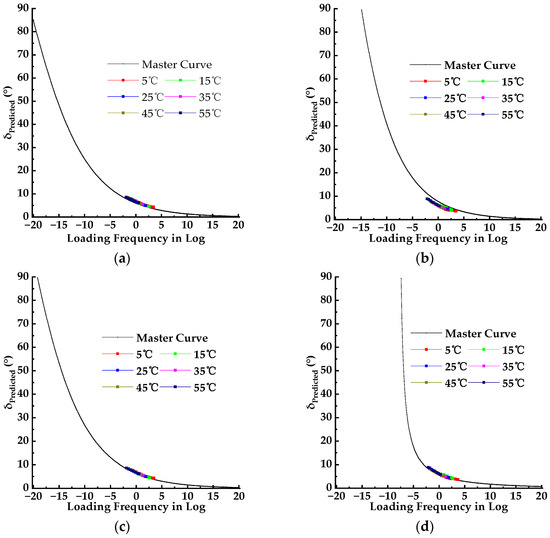
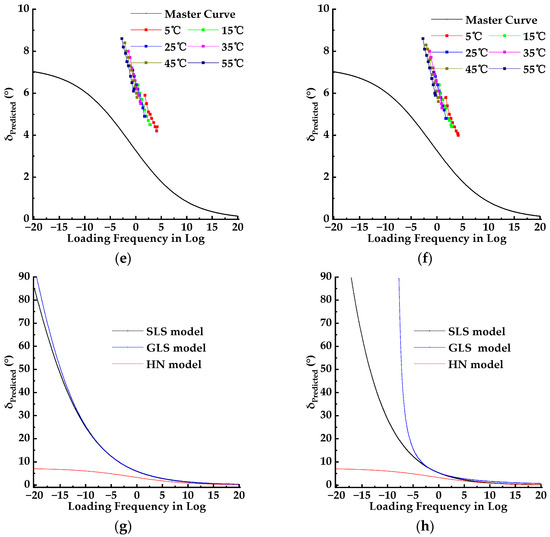
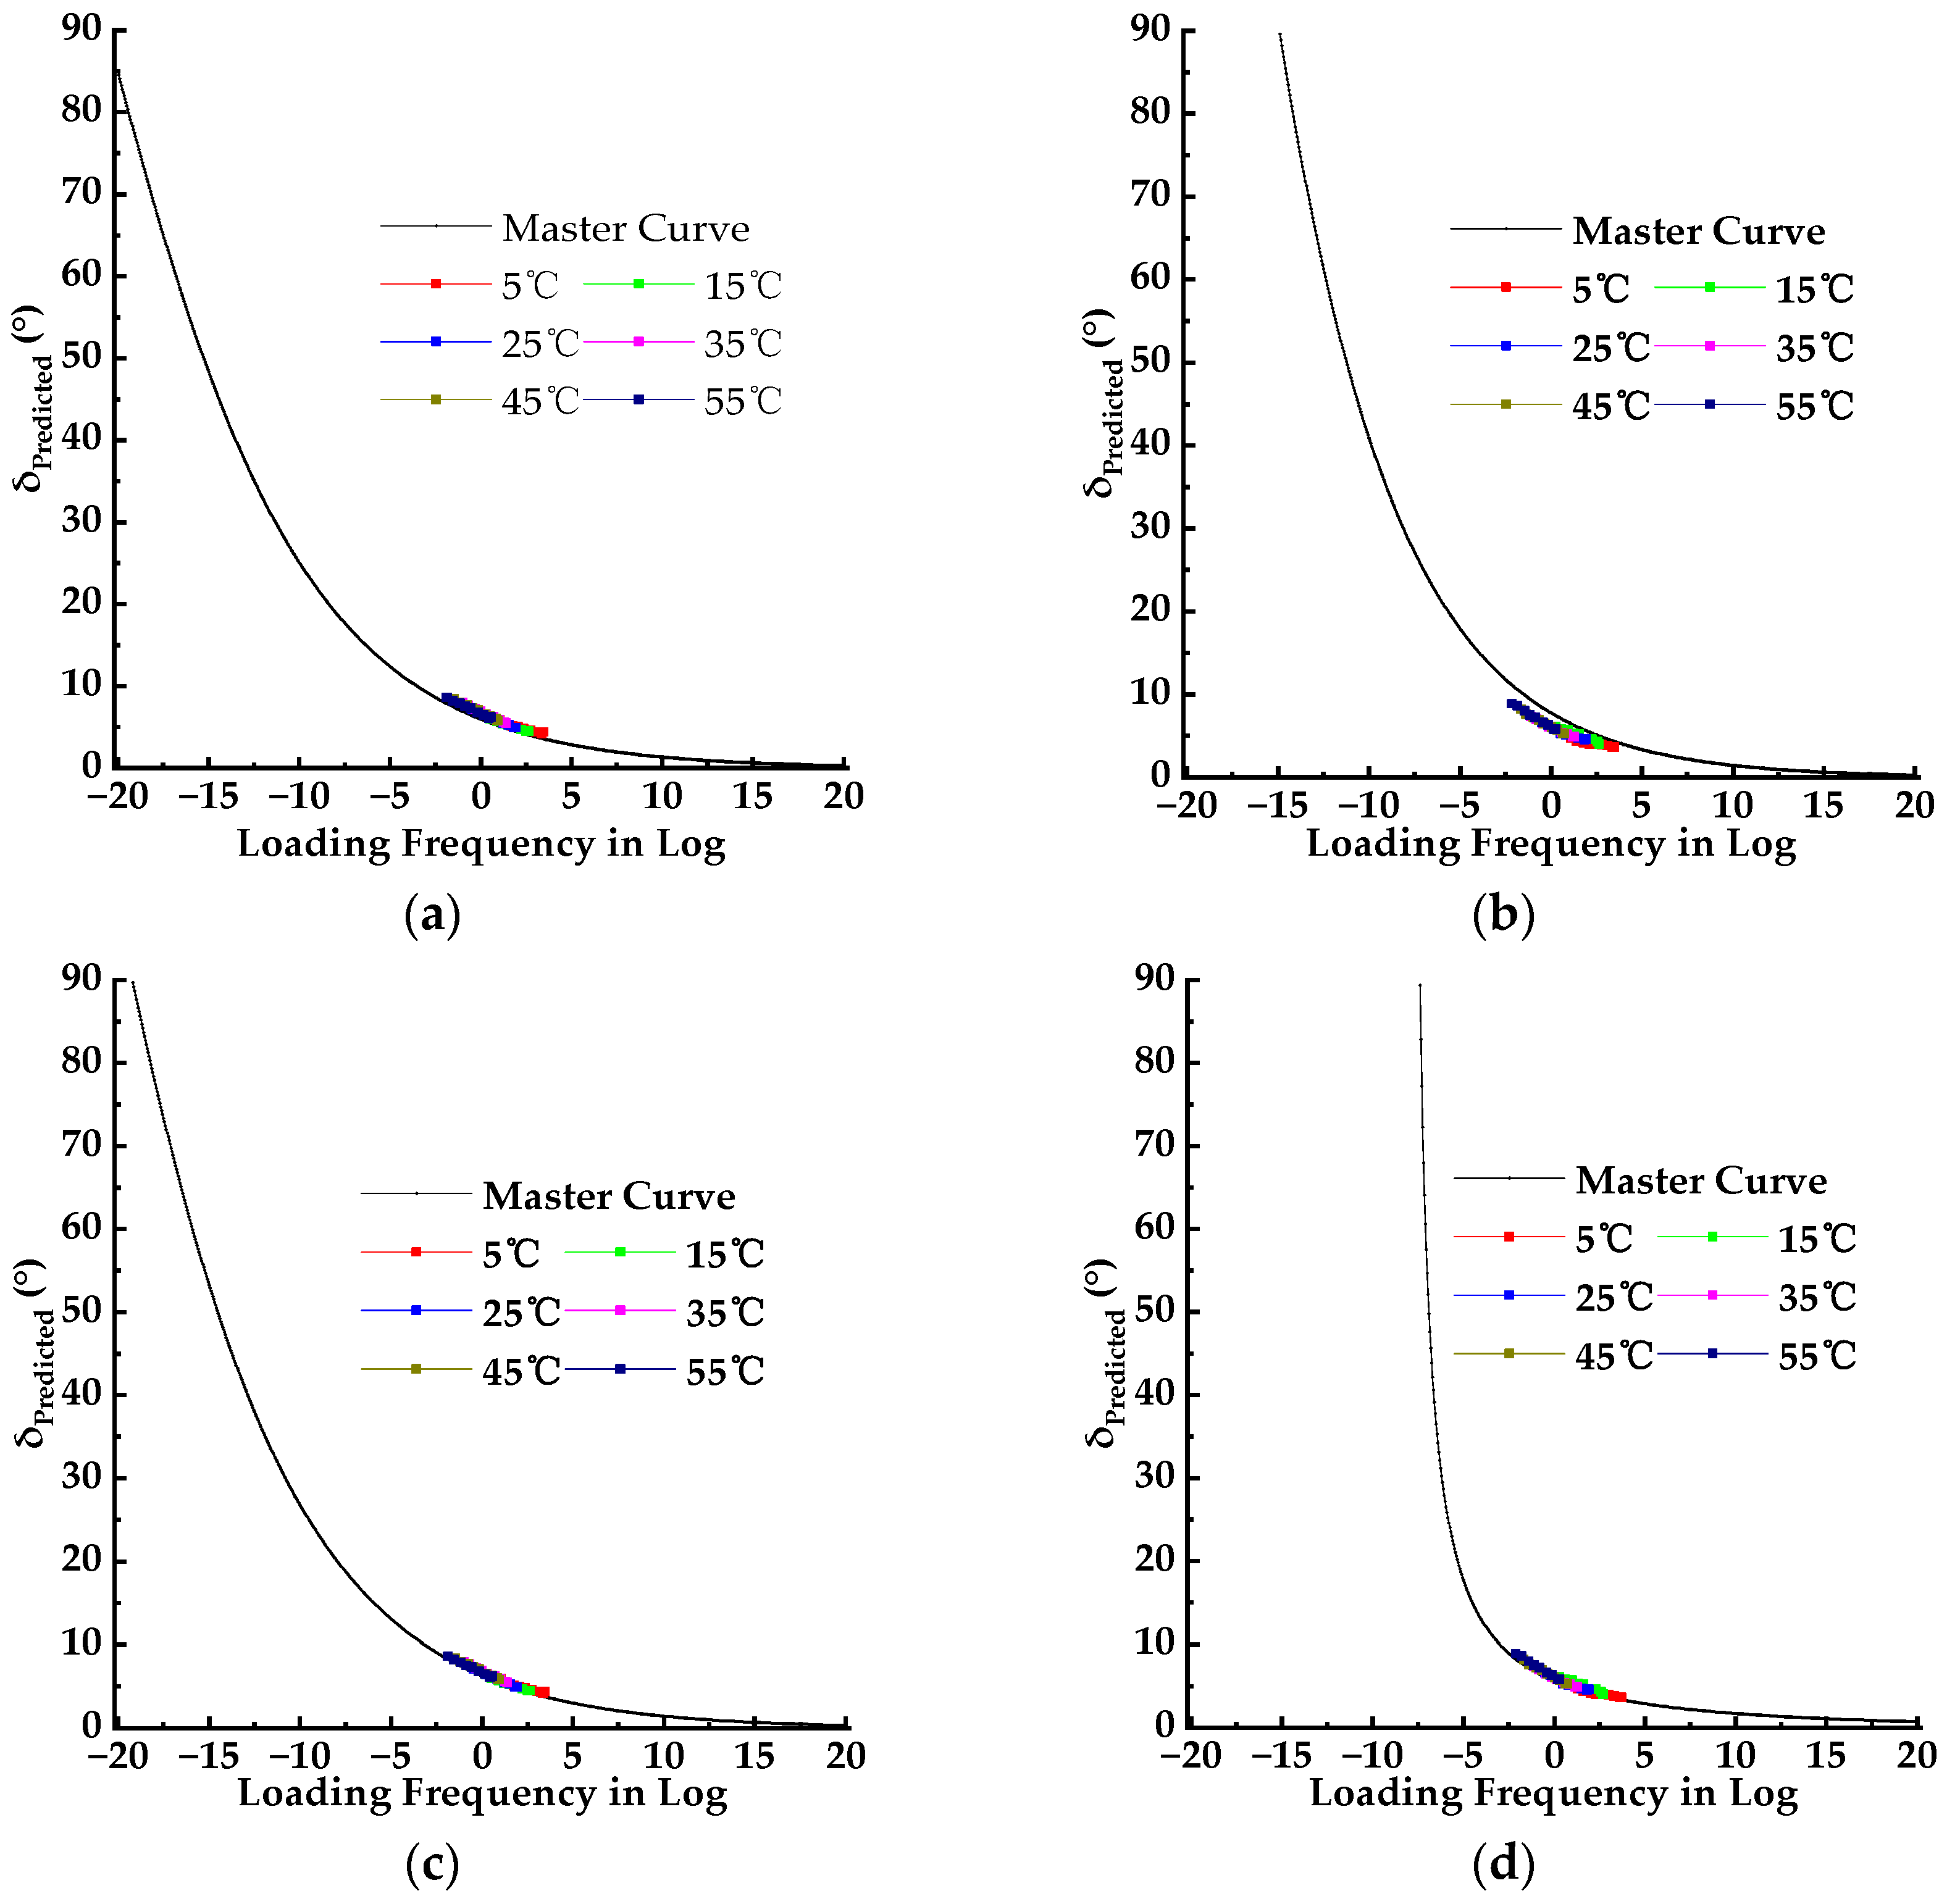
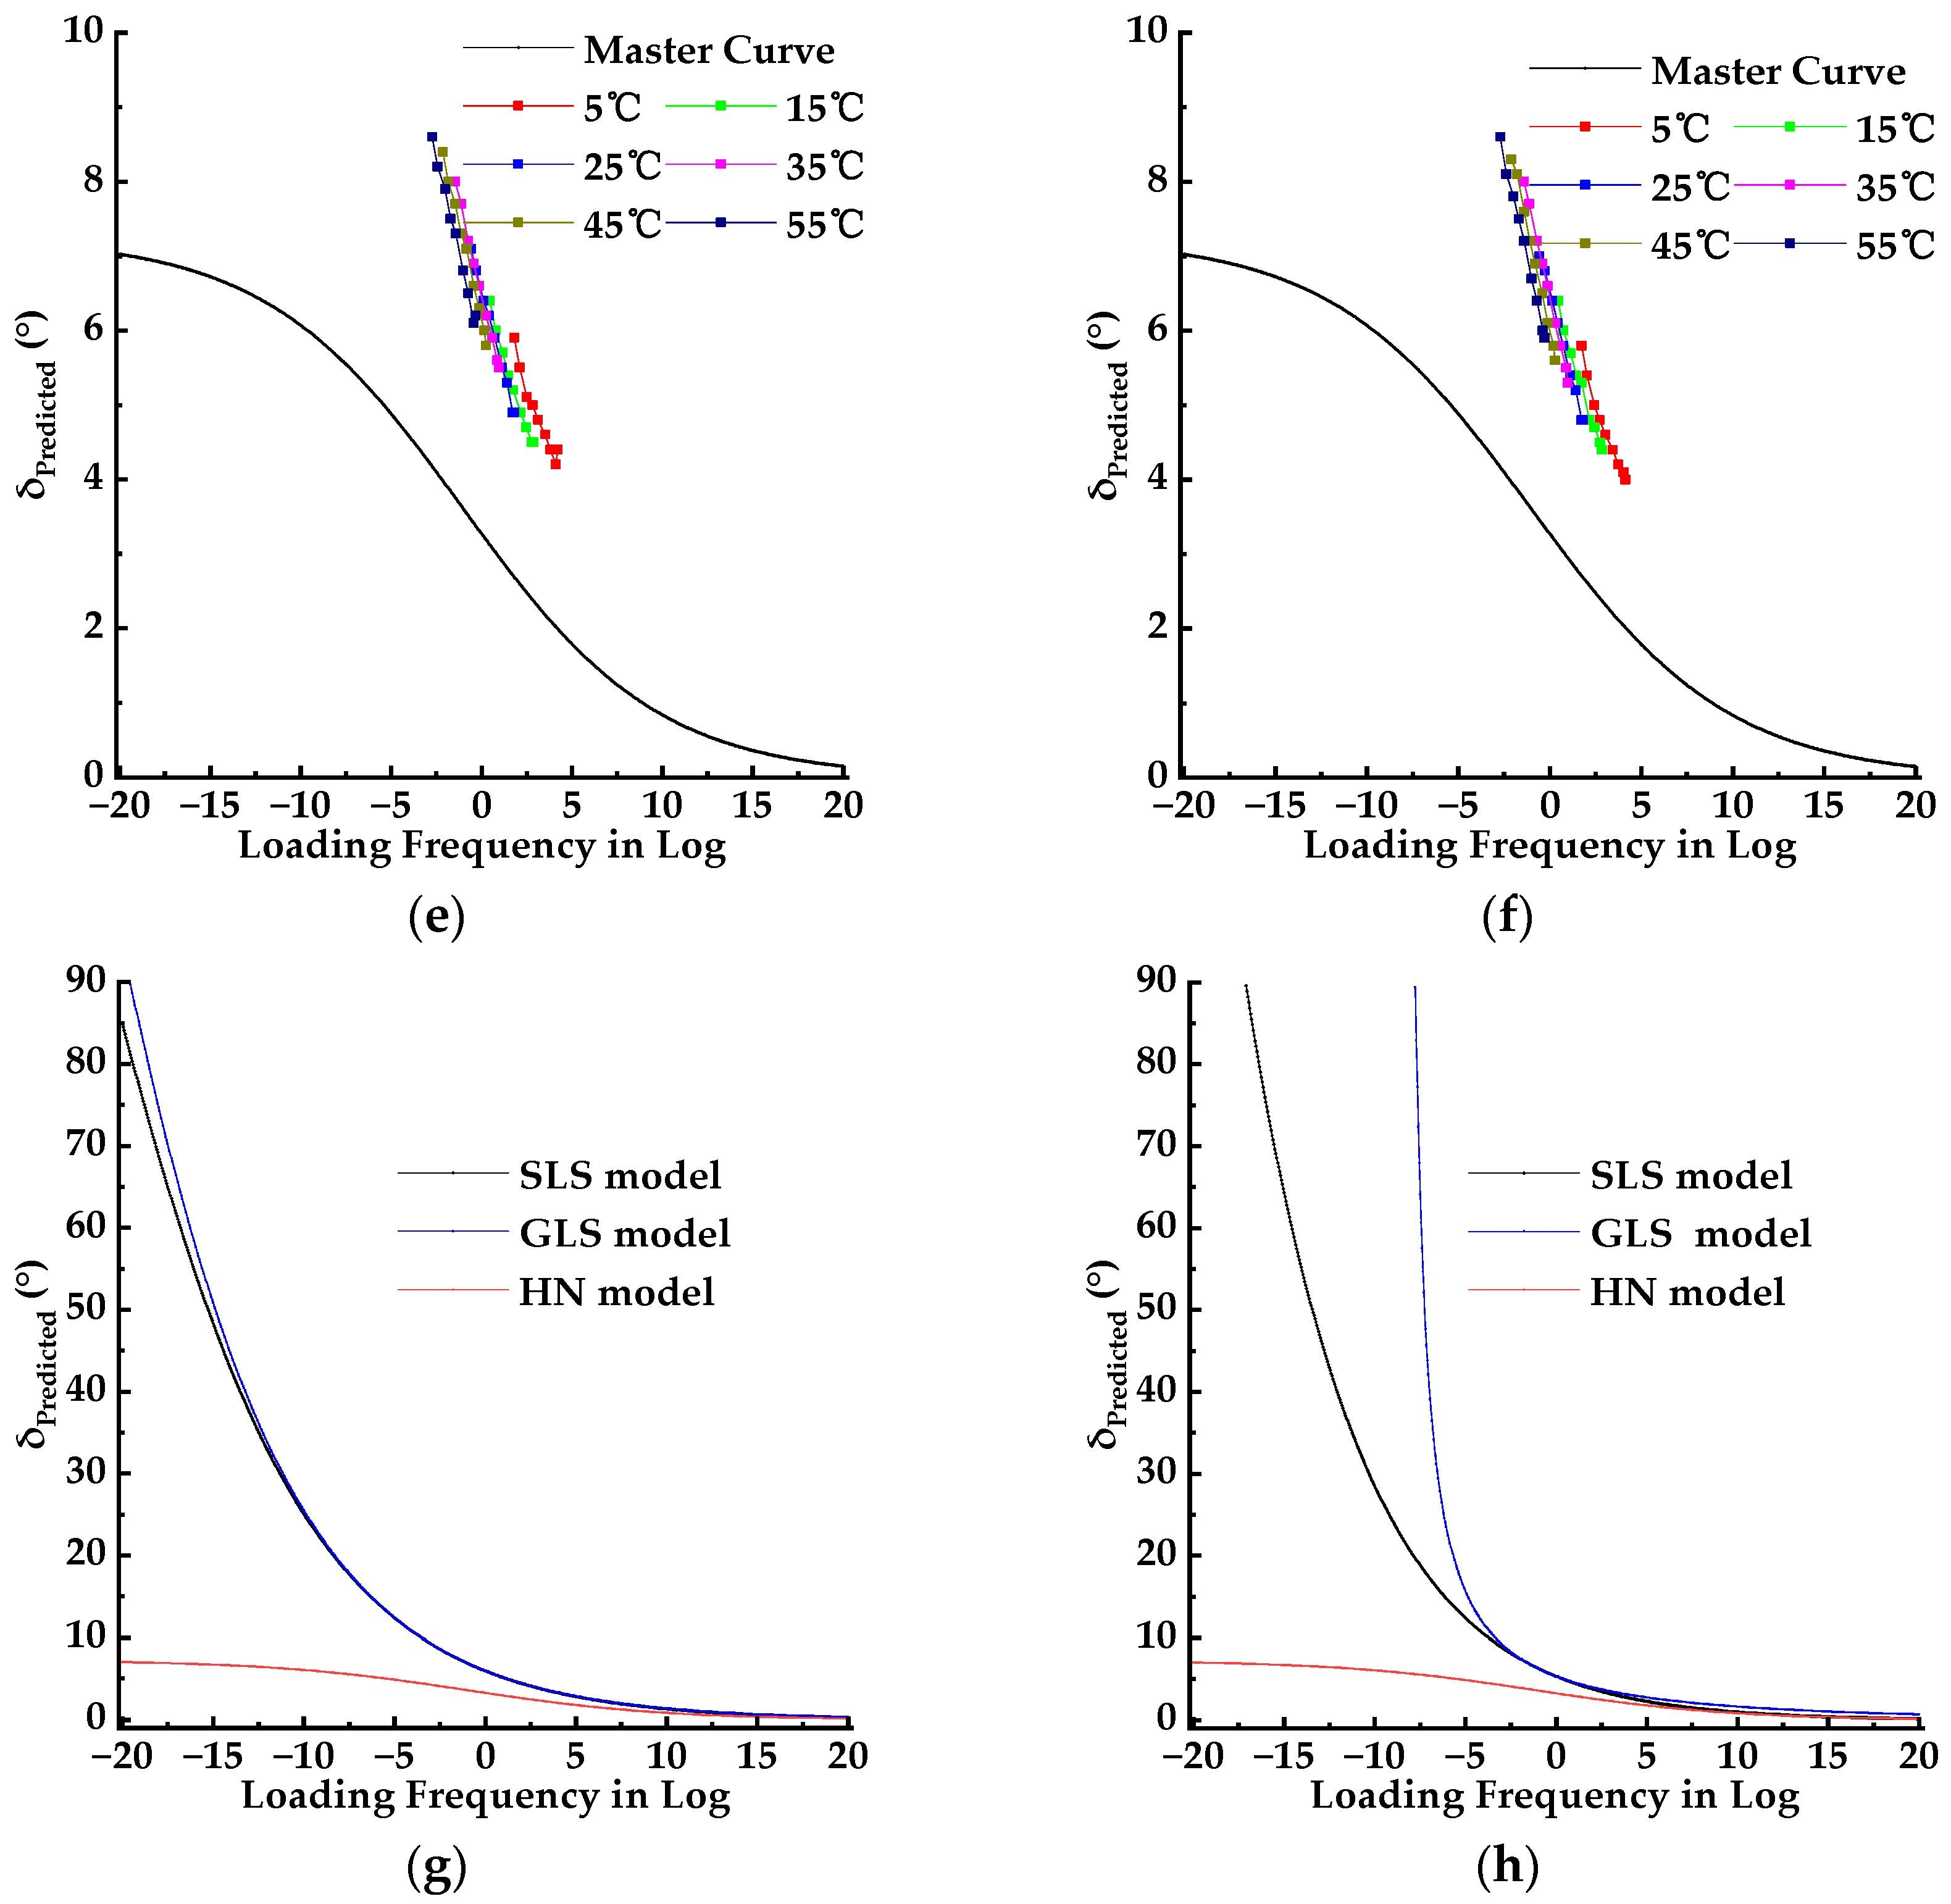
The phase angle (δ) master curves for PUM–OGFC and PUM–AC, constructed using SLS, GLS, and HN models, are presented in Figure 9a–f. A comparison of the three models for each PU mixture is shown in Figure 9g,h.
Figure 9.
Phase angle (δ) master curves for PUM–OGFC and PUM–AC, constructed using different models. (a) PUM–AC with the SLS model; (b) PUM–OGFC with the SLS model; (c) PUM–AC with the GLS model; (d) PUM–OGFC with the GLS model; (e) PUM–AC with the HN model; (f) PUM–OGFC with the HN model; (g) model comparison for PUM–AC; (h) model comparison for PUM–OGFC.
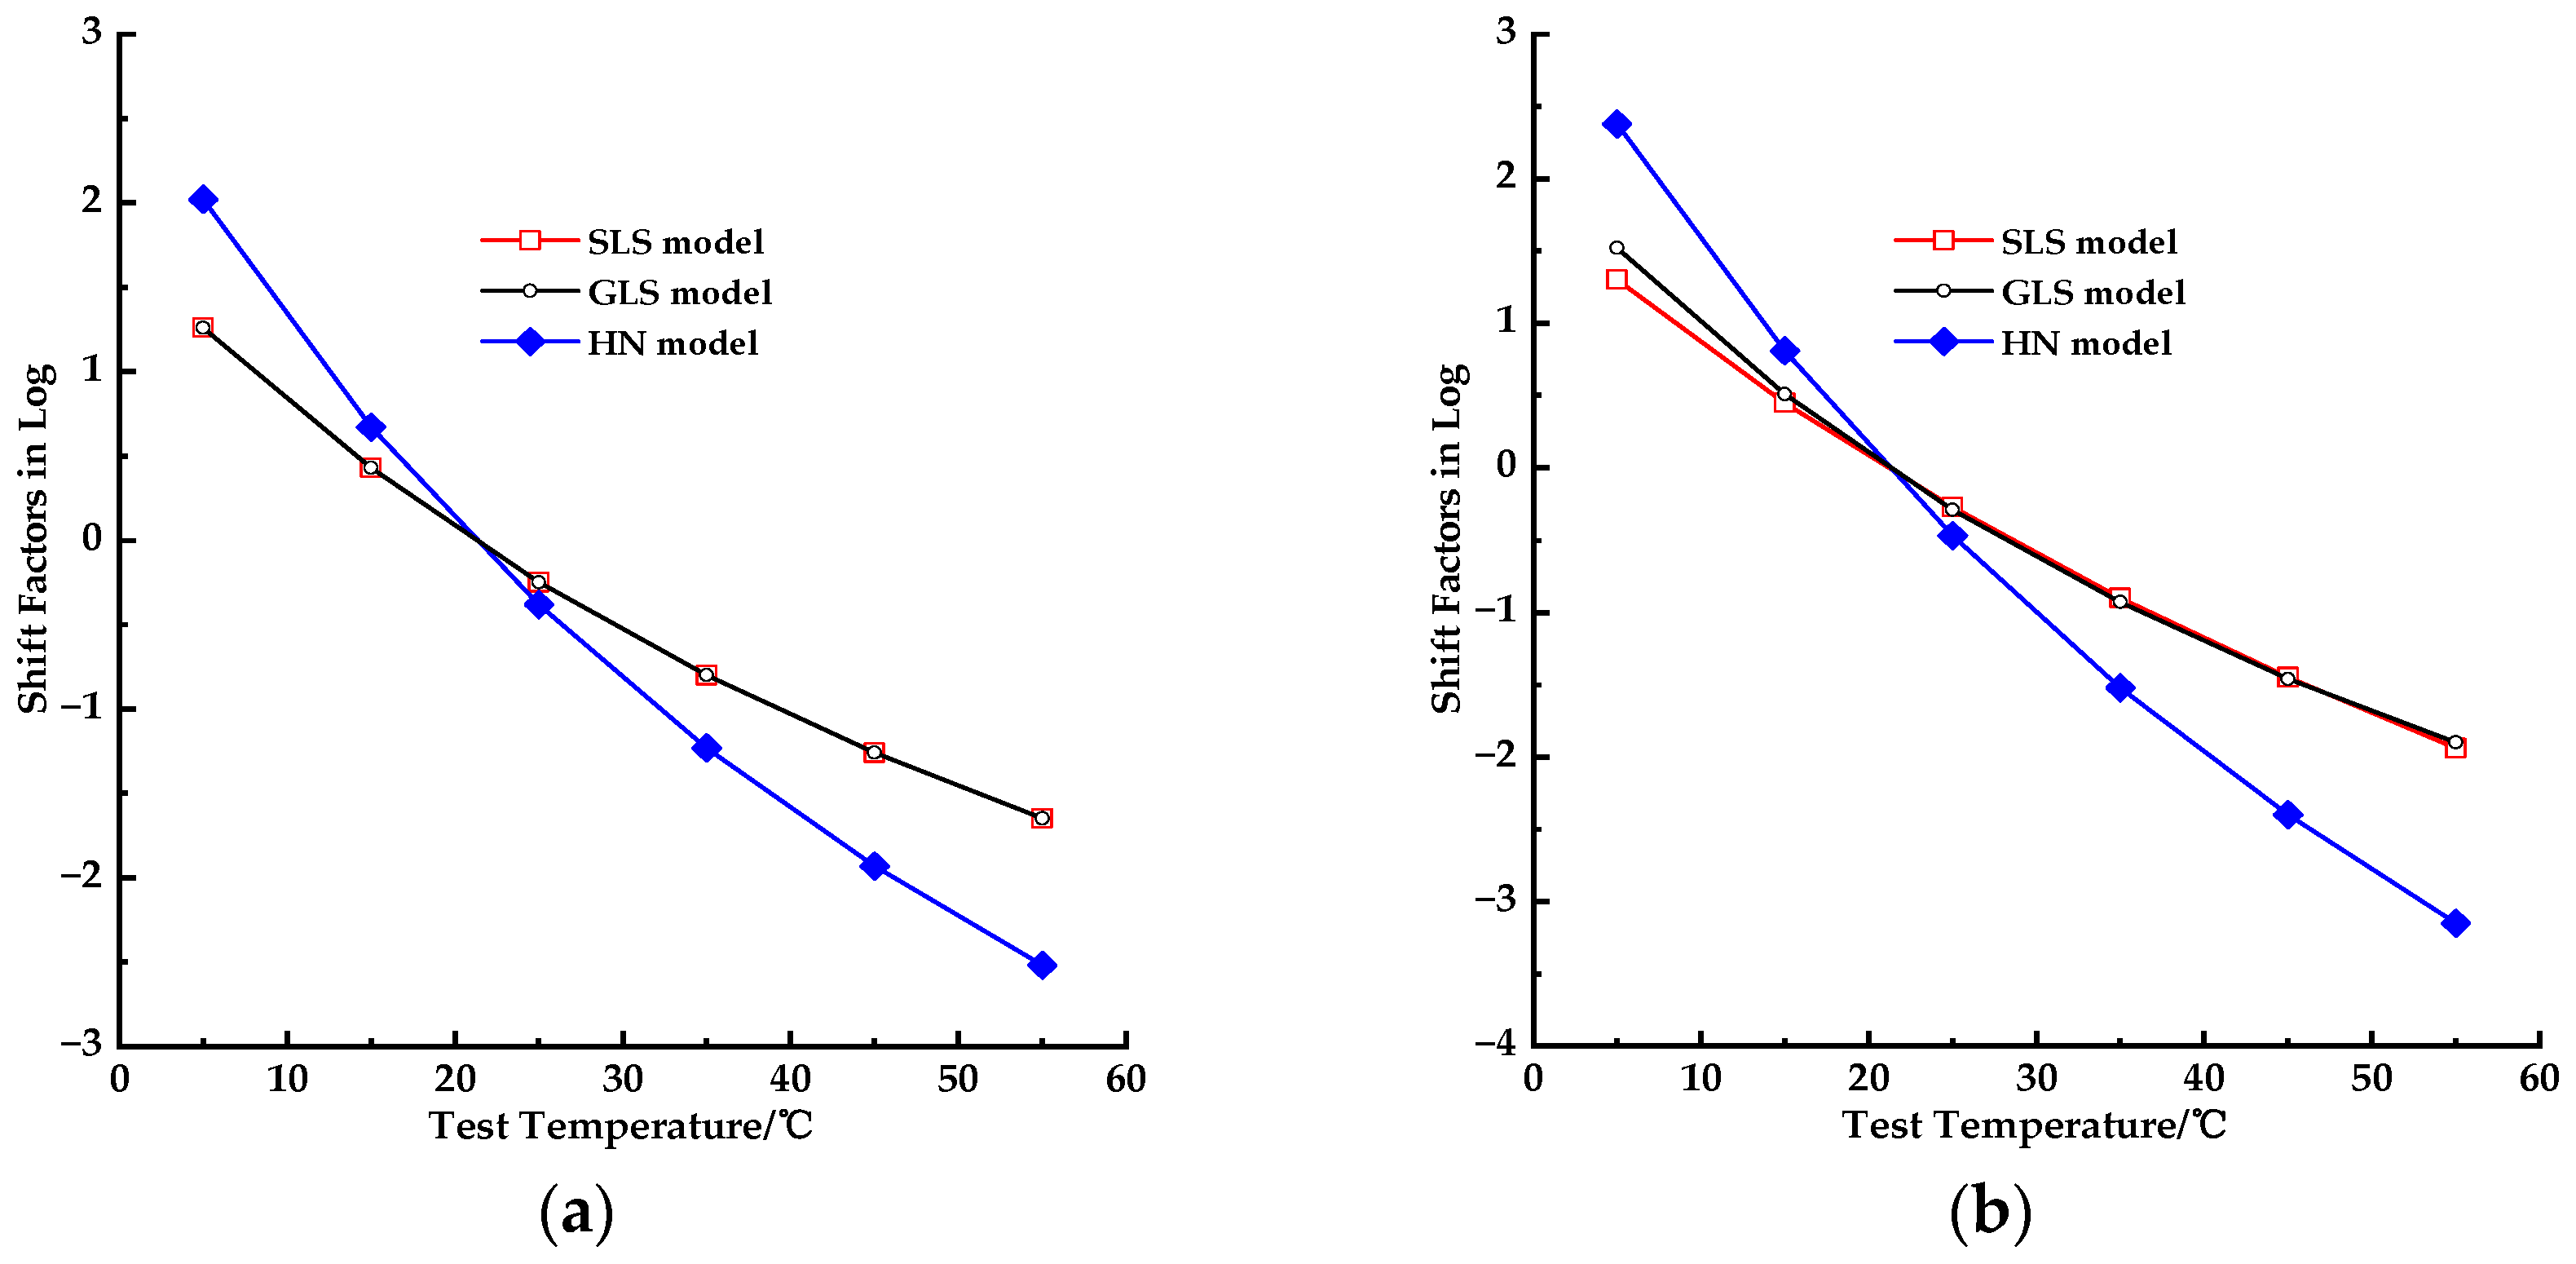
The shift factors used to construct the phase angle master curve are presented in Figure 10a,b for PUM–OGFC and PUM–AC, respectively.
Figure 10.
Shift factors for the phase angle (δ) master curves of PUM–OGFC and PUM–AC. (a) PUM–AC; (b) PUM–OGFC.
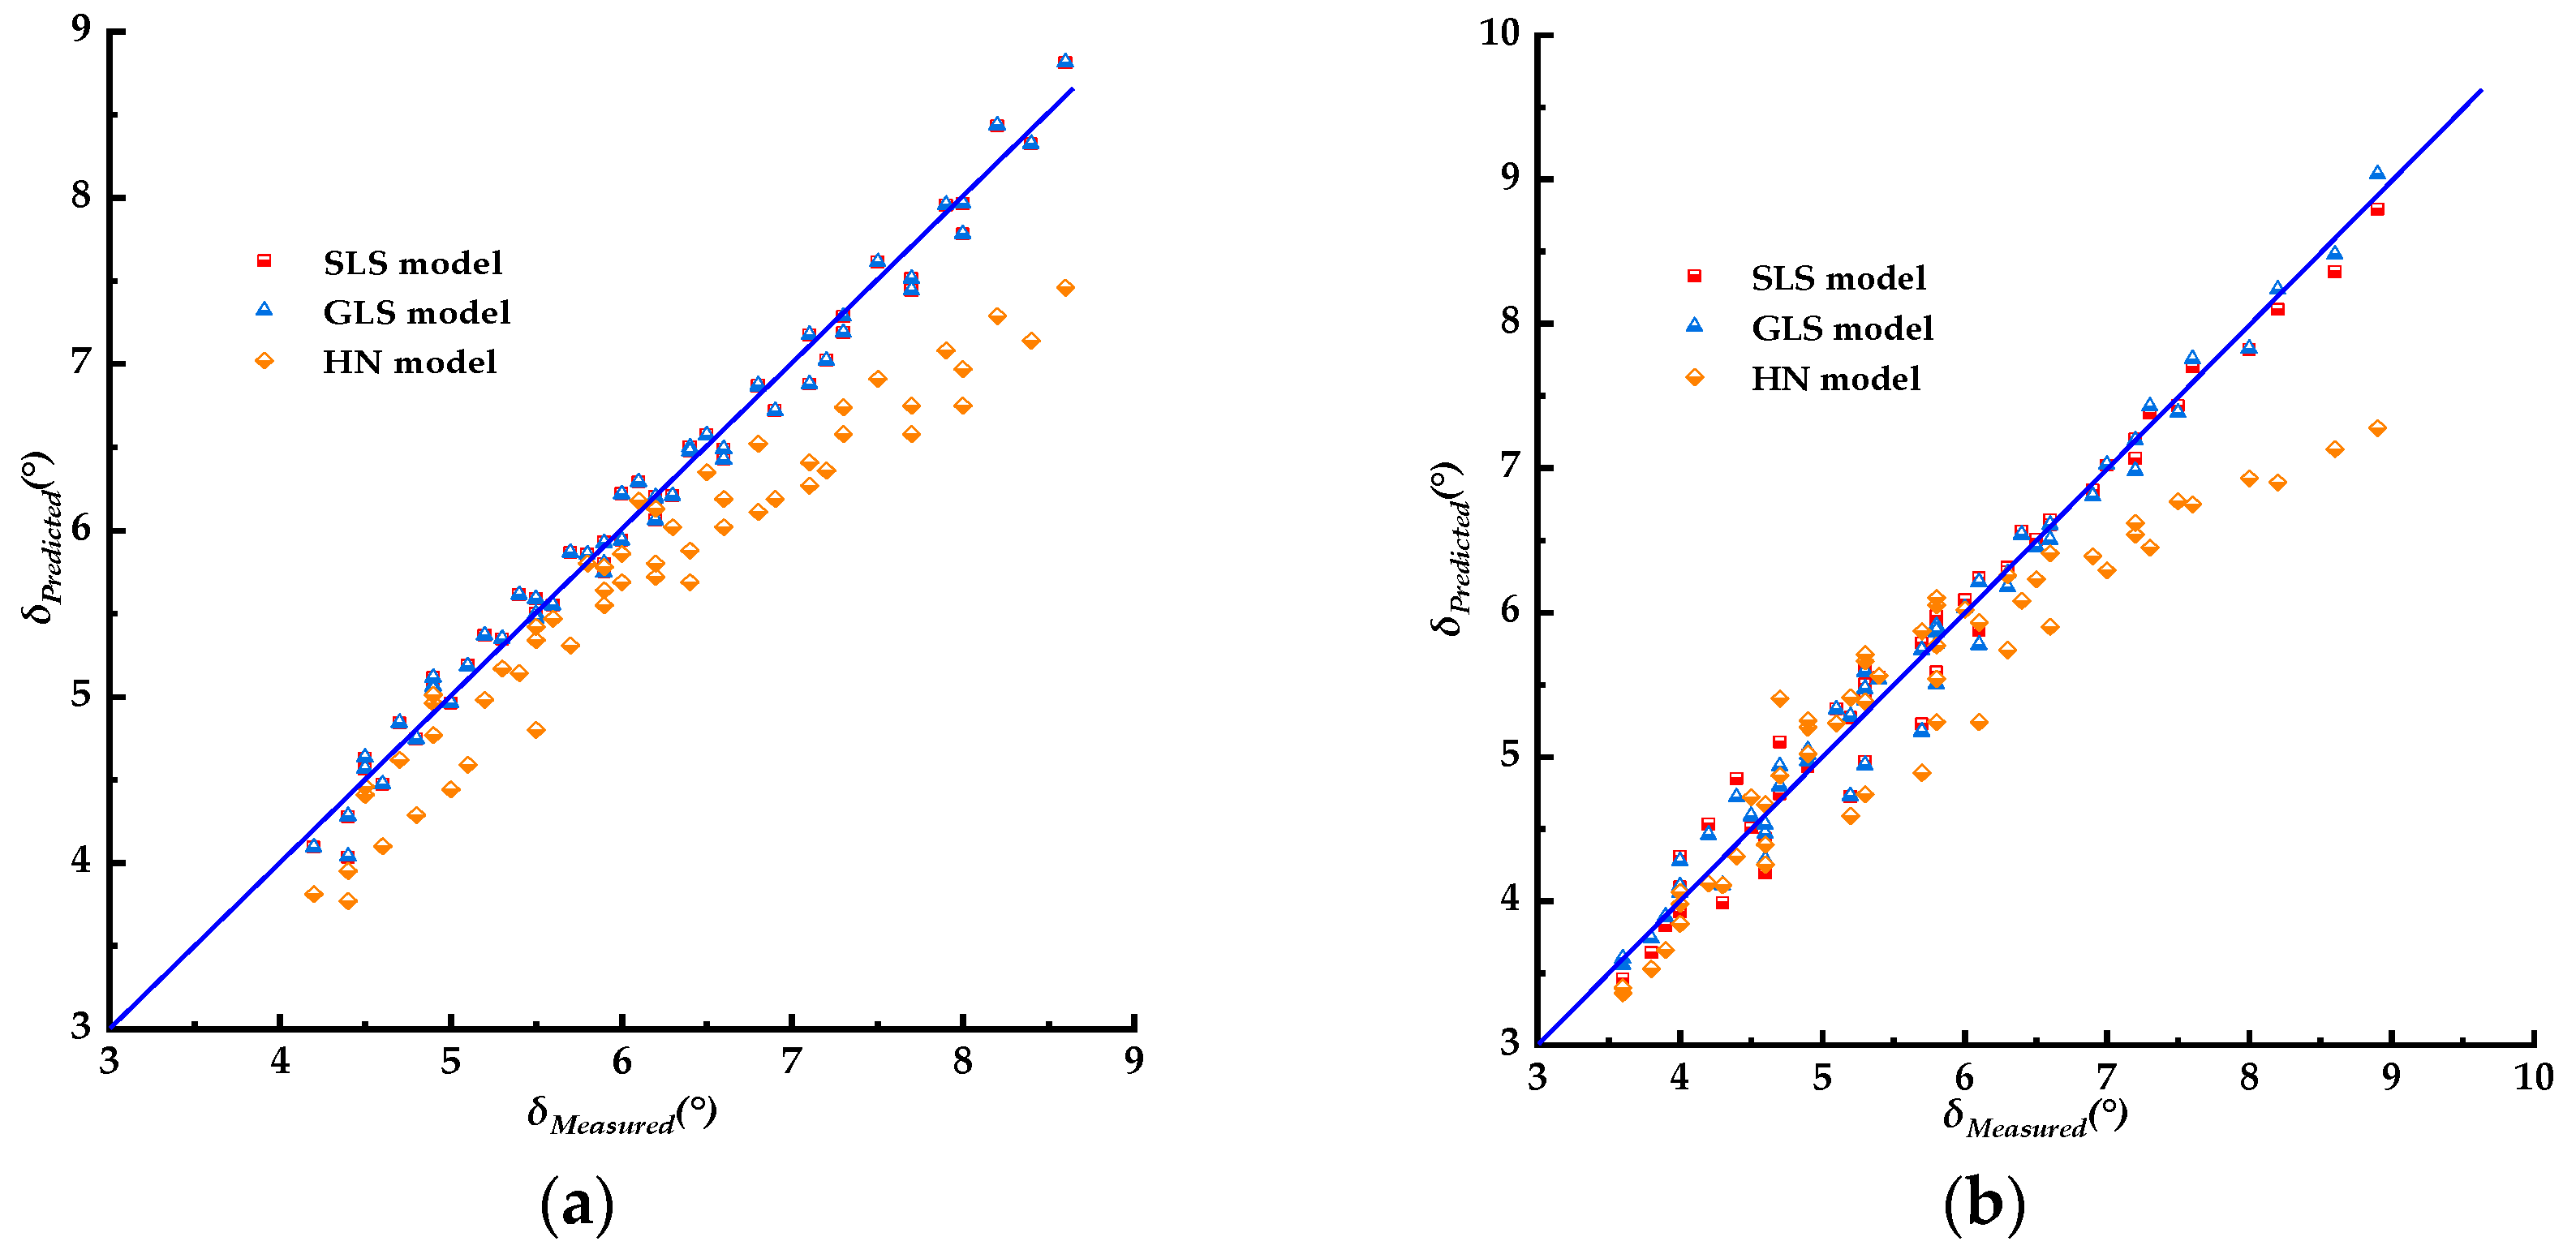
A comparison of the predicted and measured phase angle (δ) data for PUM–OGFC and PUM–AC is presented in Figure 11a,b, respectively. The corresponding linear regression parameters are summarized in Table 3 and Table 4.
Figure 11.
Comparison of predicted and measured phase angle (δ) for the PUM–OGFC and PUM–AC. (a) PUM–AC; (b) PUM–OGFC.
Table 3.
Linear regression parameters between predicted and measured phase angle data of PUM–AC.
Table 4.
Linear regression parameters between predicted and measured phase angle data of PUM–OGFC.
4. Discussion
4.1. Comparing Dynamic Modulus and Phase Angle of Two PU Mixtures
4.1.1. Dynamic Modulus Comparison
As shown in Figure 2a,b, the dynamic modulus (|E*|) of both PUM mixtures exhibited characteristic viscoelastic behavior: it increased with loading frequency and decreased with rising temperature. The sensitivity to these factors was quantified. The increasing rate from 0.1 Hz to 25 Hz was more pronounced at higher temperatures, ranging from 31.8% to 47.2% for PUM–AC and from 22.9% to 46.1% for PUM–OGFC. Furthermore, |E*| decreased with increasing test temperature across all loading frequencies. The magnitude of this decrease was greater at lower frequencies, rising steadily from 43% to 49% as loading frequencies decreased from 25 Hz to 0.1 Hz for PUM–AC and from 50.7% to 58.6% for PUM–OGFC. Therefore, the dynamic modulus of both PUM mixtures is influenced by both test temperature and loading frequency. Temperatures had a more significant influence on |E*| than loading frequency. Specifically, high temperature and low loading frequencies (corresponding to slow vehicle speed) reduce the dynamic modulus of both PUM mixtures.
As shown in Figure 2c–e, the dynamic modulus of PUM–OGFC was consistently lower than that of PUM–AC at all test temperatures. For instance, the |E*| value for PUM–AC at 55 °C was greater than that for PUM–OGFC at 15 °C. Therefore, aggregate gradation profoundly influences the dynamic modulus of the PU mixture. This result indicates that the aggregate skeleton, in combination with the PU binder, contributes significantly to load bearing. The denser AC gradation, with its lower air void content and more continuous aggregate skeleton, provides a higher resistance to elastic deformation under load compared to the open-graded structure.
However, it is critical to distinguish between resistance to elastic deformation and resistance to permanent deformation (rutting). While the higher |E*| suggests PUM–AC may offer advantages in terms of instantaneous stiffness, the overall rutting performance is governed by both the stiffness and the viscous characteristics of the material, as evaluated by the phase angle and rutting parameter (|E*|/sin(δ)) in the subsequent sections. The following discussion will demonstrate that the PUM–OGFC mixture compensates for its lower stiffness with a markedly more elastic response, leading to superior long-term rutting resistance.
4.1.2. Phase Angle Comparison
Figure 3a shows that the phase angle (δ) of PUM–AC decreased with increasing loading frequency across all test temperatures, with a reduction rate ranging from 29.1% to 33.8%. This rate of decrease did not vary consistently with temperature. Conversely, the phase angle increased with temperature, with an increase rate of 45.8% to 54.9% across all loading frequencies. This rate of increase varied steadily with loading frequency. The phase angle demonstrated a higher percentage change in response to variations in temperature and loading frequency compared to the dynamic modulus, highlighting its strong dependence on test conditions. As shown in Figure 3b, the phase angle of PUM–OGFC exhibits a trend similar to that of PUM–AC. Specifically, the phase angle decreased with loading frequency (by 25.5% to 37.8%) and increased with temperature (by 60% to 95.5%). These results indicate that the phase angle of PUM–OGFC is even more sensitive to changes in loading frequency and temperature than that of PUM–AC.
Figure 3c–e shows that at a given temperature, the phase angle of PUM–AC was slightly larger than that of PUM–OGFC. However, the absolute phase angle values for both PU mixtures were less than 10°, regardless of gradation. The phase angle represents the viscoelastic behavior of a material: lower values indicate more elastic solid-like behavior, while higher values indicate more viscous fluid-like behavior. The consistently low phase angle (<10°) indicated that both PUM–OGFC and PUM–AC exhibit a predominantly elastic and highly recoverable response, even at 55 °C. This pronounced elastic character is a key indicator of the material’s potential to resist the accumulation of permanent deformation.
4.2. Comparing Rutting Parameter (|E*|/sin(δ))
The NCHRP report 513 established a strong correlation between the dynamic modulus of asphalt mixtures and field permanent deformation behavior, a finding subsequently incorporated into the Superpave performance evaluation system. Research indicates that the rutting resistance of a hot mixed asphalt mixture correlates well with the rutting parameter (|E*|/sin(δ)). Consequently, this parameter is a reliable indicator for evaluating the high-temperature rutting resistance of hot mixed asphalt mixture (HMA). Thus, higher |E*|/sin(δ) values correspond to greater rutting resistance.
As shown in Figure 4, PUM–OGFC and PUM–AC exhibited similar trends: the rutting parameters (|E*|/sin(δ)) increased with loading frequency and decreased with temperature. Consequently, both PU mixtures exhibit maximum rutting resistance at low temperatures and high loading frequencies. For PUM–AC, increasing the loading frequency from 0.1 Hz to 25 Hz raised |E*|/sin(δ) by approximately 94.2% to 111.8% across the tested temperatures. Conversely, increasing the temperature from 5 °C to 55 °C reduced it by approximately 61.6% to 65.9% across all loading frequencies. Thus, for PUM–AC, the loading frequency had a greater influence on |E*|/sin(δ) than temperature. Similarly, for PUM–OGFC, |E*|/sin(δ) increased by approximately 60.3% to 123.7% as loading frequency increased from 0.1 Hz to 25 Hz, and decreased by 69.4% to 78.2% as temperature increased from 5 °C to 55 °C. Therefore, the loading frequency also had a greater effect on PUM–OGFC than temperature.
More critically, under identical temperature and frequency conditions, PUM–OGFC consistently exhibited higher |E*|/sin(δ) values than PUM–AC. For example, the value for PUM–OGFC at 55 °C exceeded that of PUM–AC at 35 °C. This direct comparison conclusively demonstrates the superior rutting resistance of the PUM–OGFC mixture.
Furthermore, this finding underscores the unique advantage of the polyurethane binder system. Despite the PUM–OGFC mixture’s higher air void content (which typically compromises stiffness), the synergistic effect of the strong, elastic polyurethane binder and the interlocking open-graded skeleton leads to a composite material with an exceptionally favorable balance of stiffness and elasticity, as quantified by the rutting parameter.
4.3. Black Space Diagram Comparing
The black space diagram [68] is a plot of dynamic modulus versus phase angle, used to analyze the rheological properties of asphalt and compare the viscoelastic performance of HMA [37,69]. It also assesses the stiffness and relaxation capability of HMA [30]. In this diagram, a curve shifted to the right or a right-side inflection indicates viscous status in the asphalt binder or HMA. A typical HMA exhibits a peak phase angle value in its black space plot, reflecting the interaction between asphalt binder and aggregate [70]. Consequently, a well-defined curve shape and a distinct inflection point in the black space diagram are characteristic of typical rheological properties in the asphalt binders or HMA.
Figure 5 shows that the black space diagrams for PUM–OGFC and PUM–AC lack the well-defined curve shape and distinct inflection points characteristic of typical HMA. This distinct, near-linear clustering of data points indicates that the relationship between |E*| and δ for these polyurethane mixtures is remarkably consistent across the wide range of temperatures and loading frequencies tested. Unlike HMA, the viscoelastic response of the PUM composites does not traverse a broad, curved path in the black space, suggesting a fundamentally different and simpler relaxation mechanism. Furthermore, the entire dataset for PUM–OGFC is positioned at lower phase angles compared to PUM–AC at similar stiffness levels. This clear separation underscores the significant influence of aggregate gradation on the viscoelastic character of the PU composite, with the OGFC structure consistently promoting a more elastic-dominant response.
4.4. Master Curves Comparing
4.4.1. Dynamic Modulus Master Curve Analyzing
This section details the use of three master curve models—SLS, GLS, and HN models—to fit equation parameters and construct the corresponding master curves. The measured data points were shifted to a selected reference temperature using the WLF shift factor equation. During the fitting process, the sum of squared error (SSE, denoted as error2) between the predicted and measured |E*| values was minimized. The coefficient of R2 and Se/Sy were used as additional good-of-fit criteria. The quality of the model fits was evaluated using the coefficient of determination (R2) and additional statistical metrics (error2, Se/Sy, and SSE), as defined in Supplementary Material Table S1.
Figure 6a,b show that the |E*| master curves for PUM–OGFC and PUM–AC have similar shapes but different peak values. This finding confirms the discussion in Section 4.1.1 that PUM–AC exhibits higher stiffness than PUM–OGFC. The measured data points are clustered on the right side of the master curves, slightly offset from them. The R2 values for both PU mixtures approach 1, indicating that the SLS model provides a good fit to the measured |E*| data. As summarized in Supplementary Table S1, the error2, Se/Sy, and SSE values were lower for the PUM–AC fits than for the PUM–OGFC fits across all models, indicating a marginally more precise prediction for the dense-graded mixture’s dynamic modulus data.
All three models successfully generated continuous master curves for both PUM–OGFC and PUM–AC, as shown in Figure 6. A consistent, key observation is that the master curves for PUM–AC are positioned at significantly higher |E*| values than those for PUM–OGFC across all models (Figure 6a,c,e), providing model-based confirmation of the higher stiffness of the dense-graded mixture. Furthermore, the statistical metrics (R2, Error2, SSE) uniformly indicate that all models fit the experimental data for PUM–AC more precisely than for PUM–OGFC (see Supplementary Table S1). This suggests the dynamic modulus of the dense-graded mixture is more predictable within these viscoelastic frameworks. The SLS model (Figure 6a,b) provides a very good fit for both mixtures (R2 ≈ 1). The error metrics (Error2, SSE) are notably lower for PUM–AC than for PUM–OGFC. The GLS model (Figure 6c,d) yields a similar quality of fit to the SLS model, with comparably high R2 values. Consistent with the SLS results, the GLS model also shows lower fitting errors for PUM–AC. The HN Model (Figure 6e,f) provides an excellent fit, with R2 values of 0.9855 for PUM–AC and 0.9675 for PUM–OGFC. While its R2 for PUM–OGFC is relatively lower, the HN model produces the lowest absolute SSE values for both materials, indicating it minimizes the absolute prediction error most effectively. A direct comparison of the master curves from the three models for each mixture is shown in Figure 6g,h. The curves exhibit similar shapes, with minor differences in predicted values across the frequency range.
For PU–OGFC mixtures, the shift factor fitted with the SLS and GLS models shows minimal difference, but their absolute values are consistently larger than those fitted with the HN model (Figure 7b). While for PU–AC in Figure 7a, all shift factors for the three models exhibited nearly the same values. The shift factor, a function of temperature, facilitates the translation of data from various test temperatures to a referenced temperature to form a continuous, smooth curve. It also indicates the quality of this translation, reflecting the time–temperature superposition principle [71]. The absolute shift factor value at a given test temperature reflects the mixture’s temperature dependency, with higher values indicating greater temperature dependency [72]. The activation energy, which is related to the shift factor [73], represents the energy barrier overcome when data measured at different temperatures are shifted to form the master curve. A higher activation energy indicates that more energy is required to shift the data, implying greater temperature sensitivity. A critical finding is that the absolute values of aT are larger for PUM–OGFC than for PUM–AC across all three models. This indicates the dynamic modulus of the open-graded mixture exhibits greater temperature dependency, implying a higher activation energy for its viscoelastic relaxation.
It was generally observed from Figure 8a that for PUM–AC, all the predicted |E*| values for the three models are closely clustered around the line of equality, with only an outlier from the HN model. Linear fitting was used to evaluate the correlation between predicted and measured |E*| values. According to Table 1, all three models predict PUM–AC’s |E*| values with high accuracy (high R2 values). The SLS model has higher R2 values than the HN model, while the GLS model showed slightly lower R2 values than the HN model. The HN model has the smallest intercept values and slope values closest to 1, indicating it provides the most accurate prediction for PUM–AC. Figure 8b shows that for PUM–OGFC, the predicted values also cluster around the line of equality but exhibit greater dispersion than those for PUM–AC. The linear regression results in Table 2 show that all three models also predict the |E*| of PUM–OGFC with high precision, as indicated by high R2 values. The SLS and GLS models have higher R2 values and smaller, nearly identical slope and intercept values compared to the HN model. The R2 values are higher for PUM–AC than for PUM–OGFC. The SLS model, with its smaller slope and intercept values, predicts the |E*| of PUM–AC more accurately than that of PUM–OGFC. The R2 values from this linear regression are consistently higher for PUM–AC, reaffirming that aggregate gradation influences the predictability of the dynamic modulus, with the behavior of the dense-graded mixture being more readily captured by these models.
4.4.2. Phase Angle Master Curve Analyzing
Numerous models, such as the SLS, GLS, and HN models used in this paper, have been developed to construct dynamic modulus master curves. However, few models existed to construct a master curve for the simultaneously measured phase angle data. Consequently, the K–K relations [74,75] were employed to derive a phase angle master curve from the corresponding dynamic modulus data. The fitting procedure mirrored that used for the dynamic modulus; the WLF equation was also used to fit the shift factors.
The phase angle master curves constructed using the SLS, GLS, and HN models are presented in Figure 9. Both the SLS and GLS models successfully generated curves within the theoretical range of 0–90°, capturing the characteristic decrease in phase angle with increasing loading frequency (Figure 9a–d). In contrast, the HN model produced master curves with very low ultimate values (below 8°), which substantially underestimated the measured phase angles and showed poor agreement with the experimental data, indicating its inadequacy for this purpose (Figure 9e,f).
For both the SLS and GLS models, the master curves of PUM–AC were consistently positioned below those of PUM–OGFC across the frequency range (Figure 9a–d), confirming the more elastic-dominant behavior of the dense-graded mixture. Statistically, the fits for PUM–AC also demonstrated slightly higher R2 values and lower Error2, Se/Sy, and SSE values compared to PUM–OGFC, indicating a marginally better prediction precision for the dense-graded mixture.
The fitted shift factors are plotted in Figure 10a,b. The values for the SLS and GLS models are nearly identical and are smaller in absolute value than the HN model. Furthermore, the absolute shift factor values for PUM–AC are smaller than those for PUM–OGFC. Consequently, PUM–OGFC exhibits greater temperature sensitivity than PUM–AC and is more prone to high-temperature deformation. Therefore, aggregate gradation type affects PU mixture performance, with the AC gradation exhibiting superior performance.
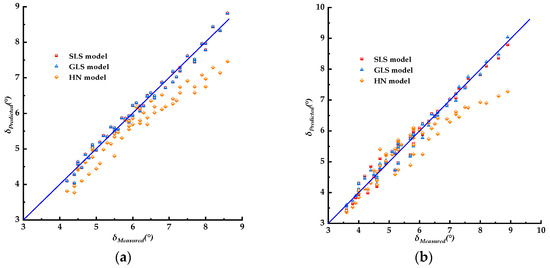
The predicted versus measured phase angle data for all three models are shown in Figure 11a,b. Figure 11a shows that for PUM–AC, the data points predicted by the SLS and GLS models are distributed around the line of equality, whereas those predicted by the HN model show significantly greater dispersion. This result is consistent with the previous discussion on the phase angle master curves. Similarly, Figure 11b shows that for PUM–OGFC, the data points predicted by the SLS and GLS models are distributed around the line of equality but exhibited greater dispersion than those for PUM–AC. The data points from the HN model are also located far from the line of equality and exhibit the highest dispersion. The linear regression process was used to analyze the correlation between predicted and measured phase angles; the results are listed in Table 3 and Table 4. For PUM–AC, the HN model has the lowest prediction precision, while the GLS and SLS models have identical prediction precision, evidenced by their slope and intercept values. For PUM–OGFC, the HN and SLS models also show the lowest and highest precision, respectively. Furthermore, the R2 values are higher for PUM–AC than for PUM–OGFC, while the slope and intercept values are close to 1 and 0, respectively. Therefore, aggregate gradation type significantly influences the prediction precision of the PU mixture’s phase angle. Overall, the GLS model provides the most precise phase angle predictions for both PUM–OGFC and PUM–AC.
5. Conclusions
This paper utilized open-graded (OGFC–13) and dense-graded (AC–13) aggregate gradation to prepare PU mixtures and investigate the dynamic properties of the open-graded PU mixture (PUM–OGFC). Based on complex dynamic modulus test results, the dynamic modulus, phase angle, rutting resistance, and rheological properties of PUM–OGFC and PUM–AC were compared. The SLS, GLS, and HN models, in conjunction with the WLF equation, were used to construct dynamic modulus master curves for both PU mixtures. The K–K relations were employed to derive phase angle master curve equations from the dynamic modulus models, which were then used to construct the phase angle master curves. The main conclusions are as follows:
- (1)
- The dynamic modulus of PUM–AC at 55 °C was greater than that of PUM–OGFC at 15 °C. The phase angle of PUM–OGFC was slightly lower than that of PUM–AC across all temperatures and frequencies. All phase angles were below 10 °, indicating predominantly elastic behavior at 55 °C. The phase angle of PUM–OGFC was more sensitive to variations in temperatures and frequencies than that of PUM–AC.
- (2)
- PUM–OGFC exhibited higher rutting resistance. The rutting parameter (|E*|/sin(δ)) for PUM–OGFC at 55 °C exceeded that for PUM–AC at 35 °C. The parameter was more sensitive to loading frequency than to temperature.
- (3)
- Unlike typical HMA, PUM–OGFC and PUM–AC did not exhibit defined black space diagram shapes. Aggregate gradation significantly influenced the rheological property of the PU mixture.
- (4)
- The SLS, GLS, and HN models accurately fitted the dynamic modulus data of both PU mixtures. PUM–OGFC exhibited greater temperature sensitivity than PUM–AC. Aggregate gradation influenced the fitting result and prediction accuracy.
- (5)
- The SLS and GLS models provided a more precise fit to the phase angle data than the HN model. Consistent with the dynamic modulus results, PUM–OGFC showed greater temperature sensitivity, and aggregate gradation affected the prediction accuracy.
This study reveals that the introduction of a PU binder fundamentally alters the conventional framework for understanding the gradation–performance relationship in paving mixtures. For PU-based composites, the exceptional performance originates from the binder’s intrinsic mechanical properties and its unique interaction with the aggregate structure, rather than strictly following the traditional skeleton or densification principles of asphalt mixtures.
In conventional asphalt mixtures, open-graded (OGFC) designs rely primarily on point contacts between coarse aggregates to form a load-bearing skeleton. However, the thermoplastic and viscoelastic nature of asphalt binder can lead to skeleton instability under prolonged loading at high temperatures. In contrast, for PU mixtures, the situation is transformed. The reactive PU binder cures to form a tough, highly elastic three-dimensional network. Within PUM–OGFC, this elastic network not only provides strong adhesion at aggregate contact points but, more critically, it fills and reinforces the large void spaces, creating a continuous elastic matrix that supports the aggregate skeleton. This means load transmission is no longer reliant solely on limited aggregate point contacts but is achieved through a synergistic mechanism combining the “aggregate skeleton” and the “PU elastic matrix.” This synergy results in a composite material that achieves an exceptional balance of high stiffness, high elasticity, and superior resistance to permanent deformation, surpassing the performance of traditional materials.
Conversely, in the dense-graded PUM–AC, although the PU binder strengthens the mastic, the compact structure limits the formation of an extensive, effective spatial network of the elastic binder. The performance improvement here stems more from the increased modulus of the mastic itself. The rheological data from this study, specifically the higher rutting parameter (|E*|/sin(δ)) and lower phase angle for PUM–OGFC, confirm that the “spatial synergy” between the PU binder and the open-graded skeleton translates the excellent material properties of PU into macroscopic engineering performance advantages more effectively than the “filling and reinforcement” mechanism in the dense-graded mixture.
Therefore, a key insight from this research is that for high-performance reactive binders like polyurethane, an open-graded structure is not a mechanical disadvantage but an ideal framework to fully utilize its high elasticity and strong adhesive properties. This provides a new theoretical basis and a viable technical pathway for designing sustainable pavement materials that combine excellent drainage function with high resistance to rutting. Beyond the laboratory findings, this study underscores the need to correlate lab performance with long-term field behavior through future pilot sections. While the established rheological parameters provide a sound basis for mix design, their validation ultimately requires real-world performance data under complex traffic and environmental conditions. Future work should therefore focus on bridging this gap by developing reliable transfer functions between lab tests and field monitoring data. Addressing this challenge is crucial to translate the present mechanistic insights into robust, practical criteria for sustainable pavement design [76].
Supplementary Materials
The following supporting information can be downloaded at: https://www.mdpi.com/article/10.3390/coatings16020153/s1, Table S1: The dynamic modulus master curve fitting results for PUM–AC and PUM–OGFC. Table S2: The phase angle master curve fitting results for PUM–AC and PUM–OGFC.
Author Contributions
Conceptualization, H.Z.; methodology, S.M.; software, Y.L. and M.X.; validation, H.Z., Y.L. and M.X.; formal analysis, H.Z.; investigation, H.Z. and C.S.; resources, B.W., W.Z. and P.Z.; data curation, H.Z., C.S. and P.Z.; writing—original draft preparation, H.Z.; writing—review and editing, S.M.; visualization, H.Z., C.S., M.X. and B.W.; supervision, S.M.; project administration, W.Z. and S.M.; funding acquisition, W.Z.; All authors have read and agreed to the published version of the manuscript.
Funding
This research received no external funding.
Institutional Review Board Statement
Not applicable.
Informed Consent Statement
Not applicable.
Data Availability Statement
The data presented in this study are available on request from the corresponding author.
Acknowledgments
We thank Guang Li and Gen Li for their assistance with experiments and valuable discussion.
Conflicts of Interest
Authors Bin Wang, Yong Liu, Mingzhu Xu was employed by the company of Dezhou Transportation Bureau. Author Wensheng Zhang was employed by the company of Wanhua Chemical Group Co. Ltd. The remaining authors declare that the research was onducted in the absence of any commercial or financial relationships that could be construed as apotential conflict of interest.
Abbreviations
The following abbreviations are used in this manuscript:
| AC | Dense-Graded Asphalt Concrete |
| BPN | British Pendulum Number |
| CRMA | Crumb Rubber-Modified Asphalt |
| DSR | Dynamic Shear Rheometer |
| FTIR | Fourier Transform Infrared Spectroscopy |
| GLS | Generalized Logistic Sigmoid (model) |
| HMA | Hot Mixed Asphalt (mixture) |
| HN | Havriliak–Negami (model) |
| K–K | Kramers–Kronig (relations) |
| MPD | Mean Profile Depth |
| OGFC | Open-Graded Friction Course |
| PPAM | Porous Polyurethane-Modified Asphalt Mixture |
| PU | Polyurethane |
| PUM–AC | Polyurethane Mixture with Dense-Graded (Asphalt Concrete) |
| PUM–OGFC | Polyurethane Mixture with Open-Graded Friction Course |
| PUMA | Polyurethane-Modified Asphalt |
| R2 | Coefficient of Determination |
| SMPU–13 | Stone Matrix Polyurethane Mixture (13 mm nominal size) |
| SLS | Standard Logistic Sigmoid (model) |
| SSE | Sum of Squared Errors |
| SUPU–20 | Superpave Polyurethane Mixture (20 mm nominal size) |
| TTSP | time–temperature superposition principle |
References
- Hou, X.; Lv, S.; Chen, Z.; Xiao, F. Applications of Fourier transform infrared spectroscopy technologies on asphalt materials. Measurement 2018, 121, 304–316. [Google Scholar] [CrossRef] [Scilit]
- Kumar, A.; Choudhary, R.; Kumar, A. A review of the application of crosslinking additives in asphalt binder modification for rheological changes and storage stability. Eur. J. Environ. Civ. Eng. 2024, 28, 2821–2861. [Google Scholar] [CrossRef] [Scilit]
- Zhou, J.; Chen, X.; Xu, G.; Zhang, H. Evaluation on low temperature characteristics of SBS/CR modified asphalt binder under different aging conditions. IOP Conf. Ser. Mater. Sci. Eng. 2019, 652, 12019. [Google Scholar] [CrossRef] [Scilit]
- Fu, Q.; Sun, F.; Xu, G.; Chen, X. Performance Evaluation of SBS+CR Composite Modified Asphalt Binder and Mixture for Railway Substructure. In Proceedings of the 19th COTA International Conference of Transportation Professionals (CICTP 2019), Nanjing, China, 6–8 July 2019; pp. 928–940. [Google Scholar]
- Qian, C.; Fan, W.; Yang, G.; Han, L.; Xing, B.; Lv, X. Influence of crumb rubber particle size and SBS structure on properties of CR/SBS composite modified asphalt. Constr. Build. Mater. 2020, 235, 117517. [Google Scholar] [CrossRef] [Scilit]
- Wu, S.; He, R.; Chen, H.; Li, W.; Li, G. Rheological Properties of SBS/CRP Composite Modified Asphalt under Different Aging Treatments. Materials 2020, 13, 4921. [Google Scholar] [CrossRef] [Scilit]
- Li, L.; Wu, C.; Cheng, Y.; Wang, H.; Liang, J.; Zhao, W. Synergistic effect of waste rubber powder on low-temperature toughness and high-temperature rheological properties of SBS modified asphalt. Constr. Build. Mater. 2023, 365, 130112. [Google Scholar] [CrossRef] [Scilit]
- Wang, W.; Wang, Z.; Guo, L. High-Temperature Property Evaluation and Index Research of Modified Asphalt before and After Aging. J. Phys. Conf. Ser. 2022, 2152, 12032. [Google Scholar] [CrossRef] [Scilit]
- Šernas, O.; Vaitkus, A.; Škulteckė, J. Performance of crumb rubber bitumen and asphalt modified in the wet process alone and in combination with SBS polymer. Road Mater. Pavement Des. 2023, 24, 107–123. [Google Scholar] [CrossRef] [Scilit]
- Huang, J.; Yan, K.; Wang, M.; Shi, K.; Li, Y.; Zhang, Y. Performance evaluation of SBS-modified asphalt mixtures incorporating waste tire rubber and HDPE. Constr. Build. Mater. 2024, 430, 136423. [Google Scholar] [CrossRef] [Scilit]
- Wang, X.; Hui, Y.; Xu, X.; Xu, T.; Zhao, T.; Li, B. Multi-scale study on the whole process adhesion behaviour of steel slag and SBS/CR composite modified asphalt. Int. J. Pavement Eng. 2024, 25, 2419937. [Google Scholar] [CrossRef] [Scilit]
- Lin, P.; Huang, W.; Tang, N.; Xiao, F. Performance characteristics of Terminal Blend rubberized asphalt with SBS and polyphosphoric acid. Constr. Build. Mater. 2017, 141, 171–182. [Google Scholar] [CrossRef] [Scilit]
- Qian, C.; Fan, W.; Liang, M.; He, Y.; Ren, S.; Lv, X.; Nan, G.; Luo, H. Rheological properties, storage stability and morphology of CR/SBS composite modified asphalt by high-cured method. Constr. Build. Mater. 2018, 193, 312–322. [Google Scholar] [CrossRef] [Scilit]
- Ren, S.; Liu, X.; Xu, J.; Lin, P. Investigating the role of swelling-degradation degree of crumb rubber on CR/SBS modified porous asphalt binder and mixture. Constr. Build. Mater. 2021, 300, 124048. [Google Scholar] [CrossRef] [Scilit]
- Jiang, Z.; Easa, S.M.; Hu, C.; Zheng, X. Understanding damping performance and mechanism of crumb rubber and styrene-butadiene-styrene compound modified asphalts. Constr. Build. Mater. 2019, 206, 151–159. [Google Scholar] [CrossRef] [Scilit]
- Li, H.; Cui, C.; Temitope, A.A.; Feng, Z.; Zhao, G.; Guo, P. Effect of SBS and crumb rubber on asphalt modification: A review of the properties and practical application. J. Traffic Transp. Eng. 2022, 9, 836–863. [Google Scholar] [CrossRef] [Scilit]
- Wang, H.; Huang, Y.; Jin, K.; Zhou, Z. Properties and mechanism of SBS/crumb rubber composite high viscosity modified asphalt. J. Clean. Prod. 2022, 378, 134534. [Google Scholar] [CrossRef] [Scilit]
- Zhao, Z.; Wu, S.; Xie, J.; Yang, C.; Wang, F.; Li, N.; Liu, Q.; Amirkhanian, S. Effect of direct addition of asphalt rubber pellets on mixing, performance and VOCs of asphalt mixtures. Constr. Build. Mater. 2024, 411, 134494. [Google Scholar] [CrossRef] [Scilit]
- Loderer, C.; Partl, M.N.; Poulikakos, L.D. Effect of crumb rubber production technology on performance of modified bitumen. Constr. Build. Mater. 2018, 191, 1159–1171. [Google Scholar] [CrossRef] [Scilit]
- Brondani, C.; Menezes Vestena, P.; Faccin, C.; Lisboa Schuster, S.; Pivoto Specht, L.; da Silva Pereira, D. Moisture susceptibility of asphalt mixtures: 2S2P1D rheological model approach and new index based on dynamic modulus master curve changes. Constr. Build. Mater. 2022, 331, 127316. [Google Scholar] [CrossRef] [Scilit]
- Lagos-Varas, M.; Movilla-Quesada, D.; Raposeiras, A.C.; Monsalve-Cárcamo, P.; Castro-Fresno, D. Rheological analyses of binders modified with triple combinations of Crumb-Rubber, Sasobit and Styrene-Butadiene-Styrene. Case Stud. Constr. Mater. 2023, 19, e02235. [Google Scholar] [CrossRef] [Scilit]
- Liu, X.; Bi, Y.; An, Y.; Zhou, S.; Li, F. Secondary-Reaction Method to Improve Performance of a Compound Modified Rubber Asphalt after Short-Term Aging. J. Transp. Eng. Part B Pavements 2021, 147, 04021038. [Google Scholar] [CrossRef] [Scilit]
- Zhang, Y.; Deng, X.; Xiao, P.; Qian, P.; Zhang, Y.; Kang, A. Properties and interaction evolution mechanism of CR modified asphalt. Fuel 2024, 371, 131886. [Google Scholar] [CrossRef] [Scilit]
- Li, H.; Jia, M.; Zhang, X.; Wang, Z.; Liu, Y.; Yang, J.; Yang, B.; Sun, Y.; Wang, H.; Ma, H. Laboratory Investigation on Fumes Generated by Different Modified Asphalt Binders. Transp. Res. Part D Transp. Environ. 2023, 121, 103828. [Google Scholar] [CrossRef] [Scilit]
- Azimi Alamdary, Y.; Singh, S.; Baaj, H. Effect of aggregates containing iron sulphide on asphalt ageing. Road Mater. Pavement Des. 2019, 22, 623–638. [Google Scholar] [CrossRef] [Scilit]
- Pei, Y.; Jiang, S.; Ding, Z.; Cheng, L.; Li, P.; Jiang, X. Preparation and performance analysis of high-viscosity asphalt containing high-content SBS and crumb rubber by oxygen-free high-temperature treatment. Constr. Build. Mater. 2023, 402, 132763. [Google Scholar] [CrossRef] [Scilit]
- Vural Kok, B.; Furtana Yalcin, B.; Yilmaz, M.; Yalcin, E. Performance evaluation of bitumen modified with styrene–isoprene-styrene and crumb rubber compound. Constr. Build. Mater. 2022, 344, 128304. [Google Scholar] [CrossRef] [Scilit]
- Yang, X.; You, Z.; Hasan, M.R.M.; Diab, A.; Shao, H.; Chen, S.; Ge, D. Environmental and mechanical performance of crumb rubber modified warm mix asphalt using Evotherm. J. Clean. Prod. 2017, 159, 346–358. [Google Scholar] [CrossRef] [Scilit]
- Zhang, Q.; Wang, S.; Lv, R.; Wu, J.; Qi, H. Viscoelastic mechanical performance of dense polyurethane mixtures based on dynamic and static modulus testing and creep testing. Constr. Build. Mater. 2022, 320, 126207. [Google Scholar] [CrossRef] [Scilit]
- Oshone, M.; Dave, E.; Daniel, J.S.; Rowe, G.M. Prediction of phase angles from dynamic modulus data and implications for cracking performance evaluation. Road Mater. Pavement Des. 2017, 18, 491–513. [Google Scholar] [CrossRef] [Scilit]
- Zhang, F.; Wang, L.; Li, C.; Xing, Y. Predict the Phase Angle Master Curve and Study the Viscoelastic Properties of Warm Mix Crumb Rubber-Modified Asphalt Mixture. Materials 2020, 13, 5051. [Google Scholar] [CrossRef] [Scilit]
- Yan, K.; Shi, K.; Wang, M.; Huang, J.; Li, Y.; Ouyang, Z. Effect of high-density-polyethylene (HDPE) and waste tire rubber (WTR) on laboratory performance of styrene butadiene styrene (SBS) modified asphalt. Road Mater. Pavement Des. 2024, 26, 1360–1375. [Google Scholar] [CrossRef] [Scilit]
- Bi, Y.; Guo, F.; Zhang, J.; Pei, J.; Li, R. Correlation analysis between asphalt binder/asphalt mastic properties and dynamic modulus of asphalt mixture. Constr. Build. Mater. 2021, 276, 122256. [Google Scholar] [CrossRef] [Scilit]
- Nguyen, T.H.; Ahn, J.; Lee, J.; Kim, J.H. Dynamic Modulus of Porous Asphalt and the Effect of Moisture Conditioning. Materials 2019, 12, 1230. [Google Scholar] [CrossRef] [Scilit] [PubMed]
- Hajibandeh, E.; Shalaby, A. Dynamic Modulus and Rutting Performance of As-Built Hot-Mix Asphalt Using Small-Scale Specimens. J. Mater. Civ. Eng. 2020, 32, 04020089. [Google Scholar] [CrossRef] [Scilit]
- Lachance-Tremblay, É.; Perraton, D.; Vaillancourt, M.; Di Benedetto, H. Degradation of asphalt mixtures with glass aggregates subjected to freeze-thaw cycles. Cold Reg. Sci. Technol. 2017, 141, 8–15. [Google Scholar] [CrossRef] [Scilit]
- Mensching, D.J.; Rowe, G.M.; Sias Daniel, J. A mixture-based Black Space parameter for low-temperature performance of hot mix asphalt. Road Mater. Pavement Des. 2016, 18, 404–425. [Google Scholar] [CrossRef] [Scilit]
- Zhang, J.; Cao, W.; Li, W.; Lou, S.; Zhang, W.; Hou, Z. Performance assessment of composite modified bitumen integrated with desulfurized crumb rubber and SBS modifier as waterproofing adhesive layer. Int. J. Adhes. Adhes. 2024, 134, 103802. [Google Scholar] [CrossRef] [Scilit]
- Wang, S.; Liu, C.; Zhu, X.; Peng, X.; Pan, Q.; Zhao, Z.; Zhang, Z. Influence of gradation on volume characteristics and engineering performance of asphalt mixture. Mater. Today Commun. 2024, 38, 107615. [Google Scholar] [CrossRef] [Scilit]
- Du, J.; Ren, D.; Ai, C.; Zhang, J.; Qiu, Y. Effect of aggregate gradation on crack propagation in asphalt mixtures at low temperatures based on the Eshelby equivalent inclusion theory. Constr. Build. Mater. 2021, 290, 123181. [Google Scholar] [CrossRef] [Scilit]
- Wang, H.; Zhan, S.; Liu, G. The Effects of Asphalt Migration on the Dynamic Modulus of Asphalt Mixture. Appl. Sci. 2019, 9, 2747. [Google Scholar] [CrossRef] [Scilit]
- Shi, C.; Zhou, W.; Wang, T.; Cai, X.; Wang, H.; Yang, J.; Hong, J.; Gong, M. Fatigue performance characterization of styrene-butadiene-styrene and crumb rubber composite modified asphalt binders with high crumb rubber contents. J. Clean. Prod. 2022, 331, 129979. [Google Scholar] [CrossRef] [Scilit]
- Chen, J.; Wang, J.; Li, M.; Zhao, Z.; Ren, J. Mesoscopic Mechanical Properties of Aggregate Structure in Asphalt Mixtures and Gradation Optimization. Materials 2023, 16, 4709. [Google Scholar] [CrossRef] [Scilit] [PubMed]
- Cheng, Z.; Li, X.; Yang, Q.; Liang, N.; Chen, L.; Zheng, S.; Wang, D. Study on Compaction Properties and Skeleton Structural Characteristics of Porous Asphalt Mixture. Sustainability 2023, 15, 13911. [Google Scholar] [CrossRef] [Scilit]
- Lv, Q.; Huang, W.; Zheng, M.; Sadek, H.; Zhang, Y.; Yan, C. Influence of gradation on asphalt mix rutting resistance measured by Hamburg Wheel Tracking test. Constr. Build. Mater. 2020, 238, 117674. [Google Scholar] [CrossRef] [Scilit]
- Qian, C.; Fan, W. Evaluation and characterization of properties of crumb rubber/SBS modified asphalt. Mater. Chem. Phys. 2020, 253, 123319. [Google Scholar] [CrossRef] [Scilit]
- Ren, J.; Xu, Y.; Huang, J.; Wang, Y.; Jia, Z. Gradation optimization and strength mechanism of aggregate structure considering macroscopic and mesoscopic aggregate mechanical behaviour in porous asphalt mixture. Constr. Build. Mater. 2021, 300, 124262. [Google Scholar] [CrossRef] [Scilit]
- Kusumawardani, D.M.; Wong, Y.D. Evaluation of aggregate gradation on aggregate packing in porous asphalt mixture (PAM) by 3D numerical modelling and laboratory measurements. Constr. Build. Mater. 2020, 246, 118414. [Google Scholar] [CrossRef] [Scilit]
- Taghipoor, M.; Hassani, A.; Karimi, M.M. Investigation of material composition, design, and performance of open-graded asphalt mixtures for semi-flexible pavement: A comprehensive experimental study. J. Traffic Transp. Eng. 2024, 11, 92–116. [Google Scholar] [CrossRef] [Scilit]
- Zhang, D.; Birgisson, B.; Luo, X. A new dynamic modulus predictive model for asphalt mixtures based on the law of mixtures. Constr. Build. Mater. 2020, 255, 119348. [Google Scholar] [CrossRef] [Scilit]
- Zhang, J.; Bao, L. Determination of asphalt mixture’s viscoelastic constitutive parameters for pavement response analysis using dynamic modulus transformation. Constr. Build. Mater. 2022, 315, 125729. [Google Scholar] [CrossRef] [Scilit]
- Wang, H.; Li, R.; Wang, X.; Ling, T.; Zhou, G. Strength and road performance for porous polyurethane mixture. China J. Highw. Transp. 2014, 27, 27–35. [Google Scholar]
- Wang, H.; Hu, Q.; Li, R. Study of the water-heat stability for porous polyurethane mixture. Highw. Eng. 2014, 39, 246–250. [Google Scholar]
- Lu, G.; Renken, L.; Li, T.; Wang, D.; Li, H.; Oeser, M. Experimental study on the polyurethane-bound pervious mixtures in the application of permeable pavements. Constr. Build. Mater. 2019, 202, 838–850. [Google Scholar] [CrossRef] [Scilit]
- Chen, J.; Yin, X.; Wang, H.; Ding, Y. Evaluation of durability and functional performance of porous polyurethane mixture in porous pavement. J. Clean. Prod. 2018, 188, 12–19. [Google Scholar] [CrossRef] [Scilit]
- Cong, L.; Wang, T.; Tan, L.; Yuan, J.; Shi, J. Laboratory evaluation on performance of porous polyurethane mixtures and OGFC. Constr. Build. Mater. 2018, 169, 436–442. [Google Scholar] [CrossRef] [Scilit]
- Sun, M. Research on Performance of Polyurethane Porous Elastic Pavement Mixture. Master’s Thesis, Southeast University, Dhaka, Bangladesh, 2016. [Google Scholar]
- Li, T.; Lu, G.; Wang, D.; Hong, B.; Tan, Y.; OESER, M. Key properties of high-performance polyurethane bounded pervious mixture. China J. Highw. Transp. 2019, 32, 158–169. [Google Scholar]
- Zhang, J.; Zhang, X.; Liang, M.; Jiang, H.; Wei, J.; Yao, Z. Influence of different rejuvenating agents on rheological behavior and dynamic response of recycled asphalt mixtures incorporating 60% RAP dosage. Constr. Build. Mater. 2020, 238, 117778. [Google Scholar] [CrossRef] [Scilit]
- Zhang, Y.; Luo, W.; Liu, X. Experimental studies on the dynamic viscoelastic properties of basalt fiber-reinforced asphalt mixtures. Sci. Eng. Compos. Mater. 2021, 28, 489–498. [Google Scholar] [CrossRef] [Scilit]
- Havriliak, S.; Negami, S. A Complex Plane Analysis of α-dispersions in Some Polymer Systems. In Journal of Polymer Science Part C Polymer Symposia; Wiley Subscription Services, Inc.: New York, NY, USA, 1966; pp. 99–117. [Google Scholar]
- Tschoegl, N.W. The Phenomenological Theory of Linear Viscoelastic Behavior; Springer Science & Business Media: Berlin/Heidelberg, Germany, 1989. [Google Scholar]
- Jongepier, R.; Kuilman, B.; Schmidt, R.; Puzinauskas, V.; Rostler, F. Characteristics of the rheology of bitumens. In Association of Asphalt Paving Technologists Proc; Michigan University: Ann Arbor, MI, USA, 1969. [Google Scholar]
- Rowe, G.; Baumgardner, G.; Sharrock, M. Functional forms for master curve analysis of bituminous materials. In Advanced Testing and Characterization of Bituminous Materials, Two Volume Set; CRC Press: Boca Raton, FL, USA, 2009; pp. 97–108. [Google Scholar]
- Olard, F.; Di Benedetto, H.; Eckmann, B.; Triquigneaux, J.-P. Linear Viscoelastic Properties of Bituminous Binders and Mixtures at Low and Intermediate Temperatures. Road Mater. Pavement Des. 2011, 4, 77–107. [Google Scholar] [CrossRef]
- Dobson, G.; Monismith, C.; Puzinauskas, V.; Busching, H. The dynamic mechanical properties of bitumen. In Association of Asphalt Paving Technologists Proc; Michigan University: Ann Arbor, MI, USA, 1969; pp. 123–139. [Google Scholar]
- Su, N.; Xiao, F.; Wang, J.; Amirkhanian, S. Precision Analysis of Sigmoidal Master Curve Model for Dynamic Modulus of Asphalt Mixtures. J. Mater. Civ. Eng. 2018, 30, 04018290. [Google Scholar] [CrossRef] [Scilit]
- Airey, G.D. Use of Black Diagrams to Identify Inconsistencies in Rheological Data. Road Mater. Pavement Des. 2011, 3, 403–424. [Google Scholar] [CrossRef]
- Christensen, D. Analysis of creep data from indirect tension test on asphalt concrete. J. Assoc. Asph. Paving Technol. 1998, 67, 458–492. [Google Scholar]
- Mensching, D.J.; Rowe, G.M.; Daniel, J.S.; Bennert, T. Exploring low-temperature performance in Black Space. Road Mater. Pavement Des. 2015, 16, 230–253. [Google Scholar] [CrossRef] [Scilit]
- Qin, X.; Ma, L.; Wang, H. Comparison analysis of dynamic modulus of asphalt mixture: Indirect tension and uniaxial compression test. Transp. A Transp. Sci. 2018, 15, 165–178. [Google Scholar] [CrossRef] [Scilit]
- Arefin, M.S.; Quasem, T.; Nazzal, M.; Dessouky, S.; Abbas, A.R. Accuracy of MEPDG Dynamic Modulus Predictions for Short-Term and Long-Term Aged Asphalt Mixtures. J. Transp. Eng. Part B Pavements 2019, 145, 04019025. [Google Scholar] [CrossRef] [Scilit]
- Ding, Z.; Su, J.; Li, P.; Bing, H. Mechanism of HCB-Modified Asphalt and Dynamic Properties of Mixtures. Appl. Sci. 2020, 10, 4971. [Google Scholar] [CrossRef] [Scilit]
- Chailleux, E.; Ramond, G.; Such, C.; de La Roche, C. A mathematical-based master-curve construction method applied to complex modulus of bituminous materials. Road Mater. Pavement Des. 2011, 7, 75–92. [Google Scholar] [CrossRef] [Scilit]
- Rouleau, L.; Deü, J.F.; Legay, A.; Le Lay, F. Application of Kramers–Kronig relations to time–temperature superposition for viscoelastic materials. Mech. Mater. 2013, 65, 66–75. [Google Scholar] [CrossRef] [Scilit]
- Loizos, A.; Gkyrtis, K.; Plati, C. Modelling Asphalt Pavement Responses Based on Field and Laboratory Data. In Accelerated Pavement Testing to Transport Infrastructure Innovation; Springer International Publishing: Cham, Switzerland, 2020; pp. 438–447. [Google Scholar]

Disclaimer/Publisher’s Note: The statements, opinions and data contained in all publications are solely those of the individual author(s) and contributor(s) and not of MDPI and/or the editor(s). MDPI and/or the editor(s) disclaim responsibility for any injury to people or property resulting from any ideas, methods, instructions or products referred to in the content. |
© 2026 by the authors. Licensee MDPI, Basel, Switzerland. This article is an open access article distributed under the terms and conditions of the Creative Commons Attribution (CC BY) license.