


Abstract
The state of a perovskite precursor ink is set by how its solvents coordinate the precursors, yet the roles of individual solvents in green mixtures remain poorly understood. We examine how 2-methoxyethanol (2Me) and 1,3-dimethyl-2-imidazolidinone (DMI) share the solvation of the four precursors of a formamidinium–methylammonium (FA–MA) lead iodide–bromide ink: PbI2, PbBr2, FAI and MABr. Cluster–continuum DFT calculations (r2SCAN-3c/SMD) of the exchange of 2Me for DMI in the first solvation shell show that PbI2 prefers DMI, whereas PbBr2 and MABr prefer 2Me (+4.9 and +6.3 kJ mol−1 per DMI) and FAI has no clear preference (+2.0 kJ mol−1); in FAI and MABr, 2Me donates O–H···X− hydrogen bonds. A thermodynamic model built on these energies is consistent with 2Me-rich mixtures (about 10–20 vol% DMI) as a tentative compromise. All 2Me/DMI mixtures wet PTAA, with the contact angle falling from 24.7° (2Me) to 13.3° (DMI). Without an anti-solvent (gas quenching only), the 2Me:DMI ink gives on PTAA a film with larger grains in the imaged areas than the DMF:DMSO ink, with the same absorption onset (776 nm) and a similar photoluminescence band. With literature data on blade-coated films, these results support testing 2Me/DMI for anti-solvent-free, large-area processing of FA–MA perovskites.
1. Introduction
Metal halide perovskites are among the most studied materials for solution-processed photovoltaics. Mixed-cation compositions, in which formamidinium (FA+) and methylammonium (MA+) share the A site and bromide partly replaces iodide, stabilized the perovskite phase of FAPbI3 and gave n–i–p solar cells with efficiencies above 18% [1]. In 2026, a certified steady-state efficiency of 27.17% was reported for n–i–p cells [2]. Large-area devices lag behind: the latest efficiency tables report 22.1% for a 0.08 m2 module and 19.3% for a 0.72 m2 module [3]. Reproducible fabrication and scale-up remain difficult, because film formation is sensitive to the state of the precursor solution and to the way the solvent leaves the wet film.
The solvent is an active component of the ink and not only a dissolution medium. In DMF/DMSO inks, DMSO binds PbI2 strongly and, because of its high boiling point, stays in the wet film, so the film remains undersaturated for a long time and, if left to dry, crystallizes slowly from few nuclei into a rough, incomplete layer. An anti-solvent drip removes DMF and DMSO from the wet film within seconds, raises the supersaturation abruptly and induces dense nucleation of a solvated intermediate, which is converted into the perovskite on annealing [4]; the Lewis-base adduct of PbI2 with DMSO delays crystallization and improves reproducibility [5]. DMF/DMSO inks therefore need an anti-solvent or an equivalent fast quench, and its application is hard to make uniform over large areas. Precursor solutions are generally colloidal dispersions, and their state controls crystallization kinetics and film morphology [6,7]. How strongly a solvent coordinates Pb2+ correlates with its Gutmann donor number [8], and sulfur-donor solvents bind Pb2+ more strongly than oxygen-donor solvents [9]; solvated iodoplumbate complexes in DMSO and DMF have been identified by combined DFT and UV–vis studies [10]. A donor-number picture, however, considers only the interaction with Pb2+ and ignores hydrogen-bond donation by the solvent. The interaction with the organic cation can also decide which intermediate forms: NMP interacts more strongly than DMSO with formamidinium and stabilizes a FAI–PbI2·NMP adduct [11]. For FA/MA and I−/Br− mixtures, crystallization from DMF and DMSO proceeds through several solvate phases that are set by the composition of the solution [12], and in binary mixtures the most volatile solvent dominates evaporation, so that the solvent ratio at nucleation differs from that in the ink [13].
The need for a fast supersaturation step follows from the LaMer mechanism of nucleation and growth, the framework generally used for perovskite films [14,15]. As the solvent leaves, the solute concentration rises; nucleation starts only when it exceeds a critical supersaturation and stops as soon as the nuclei consume the solute and the concentration falls below it, after which the existing nuclei only grow. A short, sharp burst of nucleation gives many nuclei at once and a dense film of uniform grains, whereas a slow rise spreads nucleation over time and gives few, non-uniform nuclei and incomplete coverage. The anti-solvent drip creates the burst by extracting the solvent abruptly, and gas quenching does so by accelerating evaporation. Where an anti-solvent cannot be applied uniformly, as in large-area coating, the burst has to come from the ink itself, that is, from the volatility of its solvents and from how strongly they bind the precursors, which sets how far the concentration must rise before nucleation. This is why the solvation of the precursors, and not only the film, has to be understood.
The DMF/DMSO pair, the most widely used, has further drawbacks. DMF is toxic, and the DMSO retained in the wet film is the main cause of dewetting of precursor solutions on hydrophobic polymer hole-transport layers such as PTAA in gas-quenching deposition: DMF evaporates first, the DMSO fraction in the wet film rises, and the contact angle approaches that of pure DMSO (45.6° on PTAA), which leaves pinholes [16]. 2-Methoxyethanol (2Me), a more volatile solvent, was introduced for methylammonium lead halide solar cells, where it gave smaller crystals and better surface coverage than DMF [17]. Weakly bonded I− ions and cluster complexes were found in 2Me inks of MAPbI3, and in FAPbI3 the cluster ratio was linked to the kinetics of δ-phase formation [18,19]. Combining 2Me with the donor solvent DMI keeps fast drying and adds a carbonyl donor for Pb2+. For an ink of (FAPbI3)0.95(MAPbBr3)0.05, a 2Me/DMI mixture with 75 μL of DMI per mL gave pinhole-free films over more than 100 cm2, n–i–p cells of 23.4% and modules of 20.1% efficiency, ahead of DMF/DMSO and 2Me/NMP inks [20]. Desorption measurements showed that DMI is removed completely at 100 °C and leaves the film at a higher temperature than NMP, which points to stronger binding to PbI2, whereas DMSO remains in the film after 1 h at 100 °C [20].
That work was a process study, and it is still unclear how 2Me and DMI divide their roles among the four components of a FA/MA lead iodide–bromide ink: PbI2, PbBr2, FAI and MABr. In contrast to that study, which optimized the ink empirically and evaluated devices, and to DFT studies of precursor solvation in DMSO and DMF [10], we resolve for each of the four precursors separately which solvent occupies the first solvation shell in a 2Me/DMI mixture, and we relate the result to the composition range used in practice. The hydroxyl group of 2Me can donate hydrogen bonds to halide anions, whereas DMI is an aprotic carbonyl donor, so the preferred solvent may differ from one precursor to another. Cluster–continuum models, which combine explicit first-shell solvent molecules with a dielectric continuum [21], are suited to this question. Quantum-chemical interaction energies have also been combined with phase-equilibrium analysis to design mixed solvents in other fields, for example, for the extractive distillation of dimethyl carbonate [22]; here the same idea, a molecular-level description of how the components of a solvent mixture share the interaction with the solute, is applied to the solvation of perovskite precursors. This work concerns the inverted p–i–n architecture, in which the perovskite ink is cast on a hydrophobic hole-transport polymer, here PTAA. The aim is to establish the molecular and processing basis for using 2Me/DMI as a solvent system for anti-solvent-free film formation over large areas. We use cluster–continuum DFT calculations to describe the exchange of 2Me for DMI in the first solvation shell of the four precursors and to derive their relative solubility as a function of the 2Me:DMI ratio, and we complement them with photographs and FTIR spectra of solutions in 2Me/DMI and in the reference solvents, UV–vis spectra, XRD patterns and SEM images of films cast from 2Me:DMI and DMF:DMSO inks on PTAA, PL spectra of films cast on glass, and contact-angle measurements on PTAA. We have not made complete solar cells or large-area films in this work, and statements about devices and large areas rely on literature data, which we state explicitly.
2. Materials and Methods
2.1. Materials
All chemicals were used as received without further purification. Lead(II) iodide (PbI2, 99.99%) and lead(II) bromide (PbBr2, 99.99%) were purchased from Tokyo Chemical Industry (TCI; Tokyo, Japan). Poly[bis(4-phenyl)(2,4,6-trimethylphenyl)amine] (PTAA, >99%), formamidinium iodide (FAI, >99.5%), methylammonium bromide (MABr, >99%), dimethylformamide (DMF, ≥99.9%), dimethyl sulfoxide (DMSO, ≥99.9%), toluene, anhydrous 2-methoxyethanol (2Me, 99.8%), 1,3-dimethyl-2-imidazolidinone (DMI, ≥99.0%), anhydrous N-methyl-2-pyrrolidone (NMP, 99.5%), methylammonium chloride (MACl, 99.99%), thiourea (≥99.999%, metals basis; Supelco) and poly(methyl methacrylate) (PMMA, Mw ≈ 100,000) were obtained from Sigma-Aldrich (St. Louis, MO, USA).
2.2. Substrate and Film Preparation
Glass substrates coated with indium tin oxide (ITO), 20 mm × 15 mm in size, were cleaned in several steps. First, mechanical cleaning was performed with a 1:10 (v:v) aqueous solution of Hellmanex™ III, followed by ultrasonic cleaning in toluene, acetone, and isopropyl alcohol (IPA) for 10 min each. Substrates were dried under nitrogen flow and treated with UV–ozone (Ossila UV Ozone Cleaner, Ossila Ltd., Sheffield, UK) for 15 min to enhance surface wettability.
A hole transport layer (HTL) was deposited by spin-coating 100 μL of a PTAA solution (1.5 mg mL−1 in toluene) at 6000 rpm for 30 s using a spin coater (Ossila Ltd., Sheffield, UK), followed by annealing at 100 °C for 10 min.
The perovskite precursor solution of composition (FAPbI3)0.95(MAPbBr3)0.05 was prepared in 2Me:DMI. For 1 mL of ink, PbI2 (525.6 mg, 1.140 mmol), FAI (196.0 mg, 1.140 mmol), PbBr2 (22.0 mg, 0.060 mmol), MABr (6.8 mg, 0.061 mmol) and MACl (6.0 mg, 0.089 mmol) were dissolved in 900 μL of 2Me and 76 μL of DMI. The mixture was kept at 60 °C for 30 min, cooled to room temperature and filtered through a 0.45 μm polytetrafluoroethylene (PTFE) syringe filter. After filtration, 17 μL of thiourea (100 mg mL−1 in DMI; 1.7 mg) and 7 μL of poly(methyl methacrylate) (PMMA, 5 mg mL−1 in DMI; 35 μg) were added, and the vial was gently shaken by hand until the additives were fully mixed. The final volume was 900 + 76 + 17 + 7 = 1000 μL; with the DMI introduced by the additive solutions (76 + 17 + 7 = 100 μL), the final solvent composition was 2Me:DMI = 900:100 μL (9:1 v/v); all other binary mixtures used in this work (2Me:NMP, DMF:DMSO and DMF:NMP) also had a volume ratio of 9:1. MACl was included because it stabilizes the intermediate phase and promotes the formation of the α-phase [23], and thiourea because it enlarges the grains, improves crystallinity and reduces pinholes in (FAPbI3)0.85(MAPbBr3)0.15 films [24].
For film deposition, 100 μL of the solution was spin-coated onto the PTAA layer in two steps: 1000 rpm for 10 s, then 5000 rpm for 60 s. Nitrogen gas quenching at 3 bar (0.3 MPa) was applied from the 10th second of the second step for 40 s, and the gas flow was stopped when the film had turned completely dark brown. The films were then annealed at 130 °C for 30 min. Reference films were prepared from the same precursor composition, with the same additives, dissolved in DMF:DMSO and processed under identical conditions.
2.3. Characterization
2.3.1. Solutions
Perovskite solutions (PVSK, 1 mL) and solutions of the individual precursors (MABr, FAI, PbI2 and PbBr2) were prepared at the concentrations of the ink (Section 2.2) in nine solvent systems: the single solvents DMF, DMSO, NMP, 2Me and DMI, and the binary mixtures DMF:DMSO, DMF:NMP, 2Me:DMI and 2Me:NMP. The PVSK solutions were photographed in glass vials. FTIR spectra of the solvents and of all solutions were recorded on an Invenio-S Fourier-transform infrared spectrometer (Bruker Optik GmbH, Ettlingen, Germany) in attenuated total reflectance (ATR) mode over 4000–400 cm−1 at 4 cm−1 resolution. For the analysis, the transmittance T was converted to absorbance, A = −log10(T/T0), with T0 the mean transmittance at 2200–2500 cm−1, and the positions of the C=O, C–O, C–H and O–H bands were obtained by fitting a Lorentzian function with a linear baseline to each band. The fit errors are 0.05–0.3 cm−1 for the narrow bands and about 1 cm−1 for the O–H band; each spectrum was recorded once, so the reproducibility between measurements was not tested.
2.3.2. Films
Films were cast from the 2Me:DMI and DMF:DMSO inks as described in Section 2.2. Their absorption spectra were recorded over 550–900 nm on a Shimadzu UV-3600 spectrophotometer (Shimadzu Corporation, Kyoto, Japan) in transmission mode, using films deposited on glass/ITO/PTAA substrates (glass/ITO/PTAA/perovskite); a bare glass/ITO substrate was used as the reference. The spectra were smoothed with a Savitzky–Golay filter (21 nm window, third-order polynomial). The absorption onset was taken as the intersection of the tangent at the steepest point of the absorption edge with the baseline above the edge. Because no direct thickness measurement was made, the thicknesses of the two films were compared through their absorbances: for the same absorption coefficient, the ratio of the film thicknesses equals the ratio of the absorbances at the same wavelength (here 600 nm, corrected for the baseline at 800–830 nm, according to the Beer–Lambert law). This comparison neglects reflection and scattering, and an absolute thickness was not derived. X-ray diffraction (XRD) patterns of the films, deposited on ITO-coated substrates, were recorded on a Rigaku MiniFlex 600 diffractometer (Rigaku Corporation, Tokyo, Japan) with Cu Kα radiation over 2θ = 5–45° in steps of 0.02°. The background was subtracted, and the patterns were smoothed with a Savitzky–Golay filter (9 points, 0.18°; third-order polynomial); peak positions, heights and widths were obtained from pseudo-Voigt fits to the unsmoothed data. The surface morphology of the films was examined with a JSM-IT210 scanning electron microscope (SEM; JEOL Ltd., Tokyo, Japan) in secondary-electron mode under high vacuum, at an accelerating voltage of 8 kV, a working distance of 11.0 mm and a magnification of 8000×; images were acquired with InTouchScope software. Grain sizes were determined from the images shown in the figure by watershed segmentation (Gaussian smoothing, markers from local intensity maxima; scikit-image), excluding grains that touch the image border; the equivalent diameter of each grain, 2(A/π)1/2 with A the area, was calculated with the scale of the image. For presentation, the images were denoised with a non-local-means filter and their contrast was stretched. Steady-state photoluminescence (PL) spectra were recorded on a FluoTime 300 spectrometer (PicoQuant GmbH, Berlin, Germany) with excitation at 420 nm on films cast from the two inks on bare glass. For presentation, the spectra were smoothed with a Savitzky–Golay filter (7 points, i.e., 12 nm; third-order polynomial) and interpolated with a cubic spline; the peak positions and intensities quoted in the text are the maxima of the unsmoothed spectra.
2.3.3. Wetting
Static contact angles were measured on a KRÜSS DSA25 drop-shape analyzer (KRÜSS GmbH, Hamburg, Germany) by the sessile-drop method at 20.0 °C in air. Drops (2 μL; three per composition) of 2Me/DMI mixtures (2Me:DMI from 10:0 to 0:10 by volume, in steps of 1) were placed on PTAA films prepared as in Section 2.2, and the angle was taken from the fitted drop profile at the moment of contact (0.00 s) as the mean of the left and right angles and of the three drops. The contact angles of the inks themselves (with the dissolved precursors and additives) were not measured.
2.4. Computational Details
All quantum-chemical calculations were performed with ORCA 6.1.1 [25]. Each solvate cluster was treated in three steps. Initial geometries were optimized with GFN2-xTB (xtb version 6.8.0) [26], in the gas phase for lead halides and MABr and in the ALPB implicit model (methanol) for FAI, which prevents N–H···I− proton transfer in the gas phase (no proton transfer occurred in the MABr clusters: N–H ≤ 1.08 Å and H···Br− ≥ 2.05 Å). The geometries were then re-optimized with r2SCAN-3c [27] and the SMD implicit solvation model [28], with the def2 effective core potential on Pb and the continuum parametrized as 2Me for all clusters. The thermal correction to the free energy, (G−Eel), was obtained from GFN2-xTB harmonic frequencies at 298.15 K, with the quasi-RRHO treatment of low-frequency modes [29,30]. For lead halides and the free solvents, the r2SCAN-3c geometry was first re-optimized with GFN2-xTB with tight criteria, and all these structures are minima without imaginary frequencies. For ion pairs, the xTB re-optimization changed the structure qualitatively (a contact ion pair turned into a pair separated by a solvent molecule), so their frequencies were calculated directly at the r2SCAN-3c geometry in ALPB(methanol); the free 2Me and DMI molecules of the ion-pair series were treated in the same way, so that E and G–Eel belong to the same geometry. Small imaginary modes of the ion pairs (|ν| ≤ 50 cm−1; the largest was 37 cm−1) were excluded from the thermal correction. The free energy of each structure is
The first solvation shell was described by explicit solvent molecules and the rest of the medium by a dielectric continuum (cluster–continuum approach [21]). Further details of the protocol are given in Section S1 of the Supporting Information.
2.4.1. Sensitivity Tests
The thermochemical level was tested on 15 representative structures (both solvents; b = 0, 2 and 4 for the four precursors and b = 1 for PbBr2), which were re-optimized at the r2SCAN-3c/SMD(2Me) level with tight criteria; analytical harmonic frequencies were calculated at the same level (scheme B, Table S1). For PbI2, PbBr2 (b = 2, 4) and MABr, scheme B changes ΔGb by 1.5–4.8 kJ mol−1 relative to the scheme described above (scheme A). For FAI the change is larger (+6 to +20 kJ mol−1, almost entirely from the thermal term), so the magnitude of ΔGb of FAI depends on the thermochemical level; ΔG4 of FAI nevertheless remains positive, and the preference for 2Me becomes stronger. In eight of the 15 structures, small imaginary modes remained after the optimization. Displacing the structure along these modes and re-optimizing removed the mode only for MABr at b = 4; in the other seven structures, the optimization returned to nearly the same geometry and modes (−43 to −195 cm−1), which points to numerical noise of the analytical Hessian (integration grid, continuum discretization) and not to true saddle points. Treating these modes as real low-frequency modes changes ΔGb by at most 5.6 kJ mol−1. Varying the quasi-RRHO cut-off between 50 and 150 cm−1 shifts ΔGb by at most 2.6 kJ mol−1, whereas pure RRHO changes it by up to 10 kJ mol−1 (Table S2). The sensitivity to the continuum and to the electronic-structure method was tested with single-point calculations at the r2SCAN-3c/SMD(2Me) geometries (Table S3): (a) CPCM [31] instead of SMD; (b) CPCM with the dielectric constant and refractive index of DMI (ε = 37.6, n = 1.472) instead of those of 2Me; and (c) ωB97M-V/def2-TZVP/SMD(2Me) [32,33] for representative species. Changing the continuum from 2Me to DMI alters the exchange energy by at most 1.8 kJ mol−1 per DMI molecule, and ωB97M-V alters it by at most 3.0 kJ mol−1 per DMI molecule, in no case with a change of sign. The difference between SMD and CPCM is larger (up to 6.2 kJ mol−1 per DMI molecule), because CPCM lacks the non-electrostatic terms (cavitation, dispersion, solvent structure) that SMD includes; we regard SMD as the more complete model and treat the difference as a model-type uncertainty. With CPCM the sign changes only for two FAI isomers with |ΔEb| < 2 kJ mol−1.
2.4.2. Species in Solution
Each precursor was considered separately, as if dissolved alone in the solvent. The species assumed for each follows from the nature of its bonds. PbI2 and PbBr2 are polar covalent halides of the soft Lewis acid Pb2+, which has a flexible, high coordination number and gains energy by binding donor atoms of the solvent; they were therefore treated as neutral molecular solvate complexes PbX2(solvent)4, in which both Pb–X bonds are kept and the solvent donor atoms occupy the remaining coordination sites. In the optimized structures the Pb–X distances remain at 3.10–3.16 Å (Pb–I) and 2.81–2.86 Å (Pb–Br) for every composition (Figure S1b), so the halides stay bound to Pb and are not released as free ions. FAI and MABr, in contrast, are ionic salts, in which cation and halide are held by electrostatic attraction. At the contact distance of about 3.8 Å, this attraction amounts to 1389/(ε·3.8) ≈ 22 kJ mol−1 in 2Me (ε = 16.9) and ≈ 10 kJ mol−1 in DMI (ε = 37.6), several times kT (2.5 kJ mol−1 at 298 K), and the Bjerrum length [34] (33 and 15 Å, Section S2 of the Supporting Information) exceeds the contact distance; in these solvents the ions therefore remain associated as contact ion pairs and not as free solvated ions, and the contact ion pair was taken as the ionic species. Free ions, solvent-separated pairs and iodoplumbate anions (PbX3−, PbX42−), which form when halide from FAI or MABr is added to PbX2, were not included, so the model describes each precursor separately and not the complete ink.
2.4.3. Solvate Cluster Models
For PbI2 and PbBr2 the coordination bond between Pb2+ and the O-donor atom of the solvent is decisive, and strong Lewis bases are needed to dissolve the halides [5,9]. The solvent properties used in the model are collected in Table 1.
Table 1.
Properties of 2Me and DMI used in the model (25 °C).
Lead halides were modelled as neutral octahedral solvate complexes PbX2(2Me)4−b(DMI)b (X = I, Br; b = 0–4), with the two halides in axial positions and four solvent molecules in the equatorial plane; for b = 2 the cis and trans isomers were calculated separately. FAI and MABr were treated as contact ion pairs (see above and Section S2 of the Supporting Information). Their first solvation shell has four sites (n = 4): two cation sites at N–H groups, to which the solvent O atom binds through N–H···O hydrogen bonds, and two anion sites around the halide, where 2Me binds through O–H···X− hydrogen bonds, whereas aprotic DMI can form only weak C–H···X− contacts. Isomers were calculated separately for each number of DMI molecules at the cation (c = 0–2) and anion (a = 0–2) sites, with b = c + a and statistical weight g = C(2,c)·C(2,a). Free 2Me and DMI molecules were calculated with the same protocol as each series. One starting structure was built with RDKit [35] for each b and (c, a) arrangement, and no systematic conformer search was made. In the GFN2-xTB re-optimization, several contact ion pairs converted spontaneously into pairs separated by a solvent molecule, so solvent-separated ion pairs may also be competitive; the results for FAI and MABr therefore refer to the contact-ion-pair model, and their quantitative reliability is limited by conformational sampling, which was not assessed.
2.4.4. Thermodynamic Model
Solubility in the mixed solvent was derived from ligand-exchange equilibria without calculating the solid phase. For a dissolved species M (PbI2, PbBr2, FAI or MABr), the replacement of b molecules of 2Me by b molecules of DMI in the first shell is
with the cumulative free energy of exchange, relative to the all-2Me complex,
ΔGb is thus cumulative; the increment of the b-th exchange is ΔGb–ΔGb−1. The number of molecules is conserved, so no standard-state correction is needed. Isomers with the same b are combined by Boltzmann weighting,
where gi is the statistical weight, that is, the number of distinct placements of the b DMI molecules on the n sites of the idealized site model. The optimized geometries depart partly from this model (bidentate 2Me, migration of 2Me into the second shell), so g is an approximate combinatorial factor. The concentration of each complex in a saturated solution is
where φ is the volume fraction of DMI, Sref is the solubility in pure 2Me, CDMI and C2Me are the pure-liquid concentrations (Table 1), and a2Me and aDMI are the activities of the unbound solvents, found self-consistently from the mass-balance equations (Section S3 of the Supporting Information, Equations (S1) and (S2); Equation (5) is also derived there). DFT gives only relative quantities, so relative solubilities Ssat(φ)/Ssat(0) are reported. The free energies refer to the 1 mol L−1 standard state in the continuum. Because the exchange reaction conserves the number of molecules, the standard-state corrections cancel in ΔGb, and converting the 1 mol L−1 equilibrium constant to activities relative to the pure liquids gives the factor (CDMI/C2Me)b in Equation (5). Activities refer to the unbound solvents, with the pure liquids as the reference state (ai = 1) and ideal mixing; the activity coefficient of the solute is taken as unity. Because the solute binds part of the solvent, Ssat(0) is close to, but not identical with, Sref, and Sref does not cancel exactly in Ssat(φ)/Ssat(0); all relative values are normalized to Ssat(0) of the same solution. Since no calibration point is available, the calculations of Section 3.3 and Section 3.4 and the speciation in Figure S2 were made in the dilute limit (Sref = 10−6 mol L−1), in which the bound solvent is negligible and Sref cancels exactly; the dependence on Sref (0.1, 0.5 and 1.0 mol L−1) is shown in Figure S3. The sensitivity to errors in ΔGb was estimated by shifting it by ±4 kJ mol−1 per DMI molecule. This value is an upper bound of the method errors found in the sensitivity tests above (electronic-structure method ≤3.0 and continuum composition ≤1.8 kJ mol−1 per DMI molecule; quasi-RRHO cut-off ≤2.6 kJ mol−1). The larger SMD–CPCM difference is a model-type uncertainty discussed above, and for FAI the sensitivity to the thermochemical level (up to 20 kJ mol−1 at b = 4, about 5 kJ mol−1 per DMI molecule) exceeds this band. The band represents the method error only; the sampling error (conformers, contact versus solvent-separated ion pairs) and the model assumptions below were not quantified. The model assumes ideal mixing of the solvents and a precipitating solid that is the pure precursor, and it neglects iodoplumbate species (PbX3−, PbX42−).
3. Results and Discussion
3.1. Structure of the Solvate Clusters
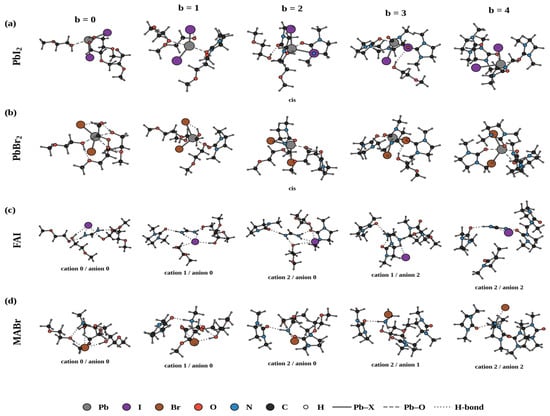
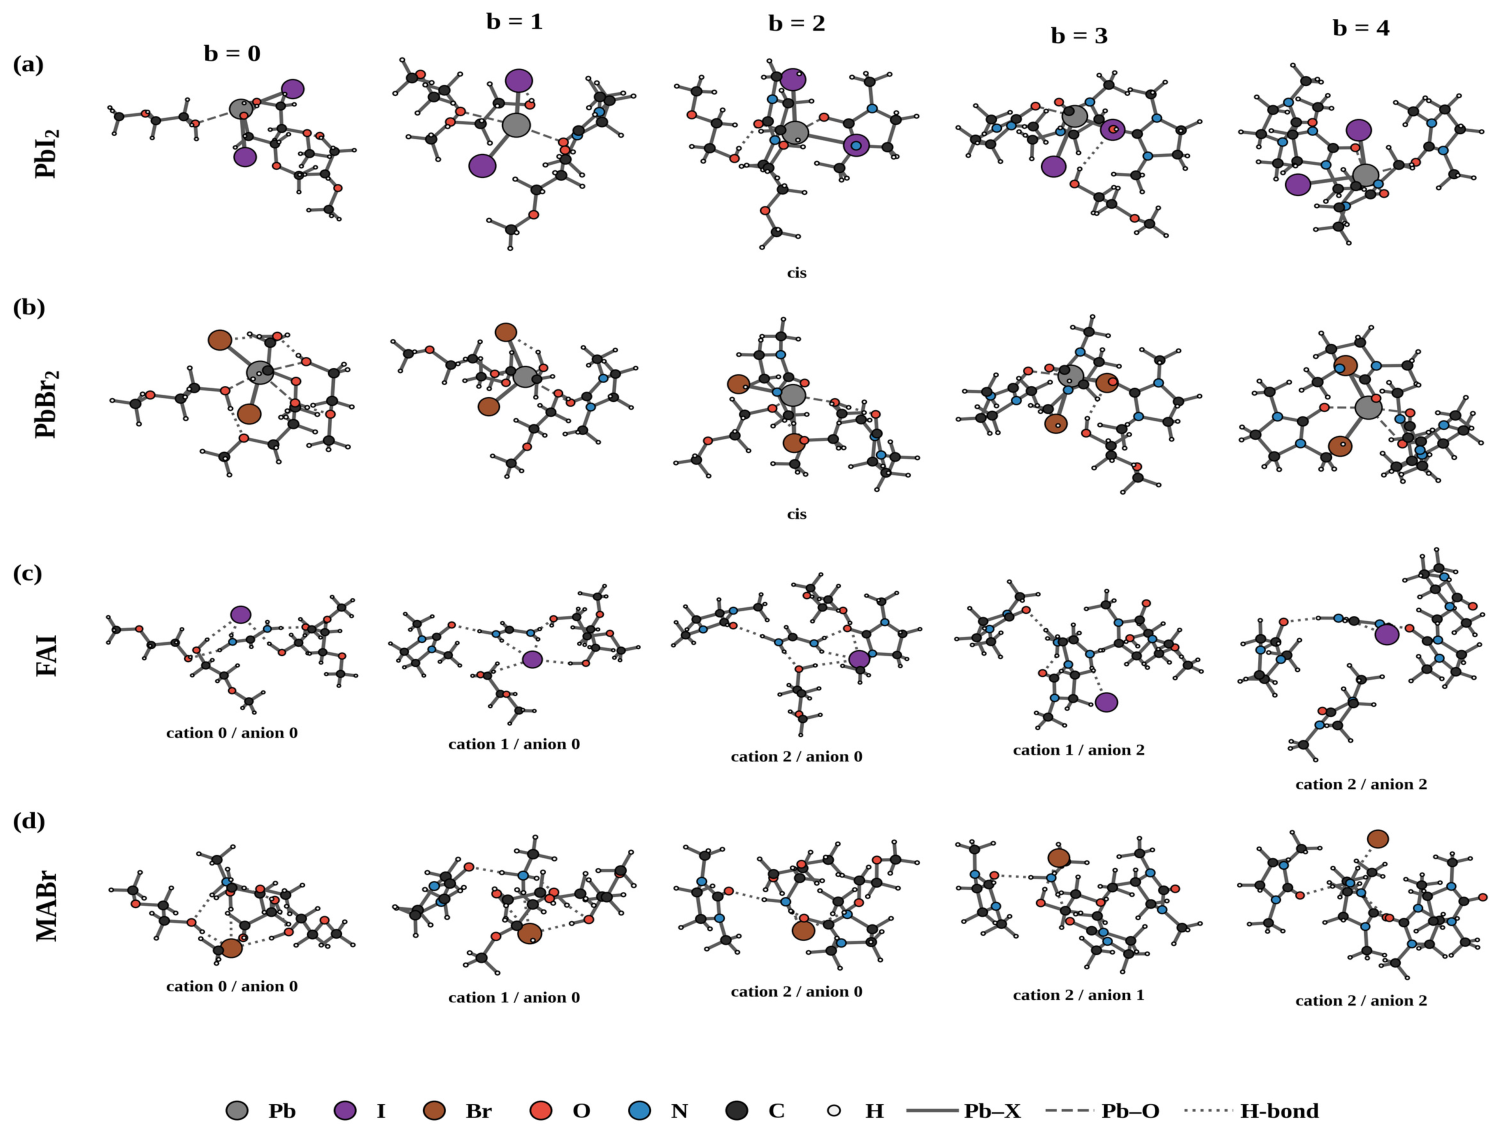
Figure 1 shows the most stable solvate cluster at each step of the exchange series. In PbI2 and PbBr2, Pb2+ departs from the initial octahedral coordination: part of the 2Me binds Pb through two oxygen atoms (hydroxyl and ether), and another part moves to the second shell and binds the halide through O–H···X hydrogen bonds. In PbI2 the two iodine atoms change from trans to cis from b = 2 onward, and the mean Pb–I distance increases from 3.10 to 3.16 Å with b (Figure S1b), which indicates that stronger coordination of DMI to Pb weakens the Pb–I bond; the Pb–Br distance hardly changes. In FAI and MABr the cation and anion stay a contact ion pair. DMI first occupies the cation sites (c = b, a = 0 for b ≤ 2), and 2Me keeps O–H···X− hydrogen bonds around the anion; the O–H···Br− distance (2.31–2.35 Å) is markedly shorter than O–H···I− (2.61–2.70 Å) (Figure S1d), so bromide forms stronger hydrogen bonds with 2Me.
Figure 1.
Solvate clusters optimized at the r2SCAN-3c/SMD(2Me) level: complexes of (a) PbI2, (b) PbBr2, (c) FAI and (d) MABr with b = 0–4 coordinated DMI molecules. The isomer with the lowest free energy is shown for each b; the isomer type for PbX2 at b = 2 (cis/trans) and the numbers of DMI molecules at the cation and anion sites for FAI and MABr are given below each panel. Solid lines are covalent and Pb–X bonds, dashed lines are Pb–O coordination bonds, and dotted lines are N–H···O and O–H···X− hydrogen bonds.
3.2. Energetics of Ligand Exchange
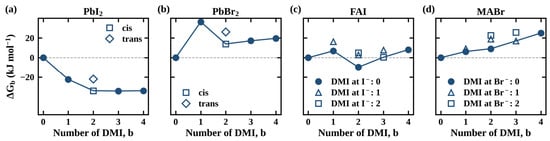
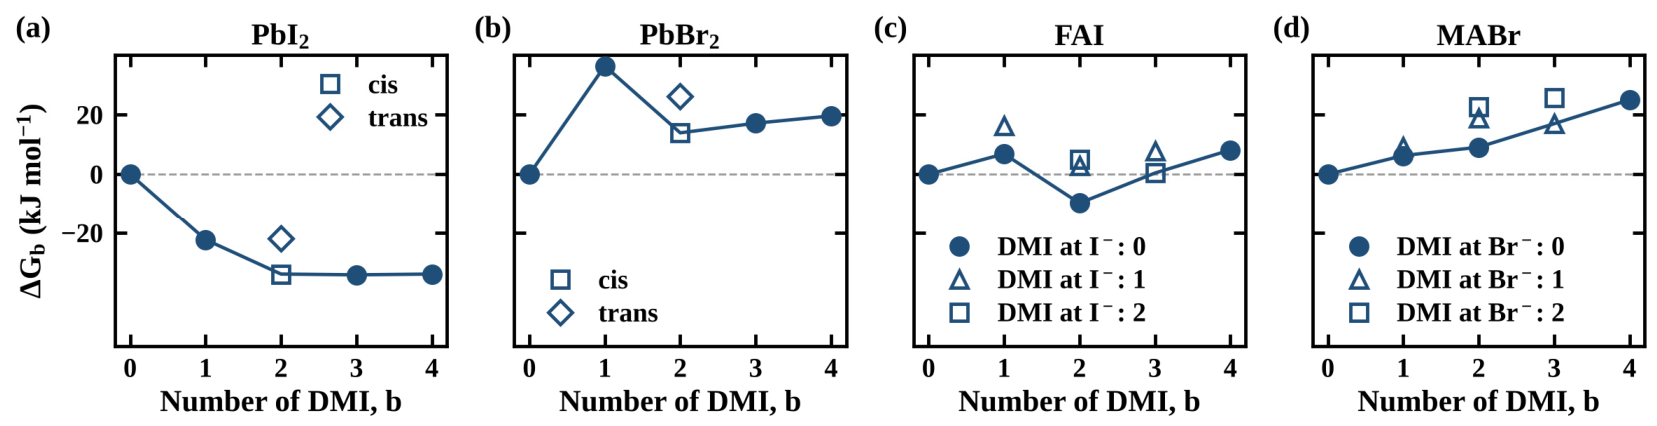
The cumulative exchange free energies ΔGb (Figure 2) divide the four precursors into two groups. For PbI2, ΔGb is negative and drops quickly for the first two DMI molecules (−22.2 and −33.8 kJ mol−1 at b = 1 and 2); the third and fourth exchanges add almost nothing (cumulative −34.0 and −33.8 kJ mol−1 at b = 3 and 4, increments of −0.2 and +0.2 kJ mol−1). DMI thus displaces 2Me from the first shell of PbI2, but the effect saturates after the second DMI molecule. At b = 2 the cis isomer is 11.9 kJ mol−1 more stable than the trans isomer. For PbBr2, FAI and MABr the full-exchange energy is positive (ΔG4 = +19.6, +8.2 and +25.0 kJ mol−1), so 2Me is the better solvating solvent for PbBr2 and MABr. For FAI the preference is weak and depends on the thermochemical level: the electronic exchange energy at b = 4 is slightly negative (ΔE4 = −1.6 kJ mol−1, Table S3), so the positive ΔG4 comes from the thermal term, which is +8.2 kJ mol−1 in the scheme used here and +28.0 kJ mol−1 with the full r2SCAN-3c/SMD thermochemistry (Table S1).
Figure 2.
Free energies ΔGb (Equation (3)) of the cumulative exchange of 2Me for DMI in the first solvation shell (relative to the all-2Me complex) as a function of the number of coordinated DMI molecules, b: (a) PbI2, (b) PbBr2, (c) FAI and (d) MABr. For PbX2 the cis and trans isomers at b = 2 are shown with different markers; for FAI and MABr the number of DMI molecules at the anion site (a = 0, 1, 2) is shown with different markers. The line connects the Boltzmann-effective values of the isomers at the same b. Negative values indicate that DMI coordination is thermodynamically favored. T = 298.15 K.
For FAI and MABr this follows from the O–H···X− hydrogen bonds that 2Me forms with the halide anion. At b ≤ 2, placing DMI at an anion site is unfavorable: the isomers with a = 1 and a = 2 lie 9.5–14.8 kJ mol−1 (FAI) and 2.1–13.5 kJ mol−1 (MABr) above the a = 0 isomer, whereas placing DMI at a cation site is favorable for FAI (ΔG2 = −9.7 kJ mol−1 for c = 2, a = 0). The calculations thus show the opposite roles of the two solvents: DMI solvates the cation, and 2Me solvates the anion. Because bromide is a stronger hydrogen-bond acceptor than iodide, the effect is stronger in MABr, whose ΔGb stays positive for all b.
For PbBr2 the preference for 2Me may likewise be related to O–H···Br hydrogen bonds (Figure 1b). The value at b = 1 (+36.4 kJ mol−1), however, is higher than that at b = 2 (+13.9 kJ mol−1), which means that the second exchange alone would release 22.5 kJ mol−1 (ΔG2–ΔG1), an irregularity unusual for successive exchanges; it is accompanied by a sharp increase in the mean Pb–O distance (Figure S1a). Part of this irregularity is an artifact of the xTB thermal correction: with the full r2SCAN-3c/SMD thermochemistry, ΔG1 falls to +25.6 kJ mol−1 (Table S1). The remaining irregularity (ΔG1 > ΔG2) and the long Pb–O distance suggest that the b = 1 complex is still not the global minimum; no systematic conformer search was made (Section 2.4), so the quantitative PbBr2 values should be regarded as less certain than those of the other precursors.
3.3. Relative Solubility in the Mixed Solvent
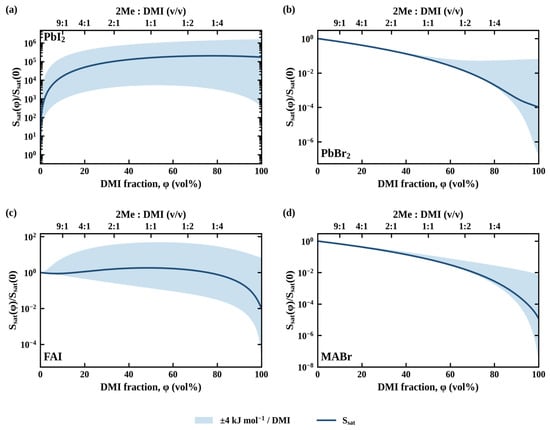
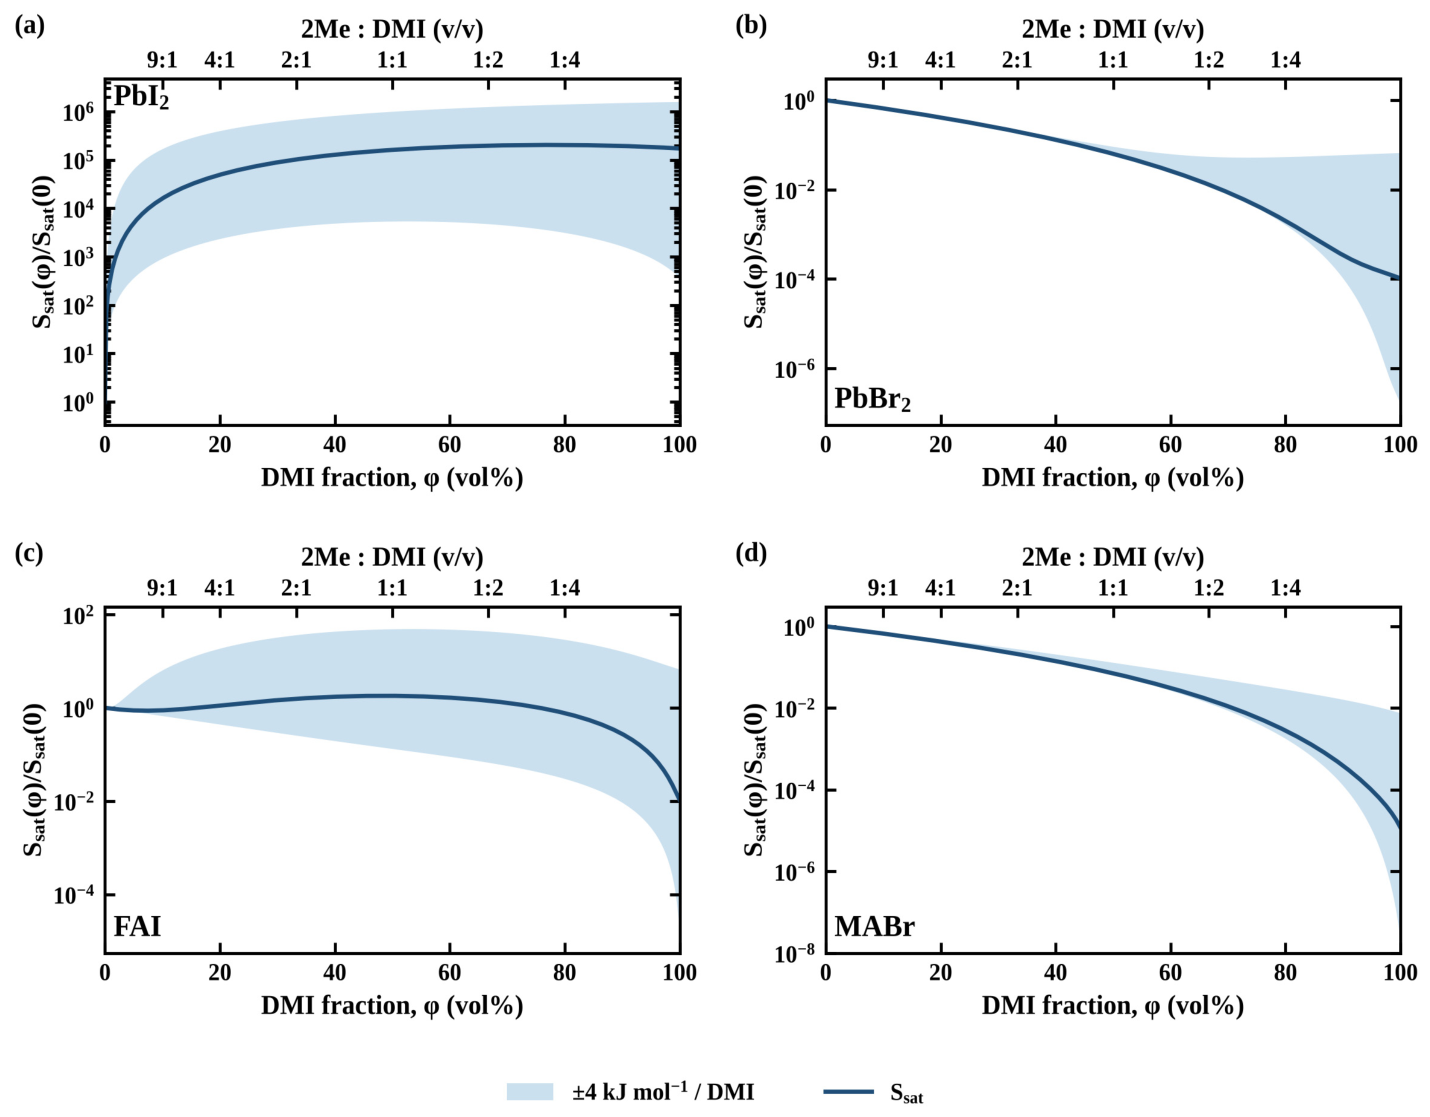
The relative solubility Ssat(φ)/Ssat(0) calculated from Equation (5) and the mass balance is shown in Figure 3. For PbI2 the solubility rises steeply on adding DMI: in the dilute limit, 10 vol% DMI increases it by a factor of about 1.6·104, φ = 40% gives about 1.3·105, and the curve levels off at about 2·105 near φ = 80%. These values refer to the dilute limit. At realistic concentrations (Sref = 0.1–1 mol L−1), each dissolved PbI2 binds four solvent molecules, so the mass balance limits the increase: the solubility rises by a factor of 2–10 at 10 vol% DMI and by 5–25 in the 1:1 mixture (Figure S3); the shape of the curve is unchanged. Because these numbers depend exponentially on ΔGb, the ±4 kJ mol−1 uncertainty changes them by several orders of magnitude (shaded band in Figure 3a), and the reliable conclusion is the shape of the curve, a steep rise at small DMI fraction followed by saturation, in line with Figure 2. For PbBr2 and MABr, in contrast, the solubility decreases as DMI is added: in the 1:1 mixture it is about 14–16 times lower than in pure 2Me, and in pure DMI about 104 times (PbBr2) and 9·104 times (MABr) lower. The solubility of FAI stays nearly constant up to φ ≈ 80% (0.8–1.8 times that in pure 2Me, with a small maximum near the 1:1 mixture) and falls sharply only near pure DMI (about 102 times lower). These variations lie within the ±4 kJ mol−1 band, and with the full r2SCAN-3c thermochemistry the preference of FAI for 2Me is stronger (Table S1), so the reliable conclusion for FAI is that its solubility does not decrease appreciably up to φ ≈ 80%. The solubility limit of PbI2 is therefore expected at low DMI fractions and that of the other three precursors at high DMI fractions. The distribution of solvate complexes (Figure S2) shows the mechanism: in PbI2 the all-2Me complex disappears at a very small DMI fraction, PbI2(2Me)2(DMI)2 dominates between φ ≈ 2% and 56%, PbI2(2Me)(DMI)3 between 57% and 86%, and the full DMI complex above 86%; in PbBr2 and MABr the all-2Me complex dominates up to φ ≈ 90%, and mixed complexes appear only in a narrow range near pure DMI; in FAI the mixed complex with two DMI molecules at the cation and two 2Me molecules at the anion is the main species from φ ≈ 16% to 98%. In a mixed solvent the two solvents together thus create the optimal solvation environment for FAI.
Figure 3.
Relative saturation solubility Ssat(φ)/Ssat(0) of the precursors as a function of the DMI volume fraction φ, calculated with Equation (5) and the mass balance: (a) PbI2, (b) PbBr2, (c) FAI and (d) MABr. The solid line is calculated with the computed ΔGb; the shaded band is the range obtained by shifting ΔGb by ±4 kJ mol−1 per DMI molecule (method error, Section 2.4). The curves are calculated in the dilute limit (Sref = 10−6 mol L−1); for realistic concentrations see Figure S3. The upper axis gives the 2Me:DMI volume ratio.
3.4. Overall Solvation Preference and Tentative Composition Range
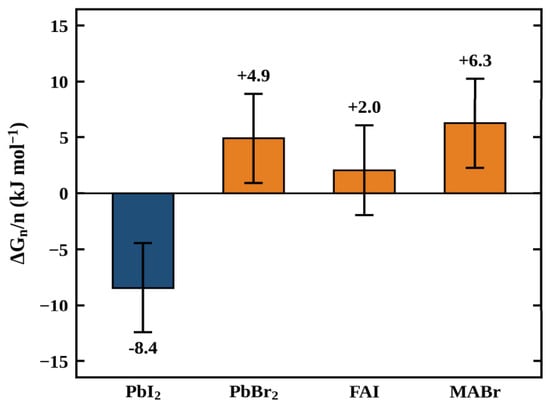
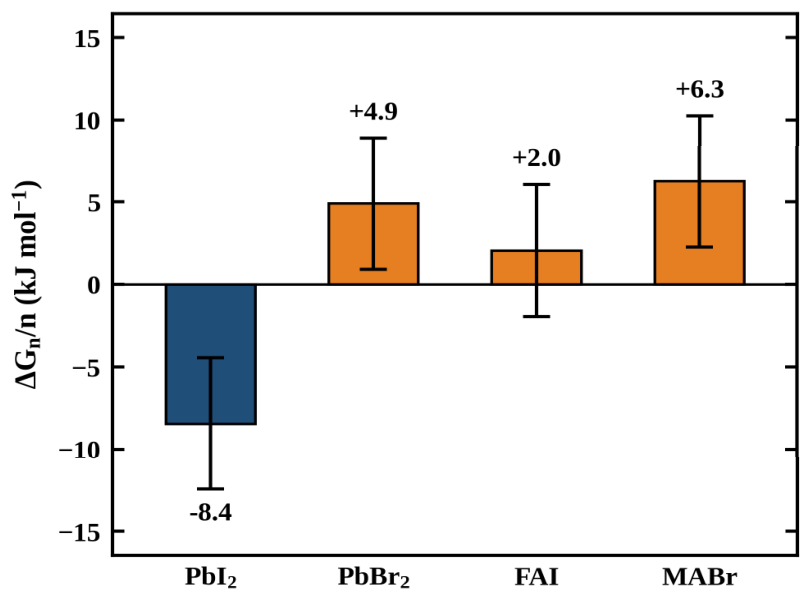
The full-exchange free energy per DMI molecule, ΔGn/n (Figure 4), summarizes the four precursors: −8.4 kJ mol−1 for PbI2 and +4.9, +2.0 and +6.3 kJ mol−1 for PbBr2, FAI and MABr. With the ±4 kJ mol−1 uncertainty, the sign is unchanged for PbI2, PbBr2 and MABr (for PbBr2 the error bar ends close to zero), whereas the value for FAI lies within the error band, so FAI shows no clear preference for either solvent. The calculations point to a trade-off: PbI2 needs only a small DMI fraction, because its gain saturates after two DMI molecules, whereas the solubility of PbBr2 and MABr falls steadily as DMI is added and that of FAI stays nearly constant up to φ ≈ 80%. A 2Me-rich mixture is therefore expected to suit all four precursors best. The composition range of about 10–20 vol% DMI that follows from the model is not a prediction: the calculated solubilities depend exponentially on ΔGb, and without an experimental solubility as a calibration point (Section S3 of the Supporting Information), the absolute limits cannot be derived. We use the range only as a consistency check. The empirical optimum of 75 μL of DMI per mL of ink (7.5 vol%) reported for blade-coated films of the same composition [20], and the ink used here (Section 2.2; 10 vol% DMI, 76 μL per mL before the additive solutions), lie at or slightly below the lower edge of this range, so the agreement is only approximate. Two further limitations apply. The ink contains 1.14 M PbI2 and only about 0.9 M DMI, that is, fewer than one DMI molecule per PbI2, so the dilute-limit picture, in which DMI is in large excess over the solute, does not apply directly (Figure S3). PbBr2 and MABr, whose solubility decreases with DMI, are present at only about 0.06 M each, so they are far from their solubility limits in a 2Me-rich mixture. The range should therefore be regarded as tentative.
Figure 4.
Full-exchange free energy per DMI molecule, ΔGn/n (n = 4); error bars are ±4 kJ mol−1 (method error, Section 2.4). A negative value indicates that DMI is preferentially solvating, a positive value that 2Me is.
3.5. Dissolution of the Precursors in 2Me/DMI and Reference Solvents
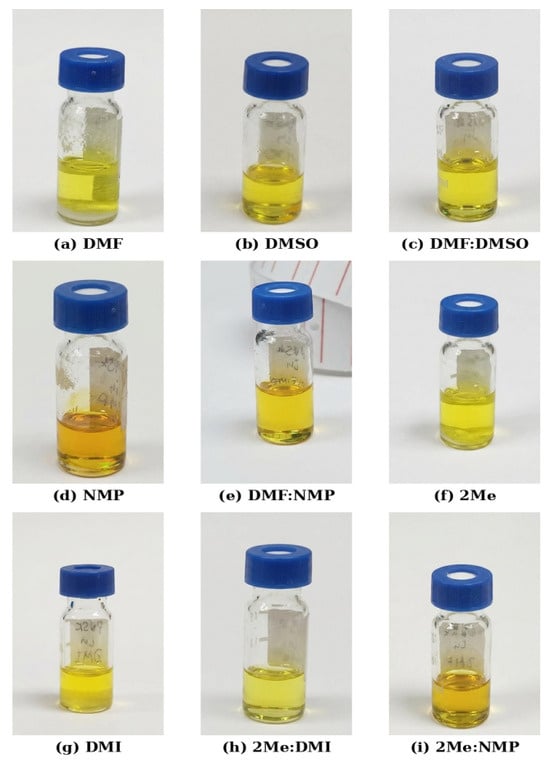
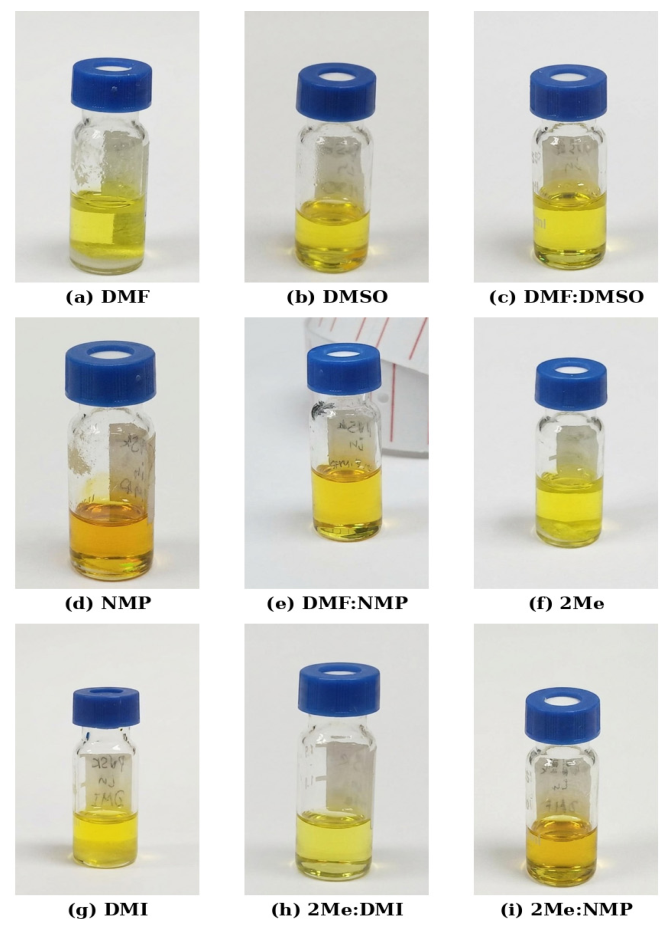
To test whether the 2Me/DMI mixture can hold the precursors in solution, perovskite solutions in green and conventional solvents were photographed (Figure 5). Besides 2Me:DMI and DMF:DMSO, the series contains two NMP-containing mixtures as controls: NMP is the Lewis-base co-solvent that was benchmarked against DMI in 2Me-based inks [20], it binds the formamidinium cation and stabilizes a FAI–PbI2·NMP adduct [11], and DMF:NMP is its counterpart in the DMF-based pair. Comparing 2Me:NMP with 2Me:DMI, and DMF:NMP with DMF:DMSO, separates the effect of the co-solvent from that of the main solvent (2Me or DMF), and the single solvents show the contribution of each component. All solutions, including those based on 2Me, DMI, 2Me:DMI and 2Me:NMP, are clear and show no visible turbidity or precipitate, so the green solvents keep the precursors in solution, with no visible undissolved material, at the concentration of the ink (about 1.2 M Pb). The 2Me:DMI solution is pale yellow, like the DMF:DMSO reference, whereas the NMP-containing solutions (Figure 5d,i) are a deeper yellow-orange; this difference was not investigated here.
Figure 5.
Photographs of perovskite precursor solutions in different solvents: (a) DMF, (b) DMSO, (c) DMF:DMSO, (d) NMP, (e) DMF:NMP (conventional formulations); (f) 2Me, (g) DMI, (h) 2Me:DMI, (i) 2Me:NMP (alternative and green formulations).
3.6. FTIR Spectra of the Precursor Solutions
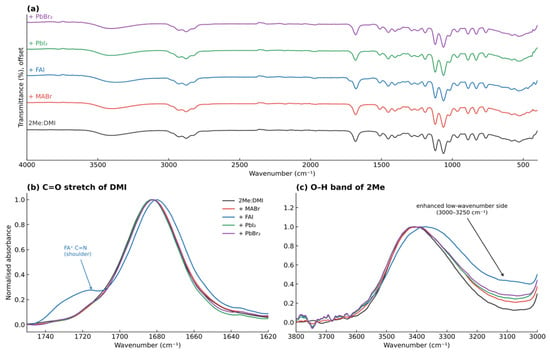
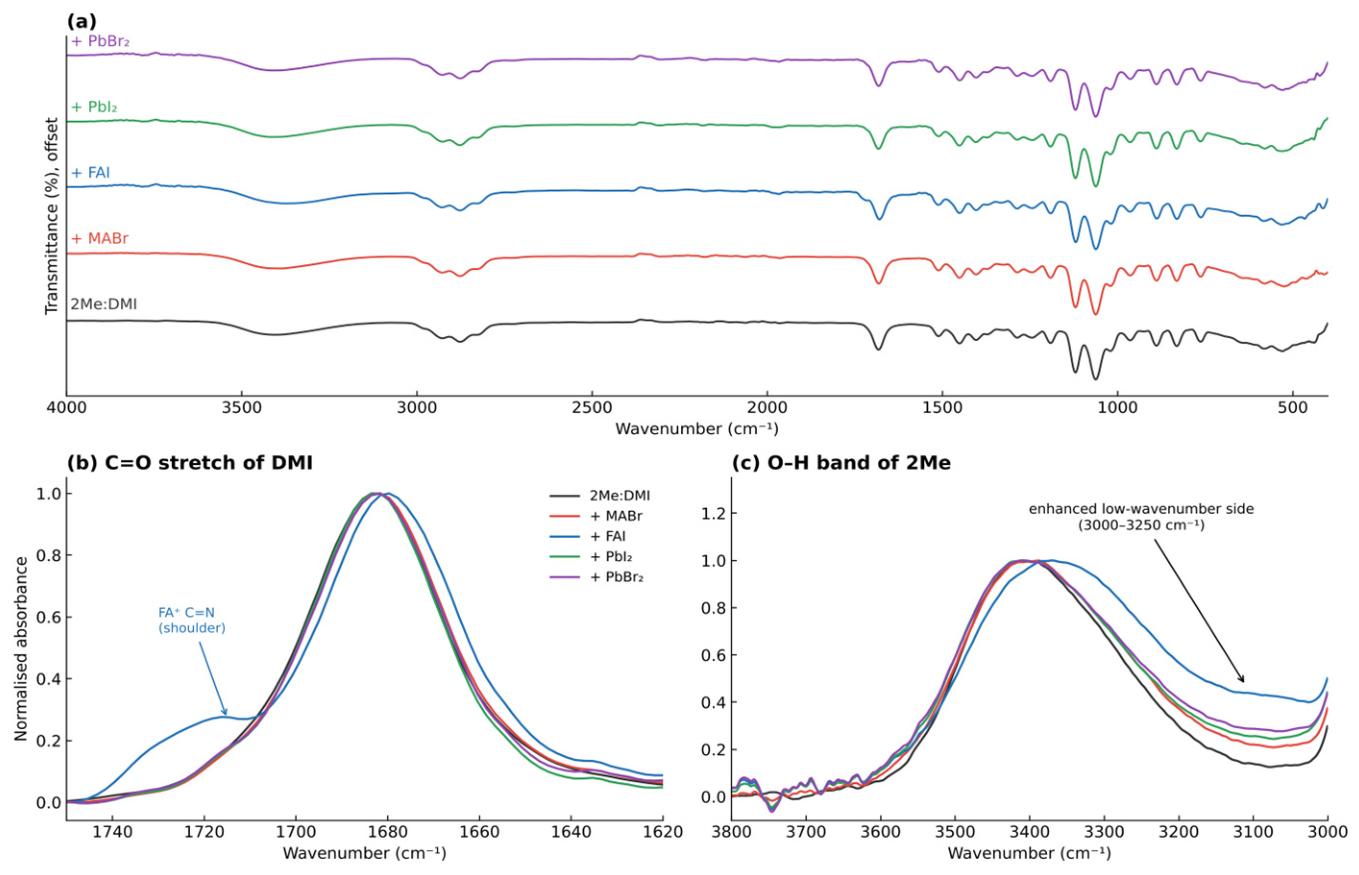
Figure 6 compares the spectrum of the 2Me:DMI binary solvent with those of solutions containing MABr, FAI, PbI2 and PbBr2. The spectra show the C=O stretch of DMI near 1683 cm−1, the C–O stretching bands of 2Me at 1120–1050 cm−1 and the broad O–H band of 2Me near 3400 cm−1, so both solvents remain available as donors in the mixture. The spectra of the conventional solvents and of the other formulations are given in Figures S4–S6 and are dominated by the same kind of solvent bands: ν(C=O) near 1660 cm−1 for DMF and NMP, ν(S=O) near 1050 cm−1 for DMSO and ν(O–H) near 3400 cm−1 for 2Me. The DFT results predict that the carbonyl oxygen of DMI binds Pb2+ and the N–H groups of FA+ and MA+, and that the hydroxyl group of 2Me hydrogen-bonds to halide anions. In the harmonic r2SCAN-3c/SMD(2Me) spectra of representative clusters (Table S4), the C=O stretch of DMI shifts by only −3 to −13 cm−1 relative to free DMI (b = 4 complexes: −5.5 cm−1 for PbI2, −13.2 for PbBr2, −2.6 for FAI and −4.0 for MABr), and the O–H stretch of 2Me by −120 to −420 cm−1 because of O–H···X− hydrogen bonding. The calculated frequencies are harmonic and unscaled, and only shifts relative to the free solvent are used.
Figure 6.
FTIR spectra of the 2Me:DMI binary solvent and of solutions containing the precursors (MABr, FAI, PbI2 and PbBr2): (a) 4000–400 cm−1 (offset vertically), (b) C=O stretching region and (c) O–H stretching region of the absorbance spectra normalized to the band maximum. The arrow in (b) marks the shoulder of the FAI solution near 1715 cm−1 and that in (c) the enhanced low-wavenumber side of the O–H band.
The measured band positions are given in Table 2. The C=O band of DMI lies at 1682.8 cm−1 in 2Me:DMI, and it shifts by −0.7 cm−1 on adding MABr, by −0.6 cm−1 on adding PbBr2 and not at all (0.0 cm−1) on adding PbI2. The C–O and C–H bands of the solvent move by 0.8 cm−1 or less. Only the FAI solution shows a larger change in the C=O region: the band is shifted by −3.2 cm−1 (to 1679.6 cm−1), is slightly broader and has an additional shoulder near 1715 cm−1 (Figure 6b). The shift agrees with the calculated value for FAI (−2.6 cm−1), but the shoulder is most probably the C=N stretching band of FA+, which lies in the same region and would distort the position of the C=O band, and a shift of 3 cm−1 is below the resolution of the measurement (4 cm−1); we therefore do not treat it as evidence of coordination. For PbI2 and PbBr2, for which the largest shifts are calculated (−5.5 and −13.2 cm−1), none is observed. The calculated values refer to complexes in which DMI occupies all four sites, whereas the band measured is an average over all DMI molecules, bound and free, in a mixture that contains 90 vol% of 2Me, so the shifts are expected to be much smaller; this is consistent with the observation but does not allow us to test the calculated values.
Table 2.
Positions of the main IR bands of 2Me:DMI and of its solutions of the precursors, from Lorentzian fits (cm−1), and their shifts relative to 2Me:DMI in parentheses. The fit errors are 0.05–0.3 cm−1; the resolution of the measurement is 4 cm−1.
The O–H band of 2Me (maximum near 3400 cm−1) shows a clearer change: its low-wavenumber side (3000–3250 cm−1) is stronger in all four solutions than in 2Me:DMI (Figure 6c). At 3100 cm−1 the absorbance, normalized to the band maximum, is 0.14 for 2Me:DMI and rises to 0.22 (MABr), 0.26 (PbI2), 0.29 (PbBr2) and 0.44 (FAI). This is the direction expected for O–H···X− hydrogen bonds, and for PbI2 and PbBr2 it cannot be caused by N–H groups. However, the N–H stretching bands of FA+ and MA+ absorb in the same region, and water taken up by the hygroscopic salts, whose content was not determined, also increases the absorbance there, so the change cannot be assigned to coordination quantitatively. The spectra thus show qualitative changes in the C=O and O–H regions in the direction predicted by the calculations, apart from the missing shifts for PbX2, but they are single measurements, the shifts are at or below the resolution, and they are not used as independent evidence for the calculated coordination pattern. The spectra also show that the solvents remain chemically intact and that no new strong bands other than those of the cations appear when the precursors are dissolved.
3.7. Optical and Structural Properties of the Films
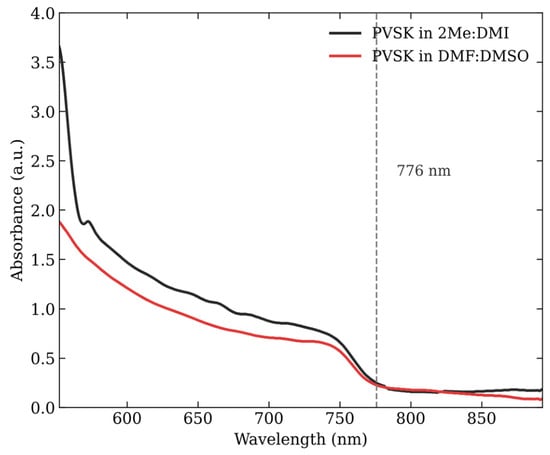
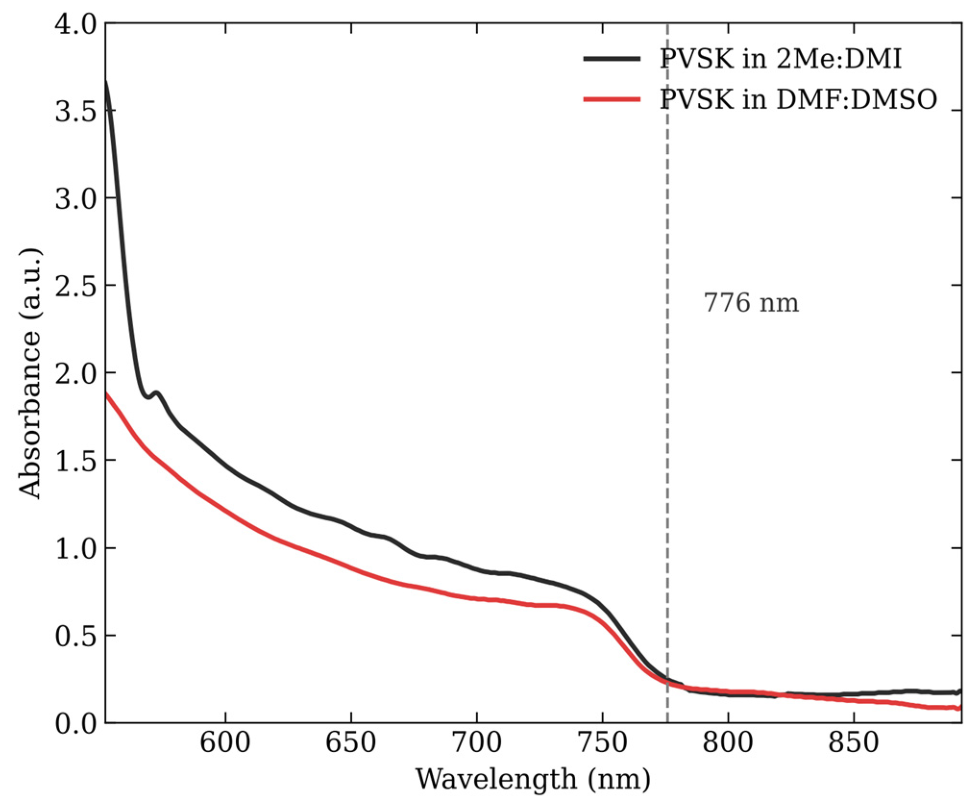
The absorption spectra of the perovskite films prepared from the 2Me:DMI and DMF:DMSO inks are compared in Figure 7. Both films have the absorption onset at 776 nm (1.60 eV; tangent method, Section 2.3), the steepest part of the edge at 760 nm and the same low background above 800 nm, so the choice of solvent does not change the position of the edge. The 2Me:DMI film absorbs more strongly at shorter wavelengths, with a steep rise below 570 nm, and shows weak shoulders near 575, 645, 665 and 685 nm that are absent from the DMF:DMSO spectrum. Stronger absorbance was likewise found for films from 2Me inks with an optimized DMI content [20]. A higher absorbance can reflect a thicker or more strongly scattering film. The shoulders are not features of a single-phase three-dimensional perovskite edge; they may come from additional absorbing species, such as residual intermediate or lower-dimensional phases, or from optical interference in the film, and their origin is not resolved by these data. Because of this, no conclusion on film quality is drawn from the absorption spectra beyond the position of the band edge. The absorbance of the 2Me:DMI film at 600 nm (baseline-corrected) is about 1.25 times that of the DMF:DMSO film (1.31 and 1.05), so, if the absorption coefficients are equal, the 2Me:DMI film is about 25% thicker, which accounts at least in part for its stronger absorbance. The thickness was not measured directly (profilometry or cross-sectional SEM), and the comparison neglects reflection and scattering. The XRD patterns (Figure 8) are discussed below.
Figure 7.
UV–vis absorption spectra of perovskite (PVSK) films prepared from the 2Me:DMI and DMF:DMSO inks. The dashed line marks the absorption onset at 776 nm.
Figure 8.
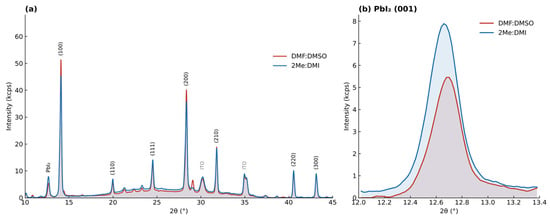
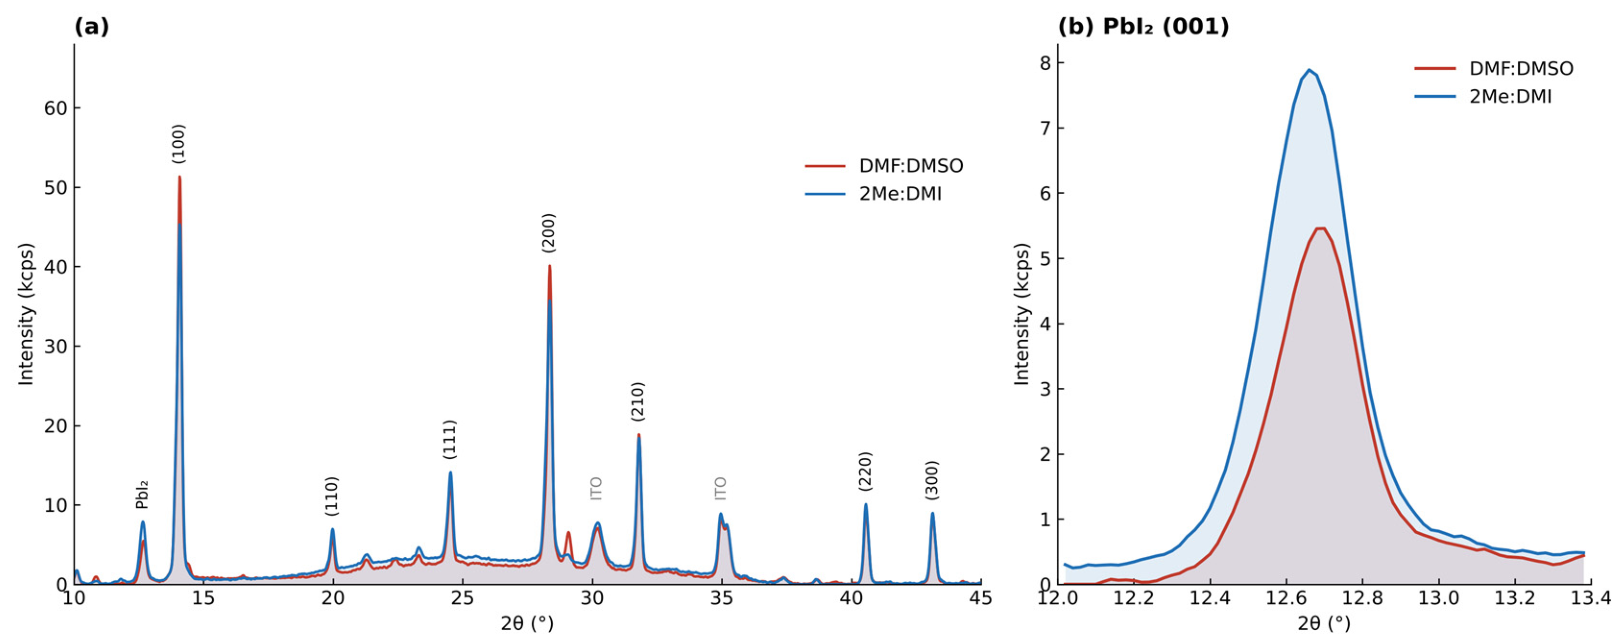
XRD patterns of perovskite films cast from the DMF:DMSO and 2Me:DMI inks (background subtracted, smoothed as described in Section 2.3): (a) 10–45° with the reflections of the cubic perovskite phase indexed and those of ITO marked; (b) the PbI2 (001) reflection.
The XRD patterns of the two films (Figure 8a) show the reflections of the cubic α-phase of the perovskite at 14.1°, 20.0°, 24.5°, 28.4°, 31.8°, 40.6° and 43.1° (indexed as (100), (110), (111), (200), (210), (220) and (300) of a cubic cell) and those of the ITO substrate at 30.2° and 35.0°. Both films also contain residual PbI2, with its (001) reflection at 12.7° (Figure 8b); the height ratio of the PbI2 (001) and perovskite (100) reflections is 0.10 for the film from DMF:DMSO and 0.17 for that from 2Me:DMI, so the 2Me:DMI film contains somewhat more PbI2 (a semi-quantitative comparison of peak heights, which also depend on film thickness and preferred orientation). The ratio of the (200) and (100) heights is the same in both films (0.74 and 0.73), so the orientation of the grains does not differ appreciably. The full width at half maximum of the (100) reflection is 0.19° for DMF:DMSO and 0.22° for 2Me:DMI; XRD therefore does not indicate larger crystalline domains in the 2Me:DMI film, although the width also depends on the instrument and on microstrain and is not converted into a crystallite size here. Weak reflections at 8.3°, 10.1°, 21.3° and 23.3°, which we have not assigned, are present in both patterns, and a reflection at 29.1° is present only in the pattern of the DMF:DMSO film. The origin of the absorption shoulders in Figure 7 is not explained by the XRD patterns. One pattern of each film is shown.
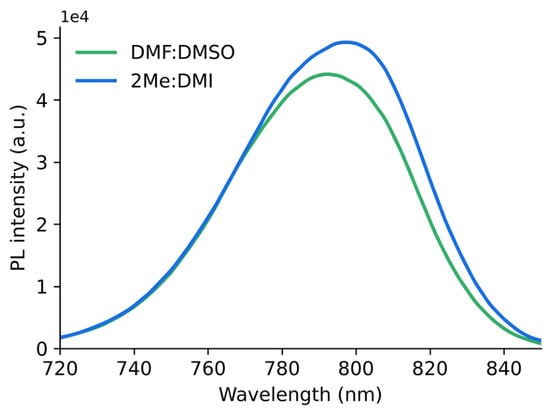
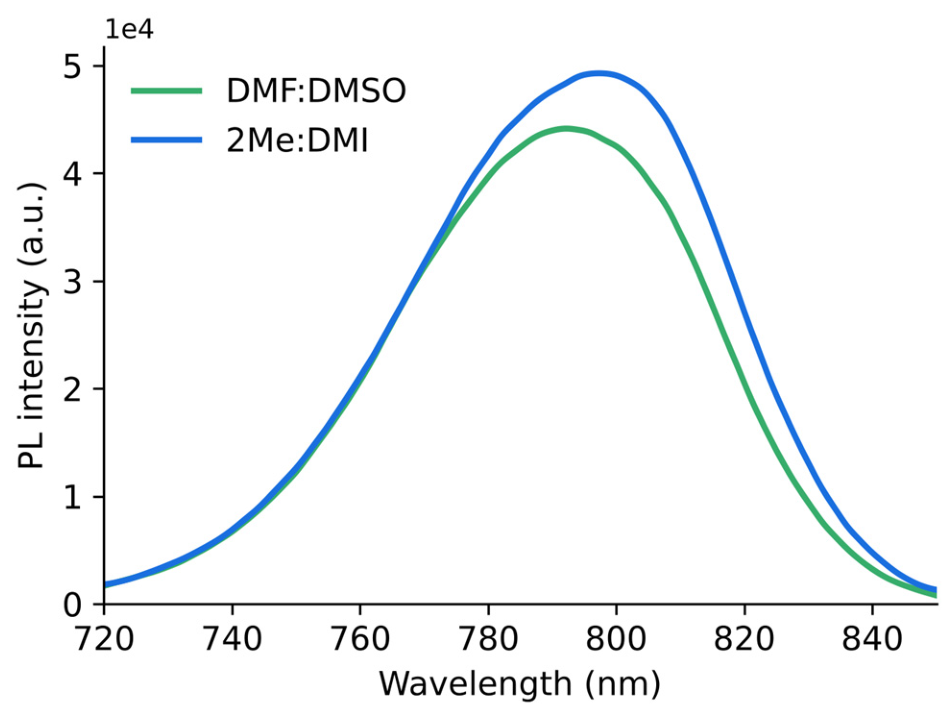
Steady-state PL spectra of films cast on glass from the two inks are compared in Figure 9. Both films show a single emission band with a maximum at 796 nm for 2Me:DMI and 792 nm for DMF:DMSO and with the same width (full width at half maximum about 57 nm). The maxima lie at longer wavelengths than the absorption onset at 776 nm, and the 4 nm difference between the films is small, so the solvent system does not change the emission band of the absorber appreciably, in agreement with the identical absorption edge. The peak intensity of the 2Me:DMI film is about 11% higher than that of the DMF:DMSO film. This difference is not evidence of fewer non-radiative losses: PL intensity also depends on film thickness, surface roughness and light out-coupling, and one film of each type was measured, and the 2Me:DMI film is estimated to be about 25% thicker. The films were measured on glass and not on PTAA, and no time-resolved PL or PL with transport layers was recorded, so carrier lifetimes are not discussed.
Figure 9.
Steady-state PL spectra of perovskite films cast from the DMF:DMSO and 2Me:DMI inks on glass. The spectra were smoothed as described in Section 2.3.
3.8. Wetting of PTAA by 2Me/DMI Mixtures
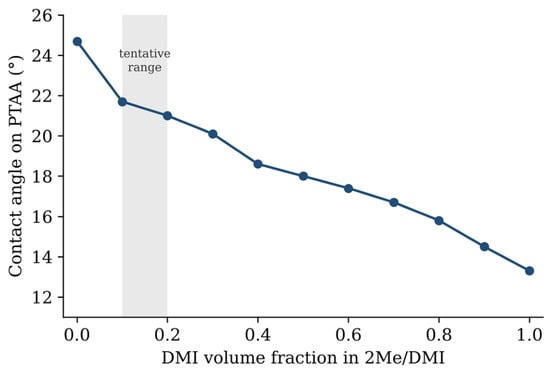
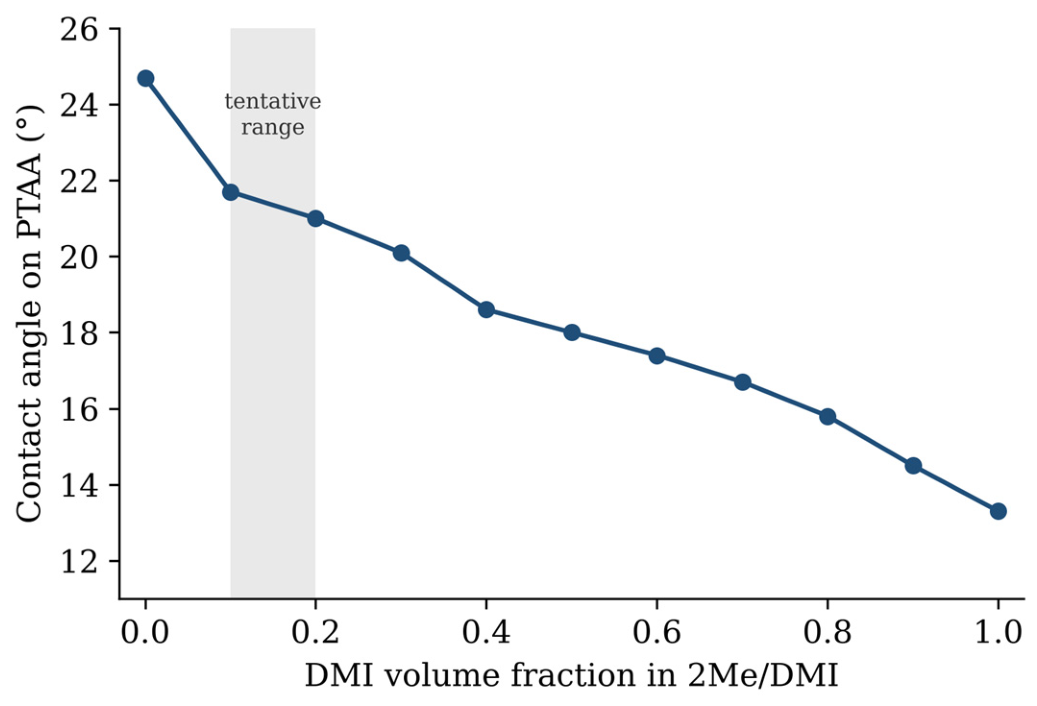
Figure 10 and Table S5 show the contact angle of the 2Me/DMI mixtures on PTAA (drop profiles in Figure S7). All compositions wet PTAA well, with angles between 24.7° for pure 2Me and 13.3° for pure DMI. The angle decreases monotonically as the DMI content rises. The largest single change occurs at the first addition of DMI (24.7° to 21.7° at 10 vol%); beyond this the angle falls almost linearly, by 0.6–1.5° per 10 vol% of DMI, and the total change over the whole range is 11.4°. For comparison, DMSO, DMF and NMP give 45.6°, 25.6° and 12.0° on PTAA [16] (a different PTAA film, so the values are comparable only in trend): pure DMI wets PTAA about as well as NMP and 2Me about as well as DMF, whereas DMSO wets it much worse.
Figure 10.
Contact angle of 2Me/DMI mixtures on PTAA as a function of the DMI volume fraction. The shaded band marks the 10–20 vol% DMI range that is consistent with the calculations as a tentative compromise for dissolving all four precursors (Figure 3).
In the tentative composition range suggested by the calculations (10–20 vol% DMI), the contact angle changes only from 21.7° to 21.0°, a difference of 0.7° that is probably within the experimental uncertainty (the scatter of the three drops is not reported), so wetting does not discriminate between compositions inside this range; it only shows that none of them suffers from poor wetting. The wetting behavior also changes during drying, which is what matters in gas-quenching deposition: the volatile 2Me (boiling point 124 °C) leaves the wet film first and the DMI fraction (boiling point 225 °C) rises, so the contact angle is expected to fall towards that of pure DMI. In DMF:DMSO the opposite happens: DMF leaves first, and the angle approaches that of DMSO, the poorest wetting solvent [16]. A high DMI content, although it favors wetting, slows drying and may retain solvent in the film, so a mixture with 10–20 vol% DMI appears to be a reasonable compromise. The measurements were made with the solvent mixtures alone; the dissolved precursors can change the angle and the surface tension, which were not determined. The contact angles of the inks themselves were not measured. The two inks contain the same precursors at the same concentrations and the same additives and differ only in the solvent system, so a difference in wetting is expected to originate mainly from the solvent; the effect of the dissolved salts on surface tension and viscosity, however, was not verified in either solvent system, and the wetting argument therefore rests on the solvent mixtures and on literature data for DMF:DMSO.
3.9. Film Morphology and Choice of the Reference Solvent
3.9.1. Choice of the Two Systems
Films were cast from 2Me:DMI and DMF:DMSO only, although nine solvent systems (five single solvents and four binary mixtures) were examined in solution. DMF:DMSO was taken as the reference because inks of this type are the basis of the solvent-engineering route [4,5], and in a direct comparison of inks with the same (FAPbI3)0.95(MAPbBr3)0.05 composition, 2Me/DMI gave the highest efficiency (23.45%) ahead of DMF/DMSO (22.73%) and 2Me/NMP (22.29%) [20]. NMP-containing mixtures were not taken to the film stage because the 2Me/NMP ink has a narrower processing window and a lower efficiency than 2Me/DMI [20], and DMF:NMP still contains the toxic DMF and is therefore not a green alternative. Single solvents were not taken to the film stage because the calculations show that neither 2Me nor DMI alone is the best solvent for all four precursors (Section 3.4), which is the reason for combining them; the single-solvent solutions served only to show the contribution of each component. The solution results do not separate the remaining formulations: all solutions are clear (Figure 5), the FTIR bands of the solvent change by 4 cm−1 or less on adding the precursors (Figure 6), and the films from 2Me:DMI and DMF:DMSO have the same absorption onset at 776 nm (Figure 7). Both inks therefore give absorbers with the same band edge, so a difference between the films can be attributed to the solvent system and not to a different composition.
3.9.2. Morphology
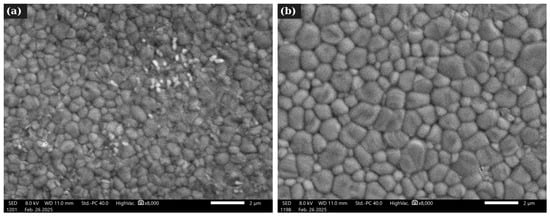
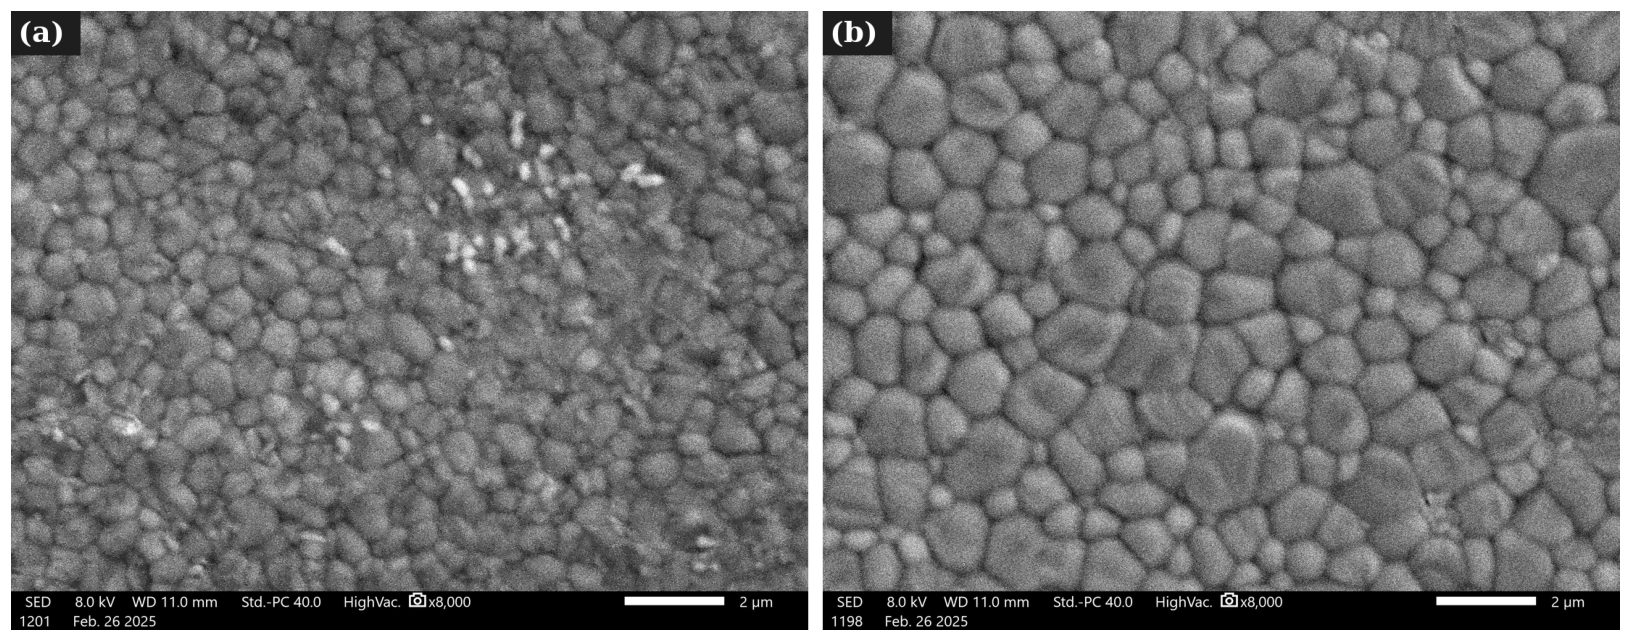
Figure 11 compares the films. The film from DMF:DMSO (Figure 11a) consists of small, closely packed grains of about 0.4–1 μm, with clusters of bright elongated particles a few hundred nanometers long in some areas. The film from 2Me:DMI (Figure 11b) is built from larger grains of about 0.6–2 μm with well-defined boundaries and without such particles. Both films are continuous in the imaged areas and no pinholes are seen in either, so the images show a difference in grain size and not in coverage; the homogeneity was assessed visually only. The composition of the bright particles was not determined. A burst of nucleation gives many small grains, and slower nucleation gives fewer, larger ones (Section 1), so the different grain sizes may reflect different nucleation behavior of the two inks, but the present data do not resolve this. The wetting results point in the same direction: all 2Me/DMI mixtures wet PTAA (Figure 10), whereas DMSO is the poorest wetting solvent of the DMF/DMSO pair on PTAA, and dewetting caused by the DMSO fraction left in the wet film leads to pinholes in gas-quenching deposition [16]. The DMF:DMSO film imaged here shows no pinholes, so the SEM images neither show nor exclude this effect; the contact angles of the inks themselves were not measured, and one area of each film was imaged. Both inks contain the same additives (MACl, thiourea and PMMA), so the difference cannot be attributed to them. Together, the DFT, wetting and SEM results indicate that, under the same gas-quenching conditions, the 2Me:DMI ink gives on PTAA a film of larger grains than the DMF:DMSO ink in the imaged areas, which supports the use of a 2Me-rich mixture as a green alternative. Grain sizes were measured on the two images shown in Figure 11 (Section 2.3): the mean equivalent grain diameter is 0.64 ± 0.17 μm for DMF:DMSO (473 grains) and 0.81 ± 0.22 μm for 2Me:DMI (294 grains), with medians of 0.62 and 0.79 μm; the distributions are given in Figure S8. The values refer to one area of each film, the grains are not independent samples of the film, and the automatic segmentation splits some large grains in the 2Me:DMI image, which lowers its mean, so the difference of about 25% should be read as an estimate for the imaged areas and not as a statistical result for the films. The ranges quoted above are read from the scale bars of the images shown; the statistics above and the ranges differ because the ranges describe the visible spread of grain sizes and not their mean.
Figure 11.
Top-view SEM images (secondary electrons, 8000×) of perovskite films cast from (a) DMF:DMSO and (b) 2Me:DMI on PTAA. Scale bars, 2 μm. The images were denoised (non-local-means filter) and their contrast was stretched; no other processing was applied.
3.10. Implications for Large-Area, Anti-Solvent-Free Processing
Large-area coating places requirements on the ink that the results above address in part. First, the ink must stay dissolved at a high concentration. The 1.2 M inks in 2Me:DMI are clear (Figure 5), and the calculations explain why some DMI is needed and why only a little: DMI raises the solubility of PbI2 (by orders of magnitude in the dilute limit and by about 2–25 times at realistic concentrations, Figure S3), with most of the gain from the first two DMI molecules (Figure 2a and Figure 3a), whereas a 2Me-rich solvent keeps PbBr2, FAI and MABr in solution (Section 3.4). The calculations give this trend and not the exact composition, because absolute limits need a solubility calibration point that DFT cannot supply (Section S3 of the Supporting Information). The composition rests on experiment: in blade-coated films of the same composition, 25–50 μL of DMI per mL of ink gave pinholes because DMI was too little to retard nucleation, 125 μL gave defective films, and the optimum was 75 μL [20]. The DMI content therefore cannot be reduced without limit; the workable range is narrow and is of the order of 10 vol% DMI, consistent with the direction of the calculated trend but not derived from it.
Second, the wet film must spread completely. All 2Me/DMI compositions wet PTAA (Figure 10), and the film from 2Me:DMI is continuous and built from larger grains than the DMF:DMSO film (Figure 11). Third, the intermediate formed after solvent extraction must survive the time that large-area coating takes before annealing. For 2Me/DMI, no δ-phase and no growth of PbI2 were found after 5 min in ambient air before annealing, whereas the DMF/DMSO intermediate (diethyl ether quenching) degraded to PbI2 and the 2Me/NMP intermediate formed δ-phase [20]. This stability is consistent with the preference of PbI2 for DMI found here (Figure 2a). DMI nevertheless leaves the film completely at 100 °C within about 10 min, whereas DMSO remains after 1 h [20].
Fourth, no anti-solvent is needed. Our films were formed by nitrogen gas quenching alone, and 2Me/DMI inks have been processed by air-flow-assisted blade coating, again without an anti-solvent, into films over more than 100 cm2 and modules of 20.1% efficiency [20]. Gas quenching can possibly be reduced further. During natural drying, nucleation in 2Me/DMI starts after about 1 min and the intermediate forms over 1–5 min [20], and 2Me is volatile, so a 2Me-rich ink with the lowest DMI content that still dissolves PbI2 might crystallize even without quenching, which would remove the main equipment requirement of the method. This is a hypothesis: it was not tested here, our films were gas-quenched, and low DMI contents led to fast, inhomogeneous crystallization under air quenching [20]. Films cast with systematically reduced DMI content, with and without quenching, on blade- or slot-die-coated areas, and the resulting solar cells, are the experiments that would decide it. We also note that 2Me is itself a hazardous solvent (a reproductive toxicant) that needs closed handling, so the benefit of the 2Me/DMI system lies in its processing (no anti-solvent, a volatile main solvent, complete removal of DMI at 100 °C) and not in the absence of hazard.
4. Conclusions
Cluster–continuum DFT calculations show that DMI and 2Me play different roles in the solvation of the four precursor components of a FA/MA lead iodide–bromide ink. PbI2 prefers DMI, with most of the stabilization gained from the first two DMI molecules, whereas PbBr2 and MABr prefer 2Me and FAI shows only a weak preference that depends on the thermochemical level. In FAI and MABr, 2Me occupies the anion sites through O–H···X− hydrogen bonds, while DMI preferentially solvates the cation. A thermodynamic model built on these free energies predicts that the solubility of PbI2 rises steeply and then saturates on adding DMI, while the solubility of PbBr2 and MABr falls and that of FAI stays nearly constant up to φ ≈ 80%, so that a 2Me-rich mixture is expected to be the best compromise for a single ink; the composition range of about 10–20 vol% DMI is a consistency check with experiment and not a prediction. All 2Me/DMI mixtures wet PTAA (21–22° at 10–20 vol% DMI). Without an anti-solvent (gas quenching only), the 2Me:DMI ink gives on PTAA a continuous film of larger grains than the DMF:DMSO ink in the imaged areas, with the same absorption onset (776 nm) and a similar PL band (maxima at 796 and 792 nm); no pinholes were found in either film in the imaged areas. XRD shows the cubic α-phase in both films, with somewhat more residual PbI2 in the 2Me:DMI film (PbI2 (001)/perovskite (100) height ratio 0.17 against 0.10) and no larger crystalline domains; the 2Me:DMI film is estimated to be about 25% thicker from the absorbance. Combined with literature data on blade-coated films and modules, these results support 2Me:DMI as a solvent system for anti-solvent-free, large-area processing, with a narrow, 2Me-rich composition range set by PbI2 solubility on one side and by the solubility of the other precursors and the nucleation rate on the other. The calculations give relative solubilities only, assume ideal mixing of the solvents and use a continuum parametrized for 2Me; the uncertainty from conformational sampling and from the contact-ion-pair model was not quantified. Large-area films, solar cells and modules, films with reduced DMI content with and without gas quenching, and the contact angles of the inks remain to be reported.
Supplementary Materials
The following supporting information can be downloaded at: https://www.mdpi.com/article/10.3390/coatings16111329/s1. It contains the detailed computational protocol (Section S1), the model of ion pairs and the conformational sampling (Section S2), the details of the thermodynamic model (Section S3), the geometric parameters (Section S4, Figure S1) and speciation (Figure S2) of the clusters, the sensitivity tests of the free energies (Section S5, Tables S1–S3, Figure S3), the calculated IR shifts and the FTIR spectra of the precursors in the reference solvents (Section S6, Table S4, Figures S4–S6), the contact-angle data (Section S7, Table S5, Figure S7), the grain-size distributions (Section S8, Figure S8) and the data and code of the calculations (Section S9); Figure S1: Main geometric parameters as a function of the number of coordinated DMI molecules, b: (a) mean Pb–O and (b) mean Pb–X distances (PbI2, PbBr2); (c) shortest N–H···O and (d) shortest O–H···X− hydrogen-bond distances (FAI, MABr). Open markers are all isomers; filled markers and the line are the most stable isomer at each b. Panel (d) has no b = 4 point: no 2Me remains in the first shell, so there is no donor to form an O–H···X− hydrogen bond.; Figure S2: Relative fractions of the solvate complexes, cb/Ssat, in the saturated solution as a function of the DMI volume fraction φ: (a) PbI2, (b) PbBr2, (c) FAI and (d) MABr. Each curve corresponds to the complex M(2Me)n−b(DMI)b.; Figure S3: Dependence of the relative solubility Ssat(φ)/Ssat(0) on the reference solubility Sref: dilute limit (Sref = 10−6 mol L−1, as in the main text) and Sref = 0.1, 0.5 and 1.0 mol L−1. (a) PbI2, (b) PbBr2, (c) FAI and (d) MABr.; Figure S4: FTIR spectra of perovskite (PVSK) solutions in (a) conventional solvents (DMF, DMSO, DMF:DMSO, NMP and DMF:NMP) and (b) green formulations (2Me, DMI, 2Me:DMI and 2Me:NMP).; Figure S5: FTIR spectra of the pure solvent and of solutions of MABr, FAI, PbI2 and PbBr2 in (a) 2Me, (b) DMI, (c) DMF and (d) NMP. The vertical lines mark the C–H and C=O stretching regions.; Figure S6: FTIR spectra of the pure solvent and of solutions of MABr, FAI, PbI2 and PbBr2 in (a) DMSO, (b) DMF:DMSO and (c) DMF:NMP. The vertical lines mark the C–H and C=O stretching regions.; Figure S7: Sessile-drop profiles of 2Me/DMI mixtures on PTAA at 20 °C with the fitted contact angles: (a) 10:0, (b) 9:1, (c) 8:2, (d) 7:3, (e) 6:4, (f) 5:5, (g) 4:6, (h) 3:7, (i) 2:8, (j) 1:9, (k) 0:10.; Figure S8: Distributions of the equivalent grain diameter of the DMF:DMSO and 2Me:DMI films, from the SEM images in Figure 11 of the main text (bin width 0.1 μm).; Table S1: Effect of the thermochemical level on ΔGb,i (kJ mol−1, 298.15 K) for representative structures. A, scheme of the main text (r2SCAN-3c/SMD energy and GFN2-xTB thermal correction); B, full r2SCAN-3c/SMD(2Me) scheme (TightOpt, analytical frequencies, qRRHO with ω0 = 100 cm−1). The difference B − A is split into the contributions of the geometry (Geom., change of E) and of the thermochemistry (Therm., change of G − Eel). “Imag. ν” lists the modes that remained after displacement and re-optimization; B (|ν|) is the value obtained if these modes are taken as real low-frequency modes. The b = 0 reference structures of PbBr2 and MABr each have one imaginary mode (−49 and −43 cm−1).; Table S2: Sensitivity of ΔGb to the quasi-RRHO treatment: difference (kJ mol−1) from qRRHO with ω0 = 100 cm−1 (r2SCAN-3c/SMD(2Me) frequencies).; Table S3: Electronic exchange energy ΔEb (kJ mol−1, r2SCAN-3c/SMD(2Me)) at the r2SCAN-3c/SMD(2Me) geometries and its change in the sensitivity tests: CPCM(2Me) instead of SMD; CPCM with the parameters of DMI (ε = 37.6, n = 1.472) instead of those of 2Me; ωB97M-V/def2-TZVP/SMD(2Me) instead of r2SCAN-3c (representative structures only).; Table S4: Calculated IR bands (r2SCAN-3c/SMD(2Me), harmonic): C=O stretch of DMI and O–H stretch of 2Me (modes in which the stretching coordinate of the group dominates; intensity-weighted mean) and shift Δν relative to the free solvent (free DMI C=O 1687 cm−1; free 2Me O–H 3791 cm−1).; Table S5: Contact angle of 2Me/DMI mixtures on PTAA at 20 °C (three 2 μL drops per composition).
Author Contributions
Conceptualization, A.O.O.; methodology, A.O.O., U.A.A. and K.A.B.; software, D.A.T.; validation, N.R.A. and A.O.O.; formal analysis, D.A.T., U.A.A., U.Kh.Y. and R.Yu.R.; investigation, U.B.E., U.Kh.Y., R.Yu.R., D.A.T. and U.A.A.; resources, N.R.A.; data curation, D.A.T. and R.Yu.R.; writing—original draft preparation, A.O.O.; writing—review and editing, A.O.O., N.R.A. and K.A.B.; visualization, A.O.O.; supervision, N.R.A.; project administration, A.O.O.; funding acquisition, N.R.A. All authors have read and agreed to the published version of the manuscript.
Funding
This research was funded by the basic funding project “Creation of third-generation stable solar cells based on perovskites” of the Institute of Polymer Chemistry and Physics of the Academy of Sciences of the Republic of Uzbekistan, and partially by the Uzbekistan–Turkey joint applied research project No. AL-9825036056, “Creation of efficient monolithic tandem silicon/perovskite solar cells”.
Institutional Review Board Statement
Not applicable.
Informed Consent Statement
Not applicable.
Data Availability Statement
The data presented in this study are available in the article and in the Supplementary Materials. The optimized Cartesian coordinates of all clusters and free solvents, the energy components of every species and level of theory, representative ORCA input files and the Jupyter notebook that regenerates all results, tables and figures of the computational part from the ORCA output files are provided in the Supplementary Materials and in a public repository (https://github.com/toshmamatovdostonazamat/2me-dmi, accessed on 5 November 2026). Further raw data (FTIR, UV–vis, PL, contact-angle and SEM files) are available from the corresponding author(s) on reasonable request.
Conflicts of Interest
The authors declare no conflicts of interest.
References
- Jeon, N.J.; Noh, J.H.; Yang, W.S.; Kim, Y.C.; Ryu, S.; Seo, J.; Seok, S.I. Compositional engineering of perovskite materials for high-performance solar cells. Nature 2015, 517, 476–480. [Google Scholar] [CrossRef] [Scilit] [PubMed]
- Wang, D.; Li, S.; Ding, Z.; Xu, J.; Chen, X.; Zheng, Q.; Alshahrani, T.; Liu, S.; He, T.; Yue, X.; et al. Continuously graded-doped SnO2 for efficient n–i–p perovskite solar cells. Nature 2026, 654, 69–75. [Google Scholar] [CrossRef] [Scilit] [PubMed]
- Green, M.A.; Dunlop, E.D.; Yoshita, M.; Kopidakis, N.; Bothe, K.; Siefer, G.; Jiang, J.Y. Solar cell efficiency tables: Version 68. Joule 2026, 10, 102494. [Google Scholar] [CrossRef] [Scilit]
- Jeon, N.J.; Noh, J.H.; Kim, Y.C.; Yang, W.S.; Ryu, S.; Seok, S.I. Solvent engineering for high-performance inorganic–organic hybrid perovskite solar cells. Nat. Mater. 2014, 13, 897–903. [Google Scholar] [CrossRef] [Scilit] [PubMed]
- Ahn, N.; Son, D.-Y.; Jang, I.-H.; Kang, S.M.; Choi, M.; Park, N.-G. Highly reproducible perovskite solar cells with average efficiency of 18.3% and best efficiency of 19.7% fabricated via Lewis base adduct of lead(II) iodide. J. Am. Chem. Soc. 2015, 137, 8696–8699. [Google Scholar] [CrossRef] [Scilit] [PubMed]
- Yan, K.; Long, M.; Zhang, T.; Wei, Z.; Chen, H.; Yang, S.; Xu, J. Hybrid halide perovskite solar cell precursors: Colloidal chemistry and coordination engineering behind device processing for high efficiency. J. Am. Chem. Soc. 2015, 137, 4460–4468. [Google Scholar] [CrossRef] [Scilit] [PubMed]
- McMeekin, D.P.; Wang, Z.; Rehman, W.; Pulvirenti, F.; Patel, J.B.; Noel, N.K.; Johnston, M.B.; Marder, S.R.; Herz, L.M.; Snaith, H.J. Crystallization kinetics and morphology control of formamidinium–cesium mixed-cation lead mixed-halide perovskite via tunability of the colloidal precursor solution. Adv. Mater. 2017, 29, 1607039. [Google Scholar] [CrossRef] [Scilit] [PubMed]
- Hamill, J.C., Jr.; Schwartz, J.; Loo, Y.-L. Influence of Solvent Coordination on Hybrid Organic–Inorganic Perovskite Formation. ACS Energy Lett. 2018, 3, 92–97. [Google Scholar] [CrossRef] [Scilit]
- Hamill, J.C., Jr.; Romiluyi, O.; Thomas, S.A.; Cetola, J.; Schwartz, J.; Toney, M.F.; Clancy, P.; Loo, Y.-L. Sulfur-donor solvents strongly coordinate Pb2+ in hybrid organic–inorganic perovskite precursor solutions. J. Phys. Chem. C 2020, 124, 14496–14502. [Google Scholar] [CrossRef] [Scilit]
- Radicchi, E.; Mosconi, E.; Elisei, F.; Nunzi, F.; De Angelis, F. Understanding the solution chemistry of lead halide perovskites precursors. ACS Appl. Energy Mater. 2019, 2, 3400–3409. [Google Scholar] [CrossRef] [Scilit]
- Lee, J.-W.; Dai, Z.; Lee, C.; Lee, H.M.; Han, T.-H.; De Marco, N.; Lin, O.; Choi, C.S.; Dunn, B.; Koh, J.; et al. Tuning molecular interactions for highly reproducible and efficient formamidinium perovskite solar cells via adduct approach. J. Am. Chem. Soc. 2018, 140, 6317–6324. [Google Scholar] [CrossRef] [Scilit] [PubMed]
- Petrov, A.A.; Fateev, S.A.; Khrustalev, V.N.; Li, Y.; Dorovatovskii, P.V.; Zubavichus, Y.V.; Goodilin, E.A.; Tarasov, A.B. Formamidinium haloplumbate intermediates: The missing link in a chain of hybrid perovskites crystallization. Chem. Mater. 2020, 32, 7739–7745. [Google Scholar] [CrossRef] [Scilit]
- Shargaieva, O.; Näsström, H.; Smith, J.A.; Többens, D.; Munir, R.; Unger, E. Hybrid perovskite crystallization from binary solvent mixtures: Interplay of evaporation rate and binding strength of solvents. Mater. Adv. 2020, 1, 3314–3321. [Google Scholar] [CrossRef] [Scilit]
- LaMer, V.K.; Dinegar, R.H. Theory, production and mechanism of formation of monodispersed hydrosols. J. Am. Chem. Soc. 1950, 72, 4847–4854. [Google Scholar] [CrossRef] [Scilit]
- Jung, M.; Ji, S.; Kim, G.; Seok, S.I. Perovskite precursor solution chemistry: From fundamentals to photovoltaic applications. Chem. Soc. Rev. 2019, 48, 2011–2038. [Google Scholar] [CrossRef] [Scilit] [PubMed]
- Brinkmann, K.O.; He, J.; Schubert, F.; Malerczyk, J.; Kreusel, C.; van gen Hassend, F.; Weber, S.; Song, J.; Qu, J.; Riedl, T. Extremely Robust Gas-Quenching Deposition of Halide Perovskites on Top of Hydrophobic Hole Transport Materials for Inverted (p–i–n) Solar Cells by Targeting the Precursor Wetting Issue. ACS Appl. Mater. Interfaces 2019, 11, 40172–40179. [Google Scholar] [CrossRef] [Scilit] [PubMed]
- Hendriks, K.H.; van Franeker, J.J.; Bruijnaers, B.J.; Anta, J.A.; Wienk, M.M.; Janssen, R.A.J. 2-Methoxyethanol as a new solvent for processing methylammonium lead halide perovskite solar cells. J. Mater. Chem. A 2017, 5, 2346–2354. [Google Scholar] [CrossRef] [Scilit]
- Xie, Y.; Xu, X.; Cui, Y.; Qiao, L.; Chi, K.; Shi, D.; Bai, Y.; Wu, Z.; He, S. Colloidal chemistry of MAPbI3 perovskite ink using 2-methoxyethanol as the solvent. Colloids Surf. A Physicochem. Eng. Asp. 2023, 677, 132406. [Google Scholar] [CrossRef] [Scilit]
- Xie, Y.; Wang, Z.; Cui, Y.; Qiao, L.; Chi, K.; Shi, D.; Bai, Y.; Wu, Z.; He, S. Competing formation of α and δ-FAPbI3 in perovskite ink using 2-methoxyethanol as the solvent. J. Solid State Chem. 2024, 334, 124657. [Google Scholar] [CrossRef] [Scilit]
- Chung, J.; Kim, S.-W.; Li, Y.; Mariam, T.; Wang, X.; Rajakaruna, M.; Saeed, M.M.; Abudulimu, A.; Shin, S.S.; Guye, K.N.; et al. Engineering perovskite precursor inks for scalable production of high-efficiency perovskite photovoltaic modules. Adv. Energy Mater. 2023, 13, 2300595. [Google Scholar] [CrossRef] [Scilit]
- Bryantsev, V.S.; Diallo, M.S.; Goddard, W.A., III. Calculation of Solvation Free Energies of Charged Solutes Using Mixed Cluster/Continuum Models. J. Phys. Chem. B 2008, 112, 9709–9719. [Google Scholar] [CrossRef] [Scilit] [PubMed]
- Gui, Y.; Guo, C.; Hou, W.; Zhao, W.; Man, Y. Synergistic Mechanisms and Economic-Environmental Analysis of Novel Extractive Distillation Using [BMIM][NTf2]-Based Mixed Solvents for Enhanced Separation of Battery-Grade Dimethyl Carbonate. ACS Sustain. Chem. Eng. 2026, 14, 3354–3369. [Google Scholar] [CrossRef] [Scilit]
- Kim, M.; Kim, G.-H.; Lee, T.K.; Choi, I.W.; Choi, H.W.; Jo, Y.; Yoon, Y.J.; Kim, J.W.; Lee, J.; Huh, D.; et al. Methylammonium chloride induces intermediate phase stabilization for efficient perovskite solar cells. Joule 2019, 3, 2179–2192. [Google Scholar] [CrossRef] [Scilit]
- Oblakulov, A.O.; Trukhina, O.; Vasylkovskyi, V.; Dörflinger, P.; Dyakonov, V.V.; Ashurov, N.R.; Nurgaliev, I.N. The multifunctional role of thiourea in enhancing crystallinity and charge carrier dynamics in perovskite solar cells. Appl. Sol. Energy 2025, 61, 623–631. [Google Scholar] [CrossRef] [Scilit]
- Neese, F. Software update: The ORCA program system, version 6.0. WIREs Comput. Mol. Sci. 2025, 15, e70019. [Google Scholar] [CrossRef] [Scilit]
- Bannwarth, C.; Ehlert, S.; Grimme, S. GFN2-xTB—An accurate and broadly parametrized self-consistent tight-binding quantum chemical method with multipole electrostatics and density-dependent dispersion contributions. J. Chem. Theory Comput. 2019, 15, 1652–1671. [Google Scholar] [CrossRef] [Scilit] [PubMed]
- Grimme, S.; Hansen, A.; Ehlert, S.; Mewes, J.-M. r2SCAN-3c: A “Swiss army knife” composite electronic-structure method. J. Chem. Phys. 2021, 154, 064103. [Google Scholar] [CrossRef] [Scilit] [PubMed]
- Marenich, A.V.; Cramer, C.J.; Truhlar, D.G. Universal solvation model based on solute electron density and on a continuum model of the solvent defined by the bulk dielectric constant and atomic surface tensions. J. Phys. Chem. B 2009, 113, 6378–6396. [Google Scholar] [CrossRef] [Scilit] [PubMed]
- Grimme, S. Supramolecular binding thermodynamics by dispersion-corrected density functional theory. Chem. Eur. J. 2012, 18, 9955–9964. [Google Scholar] [CrossRef] [Scilit] [PubMed]
- Grimme, S.; Bohle, F.; Hansen, A.; Pracht, P.; Spicher, S.; Stahn, M. Efficient quantum chemical calculation of structure ensembles and free energies for nonrigid molecules. J. Phys. Chem. A 2021, 125, 4039–4054. [Google Scholar] [CrossRef] [Scilit] [PubMed]
- Barone, V.; Cossi, M. Quantum calculation of molecular energies and energy gradients in solution by a conductor solvent model. J. Phys. Chem. A 1998, 102, 1995–2001. [Google Scholar] [CrossRef] [Scilit]
- Mardirossian, N.; Head-Gordon, M. ωB97M-V: A combinatorially optimized, range-separated hybrid, meta-GGA density functional with VV10 nonlocal correlation. J. Chem. Phys. 2016, 144, 214110. [Google Scholar] [CrossRef] [Scilit] [PubMed]
- Weigend, F.; Ahlrichs, R. Balanced basis sets of split valence, triple zeta valence and quadruple zeta valence quality for H to Rn: Design and assessment of accuracy. Phys. Chem. Chem. Phys. 2005, 7, 3297–3305. [Google Scholar] [CrossRef] [Scilit] [PubMed]
- Bjerrum, N. Untersuchungen über Ionenassoziation. K. Dan. Vidensk. Selsk. Mat.-Fys. Medd. 1926, 7, 1–48. [Google Scholar]
- RDKit: Open-Source Cheminformatics Software. Available online: https://www.rdkit.org (accessed on 17 October 2026).

Disclaimer/Publisher’s Note: The statements, opinions and data contained in all publications are solely those of the individual author(s) and contributor(s) and not of MDPI and/or the editor(s). MDPI and/or the editor(s) disclaim responsibility for any injury to people or property resulting from any ideas, methods, instructions or products referred to in the content. |
© 2026 by the authors. Licensee MDPI, Basel, Switzerland. This article is an open access article distributed under the terms and conditions of the Creative Commons Attribution (CC BY) license.