


Abstract
Galvanic corrosion between 42CrMo steel and 410 stainless steel in low-conductivity Yangtze River freshwater was investigated using electrochemical measurements and secondary current distribution modeling. Experimental polarization data were used to establish the electrode kinetics, and the numerical model was calibrated against the measured galvanic current. The effects of cathode-to-anode area ratio (Ac/Aa) and electrode separation (d) were evaluated across 20 geometric configurations. At d = 50 mm, increasing Ac/Aa from 0.5 to 4 increased the total galvanic current from 1.57 × 10⁻⁴ to 4.97 × 10⁻⁴ A and the maximum local anodic current density from 0.078 to 0.270 A m−2. At Ac/Aa = 1, increasing electrode separation from 10 to 100 mm reduced the total galvanic current by approximately 41%, while the current-localization factor increased. These results demonstrate that electrode geometry governs both the overall galvanic corrosion intensity and the spatial distribution of anodic current. The findings provide a basis for identifying high-risk configurations and optimizing the geometric design of dissimilar-metal connections in hydropower structures.
1. Introduction
Hydraulic and hydropower structures frequently combine low-alloy steels with stainless steels to satisfy mechanical and corrosion-resistance requirements. When these dissimilar metals are electrically connected in water, the less noble metal is anodically polarized and may undergo accelerated dissolution. The resulting galvanic current depends not only on the potential difference between the metals but also on electrode kinetics, electrolyte conductivity, and geometry. Previous studies have shown that current in steel/stainless-steel couples can be strongly nonuniform, so total galvanic current alone does not fully describe local electrochemical loading [1,2,3]. Hydropower equipment experiences transient hydraulic conditions [4].
Cathode-to-anode area ratio and electrode separation are particularly important geometric variables. A larger cathode can support a greater cathodic reaction rate and increase anodic demand, whereas a larger separation lengthens the ionic transport path and increases ohmic loss [3,5]. Most quantitative studies of these effects have been performed in chloride-rich or relatively conductive electrolytes. In natural freshwater, where solution resistance is much higher, geometry can exert a stronger influence on both the magnitude and spatial redistribution of galvanic current. Exposed area ratio has also been examined for a carbon steel/13Cr stainless steel galvanic couple under supercritical CO2 conditions [6].
Numerical electrochemical modeling provides a direct way to resolve this spatial behavior. Boundary-element and finite-element studies have successfully reproduced potential and current-density fields in dissimilar-metal systems and have shown that material combination and geometric scale can alter local electrochemical response [7,8,9,10]. These approaches complement macroscopic electrochemical measurements by resolving current distributions that are difficult to measure directly. Finite-element analysis has also been applied to trimetallic galvanic coupling under thin electrolyte films [11].
Li et al. [12] previously examined the galvanic corrosion behavior of 42CrMo steel and 410 stainless steel in Yangtze River freshwater using immersion and electrochemical measurements. Their findings established the macroscopic galvanic response of this material pair under freshwater exposure. The present work addresses a different question: how do the cathode-to-anode area ratio and electrode separation redistribute local anodic current on 42CrMo steel? This distinction is particularly relevant in a low-conductivity electrolyte, where electrode kinetics and solution resistance jointly govern the current field [13].
Stainless-steel welded joints have also been studied in simulated reservoir freshwater [14]. Water chemistry influences electrochemical reactions at metallic interfaces. Previous studies of aqueous electrocatalytic reactions and metal recovery from industrial wastewater illustrate the broader significance of metal–solution interactions [15,16]. Investigations of the Three Gorges Reservoir and river-water systems have also documented environmental variability in aquatic conditions [17,18,19].
Experimental studies of dissimilar steel couples have identified the roles of erosion, surface condition, chloride exposure, and cathode-to-anode area ratio in galvanic corrosion [20,21,22,23,24]. These studies establish important comparisons with engineered steel connections, although electrolyte composition and exposure geometry differ from those examined here.
Finite-element simulations of macrocell corrosion have further demonstrated the value of resolving spatial current distributions and electrolyte-resistance effects [25]. Combining established secondary-current-distribution modeling with the 42CrMo/410 freshwater measurements therefore permits comparison of both integrated current and localized anodic loading across systematically varied geometries.
In this study, a finite-element model based on experimentally determined electrode kinetics is used to assess the galvanic interaction between 42CrMo steel and 410 stainless steel in Yangtze River freshwater. Galvanic-current measurements provide baseline calibration, while systematic variations in cathode-to-anode area ratio (Ac/Aa) and electrode separation (d) resolve geometric effects. Total galvanic current (Igal), maximum local anodic current density (imax), and a normalized current-localization factor (Li; defined in Section 2.8) are evaluated as complementary measures of corrosion loading.
The central contribution is to separate overall galvanic loading from spatial current concentration and to show how these two responses evolve differently with geometry. A full Ac/Aa–d parameter matrix is used to map the coupled effects of cathode size and ionic transport distance, while three-dimensional calculations assess finite-size current spreading. This framework extends the previous macroscopic description of the 42CrMo/stainless-steel couple to a spatially resolved evaluation of geometry-controlled galvanic corrosion in low-conductivity freshwater.
2. Experimental and Numerical Methods
2.1. Materials and Yangtze River Freshwater
Commercial 42CrMo low-alloy steel and 410 stainless steel were selected as the anodic and cathodic materials, respectively, to represent the dissimilar-metal combination used in hydropower gate-slot assemblies. The metallic specimens were machined into 50 × 50 × 5 mm plates. Prior to electrochemical and galvanic-corrosion measurements, the exposed surfaces were mechanically ground to remove surface oxides and obtain a reproducible surface condition. The specimens were subsequently cleaned with distilled water and organic solvent and dried before testing. For galvanic measurements, a copper lead was connected to the back surface of each specimen, while all nonworking surfaces were sealed with epoxy resin so that only the designated working surface was exposed to the electrolyte. The nominal exposed working face was 50 × 50 mm for both materials in the baseline galvanic experiment. The chemical compositions of the two steels are summarized in Table 1.
Table 1.
Chemical compositions of 42CrMo steel and 410 stainless steel used in this study (wt%).
The electrolyte was authentic Yangtze River freshwater collected from the gate environment of the Three Gorges hydropower station. Its measured ionic composition and water-quality properties are reported in Table 2.
Table 2.
Major composition and model-relevant properties of the authentic Yangtze River freshwater.
For the numerical model, the electrolyte was treated as a homogeneous ohmic conductor. A nominal conductivity of
was used for the baseline calculation. Conductivity sensitivity was evaluated over 0.5 to 1.5 times σ0.
σ0 = 0.043 S m−1
2.2. Electrochemical Characterization and Galvanic-Coupling Experiment
Electrochemical measurements were conducted using a conventional three-electrode configuration, with the metallic specimen as the working electrode, a saturated calomel electrode (SCE) as the reference electrode, and a Pt electrode as the counter electrode. A Gamry electrochemical workstation was used for polarization and impedance measurements. In the previous electrochemical experiments, the corrosion potential was monitored before polarization, and potentiodynamic scans were subsequently performed to characterize the anodic and cathodic reaction kinetics.
Galvanic-coupling experiments were performed in a custom electrically insulating rectangular acrylic cell (internal dimensions: 200 × 150 × 150 mm; length × width × height) at 25 ± 1 °C. After the epoxy-encapsulated specimens and insulating fixtures had been placed in the cell, approximately 2.8 L of authentic Three Gorges Yangtze River freshwater was added to establish a liquid height of approximately 100 mm. The nominal electrolyte-domain dimensions at this liquid level were 200 × 150 × 100 mm (length × width × liquid height), consistent with the geometric envelope used in the three-dimensional finite-element model. The nominal baseline electrolyte conductivity was 0.043 S m−1. Commercial 42CrMo steel and 410 stainless steel specimens (50 × 50 × 5 mm) served as the anode and cathode, respectively. Each specimen had a 50 × 50 mm working face; all remaining surfaces and the rear copper-lead connection were sealed with epoxy resin.
The two specimens were held vertically by insulating fixtures near the center of the cell, with their working faces parallel and directly facing one another. Their baseline separation, d = 50 mm, was the normal distance between the exposed working faces; thus, Ac/Aa = 1. A saturated calomel electrode was positioned symmetrically between the specimens for potential measurements. The specimen leads were connected through the zero-resistance ammeter (ZRA) mode of a Gamry electrochemical workstation, permitting continuous monitoring of the galvanic current over 50 days. Three replicate measurements (n = 3) were conducted under the baseline condition.
The measured galvanic current increased during approximately the first 48 h and subsequently decreased as interfacial corrosion products and passive films developed. A representative galvanic current of 0.250 mA (2.50 × 10⁻⁴ A) at 48 h was used for baseline model calibration (Ac/Aa = 1; d = 50 mm). The calibrated kinetic parameter was then held constant in subsequent geometry, conductivity, and three-dimensional calculations.
2.3. Electrochemical Kinetic Parameters
The polarization data of 42CrMo steel obtained from previous experiments were used to determine the electrochemical kinetic parameters. The data obtained at 0 d were selected to represent the initial surface condition of the electrodes.
The anodic and cathodic Tafel branches were independently fitted in terms of
E = a + blog10|I|.
To minimize the influence of the immediate corrosion-potential region and the highly polarized nonlinear regions, the anodic fitting interval was defined as
whereas the cathodic interval was
Ecorr + 0.05 ≤ E ≤ Ecorr + 0.30 V,
Ecorr − 0.30 ≤ E ≤ Ecorr − 0.05 V.
For 42CrMo steel, the resulting anodic and cathodic Tafel slopes were 0.2513 and 0.3476 V dec−1, respectively, with coefficients of determination of R2 = 0.961 and 0.947, respectively. The experimentally determined corrosion potential and corrosion current density were used directly in the numerical model:
Ecorr,42 = −0.746 V vs. SCE
icorr,42 = 0.243 A m−2.
For 410 stainless steel, previous experiments gave
and showed a characteristic passive response. The anodic and cathodic Tafel slopes used in the numerical model were
Ecorr,410 ≈ −0.480 V vs. SCE
icorr,410 ≈ 5.0 × 10⁻⁶ A cm−2 = 0.050 A m−2,
βa,410 = 0.120 V dec−1
βc,410 = 0.300 V dec−1.
The influence of the cathodic Tafel slope was evaluated using βc,410 = 0.24, 0.30, and 0.36 V dec−1. The kinetic parameters used in the baseline calculations are summarized in Table 3.
Table 3.
Electrochemical kinetic parameters used in the baseline model.
2.4. Numerical Formulation
Galvanic-current distributions were computed using the established Secondary Current Distribution interface in FEniCSx (DOLFINx version 0.8), rather than a newly developed numerical algorithm. The electrolyte was modeled as an electroneutral, homogeneous, isotropic ohmic conductor, without explicitly resolving species-concentration gradients. Under these assumptions, the governing charge-conservation and current-transport relationships follow the conventional secondary-current-distribution formulation [26].
with
where il is the electrolyte current-density vector, σ is the electrolyte conductivity, and ϕl is the electrolyte potential.
∇⋅il = 0,
il = −σ∇ϕl,
The local electrode overpotential was defined as
where ϕs denotes the metal potential. Because the two electrodes were electrically short-circuited in the galvanic couple, they shared the same metallic potential. A common value of ϕs = 0 was therefore used as the electrical reference without affecting the calculated galvanic-current distribution.
η = ϕs − ϕl − Ecorr,
For each electrode, anodic and cathodic partial currents were represented using Tafel expressions with positive Tafel-slope magnitudes [27].
For 410 stainless steel, the cathodic branch was multiplied by a kinetic correction factor kcat,
The correction factor kcat was calibrated using the baseline experimental condition and then held constant in all geometric parameter studies.
2.5. Two-Dimensional Geometric Model and Boundary Conditions
The main calculations were performed using an idealized two-dimensional electrolyte domain to isolate the effects of cathode-to-anode area ratio and electrode separation from other geometric complexities. The 42CrMo anodic boundary had a fixed active length
while the active length of the 410 cathode was defined as
La = 50 mm,
An out-of-plane width of t = 50 mm was assigned so that the baseline La = 50 mm configuration represented a 50 × 50 mm anodic surface. The baseline electrode spacing was d = 50 mm. The electrolyte-domain height was initially set to Hdom = 250 mm, with both active boundaries centered within the computational domain. The remaining external boundaries were electrically insulating.
The two-dimensional geometry was used to quantify geometric scaling, while finite electrode-size effects were evaluated separately using three-dimensional calculations.
A free triangular mesh was used in the 2D domain. The electrode boundaries were locally refined using a maximum element size of 1 mm and a minimum element size equal to one-tenth of the maximum size. A maximum growth rate of 1.2 was applied near the active surfaces.
2.6. Baseline Model Calibration
The kinetic correction factor kcat was calibrated using the baseline condition Ac/Aa = 1 and d = 50 mm. For each trial value, the calculated total galvanic current was compared with the reference experimental value using
εI = |Igal,sim − Igal,exp|/Igal,exp × 100%.
A parameter sweep over kcat was conducted between approximately 0.40 and 1.50, with finer sampling around the minimum-error region. The minimum deviation was obtained at
kcat = 0.625.
The optimized correction factor (kcat = 0.625) was then fixed in all subsequent studies of cathode-to-anode area ratio, electrode separation, electrolyte conductivity, and three-dimensional geometry. The calibrated baseline current was 0.25155 mA versus the experimental reference of 0.25000 mA (0.62% deviation). This agreement characterizes baseline calibration; mesh convergence and parameter sensitivities were examined separately in Section 2.9.
2.7. Geometric Parameter Studies
Two geometric parameters were systematically investigated. First, the cathode-to-anode area ratio was varied as
while maintaining d = 50 mm. Second, the electrode separation was varied as
with Ac/Aa = 1. To resolve the coupled influence of both variables, a full factorial combination of the four area ratios and five separations was subsequently calculated, producing 20 independent geometric configurations (Table 4). These data were used to construct two-dimensional response maps of total galvanic current, maximum local anodic current density, and current-localization factor. All geometric sweeps were performed with the same calibrated kinetic parameters and electrolyte properties so that changes in the predicted electrochemical response resulted exclusively from geometry.
Ac/Aa = 0.5, 1, 2, 4,
d = 10, 25, 50, 75, 100 mm,
Table 4.
Geometric parameters used in the finite-element study.
2.8. Quantification of Galvanic Current and Current Localization
The total anodic current was obtained by integrating the normal current density over the 42CrMo surface,
The total galvanic current was defined as
Igal = |Ia|.
For the 2D model, the boundary integral was multiplied by the out-of-plane width t. The average anodic current density was then calculated from
Because numerical current densities can exhibit endpoint enhancement near electrode/insulator junctions, the maximum local current density was evaluated after excluding a small edge region from both ends of the 42CrMo surface. The baseline cutoff distance was δedge = 1 mm. The localization factor was defined as
Thus, Li = 1 corresponds to a spatially uniform anodic current distribution, whereas increasing Li indicates progressively stronger current localization.
Current conservation was evaluated using
In addition, the mean electrolyte potentials adjacent to the anodic and cathodic surfaces, and , were evaluated to determine the effective ohmic potential drop,
and the corresponding effective electrolyte resistance,
These quantities were used to interpret the influence of electrode separation in terms of electrolyte ohmic resistance rather than geometry alone.
2.9. Numerical Sensitivity and Convergence Analysis
Numerical and electrochemical sensitivity analyses were performed. Mesh convergence was examined by varying the maximum element size at the electrode surfaces between 2, 1, 0.5, and 0.25 mm. The influence of the endpoint exclusion distance was examined using δedge = 0.5, 1, 2, and 3 mm. The computational-domain height was varied between 250 and 400 mm to assess boundary-size effects.
Electrolyte conductivity was varied using
σ = (0.5, 0.75, 1, 1.25, 1.5)σ0.
A common Tafel-slope scaling factor of 0.8, 1.0, and 1.2 was applied to evaluate sensitivity to the polarization parameters. The cathodic Tafel slope of 410 stainless steel was independently varied over βc,410 = 0.24, 0.30, and 0.36 V dec−1. Numerical convergence was evaluated from the stability of Igal and iavg, whereas imax and Li were tracked separately because local extrema are more sensitive to spatial discretization and electrode-edge treatment.
Detailed mesh-refinement, computational-domain-height, endpoint-exclusion, and nonlinear-solver checks are provided in the Supporting Information (Figures S1–S4 and Tables S1–S7). The total galvanic current varied by only 0.01100% between electrode-boundary mesh sizes of 0.5 and 0.25 mm and by 0.01341% between domain heights of 250 and 400 mm in the tested area-ratio-4 configuration. In contrast, the core peak anodic current density and the current-localization factor were more sensitive to numerical settings: the peak differed by 4.4531% between the 1 and 0.25 mm meshes, and by 12.0186% between domain heights of 350 and 400 mm when referenced to the 400 mm result. These checks support stability of the integrated current within the tested conditions, but do not establish full domain independence of the local peak or localization factor.
2.10. Three-Dimensional Finite-Size Assessment
Supplementary three-dimensional simulations were performed to evaluate finite electrode dimensions. The 3D electrolyte domain had dimensions 200 × 150 × 100 mm. For the baseline case, both the 42CrMo and 410 electrode surfaces were 50 × 50 mm with a normal separation of 50 mm between facing working surfaces. A second model was constructed for Ac/Aa = 4 using a 50 × 50 mm 42CrMo anode and a 100 × 100 mm 410 cathode, again with a nominal 50 mm separation.
The same electrochemical parameters kcat = 0.625, and σ = 0.043 S m−1 were retained without additional fitting. Free tetrahedral elements were used, with local refinement to 0.5–2 mm near the active electrode surfaces.
The three-dimensional calculations were used to quantify finite-width current spreading and edge effects. Total galvanic currents were compared with the corresponding two-dimensional results, and changes at large Ac/Aa were analyzed in terms of three-dimensional current spreading.
3. Results and Discussion
3.1. Electrochemical Parameters and Baseline Model Calibration
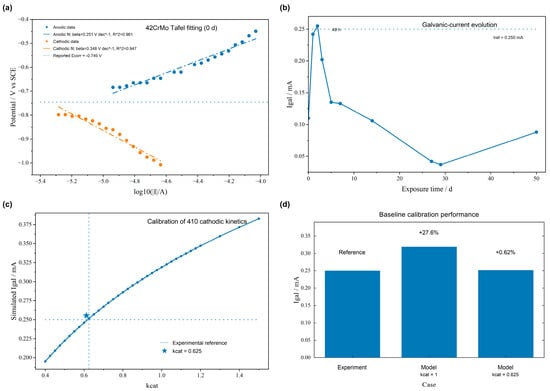
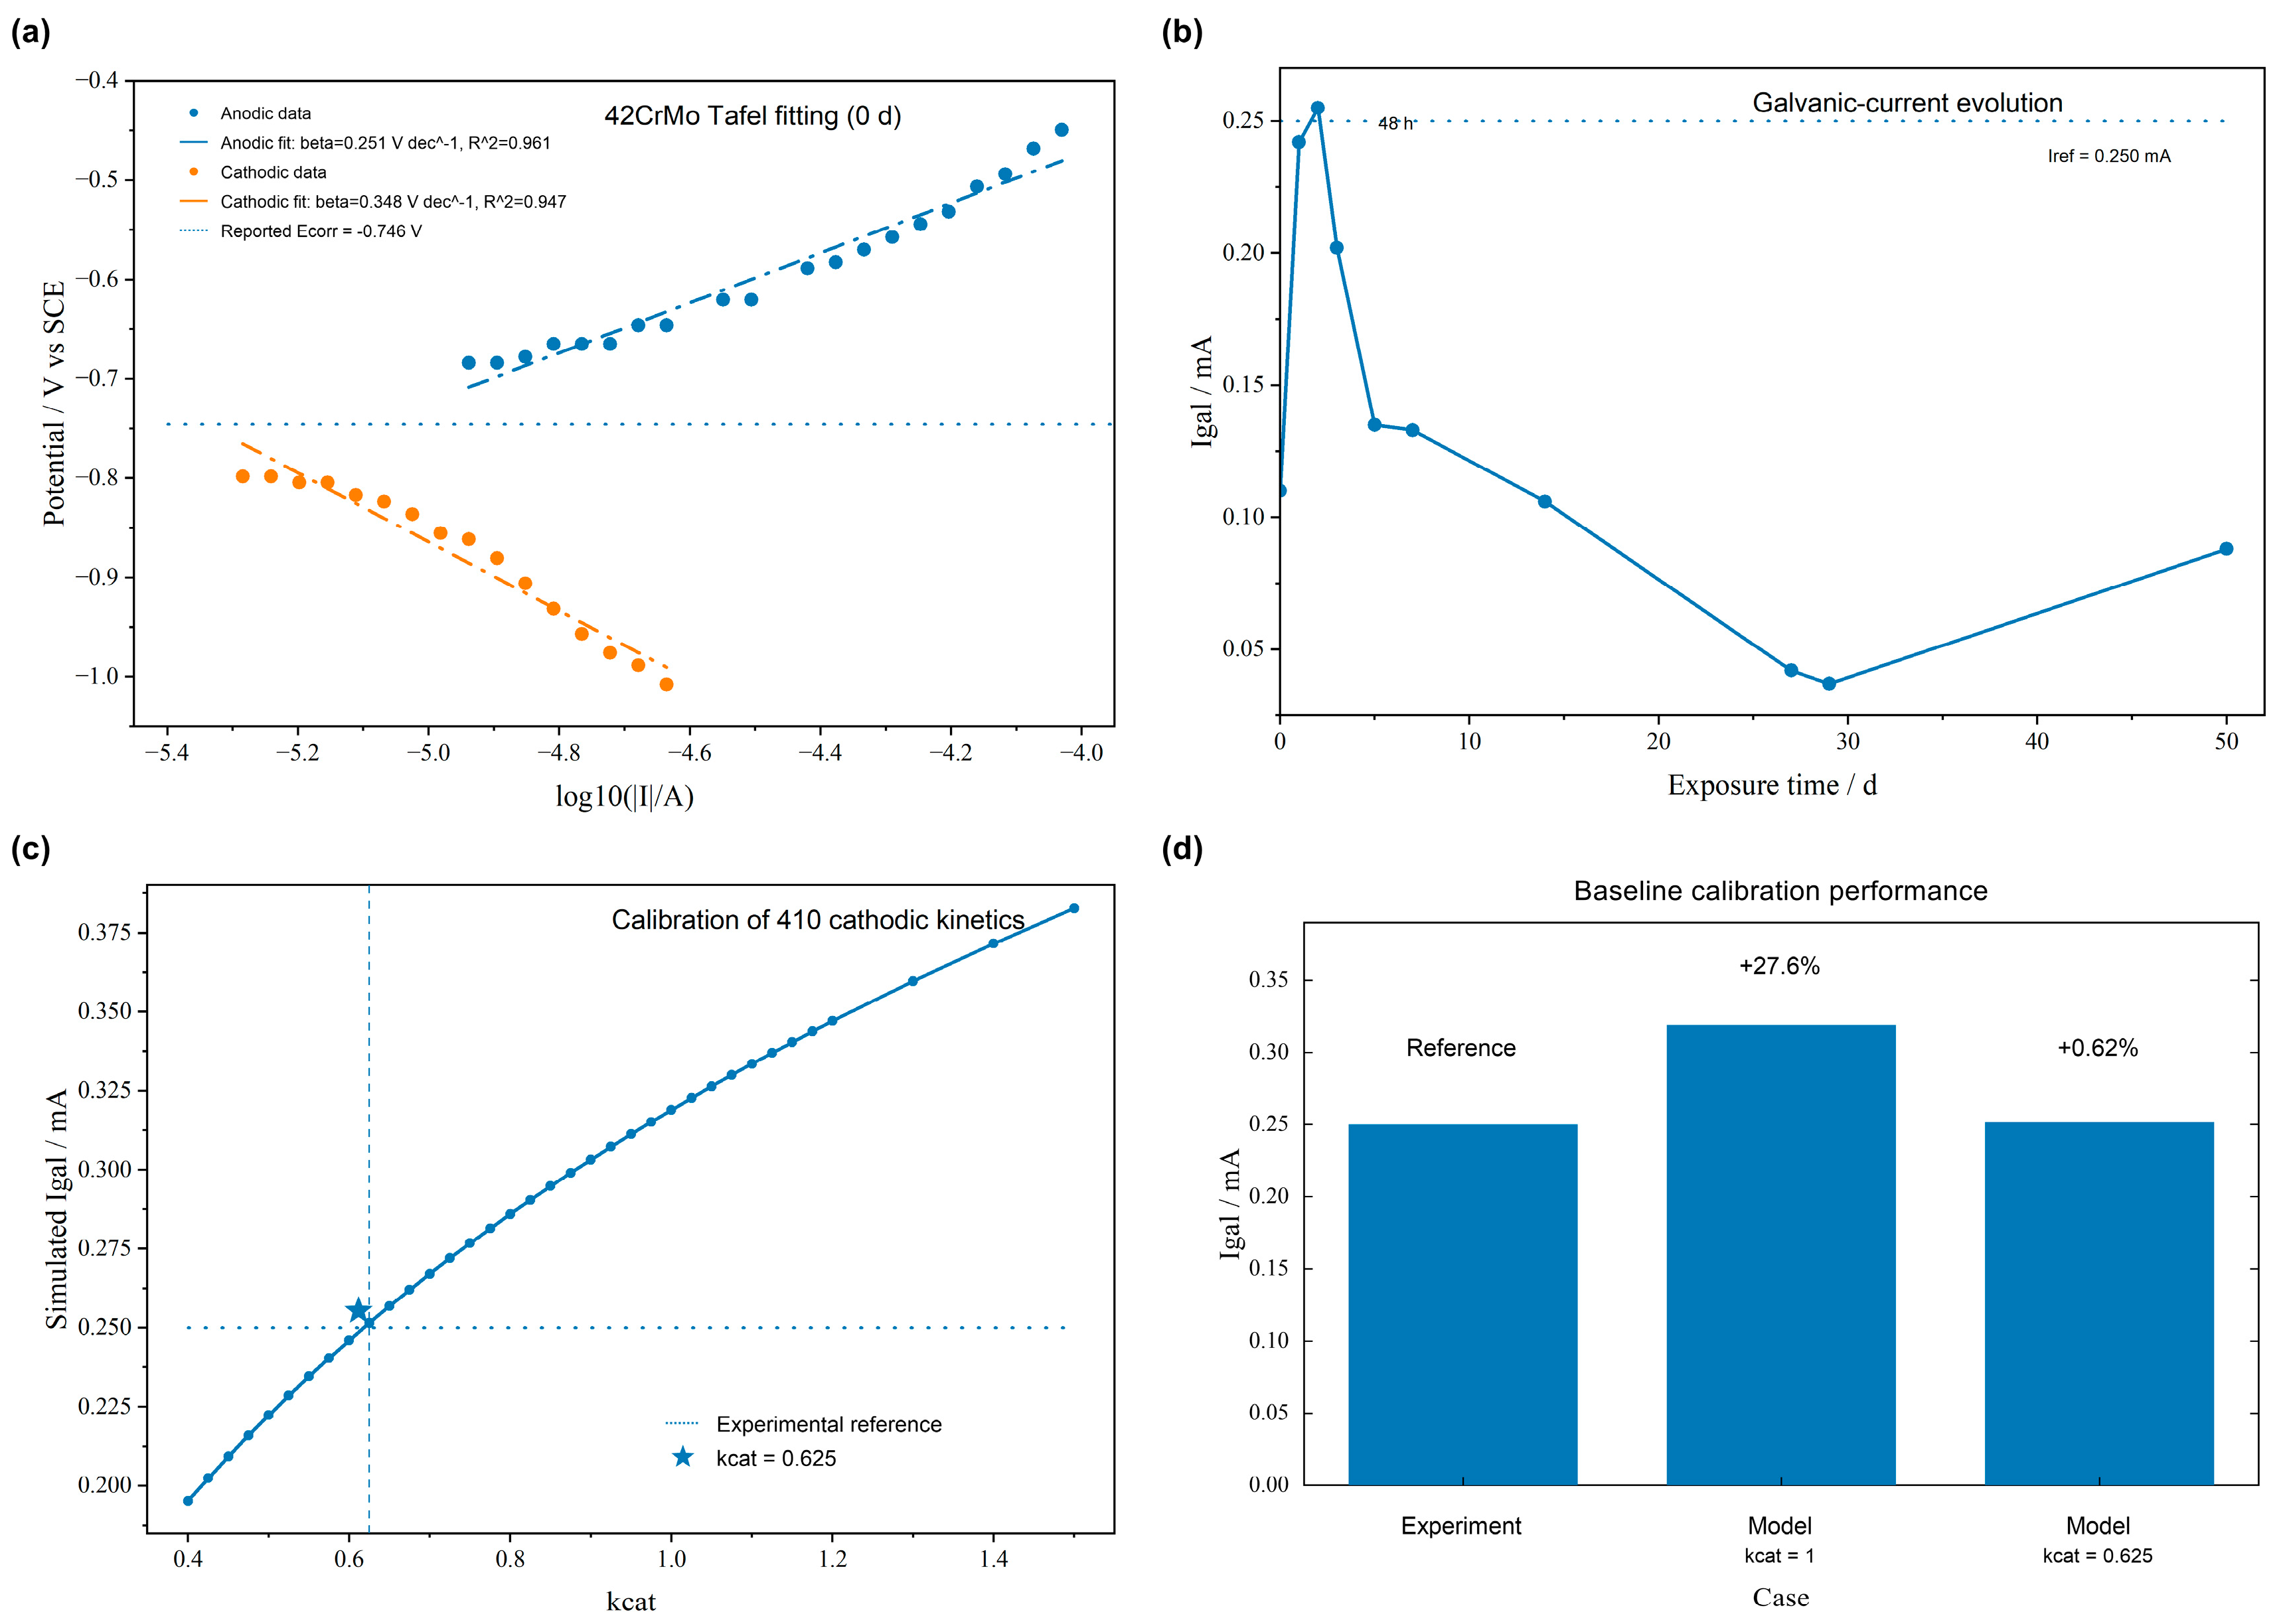
The electrochemical boundary conditions were obtained from previous polarization experiments. For 42CrMo steel, the 0 d data were used to represent the initial electrode condition. The measured corrosion potential and corrosion current density were used directly, while the anodic and cathodic branches were fitted over +50 to +300 mV and −300 to −50 mV relative to Ecorr. The resulting Tafel slopes were 0.2513 and 0.3476 V dec−1, with R2 values of 0.961 and 0.947, respectively (Figure 1a).
Figure 1.
Electrochemical boundary conditions and baseline calibration of the galvanic-corrosion model. (a) Tafel fitting of the anodic and cathodic polarization branches of 42CrMo steel at the initial exposure condition (0 d). (b) Experimental evolution of galvanic current for the 42CrMo/410 stainless-steel couple; the dotted line indicates the current used for baseline model calibration. (c) Dependence of the simulated galvanic current on the cathodic kinetic correction factor kcat for 410 stainless steel. (d) Comparison of the experimental reference current with the simulated baseline current before and after calibration.
For 410 stainless steel, the experimentally obtained corrosion potential and corrosion current density were combined with baseline anodic and cathodic Tafel slopes of 0.120 and 0.300 V dec−1, respectively. These parameters, together with the 42CrMo kinetics, defined the electrode boundary conditions used in the galvanic model.
Figure 1b shows the galvanic-current history for the baseline couple (Ac/Aa = 1, d = 50 mm). The current increased during approximately the first 48 h and then decreased as the electrode surfaces evolved. A representative current of 0.250 mA was selected for steady-state baseline calibration.
With kcat = 1, the calculated current was 0.3190 mA. A cathodic kinetic correction factor kcat was therefore introduced for 410 stainless steel and calibrated to the baseline experiment.
As illustrated in Figure 1c, the simulated galvanic current decreased systematically with decreasing cathodic kinetic activity. A parameter sweep identified
as the value that best reproduced the selected baseline reference. At this value, the calculated galvanic current was
compared with
kcat = 0.625
Igal,cal = 2.5155 × 10⁻⁴ A
Igal,ref = 2.5000 × 10⁻⁴ A.
The calibrated model reproduced the reference current with a deviation of 0.62% (Figure 1d). The resulting kcat was then held constant in all subsequent simulations, so the effects reported below arise from changes in geometry, electrolyte conductivity, or model dimensionality rather than repeated fitting.
The calibrated baseline was used as the reference state for the geometric analyses. The influence of the 410 stainless-steel cathodic Tafel slope (0.24–0.36 V dec−1) is examined separately in Section 3.6.
3.2. Spatial Distribution of Galvanic Potential and Current Density Under the Baseline Geometry
The baseline geometry (Ac/Aa = 1, d = 50 mm) was first used to establish the spatial reference state. The calibrated model predicted a total galvanic current of
corresponding to an average anodic current density on the 42CrMo surface of
Igal = 2.516 × 10⁻⁴A
iavg = 0.1006 Am−2
Because the two electrodes had equal exposed dimensions, this configuration isolates the intrinsic spatial redistribution of galvanic current before area asymmetry or spacing changes are introduced.
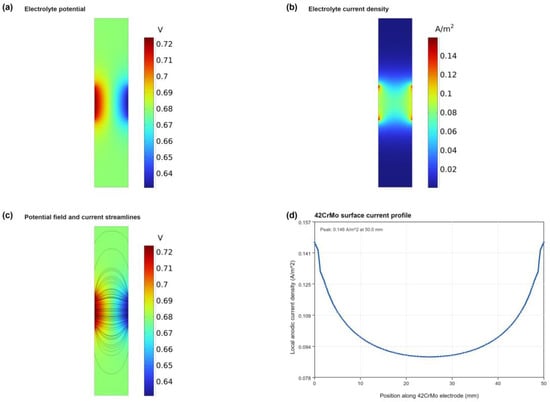
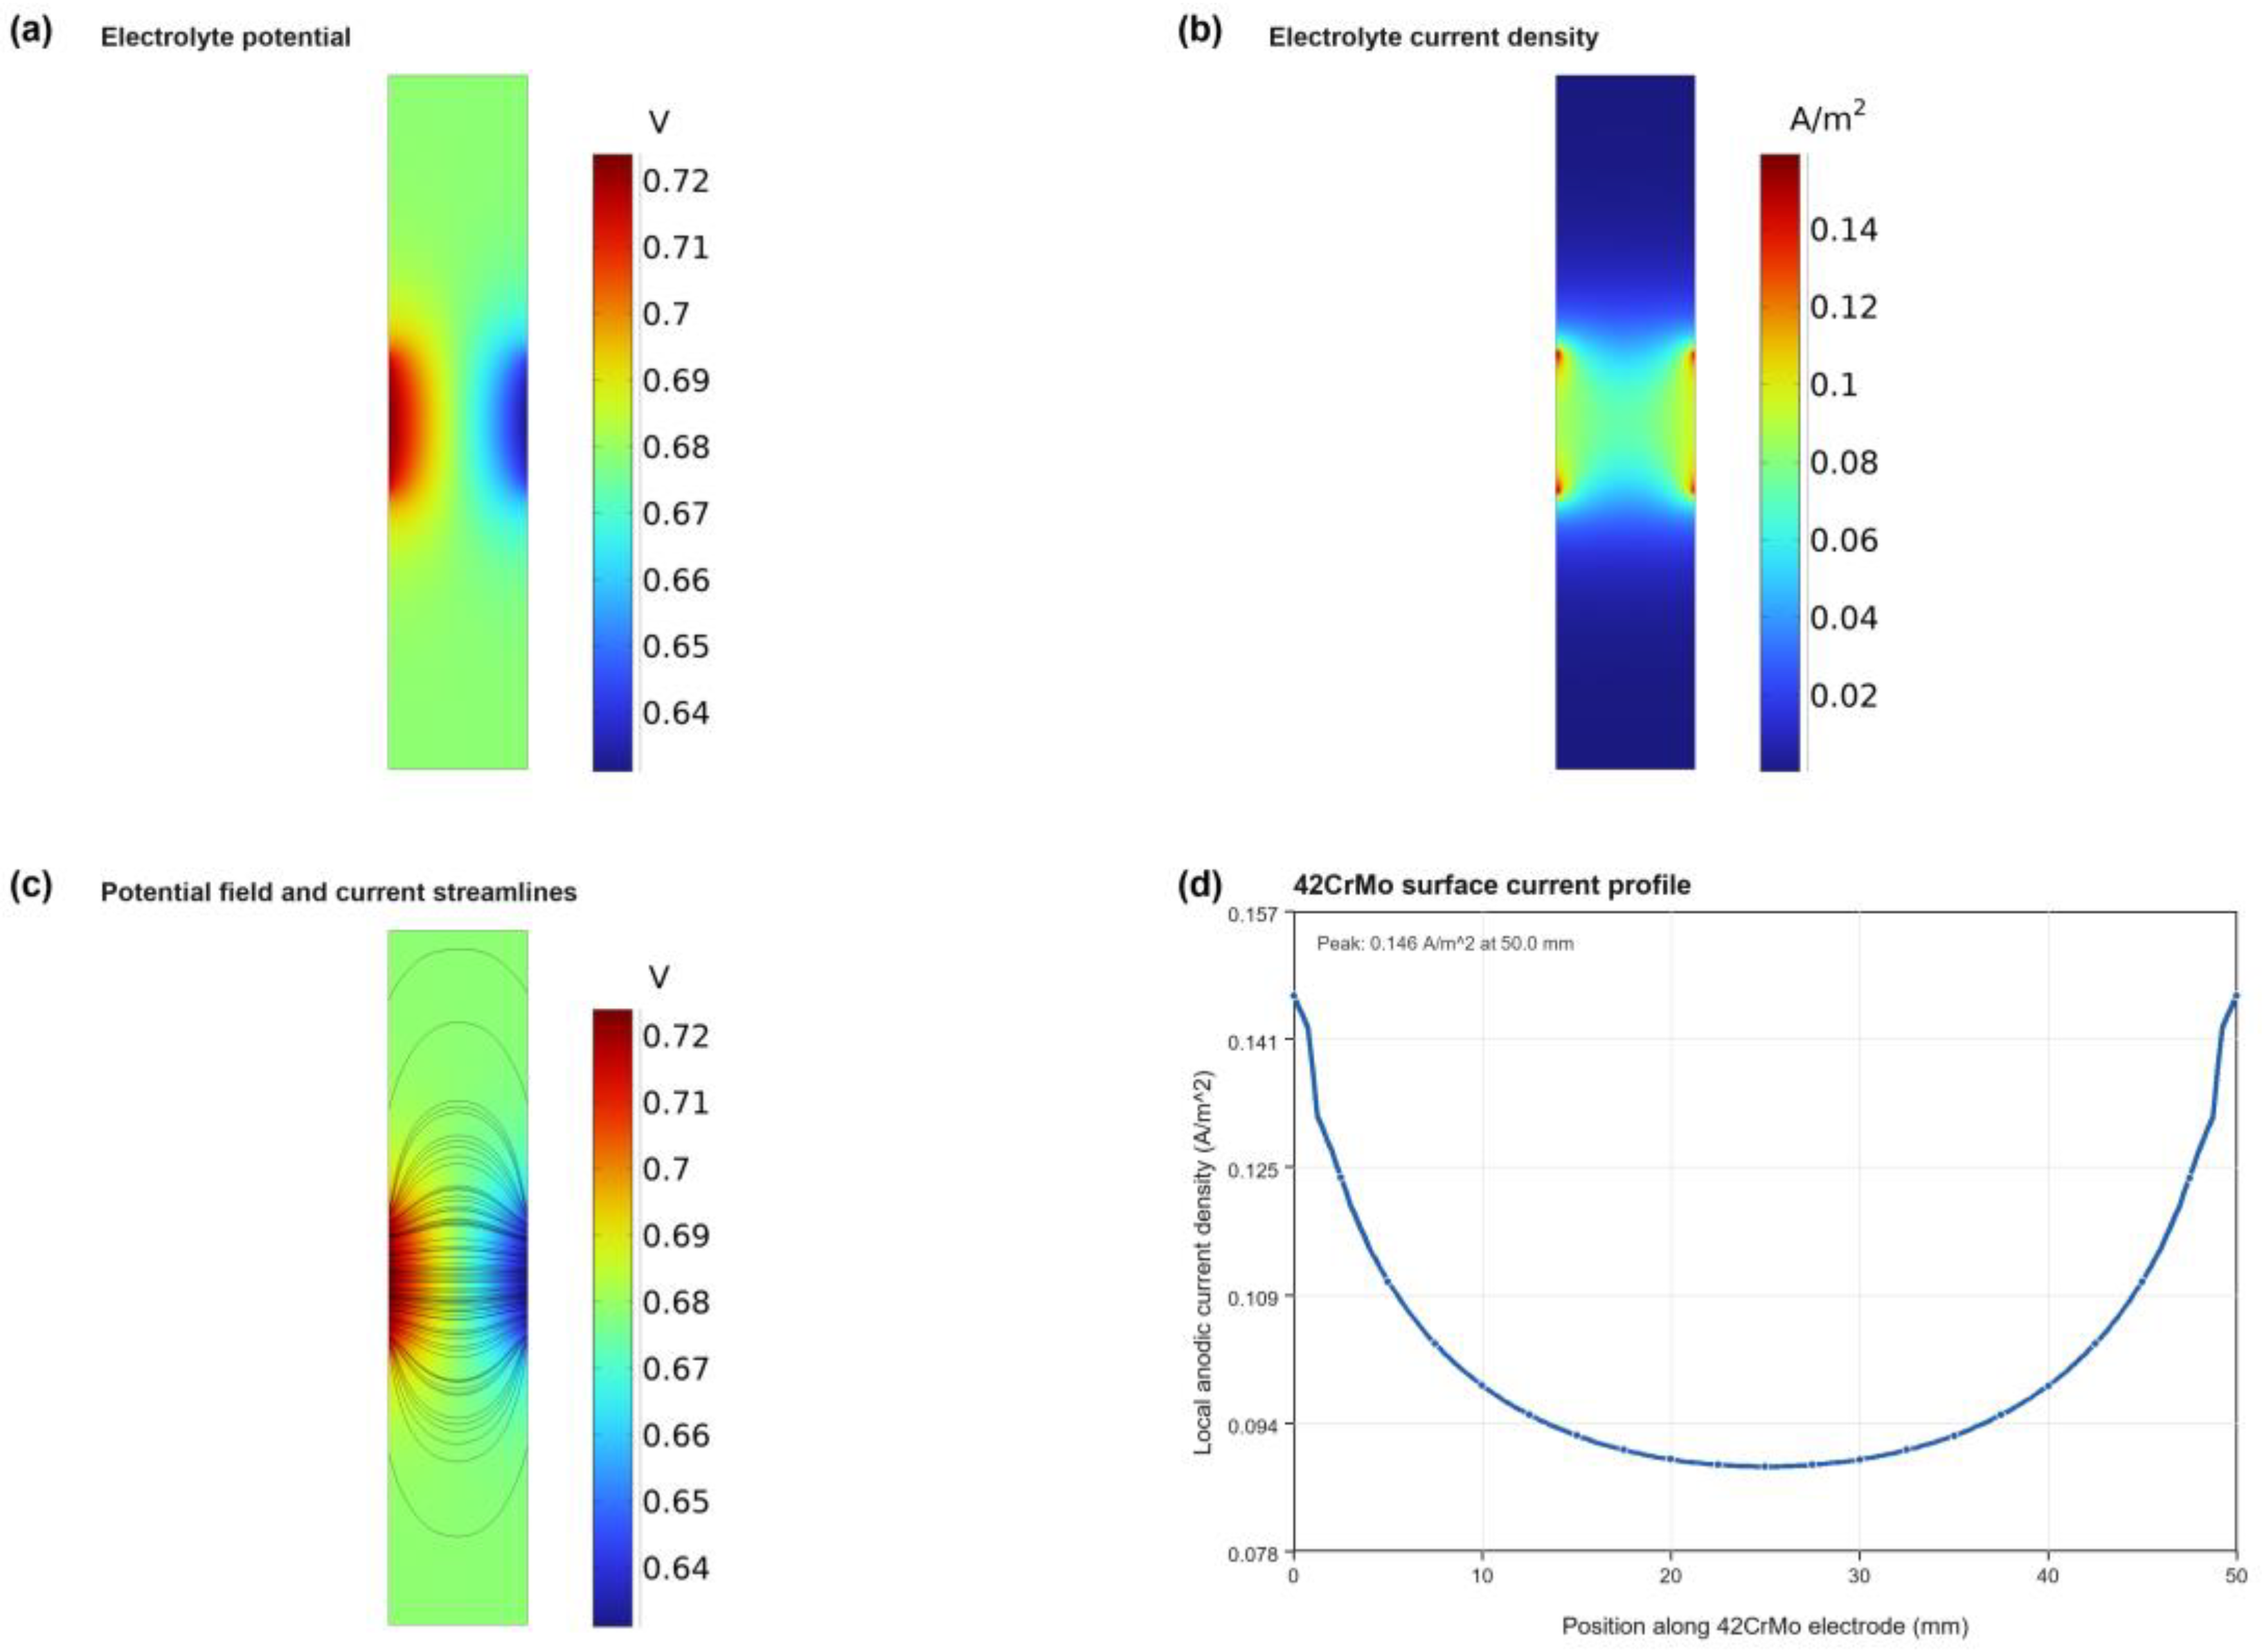
Figure 2a shows the electrolyte-potential distribution between the coupled 42CrMo steel and 410 stainless steel. The mean electrolyte potentials adjacent to the anodic and cathodic surfaces were approximately 0.721 and 0.636 V, respectively. Their difference corresponds to an effective ohmic drop of about 0.0853 V and, with the calculated galvanic current, an effective electrolyte resistance of approximately 339 Ω. The strongest potential variation occurred between the facing electrode surfaces, indicating the importance of solution resistance in low-conductivity freshwater.
Figure 2.
Spatial distribution of galvanic potential and current density for the baseline 42CrMo/410 stainless-steel couple (Ac/Aa = 1, d = 50 mm). (a) Electrolyte-potential distribution. (b) Magnitude of the electrolyte current-density field. (c) Current streamlines illustrating the principal ionic-current transport pathways between the coupled electrodes. (d) Local anodic current-density profile along the 42CrMo surface, showing edge-enhanced current localization.
The current-density contours and streamlines (Figure 2b,c) show that current is concentrated in the region directly connecting the active surfaces and is further enhanced near the electrode ends. The pattern reflects the combined effects of short ionic transport paths and current-line convergence, demonstrating that galvanic current is redistributed spatially even when the anodic and cathodic areas are equal. Similar geometry-controlled current focusing has been reported for dissimilar-metal couples, where area ratio, separation distance, and edge geometry altered local current-density distributions [28,29].
The local anodic-current-density profile along 42CrMo (Figure 2d) was approximately symmetric and U-shaped, with current increasing toward both electrode ends. After excluding a 1 mm region at each electrode/insulator junction to avoid numerical endpoint singularities, the maximum core anodic current density was 0.1272 A m−2, approximately 26% higher than the area-averaged value. The corresponding localization factor was Li = 1.264.
The profile demonstrates why integrated galvanic current and localized anodic loading should be distinguished: even an equal-area couple develops significant edge-enhanced current concentration. This spatial interpretation is consistent with local-probe and numerical studies of galvanic-current distributions [30,31].
3.3. Effect of Cathode-to-Anode Area Ratio on Galvanic Current and Localization
The cathode-to-anode area ratio is one of the most important geometric factors governing galvanic corrosion because it directly controls the amount of cathodic reaction area available to sustain anodic dissolution. To isolate this effect, the electrode separation was fixed at d = 50 mm while the cathode-to-anode area ratio was varied as
The anodic area of 42CrMo was kept constant, whereas the exposed 410 stainless-steel cathode area was systematically increased. All electrochemical parameters, electrolyte properties, and the calibrated cathodic kinetic correction factor were maintained unchanged.
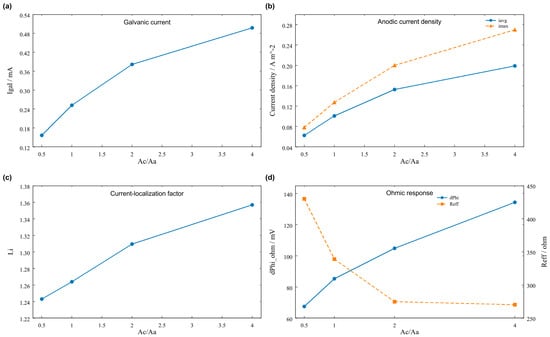
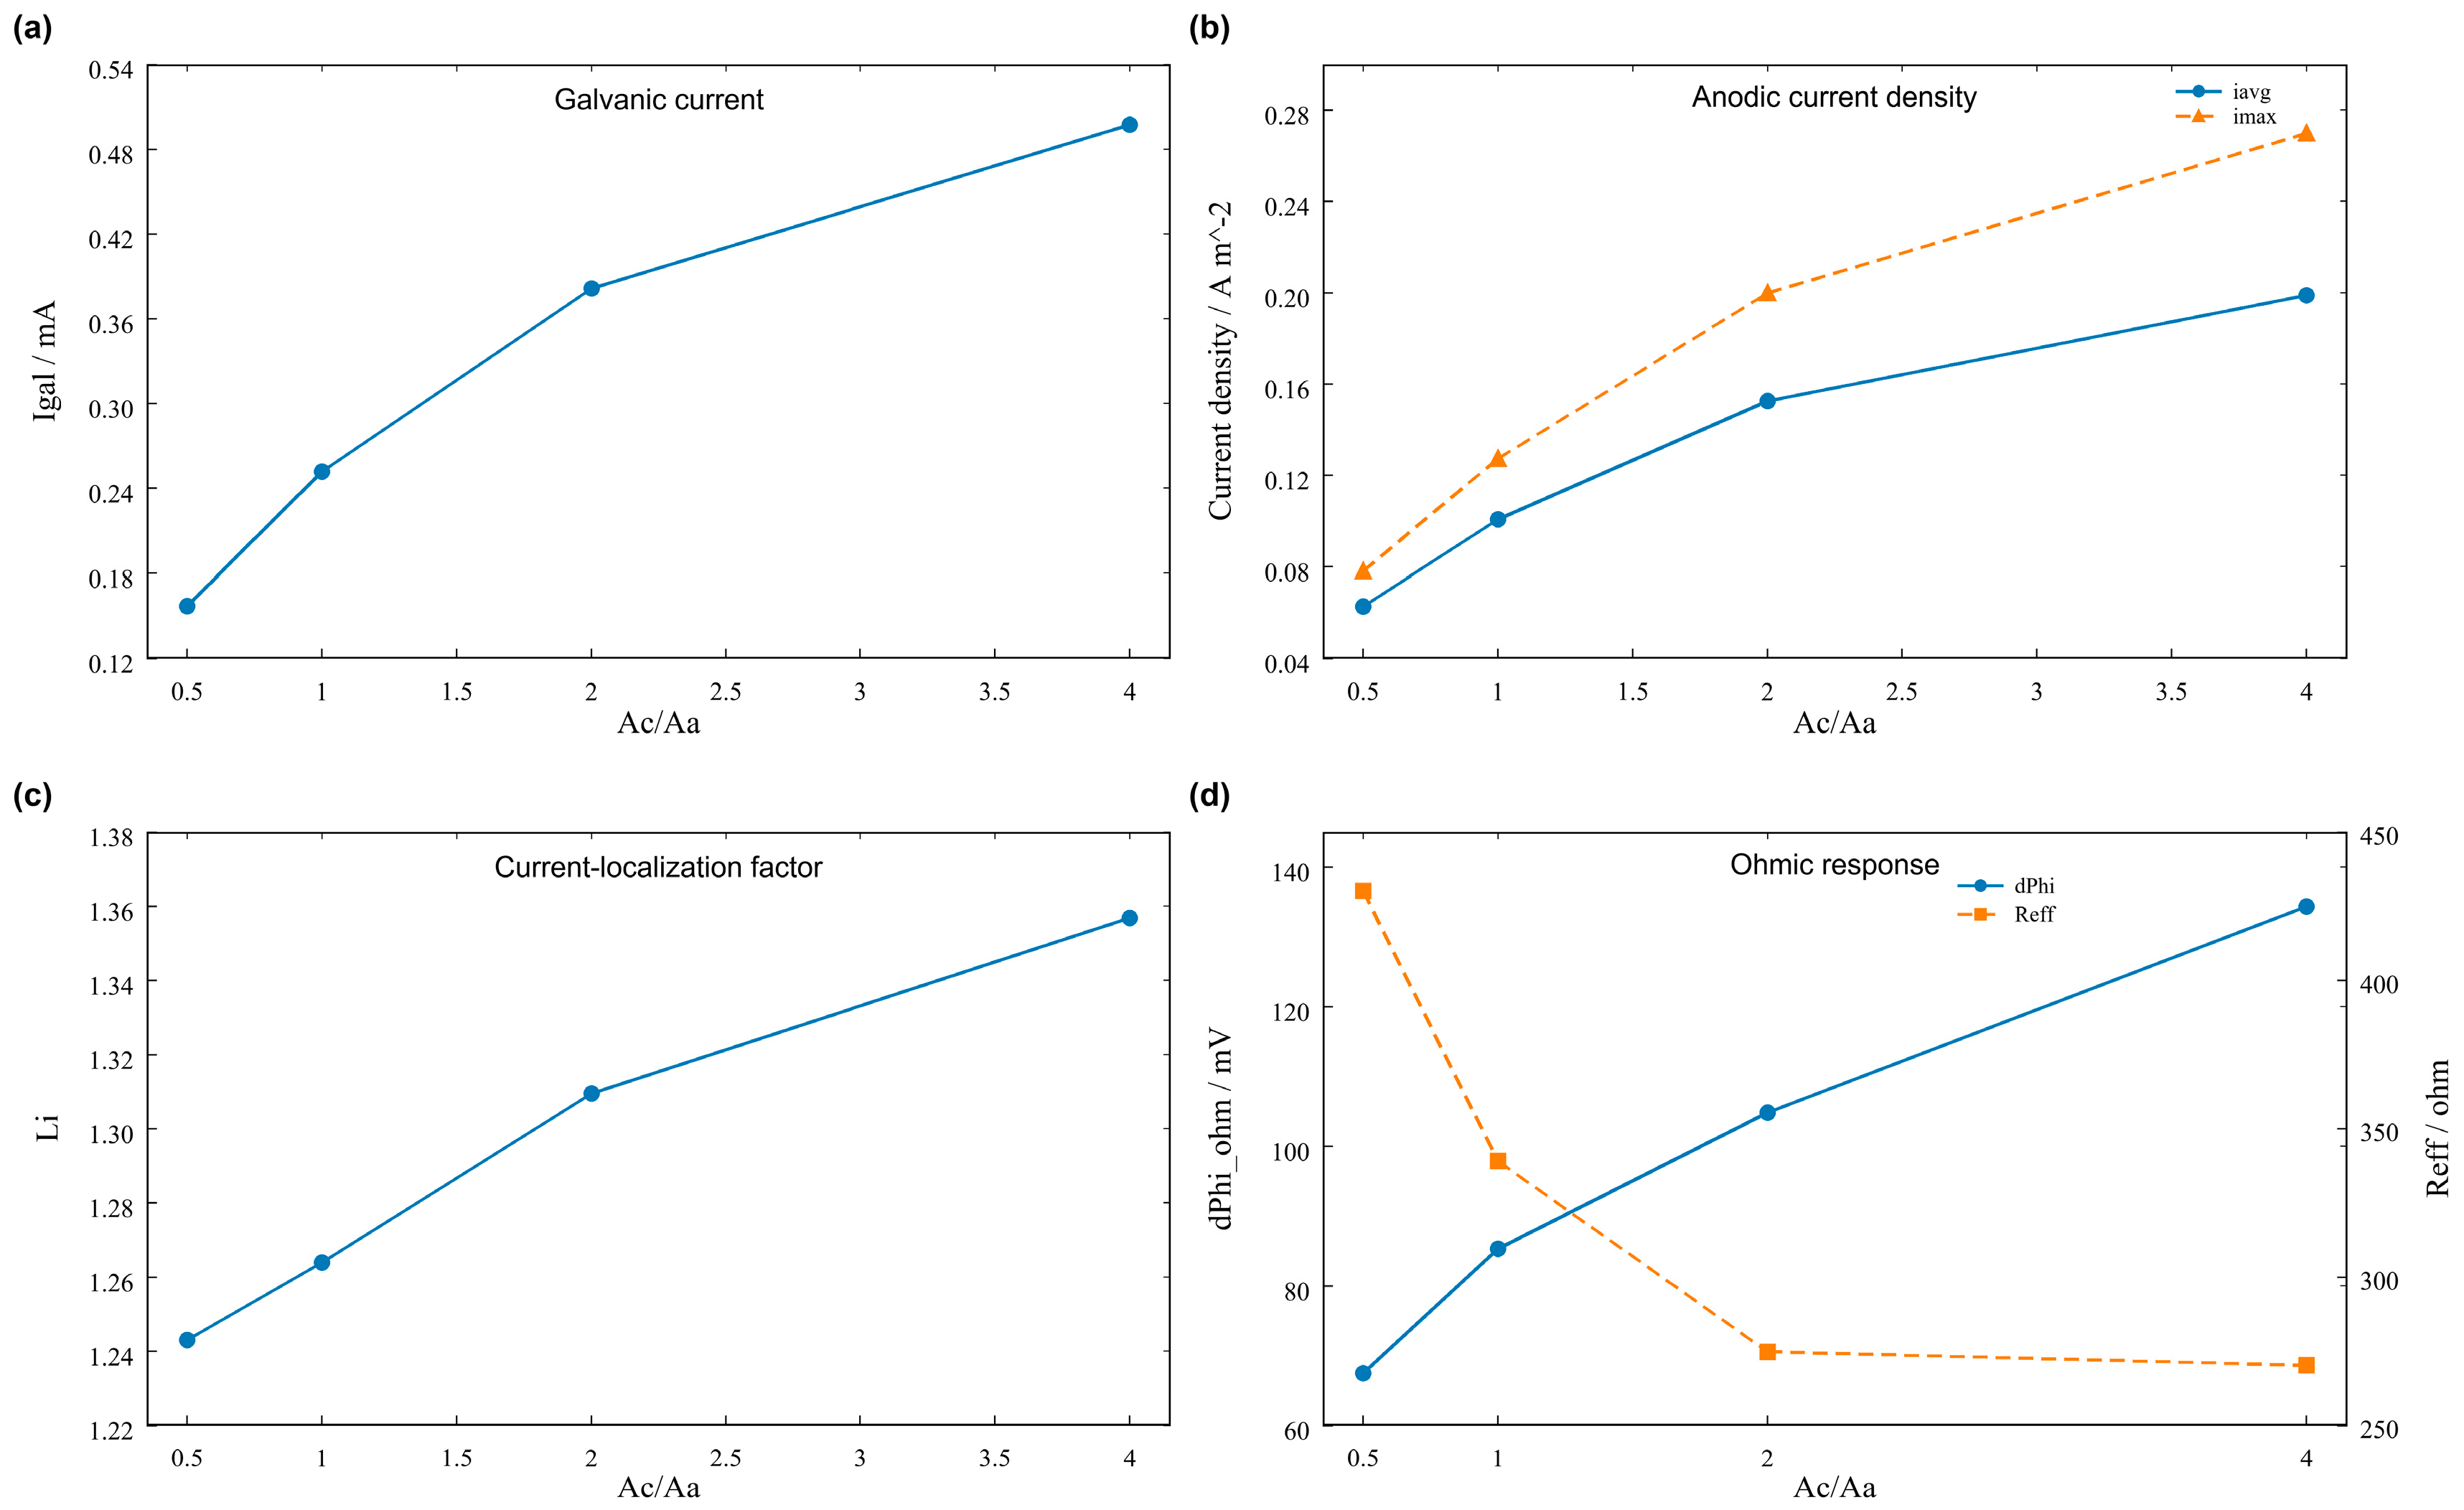
As shown in Figure 3a, the total galvanic current increased monotonically with increasing cathode-to-anode area ratio. When the area ratio increased from 0.5 to 4, the calculated galvanic current rose from
to
corresponding to an increase of approximately 217%. The response was nonlinear: increasing Ac/Aa from 1 to 2 raised Igal from 2.516 × 10⁻⁴ to 3.813 × 10⁻⁴ A, whereas the relative increase became smaller when Ac/Aa was further raised to 4. The added cathodic area therefore increased the galvanic current but with diminishing gain as electrolyte resistance and electrode polarization became increasingly important. The nonlinear increase with cathodic area is consistent with experimental and numerical studies showing that area ratio amplifies anodic demand, while polarization and transport resistances can cause departures from simple proportional scaling [32,33,34,35].
Igal = 1.568 × 10⁻⁴ A
Igal = 4.971 × 10⁻⁴ A
Figure 3.
Effect of cathode-to-anode area ratio on the galvanic response of the 42CrMo/410 stainless-steel couple at a fixed electrode separation of d = 50 mm. (a) Total galvanic current as a function of Ac/Aa. (b) Average anodic current density and maximum core anodic current density on the 42CrMo surface. (c) Current-localization factor Li. (d) Effective ohmic potential drop and effective electrolyte resistance as functions of cathode-to-anode area ratio.
Because the 42CrMo anodic area remained constant throughout the area-ratio sweep, the change in total galvanic current was directly reflected in the average anodic current density. As shown in Figure 3b, iavg increased from 0.0627 A m−2 at Ac/Aa = 0.5 to 0.1988 A m−2 at Ac/Aa = 4, representing the same approximately 3.17-fold increase as the total current. The maximum core anodic current density increased even more strongly, from
to
equivalent to an increase of approximately 246%. Thus, imax increased more strongly than the total or average anodic current as the cathode became larger.
imax = 0.0780 Am−2
imax = 0.2698 Am−2
The stronger increase in imax relative to iavg resulted in a systematic increase in the current-localization factor, as shown in Figure 3c. Specifically,
Li = 1.243, 1.264, 1.310, 1.357
For Ac/Aa = 0.5, 1, 2, and 4, Li increased from 1.243 to 1.357. The area-ratio effect therefore had two simultaneous components: a strong increase in overall anodic loading and a smaller but systematic increase in spatial concentration. This distinction is central to the present analysis because a larger cathode changes not only how much current flows, but also where that current is concentrated on the 42CrMo surface.
The nonlinear current increase is consistent with the solution response in Figure 3d. As Ac/Aa increased from 0.5 to 4, the effective resistance decreased from about 430 to 270 Ω because the larger cathode broadened the current-transfer region, while the ohmic potential drop increased from about 0.0674 to 0.1343 V as the total ionic current rose. The combined behavior explains why cathode enlargement produces a progressively weaker increment in Igal at high Ac/Aa. Comparable area-ratio effects and geometry-dependent current redistribution have been reported across several galvanic systems [28,32,33,34,35].
Overall, increasing Ac/Aa intensified both global galvanic loading and local current concentration. This dual effect is particularly relevant when a relatively small exposed low-alloy-steel region is electrically connected to a much larger stainless-steel component.
3.4. Effect of Electrode Separation on Galvanic Current and Ohmic Transport
Electrode separation provides a second geometric control parameter for the galvanic interaction between 42CrMo steel and 410 stainless steel. In contrast to the cathode-to-anode area ratio, which primarily modifies the available cathodic reaction area, changing the electrode separation directly alters the ionic transport distance through the low-conductivity freshwater electrolyte. To isolate this effect, Ac/Aa was fixed at 1, while the separation distance was varied as
d = 10, 25, 50, 75, 100 mm
All electrochemical kinetic parameters, electrolyte properties, and the calibrated value of kcat = 0.625 were kept unchanged.
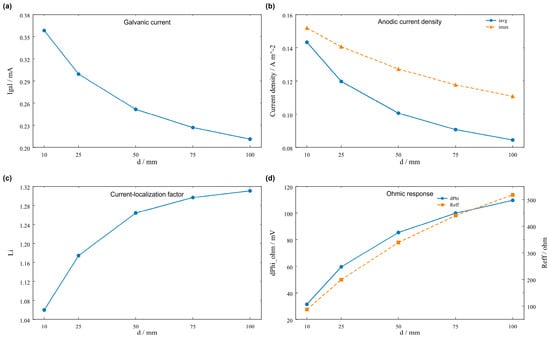
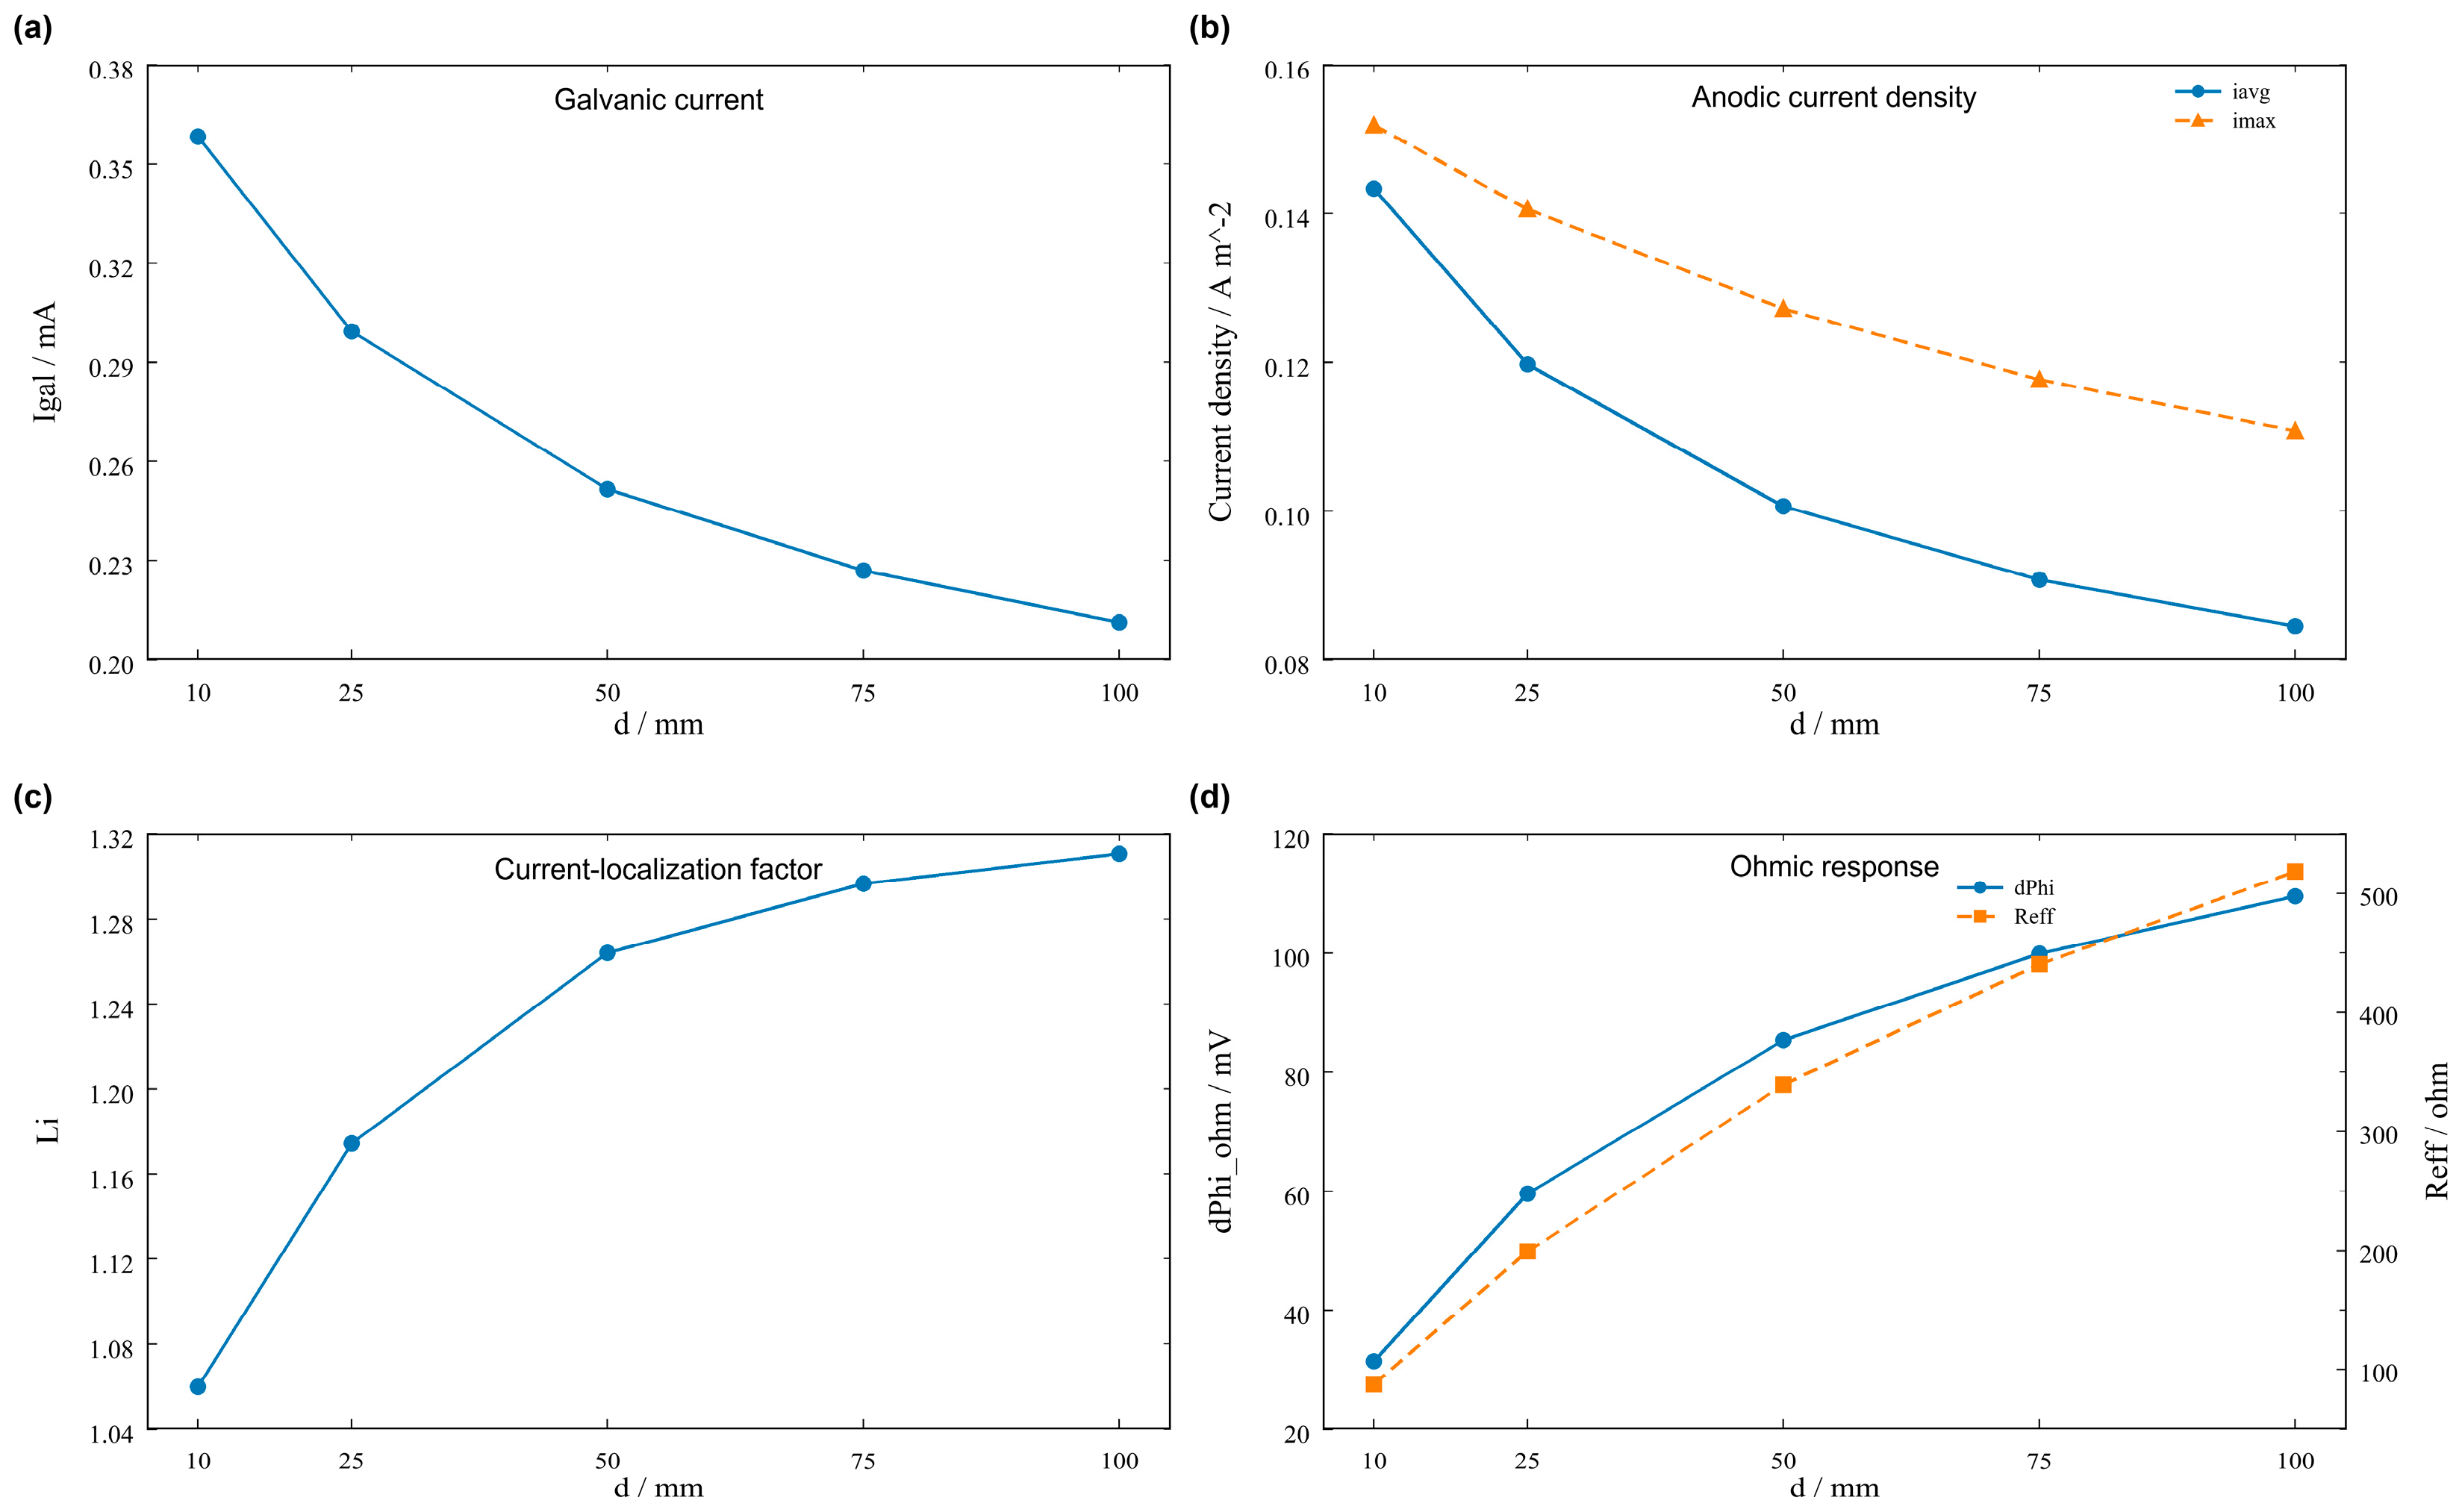
As shown in Figure 4a, increasing the electrode separation produced a pronounced decrease in the total galvanic current. At d = 10 mm,
whereas at d = 100 mm it decreased to
Igal = 3.582 × 10⁻⁴ A
Igal = 2.113 × 10⁻⁴ A
Figure 4.
Effect of electrode separation on the galvanic response of the 42CrMo/410 stainless-steel couple at a fixed cathode-to-anode area ratio of Ac/Aa = 1. (a) Total galvanic current as a function of electrode separation. (b) Average and maximum core anodic current densities on the 42CrMo surface. (c) Current-localization factor Li. (d) Effective electrolyte ohmic potential drop and effective electrolyte resistance as functions of electrode separation.
This corresponds to an overall reduction of approximately 41.0%. Because the exposed area of the 42CrMo anode remained constant, the average anodic current density showed the same trend, decreasing from 0.1433 to 0.0845 A m−2. Thus, increasing the physical separation between the coupled metals effectively reduces the overall anodic electrochemical load imposed on 42CrMo.
The decrease in Igal is controlled by the solution-phase resistance. Reff increased from approximately 87.5 Ω at d = 10 mm to 518.2 Ω at d = 100 mm, while the ohmic potential drop rose from 0.0314 to 0.1095 V (Figure 4d). Increasing separation therefore lengthened the ionic current path and dissipated a larger fraction of the electrochemical driving force within the electrolyte. Related spacer, separation-distance, and thin-electrolyte studies similarly show that increasing the ionic transport path suppresses galvanic current through greater solution-phase resistance [36,37,38].
This spacing effect can be summarized as
d↑ ⇒Reff↑ ⇒ ΔφΩ↑ ⇒Igal↓
Electrode separation therefore acts as an ionic-transport variable in low-conductivity freshwater, with the effective resistance and current magnitude changing together.
The maximum core anodic current density also decreased, from 0.1518 A m−2 at d = 10 mm to 0.1108 A m−2 at d = 100 mm. Thus, both the average and maximum absolute anodic current densities were reduced as the electrodes were separated.
However, the relative spatial nonuniformity of the anodic current showed the opposite tendency. As presented in Figure 4c, the current-localization factor increased systematically from
at d = 10 mm to
Li = 1.060
Li = 1.311
At the same time, Li increased from 1.060 to 1.311, an increase of approximately 23.7%. The spacing effect therefore differs fundamentally from the area-ratio effect: increasing d decreases both Igal and imax, but increases the relative nonuniformity of the remaining current distribution.
This contrast is a second key result of the study. A lower absolute galvanic load does not necessarily correspond to a more uniform anodic current distribution. At larger separation, the current field spreads through a greater electrolyte volume, so some regions of the 42CrMo surface retain a larger fraction of the reduced total current. Accordingly, both absolute local current and normalized localization are needed to describe the geometric effect.
d↑ ⇒Igal↓,imax↓, but Li↑
3.5. Coupled Geometric Control of Galvanic Current and Current Localization
The opposite one-dimensional trends in Section 3.3 and Section 3.4 indicate that area ratio and separation must be considered together. A full factorial matrix combining
with
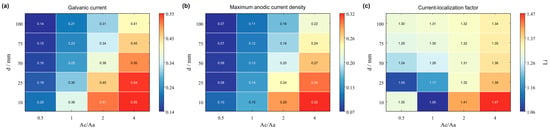
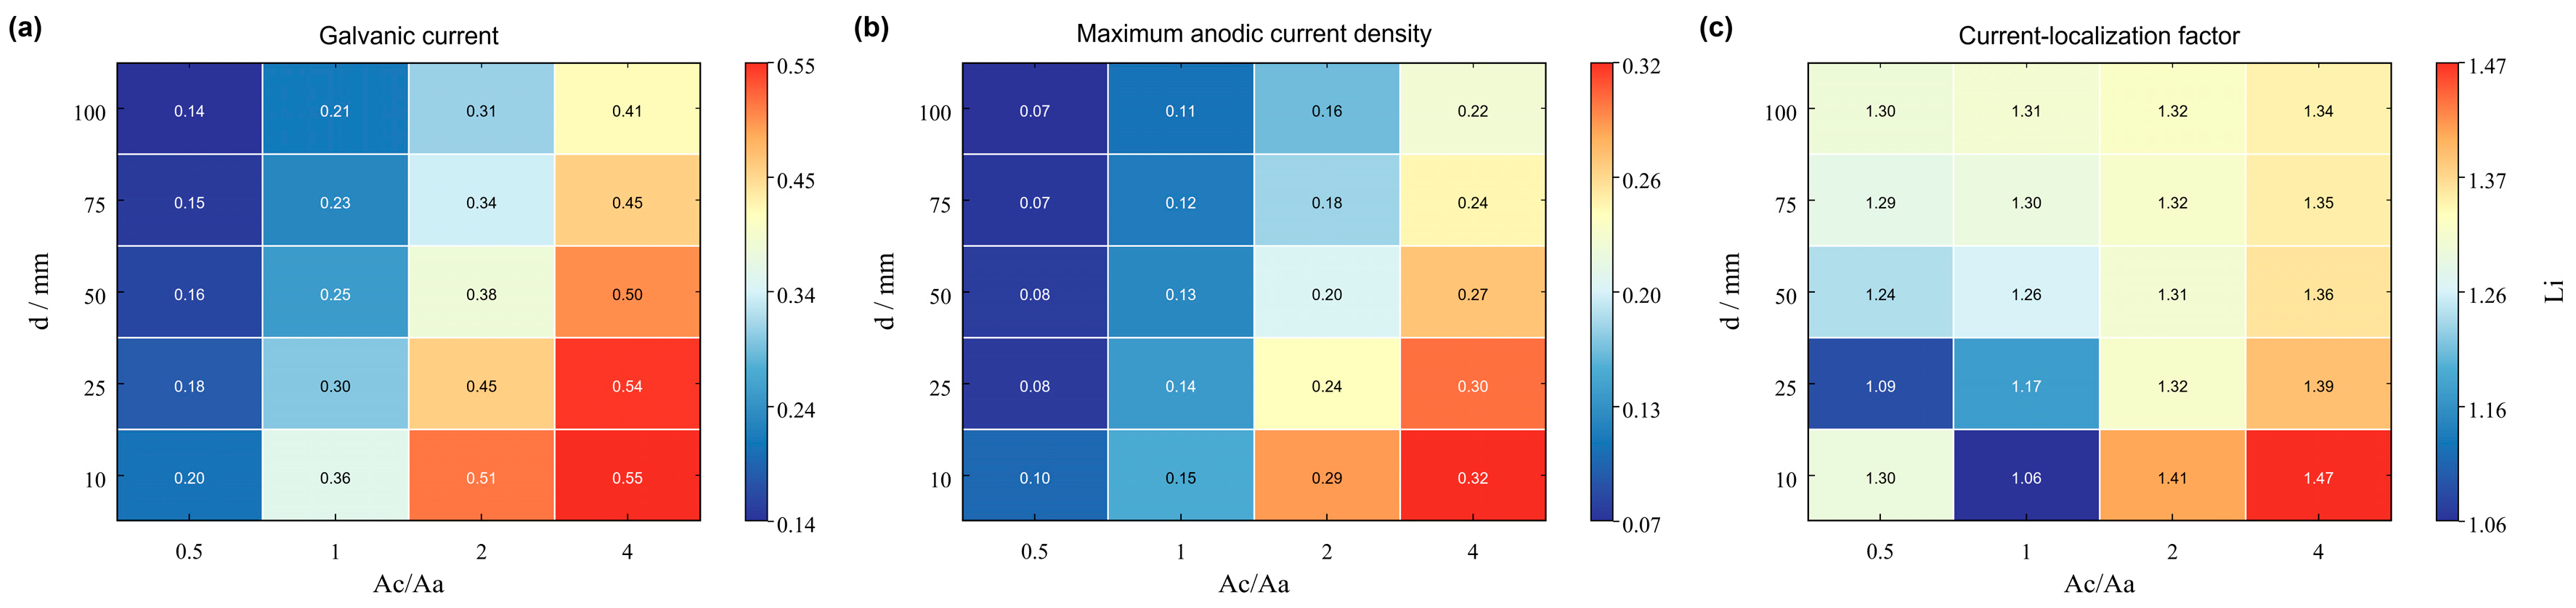
was evaluated, giving 20 geometric configurations. The resulting response maps (Figure 5) directly compare how cathode size and ionic transport distance jointly control Igal, imax, and Li.
Ac/Aa = 0.5, 1, 2, 4
d = 10, 25, 50, 75, 100 mm
Figure 5.
Coupled effects of cathode-to-anode area ratio and electrode separation on the galvanic response of the 42CrMo/410 stainless-steel couple. (a) Response map of total galvanic current Igal. (b) Response map of maximum core anodic current density imax on the 42CrMo surface. (c) Response map of the current-localization factor Li. The maps were constructed from 20 numerical configurations combining Ac/Aa = 0.5, 1, 2, and 4 with d = 10, 25, 50, 75, and 100 mm.
Figure 5a reveals a clear coupled dependence of the total galvanic current on both geometric variables. The largest galvanic current occurred at the combination of the largest cathode-to-anode area ratio and the shortest electrode separation,
for which
Ac/Aa = 4,d = 10 mm
Igal = 5.476 × 10⁻⁴ A
In contrast, the smallest current was obtained for
with
Ac/Aa = 0.5,d = 100 mm
Igal = 1.380 × 10⁻⁴ A
Across the matrix, Igal varied by nearly a factor of four, showing that geometry alone can strongly alter the electrochemical load on 42CrMo even when material and electrolyte properties are unchanged.
More importantly, the two geometric variables interacted rather than contributing independently. At Ac/Aa = 1, increasing d from 10 to 100 mm reduced Igal from 3.582 × 10⁻⁴ to 2.113 × 10⁻⁴ A (about 41%), whereas at Ac/Aa = 4 the same spacing change reduced the current from 5.476 × 10⁻⁴ to 4.139 × 10⁻⁴ A (about 24%). A larger cathode therefore weakened the suppressive effect of increasing separation, so the galvanic response is better represented as
rather than as the simple sum of two independent one-dimensional contributions.
Igal = F(Ac/Aa,d)
A similar coupled pattern is evident in the maximum core anodic current density shown in Figure 5b. The highest value,
again occurred at Ac/Aa = 4 and d = 10 mm, whereas the minimum value,
was obtained at Ac/Aa = 0.5 and d = 100 mm. The high-Igal and high-imax regions largely coincided, indicating that the geometry producing the greatest global galvanic load also produced the greatest absolute local anodic loading.
imax = 0.322 Am−2
imax = 0.0719 Am−2
However, the response of the current-localization factor is more complex. As shown in Figure 5c, Li does not vary monotonically with either geometric parameter over the entire design space. The maximum localization factor
was obtained at Ac/Aa = 4 and d = 10 mm, whereas the minimum value,
occurred at Ac/Aa = 1 and d = 10 mm. Unlike Igal and imax, Li showed a nonmonotonic response across the design space: at Ac/Aa = 1 it increased from 1.060 to 1.311 as d increased from 10 to 100 mm, whereas at Ac/Aa = 4 it decreased from 1.470 to 1.344. Relative localization is therefore controlled by the interaction among current spreading, electrode size, and solution resistance rather than by either geometric parameter alone. Configuration-dependent interactions in multimetal systems have likewise been shown to redistribute potential and current density in ways that cannot be inferred from a single geometric parameter [39].
Li = 1.470
Li = 1.060
The coupled matrix shows that Igal, imax, and Li are complementary rather than interchangeable descriptors: total galvanic current quantifies global anodic demand, maximum local current density indicates the highest absolute local loading, and the localization factor defined in Section 2.8 quantifies relative spatial nonuniformity. Their different responses explain why a geometry with lower total current can still exhibit relatively strong localization, and why total current alone cannot capture the spatial character of galvanic attack.
The response maps further show that the combination
defines the region of highest absolute galvanic risk. In this regime, a large cathodic surface supplies substantial cathodic reaction capacity while the short electrolyte path minimizes ohmic losses, leading simultaneously to high Igal and high imax. Conversely,
produces the lowest absolute galvanic loading because the smaller cathode limits cathodic reaction capacity and the larger separation increases ionic transport resistance.
Ac/Aa↑,d↓
Ac/Aa↓,d↑
From an engineering perspective, lower Ac/Aa and larger d both reduce the absolute electrochemical load, but their effectiveness depends on the coupled configuration; at high Ac/Aa, increasing separation provides a smaller reduction in current because the larger cathodic area sustains galvanic reaction despite the longer transport path. Recent secondary-current-distribution simulations of dissimilar-metal joints also demonstrate that insulation distance and geometric configuration can serve as practical variables for controlling galvanic current [40].
3.6. Parameter Sensitivity and Three-Dimensional Finite-Size Effects
Parameter sensitivity and three-dimensional calculations were used to determine which conclusions are controlled by electrochemical inputs and which are controlled by geometry.
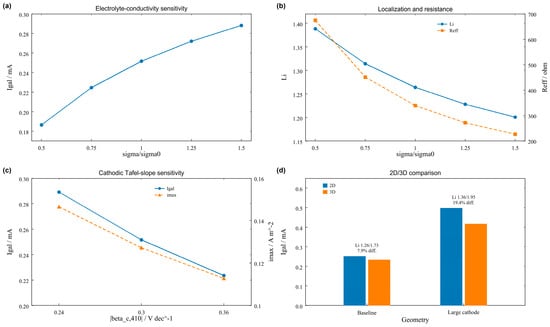
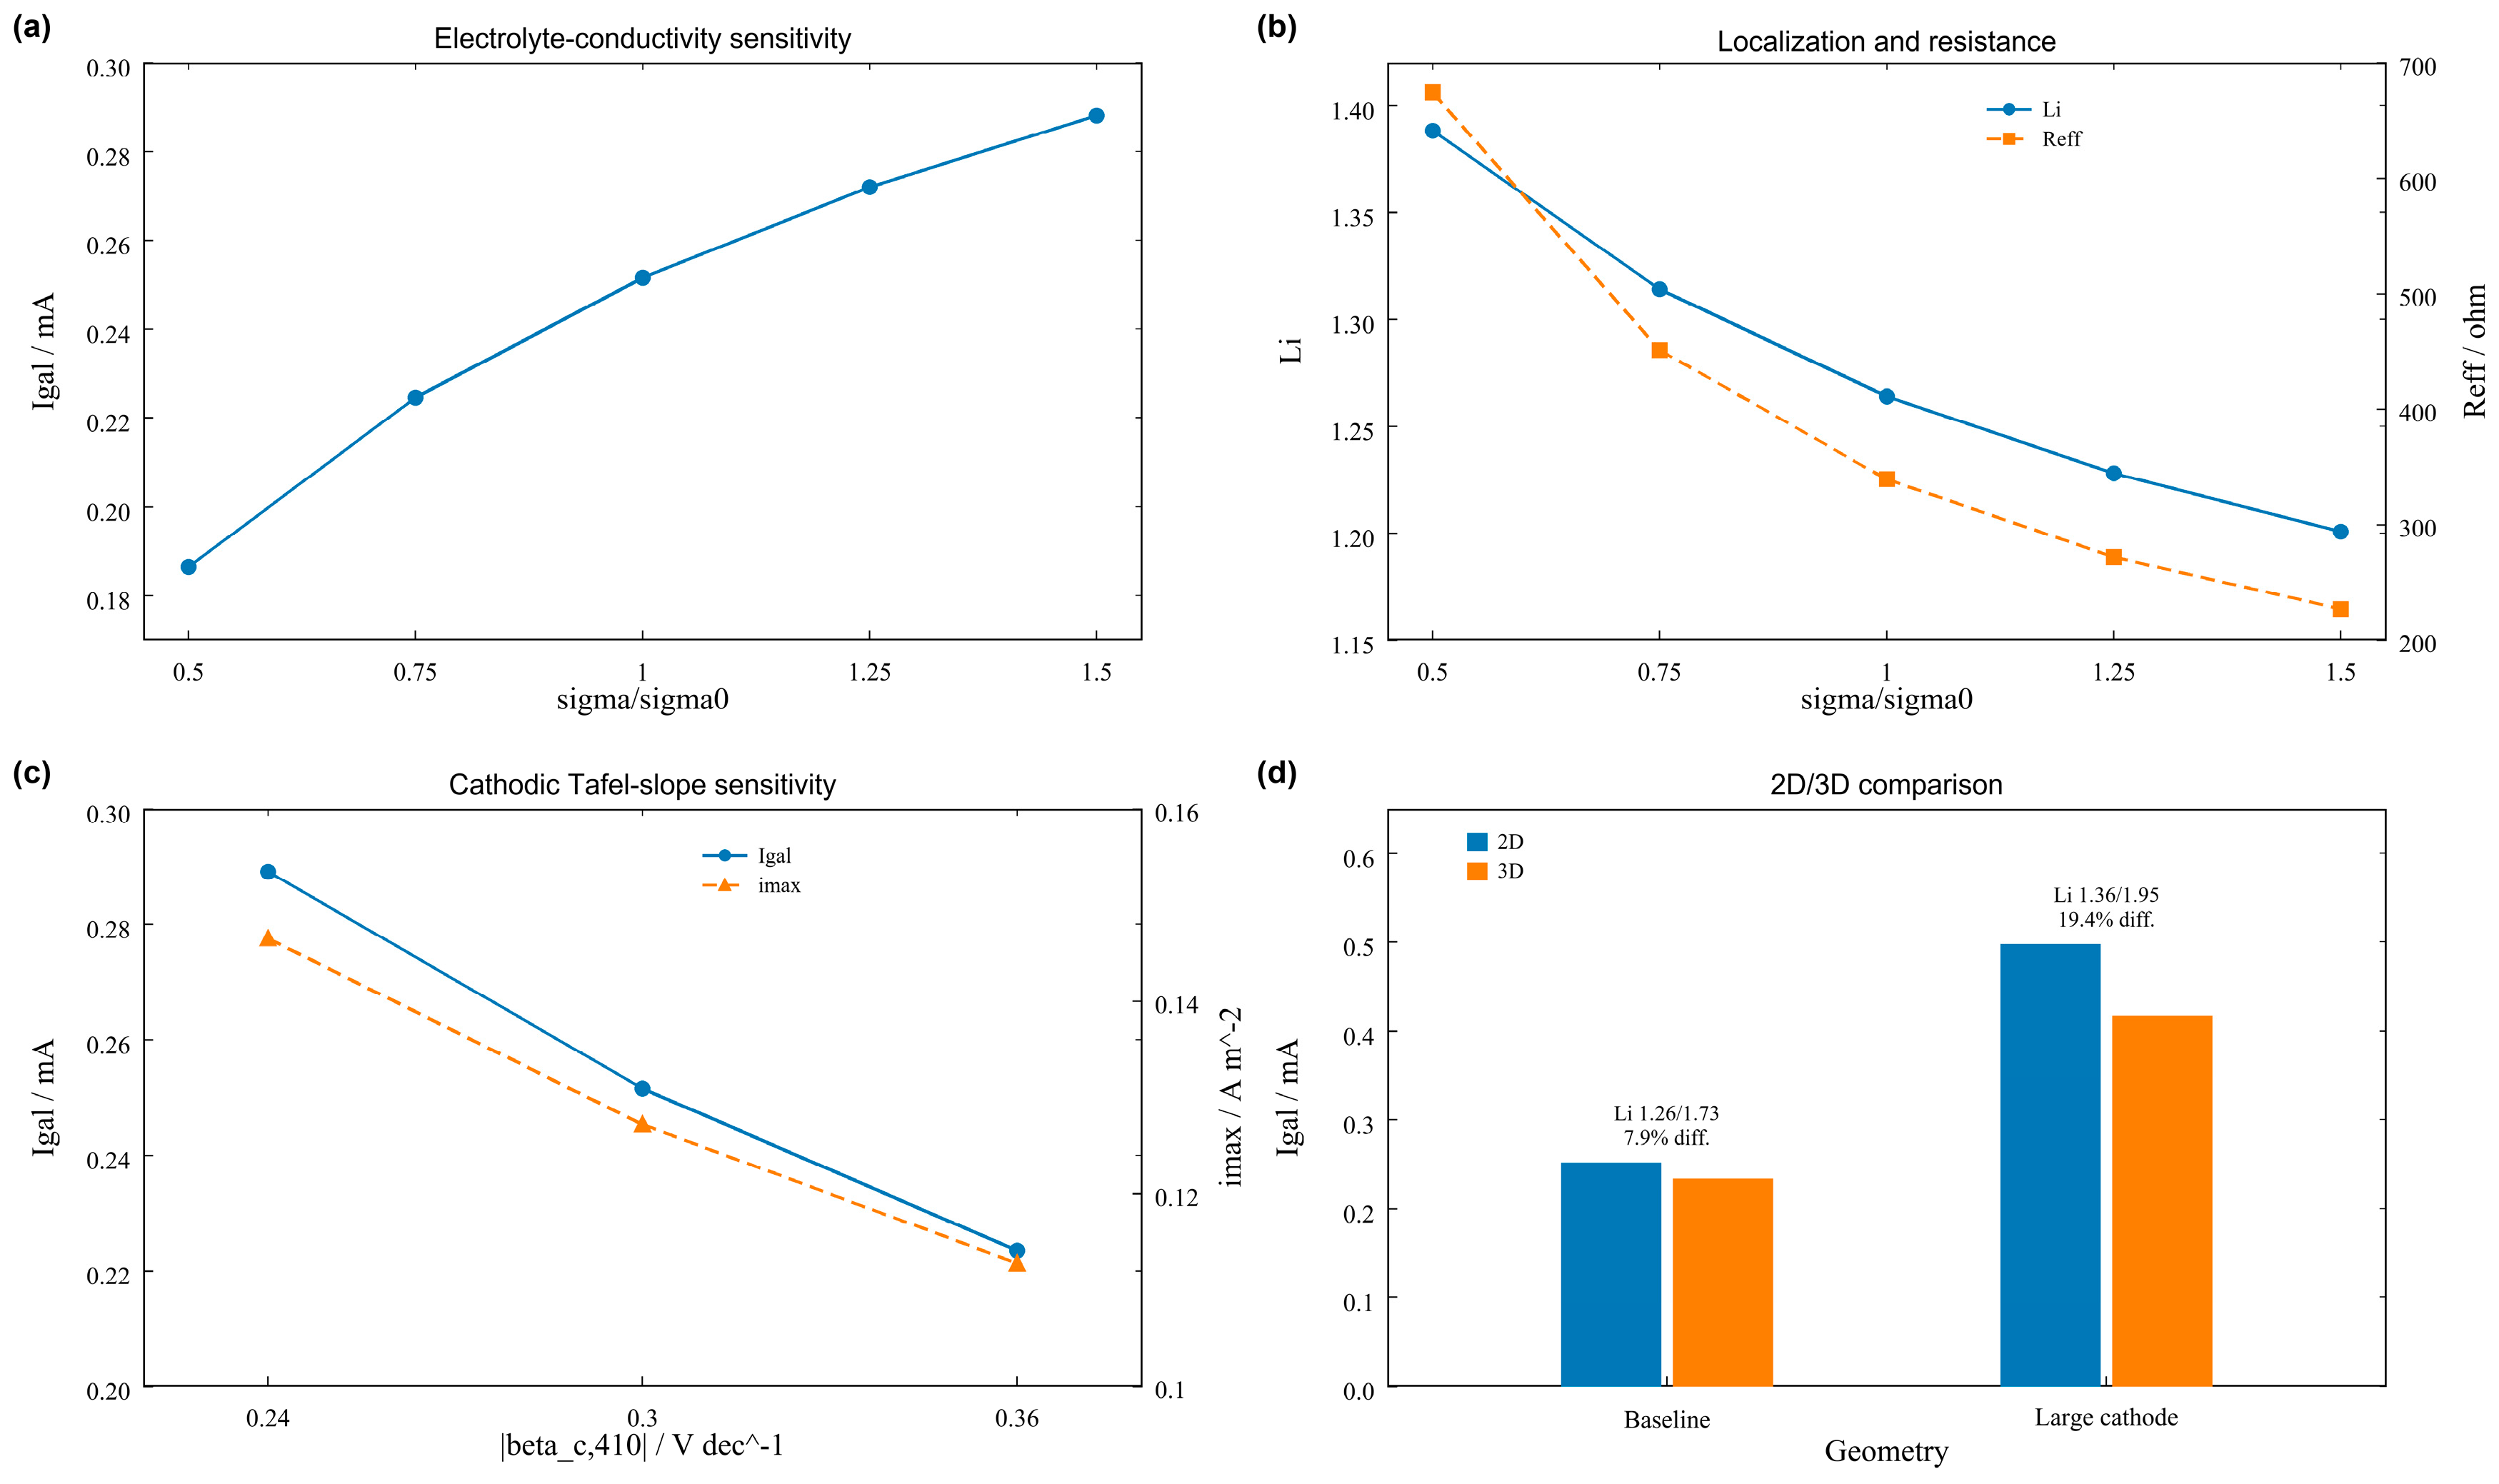
The conductivity of the freshwater electrolyte had a pronounced influence on the magnitude of the galvanic current. As shown in Figure 6a, the conductivity was varied from 0.5 to 1.5 times the baseline value,
and the total galvanic current increased from 1.864 × 10⁻⁴ to 2.881 × 10⁻⁴ A. This increase was accompanied by a decrease in the effective electrolyte resistance from approximately 674 to 227 Ω. The conductivity dependence can therefore be summarized as
σ0 = 0.043 S m−1
σ ↑ ⇒ R_eff ↓ ⇒ I_gal ↑
Figure 6.
Parameter sensitivity and three-dimensional finite-size effects for the 42CrMo/410 stainless-steel galvanic model. (a) Effect of normalized electrolyte conductivity σ/σ0 on the total galvanic current Igal. (b) Effect of normalized electrolyte conductivity on the current-localization factor Li and effective electrolyte resistance Reff. (c) Sensitivity of total galvanic current Igal and maximum core anodic current density imax to the cathodic Tafel slope of 410 stainless steel. (d) Comparison of total galvanic current predicted by the 2D and 3D models for Ac/Aa = 1 and 4 at d = 50 mm; the corresponding localization factors are indicated for comparison.
Thus, conductivity primarily controls the absolute current scale through electrolyte resistance. Similar sensitivity of galvanic response to electrolyte transport properties has been reported in validated finite-element studies [35,38].
Li changed in the opposite direction, decreasing from 1.388 to 1.201 as conductivity increased from 0.5σ0 to 1.5σ0. Higher conductivity therefore increased total current but promoted broader current spreading, again separating current magnitude from normalized localization.
The influence of the 410 stainless-steel cathodic Tafel slope was examined by varying its magnitude over:
|βc,410| = 0.24, 0.30, and 0.36 V dec−1
The corresponding total galvanic currents were 2.891 × 10⁻⁴, 2.516 × 10⁻⁴, and 2.234 × 10⁻⁴ A, respectively. In contrast, the localization factor remained nearly unchanged:
for the three cathodic Tafel slopes, respectively. The cathodic kinetic parameter therefore changed the absolute current magnitude much more strongly than the normalized spatial distribution.
L_i = 1.267, 1.264, 1.262
Mesh refinement from 2 to 0.25 mm changed Igal by less than 0.1%, whereas Li changed from approximately 1.25 to 1.32. Endpoint-cutoff variation showed the same pattern: integrated current was stable, while maximum-based localization metrics were more sensitive.
The influence of dimensional representation was finally examined by comparing the simplified 2D model with finite-size 3D calculations. For the baseline geometry,
the 2D model predicted
whereas the corresponding 3D model gave
A_c/A_a = 1, d = 50 mm
I_gal,2D = 2.516 × 10⁻⁴ A
I_gal,3D = 2.332 × 10⁻⁴ A
The relative difference was approximately 7.86% (Figure 6d), indicating similar global current levels for the baseline geometry.
At Ac/Aa = 4, the 2D and 3D currents were 4.971 × 10⁻⁴ and 4.165 × 10⁻⁴ A, respectively, a difference of approximately 19.36%. The larger deviation reflects finite-width current spreading and three-dimensional edge effects as the cathode size increases. Validated finite-element studies have similarly shown that finite-dimensional geometry and evolving local interfaces can change spatial corrosion patterns even when the global electrochemical response is reproduced [41,42].
The difference between 2D and 3D descriptions was even more evident for the current-localization factor. For the baseline configuration,
whereas at Ac/Aa = 4 the corresponding values were
L_i,2D = 1.264, L_i,3D = 1.725
L_i,2D = 1.357, L_i,3D = 1.950
The dimensional comparison therefore reinforces the same global-local distinction observed in the geometric sweeps: the 2D model captures the overall current scale and relative geometry trends efficiently, whereas the 3D model resolves stronger finite-size local concentration. Related validated models likewise show that spatially resolved corrosion fields can be more geometry-sensitive than integrated current metrics [41,42].
Overall, conductivity and cathodic kinetics mainly shifted the absolute current magnitude, while model dimensionality had a stronger effect on local peak localization. The principal geometry-dependent separation among Igal, imax, and Li remained evident across these sensitivity analyses.
3.7. Engineering Implications and Corrosion Mitigation
The 20 geometric configurations provide a basis for identifying galvanic-coupling arrangements that impose greater anodic loading on 42CrMo steel. At d = 50 mm, increasing Ac/Aa from 0.5 to 4 increased the total galvanic current from 1.57 × 10⁻⁴ to 4.97 × 10⁻⁴ A and the maximum core anodic current density from 0.0780 to 0.2698 A m−2. A large stainless-steel cathode connected to a relatively small 42CrMo surface therefore increases both the integrated galvanic current and localized anodic demand.
Electrode separation controls the electrolyte transport path. At Ac/Aa = 1, increasing d from 10 to 100 mm reduced the total galvanic current by approximately 41% and the maximum anodic current density from 0.1518 to 0.1108 A m−2. However, the current-localization factor increased from 1.060 to 1.311, showing that a reduction in absolute current does not necessarily imply a more uniform anodic distribution. The largest total galvanic current in the computed matrix occurred at Ac/Aa = 4 and d = 10 mm; the smallest occurred at Ac/Aa = 0.5 and d = 100 mm.
For corrosion mitigation, reducing the exposed cathode-to-anode area ratio and increasing separation, where structurally feasible, can lower galvanic loading. Electrical isolation through insulating gaskets, sleeves, or bushings can interrupt the metallic conduction path between dissimilar components; protective coatings can additionally reduce the electrochemically exposed area. Such measures should be evaluated with regard to mechanical requirements, coating integrity, and service conditions. The present simulations quantify the effects of electrode geometry, whereas the protective effects of electrical isolation and coatings were not independently simulated in this work [22,23,24].
These results support the combined use of total galvanic current, maximum local anodic current density, and normalized localization when screening connection geometries. The computed distributions offer comparative guidance for configurations in low-conductivity freshwater rather than direct predictions of long-term material-loss depth. Related studies have examined high-temperature oxidation [43] and aqueous ferrihydrite transformation [44].
4. Conclusions
The galvanic corrosion of 42CrMo steel coupled with 410 stainless steel in low-conductivity Yangtze River freshwater was investigated by integrating electrochemical characterization with numerical current-distribution analysis. The principal conclusions are as follows:
1. Galvanic coupling produced a strongly nonuniform anodic current distribution on 42CrMo steel. Under the baseline geometry (Ac/Aa = 1, d = 50 mm), the calibrated model yielded a total galvanic current of 2.52 × 10⁻⁴ A, an average anodic current density of 0.101 A m−2, and a maximum core current density of 0.127 A m−2, corresponding to a localization factor of approximately 1.26. The spatial current profile showed enhanced anodic loading near the electrode boundaries, indicating that the total galvanic current alone cannot fully represent local corrosion severity.
2. The cathode-to-anode area ratio strongly controlled both global and local galvanic loading. At a fixed separation of 50 mm, increasing Ac/Aa from 0.5 to 4 increased the total galvanic current from 1.57 × 10⁻⁴ to 4.97 × 10⁻⁴ A and increased the maximum anodic current density from 0.078 to 0.270 A m−2. The localization factor also increased from approximately 1.24 to 1.36, demonstrating that enlargement of the cathodic area increases not only the overall anodic demand but also the relative degree of current concentration.
3. Increasing electrode separation suppressed the absolute galvanic current through increased electrolyte resistance, but did not necessarily improve current uniformity. At Ac/Aa = 1, increasing d from 10 to 100 mm reduced the total galvanic current by approximately 41% and increased the effective electrolyte resistance from about 88 to 518 Ω. However, the localization factor increased from 1.06 to 1.31. Thus, greater separation reduces the absolute electrochemical load but can simultaneously increase the relative nonuniformity of the remaining anodic current.
4. Area ratio and electrode separation exhibited a coupled rather than purely additive effect. Across the 20 simulated geometries, the total galvanic current ranged from 1.38 × 10⁻⁴ A for Ac/Aa = 0.5 and d = 100 mm to 5.48 × 10⁻⁴ A for Ac/Aa = 4 and d = 10 mm. The regions of high total current and high maximum local current largely coincided, whereas the localization factor showed a more complex response. Therefore, Igal, imax, and Li should be considered complementary descriptors of global loading, absolute local loading, and relative spatial localization, respectively.
5. Sensitivity analysis showed that electrolyte conductivity and the 410 stainless-steel cathodic Tafel slope mainly affected the absolute galvanic-current magnitude. The 2D and 3D total currents differed by 7.9% for the baseline geometry and by 19.4% at Ac/Aa = 4, while the 3D calculations produced stronger edge-current concentration. These results highlight the different sensitivities of global current and local peak current to electrochemical and dimensional parameters.
Overall, the galvanic corrosion behavior of the 42CrMo/410 stainless-steel couple in low-conductivity freshwater is controlled by the interaction among cathodic area, ionic transport distance, and current redistribution. Reducing the cathode-to-anode area ratio and increasing the separation between dissimilar metals reduce the absolute galvanic load on 42CrMo steel, while the spatial distribution of anodic current provides additional information on local electrochemical loading.
Supplementary Materials
The following supporting information can be downloaded at: https://www.mdpi.com/article/10.3390/coatings16111316/s1, Figure S1: Effect of electrode-boundary mesh refinement on total galvanic current and core peak normal current density; Figure S2: Domain-height sensitivity at a cathode-to-anode area ratio of 4; Figure S3: Sensitivity to endpoint exclusion; Figure S4: Logged nonlinear-iteration histories of solver solution and residual estimates; Table S1: Baseline geometry, operating conditions, and kinetic parameters; Table S2: Mesh-refinement results; Table S3: Charge-balance residuals for the mesh-refinement sequence; Table S4: Computational-domain-height sensitivity results; Table S5: Endpoint-exclusion sensitivity results; Table S6: Nonlinear-solver iteration records; Table S7: Summary of numerical-verification findings.
Author Contributions
Conceptualization, S.Z. and G.C.; methodology, G.C. and Z.W.; software, M.Z.; validation, Y.Z. and M.Z.; formal analysis, G.C. and Z.W., investigation, S.Z. and Y.Z., resources, G.W.; data curation, S.Z. and Y.Z.; writing—original draft preparation, S.Z. and G.C.; writing—review and editing, G.C., M.Z. and Z.W.; visualization, M.Z. and Z.W.; supervision, G.W.; project administration, G.W.; funding acquisition, G.W. All authors have read and agreed to the published version of the manuscript.
Funding
This research was financially supported by the Research Projects of China Yangtze Power Co., Ltd. (No. Z232402031).
Institutional Review Board Statement
Not applicable. This study did not involve human participants, human data, or animals.
Informed Consent Statement
Not applicable.
Data Availability Statement
The data supporting the findings of this study are available from the corresponding authors upon reasonable request.
Acknowledgments
OpenAI ChatGPT (https://chatgpt.com/) was used solely for English-language polishing of the manuscript. The authors reviewed and approved the language edits and take full responsibility for the content of this publication.
Conflicts of Interest
S.Z., Y.Z., and G.W. are employees of China Yangtze Power Co., Ltd., which financially supported this study. The other authors declare no competing interests.
References
- Fushimi, K.; Naganuma, A.; Azumi, K.; Kawahara, Y. Current Distribution during Galvanic Corrosion of Carbon Steel Welded with Type-309 Stainless Steel in NaCl Solution. Corros. Sci. 2008, 50, 903–911. [Google Scholar] [CrossRef] [Scilit]
- Song, G.-L. Potential and Current Distributions of One-Dimensional Galvanic Corrosion Systems. Corros. Sci. 2010, 52, 455–480. [Google Scholar] [CrossRef] [Scilit]
- Arya, C.; Vassie, P.R.W. Influence of Cathode-to-Anode Area Ratio and Separation Distance on Galvanic Corrosion Currents of Steel in Concrete Containing Chlorides. Cem. Concr. Res. 1995, 25, 989–998. [Google Scholar] [CrossRef] [Scilit]
- Zhu, G.; Xuan, Y.; Feng, J.; Wang, L. Effect of Guide Vane Opening Speed on Multiscale Flow Characteristics in a Francis Turbine during Load Variation. Energy 2026, 355, 141210. [Google Scholar] [CrossRef] [Scilit]
- Shi, L.; Song, Y.; Zhao, P.; Wang, H.; Dong, K.; Shan, D.; Han, E.-H. Variations of Galvanic Currents and Corrosion Forms of 2024/Q235/304 Tri-Metallic Couple with Multivariable Cathode/Anode Area Ratios: Experiments and Modeling. Electrochim. Acta 2020, 359, 136947. [Google Scholar] [CrossRef] [Scilit]
- Si, C.Y.; Li, Y.Y.; Duan, J.M.; Khan, S.; Guan, H.; Zhang, G.A. Decoding the Roles of Applied Stress and Exposed Area Ratio in the Galvanic Corrosion of N80 Carbon Steel and 13Cr Stainless Steel in Supercritical CO2 Environment. Electrochim. Acta 2026, 574, 149537. [Google Scholar] [CrossRef] [Scilit]
- Varela, F.E.; Kurata, Y.; Sanada, N. The Influence of Temperature on the Galvanic Corrosion of a Cast Iron-Stainless Steel Couple (Prediction by Boundary Element Method). Corros. Sci. 1997, 39, 775–788. [Google Scholar] [CrossRef] [Scilit]
- Cao, X.; Hu, X. The Investigation of Micro-Galvanic Corrosion of SAF 2205 Duplex Stainless Steel Based on Numerical Simulation Model and Immersion Test. Corros. Sci. 2022, 207, 110601. [Google Scholar] [CrossRef] [Scilit]
- Ai, D.; Shi, Z.; Sun, Z.; Li, T.; Zhang, D.; Wang, Z.; Wang, Z.; Fu, Y.; Tang, X.; Hu, S. Modeling Galvanic Corrosion of 316L/40Cr and Ni-P Coated 42CrMo Alloys in Downhole Produced Water Corrosion Environment. Modell. Simul. Mater. Sci. Eng. 2025, 33, 045003. [Google Scholar] [CrossRef] [Scilit]
- Tian, S.Y.; Si, C.Y.; Xue, R.Y.; Khan, S.; Duan, J.M.; Jiang, Z.N.; Zhang, G.A. Inhibition of the Galvanic Corrosion of Carbon Steel-Stainless Steel: Integrated Experimental Approaches, Finite Element Simulations, and First-Principles Calculations. Corros. Sci. 2026, 260, 113520. [Google Scholar] [CrossRef] [Scilit]
- Shi, L.; Song, Y.; Dong, K.; Cai, Y.; Han, E.-H. Experiment and Simulation of the Galvanic Corrosion of Trimetallic Couple under Thin Electrolyte Film Condition. Corros. Eng. Sci. Technol. 2026. Epub ahead of printing. [Google Scholar] [CrossRef] [Scilit]
- Li, Y.; Zhou, M.; Lyu, X.; Wang, Z. Galvanic Corrosion Behavior of 42CrMo and Stainless Steel in Yangtze River Freshwater Environment. Electroplat. Finish. 2026, 45, 169–175. [Google Scholar] [CrossRef]
- Katona, R.M.; Taylor, J.; Schaller, R.F. Validating Corrosion Models: A Comparison of Governing Equations. Corros. Sci. 2026, 259, 113495. [Google Scholar] [CrossRef] [Scilit]
- Yu, Y.; Wang, X.; Wei, S.; Chen, Z.; Wang, Z.; Li, M.; Liu, Z. Corrosion Behavior and Mechanism of 304 Stainless Steel Welded Joints in Simulated Freshwater Environment. Materials 2025, 18, 3074. [Google Scholar] [CrossRef] [Scilit]
- Deng, Z.; Zhao, B.; Li, S.; Li, Z.; Zhang, S.; Zhang, K.; Zhu, Z. An Efficient CuZr-Based Metallic Glasses Electrode Material for Electrocatalytic Degradation of Azo Dyes. J. Environ. Sci. 2024, 136, 537–546. [Google Scholar] [CrossRef] [Scilit]
- Zhao, X.; Zhang, C.; Liu, B.; Zhao, H.; Gao, X.; Wang, Y.; Zhang, Y.; Liu, D.; Wang, C.-C. Resource Mining from Stainless Steel Pickling Wastewater to Produce Metal-Organic Frameworks. Resour. Conserv. Recycl. 2023, 188, 106647. [Google Scholar] [CrossRef] [Scilit]
- Fang, L.; Mi, W.; Li, Y.; Ai, X.; Bi, Y. Water Level Fluctuations Shape Phytoplankton Community in the Xiangxi Bay from Three Gorges Reservoir. J. Environ. Sci. 2025, 157, 111–122. [Google Scholar] [CrossRef] [Scilit]
- Yuan, L.; Fang, L.; Wang, Y.; Mi, W.; Li, J.; Zhang, G.; Yang, P.; Chen, Z.; Bi, Y. Anthropogenic Activities Accelerated the Evolution of River Trophic Status. Ecol. Indic. 2022, 136, 108584. [Google Scholar] [CrossRef] [Scilit]
- Ji, L.; Li, Y.; Zhang, G.; Bi, Y. Anthropogenic Disturbances Have Contributed to Degradation of River Water Quality in Arid Areas. Water 2021, 13, 3305. [Google Scholar] [CrossRef] [Scilit]
- Dong, C.F.; Xiao, K.; Li, X.G.; Cheng, Y.F. Erosion Accelerated Corrosion of a Carbon Steel–Stainless Steel Galvanic Couple in a Chloride Solution. Wear 2010, 270, 39–45. [Google Scholar] [CrossRef] [Scilit]
- Wu, T.; Qin, J.; Zhang, X.; Qu, S.; Feng, X.; Guo, R. Galvanic Corrosion of Mill-Scaled Carbon Steel Coupled to AISI 304 Stainless Steel in the Chloride-Contaminated Mortars. J. Mater. Civ. Eng. 2023, 35, 4023087. [Google Scholar] [CrossRef] [Scilit]
- Abreu, C.M.; Cristóbal, M.J.; Montemor, M.F.; Nóvoa, X.R.; Pena, G.; Pérez, M.C. Galvanic Coupling between Carbon Steel and Austenitic Stainless Steel in Alkaline Media. Electrochim. Acta 2002, 47, 2271–2279. [Google Scholar] [CrossRef] [Scilit]
- Hodgkiess, T.; Maciver, A.; Chong, P.Y. Galvanic Studies Related to the Use in Desalination Plant of Corrosion-Resistant Materials. Desalination 1987, 66, 147–170. [Google Scholar] [CrossRef] [Scilit]
- Ahlström, J.; Tidblad, J.; Sandberg, B.; Wadsö, L. Galvanic Corrosion Properties of Steel in Water Saturated Concrete. Mater. Corros. 2015, 66, 67–75. [Google Scholar] [CrossRef] [Scilit]
- Attarchi, M.; Brenna, A.; Ormellese, M. FEM Simulation of Corrosion under Macro-Cell Mechanism. Corros. Sci. 2021, 179, 109116. [Google Scholar] [CrossRef] [Scilit]
- Newman, J.; Thomas-Alyea, K.E. Electrochemical Systems, 3rd ed.; John Wiley & Sons: Hoboken, NJ, USA, 2004. [Google Scholar]
- Bard, A.J.; Faulkner, L.R. Electrochemical Methods: Fundamentals and Applications, 2nd ed.; John Wiley & Sons: New York, NY, USA, 2001. [Google Scholar]
- Jia, J.X.; Song, G.; Atrens, A. Influence of Geometry on Galvanic Corrosion of AZ91D Coupled to Steel. Corros. Sci. 2006, 48, 2133–2153. [Google Scholar] [CrossRef] [Scilit]
- Trinh, D.; Dauphin Ducharme, P.; Tefashe, U.M.; Kish, J.R.; Mauzeroll, J. Influence of Edge Effects on Local Corrosion Rate of Magnesium Alloy/Mild Steel Galvanic Couple. Anal. Chem. 2012, 84, 9899–9906. [Google Scholar] [CrossRef] [Scilit]
- Murer, N.; Oltra, R.; Vuillemin, B.; Neel, O. Numerical Modelling of the Galvanic Coupling in Aluminium Alloys: A Discussion on the Application of Local Probe Techniques. Corros. Sci. 2010, 52, 130–139. [Google Scholar] [CrossRef] [Scilit]
- Thebault, F.; Vuillemin, B.; Oltra, R.; Allely, C.; Ogle, K. Reliability of Numerical Models for Simulating Galvanic Corrosion Processes. Electrochim. Acta 2012, 82, 349–355. [Google Scholar] [CrossRef] [Scilit]
- Deshpande, K.B. Validated Numerical Modelling of Galvanic Corrosion for Couples: Magnesium Alloy (AE44)-Mild Steel and AE44-Aluminium Alloy (AA6063) in Brine Solution. Corros. Sci. 2010, 52, 3514–3522. [Google Scholar] [CrossRef] [Scilit]
- Chen, G.; Huai, X.; Xu, G.; Zhang, W.; Han, X.; Wang, D.; Yin, Q.; Xie, D.; Chen, Y. The Effect of Multielectrode Galvanic Corrosion Behavior and Area Ratio on 6061 Aluminum Alloy, Q235 Stainless Steel, and Carbon Fiber Composites. Mater. Corros. 2025, 76, 112–121. [Google Scholar] [CrossRef] [Scilit]
- Tang, J.; Gao, M.; Wang, H.; Xu, D.; Guo, S.; Han, E.-H. A Finite Element Model of Transient Galvanic Corrosion Behaviour of Aluminium Alloy. Electrochem. Sci. Adv. 2025, 5, e202400031. [Google Scholar] [CrossRef] [Scilit]
- Katona, R.M.; Taylor, J.; Schaller, R.F. Validating Corrosion Models: Influence of Physical Properties. Corros. Sci. 2026, 269, 113938. [Google Scholar] [CrossRef] [Scilit]
- Deshpande, K.B. Effect of Aluminium Spacer on Galvanic Corrosion between Magnesium and Mild Steel Using Numerical Model and SVET Experiments. Corros. Sci. 2012, 62, 184–191. [Google Scholar] [CrossRef] [Scilit]
- Zhang, Y.; Chen, Y.-L.; Fan, W.-J.; Wang, C.-G.; Bian, G.-X. Study on the Galvanic Corrosion of Aluminum Alloy Single Bolted Lap Joints in Simulated Atmospheres. Mater. Corros. 2017, 68, 1107–1115. [Google Scholar] [CrossRef] [Scilit]
- Palani, S.; Hack, T.; Deconinck, J.; Lohner, H. Validation of Predictive Model for Galvanic Corrosion under Thin Electrolyte Layers: An Application to Aluminium 2024-CFRP Material Combination. Corros. Sci. 2014, 78, 89–100. [Google Scholar] [CrossRef] [Scilit]
- Hu, Q.F.; Zhang, T.; Geng, S.J.; Wang, F.H. A Method for Determining the Polarization State of the Metal with the Middle Potential in Order to Calculate the Corrosion Rate of Multi-Metals Complicated Galvanic Couple. Mater. Corros. 2017, 68, 935–942. [Google Scholar] [CrossRef] [Scilit]
- Liu, K.; Wu, Y.; Liu, H.; Chen, H.; Li, W. Numerical Simulation of Galvanic Corrosion and Electrical Insulation for TC4/304 Galvanic Couple. Materials 2025, 18, 38. [Google Scholar] [CrossRef] [Scilit]
- Cross, S.R.; Gollapudi, S.; Schuh, C.A. Validated Numerical Modeling of Galvanic Corrosion of Zinc and Aluminum Coatings. Corros. Sci. 2014, 88, 226–233. [Google Scholar] [CrossRef] [Scilit]
- Snihirova, D.; Hoche, D.; Lamaka, S.V.; Mir, Z.; Hack, T.; Zheludkevich, M.L. Galvanic Corrosion of Ti6Al4V-AA2024 Joints in Aircraft Environment: Modelling and Experimental Validation. Corros. Sci. 2019, 157, 70–78. [Google Scholar] [CrossRef] [Scilit]
- Zhang, M.; Yang, Z.; Ren, L.; Zhang, J.; Gong, P.; Jin, J.; Deng, L.; Yang, X.; Wang, X. High-Temperature Oxidation Behavior of CoCrFeNiCu High-Entropy Alloys Prepared via Casting and Spark Plasma Sintering. Mater. Charact. 2026, 239, 116678. [Google Scholar] [CrossRef] [Scilit]
- Liu, J.; Pan, X.; Deng, N.; Huang, X. Oxalate Modulates Cadmium Mobility during Ferrihydrite Transformation: Roles of Dissolution Kinetics and Phase Selection. ACS Earth Space Chem. 2026, 10, 1928–1937. [Google Scholar] [CrossRef] [Scilit]

Disclaimer/Publisher’s Note: The statements, opinions and data contained in all publications are solely those of the individual author(s) and contributor(s) and not of MDPI and/or the editor(s). MDPI and/or the editor(s) disclaim responsibility for any injury to people or property resulting from any ideas, methods, instructions or products referred to in the content. |
© 2026 by the authors. Licensee MDPI, Basel, Switzerland. This article is an open access article distributed under the terms and conditions of the Creative Commons Attribution (CC BY) license.