


Highlights
What are the main findings?
- TB9 peak flow stress rises and then falls with strain rate at −100 and −196 °C.
- Cooling from 25 to −100 °C markedly increases the peak flow stress of TB9.
- A modified J-C model couples strain, strain-rate and temperature effects.
What are the implications of the main findings?
- The M-J-C model improves residual-stress prediction in cryogenic UEVC.
- It reproduces the periodic shear-slip chip morphology observed experimentally.
- The M-J-C model more closely reproduces cryogenic dynamic flow curves.
Abstract
In the cryogenic-ultrasonic elliptical vibration cutting (UEVC) of TB9 titanium alloy, high-strain-rate deformation occurs, and its cryogenic dynamic deformation behavior and constitutive model are crucial for analyzing the cutting process. Static stress–strain curves were obtained using an electronic universal testing machine, while dynamic stress–strain curves under different temperatures and strain rates were measured using a split Hopkinson pressure bar (SHPB) apparatus. Based on the Johnson–Cook (J-C) constitutive model, a modified J-C (M-J-C) constitutive model was developed by adjusting the strain rate sensitivity factor and temperature exponent. The results showed that TB9 exhibited certain strain rate sensitivity and temperature sensitivity. At low temperatures, the flow stress of TB9 titanium alloy first increased and then decreased with strain rate; as the temperature decreased, the flow stress of the material gradually increased. Compared to the original J-C model, the M-J-C curves showed closer descriptive agreement with the reported plastic stress–strain responses within the fitted domain. The proposed model was subsequently implemented in a finite element model of cryogenic-UEVC, and its predictive performance was evaluated through corresponding cutting experiments. Under machining parameter set No. 1, the experimentally measured surface residual-stress magnitude was approximately 355 MPa, whereas the original J-C and M-J-C models predicted 411 MPa and 391 MPa, respectively, reducing the prediction error from 15.7% to 9.8%. For parameter sets Nos. 2–4, the prediction errors of the M-J-C model were lower than those of the original J-C model by 9.4%, 4.2%, and 6.4%, respectively. These results demonstrate that incorporating the coupled effects of strain rate and temperature improves the description of the dynamic deformation behavior of TB9 titanium alloy and enhances the predictive capability of finite element simulations for cryogenic-UEVC.
1. Introduction
Titanium and its alloys are used in demanding structural and biomedical applications because of their mechanical properties and corrosion resistance [1,2,3,4]. TB9 (Ti-3Al-8V-6Cr-4Mo-4Zr) is a metastable β-titanium alloy whose strength and formability make its machining response relevant to precision manufacturing [5,6,7]. High strength and tool–material interaction can complicate chip formation and control of the machined surface. Non-uniform deformation and thermal loading also affect the residual stresses retained after machining. The present work examines the mechanical and machining behavior of TB9; it does not establish clinical suitability from constitutive or surface-stress results.
To address the challenges in machining TB9 titanium alloy and ensure high-quality processing, cryogenic cooling and ultrasonic elliptical vibration cutting technologies have been proven to effectively lower the cutting zone temperature, reduce friction, and extend tool life [8,9,10]. Cryogenic cutting works by adjusting the material’s mechanical response mechanisms under low-temperature conditions, enabling the precision machining of difficult-to-cut materials while effectively reducing environmental impacts during the cutting process. This technology has achieved significant results, especially in the machining of difficult-to-process materials and special alloys. Dhananchezian et al. [11] used PVD-coated tools for turning TC4 titanium alloy under liquid nitrogen lubrication, achieving a significant reduction of 42% in cutting force and 66% in machining temperature compared to conventional wet cutting methods. Additionally, tool wear on the rake face was reduced by 27%–39%. Wei et al. [12] analyzed the chip morphology of TC4 titanium alloy at low temperatures from a chip perspective and found that as the cutting speed increased, the chip height ratio and serration spacing of the titanium alloy chips also increased. They observed that the serration characteristics of the chips became more pronounced as the spray temperature decreased, and a fiber adiabatic shear band was present in the shear zone.
As an innovative precision machining technology, ultrasonic elliptical vibration cutting (UEVC) operates by superimposing high-frequency mechanical vibration (typically ≥20 kHz) onto conventional continuous cutting, where a piezoelectric actuator drives the cutting tool to perform a periodic motion with a micron-scale elliptical trajectory. Studies have shown that UEVC can significantly reduce cutting forces and cutting temperature while improving machinability. Zhang et al. [13] reported that, in the micro-cutting of FeCoCrNiAl0.6 high-entropy alloy, ultrasonic vibration cutting markedly reduced the main cutting force across different cutting speeds, with the average cutting force in the X-direction decreased by up to 68% compared with conventional cutting. Unlike traditional cutting processes, in which the tool remains in continuous contact with the workpiece, cryogenic-ultrasonic elliptical vibration-assisted cutting introduces high-frequency vibration that causes the tool and workpiece to fully separate during each vibration cycle. This unique characteristic allows the cryogenic medium to directly penetrate the cutting zone, not only modifying the material’s mechanical properties at low temperatures to enhance machinability but also efficiently cooling the cutting zone and thereby mitigating thermal damage. Moreover, cryogenic-ultrasonic elliptical vibration-assisted cutting constitutes a typical nonlinear thermo–mechanical coupling system, involving the plastic deformation response of the material under high strain rates and transient temperature gradients. Since the mechanical behavior of the material plays a decisive role in the machining process, this technology exhibits substantial potential for the precision machining of difficult-to-cut materials.
In the field of metal processing, constitutive models play a crucial role in understanding and predicting the rheological behavior of materials, especially in forming processes, numerical simulations, and the optimization of component design [14,15]. By means of constitutive equations, the mechanical response of metallic materials under different stress, strain, and strain rate conditions can be accurately described, thereby helping researchers better understand their behavior during machining. Commonly used plastic constitutive models include the Johnson–Cook (J-C) model [16,17,18] and the Arrhenius-type model [18,19]. Owing to its relatively small number of parameters, low computational cost, and reasonably accurate prediction of material plastic behavior over a wide range of temperatures and high strain rates, the J-C model has been widely adopted in machining and forming studies. Wu et al. [20] considered the strain-rate sensitivity of 7A75 aluminum alloy and proposed a modified J-C constitutive model with a strain-rate compensation term, to improve the description of dynamic and quasi-static deformation over a wide strain-rate range. Lin et al. [21] introduced a correction factor K into the original J-C model to account for the temperature softening effect and investigated the evolution of the stress–strain response of TC4 titanium alloy under low-temperature and high-strain-rate conditions. However, in the classical J-C model, the effects of strain, strain rate, and temperature are treated as mutually independent, making it difficult to accurately capture the coupled influence of strain-rate hardening and thermal softening on the flow stress. Although several studies have improved the J-C model under high-temperature conditions, particularly by modifying the strain and strain-rate terms, investigations focusing on low-temperature and high-strain-rate regimes are still relatively limited. Finite-element machining simulations based on calibrated Johnson–Cook parameters provide an effective means of evaluating material-model validity under practical cutting conditions. For example, Korkmaz et al. compared turning experiments and FEM predictions for Nimonic 80A and obtained close agreement in the cutting-force components, demonstrating the importance of experimentally validated J-C parameters and appropriate boundary conditions [22].
In this study, quasi-static tensile tests and dynamic compression tests were performed on TB9 titanium alloy at various temperatures and strain rates using an electronic universal testing machine and a split Hopkinson pressure bar (SHPB) apparatus. The experimental data were analyzed to investigate the relationship between flow stress and strain rate of TB9 titanium alloy under different strain rates and temperatures. Based on the experimental results, an M-J-C constitutive model, suitable for cryogenic and high-strain-rate conditions, was developed. Additionally, a predictive model for cryogenic-UEVC processing of TB9 titanium alloy was established, followed by corresponding cutting experiments. The novelty of the present study lies in integrating the mechanical characterization of TB9 titanium alloy under cryogenic and high-strain-rate conditions with the development of an M-J-C constitutive model and its implementation in a cryogenic-UEVC finite-element framework. The predictive capability of the proposed model is further evaluated experimentally through comparisons of surface residual stress and chip morphology. This integrated experimental–numerical framework provides a basis for predicting and controlling the surface integrity of precision-machined TB9 titanium-alloy components under cryogenic-UEVC conditions.
2. Materials and Methods
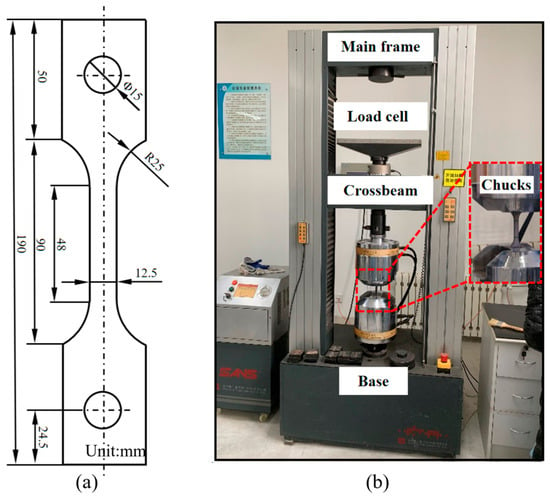
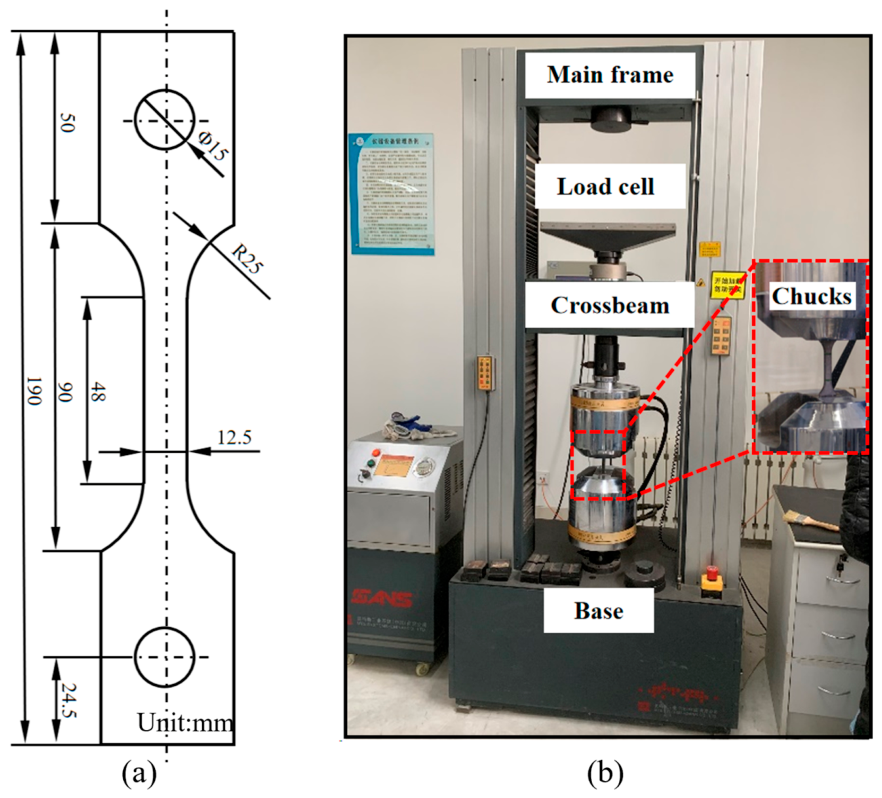
Quasi-static tensile specimens were prepared according to ISO 6892-1:2019 [23], with their geometry as shown in Figure 1a [24]. End parallelism was controlled to approximately 0.01 mm, and the specimens were deburred after machining. Cylindrical SHPB specimens had a diameter of 4 mm and a height of 2 mm [25]. Both end faces were finished to limit friction, with parallelism and perpendicularity tolerances of 0.02 mm. The chemical composition of the TB9 alloy is reported in Table 1.
Figure 1.
Specifications of quasi-static tensile samples (a) and quasi-static tensile test setup (b).
Table 1.
Reported chemical composition of the TB9 titanium alloy (wt%) [26].
The chemical composition of the TB9 titanium alloy used in this study was experimentally determined, and the results are listed in Table 1 [26]. The measured composition is consistent with the nominal composition of TB9 (Ti-3Al-8V-6Cr-4Mo-4Zr).
The quasi-static tensile test was conducted at room temperature using a CMT5305 electronic universal testing machine (MTS Systems (China) Co., Ltd., Shenzhen, China), with the experimental setup shown in Figure 1b. The tensile tests were carried out in accordance with the GB/T 228.1-2021 [27]. The sample was pre-loaded with a load not exceeding 30% of the estimated failure load to ensure no abnormalities occurred before the formal test. A crosshead speed of 2 mm/min was applied until specimen failure, after which the loading was stopped, and the maximum load and failure mode were recorded. During the loading process, a non-contact measurement method was used to continuously monitor the strain variation in the working section of the sample, enabling the collection and recording of data such as load and strain [28].
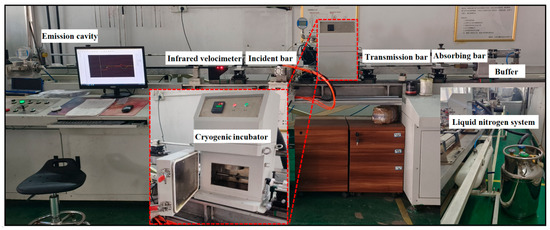
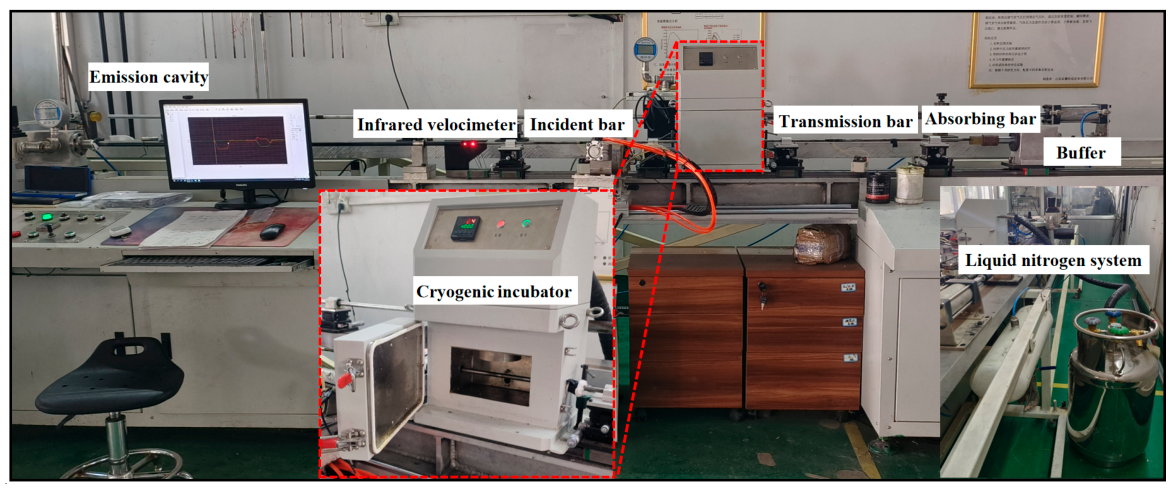
The Split Hopkinson Bar (SHPB) testing technique is based on one-dimensional and uniform assumptions [29]. Using one-dimensional stress wave theory, the strain rate, strain, and stress of the material can be determined, thereby obtaining the material’s dynamic stress–strain relationship [30]. The SHPB testing apparatus consists of the following components: the launching device, pulse shaper, ZDC-1 infrared velocimeter, incident bar, low-temperature insulation device, transmitted bar, absorber, buffer, SDY2107A ultra-dynamic strain gauge (Aifute Electronic Technology Co., Ltd., Qinhuangdao, China), and information processing system. The impact bar, incident bar, and transmitted bar are all made of 60Si2CrA spring steel, with a yield strength greater than 1.7 GPa. Due to the high yield strength of 60Si2CrA spring steel, the impact bar, incident bar, and transmitted bar remain in an elastic state and are not damaged during the experiment. The liquid-nitrogen temperature was fixed by the cooling medium and was not an independently adjustable test parameter. Temperatures were monitored during the experiments using a temperature gun. These measured temperatures must be distinguished from the coolant temperature because thermal contact, heat transfer, and deformation affect the material temperature. Before the experiment, a copper shaping sheet is applied to the impact end of the incident bar to reduce high-frequency oscillations during testing. During the experiment, it is crucial to ensure that the incident bar and transmitted bar are coaxially aligned to avoid scattering phenomena during stress wave propagation. The sample is placed between the incident bar and transmitted bar and lubricated with grease. By adjusting the air pressure, an accelerated pulse is generated by the impact bar, driving the incident bar to strike the sample. Strain gauges attached to the incident and transmitted bars record the pulse signal. By processing the corresponding strain bar signals, the load at the ends of the bars as a function of time can be measured, and the dynamic stress–strain curve of the material can be obtained. The schematic of the SHPB experimental apparatus is shown in Figure 2.
Figure 2.
The Split Hopkinson Pressure Bar (SHPB) experimental device.
To investigate the dynamic mechanical properties of TB9 titanium alloy under low temperature and high strain rate conditions, cylindrical samples with a diameter of 4 mm and a length of 2 mm were used in this experiment. During the cooling process, the specimen temperature was monitored using a temperature gun. The SHPB dynamic compression tests were conducted at measured temperatures of 25 °C, −100 °C, and −196 °C, with average strain rates of 2000 s−1, 5000 s−1, and 8000 s−1. To minimize experimental errors and ensure the accuracy of the results, each set of experiments was repeated three times, and the average value was taken as the final result. The experimental setup is shown in Table 2. Additionally, the fracture morphology of the broken samples was observed using field-emission scanning electron microscopy (FE-SEM, QUANTA FEG 250, FEI Company, Hillsboro, OR, USA).
Table 2.
Selection of parameters in the SHPB experiment.
3. Results
3.1. Strain Rate Sensitivity Analysis of TB9 Titanium Alloy
To evaluate the repeatability of the SHPB experiments, each test condition was repeated three times, and the experimental scatter was further analyzed. For the strain-rate-dependent tests, the standard deviations at strain rates of 2000, 5000, and 8000 s−1 were 30.56, 45.68, and 48.98 MPa, respectively. These values are relatively small compared with the measured flow-stress levels, indicating acceptable consistency among the repeated tests. Therefore, the averaged stress–strain curves can reasonably represent the strain-rate-dependent dynamic mechanical response of TB9 titanium alloy.
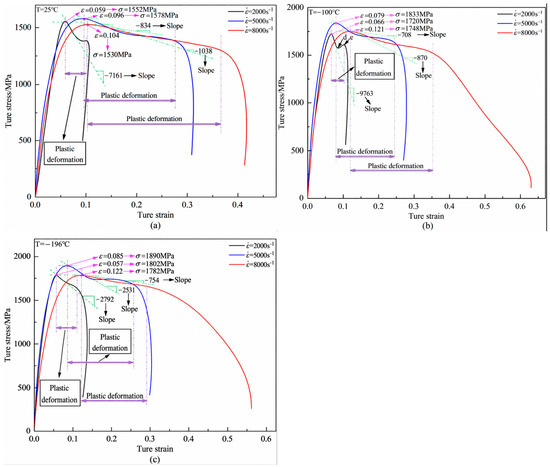
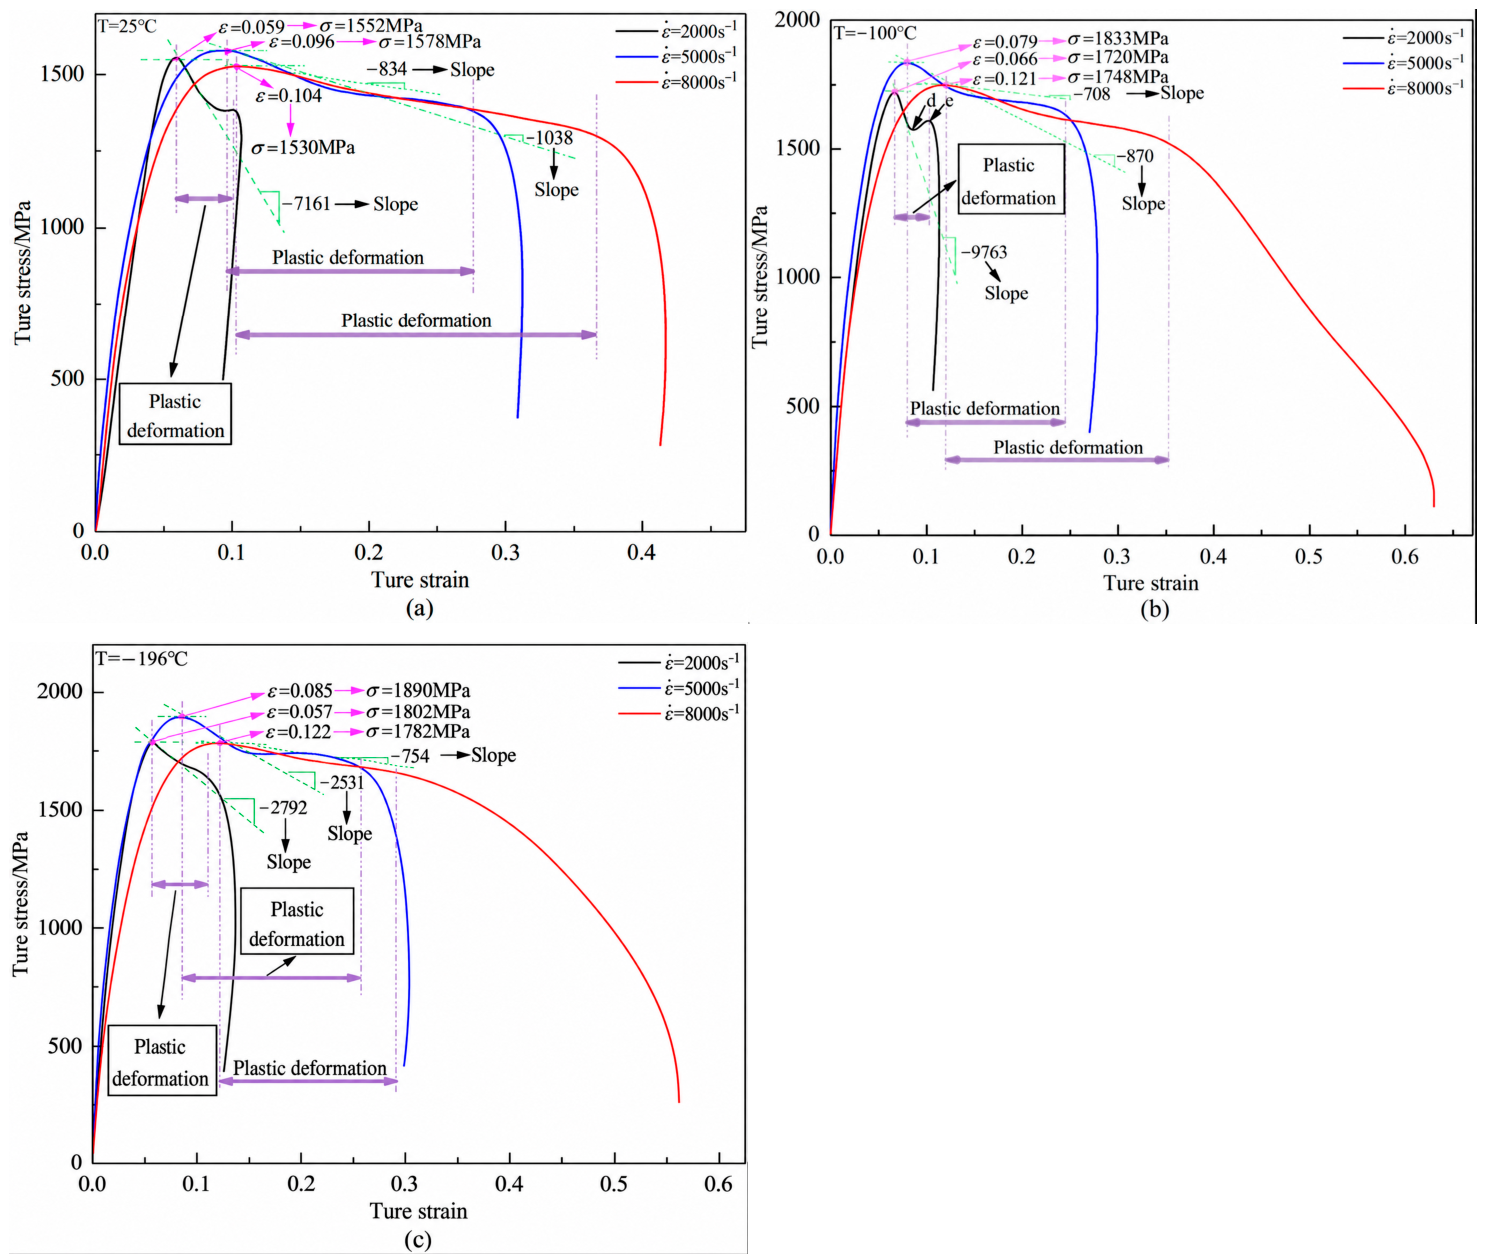
The SHPB curves in Figure 3 compare the macroscopic responses at the reported temperatures and average strain rates. At 25 °C, the reported peak stresses were 1552, 1578, and 1530 MPa at 2000, 5000, and 8000 s−1, respectively. These values showed limited variation over the tested rate range. The observed rate dependence reflects the combined response to loading and deformation-induced softening. The curves alone cannot separate intrinsic rate strengthening from thermal or localization effects.
Figure 3.
Stress–strain curves of TB9 alloy at different strain rates: (a) T = 25 °C, (b) T = −100 °C, (c) T = −196 °C.
From Figure 3b,c, under the conditions of T = −100 °C and T = −196 °C, when the strain rate increased from 2000 s−1 to 5000 s−1, the maximum flow stress of the material showed a significant increasing trend. At T = −100 °C, the maximum flow stress of TB9 titanium alloy rose from 1720 MPa to 1833 MPa, corresponding to an increase of ~6.5%. At T = −196 °C, the maximum flow stress increased from 1802 MPa to 1890 MPa, with an increase rate of ~4.8%. However, when the strain rate increased from 5000 s−1 to 8000 s−1, the maximum flow stress of the material exhibited a noticeable decrease. At T = −100 °C, the maximum flow stress of TB9 titanium alloy decreased from 1833 MPa to 1748 MPa, with a decrease rate of ~4.6%. At T = −196 °C, the maximum flow stress decreased from 1890 MPa to 1782 MPa, with a decrease rate of ~5.7%. This indicated that within the strain rate range of 2000 s−1 to 8000 s−1, TB9 titanium alloy demonstrated a characteristic of first increasing and then decreasing maximum flow stress.
In the region from points d to e in Figure 3b, the flow stress increased with strain, indicating macroscopic strain hardening. Dislocation accumulation is a possible explanation for this response [31,32]. After point e, the decreasing flow stress indicates macroscopic softening. Localized deformation and deformation-induced heating may contribute to this decrease. However, stress–strain curves do not directly establish dislocation rearrangement, annihilation, or a unique microscopic mechanism. The material continued to undergo plastic deformation over the strain interval shown.
3.2. Temperature Sensitivity Analysis of TB9 Titanium Alloy
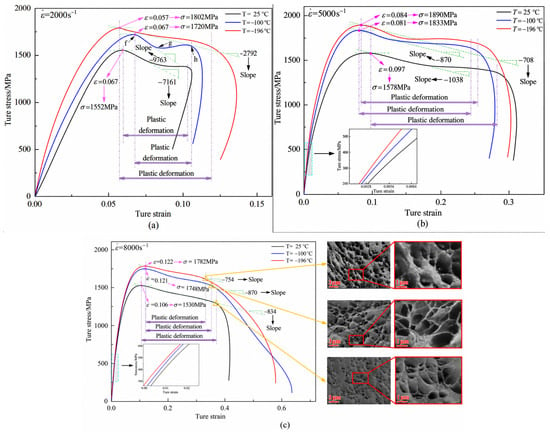
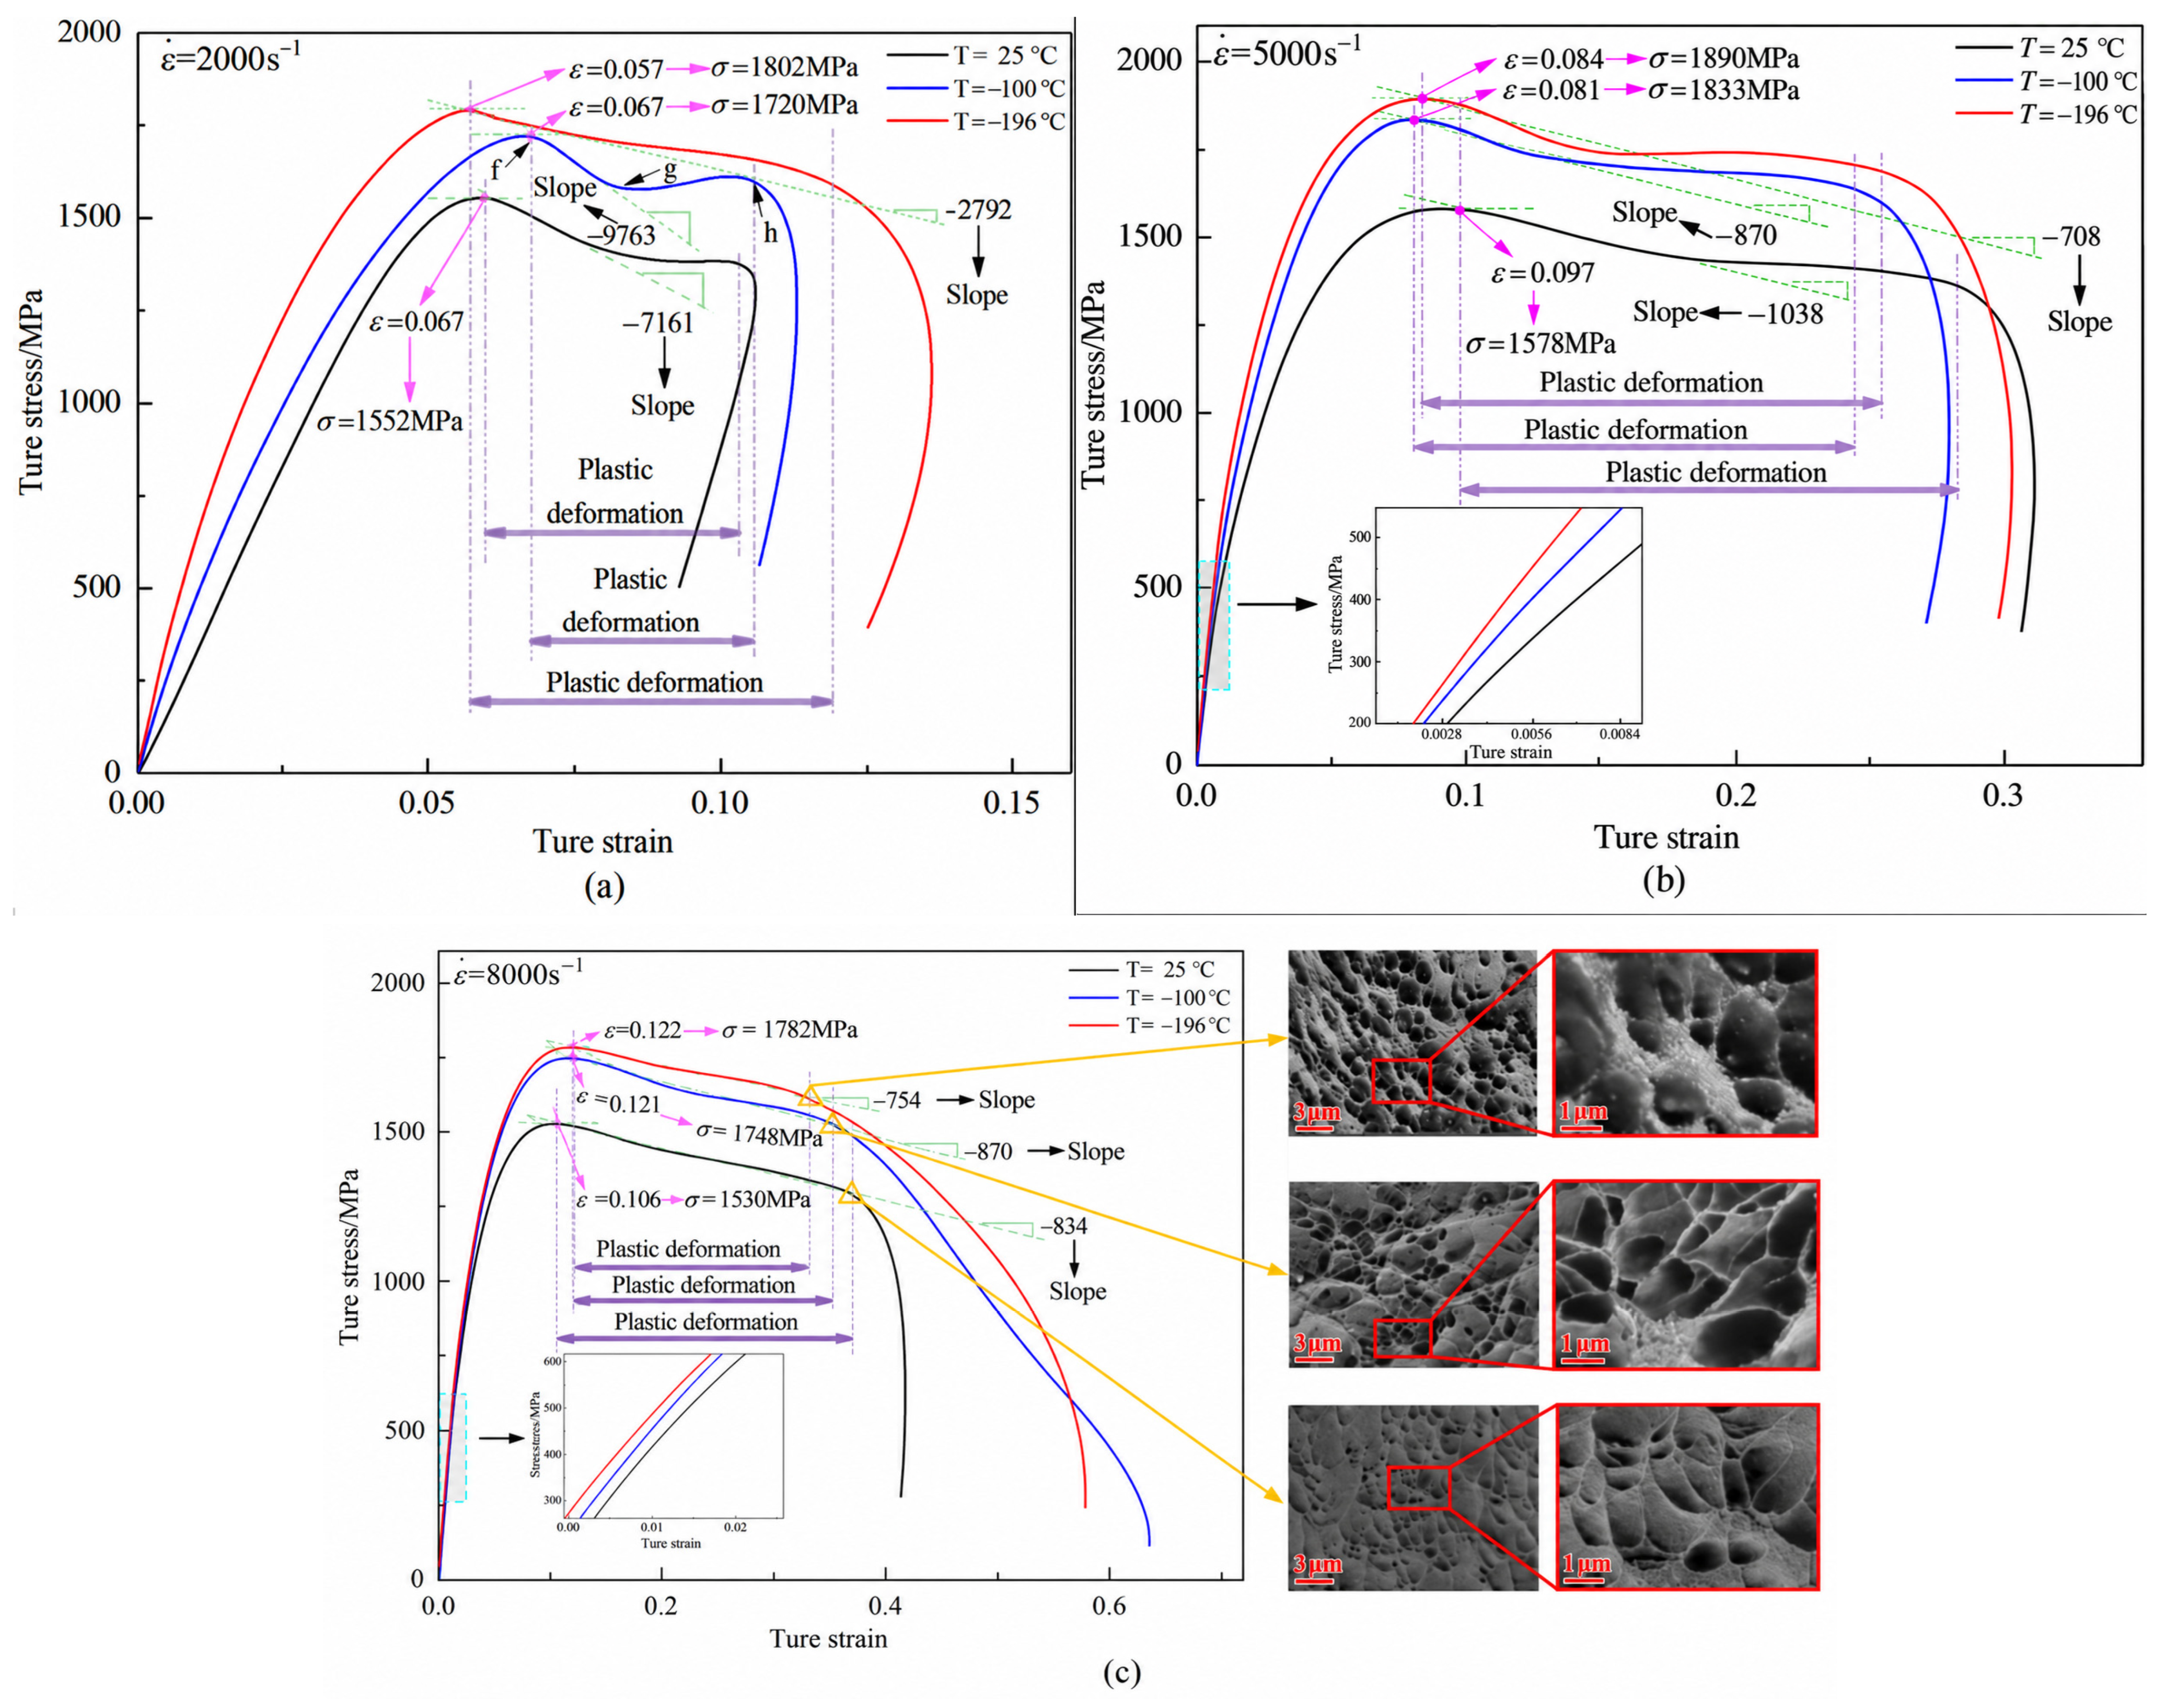
To analyze the temperature sensitivity of TB9 titanium alloy, the stress–strain curves of TB9 alloy at different temperatures under the same strain rate were studied, as shown in Figure 4. From Figure 4, it can be observed that as the temperature decreased, the maximum flow stress of TB9 titanium alloy increased to varying extents, while work absorbed over a common strain interval would require comparison of the integrated stress–strain curves.
Figure 4.
Stress–strain curves of TB9 alloy at different temperatures at fixed strain rates and the corresponding fracture morphology of dynamically compressed samples: (a) 2000 s−1; (b) 5000 s−1; (c) 8000 s−1.
The experimental scatter under different temperature conditions was also evaluated based on the three repeated tests. The standard deviations at 25 °C, −100 °C, and −196 °C were 25.69, 44.45, and 33.36 MPa, respectively. The relatively small standard deviations compared with the corresponding flow-stress levels indicate good repeatability of the SHPB measurements over the investigated temperature range. These results further support the reliability of the averaged stress–strain curves used to characterize the temperature-dependent dynamic response and for subsequent constitutive-model calibration.
From Figure 4a, it was evident that under a strain rate of 2000 s−1, as the temperature decreased from 25 °C to −100 °C, the maximum flow stress of TB9 titanium alloy increased from 1552 MPa to 1720 MPa, a rise of ~10.8%, indicating a temperature-dependent response. When the temperature further decreased from −100 °C to −196 °C, the maximum flow stress increased from 1720 MPa to 1802 MPa, an increase of ~4.7%. Notably, at −100 °C, the flow stress during the plastic deformation phase initially dropped sharply before rising again. To illustrate this non-monotonic behavior, the labels f, g, and h in Figure 4a denote characteristic locations along the stress–strain curve at −100 °C. Label f identifies the vicinity of the peak preceding the initial stress decrease, while g indicates the local minimum separating the decreasing and recovering portions of the curve. Between g and h, the flow stress increases moderately, whereas beyond h, it decreases rapidly. Accordingly, these labels distinguish the initial post-peak stress decrease, subsequent stress recovery, and final rapid stress decline. They describe the macroscopic curve characteristics without independently establishing the underlying deformation mechanisms. This non-monotonic response may reflect competition between deformation-induced softening and subsequent strain hardening [33,34]. Dynamic recovery is a possible interpretation, but it was not directly established by the stress–strain curves.
From Figure 4b,c, it can be observed that under strain rates of 5000 s−1 and 8000 s−1, when the temperature decreased from 25 °C to −100 °C, the maximum flow stress of the material exhibited an increasing trend. At a strain rate of 5000 s−1, the maximum flow stress increased from 1578 MPa to 1833 MPa, an increase of approximately 16.2%; at a strain rate of 8000 s−1, the maximum flow stress increased from 1530 MPa to 1748 MPa, corresponding to a growth rate of 14.2%. At this stage, the low temperature had a pronounced strengthening effect on the material’s maximum flow stress, consistent with reduced thermally activated dislocation motion and altered competition between hardening and softening [35]. These mechanisms remain interpretations of the macroscopic response. The fracture images show shear-type features but do not independently quantify dislocation activity or establish an adiabatic shear mechanism. As the temperature decreased, the edges of the fracture pits gradually became sharper, as shown in Figure 4c. When the temperature dropped from −100 °C to −196 °C, the maximum flow stress increased more slowly, indicating that the temperature sensitivity of TB9 titanium alloy at this stage was less pronounced.
To provide a more intuitive comparison of the effects of temperature and strain rate on the dynamic mechanical response of TB9 titanium alloy, the maximum flow stresses obtained under different experimental conditions are summarized in Table 3. As shown in Table 3, the maximum flow stress generally increases with decreasing temperature at all three strain rates. At each temperature, the maximum flow stress reaches its highest value at a strain rate of 5000 s−1, indicating that the strain-rate dependence is not strictly monotonic within the investigated range. In particular, the highest maximum flow stress of 1890 MPa is obtained at −196 °C and 5000 s−1. These results further demonstrate the combined effects of temperature and strain rate on the dynamic deformation behavior of TB9 titanium alloy.
Table 3.
Maximum flow stresses of TB9 titanium alloy at different temperatures and strain rates (MPa).
4. J-C Constitutive Model for Dynamic Impact Testing of TB9 Titanium Alloy
To more accurately describe the mechanical properties of materials, it is essential to establish a dynamic constitutive model suitable for cutting processes. During cutting, strain, strain rate, and temperature are the primary factors influencing the material’s flow stress. For metallic materials, strain, strain rate, and temperature collectively define the comprehensive deformation conditions [36]. There are several models available to describe the flow stress of materials, among which the Johnson–Cook (J-C) constitutive model is widely used, as it comprehensively accounts for the effects of strain, strain rate, and temperature on the material’s flow stress [37]. This model characterizes the strain hardening, strain rate hardening, and thermal softening effects of the material during the cutting process, and is well-known for its simplicity and minimal number of parameters [38]. As a result, it is widely applied in modeling the flow stress of materials, and its mathematical expression is as follows [36]:
where σ is the flow stress, ε is the plastic strain, A is the yield strength under quasi-static conditions, B is the strength coefficient, n is the strain-hardening exponent, C is the strain-rate sensitivity coefficient, m is the thermal-softening exponent, = / is the dimensionless plastic strain rate ( = 0.001 s−1), and T* = (T − Tᵣ)/(Tm − Tᵣ) is the homologous temperature, where Tᵣ is room temperature, Tm is the melting point of TB9 titanium alloy (1688 °C), and T is the current material temperature.
4.1. J-C Constitutive Model of TB9 Titanium Alloy
4.1.1. Calibration of A, B, and n
The basic parameters of the original J-C constitutive model are derived by fitting the data obtained from quasi-static tensile and SHPB tests. The parameters A, B, and n of the original J-C constitutive model can be determined using the quasi-static tensile test data at a strain rate of 0.001 s−1 and a temperature of 25 °C. At the reference temperature and strain rate, the rate and temperature multipliers reduce to unity, leaving the strain-dependent term for empirical calibration. Therefore, Equation (1) can be simplified to Equation (2):
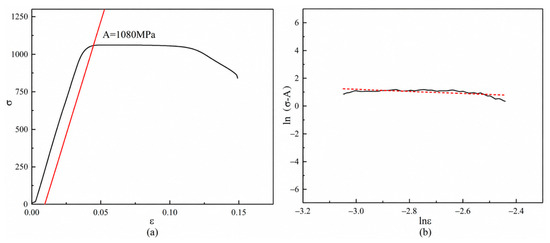
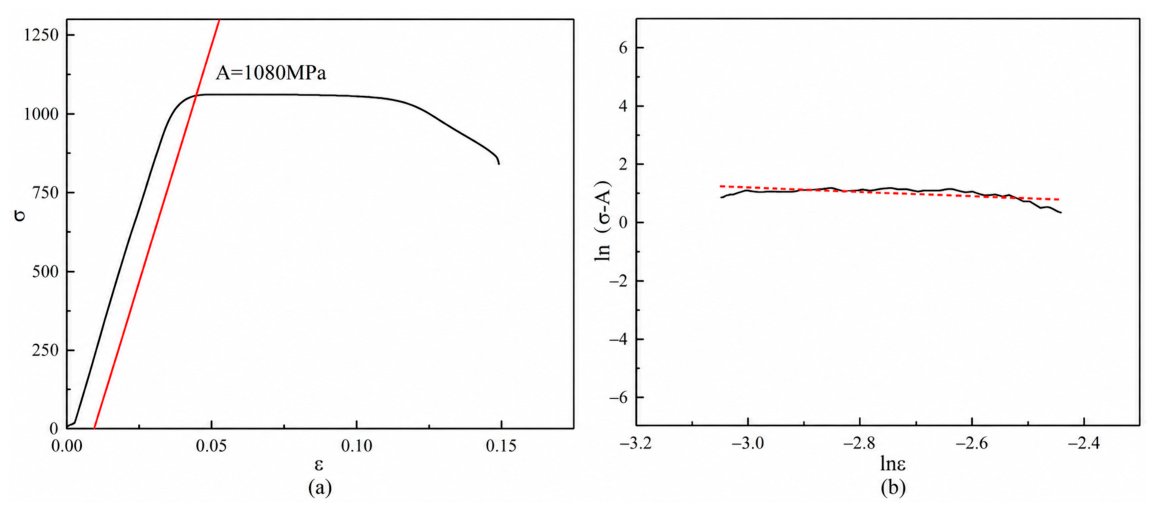
where A is the initial yield stress at the reference strain rate (1080 MPa in Figure 5a). By rearranging A in Equation (2) and taking the logarithm of both sides, we can derive Equation (3):
ln(σd − A) = lnB + nlnεq
Figure 5.
Relationship between the variables in the original J-C constitutive model: (a) σ and ε; (b) ln(σ − A) and lnε.
Based on the quasi-static test data in Figure 5b, Equation (3) can be fitted using the linear least squares method, yielding: B = 1.67, n = −0.75.
4.1.2. Calibration of Parameter C
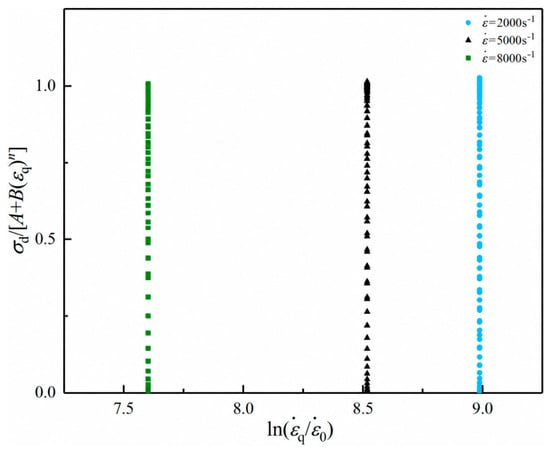
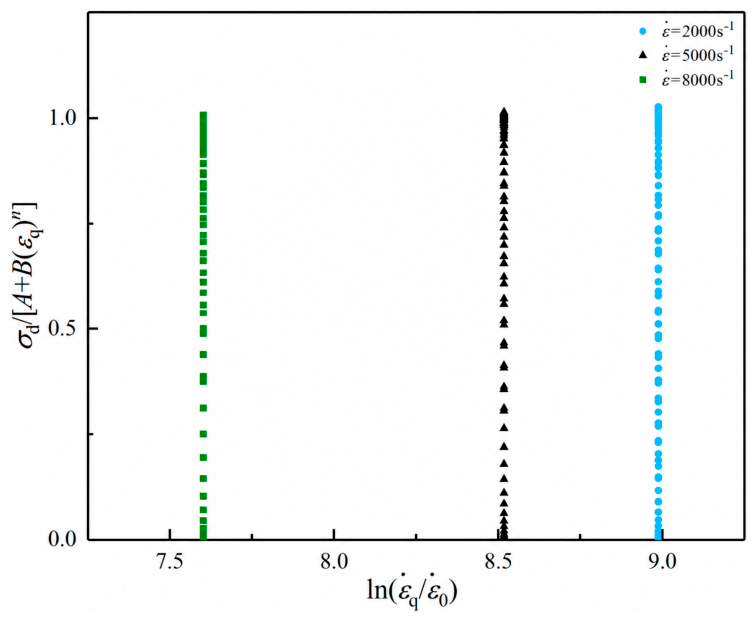
The strain rate sensitivity coefficient C in the original J-C constitutive model can be obtained by fitting the SHPB test data at different strain rates under room temperature conditions. The calibration of parameter C does not account for the effects of strain hardening and thermal softening, but only considers the strain rate hardening effect. Therefore, Equation (1) can be simplified to Equation (4):
where εq represents the plastic strain at room temperature under different strain rates. By rearranging Equation (4), we obtain Equation (5):
By fitting the experimental data at room temperature under different strain rates in Figure 6, the value of parameter C is obtained as 0.045.
Figure 6.
Relationship between σd/[A + B(εq)n] and ln(
).
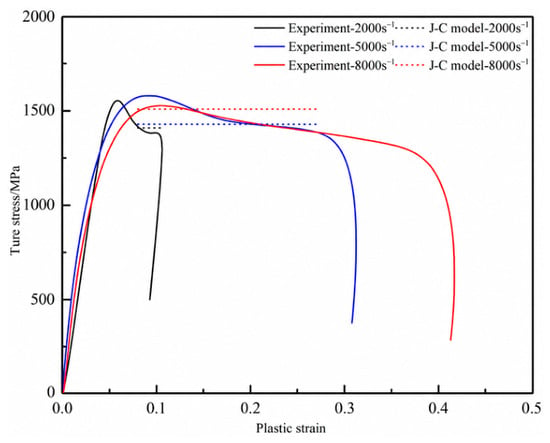
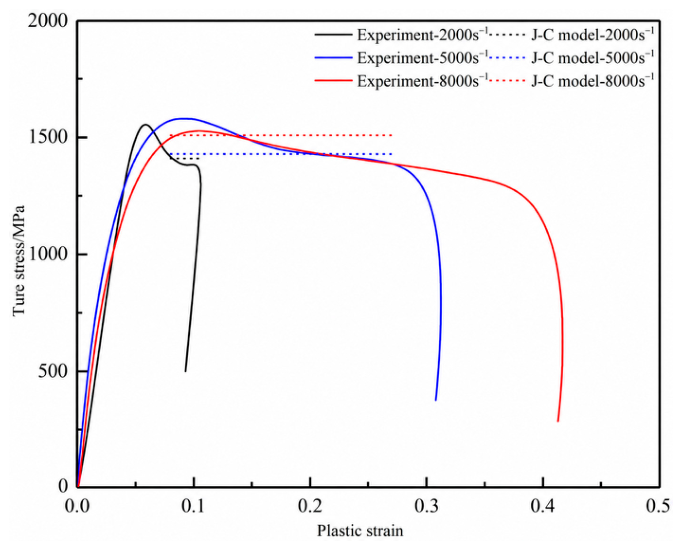
Based on the calibration of the parameters A, B, C, and n, the specific equation of the original J-C constitutive model can be derived. The stress–strain curve calculated using the original J-C constitutive model is compared with the stress–strain curve directly obtained from the SHPB test, as shown in Figure 7. It can be observed that the results predicted by the J-C constitutive model exhibited some deviation from the experimental data. This discrepancy was particularly evident in the latter half of the stress–strain curve, where, as plastic strain increased, the error between the two became more pronounced. For a fixed positive C, the rate multiplier increases monotonically with strain rate. This separable form cannot reproduce the non-monotonic rate dependence reported in Section 3.1. Accordingly, a strain- and rate-dependent correction was considered.
Figure 7.
Comparison of stress–strain data obtained from the original J-C constitutive model and the SHPB test at different strain rates.
4.1.3. Calibration of Parameter m
At a fixed strain rate of 8000 s−1, the conventional J-C expression is rearranged for the temperature-term analysis in Equations (6) and (7). Comparisons across temperature require the rate factor to be treated consistently; a high strain rate does not itself justify setting this factor to unity.
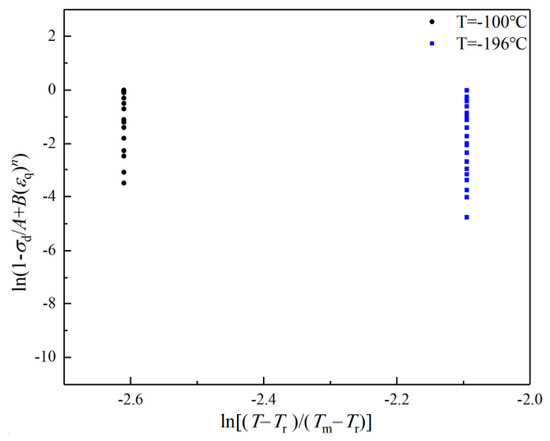
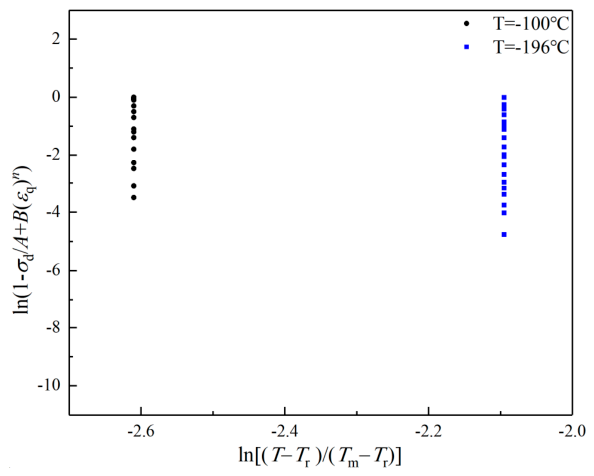
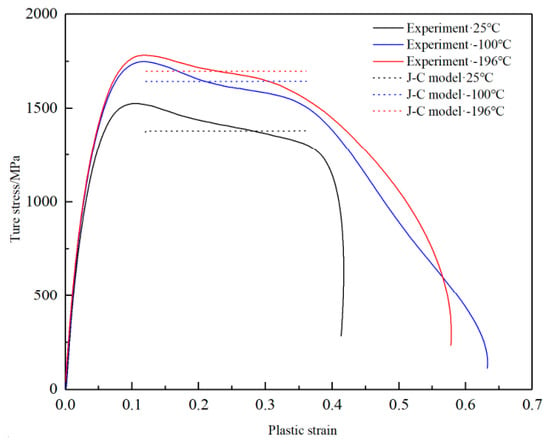
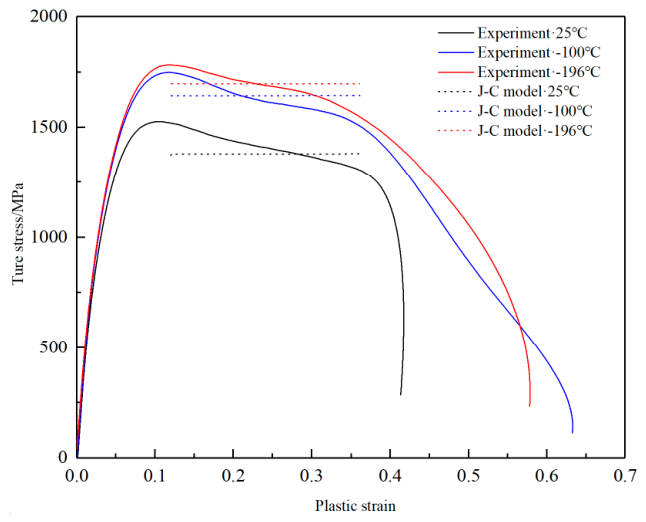
By substituting the previously obtained values of A, B, and n into Equation (7) and fitting the data, the value of m can be obtained as 1.2, as shown in Figure 8. The comparison between the results predicted by the original J-C constitutive model and those obtained from the SHPB test at different temperatures is shown in Figure 9. The results indicated that the original J-C constitutive model was not effective in describing the plastic deformation of TB9 titanium alloy at different temperatures. The conventional temperature multiplier describes thermal softening relative to its reference condition. Cryogenic strengthening below room temperature requires a separate, mathematically defined treatment. The present discrepancy motivates an empirical temperature–strain correction rather than a general claim that thermal softening decreases with increasing temperature.
Figure 8.
Relationship between ln(1 − σd/A + B(εq)n) and ln[(T − Tr)/(Tm − Tr)].
Figure 9.
The comparison of the original J-C constitutive model and SHPB test curves at different temperatures under a strain rate of 8000 s−1.
4.2. M-J-C Constitutive Model of TB9 Titanium Alloy
4.2.1. Modification of Parameter C
Without considering the temperature term, Equation (1) can be transformed into the following form:
By transforming Equation (8), we can obtain the parameter C:
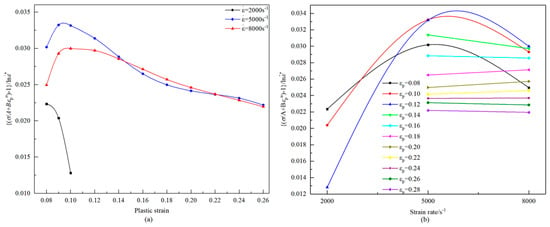
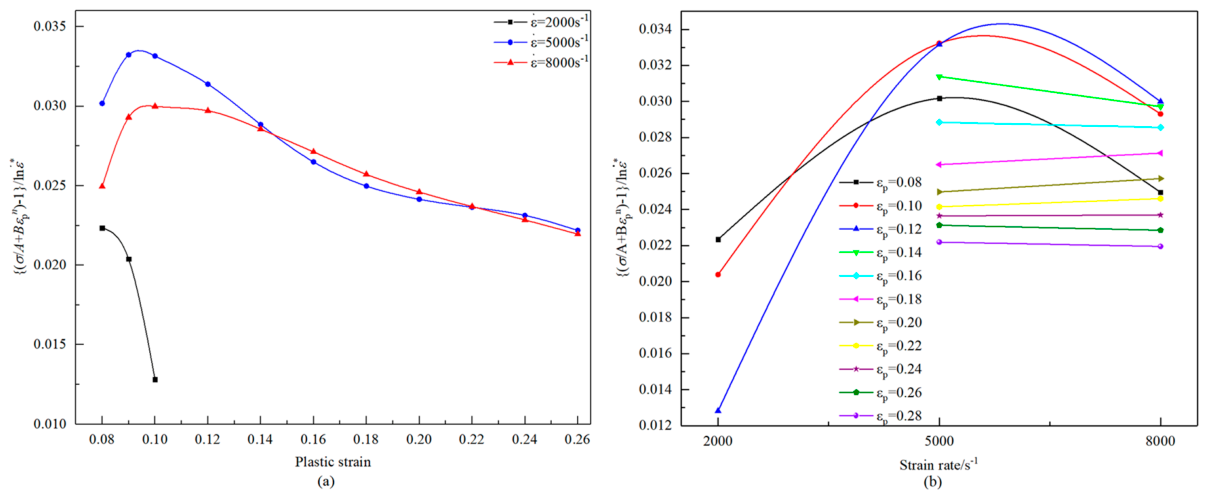
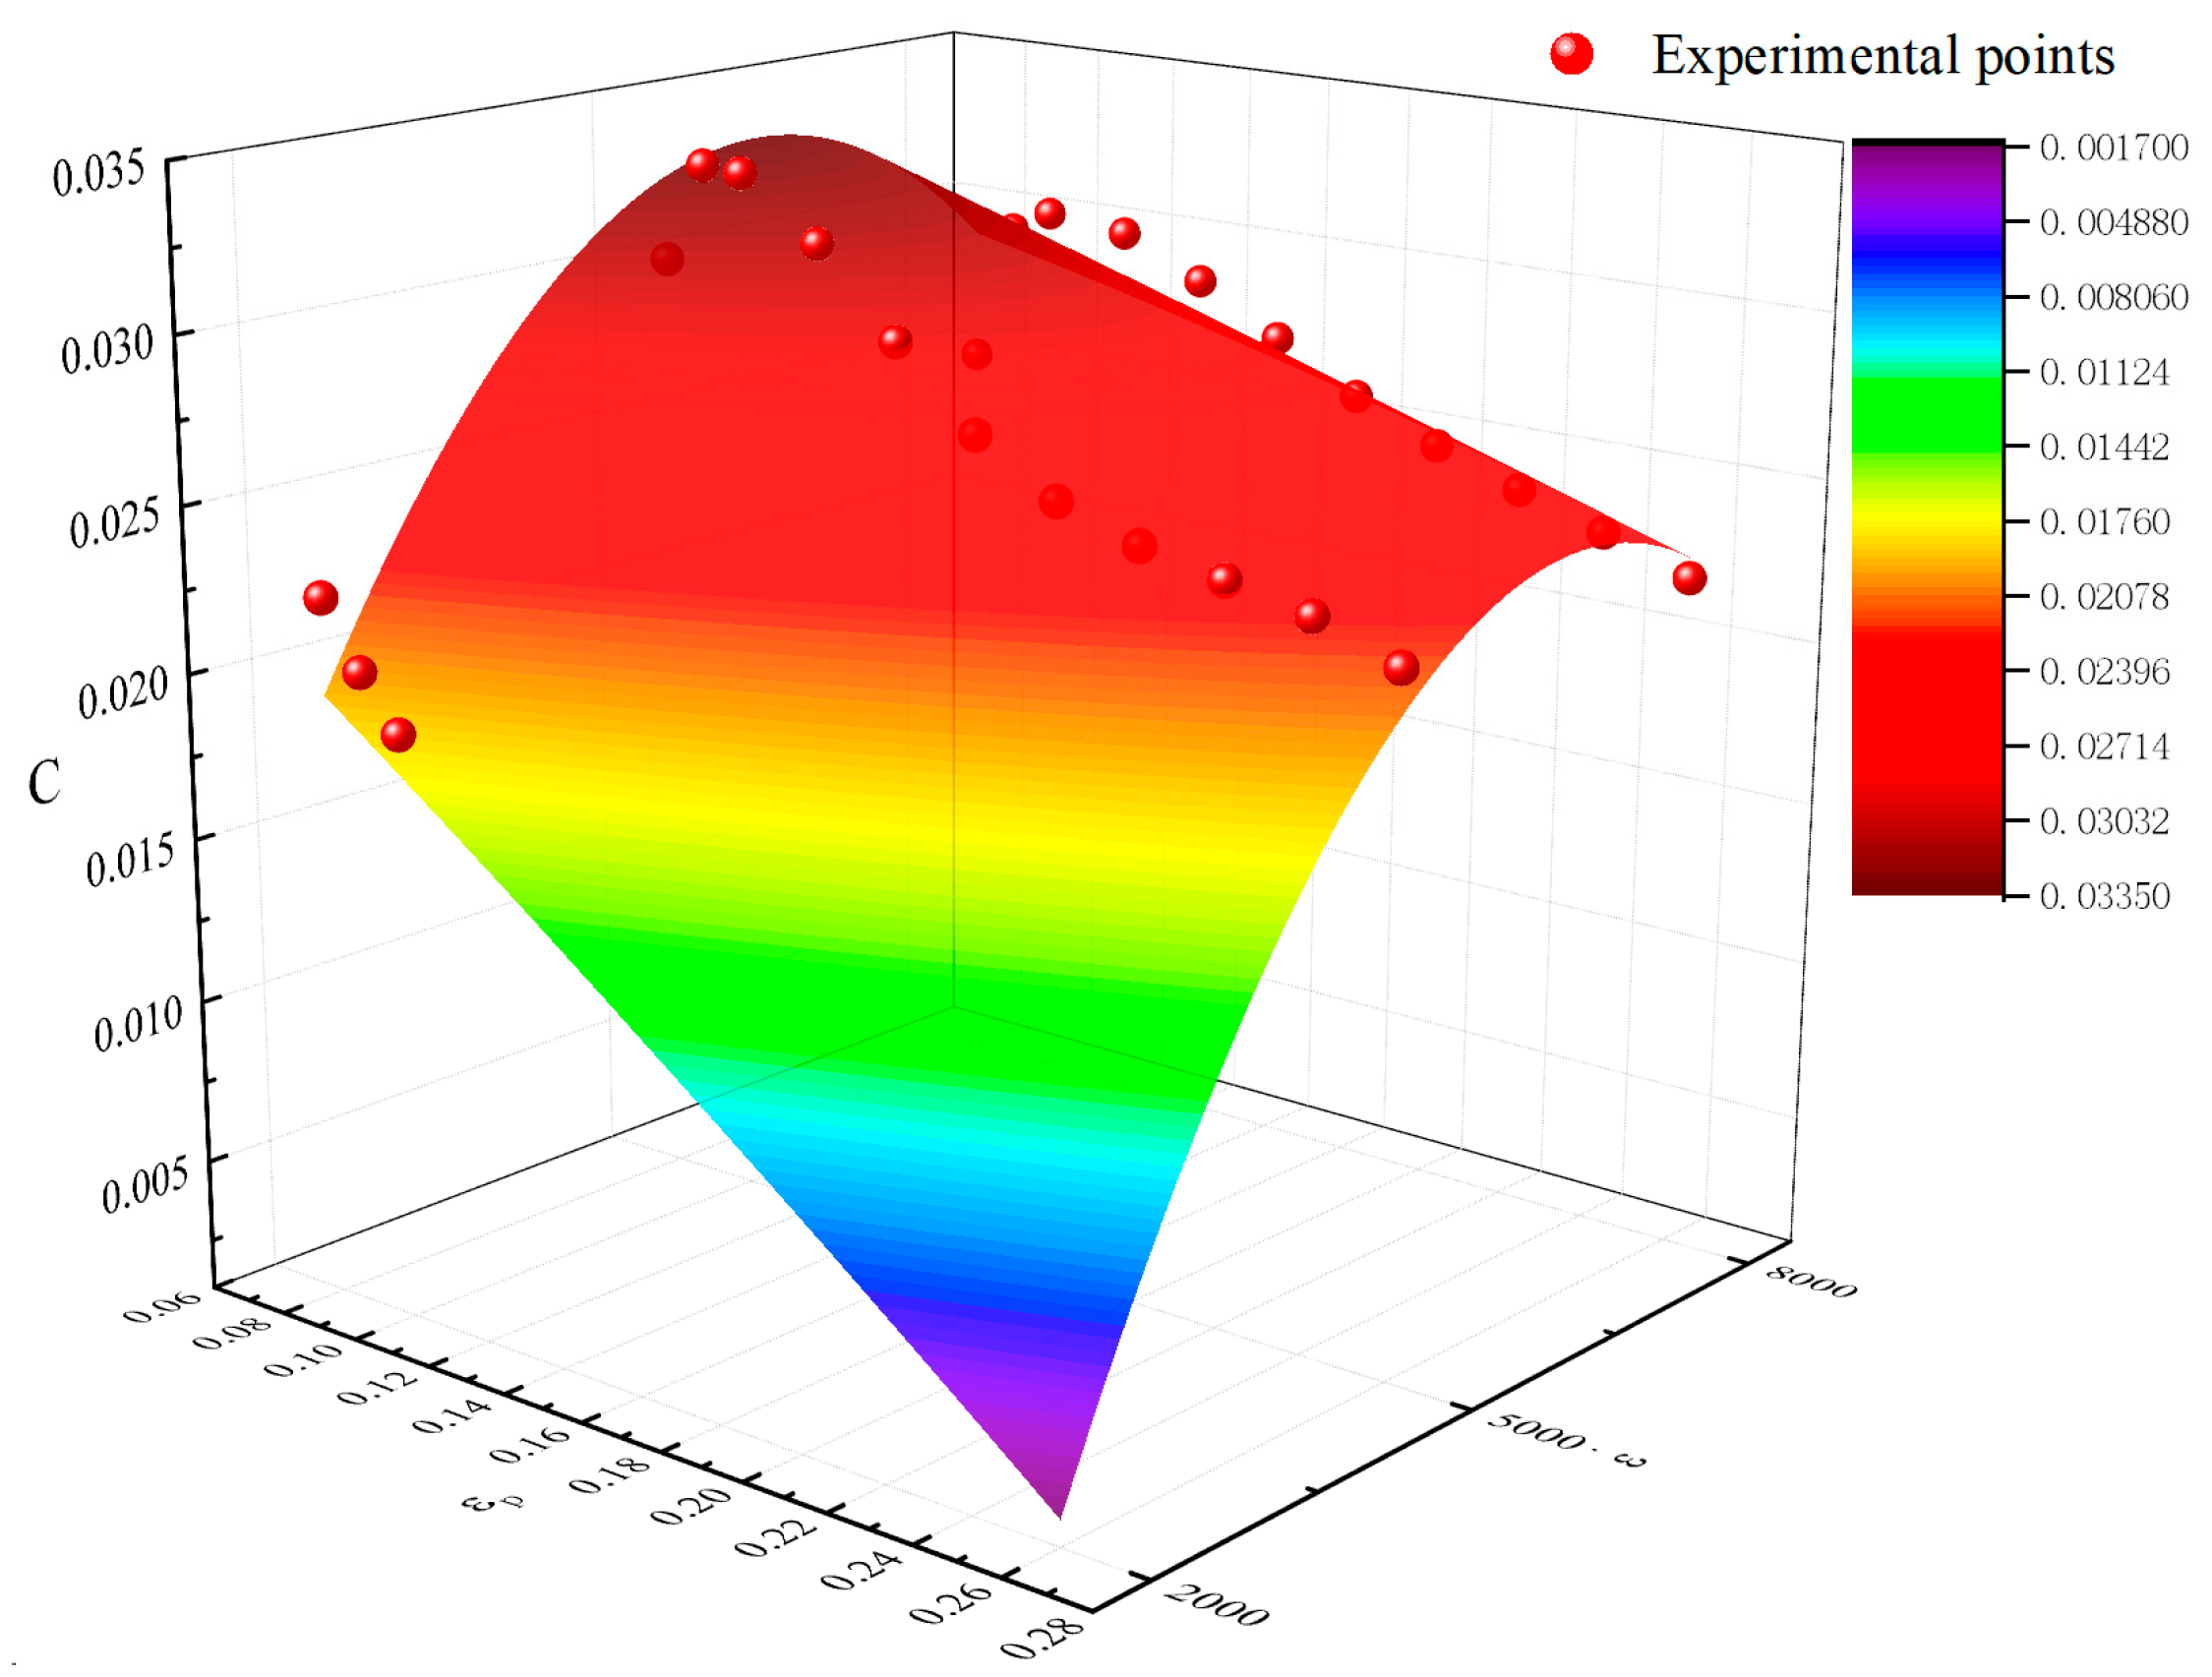
According to the experimental data, the relationship between parameter C, plastic strain, and strain rate is as shown in Figure 10. Clearly, as plastic strain and strain rate vary, parameter C cannot be assumed to be constant. From Figure 10a, it can be seen that the parameter C was not linearly related to εq, but rather a quadratic relationship. Similarly, from Figure 10b, it was evident that parameter C followed a quadratic function. Therefore, the strain rate sensitivity coefficient could be expressed as a bivariate quadratic polynomial of plastic strain and strain rate, as shown in Equation (10).
Figure 10.
The relationship between parameter C and εq: (a) C and εq; (b) C and .
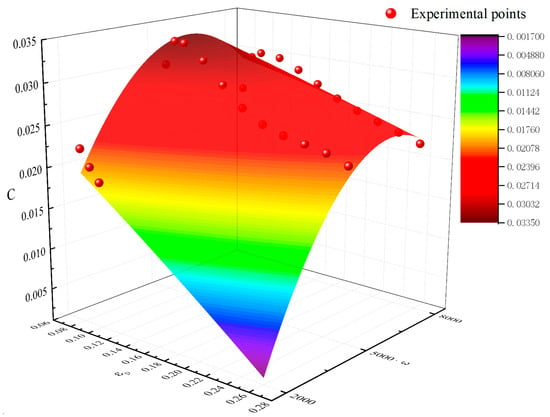
Based on the experimental data points in Figure 10, the coefficients were identified using a nonlinear surface fitting function, and the fitted surface is shown in Figure 11. The experimental points were close to the fitted surface, indicating that the fitting results were accurate. Therefore, Equation (10) could represent the variation in parameter C at different strain rates at room temperature. The coefficients C0~C5 obtained from the regression analysis are shown in Table 4.
Figure 11.
The fitted surface of parameter C with respect to εq and
Table 4.
Values of the parameter C0~C5.
4.2.2. Modification of Parameter m
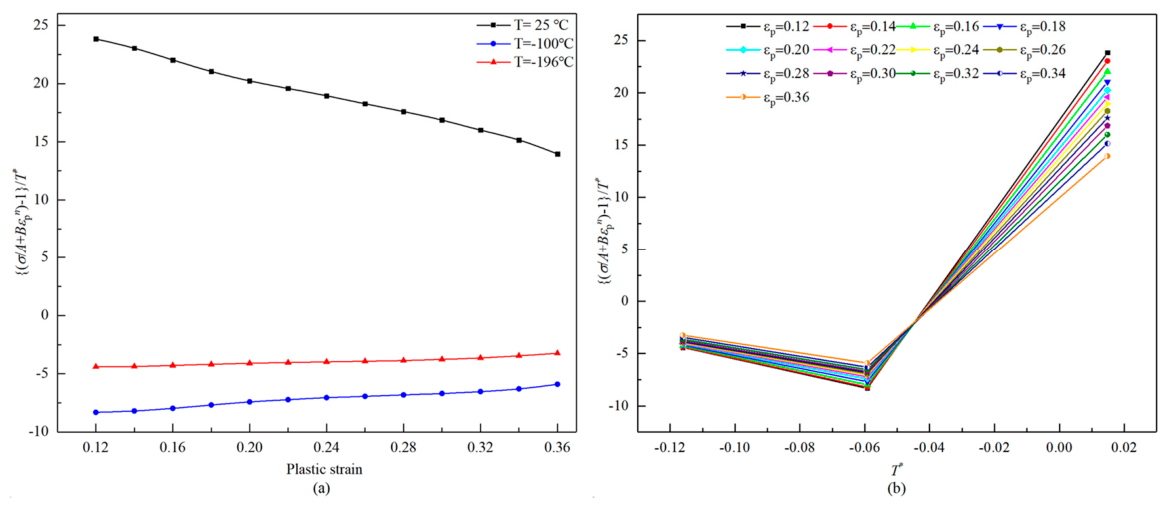
Due to the inability of parameter m (as a constant) to accurately represent the thermal softening effect, and considering the intermittent cutting characteristics of UEVC, which involve cyclic temperature changes during the cutting process, this study modified parameter m by incorporating the coupling effect of temperature and strain. To facilitate future modifications and calculations, the temperature term is replaced by exp(mT*). Therefore, m can be expressed by Equations (11) and (12).
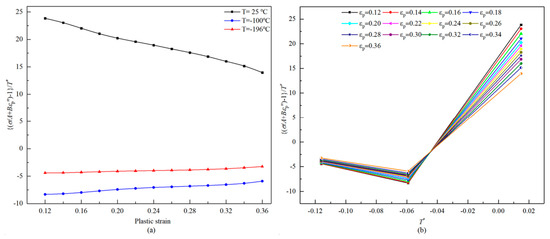
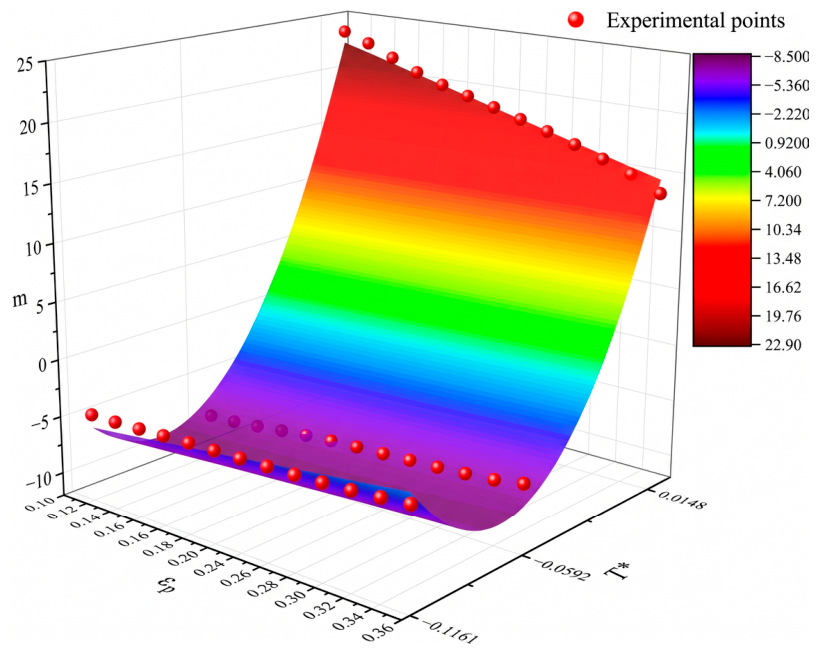
Based on the plastic data at different temperatures, the relationship between parameter m, plastic strain, and temperature is shown in Figure 12. It can be observed that parameter m was a quadratic function of both εq and T*. Therefore, the temperature term in the exponent can also be expressed as a binary quadratic polynomial relationship of εq and T*, as described in Equation (13).
Figure 12.
Relationship between parameter m, εq and T*: (a) m and εq; (b) m and T*.
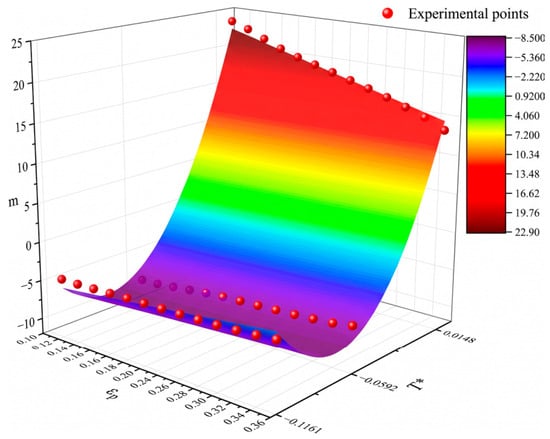
Based on the experimental data points shown in Figure 13, the coefficients of the above equation were determined using nonlinear surface fitting. The fitting results are presented in Figure 13. It can be observed that the experimental data points were almost all located on the fitted surface, demonstrating that the fitting results had good accuracy. Therefore, the above equation could represent the variation pattern of the temperature term. The coefficients m0~m5 obtained from the regression analysis are presented in Table 5.
Figure 13.
The fitted surface of parameter m with respect to εq and T*.
Table 5.
Values of the parameters m0~m5.
4.3. Reliability Analysis of M-J-C Constitutive Model
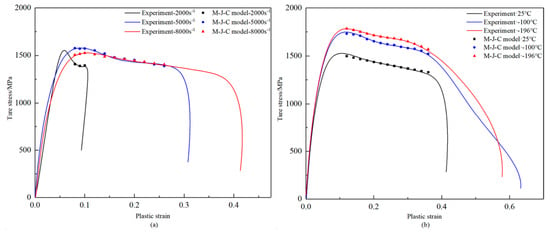
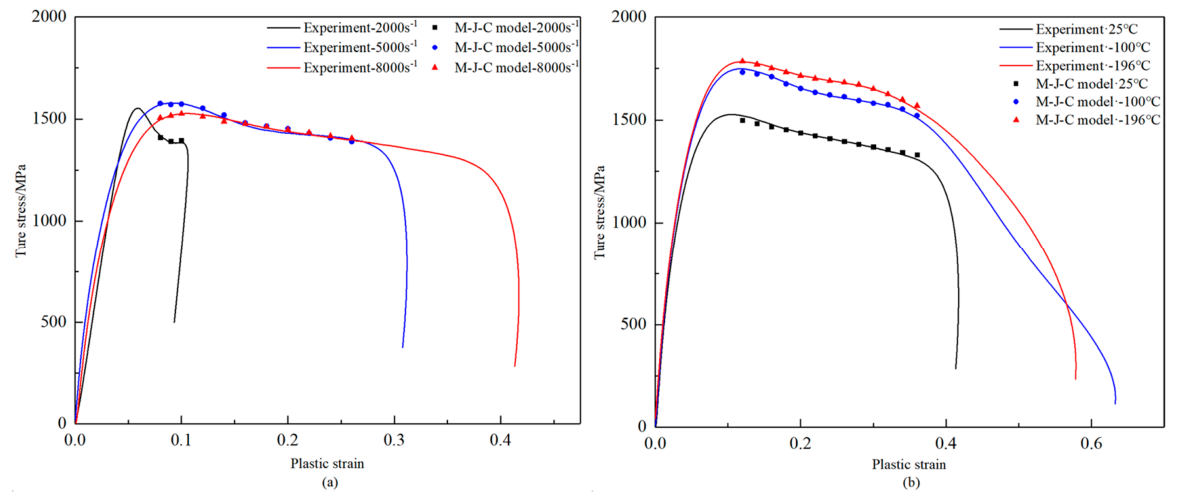
By substituting the data from Table 4 and Table 5, the M-J-C constitutive model describing the plastic stress–strain relationship was obtained. Figure 14 presents a comparison between the flow stress curves generated by the M-J-C constitutive model and the experimental results. It can be observed that the trends of the model curves closely match the experimental results. The M-J-C curves showed closer agreement with the experimental curves than the original J-C curves over the conditions shown. The M-J-C constitutive model describes the flow behavior of TB9 titanium alloy under high strain rates at different temperatures and at room temperature under various strain rates.
Figure 14.
Comparison of the M-J-C constitutive model and experimental curves: (a) 25 °C under different strain rates; (b) 8000 s−1 under different temperatures.
5. Verification of the M-J-C Constitutive Model for Cryogenic-UEVC of TB9 Titanium Alloy
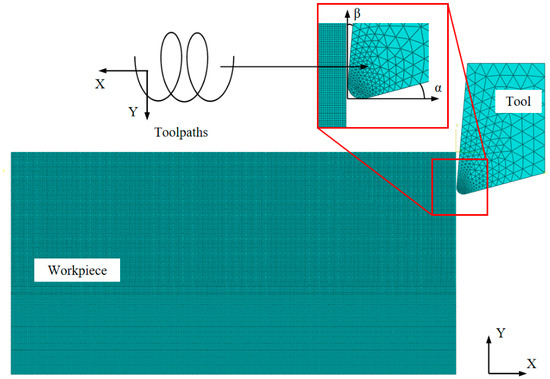
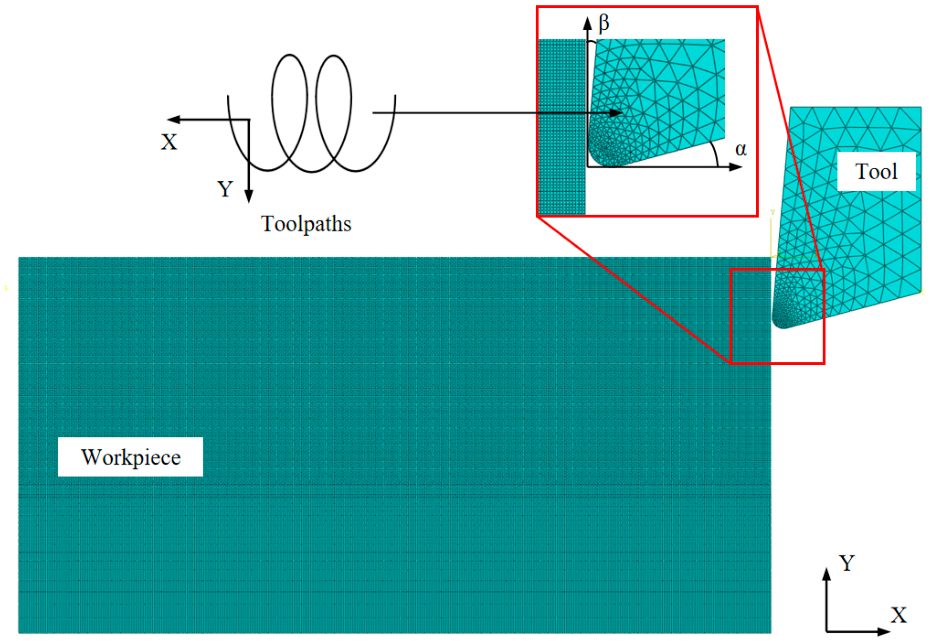
The UEVC processing of TB9 titanium alloy was simulated using the ABAQUS software (version 6.14). Combined with the M-J-C constitutive model and original J-C constitutive model, models for the UEVC processing of TB9 titanium alloy were established, as shown in Figure 15. During the finite element modeling process, the carbide cutting tool was simplified into a rigid-body approximation. Its geometric parameters were set with the edge radius of 5 μm, and the rake and clearance angles were set to 5° and 15°, respectively. The assembly relationship between the tool and the workpiece is shown in Figure 15. The coordinate system defines the cutting speed direction as the X-axis, and the cutting depth direction as the Y-axis. By controlling the relative coordinates of the tool and workpiece, the parameterization of different cutting depths can be achieved. The tool motion mode was set to translation along the negative X-axis, with the tool motion trajectory synthesized using an amplitude function. The numerical simulation used an explicit dynamic analysis with the reported temperature-dependent material response. The tool mesh was divided using CPS3 three-node triangular elements, while the titanium alloy matrix was meshed with CPS4R four-node reduced integration quadrilateral elements. The M-J-C constitutive model was associated with the ABAQUS main program through the VUMAT subroutine. The tool-workpiece interaction was described using a Coulomb friction model with a friction coefficient of 0.3. Chip formation and separation were implemented using a material damage and element-deletion approach. The cutting tool was treated as a rigid body, whereas the TB9 workpiece was modeled using a thermo-mechanically coupled formulation. Heat generation caused by plastic deformation and friction at the tool-chip/workpiece interfaces was considered. Under cryogenic-assisted cutting conditions, a low-temperature thermal boundary corresponding to liquid-nitrogen cooling was applied to the cooling region. The mesh was locally refined in the cutting and chip-formation regions to better capture the severe plastic deformation and thermal gradients near the cutting edge. The same contact, chip-separation, thermal-boundary, and mesh settings were employed for both the original J-C and M-J-C models to ensure a consistent comparison of their predictive performance.
Figure 15.
Finite element simulation model of UEVC processing for TB9 titanium alloy.
To verify the accuracy of the M-J-C constitutive model for simulating the UEVC processing of TB9 titanium alloy, a one-factor experiment was designed based on the established parameters and conditions of the 2D cutting simulation model. Furthermore, cryogenic-UEVC tests on TB9 titanium alloy were conducted under different cutting speeds, cutting depths, and vibration frequencies to validate the effectiveness of the finite element simulation model. The experimental conditions for each group are detailed in Table 6. Face turning was adopted to provide a flat and accessible cutting region for the ultrasonic tool and cryogenic nozzle and to permit a local orthogonal-cutting approximation consistent with the two-dimensional FEM model. A one-factor design was used: cutting speed, cutting depth, and vibration frequency were varied individually while the other parameters were kept constant, and the same parameter sets were used in the simulations and experiments.
Table 6.
Experimental parameters for cryogenic-UEVC of TB9 titanium alloy.
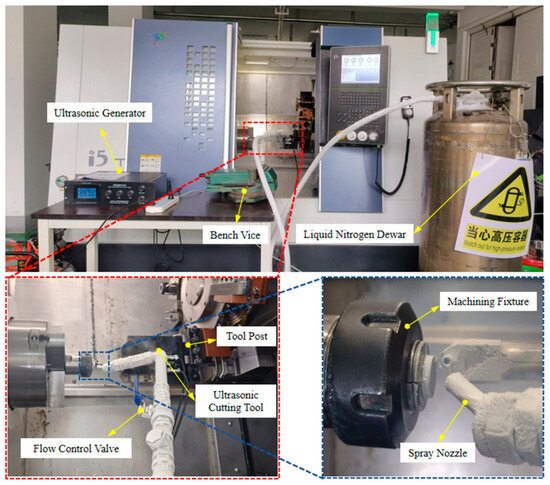
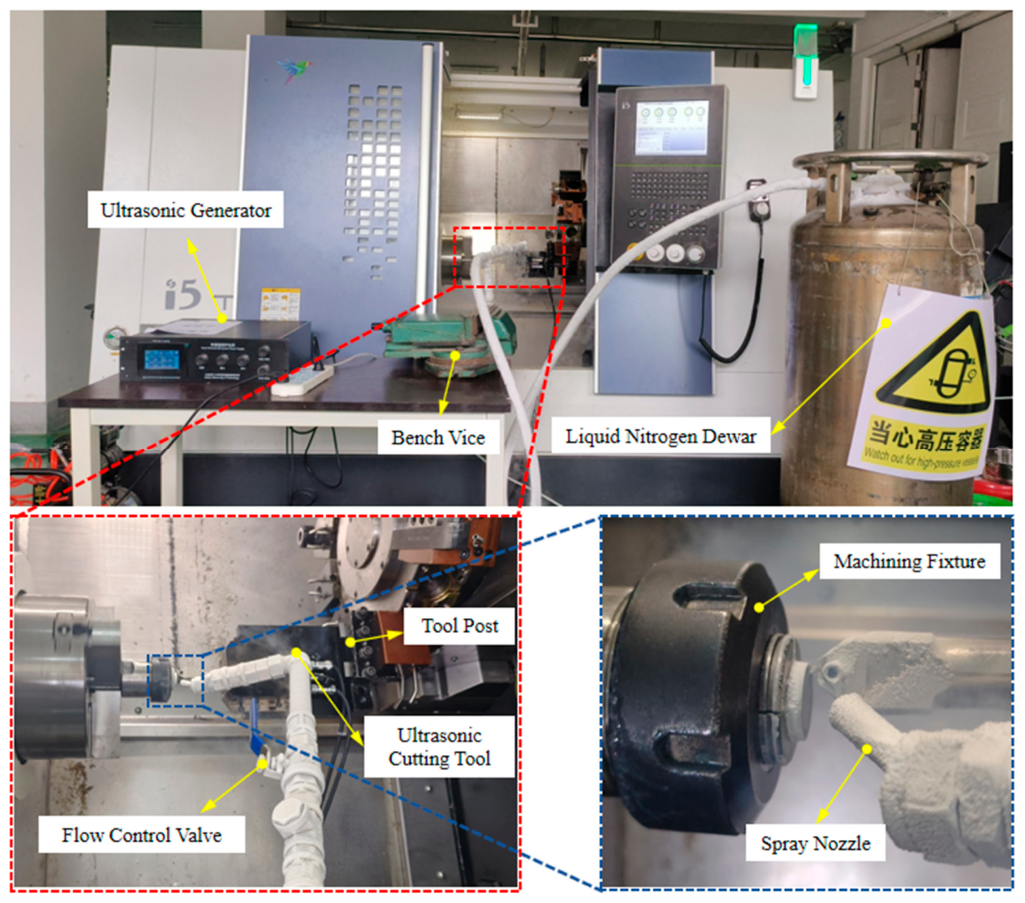
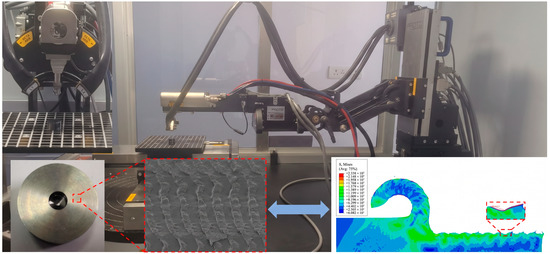
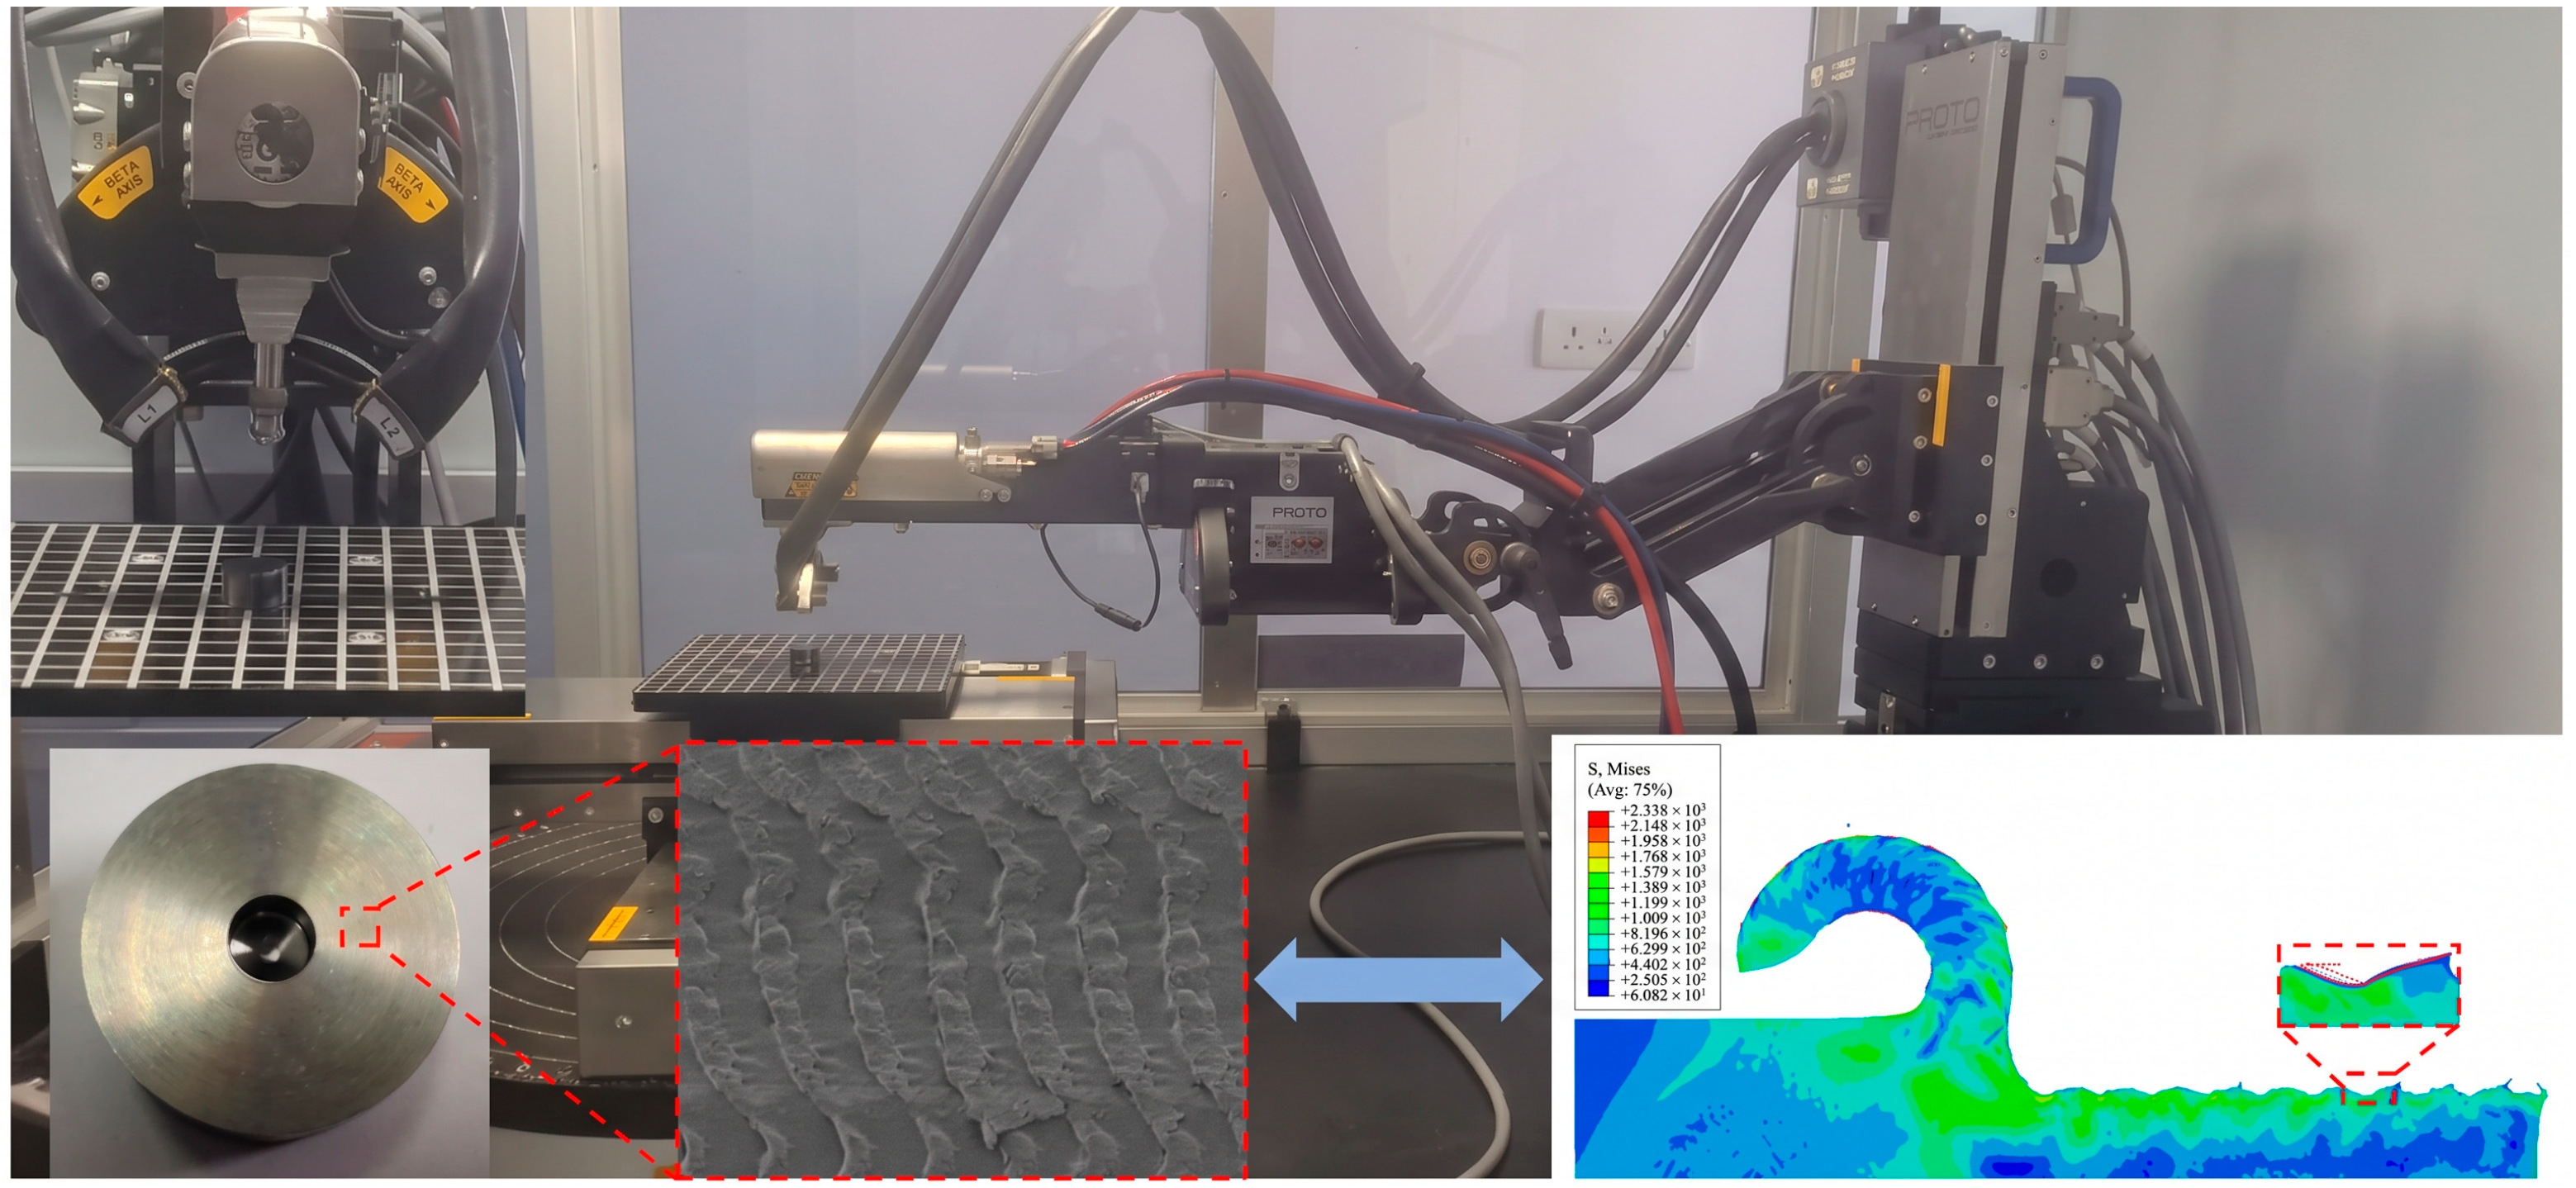
As shown in Figure 16, the cryogenic-UEVC platform primarily consists of the following components: a CNC lathe (i5 T5.2 horizontal CNC turning center with a spindle speed range of 5–5000 r/min and a machining accuracy of 2 μm), an ultrasonic elliptical vibration cutting device (with an output frequency of 20–70 kHz and a rated power of 200 W for the dual-channel ultrasonic generator), a liquid nitrogen cooling system, and a dedicated fixture. The cutting process for TB9 titanium alloy is as follows: (1) A cylindrical workpiece is fixed on the spindle of the machine tool using a custom-designed fixture to ensure parallel alignment between the workpiece surface and the chuck face; (2) The ultrasonic tool is installed on the tool holder, which is connected to the lathe tool post through an intermediate spacer; (3) The liquid nitrogen delivery tube is fixed around the processing area using a vise, and the nozzle is positioned within 10 mm of the tool’s cutting edge; (4) A self-developed fixture is used to clamp titanium alloy rods with a diameter of 17.2 mm and length of 5–10 mm for precision end-face machining. A KC5010-grade PVD AlTiN-coated cemented-carbide insert (Kennametal) was used in the cutting experiments.
Figure 16.
Cryogenic-UEVC processing platform.
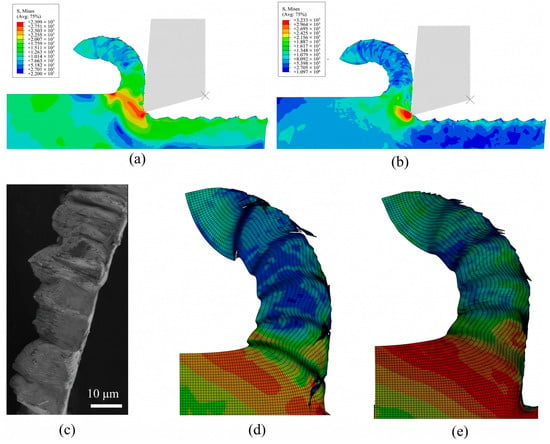
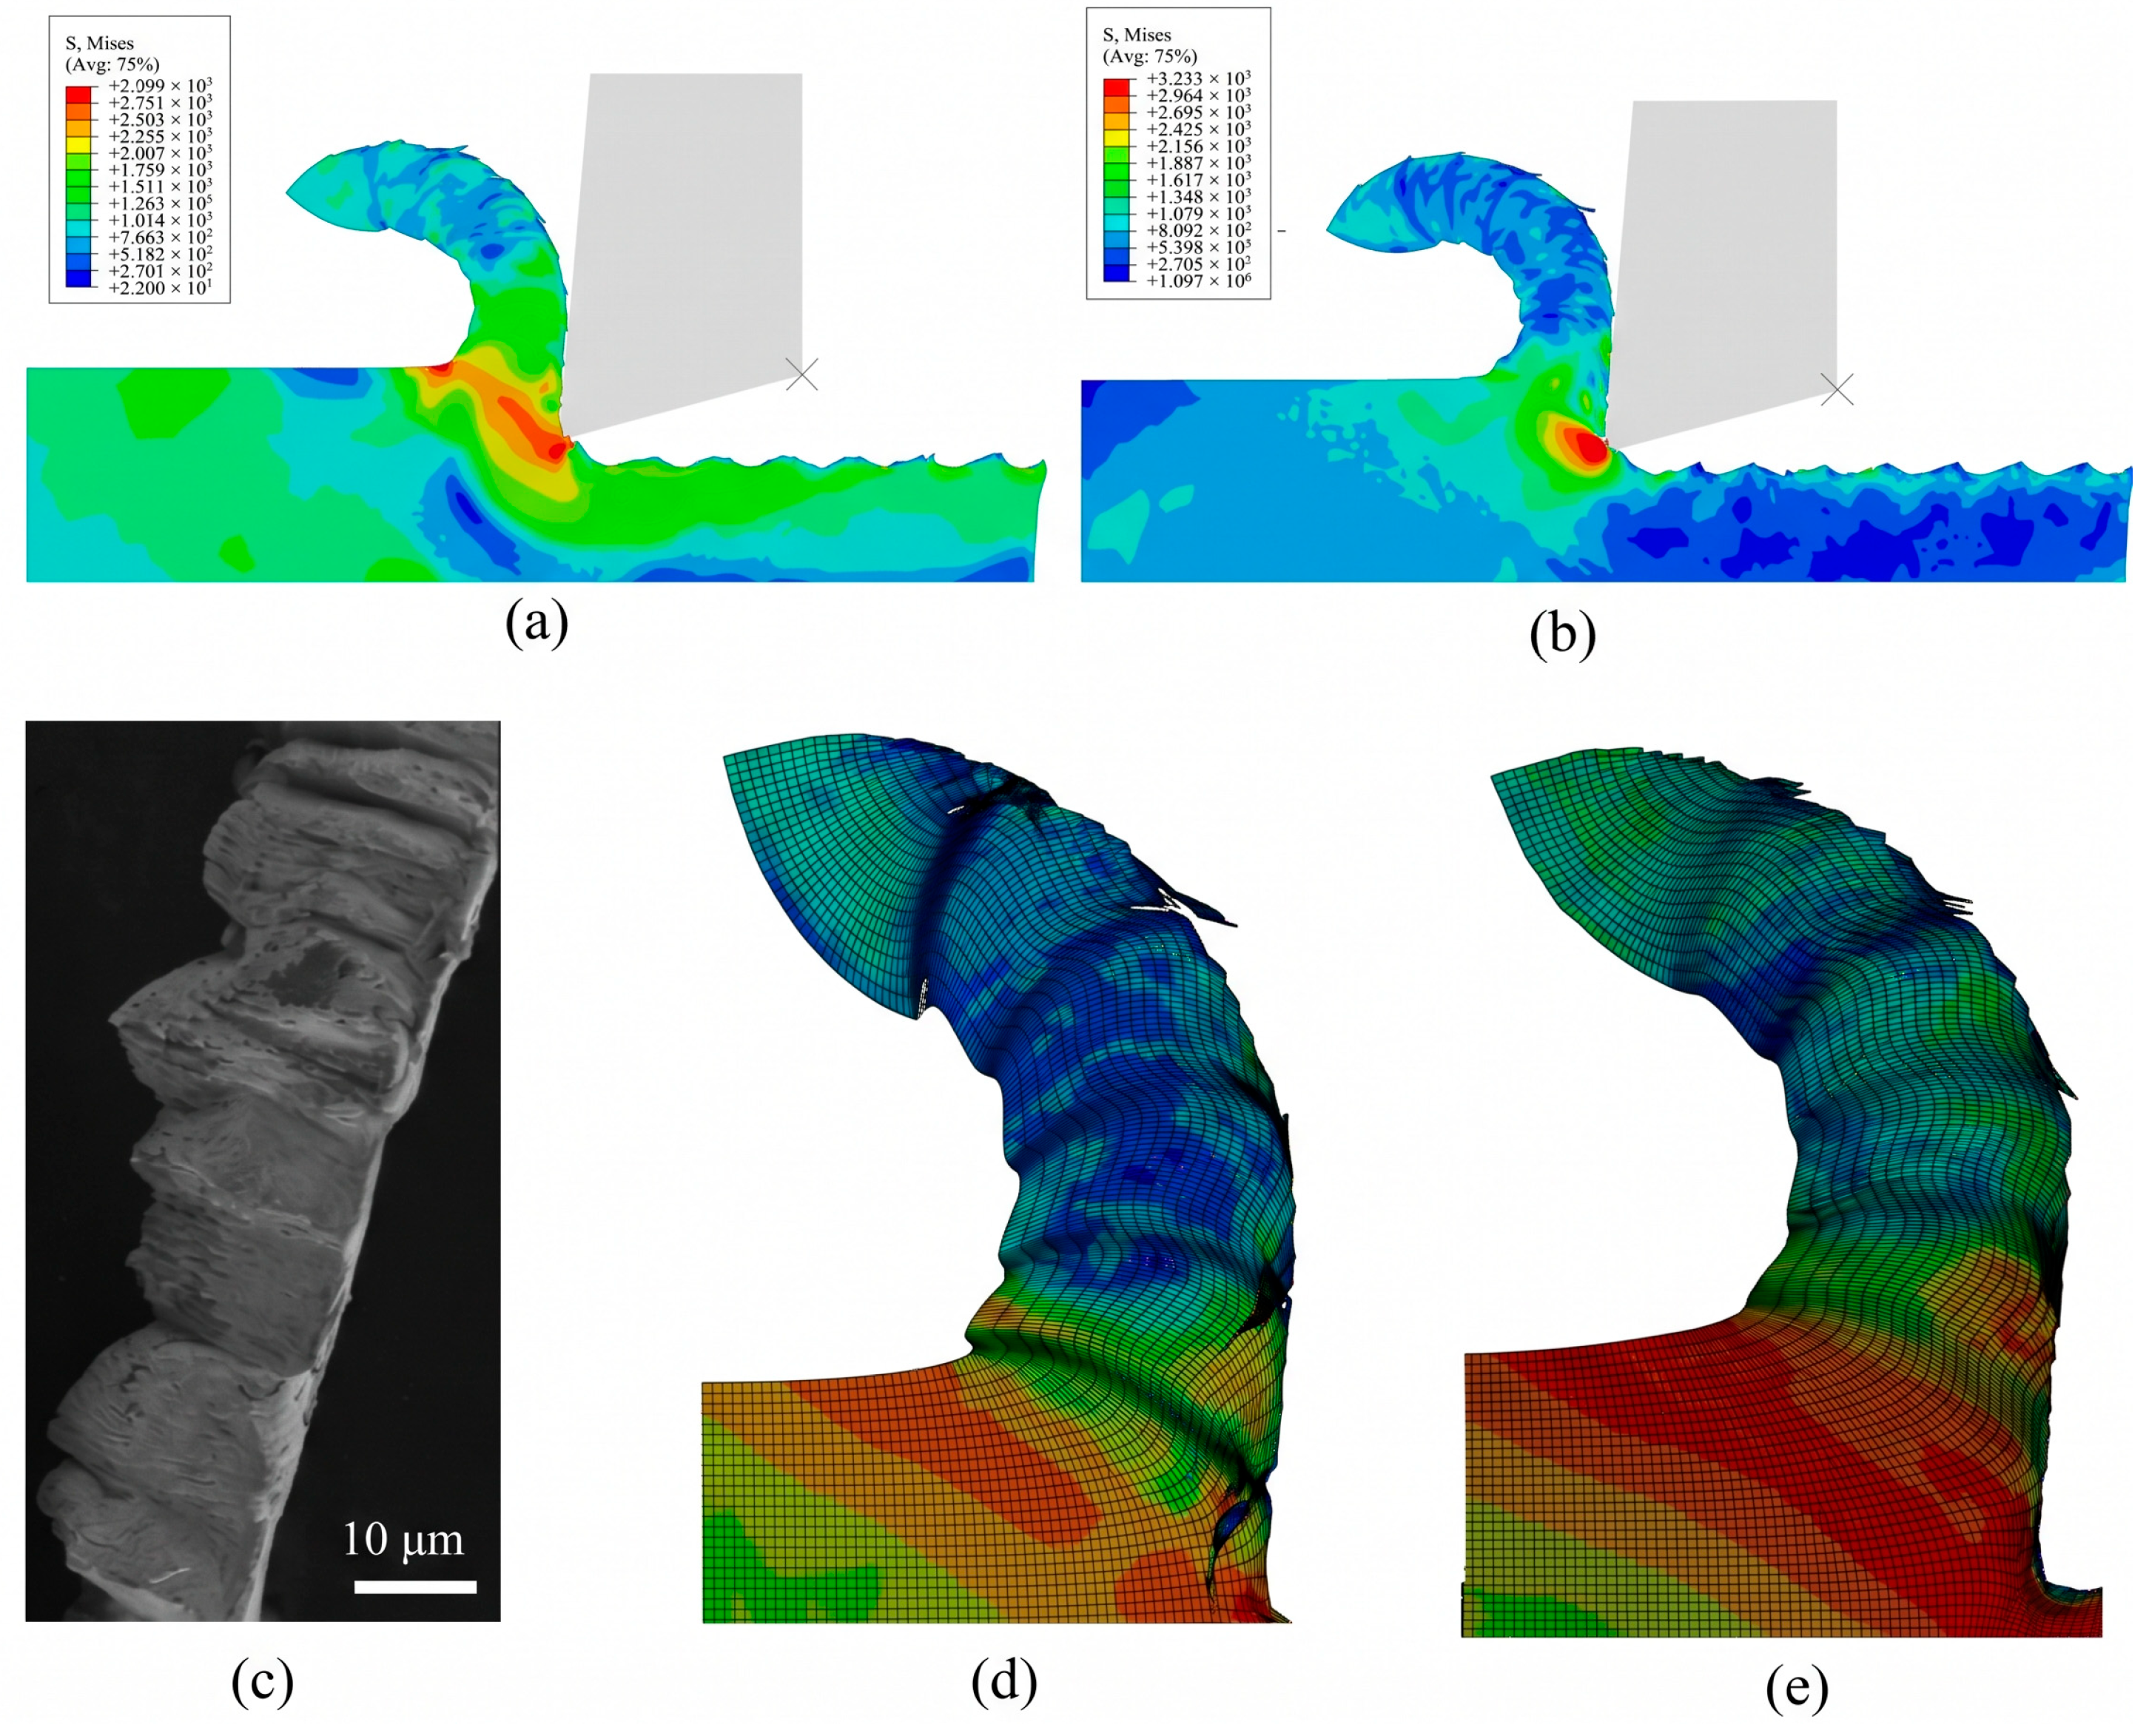
Cutting morphology, as a direct representation of the material’s dynamic mechanical response, serves as a crucial criterion for validating the accuracy of constitutive models. Particularly under extreme low-temperature and high-strain-rate conditions, thermo-mechanical coupling within the material induces adiabatic shear instability, which is reflected in the evolution of chip morphology and the distribution of the strain field. By comparing numerical simulations with experimental cutting morphology, the ability of a constitutive model to describe nonlinear phenomena, such as dynamic softening and strain localization, can be effectively evaluated. In line with this validation approach, comparative simulations using both the modified and original J-C constitutive models were performed, as shown in Figure 17.
Figure 17.
Stress contour plot and chip morphology comparison diagram: (a) M-J-C model Mises stress contour; (b) original J-C model Mises stress contour; (c) experimental chip morphology; (d) chip morphology of M-J-C model; (e) chip morphology of original J-C model. Panels (a,b) correspond to a post-processing frame during the tool-workpiece separation stage of the ultrasonic elliptical vibration cycle.
The contours in Figure 17a,b correspond to a post-processing frame during the tool–workpiece separation stage of the ultrasonic elliptical vibration cycle. Owing to the intermittent cutting characteristics of UEVC, the tool periodically separates from the workpiece; therefore, the tool tip is located above the newly machined surface at the selected instant. Such periodic tool–workpiece engagement and separation is an inherent feature of UEVC and plays an important role in the formation of the machined surface. A similar relationship between the periodic elliptical tool trajectory and surface micro-texture formation during UEVC of TB9 titanium alloy has been reported by Meng et al. [39].
Under cryogenic and high-strain-rate conditions, the experimentally measured stress–strain curves of TB9 titanium alloy exhibited post-peak softening behavior. When the softening effect becomes dominant over the stabilizing hardening mechanisms, localized shear deformation may develop. The deformation behavior of TB9 is strongly dependent on both strain rate and temperature, consistent with the rate- and temperature-dependent plastic response reported by Mo et al. [40], although their investigation was conducted over a different temperature range. These observations highlight the importance of incorporating the coupled effects of strain rate and temperature into the constitutive description of TB9 titanium alloy. It should also be noted that strain softening and negative strain-rate sensitivity represent different material responses; therefore, the observed post-peak softening alone should not be interpreted as evidence of negative strain-rate sensitivity.
As shown in Figure 17, the original J-C model predicted a relatively continuous chip morphology, showing weaker qualitative agreement with the experimentally observed segmented chip. In contrast, the M-J-C model, which incorporates corrections for the strain-rate- and temperature-dependent response of TB9 titanium alloy, reproduced the experimentally observed periodic shear-slip chip morphology more closely. The improved agreement indicates that accounting for the coupled effects of strain rate and temperature is important for describing the localized deformation behavior of TB9 during cryogenic-UEVC and improves the predictive capability of the finite element model.
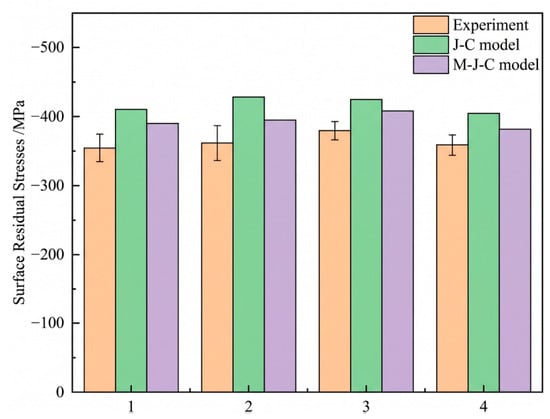
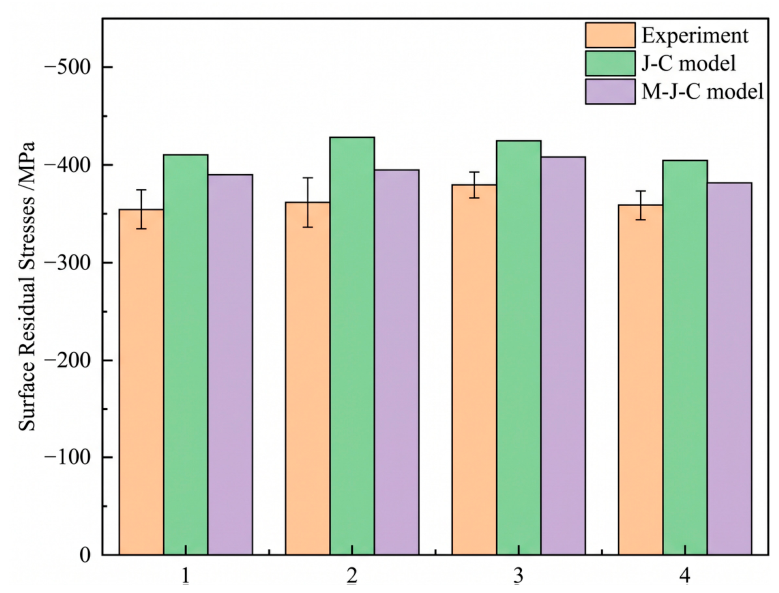
During the cryogenic-UEVC process of TB9 titanium alloy, significant non-uniform plastic deformation occurs in the subsurface layer due to the synergistic effects of high-frequency tool vibration and periodic dynamic impact loading. This coupled interaction generates a residual stress field within the machined surface layer, whose spatial distribution and magnitude are primarily governed by key process parameters, including cutting speed, cutting depth, and vibration frequency. Surface residual stresses under each parameter combination were measured using an iXRD analyzer ((Proto Manufacturing Ltd., LaSalle, ON, Canada). After completion of each cutting simulation, residual-stress values beneath individual tool marks on the simulated machined surface were extracted from the post-processing results and spatially averaged to obtain a representative surface residual-stress value. The same extraction and averaging procedure was applied to the original J-C and M-J-C models. These simulated values were compared with the surface residual stresses measured using the iXRD analyzer, as summarized in Figure 18 and Figure 19.
Figure 18.
Comparison of surface residual stresses in experimental tests.
Figure 19.
Comparison of experimental and simulated surface residual stresses.
The surface residual stresses obtained from experiments and simulations were systematically analyzed, with a comparative analysis conducted between the average residual stress data derived from simulations based on the original J-C constitutive model and the M-J-C constitutive model, as shown in Figure 19. Under machining parameter No. 1, the experimentally measured surface residual-stress magnitude was approximately 355 MPa. However, the simulated residual-stress magnitude based on the original J-C constitutive model yielded a value of 411 MPa, corresponding to an error of 15.7%. In contrast, the M-J-C constitutive model simulation produced an average residual stress of 391 MPa, exhibiting a reduced error of 9.8%. Following this trend, under machining parameter No. 2, the error of the M-J-C constitutive model simulation was 9.4% lower than that of the original J-C constitutive model. Similarly, the M-J-C constitutive model demonstrated error reductions of 4.2% and 6.4% under machining parameters No. 3 and No. 4, respectively, compared to the original J-C constitutive model simulations. Therefore, the M-J-C constitutive model effectively improves the accuracy of the simulation model and can more accurately describe the cryogenic dynamic mechanical properties of TB9 titanium alloy.
6. Conclusions
In this study, the dynamic mechanical properties of TB9 titanium alloy were investigated using the SHPB experimental setup. The relationship between the flow stress and strain of TB9 titanium alloy under different temperatures and strain rates was analyzed, and an M-J-C constitutive model was established. The accuracy of the modified J-C constitutive model was verified through finite element simulation and cryogenic-UEVC experiments. The research conclusions are as follows:
- Under the reported cryogenic conditions, peak flow stress first increased and then decreased as the average strain rate rose from 2000 to 8000 s−1. At 25 °C, peak stresses showed limited variation over this rate range. At a fixed strain rate, lower reported temperatures were associated with higher peak flow stresses.
- The post-peak decrease in flow stress indicates macroscopic softening under the displayed test conditions. The stress–strain curves and fracture images do not uniquely distinguish thermal softening, localized deformation, or microscopic recovery mechanisms.
- A strain rate sensitivity coefficient that simultaneously accounts for strain rate and strain functions was established, and a temperature term exponential function based on temperature and strain indices was constructed. Compared to the original J-C model, the M-J-C model could more accurately describe the flow characteristics of TB9 titanium alloy under cryogenic and high-strain-rate conditions.
- Under machining parameter set No. 1, the experimentally measured surface residual-stress magnitude was approximately 355 MPa, while the original J-C and M-J-C models predicted 411 MPa and 391 MPa, respectively. The corresponding prediction error was reduced from 15.7% for the original J-C model to 9.8% for the M-J-C model. For parameter sets Nos. 2–4, the prediction errors of the M-J-C model were lower than those of the original J-C model by 9.4%, 4.2%, and 6.4%, respectively. In addition, the M-J-C model more accurately reproduced the experimentally observed periodic shear-slip chip morphology, whereas the original J-C model predicted a relatively continuous chip morphology. These quantitative and qualitative comparisons demonstrate that the M-J-C model provides improved agreement with the experimental results for the selected validation indicators under the four investigated machining conditions.
Author Contributions
Conceptualization, X.F.; methodology, Y.M.; software, Q.H.; validation, Y.W.; formal analysis, Y.M.; investigation, C.W.; resources, Y.P.; data curation, C.Z.; writing—original draft preparation, Y.M.; writing—review and editing, X.F.; visualization, Q.H.; supervision, X.F.; project administration, Y.P.; funding acquisition, Y.P. All authors have read and agreed to the published version of the manuscript.
Funding
This work was funded by the National Natural Science Foundation of China (No. 52405481, 52575500), National Natural Science Foundation of Shandong Province (No. ZR2024QE184, ZR2024ME063), Key R&D Program of Shandong Province (No. 2024TSGC0065, 2024TSGC0614), and University of Jinan Disciplinary Cross-Convergence Construction Project 2024 (XKJC-202406).
Institutional Review Board Statement
Not applicable.
Informed Consent Statement
Not applicable.
Data Availability Statement
No new data were created or analyzed in this study. Data sharing is not applicable to this article.
Conflicts of Interest
The authors declare that they have no known competing financial interests or personal relationships that could have appeared to influence the work reported in this paper.
References
- Yang, Y.; Yan, S.; Qu, S.; Yi, M.; Chen, Z.; Zhou, T.; Xu, C. Microstructure of titanium alloy in additive/subtractive hybrid manufacturing: A review. J. Alloys Compd. 2025, 1014, 178769. [Google Scholar] [CrossRef] [Scilit]
- Xu, G.; Zhao, X.; Xia, W.; Yue, Q.; Zheng, Z.; Gu, Y.; Zhang, Z. A review on microstructure design, processing, and strengthening mechanism of high-strength titanium alloys. Prog. Nat. Sci. Mater. Int. 2025, 35, 258–277. [Google Scholar] [CrossRef] [Scilit]
- Gupta, J.; Arora, A.; Singh, J. Advances in high-temperature deformation of titanium alloys: Experimental and modeling aspects for industrial applications. Mater. Sci. Eng. A 2025, 948, 149295. [Google Scholar] [CrossRef] [Scilit]
- Arya, P.K.; Pandey, P.M.; Jain, N.K.; Sathiaraj, D.; Sawant, M.S.; Srivastava, A. Recent advances in strengthening titanium alloys through alloying elements. Adv. Compos. Hybrid Mater. 2026, 9, 225. [Google Scholar] [CrossRef] [Scilit]
- Li, S.; Yuan, J.; Liu, W.; Hao, P.; Xu, S.; Yao, J.; Fan, Q.; Yang, L. Underlying toughening mechanisms of TB9/TC4 laminated composite suffering impact load. J. Alloys Compd. 2025, 1022, 179872. [Google Scholar] [CrossRef] [Scilit]
- Tong, J.F.; Feng, Z.G.; Jiang, Y.L.; Tao, L. Simulation and experiment study on cold heading for TB9 titanium alloy core rod. Forg. Stamp. Technol. 2023, 48, 32–40. [Google Scholar]
- Li, S.; Hao, P.; Xu, S.; Yang, L.; Fan, Q. Optimization of Johnson-Cook constitutive parameters of titanium alloy based on a machine learning-accelerated genetic algorithm. Mater. Today Commun. 2025, 49, 114061. [Google Scholar] [CrossRef] [Scilit]
- Wang, F.; Wang, Y. Effect of cryogenic cooling on deformation of milled thin-walled titanium alloy parts. Int. J. Adv. Manuf. Technol. 2022, 122, 3683–3692. [Google Scholar] [CrossRef] [Scilit]
- Zhao, X.; Li, R.; Liu, E.; Lan, C. Effect of cryogenic cutting surface integrity on fatigue life of titanium alloy Ti-5553. Ferroelectrics 2022, 596, 115–125. [Google Scholar] [CrossRef] [Scilit]
- Liu, H.; Ayed, Y.; Birembaux, H.; Rossi, F.; Poulachon, G. Impacts of flank wear and cooling strategies on evolutions of built-up edges, diffusion wear and cutting forces in Ti6Al4V machining. Tribol. Int. 2022, 171, 107537. [Google Scholar] [CrossRef] [Scilit]
- Dhananchezian, M.; Kumar, M.P. Cryogenic turning of the Ti-6Al-4V alloy with modified cutting tool inserts. Cryogenics 2011, 51, 34–40. [Google Scholar] [CrossRef] [Scilit]
- Zhao, W.; Gong, L.; Ren, F.; Li, L.; Xu, Q.; Khan, A.M. Experimental study on chip deformation of Ti-6Al-4V titanium alloy in cryogenic cutting. Int. J. Adv. Manuf. Technol. 2018, 96, 4021–4027. [Google Scholar] [CrossRef] [Scilit]
- Zhang, P.; Lin, Z.; Yue, X.; Sun, Y.; Zhou, H.; Zhang, J.; Chen, X. Study on the influence of ultrasonic elliptical vibration cutting on the micro-cutting mechanism of FeCoCrNiAl0.6 high-entropy alloy. J. Braz. Soc. Mech. Sci. Eng. 2024, 46, 672. [Google Scholar] [CrossRef] [Scilit]
- Hashmi, M.S.J.; Hamouda, A.M.S. Development of a one-dimensional constitutive equation for metals subjected to high strain rate and large strain. J. Strain Anal. Eng. Des. 1994, 29, 117–127. [Google Scholar] [CrossRef] [Scilit]
- Anand, L. Constitutive equations for hot-working of metals. Int. J. Plast. 1985, 1, 213–231. [Google Scholar] [CrossRef] [Scilit]
- Shen, W.; Xue, F.; Li, C.; Liu, Y.; Mo, X.; Gao, Q. Study on constitutive relationship of 6061 aluminum alloy based on Johnson-Cook model. Mater. Today Commun. 2023, 37, 106982. [Google Scholar] [CrossRef] [Scilit]
- Kumar, H.; Manna, R.; Khan, D. Evaluation of Johnson-Cook material model parameters for Fe-30Mn-9Al-0.8 C low-density steel in metal forming applications. J. Mater. Sci. 2023, 58, 8118–8129. [Google Scholar] [CrossRef] [Scilit]
- Bakhshan, H.; Carbonell, J.; Oñate, E. A modified Johnson-Cook model for the plastic behavior of metals in ultrasonic vibration-assisted upsetting processes. J. Manuf. Processes 2024, 121, 361–373. [Google Scholar] [CrossRef] [Scilit]
- Cao, R.; Wang, W.; Ma, S.; Yan, H.; Mu, Z.; Zhang, S. Arrhenius constitutive model and dynamic recrystallization behavior of 18CrNiMo7-6 steel. J. Mater. Res. Technol. 2023, 24, 6334–6347. [Google Scholar] [CrossRef] [Scilit]
- Wu, B.B.; Wang, Y.X.; Liu, X.M.; Zhang, D.; Zhou, S.; Deng, L.; Wang, L.; Li, H. Investigation on dynamic deformation behavior of 7A75 aluminum alloy over wide strain rates and constitutive model establishment. J. Mater. Res. Technol. 2024, 30, 5963–5976. [Google Scholar] [CrossRef] [Scilit]
- Lin, H.; Jin, G.; Zhan, Q.; Wang, G.; Han, J. Mechanical properties and constitutive model of TC4 titanium alloy at cryogenic. J. Mater. Eng. Perform. 2024, 33, 13731–13743. [Google Scholar] [CrossRef] [Scilit]
- Korkmaz, M.E.; Yaşar, N.; Günay, M. Numerical and experimental investigation of cutting forces in turning of Nimonic 80A superalloy. Eng. Sci. Technol. Int. J. 2020, 23, 664–673. [Google Scholar] [CrossRef] [Scilit]
- ISO 6892-1:2019; Metallic Materials—Tensile Testing—Part 1: Method of Test at Room Temperature. International Organization for Standardization (ISO): Geneva, Switzerland, 2019.
- Dorogoy, A.; Rittel, D. Quasi-static and dynamic large strain shear-tension testing. Exp. Mech. 2017, 57, 1509–1514. [Google Scholar] [CrossRef] [Scilit]
- Khan, M.M.; Kumar, A.; Iqbal, M.A. Development of tensile split Hopkinson pressure bar technique for studying the dynamic behaviour of metals. Mech. Solids 2023, 58, 3315–3332. [Google Scholar] [CrossRef] [Scilit]
- Yang, X.; Li, W.; Fu, Y.; Ye, Q.; Xu, Y.; Dong, X.; Hu, K.; Zou, Y. Finite element modelling for temperature, stresses and strains calculation in linear friction welding of TB9 titanium alloy. J. Mater. Res. Technol. 2019, 8, 4797–4818. [Google Scholar] [CrossRef] [Scilit]
- GB/T 228.1-2021; Metallic Materials—Tensile Testing—Part 1: Method of Test at Room Temperature. Standardization Administration of China (SAC): Beijing, China, 2021.
- Amraei, M.; Jiao, H.; Toghyani, A.; Björk, T.; Zhao, X.-L. CFRP strengthening of butt-welded ultra-high strength steels under quasi-static tensile loading. Eng. Struct. 2021, 246, 113052. [Google Scholar] [CrossRef] [Scilit]
- Fu, Y.; Chen, S.; Zhao, P.; Ye, X. The mechanism of deformation compatibility of TA2/Q345 laminated metal in dynamic testing with split-Hopkinson pressure bar. Materials 2023, 16, 7659. [Google Scholar] [CrossRef] [Scilit]
- Shi, X.; Zhao, C.; Cao, Z.; Zhang, T.; Wang, Z.; Qiao, J. Mechanical behavior of a near α titanium alloy under dynamic compression: Characterization and modeling. Prog. Nat. Sci. Mater. Int. 2019, 29, 432–439. [Google Scholar] [CrossRef] [Scilit]
- Zhou, T.; Wu, J.; Liang, Z.; Che, J.; Zhang, Y.; Wang, X. A novel constitutive model for Ti-6Al-4V alloy based on dislocation pile-up theory. Mater. Sci. Technol. 2017, 33, 1379–1387. [Google Scholar] [CrossRef] [Scilit]
- Yang, Y.; Liu, B. Experimental study on formation characteristics and laws of dislocation and stacking fault during cutting of titanium alloy. Adv. Mater. Sci. Eng. 2013, 1, 306728. [Google Scholar] [CrossRef] [Scilit]
- Li, C.; Cui, Y.; Zheng, W.; Song, L.; Wu, Y.; Wu, Y.; Yu, C.; Hui, X. Unveiling the dynamic softening mechanism via micromechanical behavior for a near-β titanium alloy deformed at a high strain rate. J. Mater. Res. Technol. 2023, 26, 9392–9405. [Google Scholar] [CrossRef] [Scilit]
- Furuhara, T.; Poorganji, B.; Abe, H.; Maki, T. Dynamic recovery and recrystallization in titanium alloys by hot deformation. Jom 2007, 59, 64–67. [Google Scholar] [CrossRef] [Scilit]
- Lu, Z.; Zhang, X.; Ji, W.; Wei, S.; Yao, C.; Han, D. Investigation on the deformation mechanism of Ti-5Al-2.5 Sn ELI titanium alloy at cryogenic and room temperatures. Mater. Sci. Eng. A 2021, 818, 141380. [Google Scholar] [CrossRef] [Scilit]
- Sun, Y.; Li, G.; He, Z.; Kong, X. The advance of research on constitutive model used in finite element simulation of metal cutting. Proc. Inst. Mech. Eng. Part C J. Mech. Eng. Sci. 2022, 236, 4921–4945. [Google Scholar] [CrossRef] [Scilit]
- Li, J.; Wang, Y.; Jiang, S.; Cheng, Y.; Zuo, Y.; Liu, H.; Wang, Y. Correction of the constitutive model and analysis of chip formation in cryogenic machining of TA15 titanium alloy. J. Manuf. Processes 2024, 113, 16–33. [Google Scholar] [CrossRef] [Scilit]
- Kumar Srivastav, C.; Khan, D. Constitutive models based on titanium and its alloys for studying deformation and stresses in dental prosthesis: A comprehensive review. Proc. Inst. Mech. Eng. Part C J. Me-Chanical Eng. Sci. 2024, 238, 4899–4916. [Google Scholar] [CrossRef] [Scilit]
- Meng, Y.; Pan, Y.; Sun, Y.; Liang, H.; Li, T.; Fu, X. Evolution mechanism of micro-texture morphology in ultrasonic elliptical vibration cutting of TB9 titanium alloy. Int. J. Adv. Manuf. Technol. 2025, 140, 2733–2748. [Google Scholar] [CrossRef] [Scilit]
- Mo, N.; Feng, Z.; Jiang, Y.; Lu, R.; Tao, L.; Deng, J. Elucidating the strain rate and temperature dependent plasticity of TB9 titanium alloy: An integrated constitutive and microstructural analysis. J. Alloys Compd. 2026, 1075, 189274. [Google Scholar] [CrossRef] [Scilit]

Disclaimer/Publisher’s Note: The statements, opinions and data contained in all publications are solely those of the individual author(s) and contributor(s) and not of MDPI and/or the editor(s). MDPI and/or the editor(s) disclaim responsibility for any injury to people or property resulting from any ideas, methods, instructions or products referred to in the content. |
© 2026 by the authors. Licensee MDPI, Basel, Switzerland. This article is an open access article distributed under the terms and conditions of the Creative Commons Attribution (CC BY) license.