


Abstract
In this study, a multi-gradient microstructure was introduced into medium-Mn steel through torsion following heat treatment at different annealing temperatures, and through investigations on the mechanical properties under two annealing temperatures, it has also been revealed that different annealing temperatures before torsion affect the stability of austenite after torsion, thereby leading to distinct variations in mechanical performance. The yield strengths of the studied steel after annealing at 600 °C and 620 °C were 762 MPa and 673 MPa, with total elongation of 47.4% and 44.1%, respectively. After 90° torsion, the yield strength of experimental steels increased to 834 MPa and 808 MPa, while the elongation decreased to 21.6% and 29.5%, respectively. The gradient distributions from the center to the edge were observed for the austenite volume fraction, average grain size, martensite volume fraction, GND density, and hardness. The comparative analysis of the two annealing temperatures indicates that the larger grain size in the 620—annealed sample leads to its lower yield strength, while its higher austenite volume fraction and moderate stability promote a more sustained TRIP effect during deformation, contributing to its enhanced elongation. This multi-gradient microstructure is responsible for the yield strength improvements of 72 MPa and 135 MPa in the torsioned samples annealed at 600 °C and 620 °C, respectively.
1. Introduction
With the continuous improvement of living standards, automobiles have become the most prevalent means of transportation. However, as demands for vehicle lightweighting and safety performance increase, traditional steels can no longer fully meet these requirements. As a result, medium-Mn steel (MMS) has attracted extensive research interest due to its high strength, considerable work hardening capacity, and relatively low raw material cost [1,2,3,4]. The chemical composition and processing routes of MMS play a decisive role in its microstructural evolution, which in turn significantly influences mechanical, corrosion, and wear properties. Researchers have thus dedicated considerable effort to establishing direct correlations between microstructural evolution and performance, with significant advances in the following areas: alloy design for phase constitution and carbide precipitation [5,6,7]; processing routes for tailoring microstructural evolution and strengthening mechanisms such as twinning-induced plasticity (TWIP) and transformation-induced plasticity (TRIP) [8,9,10,11,12,13]; and strategies for regulating work hardening and corrosion resistance in MMS [14,15].
In recent decades, significant efforts have been devoted to studying microstructural heterogeneity, including the incorporation of gradient structures within materials [16,17,18]. Compared to their homogeneous counterparts, such gradient-structured materials often exhibit superior mechanical properties, positioning them at the forefront of materials research. For instance, novel strategies have been explored to tailor copper properties via gradient structures [19], with grain size progressively refining from coarse grains in the core to nanoscale grains at the surface. Shao et al. [20] proposed an approach to enhance the high-cycle fatigue (HCF) resistance of TWIP steel by introducing a gradient grain size distribution, resulting in improved HCF performance compared to homogeneous structures. Wang et al. [21] employed a pre-torsion method to increase the ultimate tensile strength (UTS) of an Al alloy by 600 MPa without compromising ductility. Going beyond single gradients, Wu et al. [22] combined gradient structures with the TRIP effect to develop an austenitic stainless steel with high strength and ductility. Zhang et al. [23] demonstrated that torsional deformation of 60° following annealing at 680 °C for 1 h introduced multiple gradient features, leading to a 27% increase in yield strength (YS) and a 25% improvement in total elongation (TE). Still, the effect of different annealing temperatures on the mechanical properties of medium-Mn steel has not been investigated. However, in the Fe-Mn-Al-Cu system, the influence of intercritical annealing temperature on the formation of gradient structure upon torsion and its effect on austenite stability have not been systematically studied. The purpose of this paper is to investigate the austenite content and stability after torsion at different annealing temperatures, as well as the impact of the resulting gradient structure on the mechanical properties of medium-Mn steel within this system.
2. Materials and Methods
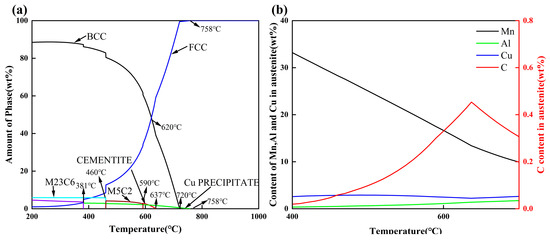
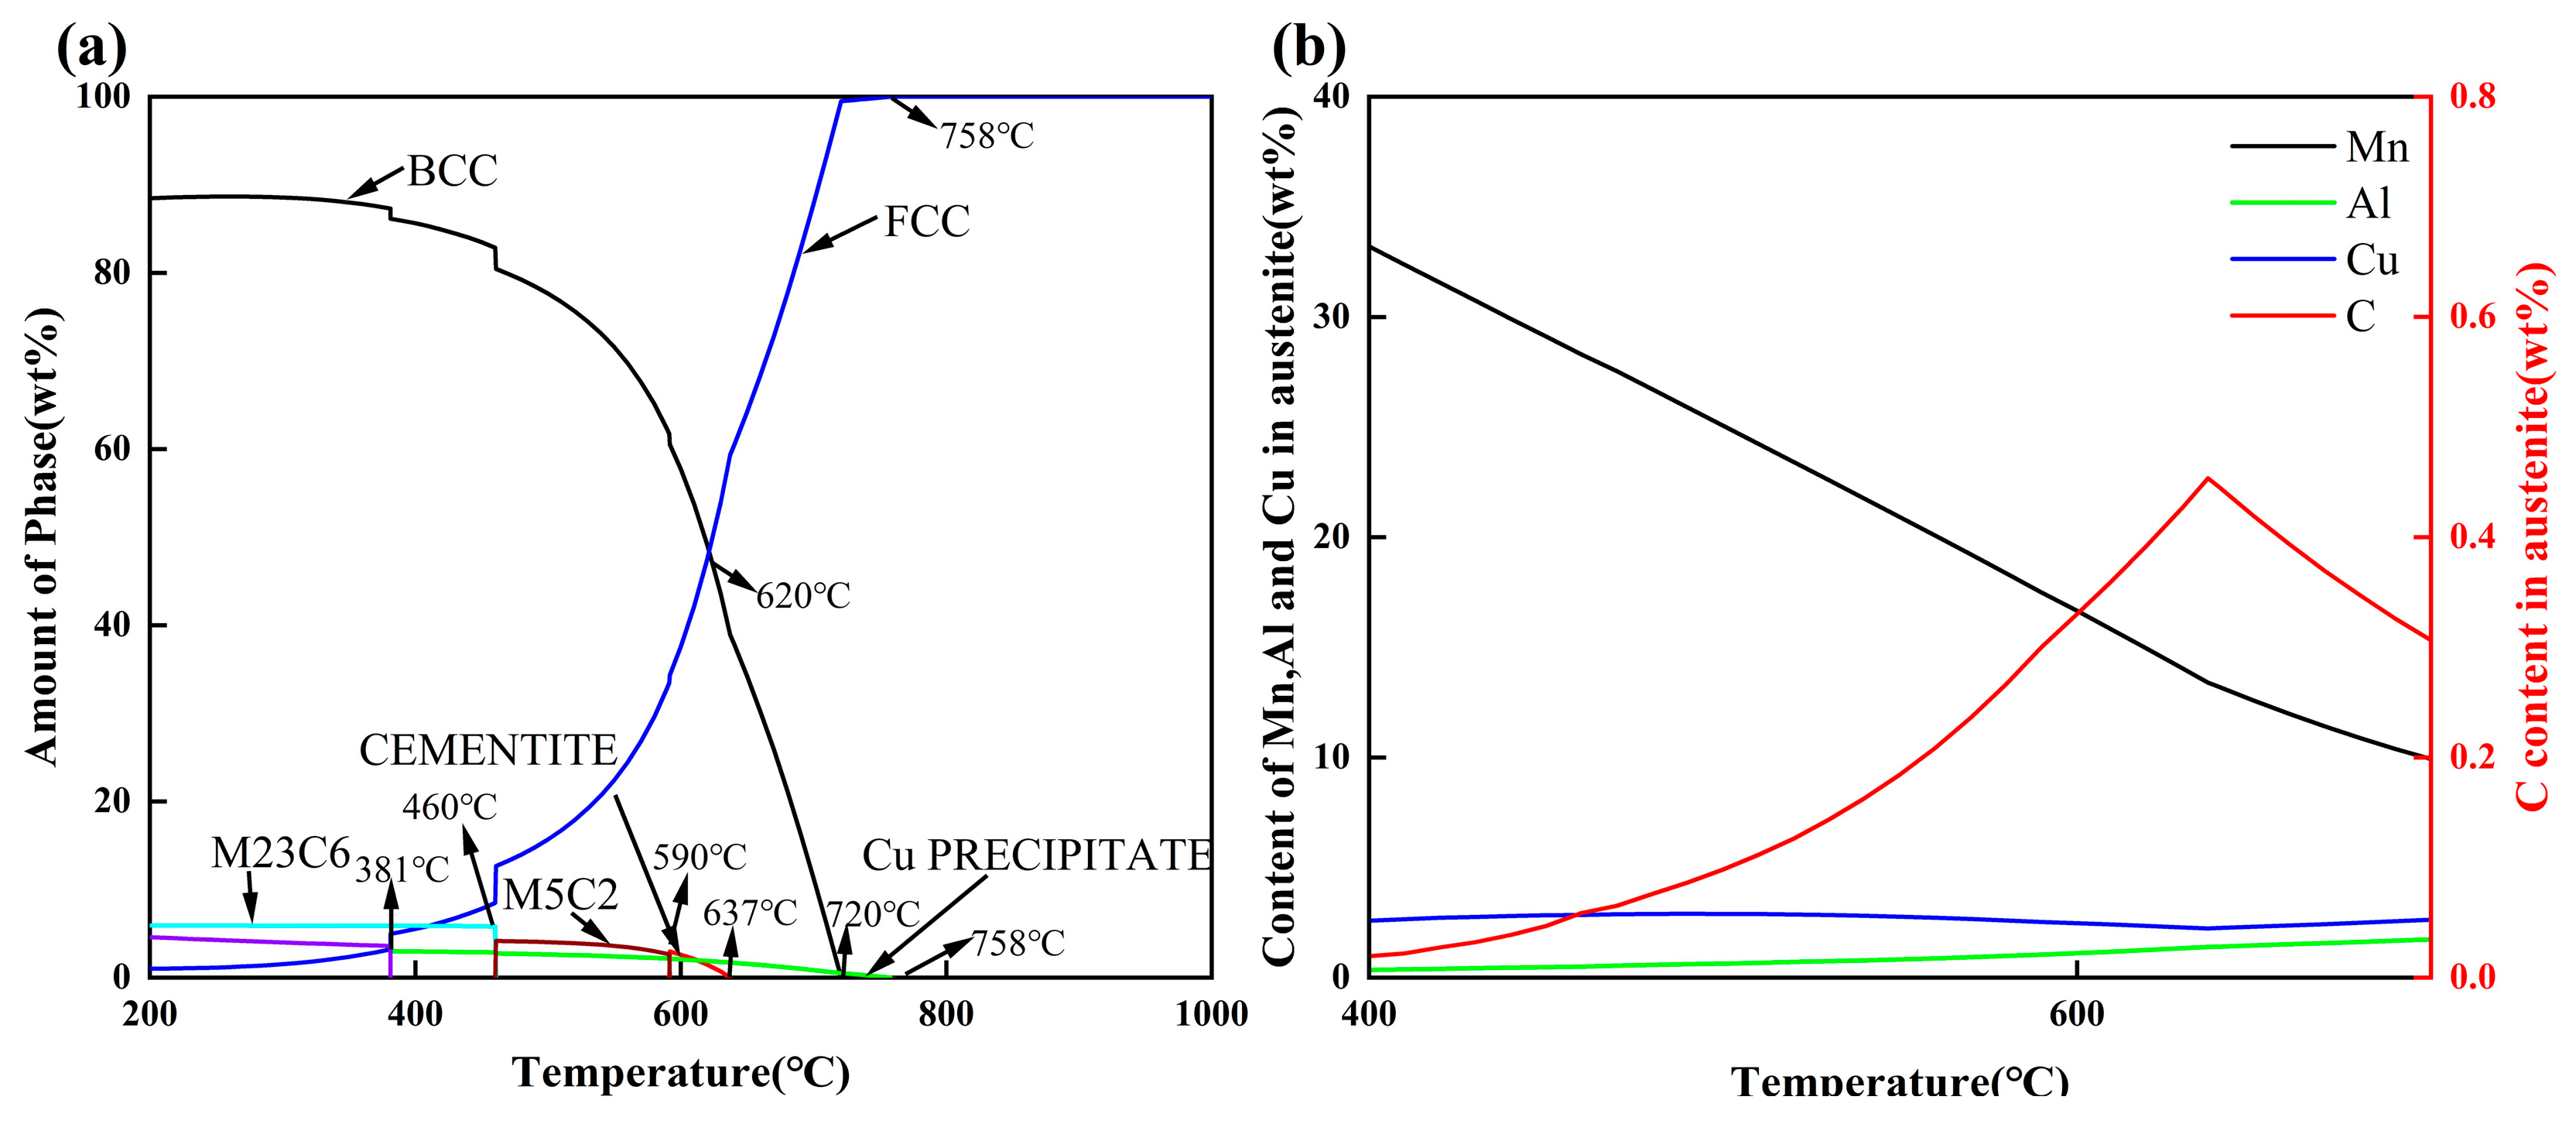
The investigated steel has a nominal composition of Fe-9.1Mn-1.86Al-3.3Cu-0.27C (wt.%). It was melted in an electromagnetic vacuum induction furnace under an argon atmosphere and cast into a 40 kg ingot. The ingot was heated at 1200 °C for 1 h, followed by hot forging and cutting into cylindrical rods of Φ12 mm × 90 mm, which were subsequently air-cooled to room temperature. The hot-forged steel bar was first sectioned into 60 mm long rods using wire electrical discharge machining (Wire-EDM). These rods were then machined on a lathe into tensile and torsion specimens with a total length of 60 mm, featuring a reduced gauge section of 30 mm in length and 5 mm in diameter. Specimens subjected to heat treatment followed by torsion were selected for subsequent analysis. Their surfaces were ground with progressively finer grit sandpapers until a uniform, polished appearance was achieved. Phase transformation temperatures were calculated using Thermo-Calc software version 2019a (TCFE8), as shown in Figure 1a. The critical temperatures A1 (where pearlite fully transforms to austenite) and A3 (where ferrite fully transforms to austenite) were determined to be 460 °C and 720 °C, respectively. Figure 1b shows the element distribution within the austenite grains. With increasing annealing temperature, the contents of Al and Cu remain basically stable, while the Mn content gradually decreases. The C content peaks at 630 °C and then decreases. Specimens were subjected to intercritical annealing in a box furnace at temperatures of 600 °C and 620 °C for 1 h, followed by air cooling (designated as A600 and A620). The annealed specimens were then torsioned to 90° and 180° at a rate of 30 °/min using a HY-NZ torsion testing machine (designated as A600-90, A620-90, A600-180, and A620-180). Tensile tests were conducted at room temperature using an Instron 3382 dual-column floor-mounted universal testing machine. A constant crosshead displacement rate of 0.0075 mm/s was applied throughout the tests. Microhardness measurements were conducted on a Struers Vickers microhardness tester using a load of HV0.1. Ten equidistant points along the radial direction of the specimen surface were measured, and the results were averaged.
Figure 1.
Thermo-Calc simulation results. (a) Phase diagram showing phase composition as a function of temperature; (b) Element content in austenite as a function of temperature.
Metallographic specimens with dimensions of Φ5 × 5 mm were extracted from the hot-forged steel bars in the following conditions: heat-treated, followed by torsion at various angles. The observation plane for all specimens was the transverse cross-section of the bars. The preparation procedure commenced with grinding off the oxide layer and wire-electrical-discharge-machining (wire-EDM) traces from both the side and cross-sectional surfaces using 150-grit sandpaper. Each specimen was subsequently rotated by 90°, and grinding was continued with 320-grit sandpaper in this new direction until the abrasion scratches uniformly superseded those from the previous orientation. This sequential grinding process was repeated using progressively finer sandpapers ranging from 400 to 3000 grit. Following grinding, the specimens were polished on a polishing machine until a scratch-free, mirror-like finish was achieved. The polished surfaces were then etched with a 4% nital solution. Immediately after etching, the specimens were rinsed thoroughly with alcohol to prevent residual etchant from affecting the surface, and finally dried using an air blower. Microstructural characterization was performed using an FEI Quanta 650 FEG thermal field emission scanning electron microscope (SEM).
EBSD specimens were prepared by hot mounting, followed by sequential grinding with progressively finer grit sandpapers and subsequent mechanical polishing. When the specimen surface achieved a near-mirror finish, the mounted block was opened to retrieve the specimen for electropolishing. Electropolishing was conducted using an electrolyte of 10 vol.% perchloric acid in alcohol at 25 °C, applied at 20 V for approximately 15 s. Microstructural characterization was performed using an FEI Quanta-650 FEG thermal field emission scanning electron microscope. The step size was set at 70 nm with a magnification of 10,000×, resulting in a scan area of 35 μm × 29.65 μm. The average Confidence Index (CI) was 0.6. EBSD data were processed with OIM Analysis 7.0 software.
3. Results and Discussion
3.1. Mechanical Properties
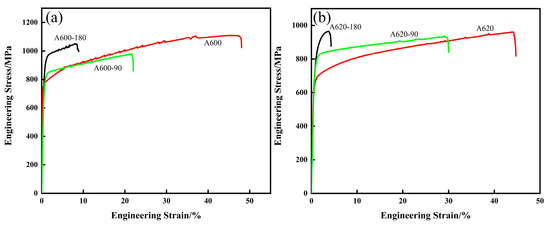
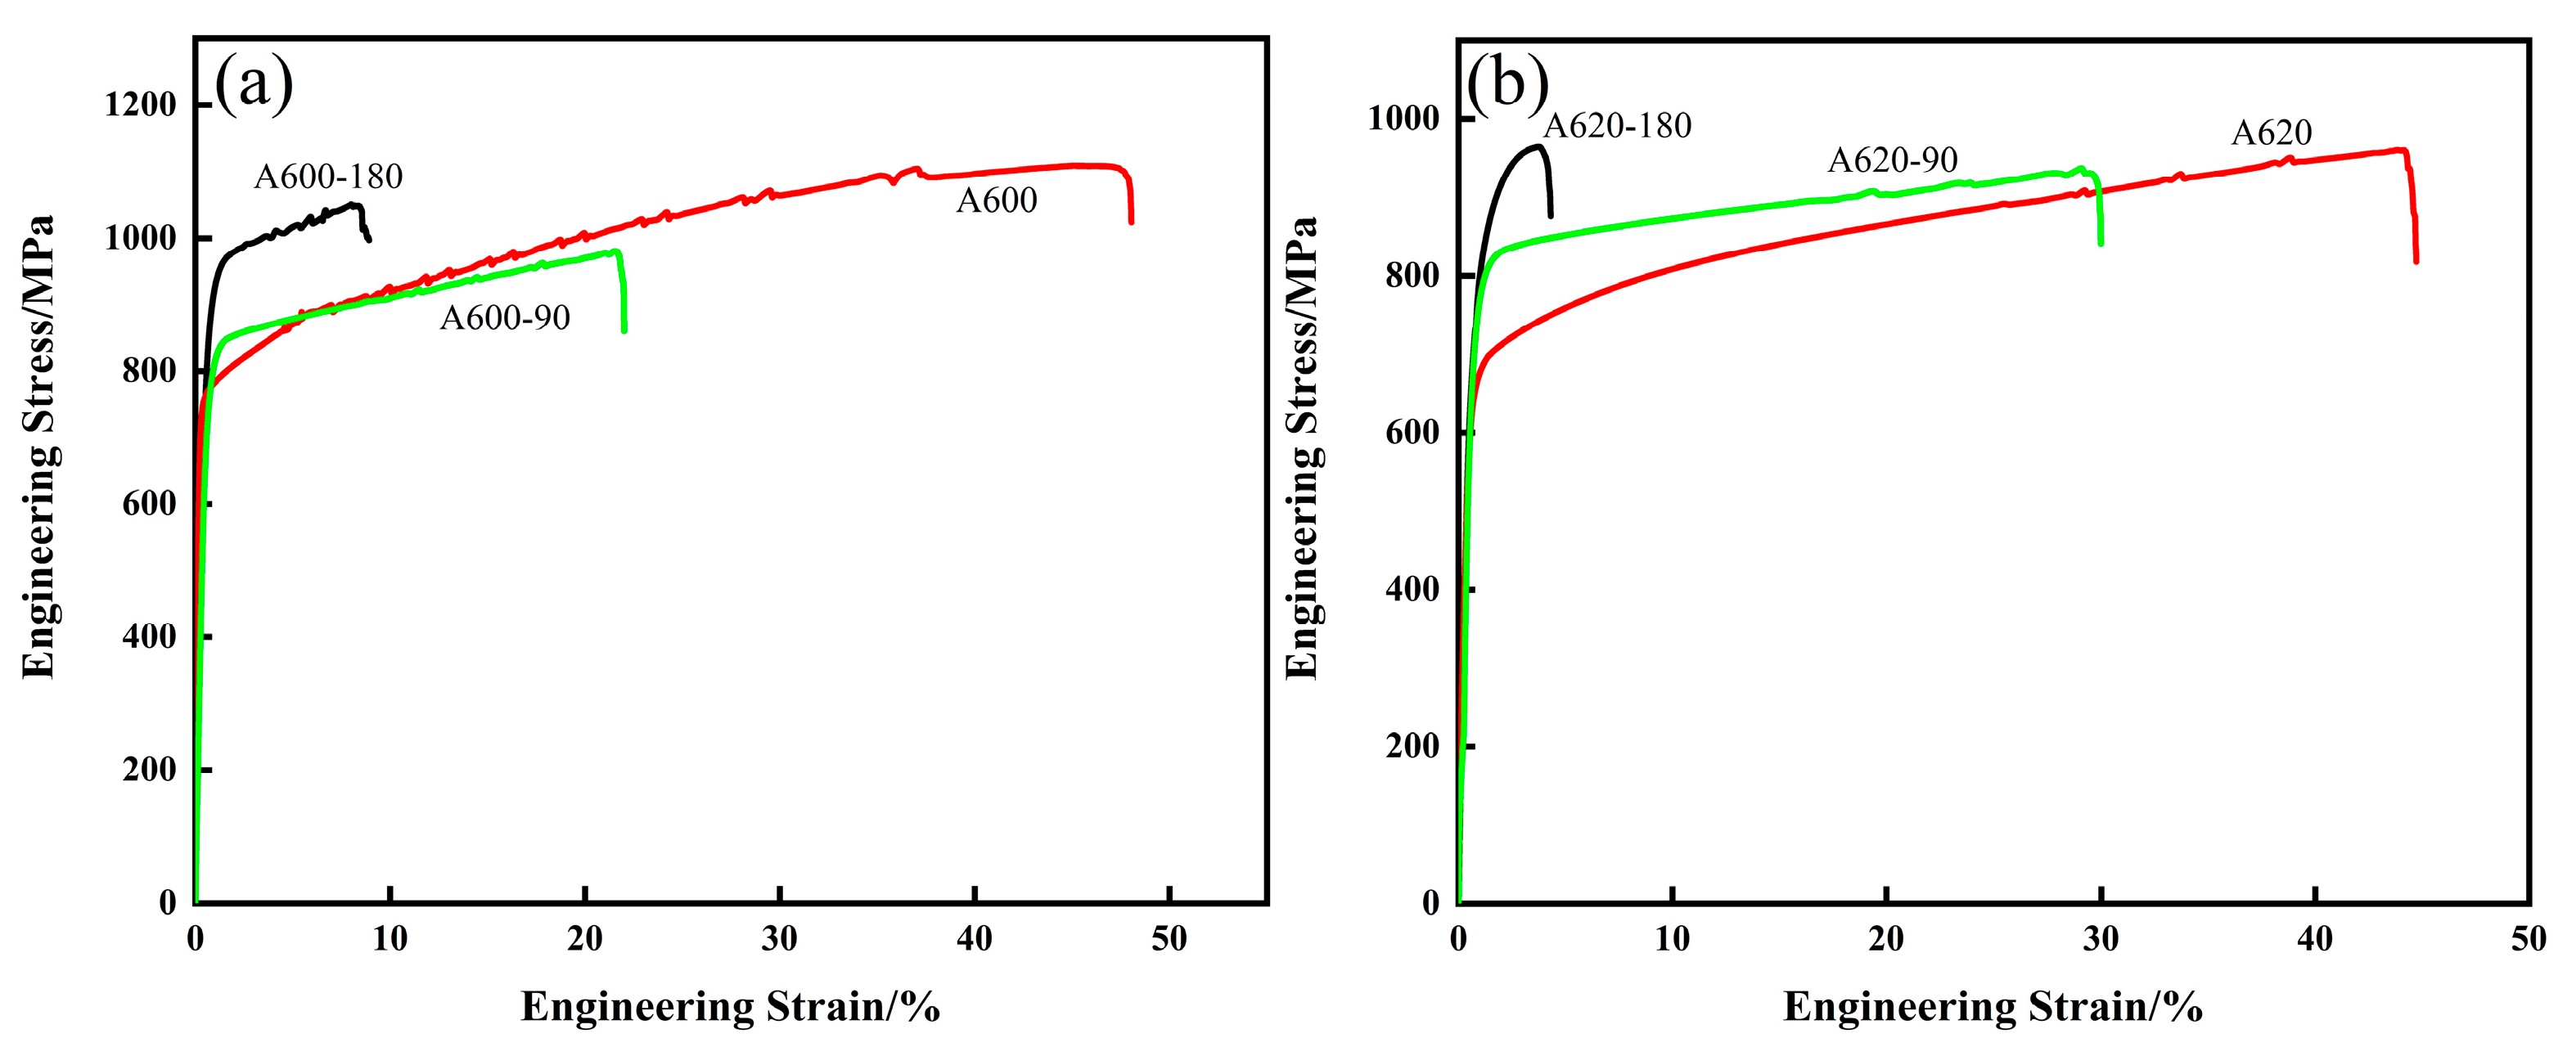
Figure 2 shows the room-temperature tensile stress–strain curves of the experimental steel subjected to different torsion angles following annealing at various temperatures. Figure 2a presents the curves for samples annealed at 600 °C in the non-torsioned, 90° torsioned, and 180° torsioned conditions, while Figure 2b shows the corresponding curves for samples annealed at 620 °C. The corresponding mechanical properties are summarized in Table 1. The post-annealing torsion process significantly influenced the mechanical behavior. Compared to the non-torsioned condition, all torsioned samples exhibited an increase in yield strength (YS). As seen in Figure 2a, after annealing at 600 °C, the YS values for the 90° and 180° torsioned samples reached 834 MPa and 955 MPa, representing increases of 72 MPa and 193 MPa, respectively. However, this strength enhancement was accompanied by a considerable reduction in total elongation (TE). The TE decreased from 47.4% in the non-torsioned condition to 21.6% after 90° torsion and further dropped to 8.4% after 180° torsion. A similar trend was observed for the samples annealed at 620 °C (Figure 2b), where the YS of the 90° and 180° torsioned samples increased to 808 MPa and 919 MPa (increases of 135 MPa and 246 MPa), while the TE decreased from 44.1% to 29.5% and 4.3%, respectively. Due to the severe degradation in ductility observed in the 180° torsioned samples, the present study primarily focuses on the samples subjected to 90° torsion. Zhang et al. [23] investigated the improvement in yield strength by torsion at different angles after annealing at 680 °C. In contrast, this study proposes the effects of two annealing temperatures and subsequent torsion on the mechanical properties of medium-Mn steel. It has been found that the mechanical properties of medium-Mn steel are closely related to the content and stability of austenite. Thermo-Calc simulation results show that the austenite content after annealing at 620 °C is higher than that at 600 °C (Figure 1a). Based on the observation that the Mn content within the austenite grains gradually decreases with increasing annealing temperature, it can be preliminarily inferred that the austenite stability at 620 °C is lower than that at 600 °C (Figure 1b). This correlation will be further verified below using EBSD analysis.
Figure 2.
Tensile curves at room temperature for experimental steels annealed at different temperatures, under 90° twisting, 180° twisting, and untwisted conditions. (a) 600 °C; (b) 620 °C.
Table 1.
Mechanical properties of experimental steels with different twisting angles at various annealing temperatures.
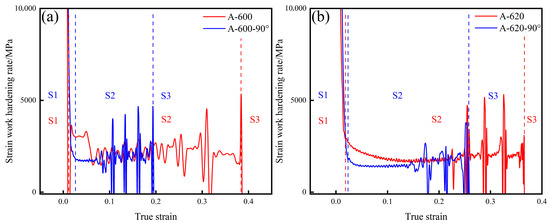
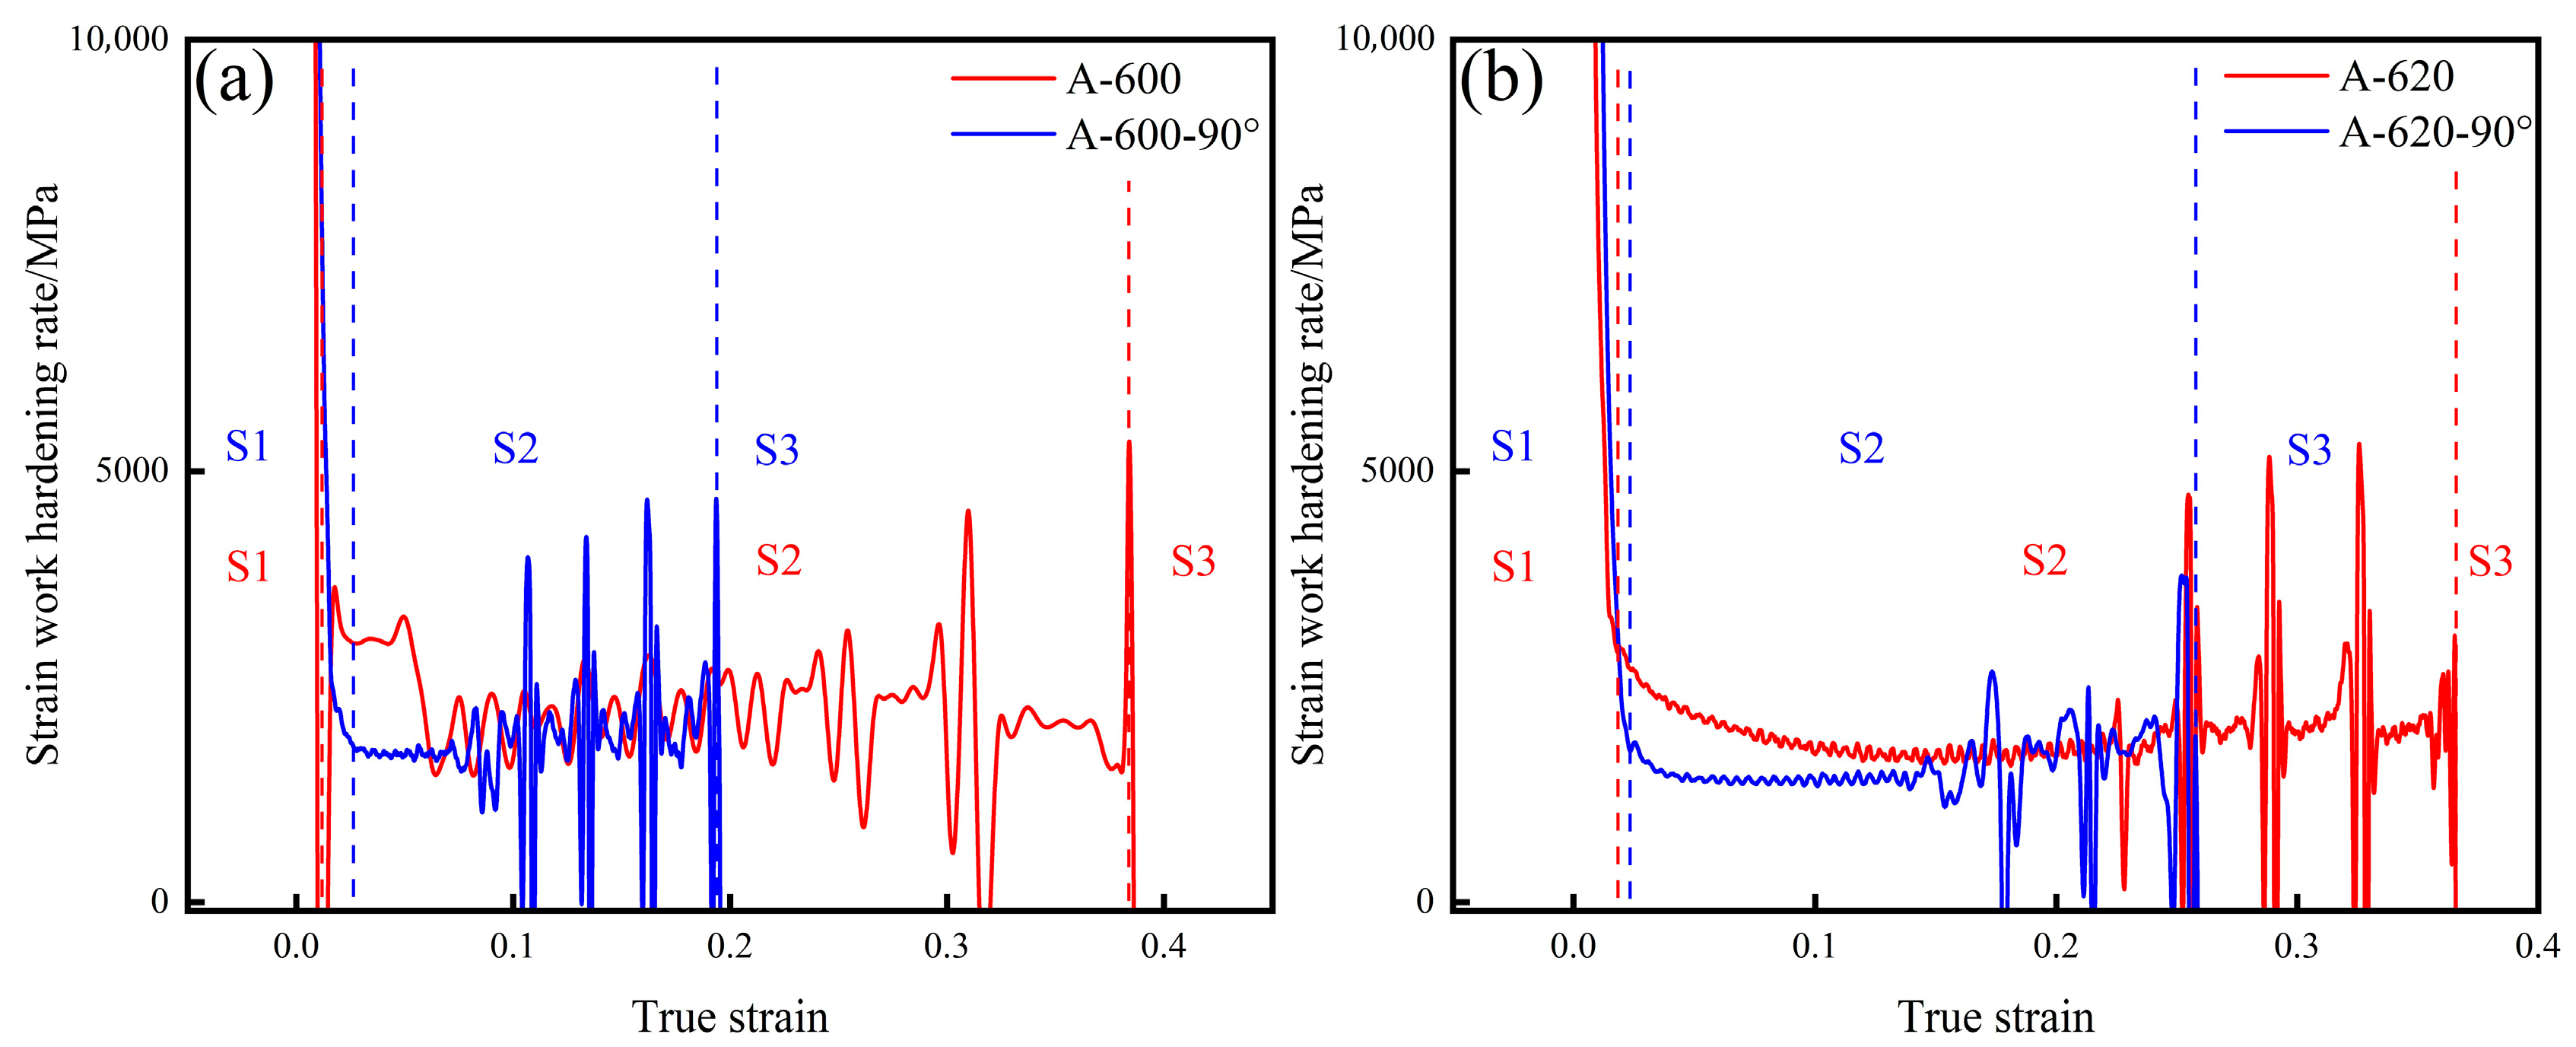
Figure 3 shows the work hardening rate curves of the experimental steel obtained from tensile tests after annealing at different temperatures. The tensile curve can be primarily divided into two stages: the yielding stage, corresponding to elastic deformation, and the tensile stage, corresponding to plastic deformation. The work hardening behavior of the material can be characterized by calculating the instantaneous differential relationship between true strain and true stress. It is well known that the slip and dislocation pile-up induced by tensile stress enhances the material’s strength. In the present experimental steel, the work hardening performance may be influenced by the TRIP effect and other strengthening mechanisms. In stage S1, the work hardening rate curve exhibits a rapid decline, with its endpoint corresponding to the upper yield point of the elastic stage or the initiation of Lüders bands. In stage S2, the curve shows a rapid initial increase, followed by either pronounced fluctuations or a gradual decrease across the yield plateau; its endpoint corresponds to the lower yield point or the termination of Lüders bands. Subsequently, the work hardening rate curve declines steadily until the onset of necking. In stage S3, the curve decreases rapidly until the final fracture or the end of necking. The behavior observed in the S2 stage, as shown in Figure 3, is critical, as a stable S2 stage is key to determining the final ductility of the material and indirectly governs its overall mechanical performance.
Figure 3.
Work hardening curves of experimental steels annealed at different temperatures under 90° twisting and untwisted conditions. (a) 600 °C; (b) 620 °C.
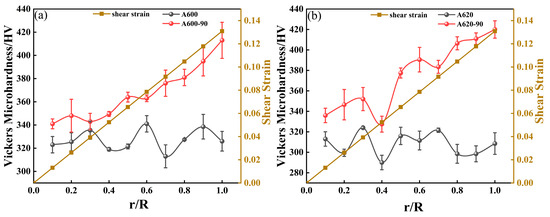
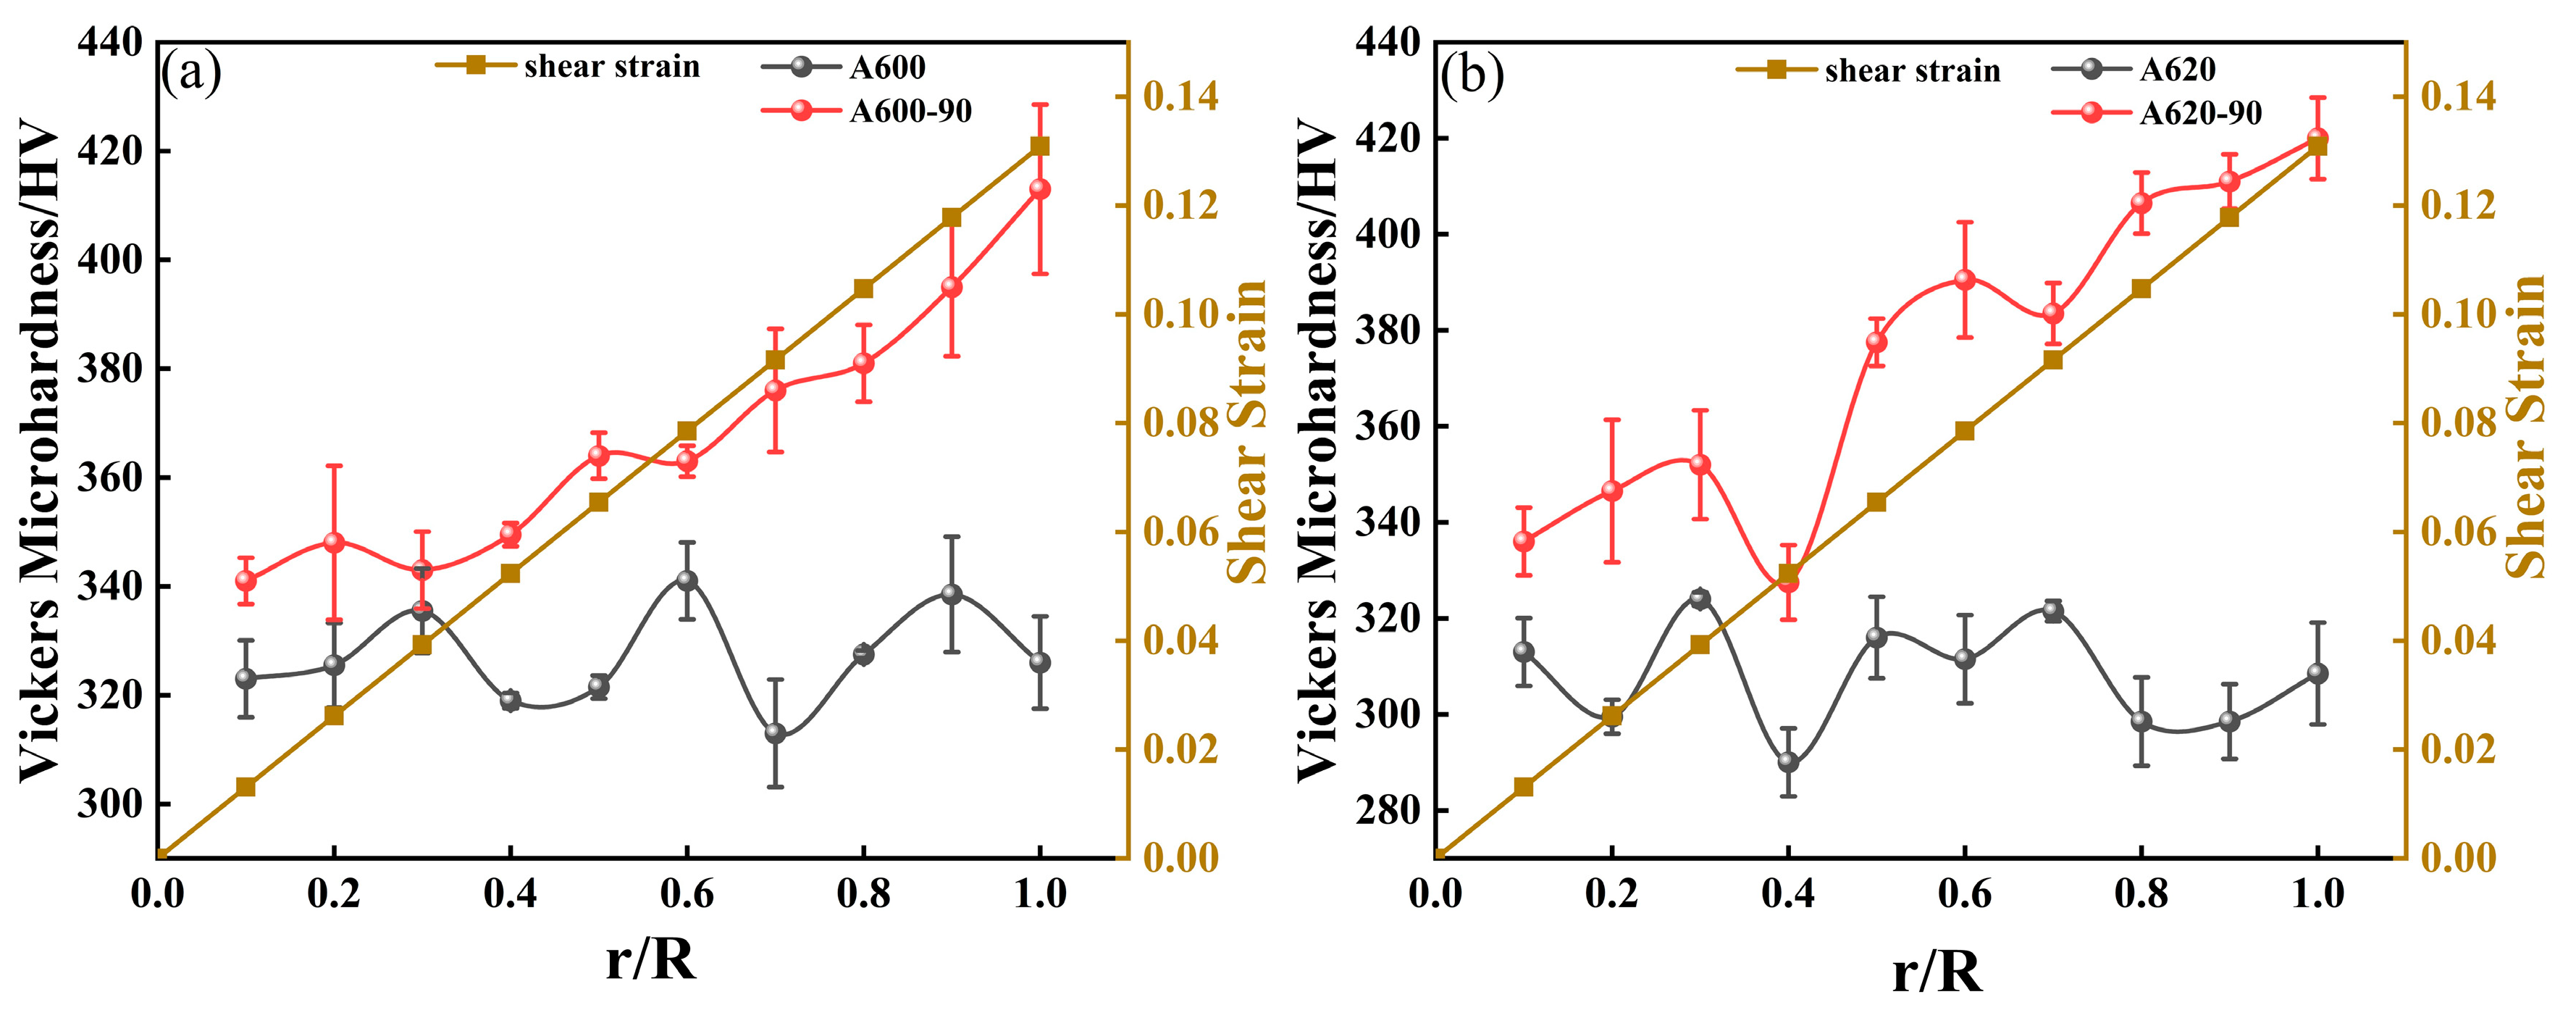
Figure 4 shows the radial distribution of Vickers microhardness in the experimental steel subjected to 90° torsion and in the non-torsioned condition, both after annealing at different temperatures. In the non-torsioned samples, the hardness remains nearly constant across the radial direction due to the relatively uniform microstructure. However, after 90° torsion, the hardness exhibits a distinct gradient, increasing progressively from the center to the edge. This gradient is attributed to microstructural rearrangement induced by shear strain. The variation in hardness strongly correlates with the phase distribution. The increasing gradient in hardness corresponds to a rise in martensite content along the radial direction, while the austenite content decreases correspondingly. As a result, the edge region, characterized by higher martensite and lower austenite fractions, shows significantly higher hardness than the center. Furthermore, the torsioned samples generally exhibit higher microhardness than the non-torsioned ones, which is consistent with the improved yield strength, indicating that torsional deformation enhances the overall mechanical properties.
Figure 4.
Relationship between radial Vickers microhardness and radius for experimental steels at different annealing temperatures, under 90° twisting and untwisted conditions. (a) 600 °C; (b) 620 °C.
The shear strain as a function of radial position after torsion can be calculated using Equation (1):
- γ(r)-Shear Strain;
- R-The current radius;
- A-Angle of Pre-torsion;
- L-Gauge Length of the Specimen
3.2. Microstructural Characterization
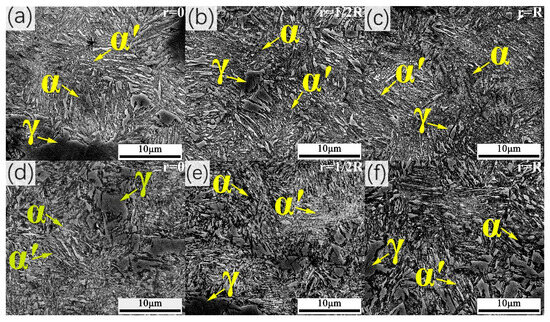
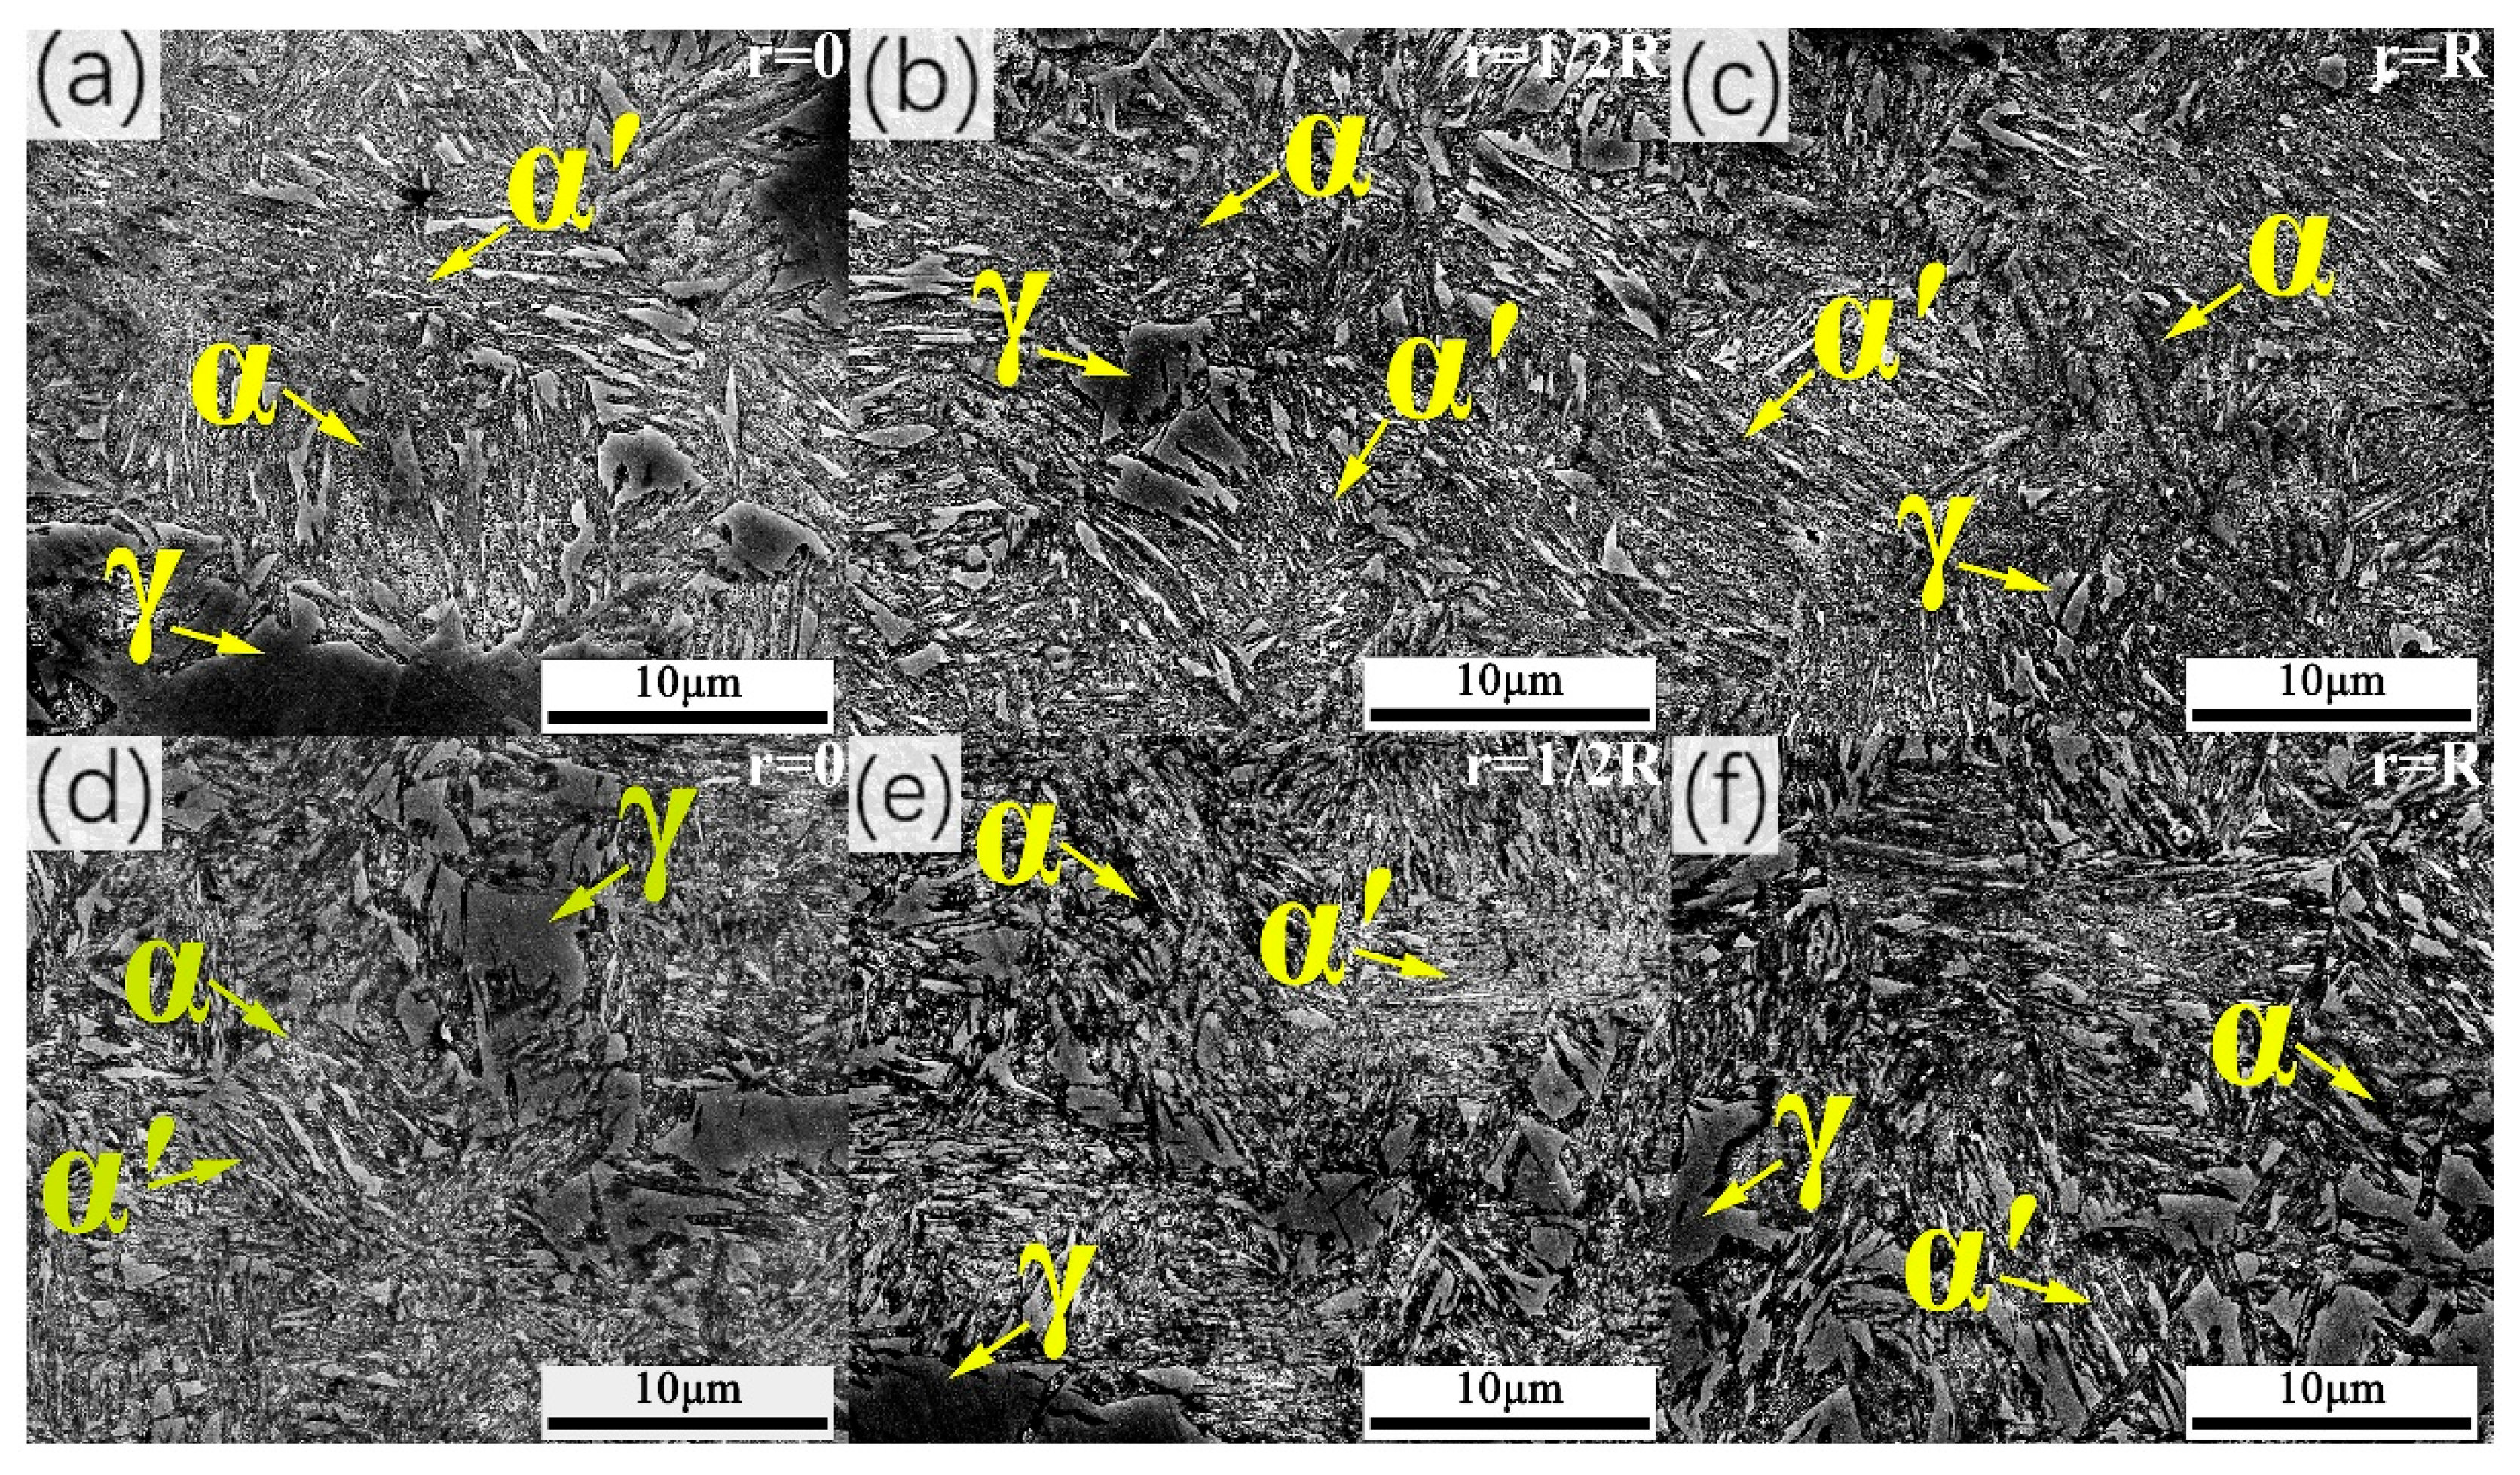
Figure 5 presents the SEM images of the experimental steel torsionally deformed to 90° after annealing at 600 °C and 620 °C. The torsional treatment induced severe deformation in the internal structure. The room-temperature microstructure consists primarily of austenite, martensite, and ferrite. Austenite appears as recessed grey grains, ferrite as protruding grey grains, and martensite as dark, irregularly shaped blocks. Under the influence of shear stress, the grains underwent morphological changes along the direction of increasing shear strain—from the center towards the edge of the specimen—progressively elongating into a lath-like shape. This morphological evolution is a direct result of grain reorientation and deformation under shear stress. In the edge region, most grains exhibit elongated lath morphologies due to the higher shear stress, which leads to greater plastic deformation and strain rate. This environment promotes extensive martensitic transformation. Shear strain plays a critical role in facilitating the transformation of blocky austenite into lath martensite, resulting in the observed elongated lath-shaped grains. Towards the center, the shear stress gradually decreases, and blocky austenite becomes more prevalent, as shown in Figure 5. The shear strain diminishes radially, resulting in minimal to no plastic deformation in the central region, where the microstructure remains unaffected mainly by torsion.
Figure 5.
SEM images of specimens after 90° torsion following annealing at 600 °C and 620 °C. (a–c) 600 °C; (d–f) 620 °C; (a,d) r = 0; (b,e) r = 1/2R; (c,f) r = R.
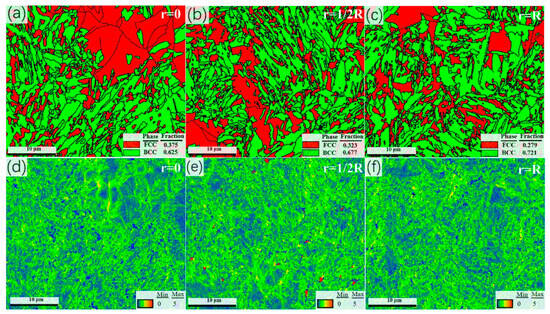
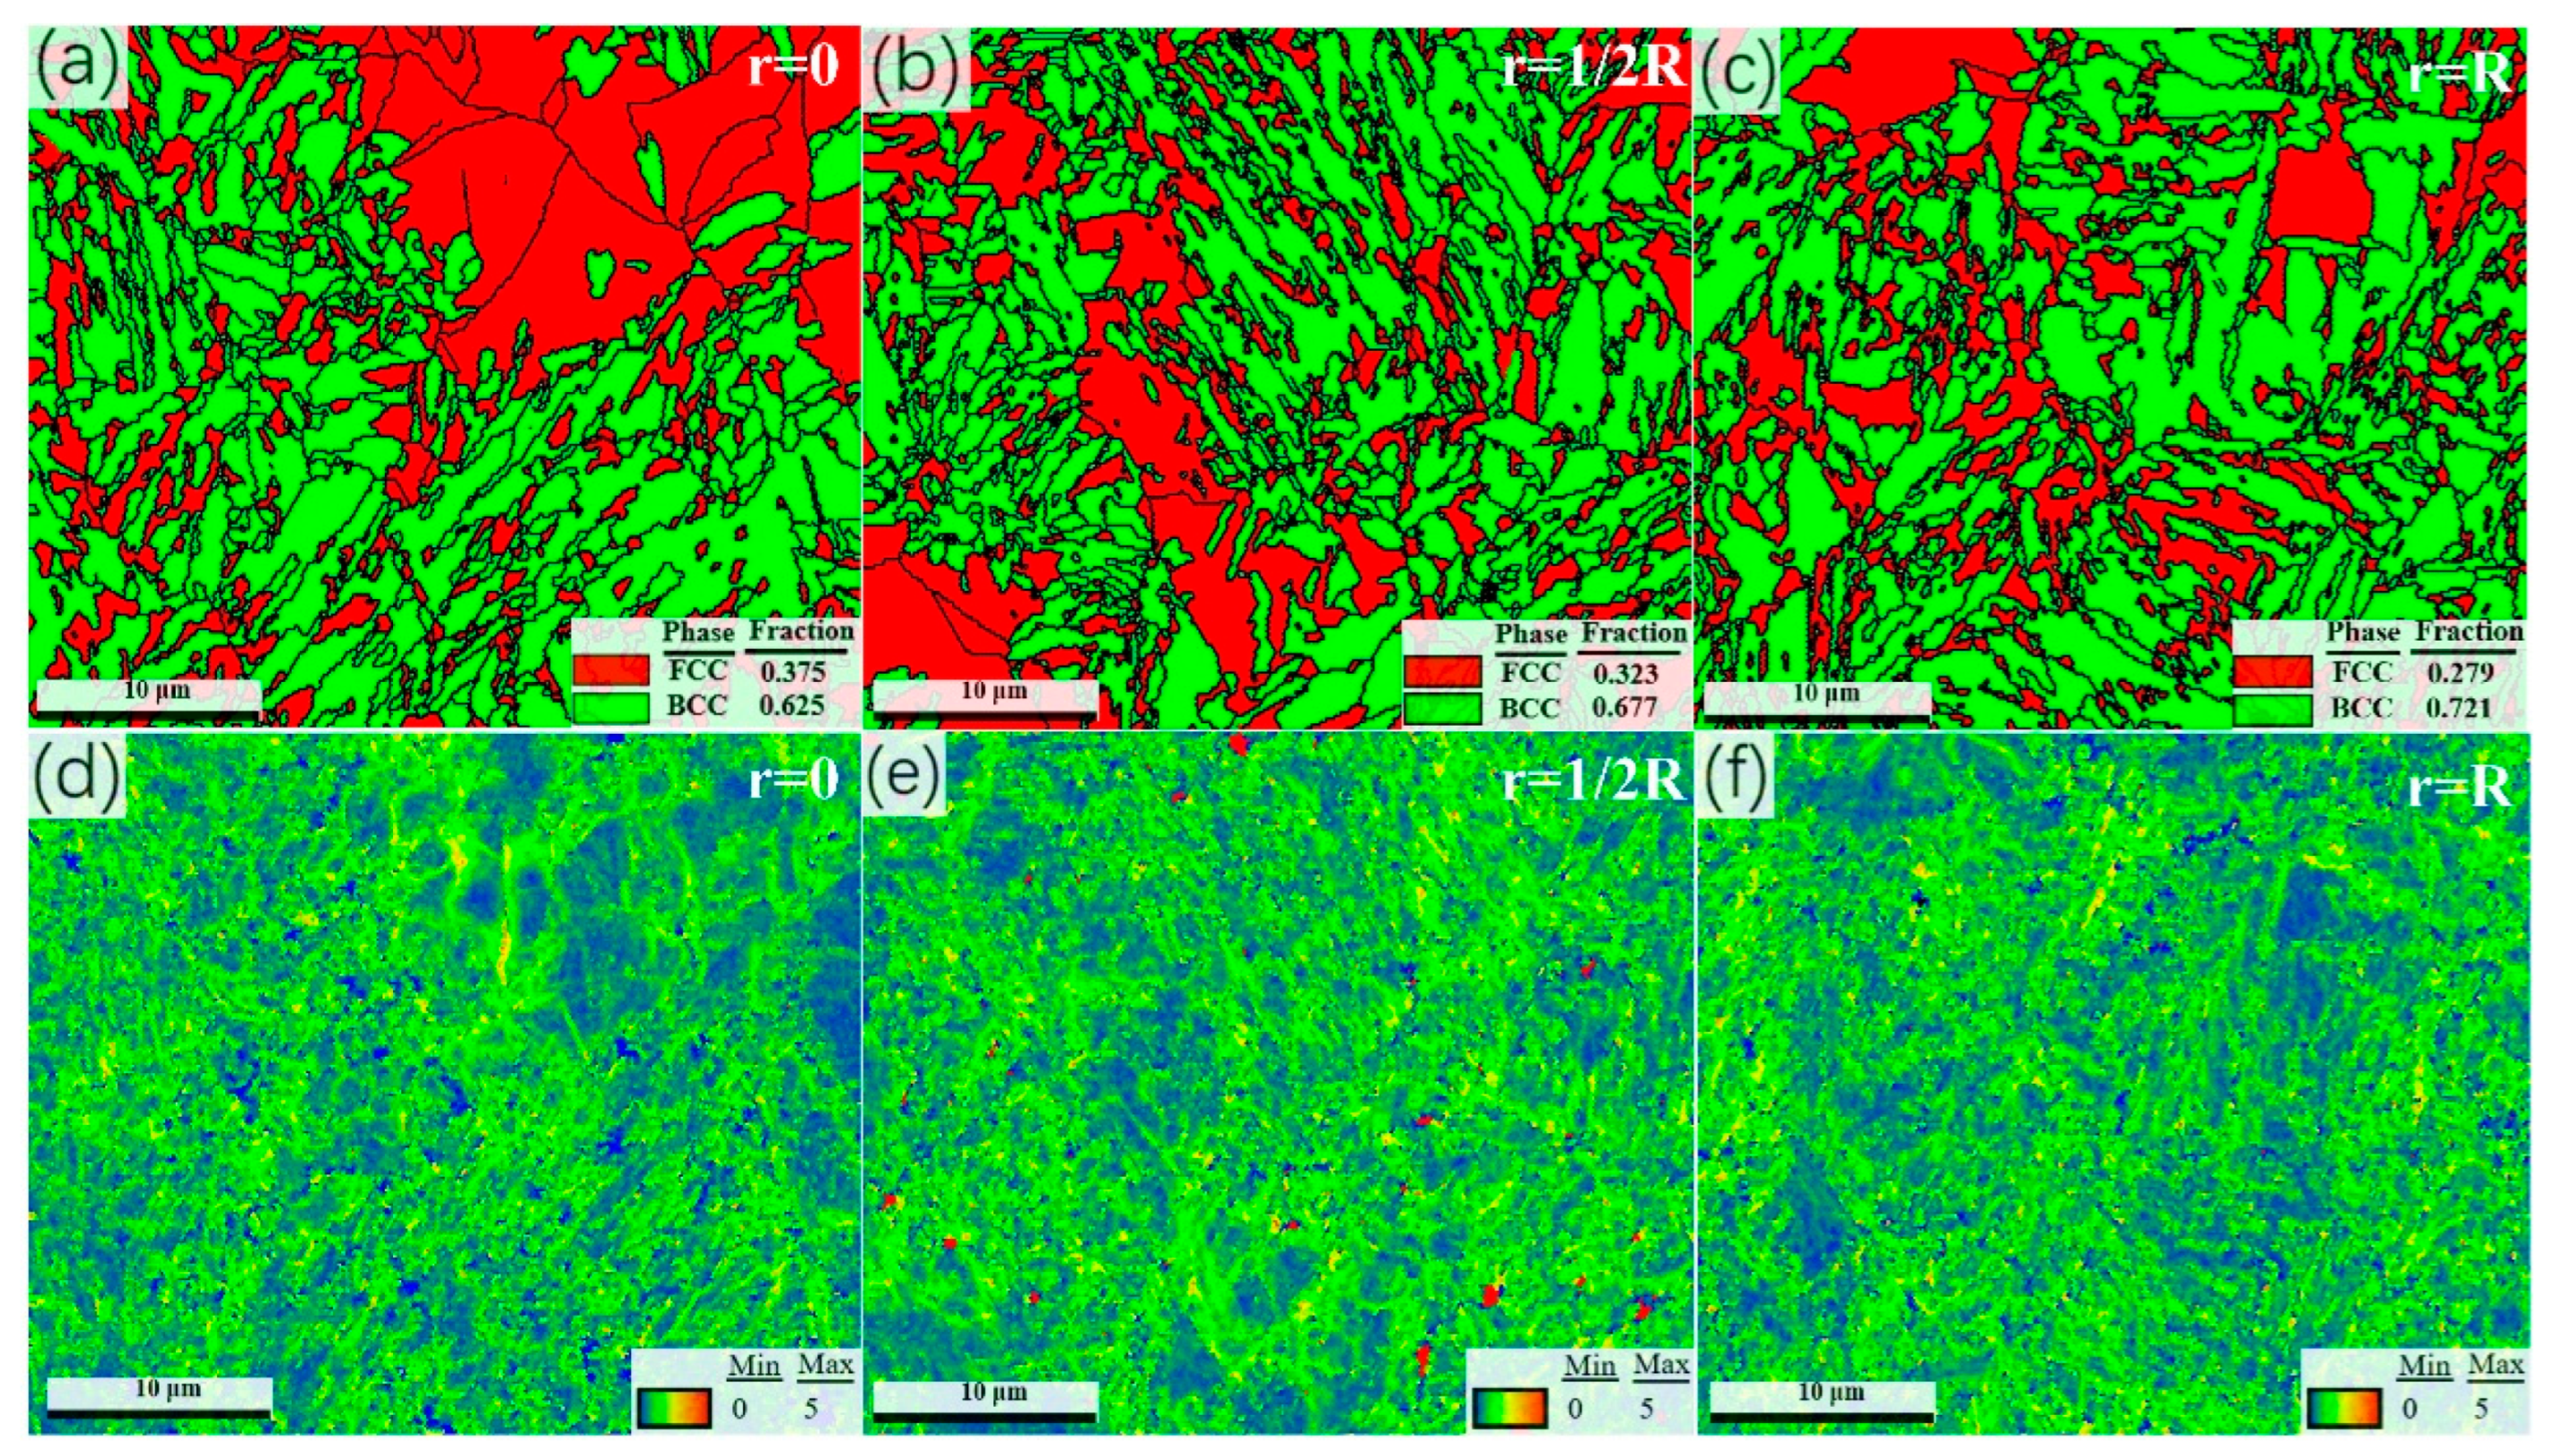
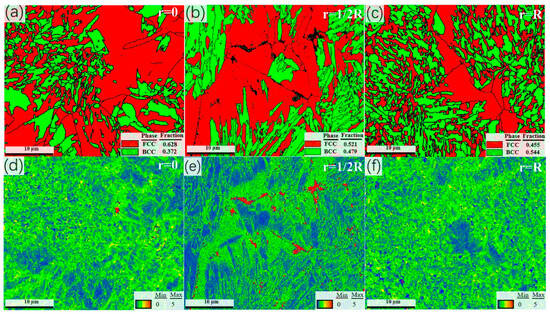
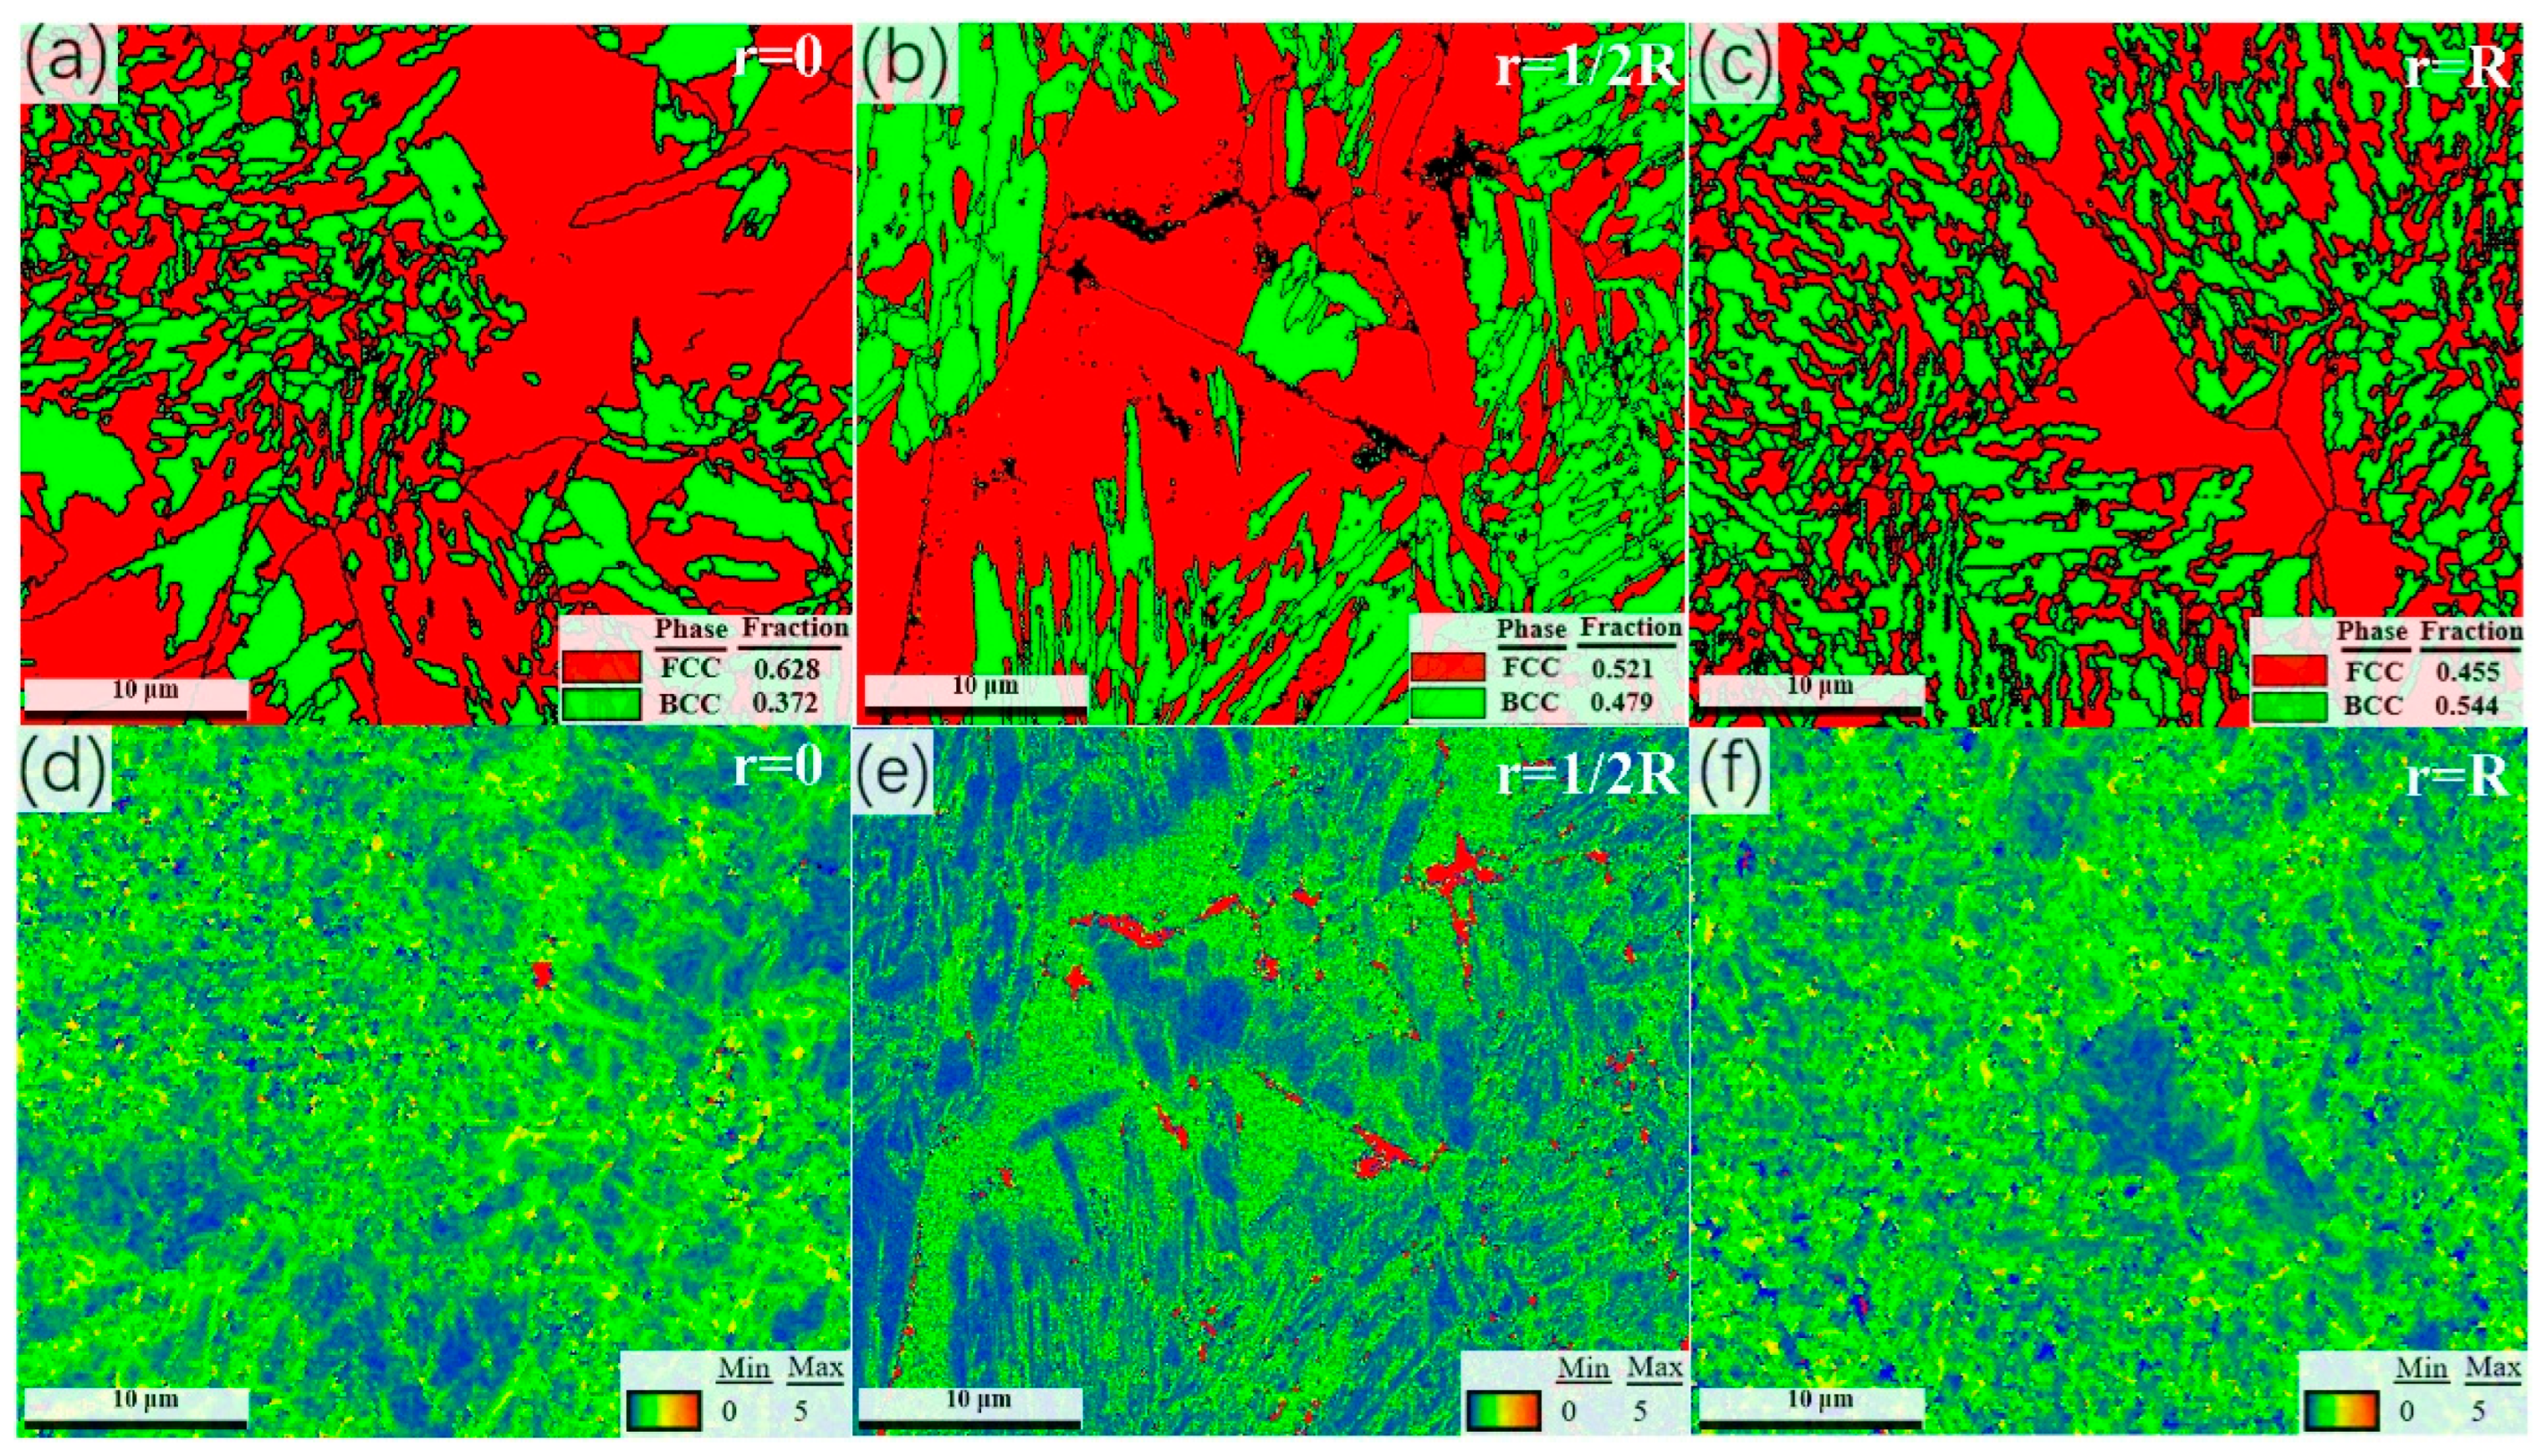
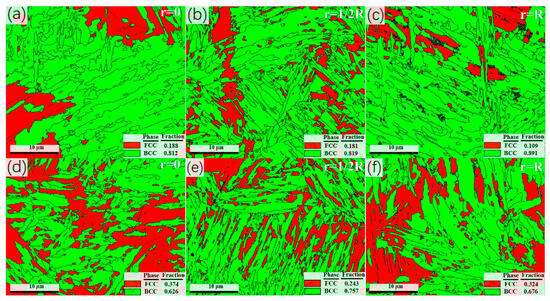
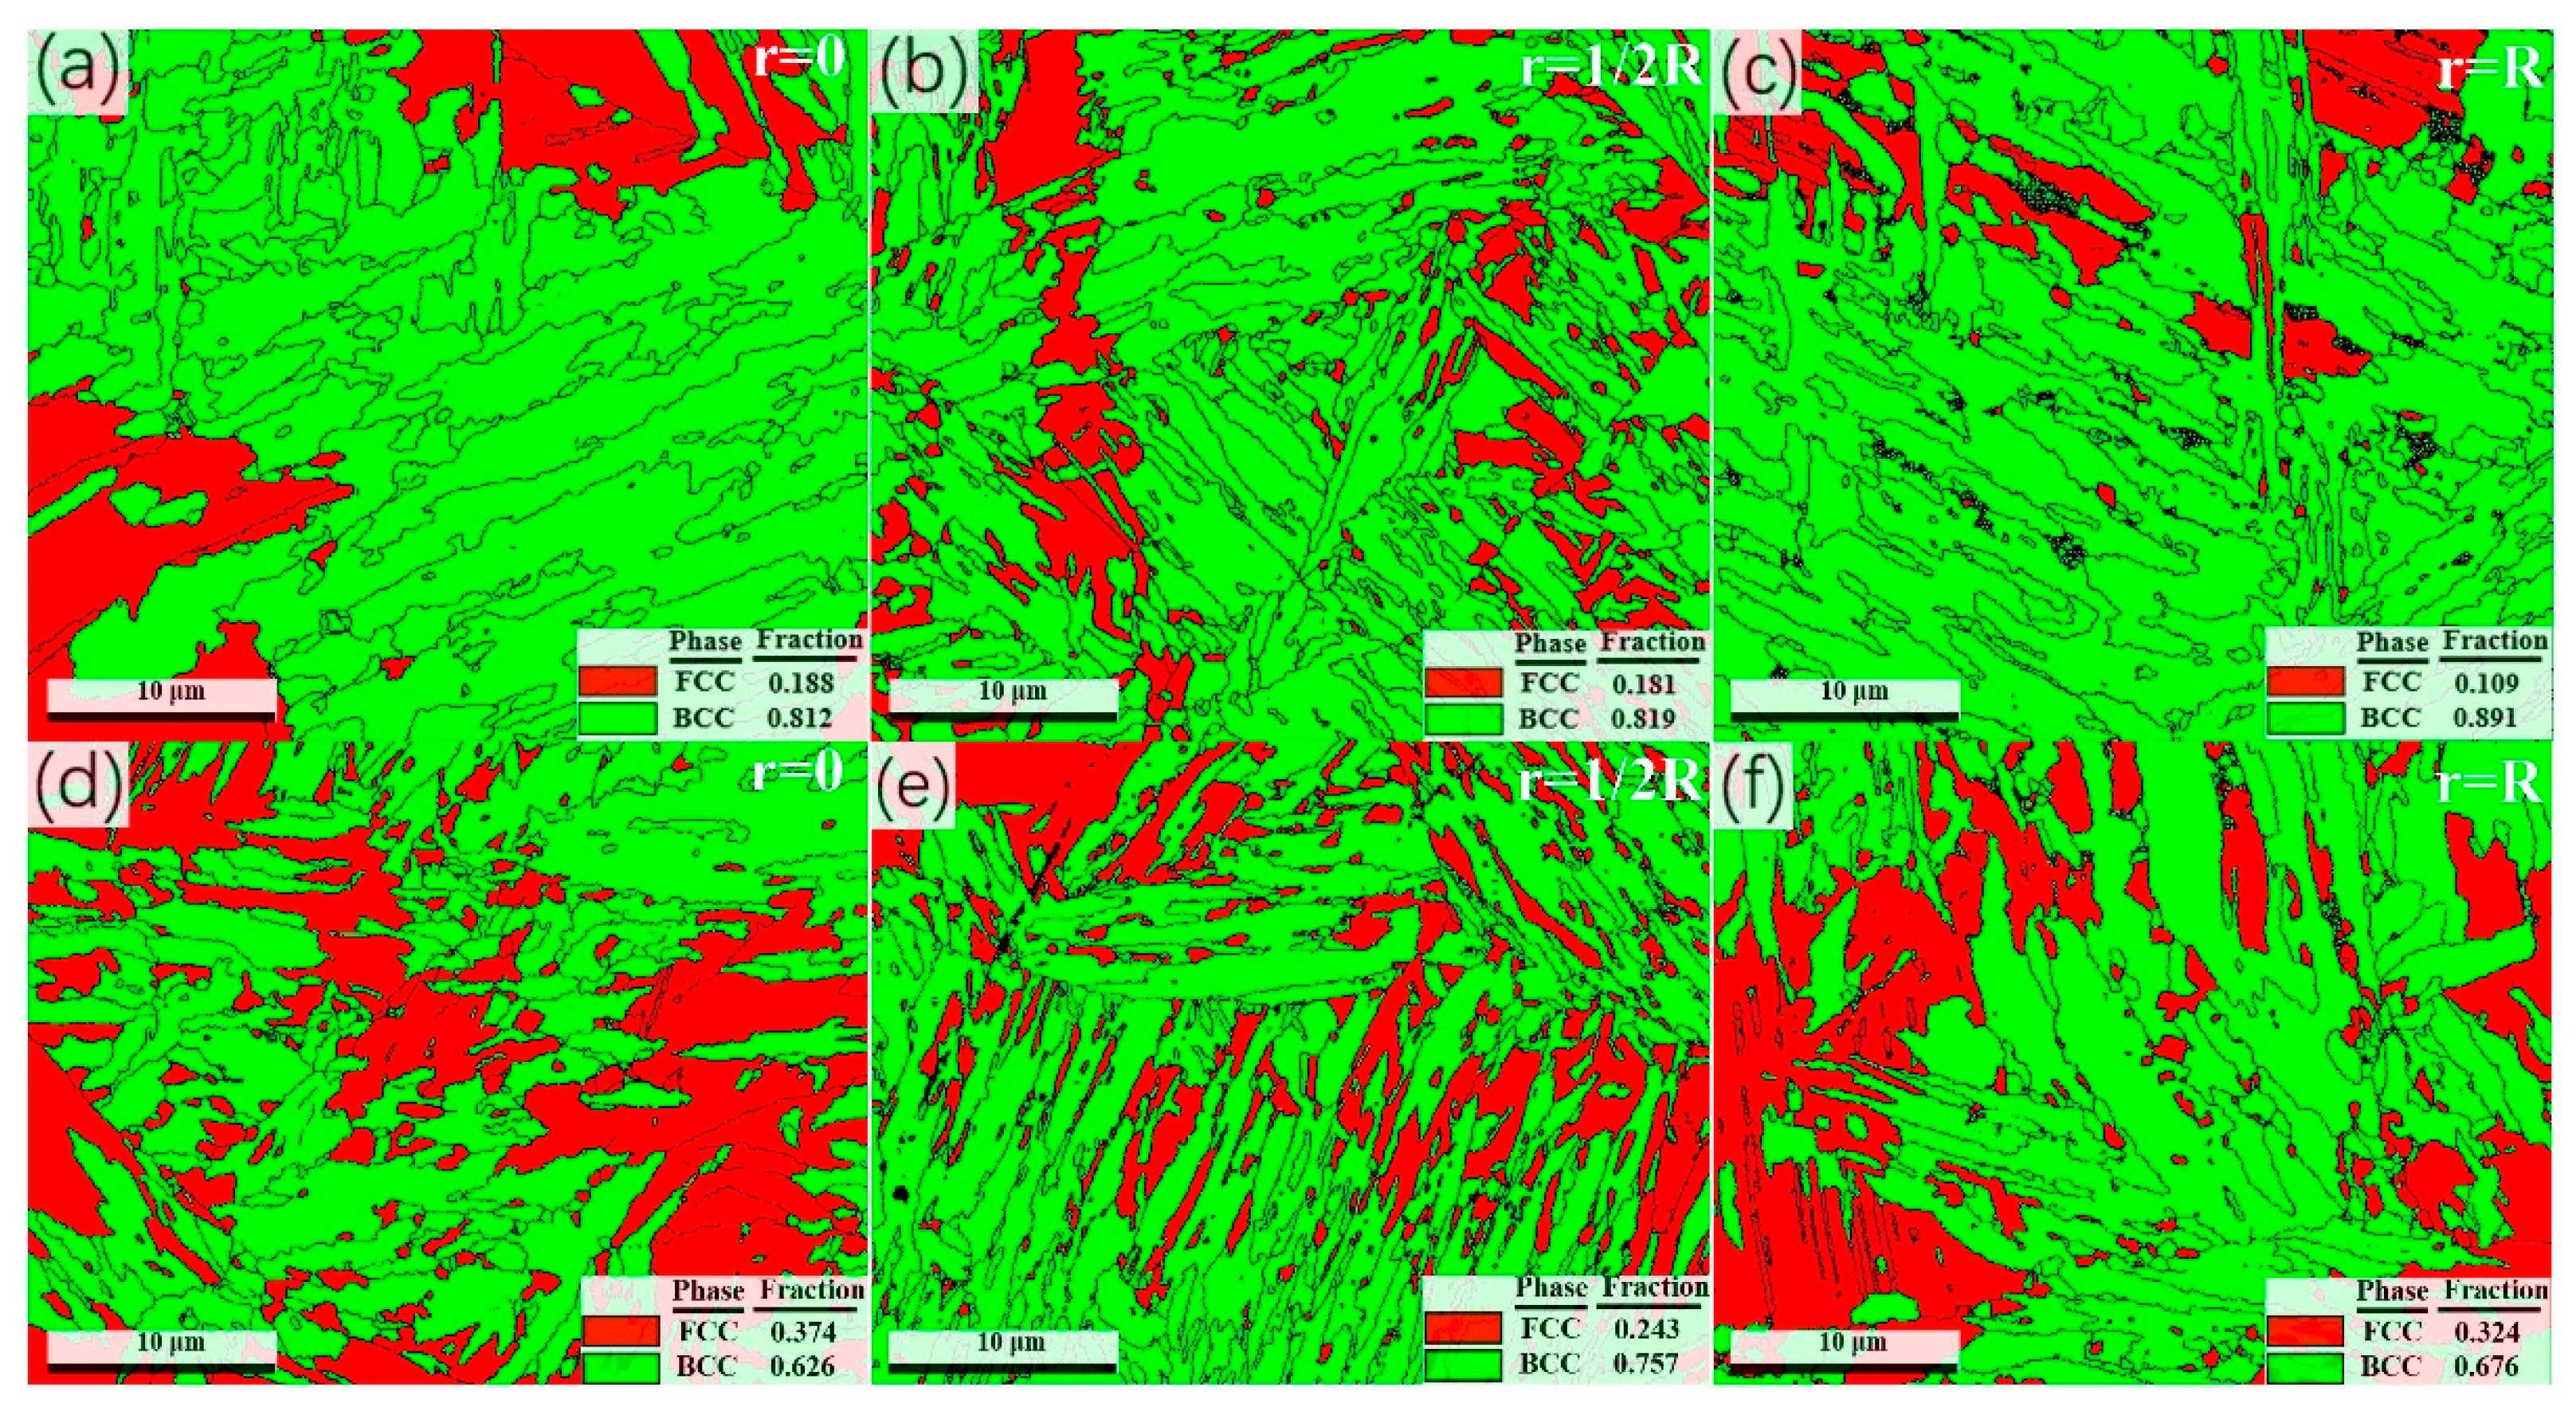
Figure 6 and Figure 7 show the EBSD phase maps and Kernel Average Misorientation (KAM) maps of the experimental steel annealed at 600 °C and 620 °C, followed by 90° torsion. As seen in Figure 6a and Figure 7a, the volume fraction of retained austenite increases gradually along the radial direction with decreasing shear stress and strain, forming a gradient distribution of austenite. The austenite contents are 37.5% and 62.8% at the center for the two annealing conditions, respectively. Figure 6b and Figure 7b reveal a noticeable increase in austenite content from the edge to the center as shear strain decreases. At the half-radius position, the austenite fractions are 32.3% and 52.1%, significantly higher than those at the edge. This indicates greater austenite stability in regions with lower shear strain, where reduced stress concentration helps retain the austenitic phase. In contrast, Figure 6c and Figure 7c show that the high shear stress and strain rate at the edge promote the transformation of most austenite into martensite, resulting in austenite contents of only 27.9% and 45.5%, respectively. The KAM values derived from the KAM maps (Figure 6d–f and Figure 7d–f) can be used for the subsequent calculation of GND (Geometrically Necessary Dislocations) density. As shown in Figure 6a–c and Figure 7a–c, the sample annealed at 620 °C exhibits a higher austenite phase fraction compared to that annealed at 600 °C. The mechanical properties of the samples are jointly determined by the austenite content and the influence of intragranular elements on austenite stability (Figure 1b) [12]. Since the austenite stability in sample A600-90 is higher than that in A620-90, the TRIP effect is less likely to occur in A600-90. Furthermore, its lower austenite content compared to A620-90 provides additional evidence for the suppressed TRIP effect. Consequently, sample A620-90 exhibits superior mechanical properties to A600-90. Subsequently, EBSD analysis was performed on the fractured tensile samples. The measured volume fraction of transformed austenite provides direct confirmation of the occurrence of the TRIP effect.
Figure 6.
EBSD phase maps and KAM maps of different positions after 90° torsion following annealing at 600 °C. (a,d) r = 0; (b,e) r = 1/2R; (c,f) r = R.
Figure 7.
EBSD phase maps and KAM maps of different positions after 90° torsion following annealing at 620 °C. (a,d) r = 0; (b,e) r = 1/2R; (c,f) r = R.
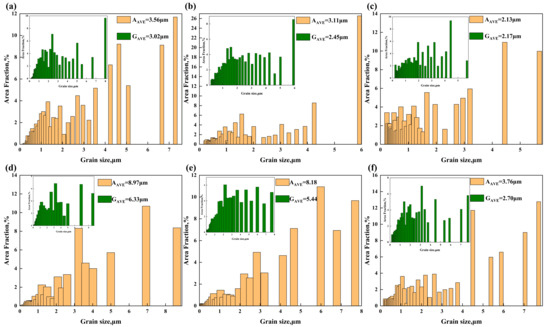
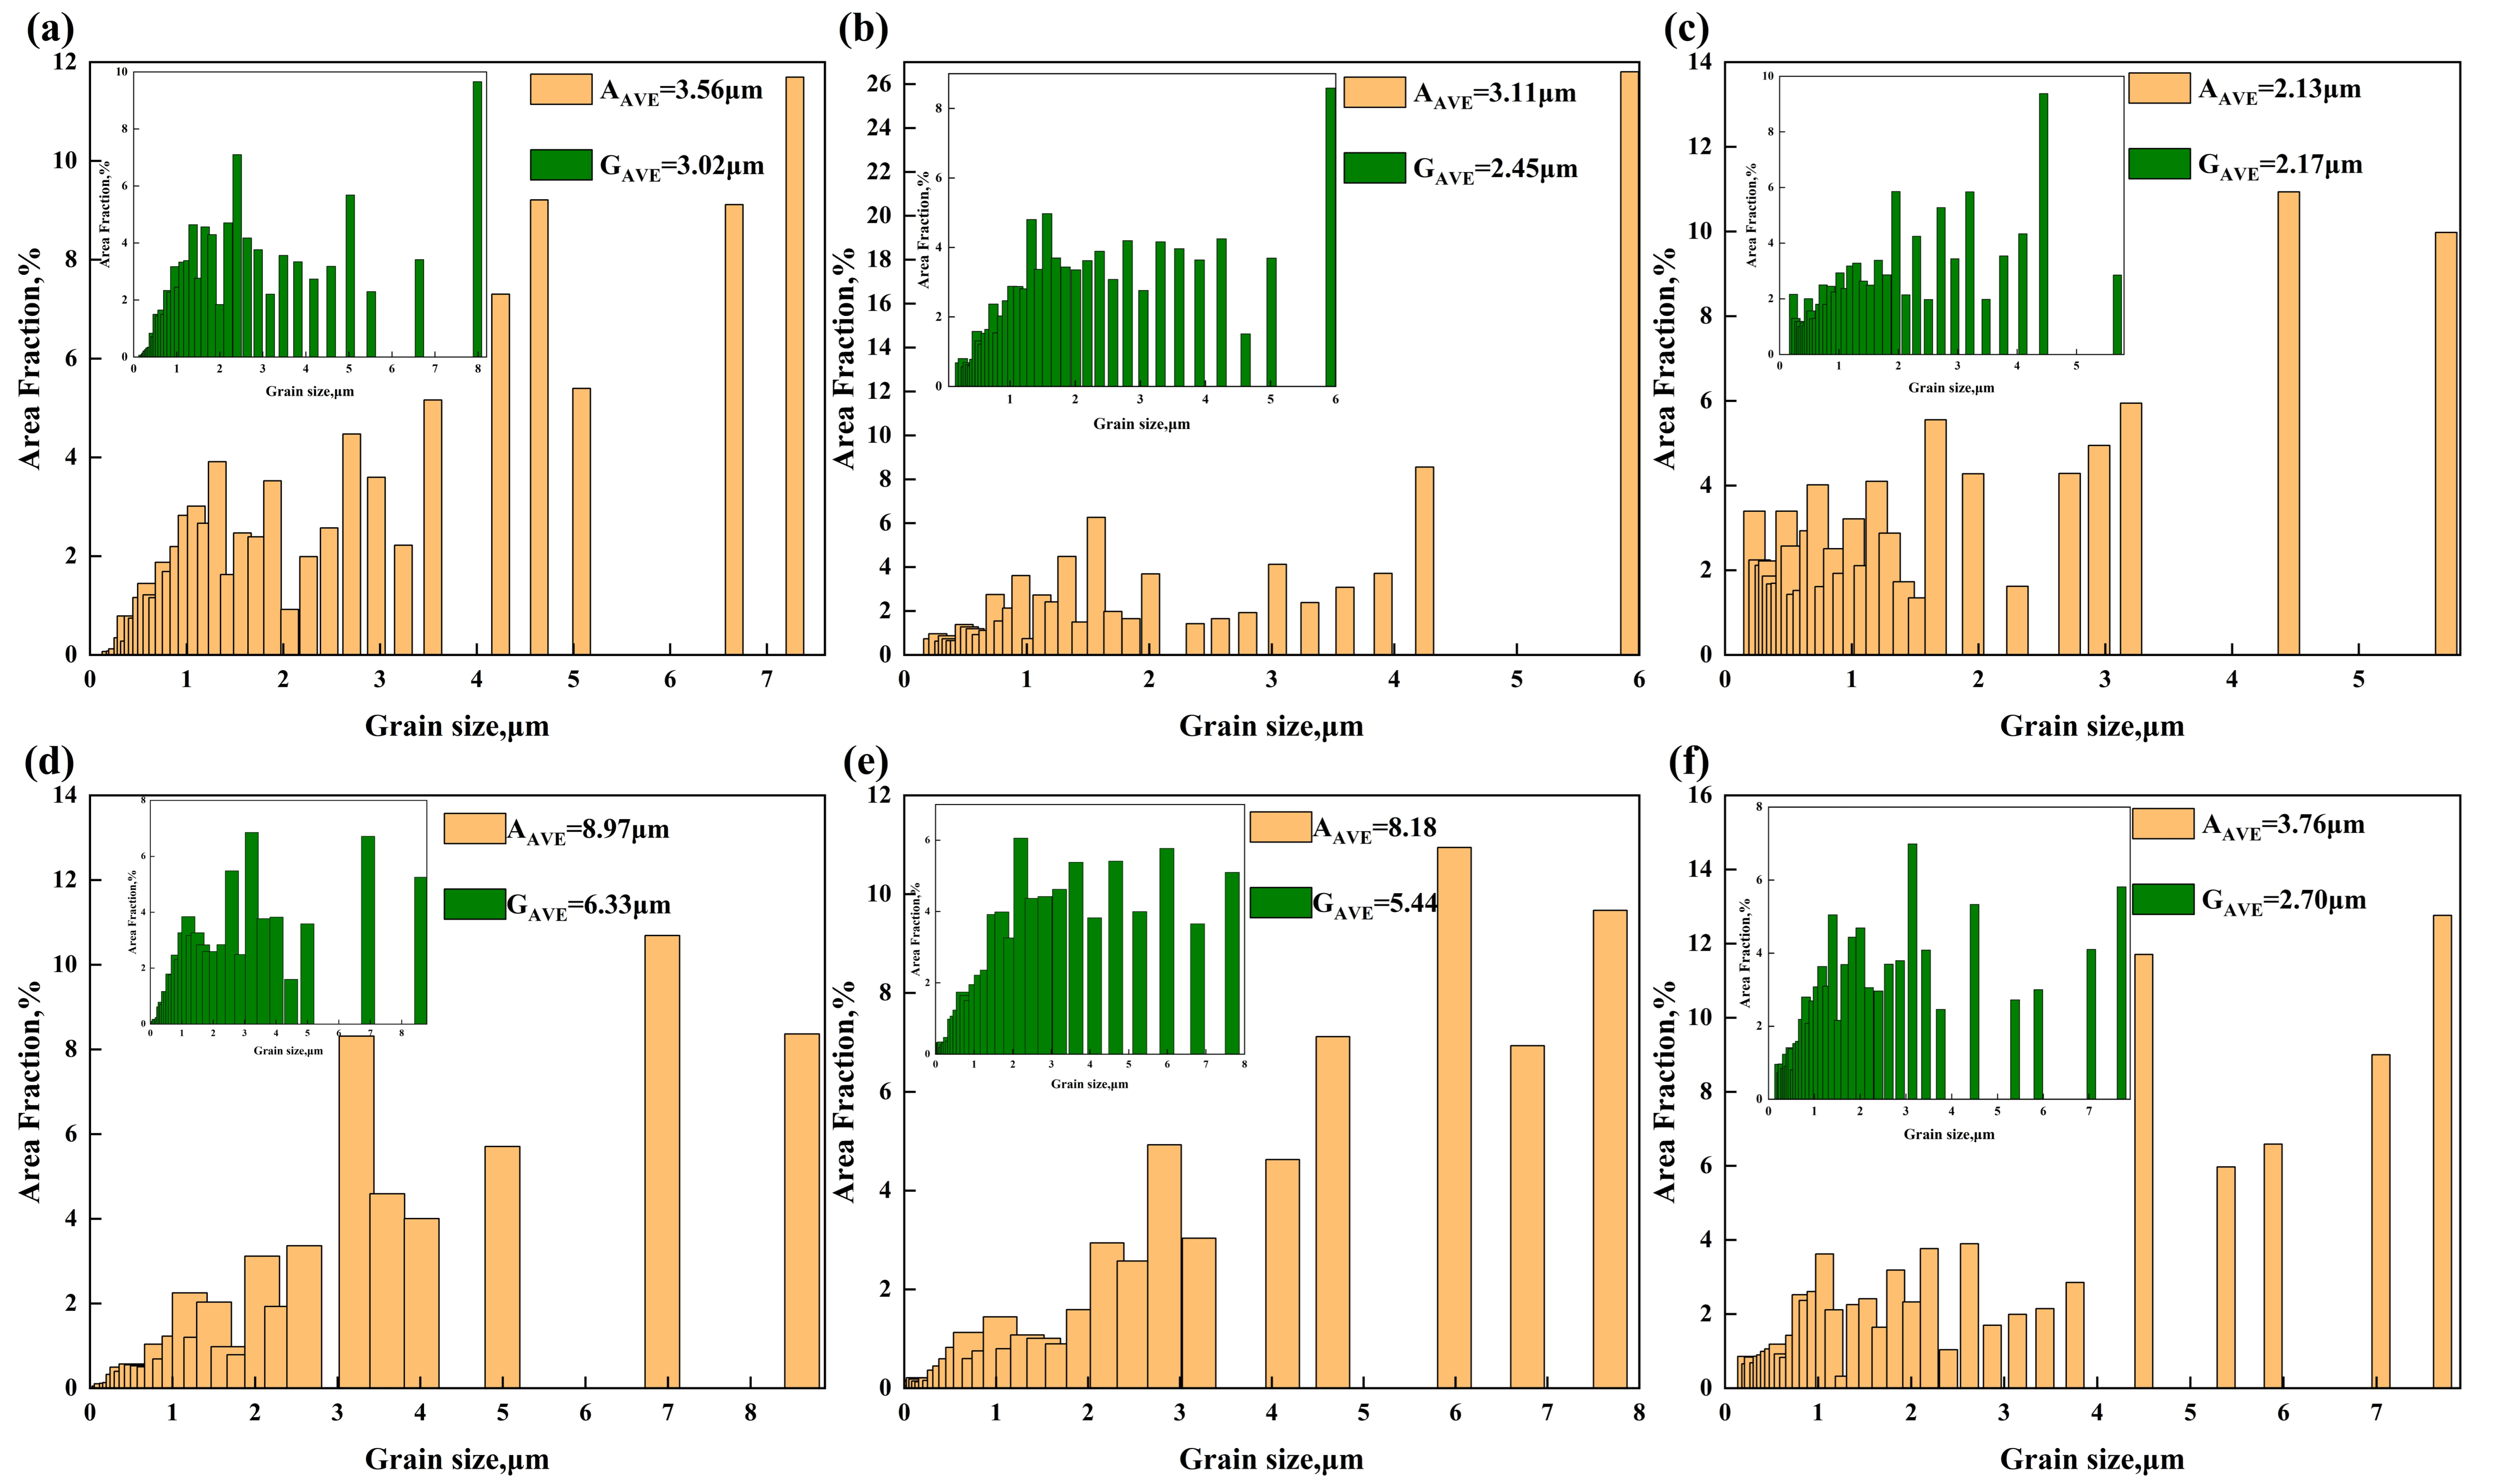
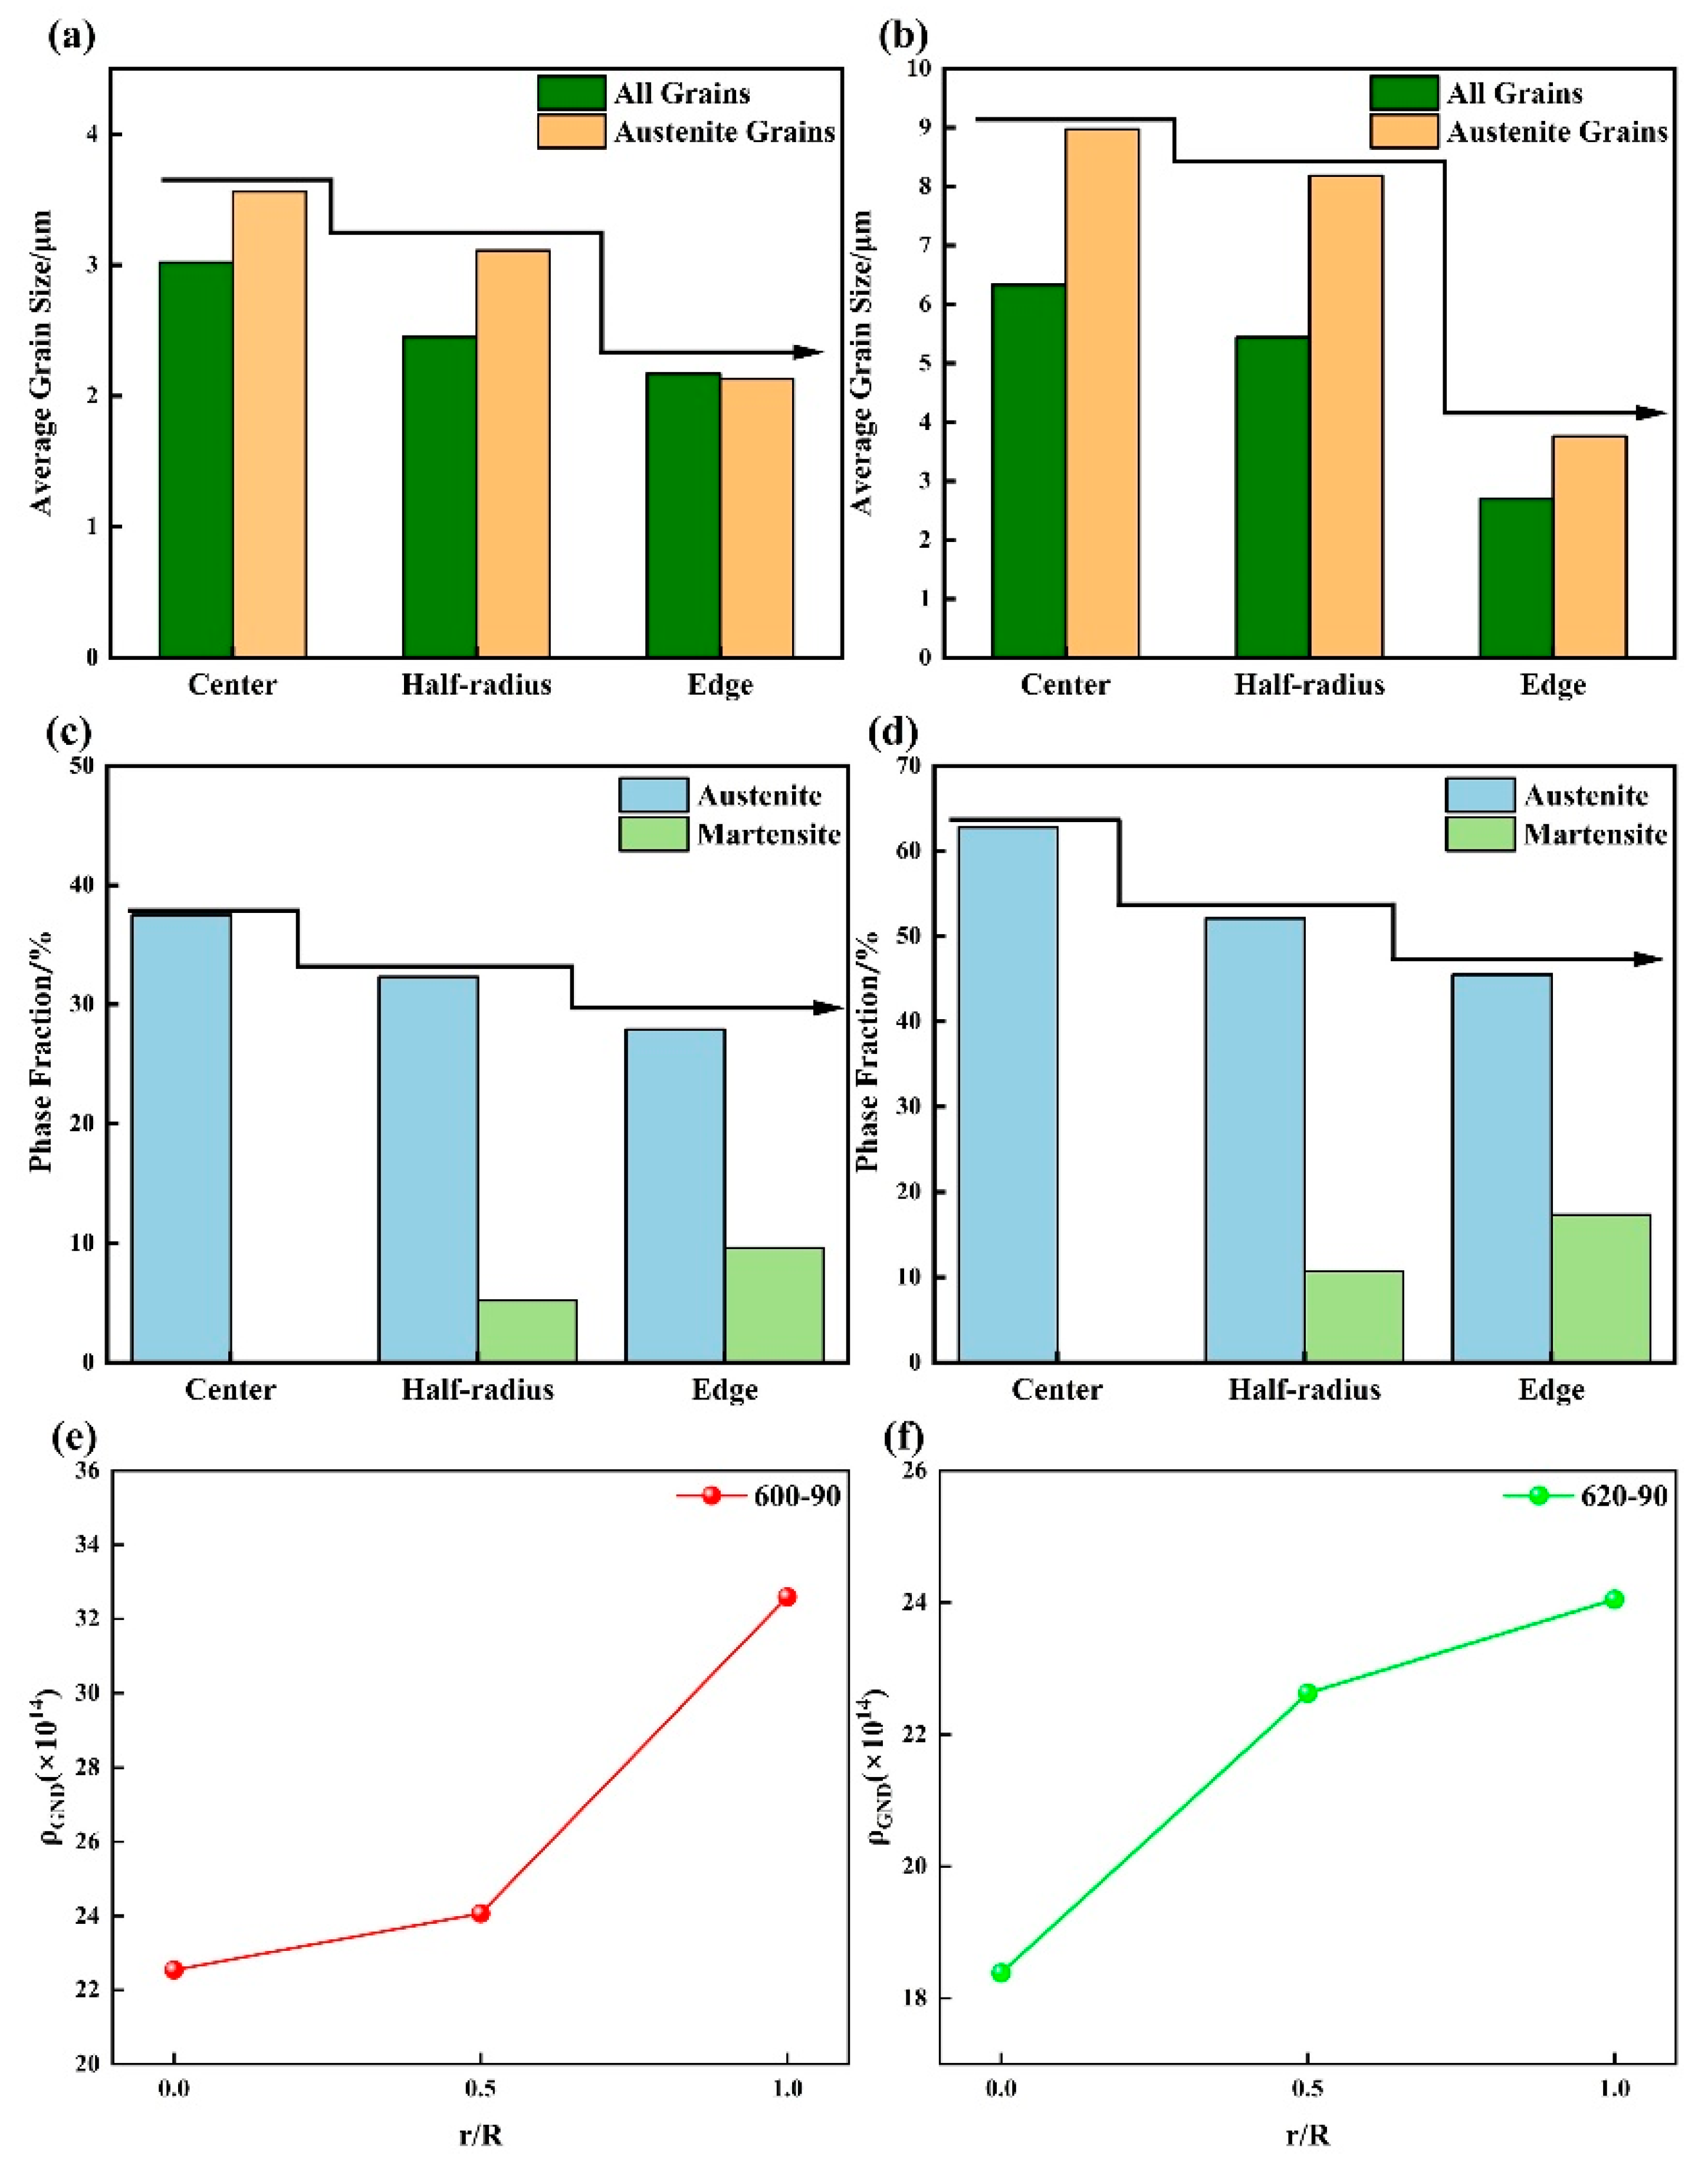
Figure 8a–c displays the overall and austenite grain size distributions at different radial positions (r = 0, r = 1/2R, r = R) for the specimen annealed at 600 °C and torsioned to 90°. At the center (r = 0, Figure 8a), the overall and austenite average grain sizes are 3.02 μm and 3.56 μm, respectively. At the half-radius (r = 1/2R, Figure 8b), the overall average grain size is 2.45 μm, while the austenite average size increases to 3.11 μm. At the edge (r = R, Figure 8c), significant grain refinement is observed: the overall average grain size is 2.17 μm, and the austenite average size is 2.13 μm. For the 620 °C annealed and torsioned specimen (Figure 8d–f), at the center (r = 0), the overall and austenite average grain sizes are 8.97 μm and 6.33 μm, respectively. At the half-radius (r = 1/2R), the values are 8.18 μm (overall) and 5.44 μm (austenite). At the edge (r = R), the overall average is 3.76 μm, and the austenite average is 2.7 μm. These results confirm that the post-annealing torsion process produces a gradient in the overall average grain size and austenite average grain size along the radial direction. The contribution of austenite to the yield strength at different locations was calculated by introducing grain refinement strengthening (Equation (1)):
where σgb is the contribution of grain refinement strengthening from constituent phases to the yield strength, it can be expressed as, i is the constituent phase, ky is the Hall–Petch coefficient. For austenite, ky is taken as 300 MPa μm1/2, d refers to the average grain size of austenite and ferrite measured via EBSD. Based on the EBSD grain size maps, the contributions of austenite phase grain refinement strengthening to the yield strength for the A600-90 and A620-90 samples at the center, mid-radius (0.5R), and edge positions can be calculated as follows: 159 MPa (center), 170 MPa (0.5R), and 206 MPa (edge) for A600-90; 100 MPa (center), 105 MPa (r = 0.5R), and 155 MPa (edge) for A620-90.
Figure 8.
EBSD overall and austenite grain size distribution diagrams corresponding to different positions after 90° torsion following annealing at 600 °C and 620 °C. (a–c) 600 °C; (d–f) 620 °C; (a,d) r = 0; (b,e) r = 1/2R; (c,f) r = R.
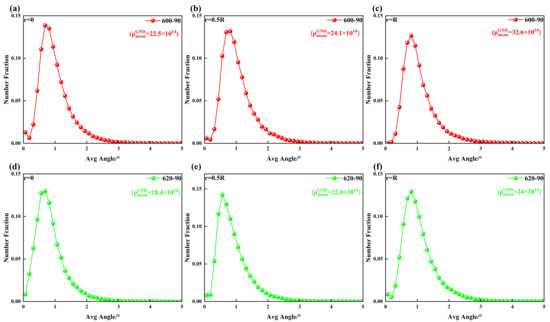
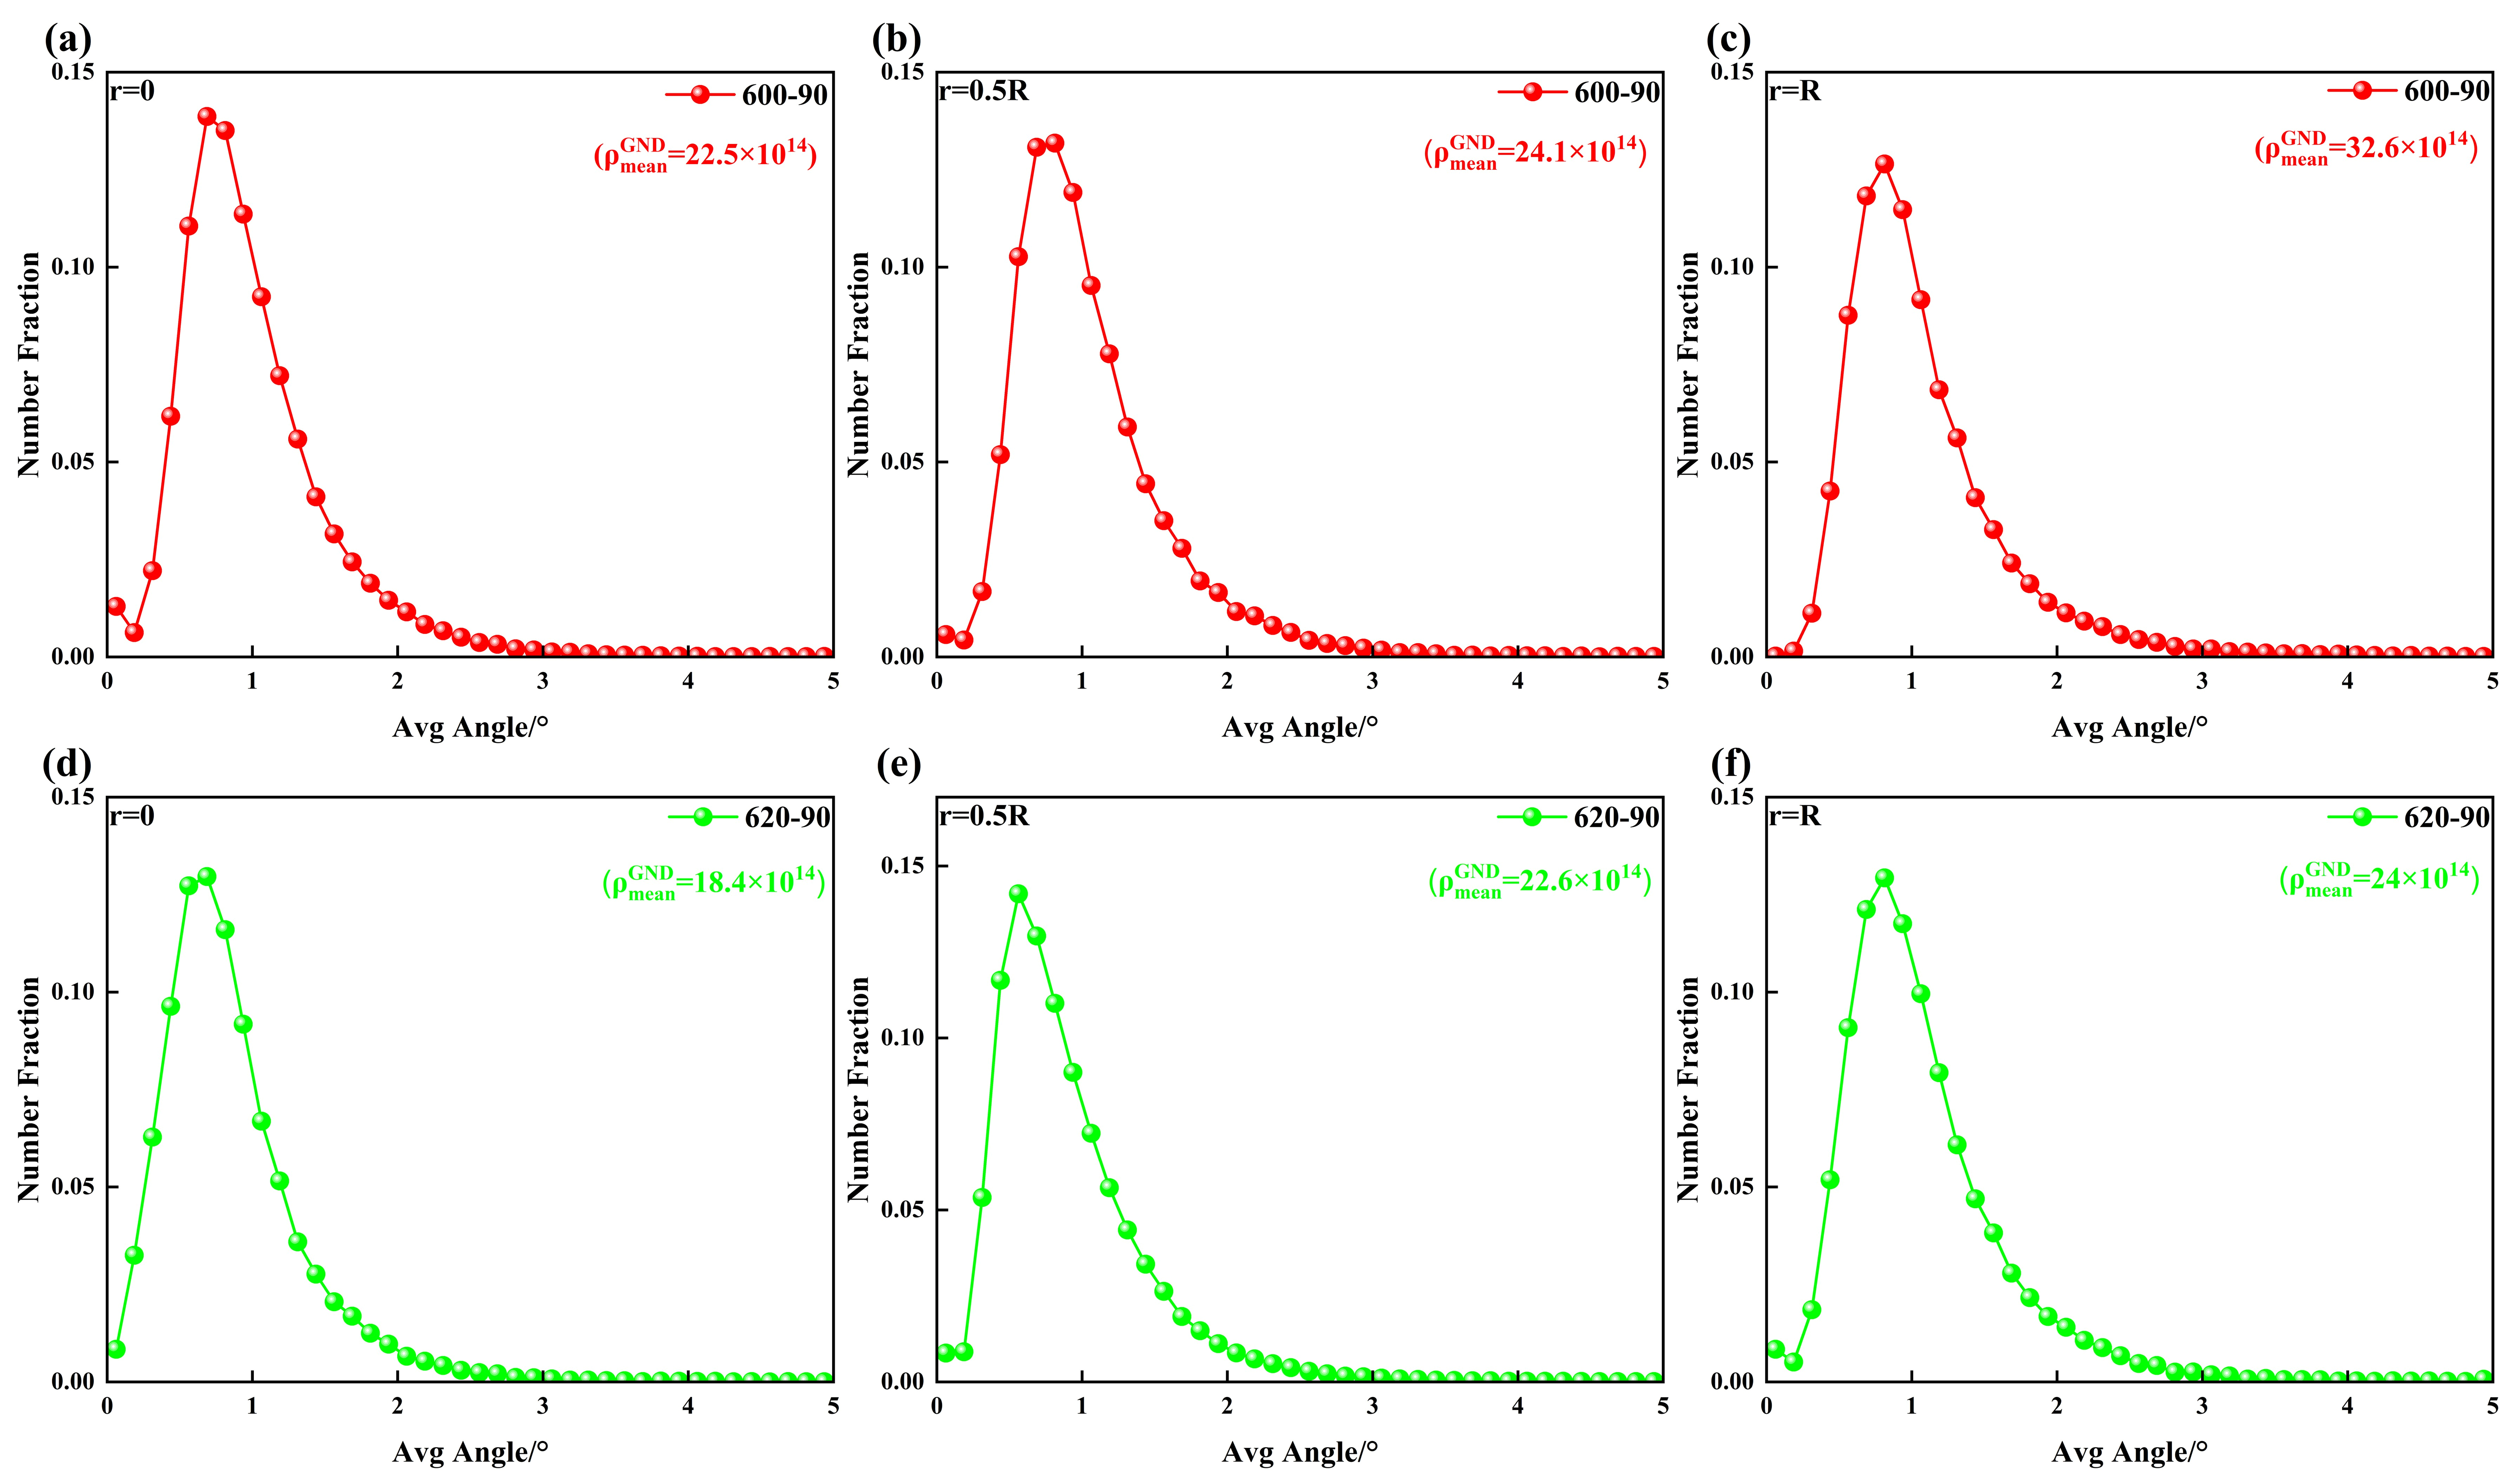
Figure 9 presents the GND density values of the experimental steel under different annealing temperatures. These values were obtained by statistically analyzing the average misorientation between a central grain within a specific region and its surrounding area. It is generally accepted that misorientation caused by dislocations is typically considered to be around 5°, while values exceeding 5° are attributed to grain boundaries. The GND density values were calculated based on the studies by Gao [24] and Kubin [25], using the following formula:
where θ is the measured average misorientation obtained from the KAM value based on the EBSD results (Figure 6 and Figure 7), u is the scanning step (0.07 μm), and b is the Burgers vector. Based on the calculated KAM value, the
at the center, half radius, and surface were approximately 22.5 × 10¹⁴ m−2, 24.1 × 10¹⁴ m−2, and 32.6 × 10¹⁴ m−2 for the A600-90 sample and approximately 18.4 × 10¹⁴ m−2, 22.6 × 10¹⁴ m−2, and 24 × 1014 m−2 for the A620-90 sample, respectively. These results confirm that the post-annealing torsion process produces a gradient in GND density values along the radial direction.
Figure 9.
Histogram of GND density. (a–c) A600-90; (d–f) A620-90; (a,d) r = 0; (b,e) r = 1/2R; (c,f) r = R.
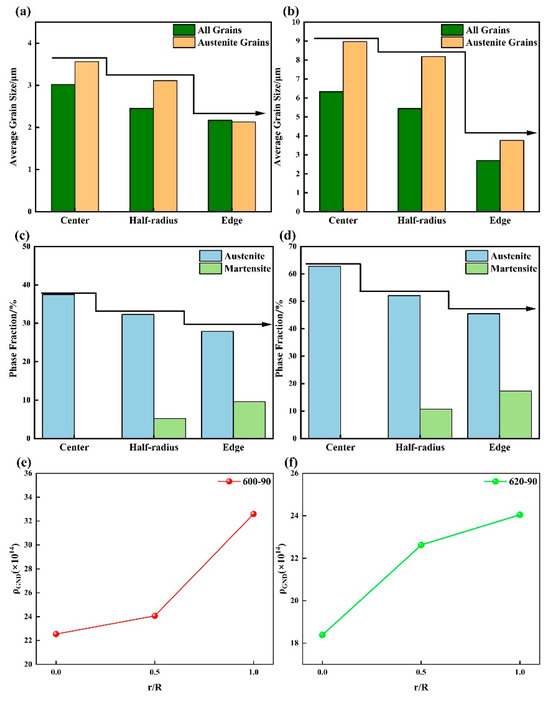
The radial variations in overall average grain size, austenite average grain size, phase content, and GND density for the 90° torsioned specimens annealed at 600 °C (A600-90) and 620 °C (A620-90) are summarized in Figure 6, Figure 7, Figure 8 and Figure 9. According to EBSD analysis, the austenite contents for A600-90 are 27.9% (edge), 32.3% (half-radius), and 37.5% (center). For A620-90, the values are 45.5%, 52.1%, and 62.8%, respectively. Using the center austenite content as the reference, the difference in austenite content along the radial direction corresponds to the martensite fraction. Thus, the martensite contents for A600-90 are 9.6% (edge), 5.2% (half-radius), and 0% (center), while for A620-90 they are 17.3%, 10.7%, and 0%, respectively. Therefore, shear strain triggers martensitic transformation, causing the austenite content to decrease gradually from the center to the edge. The transformed austenite contributes to the formation of a gradient in both austenite and martensite phase contents along the radial direction. The austenite average grain sizes for A600-90 are 2.13 μm (edge), 3.11 μm (half-radius), and 3.56 μm (center), and for A620-90, 3.76 μm, 8.18 μm, and 8.97 μm, respectively. This indicates significant refinement of austenite grains in the surface region compared to the center, confirming a gradient in austenite grain size from the core to the edge. The GND density at the center, half radius, and surface were approximately 22.5 × 10¹⁴ m−2, 24.1 × 10¹⁴ m−2, and 32.6 × 10¹⁴ m−2 for the A600-90 sample and approximately 18.4 × 10¹⁴ m−2, 22.6 × 10¹⁴ m−2, and 24 × 1014 m−2 for the A620-90 sample, respectively. In summary, the post-annealing torsion successfully produced multiple gradient structures in the radial direction, including gradients in austenite/martensite phase fraction and grain size, and GND density, as illustrated schematically in Figure 10. Based on the EBSD characterization results, it can be observed that the hardness increases gradually along the radial direction due to the corresponding gradual increase in martensite content. Furthermore, as the annealing temperature rises from 600 °C to 620 °C, the volume fraction of austenite increases, leading to a more sustained TRIP effect in A620-90, which results in its higher elongation compared to A600-90. Additionally, the larger grain size in A620-90 contributes to its lower yield strength than that of A600-90.
Figure 10.
Grain size, Phase Fraction, and GND density vary with radial position after 90° twisting. (a,c,e) 600 °C; (b,d,f) 620 °C.
According to the EBSD phase maps of the fractured specimens in Figure 11, the austenite transformation fractions for the A600-90 sample are 18.7%, 14.2%, and 17%, while those for the A620-90 sample are 25.5%, 27.8%, and 13.1%. It can be observed that the austenite transformation fraction at the center and mid-radius positions of the A620-90 sample is significantly higher than that of the A600-90 sample. Additionally, as shown in Figure 1, the Mn content within the austenite at an annealing temperature of 620 °C is lower than that at 600 °C, indicating that the austenite in sample A600-90 is more stable and less prone to the TRIP effect. Moreover, Figure 6 and Figure 7 show that the A620-90 sample possesses a higher austenite content, meaning more austenite is available to undergo the TRIP effect. Furthermore, Figure 11 demonstrates that the A620-90 sample exhibits a greater fraction of transformed austenite. This precisely confirms that a more extensive and sustained TRIP effect occurs during tensile deformation in the A620-90 sample, leading to its superior overall mechanical properties.
Figure 11.
EBSD phase maps of the fractured A600-90 and A620-90 samples. (a,d) r = 0; (b,e) r = 1/2R; (c,f) r = R.
4. Conclusions
In this study, the effects of torsion angle on the microstructure and mechanical properties of a medium-Mn steel (Fe-9.1Mn-1.86Al-3.3Cu-0.27C) subjected to different annealing temperatures were investigated. The main conclusions are as follows:
- (1)
- The A600 and A620 experimental steels exhibit yield strengths of 762 MPa and 673 MPa, and elongations of 47.4% and 44.1%, respectively. After twisting to 90° following annealing at 600 °C and 620 °C, the yield strength increased from the initial 762 MPa and 673 MPa to 834 MPa and 808 MPa, respectively; the elongation decreased from 47.4% and 44.1% to 21.6% and 29.5%, respectively. When twisted to 180°, the yield strength further rose to 955 MPa and 919 MPa from 762 MPa and 834 MPa, respectively; the elongation decreased from 47.4% and 44.1% to 8.48% and 4.3%, respectively.
- (2)
- During the torsional deformation process, the shear strain and strain rate increase from the center to the edge. Extensive plastic deformation and high strain rates induce martensitic transformation. Consequently, the volume fraction of austenite grains in both the A600-90 and A620-90 samples decreases progressively from the center to the edge, while the volume fraction of martensite gradually increases. This leads to a gradual increase in hardness from the center to the edge and also results in a gradual rise in GND density from the center to the edge, thereby successfully introducing a multi-gradient structure into the medium-Mn steel.
- (3)
- This study explains the primary reasons for the differences in mechanical properties between the A600-90 and A620-90 samples by simulating the elemental content within austenite at different temperatures and measuring the austenite content after annealing at various temperatures, focusing on the aspects of austenite stability and content. Furthermore, the austenite content of the fractured samples was measured, providing additional evidence that the superior mechanical performance of the A620-90 sample is mainly attributed to its more favorable austenite content and stability, which enable a more sustained TRIP effect during tensile deformation, significantly enhancing the overall mechanical properties. Further investigation is required to explore how the mechanical properties of the experimental steel may change under a broader temperature window and different torsional angles.
Author Contributions
Conceptualization, Z.J. and L.S.; methodology, Z.J.; software, G.L. and L.S.; validation, L.W. and H.L.; formal analysis, Z.J. and G.L.; investigation, L.S. and R.Z.; resources, L.W. and J.Z.; data curation, Z.J. and L.S.; writing—original draft preparation, Z.J. and L.S.; writing—review and editing, Z.J. and M.Z.; visualization, H.L.; supervision, Y.L., Y.F. and M.Z.; project administration, Y.L. and M.Z.; funding acquisition, M.Z. All authors have read and agreed to the published version of the manuscript.
Funding
The investigation is financially supported by the National Natural Science Foundation of China (52571041); the Central Leading Local Science and Technology Development Fund Project (236Z1003G); the Science and Technology Plan Project of Tangshan City (Grant No. 24130207C).
Institutional Review Board Statement
Not applicable.
Informed Consent Statement
Not applicable.
Data Availability Statement
Data are contained within the article.
Conflicts of Interest
The authors declare no conflicts of interest.
References
- Hu, B.; Sui, H.; Wen, Q.; Wang, Z.; Gramlich, A.; Luo, H. Review on the plastic instability of medium-Mn steels for identifying the formation mechanisms of Lüders and Potvin–Le Chatelier bands. Int. J. Miner. Metall. Mater. 2024, 31, 1285–1297. [Google Scholar] [CrossRef] [Scilit]
- Zhang, Y.; Ye, Q.; Yan, Y. Processing, microstructure, mechanical properties, and hydrogen embrittlement of medium-Mn steels: A review. J. Mater. Sci. Technol. 2024, 201, 44–57. [Google Scholar] [CrossRef] [Scilit]
- Hu, S.; Zheng, Z.; Yang, W.; Yang, H. Fe–Mn–C–Al Low-Density Steel for Structural Materials: A Review of Alloying, Heat Treatment, Microstructure, and Mechanical Properties. Steel Res. Int. 2022, 93, 2200191. [Google Scholar] [CrossRef] [Scilit]
- Speer, J.; Rana, R.; Matlock, D.; Glover, A.; Thomas, G.; de Moor, E. Processing Variants in Medium-Mn Steels. Metals 2019, 9, 771. [Google Scholar] [CrossRef] [Scilit]
- Guo, K.; Tong, Z.; Xu, Y.; Li, Y.; Li, W.; Zhao, H.; Du, H.; Xia, C.; You, X.; Liu, W.; et al. Triggering synergistic deformation mechanisms by migration of Cu-rich nanoprecipitates in medium-Mn steel. Mater. Sci. Eng. A 2025, 924, 147712. [Google Scholar] [CrossRef] [Scilit]
- Liu, D.; Tong, Z.; Han, D.; Ding, H.; Cai, M.; Zhao, K.; Li, H.; Niu, S. Study on the influence of κ-carbide on the high temperature flow behavior of the medium-Mn lightweight steel: Modeling and characterization. Mater. Sci. Eng. A 2024, 908, 146784. [Google Scholar] [CrossRef] [Scilit]
- Xiong, Y.; Guo, X.; Dong, H. Impact of Size and Distribution of k-Carbides on the Hydrogen Embrittlement and Trapping Behaviors of a Fe-Mn-Al-C Low-Density Steel. Materials 2024, 17, 2698. [Google Scholar] [CrossRef] [Scilit] [PubMed]
- Kwok, T.W.J.; Gong, P.; Rose, R.; Dye, D. The relative contributions of TWIP and TRIP to strength in fine-grained medium-Mn steels. Mater. Sci. Eng. A 2022, 855, 143864. [Google Scholar] [CrossRef] [Scilit]
- Li, Y.; Zhang, B.; Guan, Q.; He, B. Strong and ductile medium-Mn steel achieved via controlled martensite tempering. Mater. Sci. Technol. 2023, 39, 2478–2490. [Google Scholar] [CrossRef] [Scilit]
- Zhu, Q.; Gao, J.; Zhao, H.; Huang, Y.; Liu, G.; Wu, G.; Mao, X. Heterostructure-mediated high strength and large ductility in novel medium-Mn steels with low Mn content. Acta Mater. 2024, 276, 120092. [Google Scholar] [CrossRef] [Scilit]
- Bai, P.; Ren, J.; Luan, Z.; Yin, L.; Li, D.; Xiong, Y.; Ren, F. Microstructure and properties of Mn 7 medium-Mn steel at different partitioning temperatures. Mater. Sci. Eng. A 2025, 922, 147675. [Google Scholar] [CrossRef] [Scilit]
- Kumar, D.; Sanyal, S.; Yadav, M.K.; Sen, I.; Bandyopadhyay, T.K. Understanding the TRIP effect in hot- and cold-rolled Al-added medium-Mn steels: Insights into austenite stability and martensitic transformation kinetics. Mater. Today Commun. 2025, 44, 111955. [Google Scholar] [CrossRef] [Scilit]
- Kumar, S.; Bairagi, D.; Adhikary, T.; Prasad, A.D.; Jayabalan, B.; Mukherjee, S.; Mandal, S. Insights into the corrosion mechanisms in a multiphase medium-manganese steel in a marine environment: Experimental study and density functional theory simulations. Mater. Today Commun. 2025, 46, 112640. [Google Scholar] [CrossRef] [Scilit]
- Qiao, Y.X.; Zheng, Z.B.; Yang, H.K.; Long, J.; Han, P.X. Recent progress in microstructural evolution, mechanical and corrosion properties of medium-Mn steel. J. Iron Steel Res. Int. 2023, 30, 1463–1476. [Google Scholar] [CrossRef] [Scilit]
- Zhou, L.; Jia, J.; Liang, D.; Wang, Q.; Zhang, Z.; Hou, L.; Wei, Y. Influence of nickel alloying on microstructure evolution and corrosion resistance of low-density steel Fe-Mn-Al-C in chloride-rich environment. Mater. Lett. 2025, 397, 138819. [Google Scholar] [CrossRef] [Scilit]
- Ji, W.; Zhou, R.; Vivegananthan, P.; Wu, M.S.; Gao, H.; Zhou, K. Recent progress in gradient-structured metals and alloys. Prog. Mater. Sci. 2023, 140, 101194. [Google Scholar] [CrossRef] [Scilit]
- Wei, Y.; Li, Y.; Zhu, L.; Liu, Y.; Lei, X.; Wang, G.; Gao, H. Evading the strength-ductility trade-off dilemma in steel through gradient hierarchical nanotwins. Nat. Commun. 2014, 5, 3580. [Google Scholar] [CrossRef] [Scilit] [PubMed]
- Wang, H.T.; Tao, N.R.; Lu, K. Architectured surface layer with a gradient Nano twinned structure in a Fe-Mn austenitic steel. Scr. Mater. 2013, 68, 22–27. [Google Scholar] [CrossRef] [Scilit]
- Lu, K. Making strong nanomaterials ductile with gradients. Science 2014, 345, 1455–1456. [Google Scholar] [CrossRef] [Scilit]
- Shao, C.W.; Zhang, P.; Wang, X.G.; Wang, Q.; Zhang, Z. High-cycle fatigue behavior of TWIP steel with graded grains: Breaking the rule of mixture. Mater. Res. Lett. 2019, 7, 26–32. [Google Scholar] [CrossRef] [Scilit]
- Wang, F.; Li, Y.; Chen, X.; Zhao, H.; Yaqoob, K.; Du, Y.; Song, M. Superior strength–ductility combination in Al alloys via dislocation gradient structure. Mater. Res. Lett. 2023, 11, 347–353. [Google Scholar] [CrossRef] [Scilit]
- Wu, X.; Yang, M.; Yuan, F.; Chen, L.; Zhu, Y. Combining gradient structure and TRIP effect to produce austenite stainless steel with high strength and ductility. Acta Mater. 2016, 112, 337–346. [Google Scholar] [CrossRef] [Scilit]
- Zhang, X.; Jia, Z.; Liu, T.; Shi, Y.; Liu, H.; Wang, X.; Zhou, Q. Enhancing the strength-ductility synergy of medium-Mn steel by introducing multiple gradient structures. Mater. Sci. Eng. A 2022, 860, 144268. [Google Scholar] [CrossRef] [Scilit]
- Jeong, K.; Jin, J.E.; Jung, Y.S.; Kang, S.; Lee, Y.K. The effects of Si on the mechanical twinning and strain hardening of Fe–18Mn–0.6C twinning-induced plasticity steel. Acta Mater. 2013, 61, 3399–3410. [Google Scholar] [CrossRef] [Scilit]
- Sun, B.; Fazeli, F.; Scott, C.; Brodusch, N.; Gauvin, R.; Yue, S. The influence of silicon additions on the deformation behavior of austenite-ferrite duplex medium manganese steels. Acta Mater. 2018, 148, 249–262. [Google Scholar] [CrossRef] [Scilit]

Disclaimer/Publisher’s Note: The statements, opinions and data contained in all publications are solely those of the individual author(s) and contributor(s) and not of MDPI and/or the editor(s). MDPI and/or the editor(s) disclaim responsibility for any injury to people or property resulting from any ideas, methods, instructions or products referred to in the content. |
© 2026 by the authors. Licensee MDPI, Basel, Switzerland. This article is an open access article distributed under the terms and conditions of the Creative Commons Attribution (CC BY) license.