


Abstract
Background: The misuse of antibiotics in aquaculture and clinical settings promotes drug resistance in food-related microbes. Vibrio parahaemolyticus, a global pathogen linked to diarrheal disease and food safety concerns, warrants a systematic assessment of its resistance. Methods: We analyzed 9757 high-quality V. parahaemolyticus genomes retrieved from NCBI (1950–2023). ARGs, mobile genetic elements (MGEs), plasmid replicons, sequence types, and virulence genes were identified. Associations between ARGs and genomic/macro-level factors were assessed, and strain-level resistance risk was evaluated using arg_ranker. Results: Among all sequenced strains, 99.59% were pathogenic, and 23.57% were food and aquatic animal sources. Furthermore, pan-resistome analysis indicated that ARGs carried by the V. parahaemolyticus population are expanding. Notably, most ARG types were enriched in strains from food and aquatic animals. In terms of temporal trends, shifts in resistance categories highlight tetracyclines, penams, and phosphonic acid antibiotics as priority surveillance targets, given that their associated ARGs have recently increased. Consistent with these findings, a positive correlation was found between ARG abundance and mobile genetic element (MGE) count per strain, specifically with tnpA as the most frequently co-occurring MGE. In addition, dynamic changes in predominant plasmid replicon types were documented, among which IncA/C2 and Col3M show co-occurrence with high-risk ARGs. Finally, risk assessment classified 95.18% of strains as Risk Level IV (lowest). Conclusions: Although the overall global resistance risk remains low, strains from food and aquatic animals contained the highest proportion of higher-risk (Rank I and II) strains among all sources. This study provides updated insights into antimicrobial resistance trends in V. parahaemolyticus and offers a theoretical foundation for guiding future resistance management strategies.
1. Introduction
Vibrio parahaemolyticus is a halophilic, Gram-negative bacterium commonly found in marine and estuarine environments, including water columns, sediments, and aquatic animals. Infection can lead to gastroenteritis, with symptoms such as abdominal pain, diarrhea, vomiting, and fever; severe cases may progress to septicemia [1,2]. As a leading cause of seafood-borne illness, V. parahaemolyticus infection represents a significant global public health concern. A nationwide outbreak of enteric infections caused by V. parahaemolyticus during September 2021 to January 2022 in Australia was reported, with cases occurring in all states and territories. The outbreak prompted a national recall of oysters and subsequent improvements in the postharvest processing of the shellfish [3]. V. parahaemolyticus has become the leading cause of seafood-related gastroenteritis in Korea, the United States and several other parts of the world [4,5]. V. parahaemolyticus appears to be undergoing a global expansion. Antibiotics are the primary therapeutic option, but the emergence of antimicrobial resistance (AMR) in this pathogen—driven largely by the indiscriminate use of antibiotics in aquaculture and clinical settings—has become increasingly serious. Resistant strains may enter humans through the food chain, complicating clinical treatment, while mobile genetic elements (MGEs) within these bacteria can horizontally transfer ARGs (antibiotic resistance genes) to other species, further amplifying the public health threat [6,7,8].
At present, V. parahaemolyticus isolated from many countries and regions is generally resistant to ampicillin [4,9,10,11]. In addition to β-lactam antibiotics, V. parahaemolyticus shows varying degrees of resistance to a variety of antibiotics such as aminoglycosides and quinolones [12,13]. V. parahaemolyticus can acquire ARGs through various MGEs. Studies have found that genomic islands carrying multiple ARGs exist in V. parahaemolyticus and are involved in the transfer of antibiotic ARGs [14]. Meanwhile, plasmids carrying ARGs have also been found in V. parahaemolyticus [15]. These plasmids can be transferred among different strains. Additionally, they can carry integrons, which are capable of capturing and expressing multiple ARGs [16]. Horizontal gene transfer of ARGs via MGEs is a factor hindering the control of AMR, in which plasmids play a key role [17,18].
While bioinformatic methods like CARD [19], PATRIC [20], and ResFinder [21] are routinely used to identify ARGs from genomic data, their large-scale application for surveillance and mechanistic studies has emerged as a key research focus [22]. The existence of ARGs in bacteria is the basic cause of bacterial antimicrobial resistance [23]. Monitoring longitudinal AMR data is essential not only for analyzing trends but also for the early detection of emerging resistance traits [24]. In previous studies, research on the drug resistance of V. parahaemolyticus is common, but the mining of large-scale ARGs with big data on the V. parahaemolyticus genome is still rare. Some studies on large-scale genomic analysis of drug resistance in Escherichia coli and Shigella flexneri have revealed that there is a distinct increase in ARGs among these bacteria causing diarrhea, and many genes can confer resistance [24,25,26]. These studies provide a theoretical basis for alleviating the threat of antibiotic resistance.
This study conducted an in-depth analysis of global genomic drug resistance between 1950 and 2023, analyzed the relationship between ARGs and MGEs in V. parahaemolyticus, and prioritized the risk of drug resistance in V. parahaemolyticus.
2. Results
2.1. Epidemiological Characters of the Strains Used in This Study
Sequenced strains were obtained from 36 countries spanning 6 continents; 99.59% (n = 9717) of strains were pathogenic (tdh-and/or trh-positive). The majority were sourced from China in Asia (n = 5083; 52.0%) and the United States in North America (n = 3040; 31.1%), which together accounted for 83.1% of the entire collection. The primary source of strains was human clinical specimens (n = 3576). The remaining strains were derived from food and aquatic animals (n = 2300) or the environment (n = 1353). The strains, isolated from 1950 to 2023, were grouped into six periods based on the year of isolation: before 2000 (n = 265), 2000–2004 (n = 174), 2005–2009 (n = 1716), 2010–2014 (n = 2700), 2015–2019 (n = 2356), and 2020–2023 (n = 1544). A comprehensive cross-tabulation of source, geographic origin, and temporal period is provided in Table 1 (excluding entries with unavailable data).
Table 1.
The region, isolation year and source distribution of V. parahaemolyticus strains used in this study.
2.2. Antibiotic Resistance Genes Spectrum and Pan-Resistome of the Strains
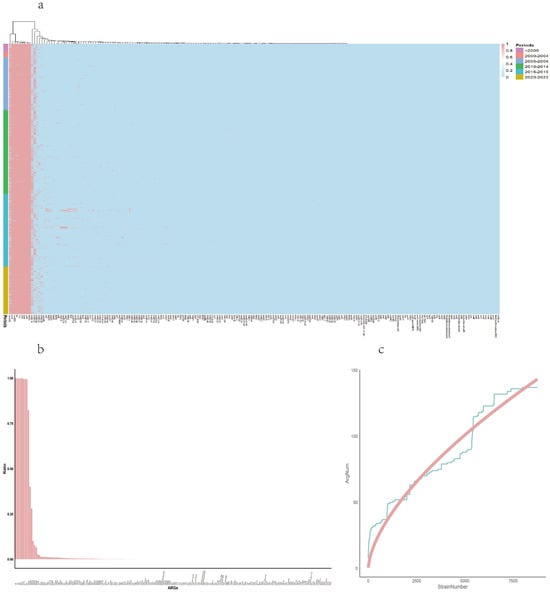
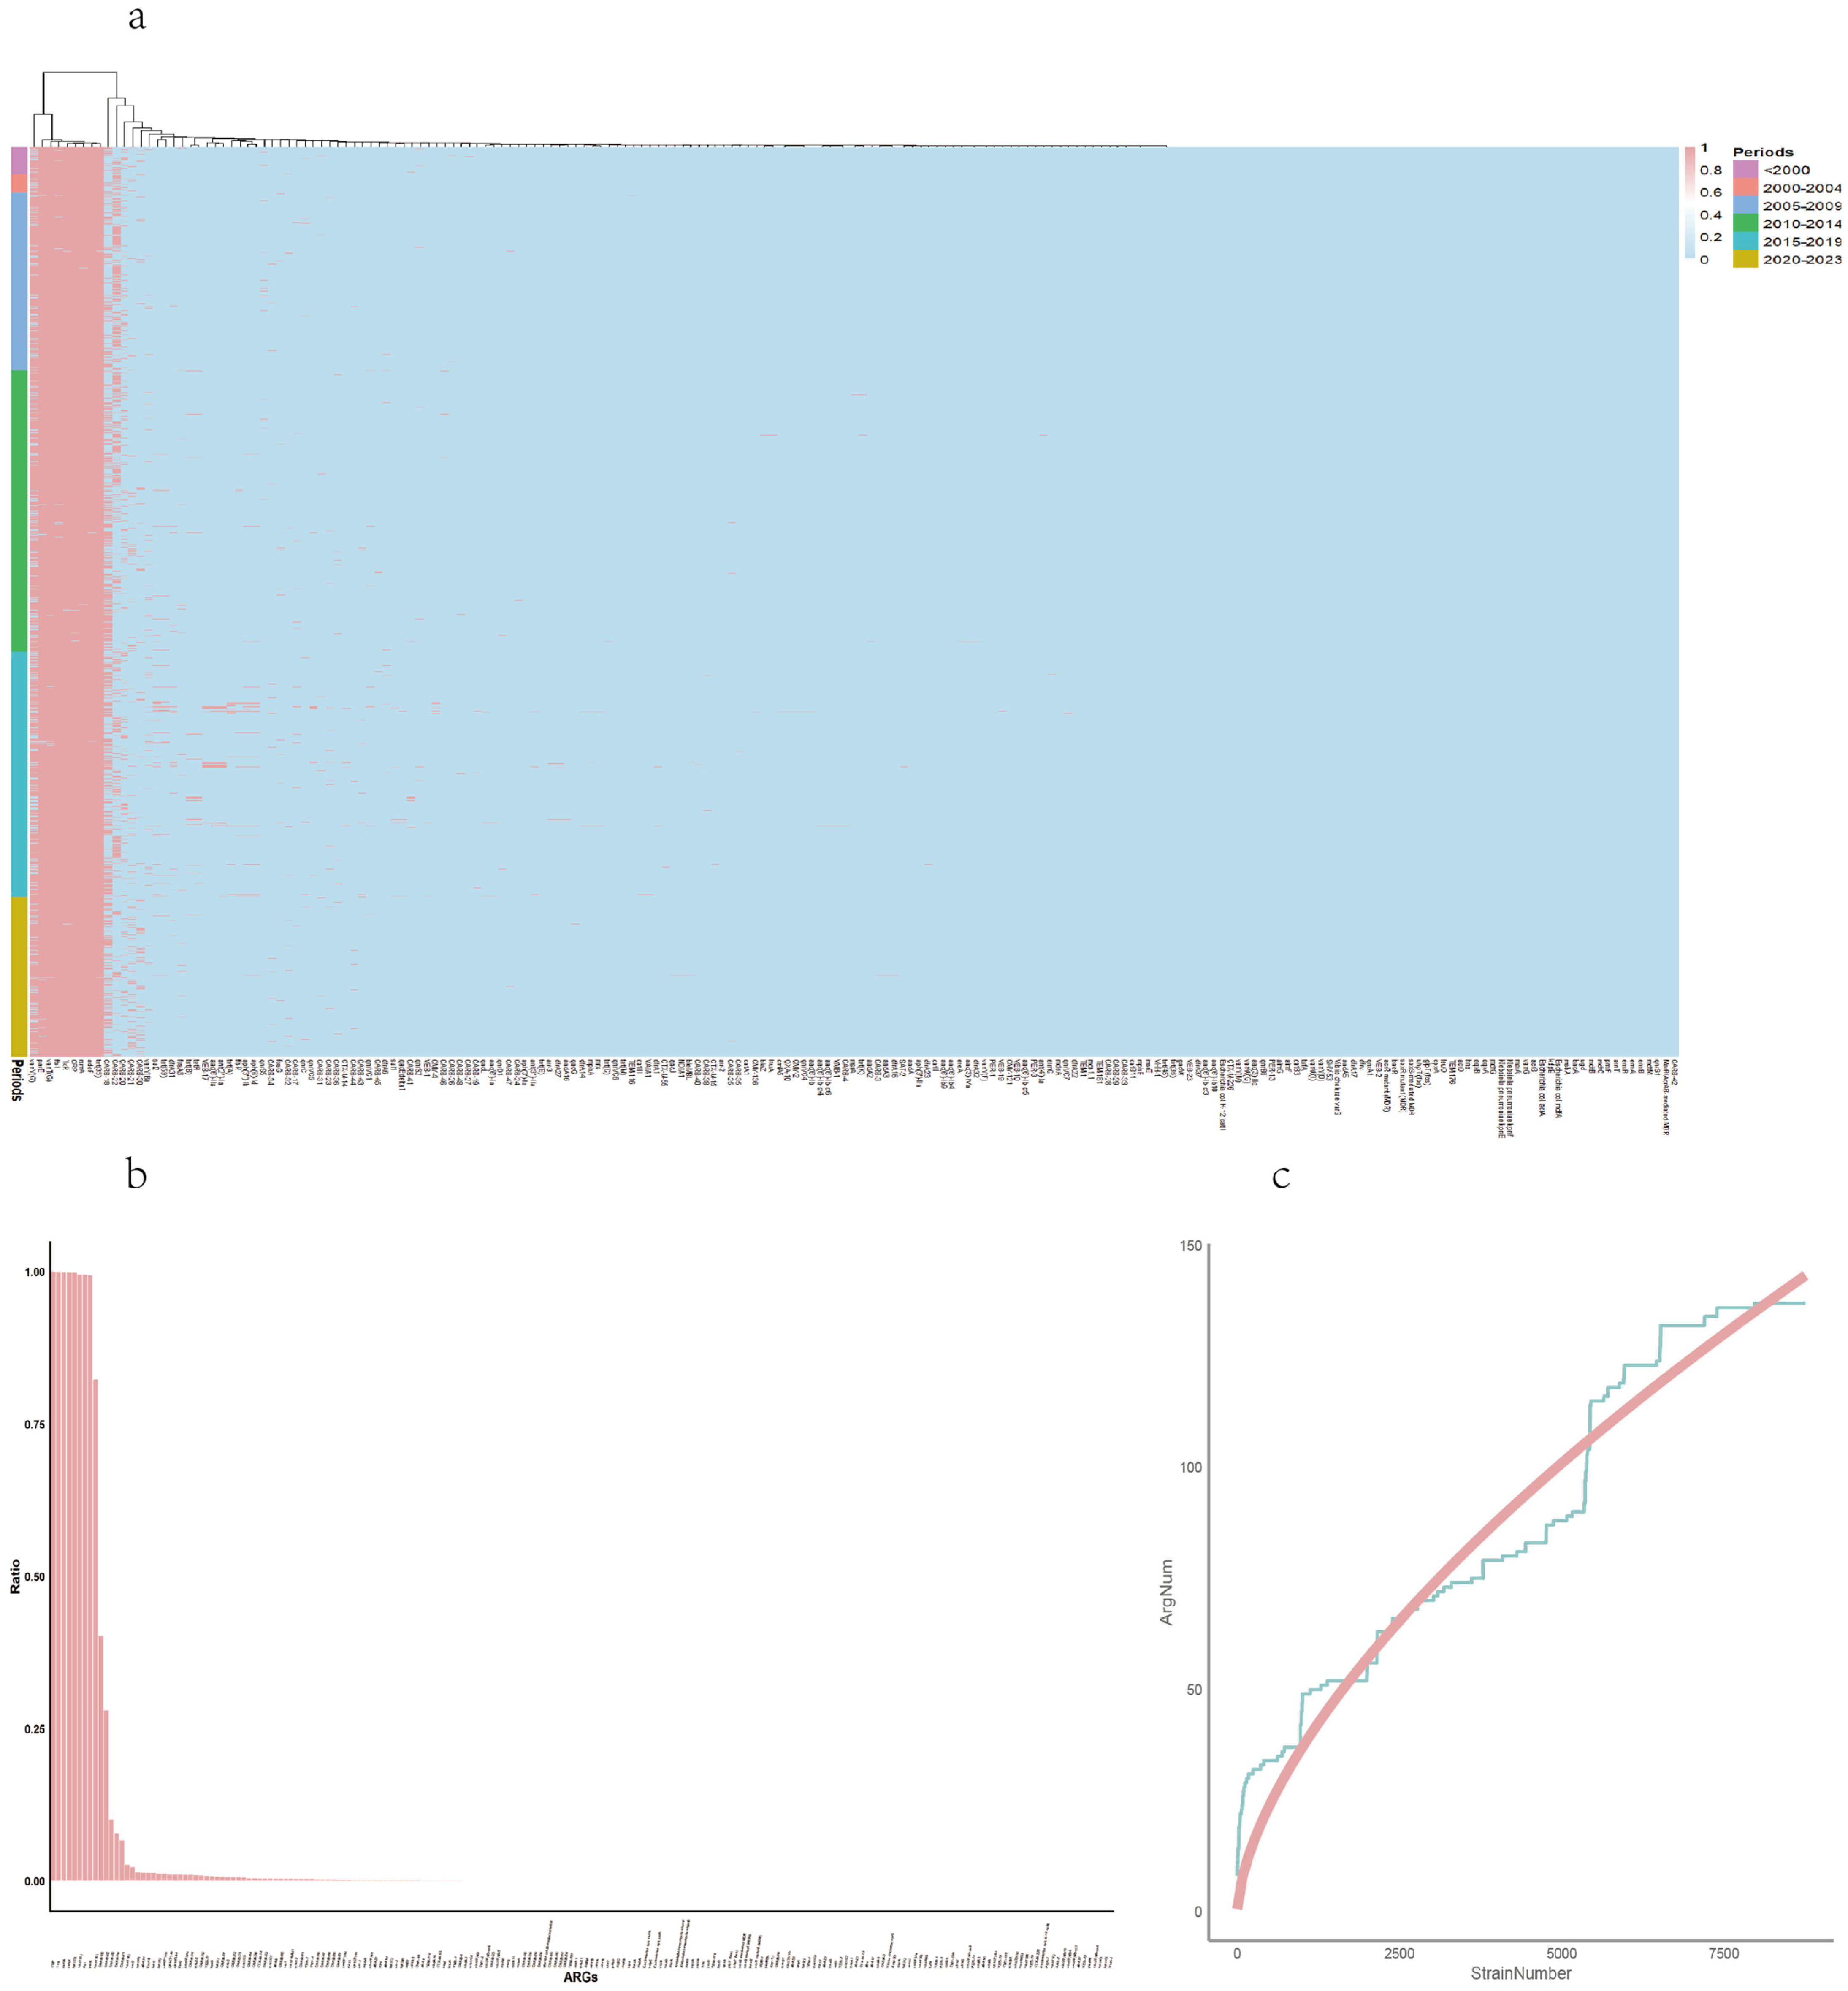
A total of 138 ARGs targeting 23 antibiotics were detected among the genomes of all strains, with the majority of these ARGs conferring resistance to penam antibiotics. The overall antibiotic resistance spectrum and the pan-resistome are presented in Figure 1a–c.
Figure 1.
Antibiotic resistance spectrum and pan-resistome analysis. (a) Two-dimensional hierarchical clustering of ARG profiles. (b) A bar plot arranged in descending order of the proportion of each ARGs across all strains. (c) Pan-resistome feature curves of 9757 strains of V. parahaemolyticus. The fitting model refers to the change curves of the pan-drug resistance genome accompanied by the increase in the genome number; Y = 0.4914 × X0.6252.
Two-dimensional hierarchical clustering revealed two major clusters of ARGs among the strains (Figure 1a): One cluster was the constitutive ARGs with high proportion, and the other cluster was the ARGs with low proportion. The strains are arranged from top to bottom by their isolation years.
The number of ARGs with the ratio of ≥0.5 within all strains accounted for 0.045 of the total ARGs. Based on the proportion of each ARG in all strains, as represented by a bar plot (Figure 1b) arranged in descending order, the ARGs were categorized into core genes and rare genes. The ARGs shared by all strains were classified as the core resistome [27]. Accordingly, eight genes were defined as the core resistome, conferring resistance to nine antibiotic classes: CRP (macrolides, fluoroquinolones, penams); TxR (tetracyclines); rsmA (fluoroquinolones, diaminopyrimidines, phenicols); adeF (fluoroquinolones, tetracyclines); tet(35) (tetracyclines); vanT(G) (glycopeptides); Haemophilus influenzae ftsI (penams, cephalosporins, cephamycins); and Escherichia coli parE (fluoroquinolones). In contrast, 23 ARGs were identified as rare, each found in only a single strain. Nine of these classes contained both core and rare genes. The remaining fourteen resistance classes were composed exclusively of rare genes.
Pan-resistome analysis found 138 ARGs among the genomes of strains. The accumulation curve of ARGs is described as: Y = 0.4914 × X0.6252, indicating a continuously rising trend in the accumulation of ARGs (Figure 1c). Meanwhile, we performed a pan-resistome analysis stratified by geographic region. The results demonstrated that strains of Chinese origin, strains of US origin, and strains from all other countries (excluding both China and the US) all exhibited a continuously rising trend in the accumulation of ARGs (see Figure S1, Supporting Information).
2.3. Association Between ARGs and Macro Factors
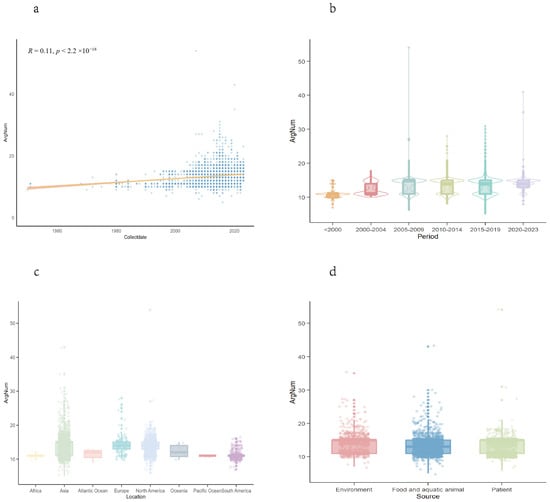
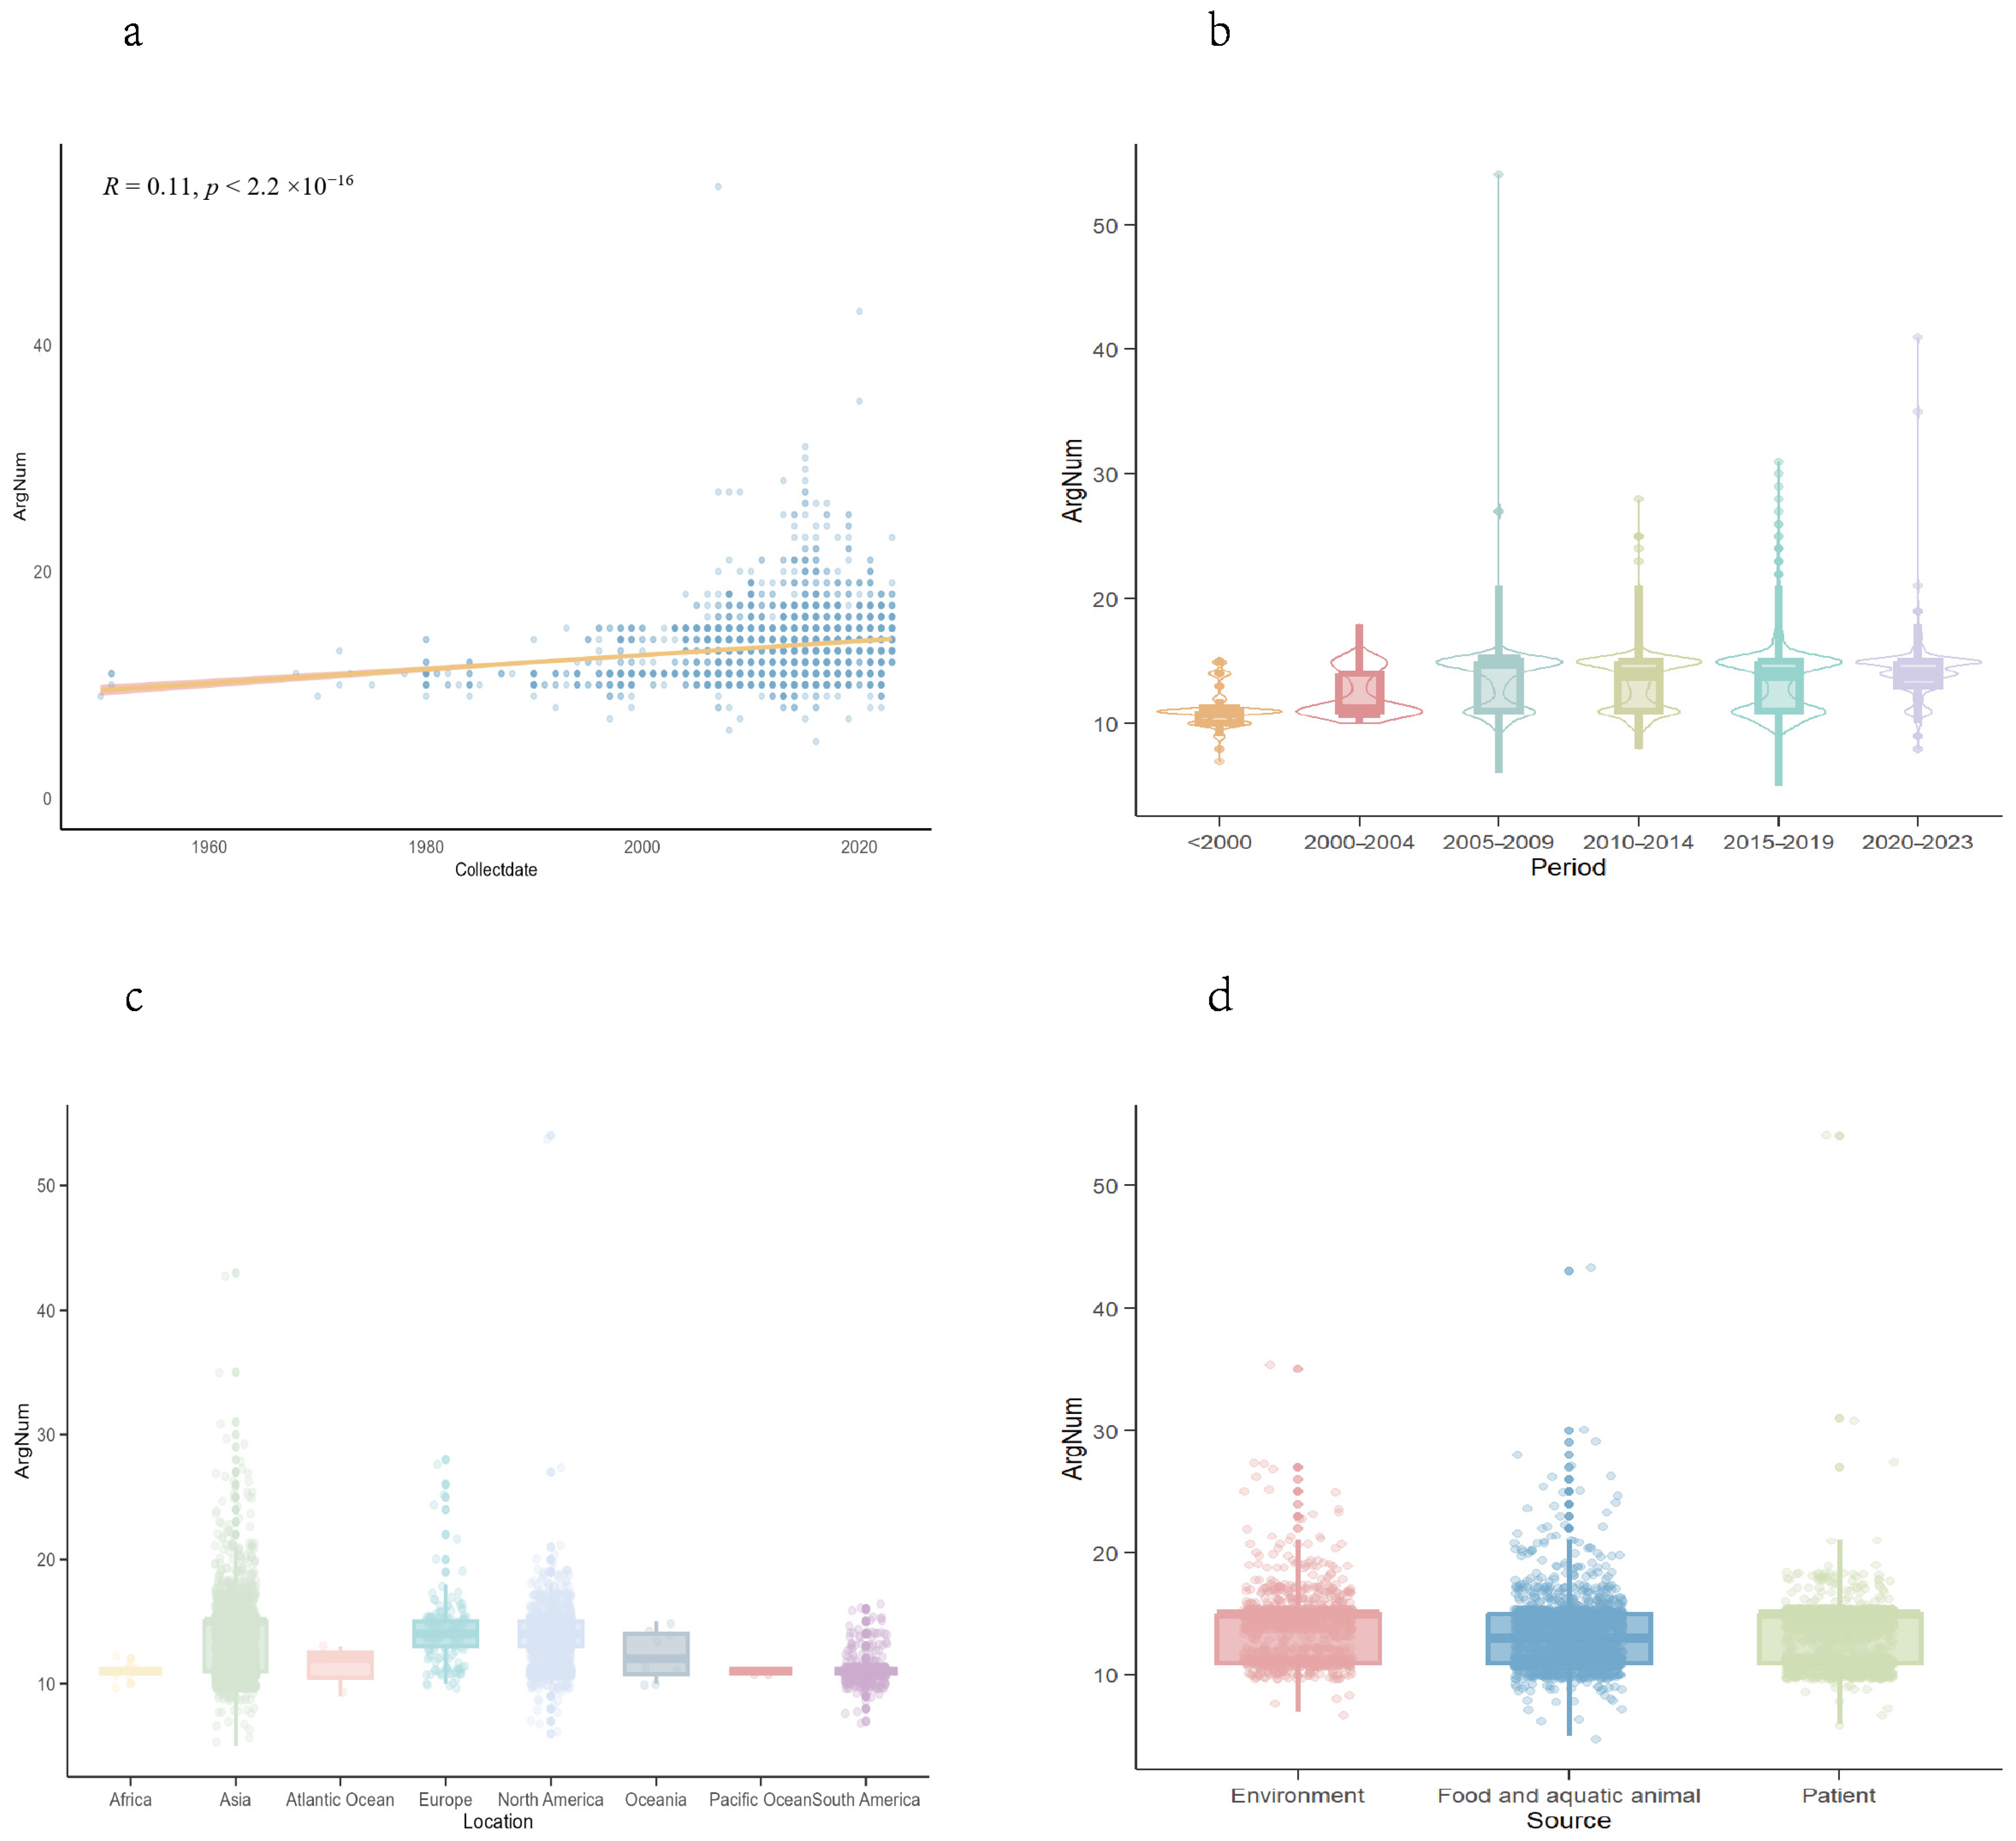
The prevalence of ARGs in bacterial strains demonstrated statistical associations with isolation time, geographic regions, and sources. Correlation analysis revealed a positive correlation between ARG counts of each strain and isolation years (R = 0.11, p < 2.2 ×10⁻¹⁶) (Figure 2a). Meanwhile, we performed a stratified analysis by geographic region: China showed a negative year-ARG correlation (R = −0.17, p < 2.2 ×10⁻¹⁶), the US showed a positive correlation (R = 0.35, p < 2.2 ×10⁻¹⁶), and excluding both countries revealed a positive trend among remaining nations (R = 0.36, p < 2.2 ×10⁻¹⁶) (see Figure S2, Supporting Information). The analysis of ARGs in different periods showed fluctuating ARG counts, with median values ranging from 11 (before 2000) to 15 (2005–2009), followed by stabilization at 14 during 2010–2023 (Figure 2b). Notably, the interquartile range (IQR) narrowed in recent years (2020–2023: IQR = 11–15), indicating reduced variability in contemporary strains. Emerging resistance categories peaked between 2020 and 2023 (e.g., tetracyclines, penams), while established threats like aminoglycosides and carbapenems have maintained high ARG counts since 2015–2019.
Figure 2.
Comparison of ARGs in different macro and genomic factors. (a) The linear fitting between the number of ARGs and years. (b) Differences in the distribution of ARG number per strain in each period. (c) Differences in ArgNum across different regions. (d) Differences in ARG number per strain from different isolation sources.
Geographic disparities were revealed by the significant difference in ARG number distribution (p < 0.05) (Figure 2c). Asian strains exhibited the highest ARG burdens (median = 15, IQR = 11–15), followed by Europe and North America (both median = 14, IQR = 13–15). This trend correlated with higher sequencing coverage in Asia and North America. Furthermore, the enrichment of ARGs in different geographic regions was analyzed. The results showed that Asia was enriched in 54 ARG types, surpassing North America (21) and Europe (17), whereas Oceania and Africa showed minimal diversity (three subtypes each).
Source-specific analysis uncovered significant, distinct ARG profiles (p < 0.05) (Figure 2d). Environmental and clinical strains displayed higher ARG counts (median = 15, IQR = 11–15) compared to food/aquatic animals (median = 13, IQR = 11–15). Among resistance categories, most categories showed significant source-dependent variations. Enriched ARG subsets varied markedly: strains from food systems harbored 65 ARG types, while it was 27 for environment strains, and 19 for clinical strains.
2.4. Association Between Antibiotic ARGs and Virulence
Pathogenic and non-pathogenic strains of V. parahaemolyticus were classified based on the presence of virulence genes: strains positive for tdh and/or trh were defined as pathogenic, whereas those negative for both genes were considered non-pathogenic. According to this criterion, 99.59% (n = 9717) of sequenced strains were pathogenic, while only 40 were non-pathogenic. The number of ARGs in pathogenic strains (median = 14, Q1 = 11, Q3 = 15) was significantly higher than in non-pathogenic strains (median = 11, Q1 = 10, Q3 = 12; Wilcoxon test, p < 0.01). Several ARGs showed statistically significant differences in prevalence between the two groups (p < 0.05, Wilcoxon test), including: vanY(G), adeF, tet(35), TxR, CARB-18, CARB-22, sul2, tet(59), aph(3″)-Ib, aph(6)-Id, tet(B), tetR, tet(A), and qnrVC1.
2.5. Association Between Antibiotic ARGs and Sequence Types
The genomic characteristics of strains, such as STs, may have an important impact on the prevalence of resistance genes. Firstly, to assess the relationship between ARGs and STs, we predicted the STs for all strains. The results showed that a total of 1059 distinct STs were assigned, except for 361 strains with novel STs. Additionally, 8.32% of the STs (n = 122) were represented by a single strain. ST3 and clonal complex 3 were most frequently detected and encompassed 2643 strains (27.09%) across all six chronological datasets, which is the ST of most V. parahaemolyticus strains. The prevalence of ST36 increased in the years following 2020. The dominant plasmids of ST2319 and ST2343 are IncA/C2, while the ST associated with IncQ1 is ST722. STs that were more prevalent in most periods generally had relatively higher ARG contents; for example, ST3(2643 strains) strains had a median ARG count of 15, while the median for ST36 (742 strains) was 14, and the median ARG count for novel STs (361) was 13. The Kruskal–Wallis All Pairs Nemenyi Test was performed for pairwise comparisons (ST3, ST36, new_ST, other). No significant difference was found between the new_ST and other groups, whereas statistically significant differences (p < 0.001) were observed among all other groups.
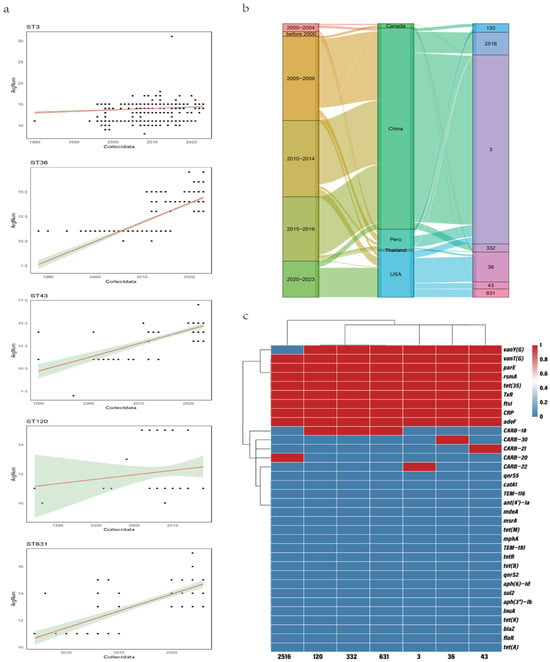
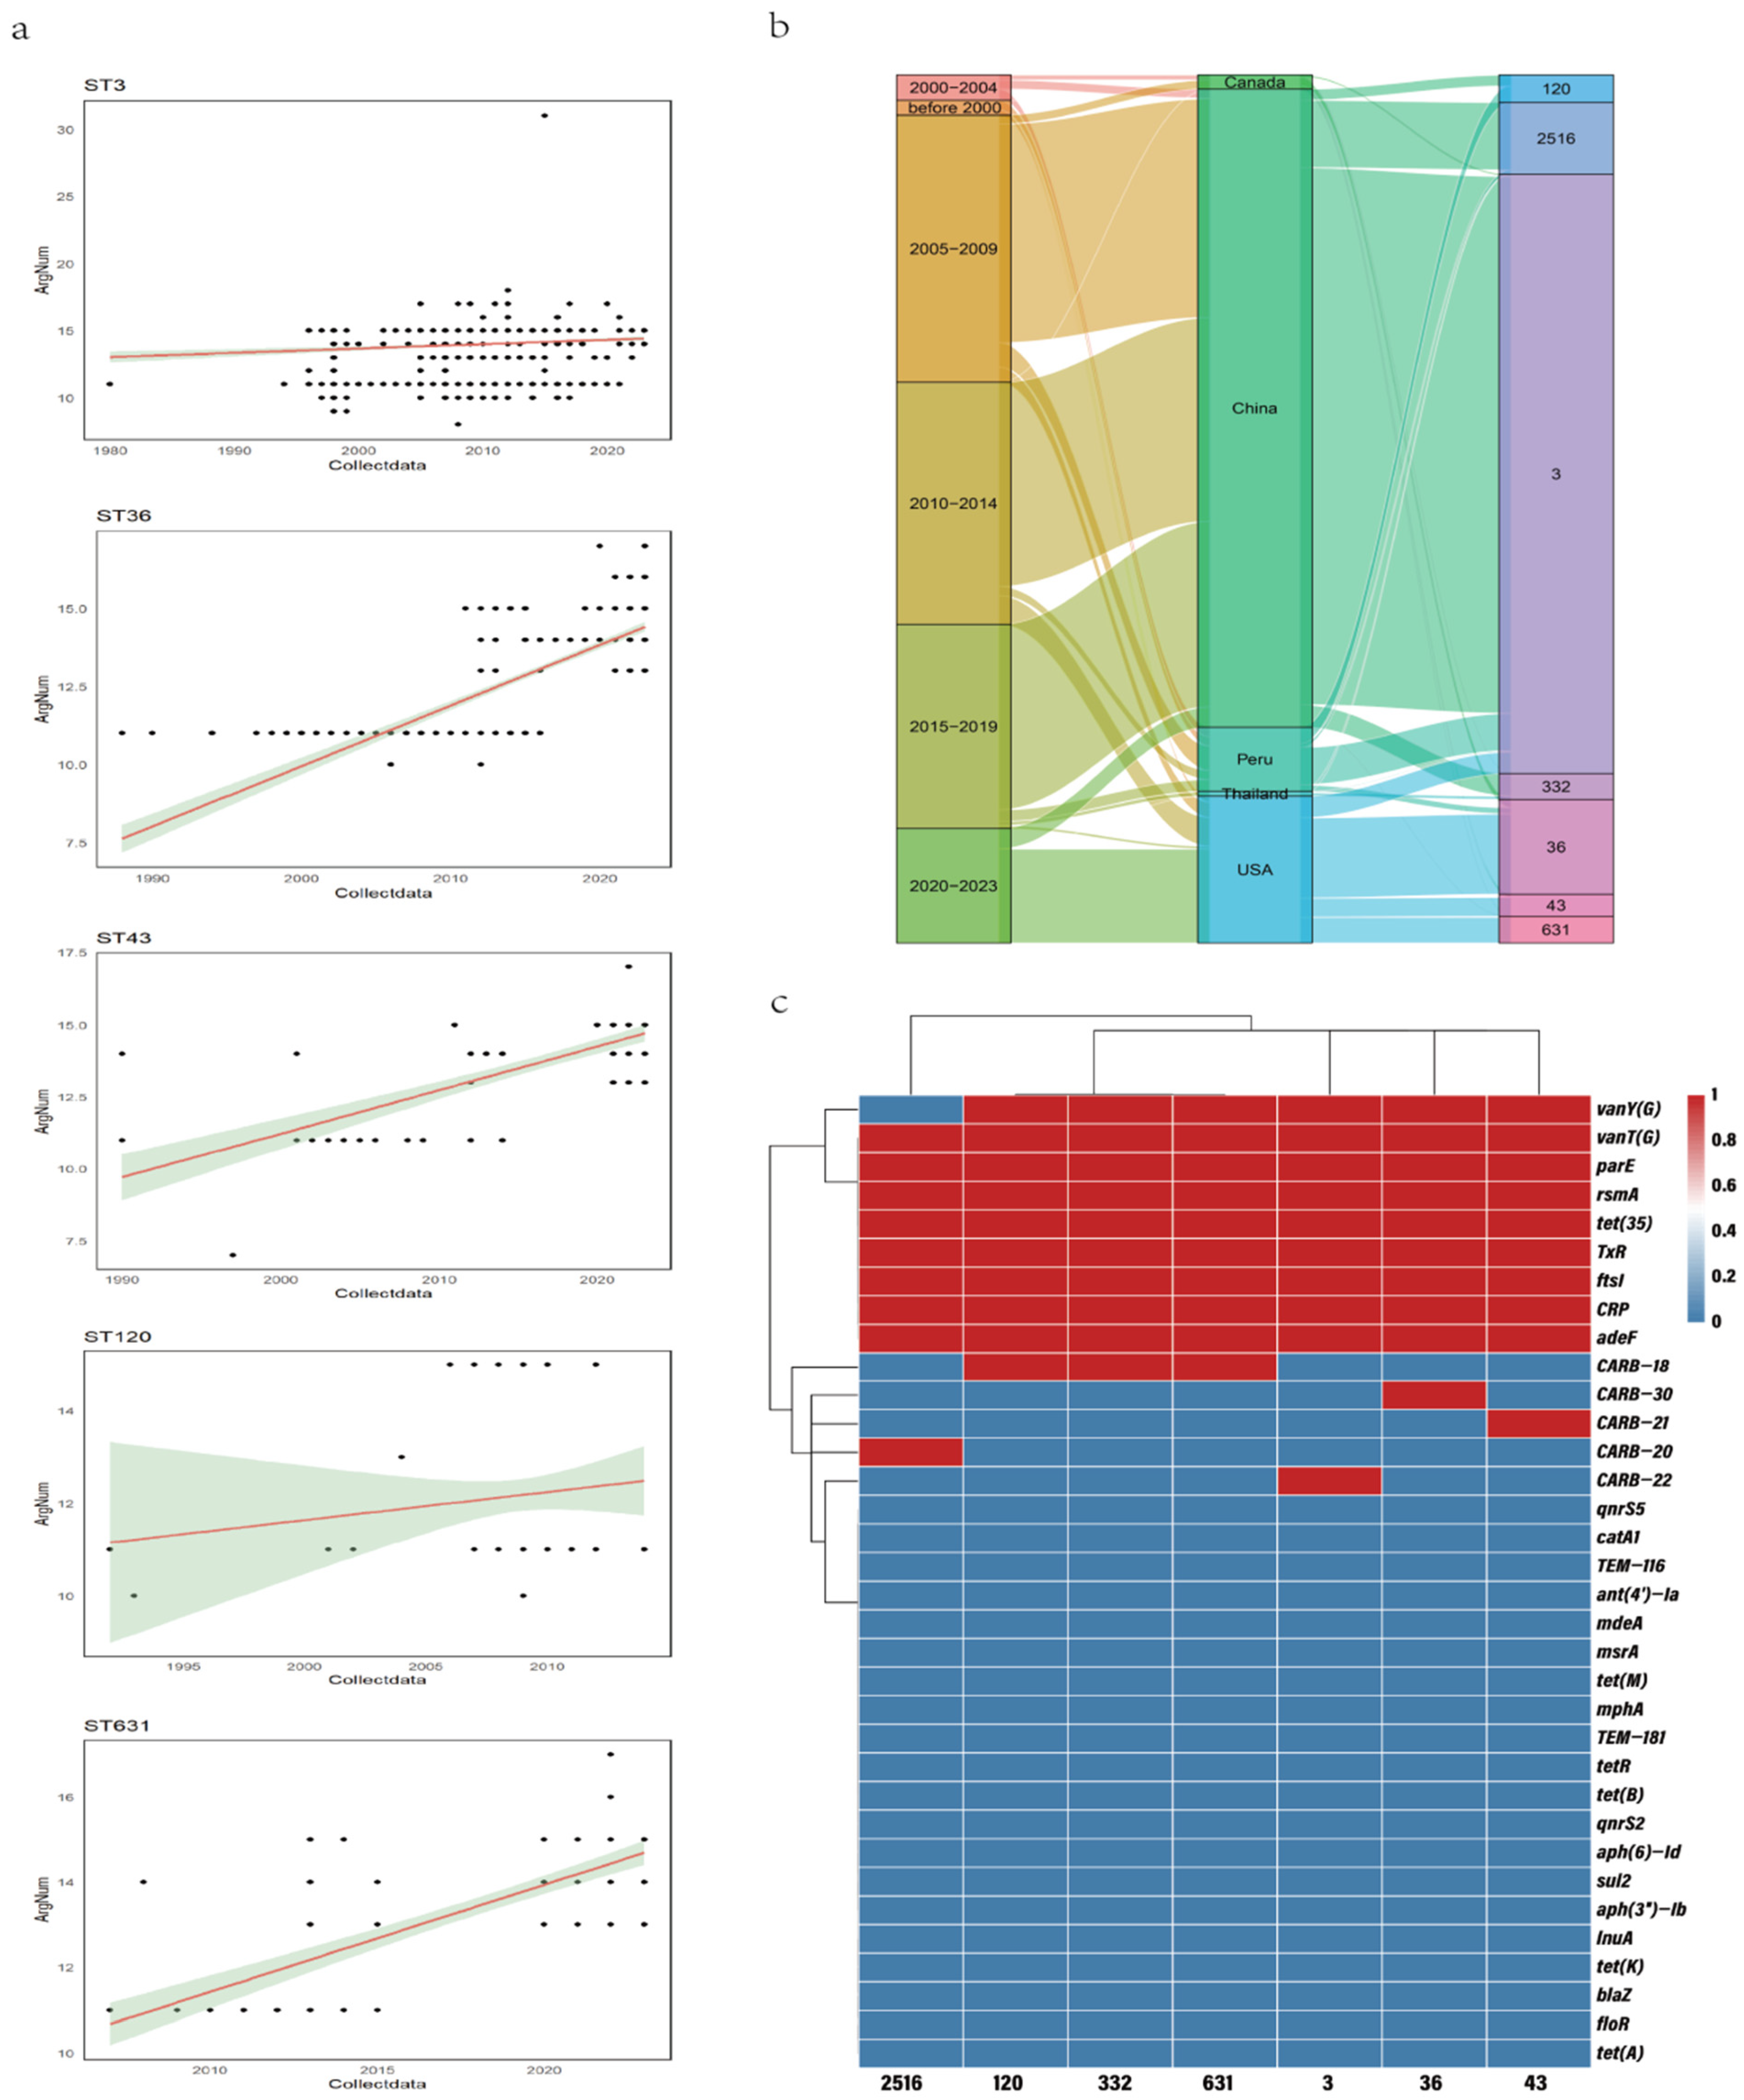
The correlations between ARG counts per ST and sampling time were analyzed for seven STs with more than 100 strains. The results showed that ST3, ST36, ST631, ST120, and ST43 displayed a marked increase (Figure 3a). The relationships between different STs, regions, and time periods are illustrated in Figure 3b. The figure shows that the distribution of STs varied across regions. ST3, ST2516, and ST332 were mainly distributed in China; ST36, ST631, and ST43 were primarily found in the United States; while ST120 was predominantly distributed in Peru.
Figure 3.
Association between ARGs and STs. (a) The linear fitting between the number of ARGs and STs. (b) The relationships between different STs, regions, and time periods. (c) The frequency distribution of ARGs across different STs.
Additionally, the ARG prevalence rates among STs were analyzed (Figure 3c). In addition to constitutive resistance genes, several ST-specific ARGs were identified. The vanY(G) was absent in ST2516, and CARB-18 was not carried by ST3, ST36, ST2516, or ST43. CARB-22 was exclusively detected in ST3, CARB-30 only in ST36, CARB-20 solely in ST2516, and CARB-21 only in ST43.
2.6. Association Between Antibiotic ARGs and MGEs
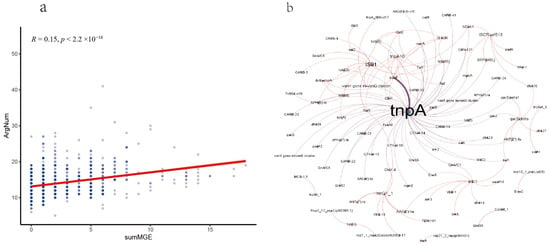
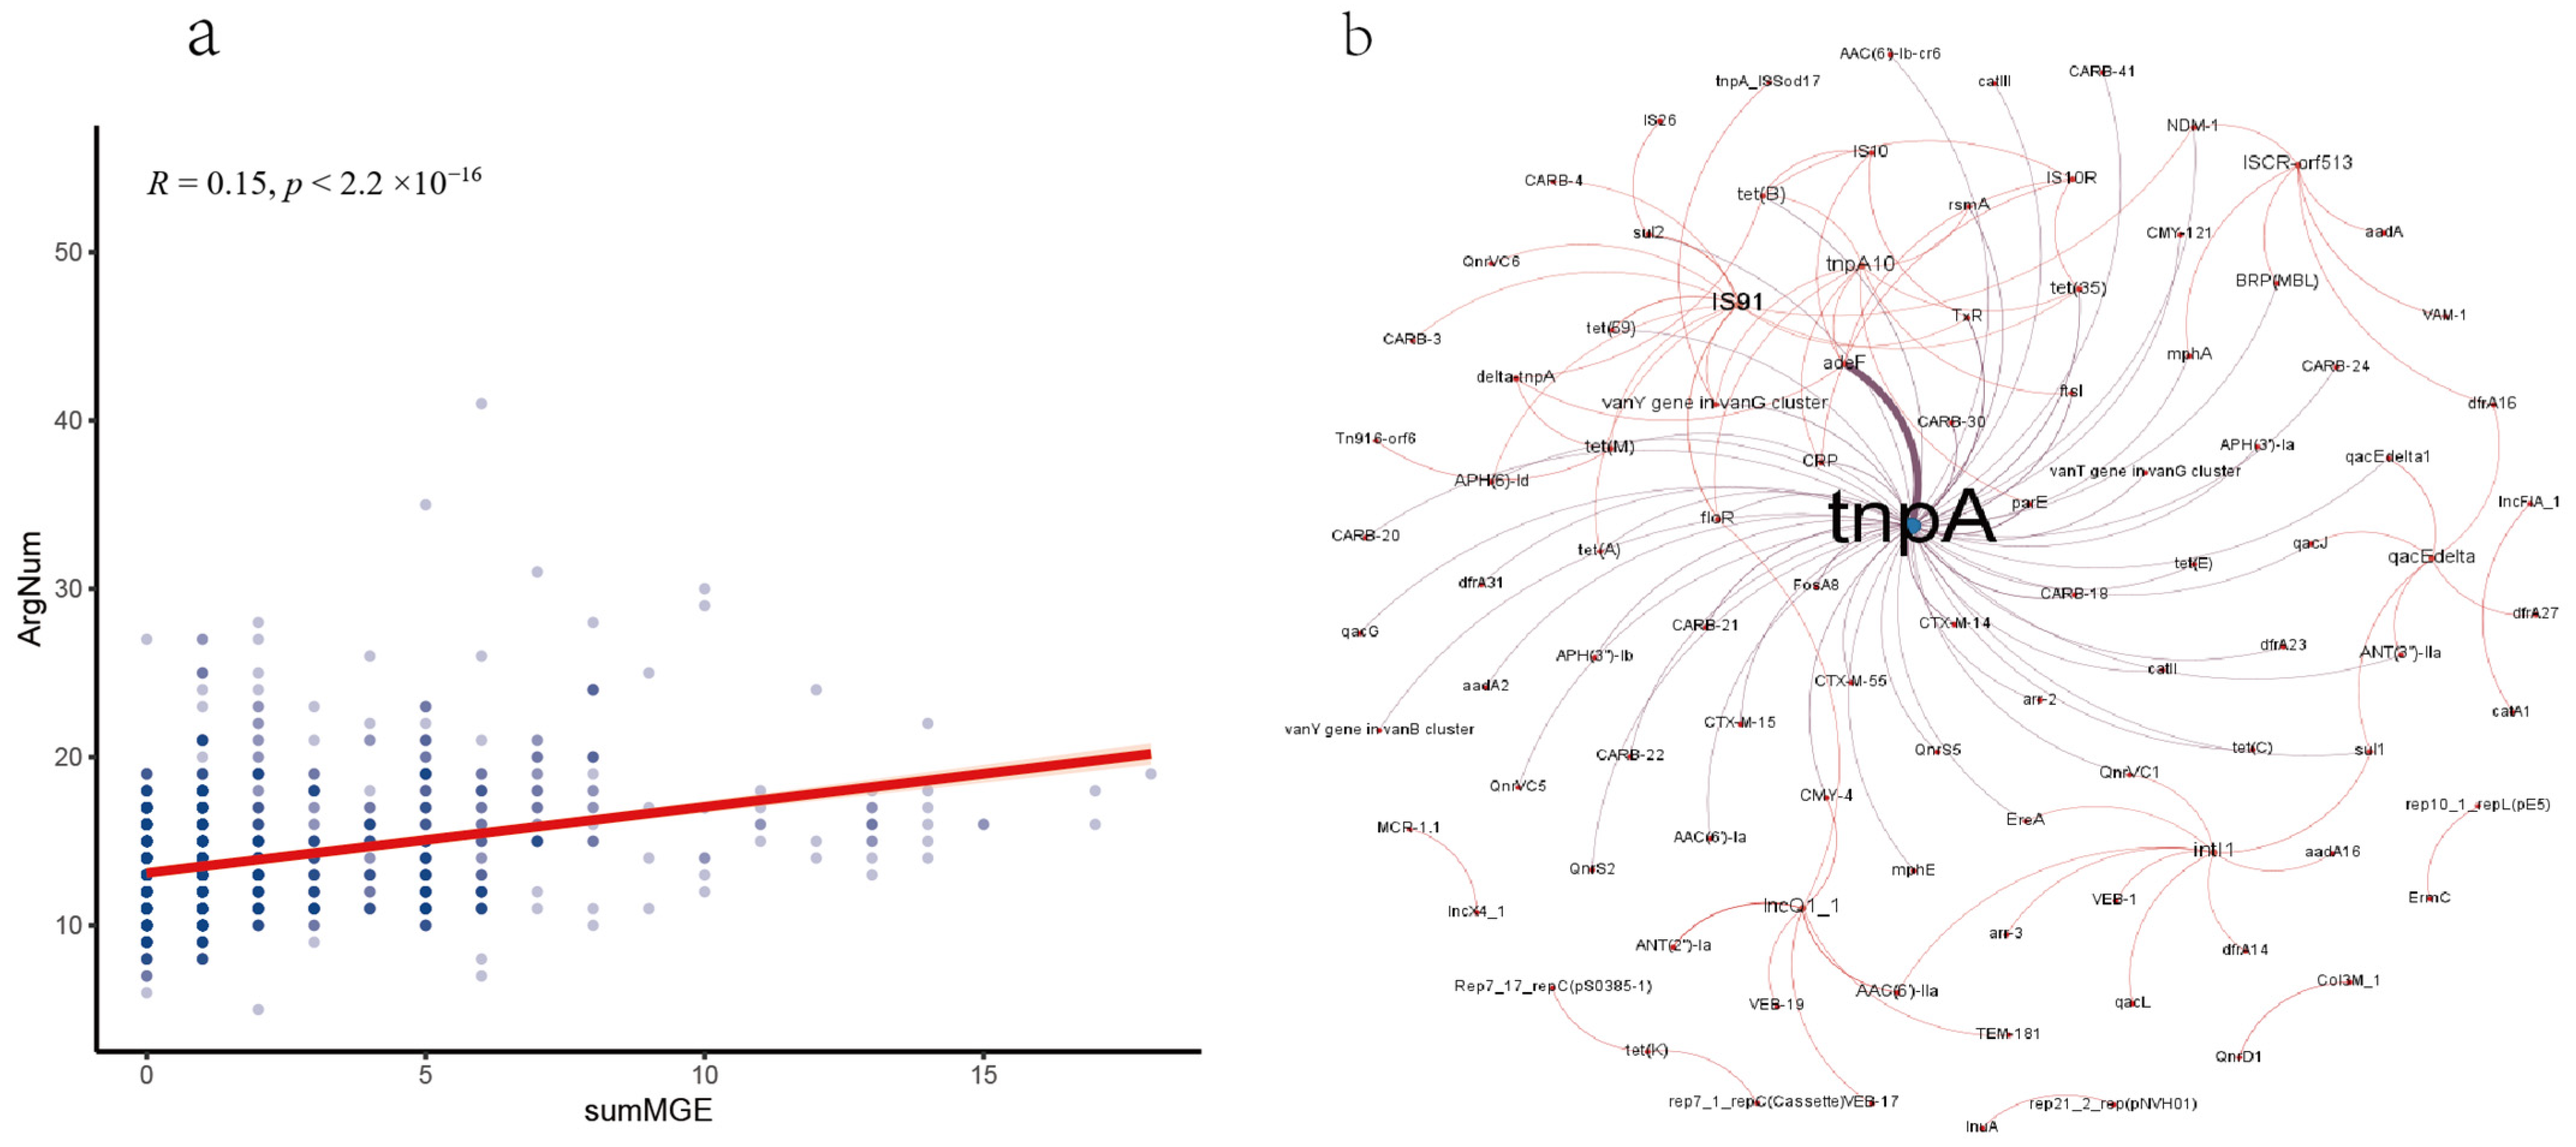
We analyzed the association between MGE number carried by each strain and their ARGs, and a statistical correlation between them was observed (R = 0. 15, p < 2.2 ×10⁻¹⁶) (Figure 4a). We then calculated the co-occurrence frequencies between ARGs and MGEs to construct a co-occurrence network, highlighting significant ARG–MGE pairs. Our analysis revealed that specific MGEs exhibited significant co-association with ARGs (Figure 4b). The MGE tnpA consistently co-occurred with the resistance genes adeF. The most frequently co-occurring MGEs included tnpA, IS91, and IncQ1.
Figure 4.
Association between antibiotic ARGs and MGEs. (a) The linear fitting between the number of ARGs and MGEs. (b) Co-occurrence networks of ARGs with MGEs.
2.7. Association Between ARGs and Plasmid Types
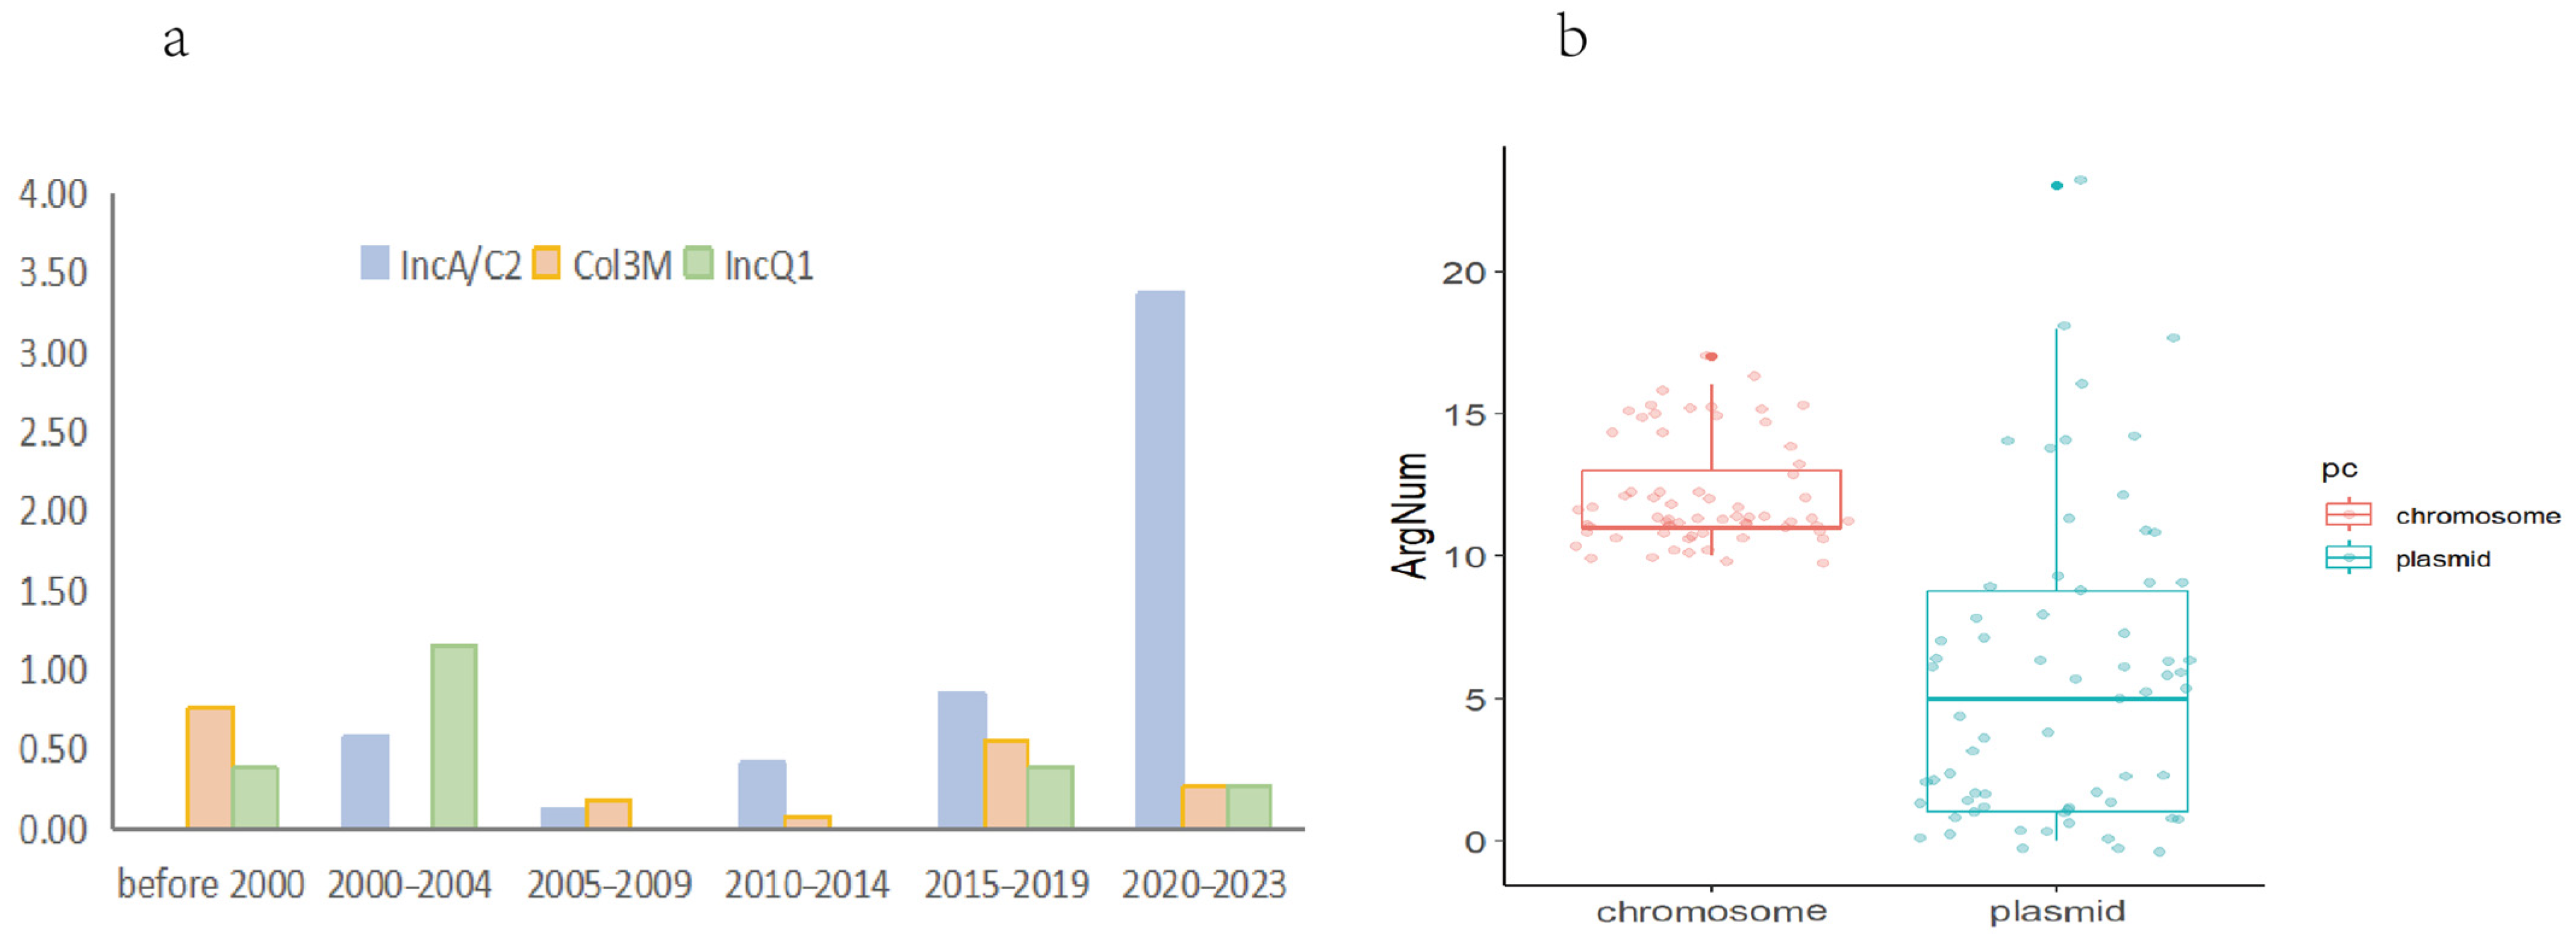
We first analyzed the plasmid content of the included strains. A total of 66 distinct plasmid sequences were identified, encompassing 16 plasmid replicon types. The distribution of plasmid types varied temporally. The proportion of plasmids across different time periods differed significantly (Chi-square test, p < 0.001; Figure 5a). The period from 2015 to 2019 contained the highest number of plasmids, with IncA/C2 being the dominant replicon type, followed by IncQ1 and Col3M. Between 2010 and 2014, which had the second-highest plasmid count, Col3M was the primary type, followed by rep7a.
Figure 5.
Distribution of plasmid types and comparative analysis of ARG loads between chromosomes and plasmids. (a) Temporal variation in plasmid composition. (b) Comparison of the number of ARGs (ARG count) located on chromosomes versus plasmids.
Regarding geographical origin, 50 plasmids were isolated from Chinese strains, four from United States strains, two from Vietnamese strains, and one each from German and Peruvian strains. Eight plasmids were from strains with an unspecified location.
As shown in the boxplot (Figure 5b), there is a significant difference in the number of ARGs per strain located on plasmids compared to those on chromosomes (Wilcoxon test, p < 0.05). The number of ARGs on plasmids is notably low, with eight plasmid sequences containing zero ARGs. Among plasmid types, IncA/C2 has a relatively higher number of ARGs, with 11 out of 29 IncA/C2 plasmids containing more ARGs than the chromosomes. For all other plasmid types, the number of ARGs on plasmids is lower than that on chromosomes.
2.8. Co-Occurrence of ARGs–Plasmids and ARGs–ARGs
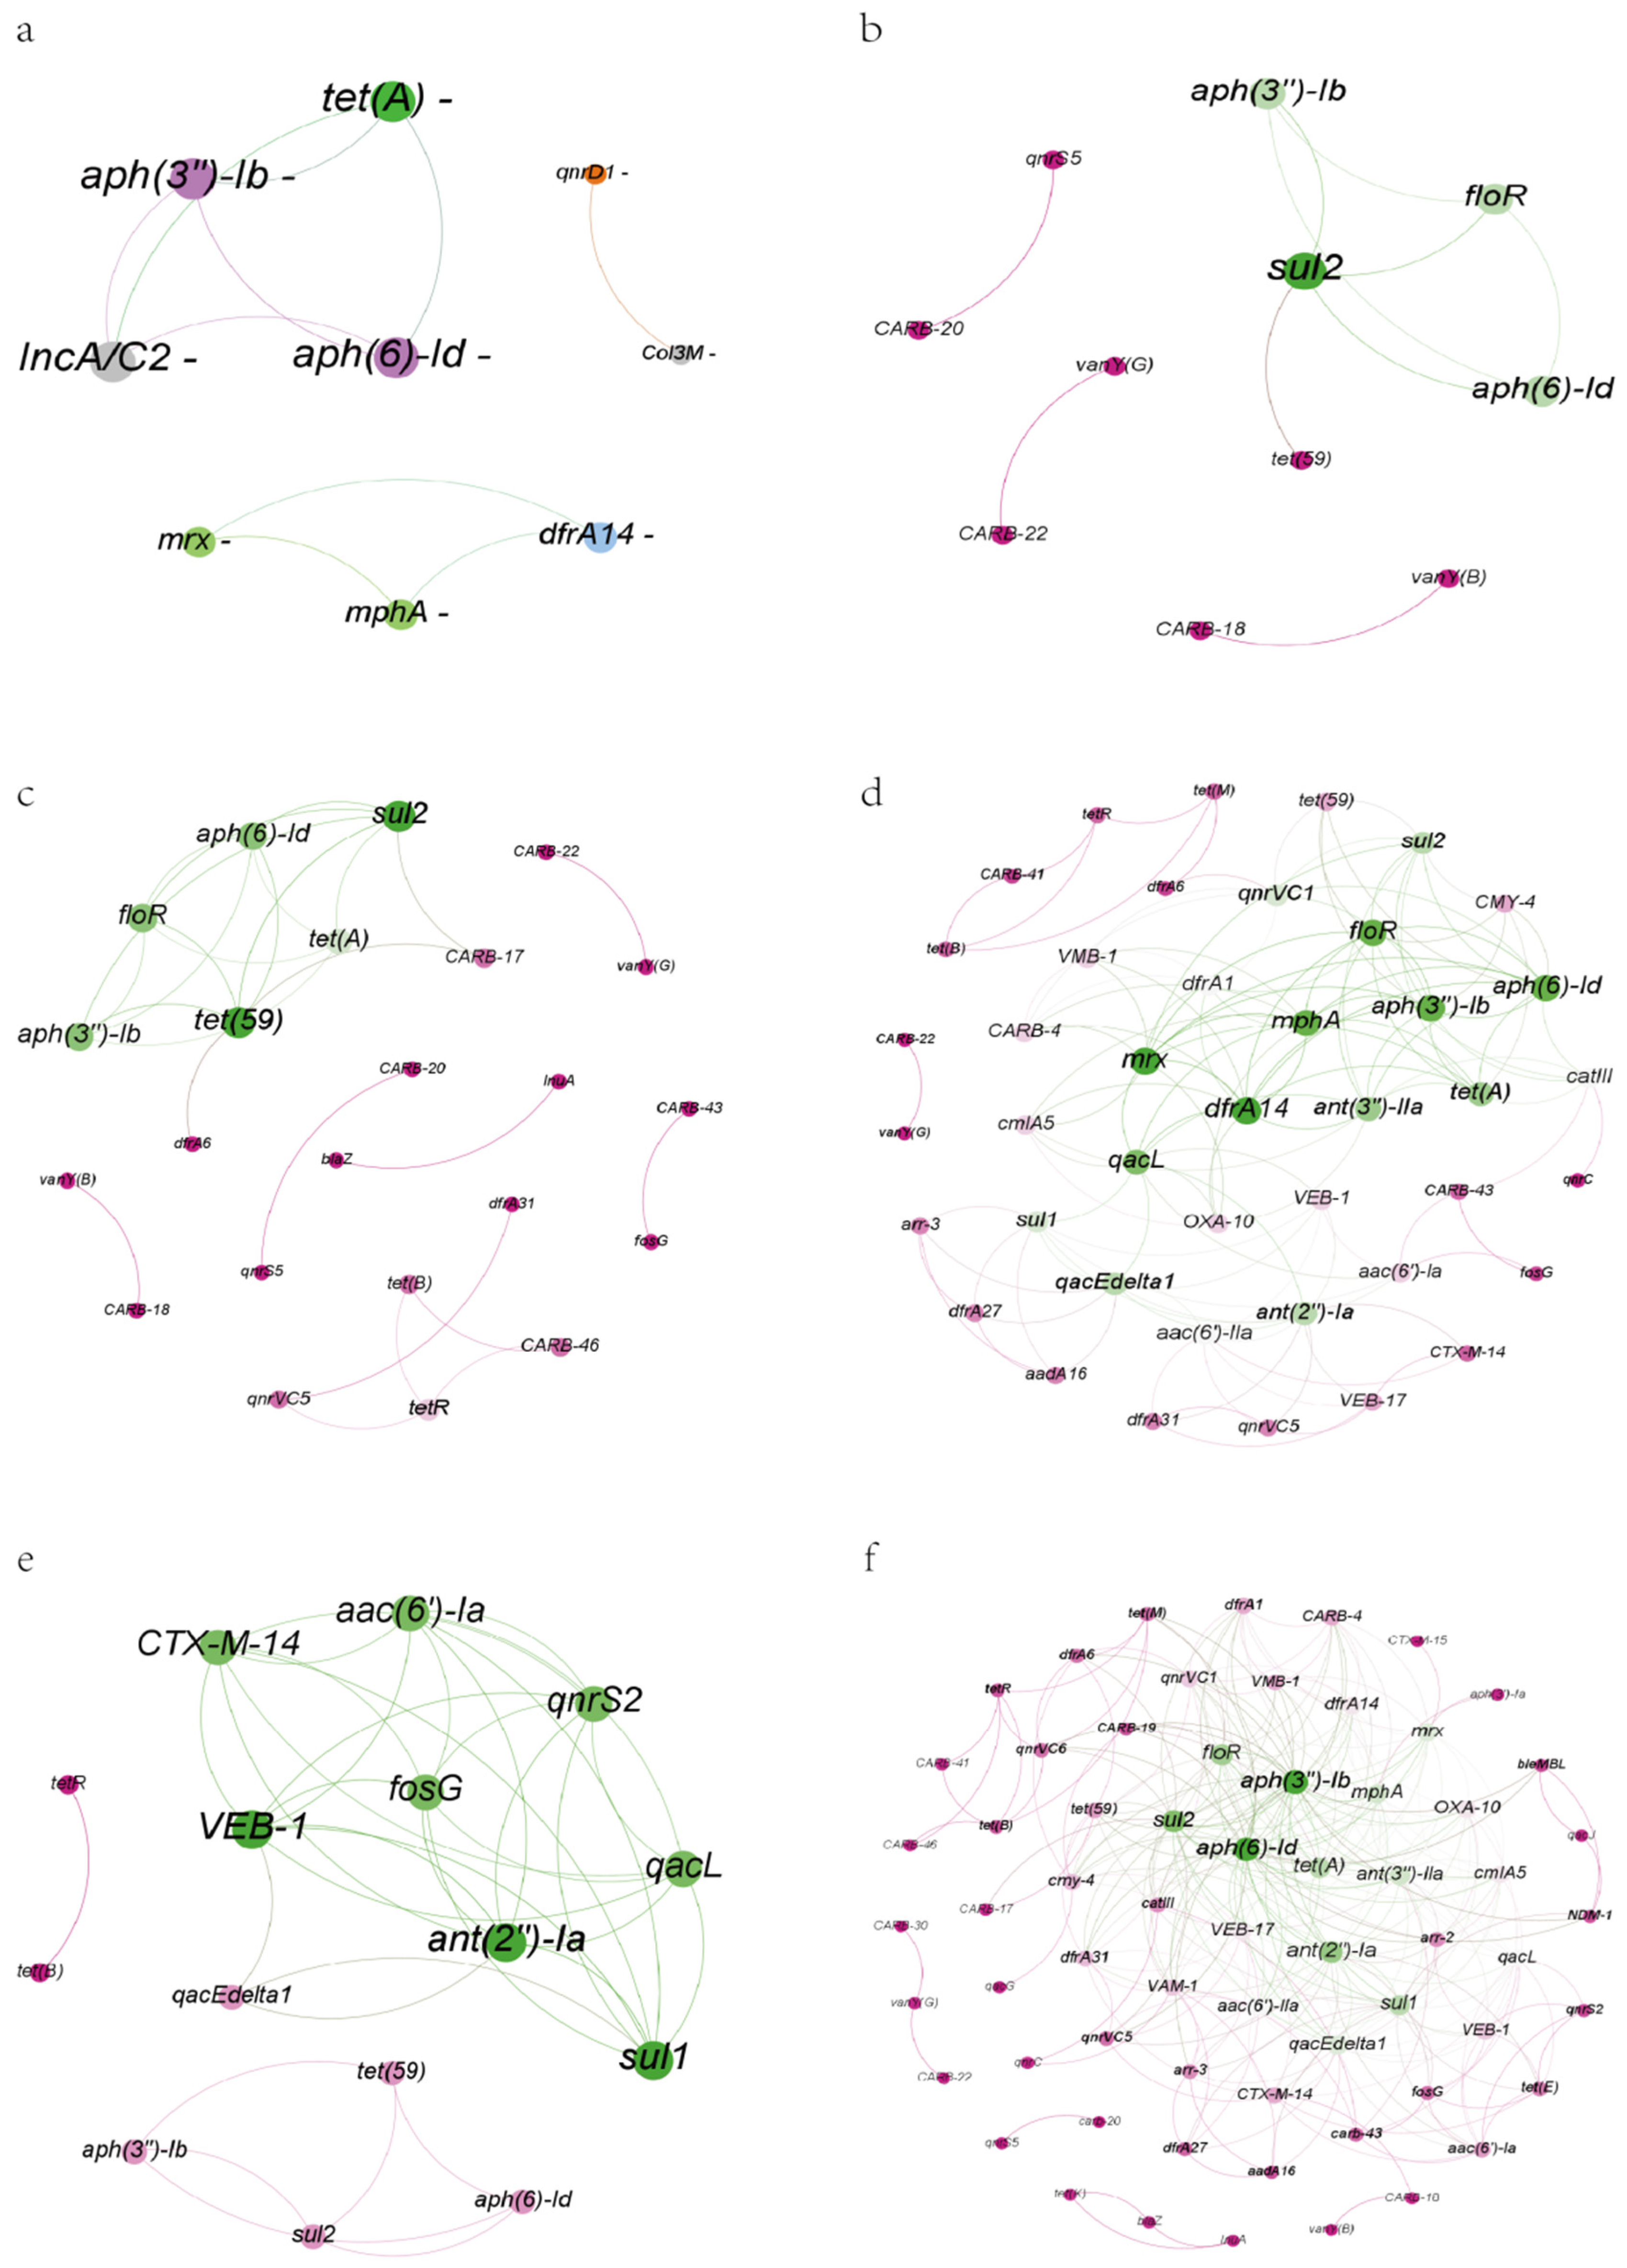
We calculated the co-occurrence frequencies between ARGs and plasmid replicons to construct a co-occurrence network, highlighting significant ARG–plasmid pairs. Specific plasmid replicons exhibited significant co-association with ARGs (Figure 6a). The replicon IncA/C2 consistently co-occurred with the aminoglycoside resistance genes aph(6)-Id and aph(3″)-Ib, as well as the tetracycline resistance gene tet(A). Col3M was strongly linked to the fluoroquinolone resistance gene qnrD1. Additionally, a cluster of ARGs, including the macrolide resistance genes mphA and mrx, along with the diaminopyrimidine resistance gene dfrA14, showed tight co-occurrence.
Figure 6.
Co-occurrence networks of ARGs with plasmids and among ARGs. (a) Network showing significant co-occurrence between ARGs and plasmid replicons. (b–f) Temporal dynamics of ARG co-occurrence networks among strains. Nodes represent ARGs. Strains are grouped by sampling period: (b) 2005–2009, (c) 2010–2014, (d) 2015–2019, (e) 2020–2023. (f) The overall ARG co-occurrence network across all strains. Edge color corresponds to the connected node pair, and edge width is proportional to the connection weight calculated by Roary.
The ARG co-occurrence network is presented in Figure 6f. The full network comprised a total of 307 co-occurring ARG pairs. The most frequently co-occurring ARGs included aph(6)-Id, aph(3″)-Ib, sul2, ant(2″)-Ia, floR, tet(A), sul1, ant(3″)-IIa, and mphA.
The number of ARG–ARG co-occurrences increased progressively over time. No co-occurrences were detected in strains from before 2000 or from 2000 to 2004. The 2005–2009 period contained smaller clusters, with only 10 co-occurring ARG pairs, primarily featuring sul2, aph(6)-Id, aph(3″)-Ib, and floR. Connections became denser in the 2010–2014 period, with the number of pairs increasing to 27; tet(59) and tet(A) emerged as newly observed ARGs in the network. The 2015–2019 period exhibited the densest connectivity, with co-occurring ARG pairs peaking at 132. Subsequently, from 2020 to 2023, the number declined to 38 pairs. The predominant co-occurring ARGs in this most recent period were ant(2″)-Ia, VEB-1, sul1, CTX-M-14, aac(6′)-Ia, fosG, qnrS2, and qacL.
2.9. Global Assessment of Resistance Risk in V. parahaemolyticus Genomes
Based on the genomic resistance risk classification, 3.29% (321/9757), 2.36% (230/9757), and 2.18% (213/9757) of the strains were assigned to risk Rank I (highest), Rank II, and Rank III, respectively. The vast majority (95.18%; 9287/9757) were only assigned under Rank IV, representing the lowest risk level. The prevalence of genes conferring Rank I and II risk increased in strains collected prior to 2020, indicating a temporal rise in genomic resistance risk. The proportions of strains categorized as Rank I and II varied significantly across different time periods (Chi-square test, p < 0.001). The highest proportions were observed during 2015–2019, reaching 8.28% and 6.88% for Rank I and II, respectively. These levels were comparatively lower in all other periods.
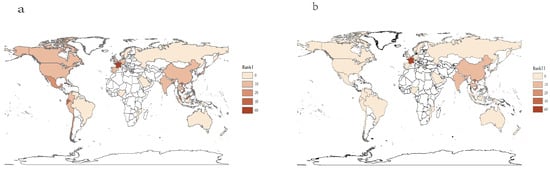
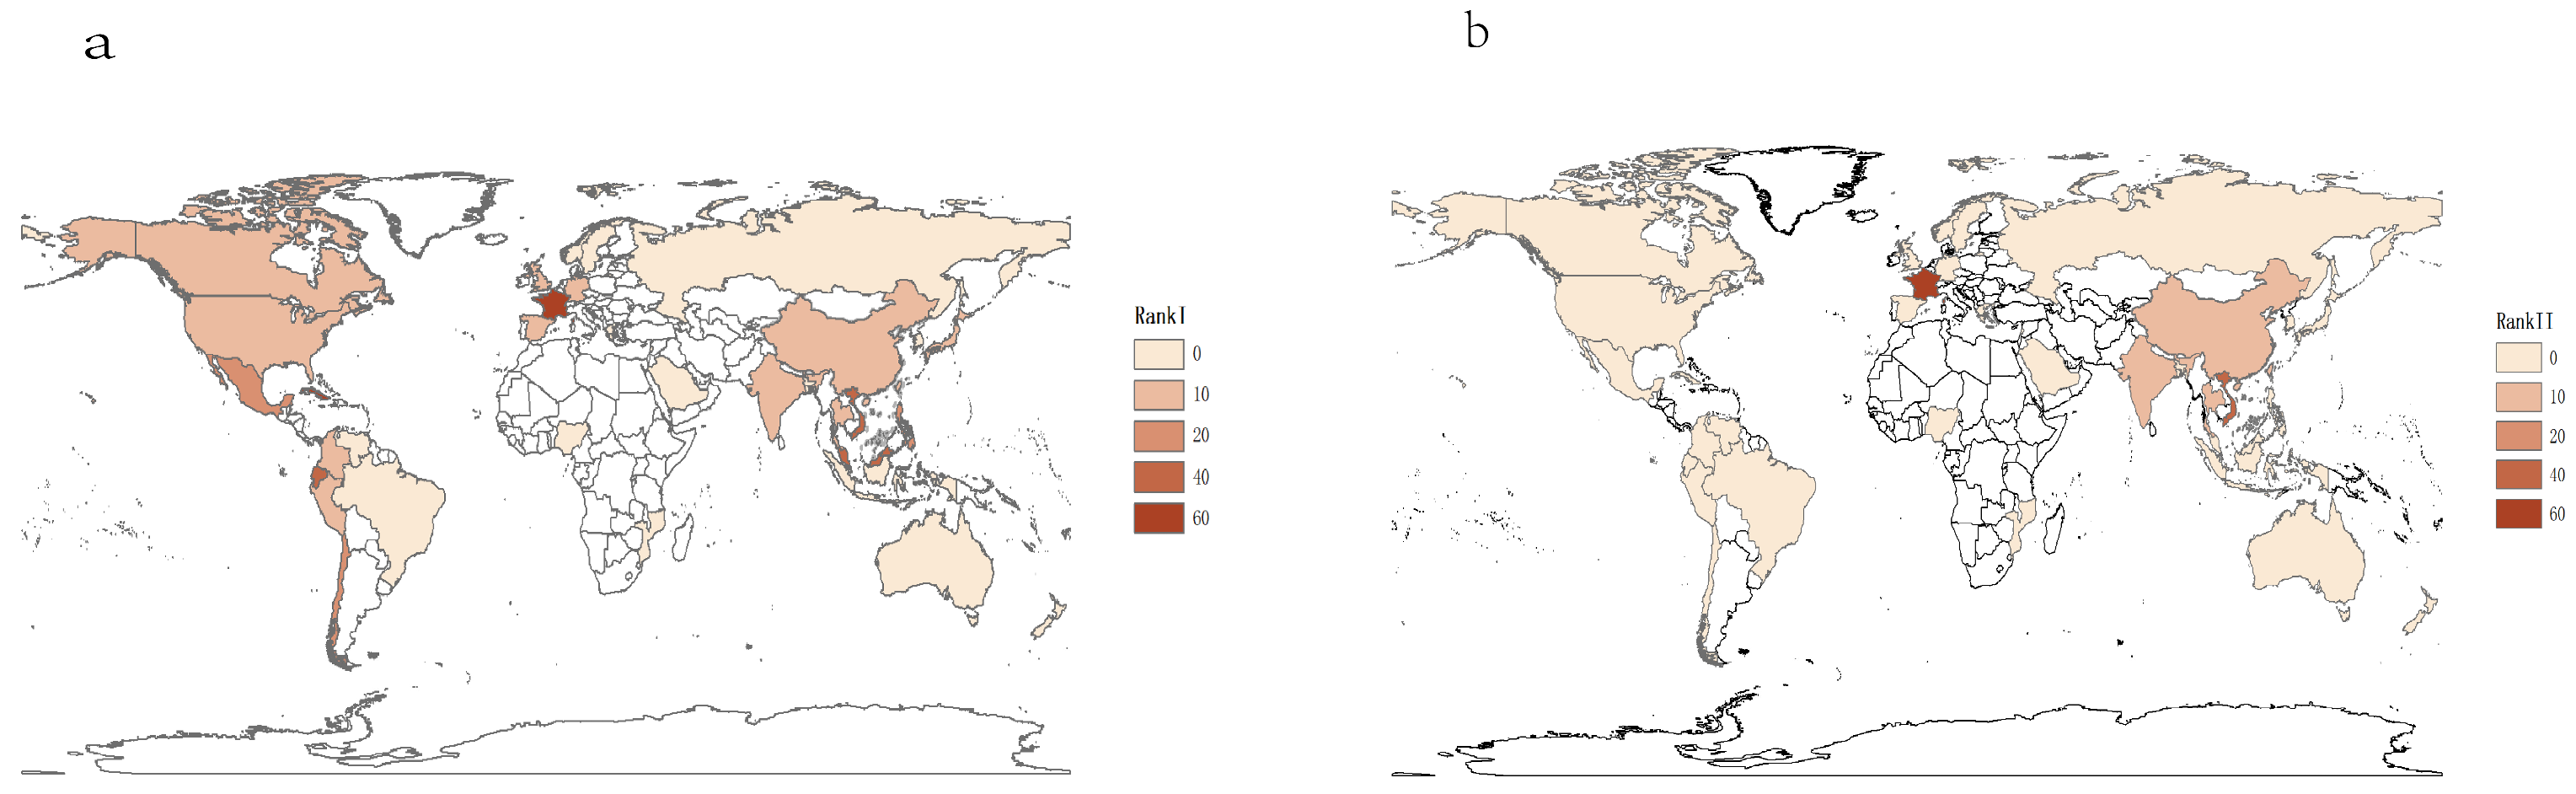
Of the 38 countries and regions from which strains originated, 18 recorded a zero prevalence of Rank I risk strains, and 33 recorded a zero prevalence of Rank II risk strains. The highest proportion of Rank I strains was observed in the Atlantic Ocean (66.67%). Countries/regions with a Rank I proportion exceeding 10% are listed in descending order: France (Europe, 60%), Cuba (North America, 50%), Ecuador (South America, 33.33%), Vietnam (Asia, 24.44%), Malaysia (Asia, 21.82%), Mexico (North America, 18.52%), Chile (South America, 12.5%), and the Philippines (Asia, 12.5%). Only five countries/regions reported Rank II strains: France (Europe, 60%), Vietnam (Asia, 24.44%), India (Asia, 10%), Thailand (Asia, 8.09%), and China (Asia, 3.72%). This indicates that the global antibiotic resistance risk posed by V. parahaemolyticus remains low in most areas, with many facing neither a present (Rank I) nor a future (Rank II) threat (Figure 7). China and the United States, which contributed the largest number of samples, showed markedly low proportions: Rank I strains accounted for 3.99% and 0.99%, and Rank II strains for 3.72% and 0%, respectively.
Figure 7.
Geographic distribution of ARG-associated risk levels of V. parahaemolyticus. (a) Geographic distribution of Rank I of V. parahaemolyticus. (b) Geographic distribution of Rank II of V. parahaemolyticus.
The prevalence of Rank I strains differed substantially by isolation source. The highest proportion was found in food and aquatic animals (9.04%), followed by environmental sources (3.62%), and the lowest in patients (0.59%). A similar trend was observed for Rank II risk, with the highest proportion again in food and aquatic animals (7.13%), then environmental sources (2.59%), and the lowest in patients (0.08%).
3. Discussion
The ARGs carried by V. parahaemolyticus primarily confer resistance to penams, which aligns with global antibiotic usage patterns [28]. A study conducted in 2022 that collected the data for the global use of antibiotics indicated that penam (55.25%) and cephalosporins (13.07%), two beta-lactam antibiotics, were used the most [26]. A study conducted in 2024 also reported that the V. parahaemolyticus isolated from aquatic foods in 15 provinces, China, 2020, exhibited the highest resistance to ampicillin (a penam) and cefazolin (a cephalosporin) [29], although the overall level of antimicrobial resistance was assessed as moderate [29]. A study conducted in 2023 reported a significant increase in the quantity of ARGs among V. parahaemolyticus in recent decades worldwide [30]. However, this trend appears to have stabilized since 2020, a change potentially attributable to enhanced antimicrobial control measures. We know that important diarrhea-causing bacteria such as Enterobacteriaceae, including E. coli, Salmonella, and Shigella, often possess a rich variety and large number of ARGs [31,32,33]. Compared to these bacteria, V. parahaemolyticus also exhibits antibiotic resistance issues and possesses a similarly abundant variety and number of ARGs.
To identify genetic differences across multiple bacterial strains, we employed a pan-genomics approach [34]. The pan-genome curve, which reflects the potential of a species to acquire new genes [35], informed our analysis. Building on this, we applied the concept of the pan-resistome—an extension of pan-genomics into antimicrobial resistance research, defined as the complete set of ARGs present within all strains of a bacterial species [22]. Our pan-resistome analysis revealed that the number of detected ARGs increased with sample size.
The sensitivity analysis revealed a complex geographic stratification pattern: China showed a negative year-ARG correlation, the US showed a positive correlation, and excluding both countries revealed a positive trend among remaining nations. We interpret this as follows: First, China’s negative correlation likely reflects a combination of improved antimicrobial stewardship since 2017 and a temporal shift in sequencing focus from clinical outbreak strains (high ARG) to broader environmental/food surveillance (lower ARG). Second, the US positive correlation aligns with ongoing intensification of aquaculture and clinical surveillance, consistent with the North American trend reported in prior studies. Third, the positive correlation among non-China/US countries (many in Southeast Asia with expanding aquaculture) confirms that the global AMR challenge is real and regionally variable. Crucially, this geographic heterogeneity does not undermine but rather enriches our study’s conclusions; it demonstrates that V. parahaemolyticus AMR evolution follows distinct regional trajectories shaped by local policy, farming practices, and surveillance history.
The principal virulence factors of V. parahaemolyticus, the thermostable direct hemolysin (TDH) and TDH-related hemolysin (TRH), were first identified in the late 1980s [36,37]. Strains carrying the tdh and/or trh genes, which encode these toxins, are traditionally considered virulent and remain the most well-characterized pathogenic markers [38]. In our collection, 99.59% of strains were pathogenic based on this genetic definition. Pathogenic strains harbored a significantly higher number of ARGs than non-pathogenic ones. The ARGs that showed significant differential abundance between the two groups included vanY(G), adeF, tet(35), TxR, CARB-18, CARB-22, sul2, tet(59), aph(3″)-Ib, aph(6)-Id, tet(B), tetR, tet(A), and qnrVC1.
A correlation was also observed between the abundance of ARGs and the sequence type (ST) profile of the strains. ST3 (clonal complex 3) was the most frequently detected, consistent with its status as the predominant sequence profile in V. parahaemolyticus. The prevalence of ST36 increased after 2020. In general, STs that were more prevalent across most time periods carried a relatively higher number of ARGs. These findings highlight specific STs (e.g., ST3, ST36) that merit increased surveillance due to their association with higher ARG burdens. Analysis of ARG prevalence per ST over time revealed a marked increase in ST3, ST36, ST631, ST120, and ST43. Owing to differences in their genetic characteristics, the geographic distribution of STs varied substantially. Furthermore, ARG enrichment patterns varied across STs, with each ST harboring a distinct repertoire of resistance genes beyond the constitutive resistance gene set.
The majority of plasmid sequences originated from China, consistent with the fact that 52% of the bacterial strains were isolated in China. Accordingly, the high concentration of Chinese plasmid sequences should not be interpreted as higher biological prevalence; it is at least partly, and possibly largely, due to the geographic composition of public sequence databases. This study cannot separate biological signal from sampling/deposition bias. Although resistance plasmids in V. parahaemolyticus have been detected worldwide, their prevalence and ubiquity are far from reaching the levels observed in enteric bacteria such as Salmonella [39]. The number of ARGs differed significantly between plasmids and chromosomes in V. parahaemolyticus. ARG distribution varied markedly between these genetic elements, with plasmids carrying notably fewer ARGs overall. This low prevalence of plasmid-borne ARGs suggests that plasmids currently pose a limited threat as vectors for disseminating antimicrobial resistance in this species. Among plasmid types, IncA/C2 harbored relatively more ARGs than other types. The prevalence of plasmids also varied significantly across different time periods. The highest plasmid count occurred from 2015 to 2019, with the IncA/C2 type being dominant, followed by IncQ1 and Col3M. During 2010–2014, plasmid counts were ranked second, with Col3M being the most common type, closely followed by rep7a. Overall, plasmids were relatively uncommon in V. parahaemolyticus, and most plasmid-carrying strains originated from China, which also accounted for the highest number of detected plasmids. The capacity of plasmids to harbor ARGs, along with temporal shifts in predominant plasmid types, underscores the importance of incorporating plasmid surveillance into antimicrobial resistance monitoring programs. Our analysis identified specific plasmid replicons that frequently co-occur with ARGs, notably IncA/C2 and Col3M, which warrant particular attention in resistance surveillance. Furthermore, co-occurrence networks were also observed among ARGs themselves, with the number of such ARG–ARG associations increasing over time.
The use of antibiotics exerts selective pressure that drives the development of antimicrobial resistance (AMR) in pathogenic bacteria [40,41]. In our study, the number of ARGs was positively correlated with the abundance of MGEs), suggesting that MGEs play a significant role in disseminating ARGs in V. parahaemolyticus—a finding consistent with previous reports [26,30]. Our ARG–MGE co-occurrence network further revealed that specific MGEs exhibited significant co-association with ARGs. Therefore, we infer that horizontal gene transfer (HGT) of ARGs via MGEs significantly impedes the containment of antimicrobial resistance, with tnpA playing a central role. The tnpA consistently co-occurred with the resistance genes adeF.
Our analysis revealed that 95.18% of the strains were categorized within Risk Level IV, indicating the lowest risk tier. An increasing trend in the abundance of strains classified under the higher-risk Ranks I and II was observed prior to 2020, suggesting a growing antimicrobial resistance risk over time. The highest proportions of strains belonging to Ranks I and II were detected during the period 2015–2019.
The global risk of antimicrobial resistance in V. parahaemolyticus currently does not appear to be high, as many countries and regions show negligible prevalence of high-risk strains (Rank I or II). In regions where higher-risk strains are reported, findings should be interpreted with caution due to limited sample sizes. Notably, in China and the United States—the two countries contributing the largest number of strains—the proportions of Rank I and II strains remain low.
The distribution of high-risk strains varied substantially by source. For both Rank I and Rank II, the highest proportions were found in strains from food and aquatic animals, followed by environmental sources, with clinical patient strains showing the lowest proportions. This is of particular concern given that V. parahaemolyticus is primarily transmitted through the consumption of contaminated raw or undercooked seafood [42,43]. The widespread use of antibiotics in aquaculture may drive the selection and accumulation of multidrug-resistant strains [44]. Consequently, the transmission of ARGs through the food chain represents a serious and growing threat to public health, underscoring the critical need for enhanced surveillance of ARGs in food and aquatic animal sources.
3.1. Added Value of This Study
This study presents the largest genomic analysis of V. parahaemolyticus antimicrobial resistance to date, covering 9757 high-quality genomes from 1950 to 2023. Its principal novelty lies in performing the first comprehensive resistance risk assessment for this species, which moves beyond simple ARG detection and shows that food and aquatic animal sources, rather than clinical specimens, disproportionately harbor high-risk strains. Building on this, plasmid-replicon profiling identifies IncA/C2 and Col3M as mobile vectors carrying high-risk ARGs. At the same time, geographic-stratified analysis reveals a tripartite year–ARG correlation pattern across China, the US, and remaining nations, pointing to distinct regional drivers behind these trends. Temporal multi-layer co-occurrence networks further track the progression of ARG–ARG pairing from 2005 to 2019, adding a time-resolved layer to the analysis, and ST-specific profiling documents hyper-resistant clone expansion (ST3, ST36), offering a new angle for tracking resistant clones.
3.2. Limitations of the Study
Although this study systematically characterized the spatiotemporal evolution and transmission mechanisms of ARGs in V. parahaemolyticus based on the largest genomic dataset to date, several limitations remain. First, the geographical distribution of samples is highly concentrated in China and the United States, with insufficient representation from other regions—particularly Southeast Asia, South Asia, and Africa, where aquaculture is active but surveillance is weak. This may lead to an underestimation of global ARG diversity and the spread of high-risk clones. Second, although multiple lines of evidence can guide surveillance prioritization without phenotypic data, they cannot replace direct validation. Using only public genomic sequences and lacking paired phenotypic susceptibility data, this study cannot directly validate predicted ARG function or their relevance to clinical or environmental resistance phenotypes. In addition, although we identified extensive colocalization between MGEs and ARGs, the horizontal transfer capabilities of these elements were not experimentally confirmed (e.g., via conjugation assays or plasmid curing), and thus the relevant inferences remain at the level of bioinformatic prediction. Future studies should integrate multi-omics data with functional validation to more comprehensively elucidate the mechanisms underlying antimicrobial resistance in V. parahaemolyticus.
4. Materials and Methods
4.1. Data Collection
A total of 10,049 V. parahaemolyticus genomes were retrieved from the NCBI Assembly database for genomic analysis (data accessed January 2024; see Table S1, Supporting Information). Genome quality control was performed using fastANI (version 1.34), QUAST (version 5.2.0), and Kraken2 (version 2.1.3). The following criteria were applied: (1) an average nucleotide identity (ANI) of ≥95% to reference genomes; (2) an N50 value greater than 10 kbp as previously described [45]; and (3) a Kraken2-based estimated contamination rate of ≤5%. Following this stringent filtering, 9757 high-quality genomes were retained for subsequent analysis, representing a refined subset of the original dataset (see Table S1, Supporting Information).
4.2. Pathogenic Strains Identification
Pathogenic strains of V. parahaemolyticus were identified based on the presence of tdh and/or trh, whereas those negative for both genes were considered non-pathogenic. The tdh and trh gene sequences retrieved from NCBI were used to create a local BLAST (version 2.10.1) database, with matches requiring ≥90% identity and ≥80% query coverage.
4.3. Analysis of ARG-MGE and ARG-Plasmid Co-Occurrence
We used RGI (version 6.0.3) to analyze ARGs. ARGs were identified using the ‘Perfect’ and ‘Strict’ paradigms, and hits classified as ‘Loose’ were excluded. We also used the MGE database (https://github.com/KatariinaParnanen/MobileGeneticElementDatabase; accessed on 30 December 2025) to compare MGEs via blastn. If an ARG and an MGE are on the same sequence and within a distance of 50 kb, then they are considered to co-occur. We employed a replicon-based method PlasmidFinder (version 2.1.6) and genomic features-based method Plasmer (version 0.1) to identify plasmid sequences. We used Discover (Discrete Independence Statistic Controlling for Observations with Varying Event Rates) package v.0.9.3, a statistical independence test, to identify the pairwise co-occurrence of ARGs and plasmid replicons in the genomes [46]. This package assesses pairwise co-occurrence by counting how many genomes have both of the two genes and comparing this to the number of genomes expected to have such an overlap by chance if these genes were independent. In short, Discover identifies more significant co-occurrences without increasing the false positive rate [24]. Based on the co-occurrence results, gene association networks were constructed in Gephi v0.10.1 [47]. Networks were generated separately for strains grouped by sampling period. In each network, nodes represent genes and edges denote significant co-occurrence relationships. Edge width corresponds to the connection weight, reflecting the strength of association between two nodes.
4.4. Antibiotic Resistance Gene Risk Assessment
ARGs are widespread among bacteria. However, not all ARGs pose serious threats to public health, highlighting the importance of identifying those that are high-risk. Here, Zhang et al. [48] designed an ARG risk ranking framework to evaluate ARG risk considering several factors, including human-associated-enrichment (I), gene mobility (II), and host pathogenicity (III). This simple framework yields four risk categories. ARGs that do not meet the first criterion are assigned to Rank IV (lowest risk); those that meet the first, but not the second, are assigned to Rank III; those that meet the first and second but not the third, Rank II; and those that meet all three criteria, Rank I (the highest risk). The framework aimed to evaluate the potential transfer and dissemination of an ARG into human pathogens, as it represented the potential risk of an ARG to human health and the priority of an ARG to be controlled. To determine whether the genes identified as ARGs pose a health risk to human beings, we used the bioinformatics tool arg_ranker (v3) (https://github.com/caozhichongchong/arg_ranker; accessed on 10 September 2024), to detect ARGs and evaluate the risk of ARGs in the genome. For each genome, ARGs were first predicted and then assigned by arg_ranker to one of four risk ranks according to three criteria: (i) human-associated enrichment, (ii) gene mobility, and (iii) host pathogenicity. Specifically, ARGs that did not meet criterion (i) were assigned to Rank IV (lowest risk); those that met criterion (i) but not (ii) were assigned to Rank III; those that met criteria (i) and (ii) but not (iii) were assigned to Rank II; and those that met all three criteria were assigned to Rank I (highest risk). The risk maps were generated using ArcMap v.10.4.1 (ESRI Inc., Redlands, CA, USA), with geographic layers obtained from https://l7.antv.antgroup.com/ (accessed on 30 March 2026).
4.5. Statistical Analysis and Visualization
Statistical analyses were performed using R (version 4.3.2). Spearman’s correlation was employed to assess the associations between the number of ARGs in V. parahaemolyticus strains and the abundance of MGEs. To compare ARG numbers across groups defined by time period, geographic region, and isolation source, we identified ARGs that differed significantly among these categories. We also assessed associations between ARGs and bacterial sequence types (STs). For statistical testing, the Wilcoxon rank-sum test was used for two-group comparisons, and the Kruskal–Wallis rank-sum Test for multi-group comparisons. Enrichment of individual ARGs across sources or regions was evaluated using the hypergeometric test. Differences in plasmid prevalence over time were examined with the Pearson’s Chi-squared Test. All figures, including ARG accumulation curves and two-way hierarchical clustering heatmaps of ARGs versus strains, were generated using the ggplot2 (version 3.4.4) package in R (version 4.3.2).
5. Conclusions
This study conducted a longitudinal analysis of AMR trends in globally collected V. parahaemolyticus strains (1950–2023). Overall, the abundance of ARGs shows a temporal increase, but their temporal dynamics exhibit regional heterogeneity. Pan-resistome analysis revealed a continuous expansion in the profile of ARGs. This pathogen’s increasing acquisition of ARGs is also mediated by MGEs, among which tnpA was the most common. The number of ARGs in the five major STs increased over time, and the distribution of STs varied by region and each ST harboring a distinct repertoire of resistance genes beyond the constitutive resistance gene set. Persistently prevalent STs generally harbored a higher number of ARGs, with particular attention warranted for highly resistant STs such as ST3 and ST36. Notably, pathogenic strains carried a significantly higher ARG burden compared to non-pathogenic strains. Plasmids were found to be relatively uncommon in V. parahaemolyticus, and the vast majority of plasmid-carrying strains have been isolated and reported in China. Specific plasmid replicons, including IncA/C2 and Col3M, which frequently co-occurred with ARGs, merit focused surveillance. Overall, the global antibiotic resistance risk associated with V. parahaemolyticus currently remains relatively low, with most countries not facing an immediate threat from high-risk (Rank I or II) strains. However, the distribution of risk ranks varied across isolation sources. Strains from food and aquatic animal sources exhibited the highest proportion of Rank I and II strains, highlighting the need to prioritize monitoring of ARGs in these reservoirs.
Supplementary Materials
The following supporting information can be downloaded at: https://www.mdpi.com/article/10.3390/antibiotics15111081/s1, Figure S1: Pan-resistome accumulation curves stratified by geographic region. Figure S2: Correlation between ARG counts and isolation year stratified by geographic region. Table S1: Original dataset and quality-controlled dataset used in this analysis.
Author Contributions
CRediT authorship contribution statement: L.H.: Writing—review and editing, writing—original draft, visualization, methodology, formal analysis, data curation, and conceptualization. X.F.: Funding acquisition. Y.W.: Data curation. X.W.: Data curation. B.P.: Data curation and writing—review and editing. Z.L.: Data curation, writing—review and editing, and visualization. X.L.: Supervision. S.Z.: Resources. B.K.: Project administration, writing—review and editing, and conceptualization. All authors have read and agreed to the published version of the manuscript.
Funding
This research received no external funding.
Institutional Review Board Statement
Not applicable.
Informed Consent Statement
Not applicable.
Data Availability Statement
The datasets generated and analyzed during the current study are available in Table S1, Supporting Information.
Acknowledgments
This research was supported by National Key Infectious Disease and Vector Surveillance Program. We are also very grateful for the helpful inputs from the Editor and anonymous reviewers.
Conflicts of Interest
The authors declare that they have no known competing financial interests or personal relationships that could have appeared to influence the work reported in this paper.
References
- Yeung, P.S.M.; Booor, K.J. Epidemiology, pathogenesis, and prevention of foodborne Vibrio parahaemolyticus infections. Foodborne Pathog. Dis. 2004, 1, 74–88. [Google Scholar] [CrossRef] [Scilit] [PubMed]
- Martinez-Urtaza, J.; Baker-Austin, C. Vibrio parahaemolyticus. Trends Microbiol. 2020, 28, 867–868. [Google Scholar] [CrossRef] [Scilit] [PubMed]
- Fearnley, E.; Leong, L.E.X.; Centofanti, A.; Dowsett, P.; Combs, B.G.; Draper, A.D.K.; Hocking, H.; Howden, B.; Horan, K.; Wilmot, M.; et al. Vibrio parahaemolyticus Foodborne Illness Associated with Oysters, Australia, 2021–2022. Emerg. Infect. Dis. 2024, 30, 2271–2278. [Google Scholar] [CrossRef] [Scilit] [PubMed] [PubMed Central]
- Elmahdi, S.; DaSilva, L.V.; Parveen, S. Antibiotic resistance of Vibrio parahaemolyticus and Vibrio vulnificus in various countries: A review. Food Microbiol. 2016, 57, 128–134. [Google Scholar] [CrossRef] [Scilit] [PubMed]
- Jo, S.; Shin, C.; Shin, Y.; Kim, P.H.; Park, J.I.; Kim, M.; Park, B.; So, J.S. Heavy metal and antibiotic co-resistance in Vibrio parahaemolyticus isolated from shellfish. Mar. Pollut. Bull. 2020, 156, 111246. [Google Scholar] [CrossRef] [Scilit] [PubMed]
- Chen, M.; Pang, B. Characteristics and mechanisms of antibiotic resistance of Vibrio parahaemolyticus. Dis. Surveill. 2018, 33, 6. [Google Scholar] [CrossRef]
- Tokuda, M.; Shintani, M. Microbial evolution through horizontal gene transfer by mobile genetic elements. Microb. Biotechnol. 2024, 17, e14408. [Google Scholar] [CrossRef] [Scilit] [PubMed] [PubMed Central]
- Sher, S.; Richards, G.P.; Parveen, S.; Williams, H.N. Characterization of Antibiotic Resistance in Shewanella Species: An Emerging Pathogen in Clinical and Environmental Settings. Microorganisms 2025, 13, 1115. [Google Scholar] [CrossRef] [Scilit] [PubMed] [PubMed Central]
- Obaidat, M.M.; Salman, A.E.B.; Roess, A.A. Virulence and Antibiotic Resistance of Vibrio parahaemolyticus Isolates from Seafood from Three Developing Countries and of Worldwide Environmental, Seafood, and Clinical Isolates from 2000 to 2017. J. Food Prot. 2017, 80, 2060–2067. [Google Scholar] [CrossRef] [Scilit] [PubMed]
- Lopatek, M.; Wieczorek, K.; Osek, J. Antimicrobial Resistance, Virulence Factors, and Genetic Profiles of Vibrio parahaemolyticus from Seafood. Appl. Environ. Microbiol. 2018, 84, e00537-18. [Google Scholar] [CrossRef] [Scilit] [PubMed] [PubMed Central]
- Zin, H.; Ham, I.; Shin, S.B.; Yu, H.; Choi, T.-J.; Ha, K.; Mok, J.S. Distribution, Antibiotic Resistance, and Virulence Factors of Vibrio parahaemolyticus in the Southern Coastal Waters of Republic of Korea. Antibiotics 2025, 14, 435. [Google Scholar] [CrossRef] [Scilit] [PubMed]
- Lei, T.; Jiang, F.; He, M.; Zhang, J.; Zeng, H.; Chen, M.; Pang, R.; Wu, S.; Wei, L.; Wang, J.; et al. Prevalence, virulence, antimicrobial resistance, and molecular characterization of fluoroquinolone resistance of Vibrio parahaemolyticus from different types of food samples in China. Int. J. Food Microbiol. 2020, 317, 108461. [Google Scholar] [CrossRef] [Scilit] [PubMed]
- Algammal, A.M.; Alghamdi, S.; Almessiry, B.K.; Kabrah, A.; Sindi, A.S.; Alshahrani, M.Y.; Al-Olayan, E.; Youssef, F.M.; Abdelsamea, S.S.; Dayrit, G.B.; et al. In-depth characterization of virulence traits, pathogenicity, antibiogram, and antibiotic resistance genes of MDR Vibrio parahaemolyticus retrieved from shrimp. Sci. Rep. 2025, 15, 34285. [Google Scholar] [CrossRef] [Scilit] [PubMed] [PubMed Central]
- Hurley, C.C.; Quirke, A.; Reen, F.J.; Boyd, E.F. Four genomic islands that mark post-1995 pandemic Vibrio parahaemolyticus isolates. BMC Genom. 2006, 7, 104. [Google Scholar] [CrossRef] [Scilit] [PubMed] [PubMed Central]
- Li, R.; Lin, D.; Chen, K.; Wong, M.H.; Chen, S. First detection of AmpC β-lactamase bla(CMY-2) on a conjugative IncA/C plasmid in a Vibrio parahaemolyticus isolate of food origin. Antimicrob. Agents Chemother. 2015, 59, 4106–4111. [Google Scholar] [CrossRef] [Scilit] [PubMed] [PubMed Central]
- Rapa, R.A.; Labbate, M. The function of integron-associated gene cassettes in Vibrio species: The tip of the iceberg. Front. Microbiol. 2013, 4, 385. [Google Scholar] [CrossRef] [Scilit] [PubMed] [PubMed Central]
- Wang, X.; Zhang, H.; Yu, S.; Li, D.; Gillings, M.R.; Ren, H.; Mao, D.; Guo, J.; Luo, Y. Inter-plasmid transfer of antibiotic resistance genes accelerates antibiotic resistance in bacterial pathogens. ISME J. 2024, 18, wrad032. [Google Scholar] [CrossRef] [Scilit] [PubMed] [PubMed Central]
- Castañeda-Barba, S.; Top, E.M.; Stalder, T. Plasmids, a molecular cornerstone of antimicrobial resistance in the One Health era. Nat. Rev. Microbiol. 2024, 22, 18–32. [Google Scholar] [CrossRef] [Scilit] [PubMed] [PubMed Central]
- McArthur, A.G.; Waglechner, N.; Nizam, F.; Yan, A.; Azad, M.A.; Baylay, A.J.; Bhullar, K.; Canova, M.J.; De Pascale, G.; Ejim, L.; et al. The comprehensive antibiotic resistance database. Antimicrob. Agents Chemother. 2013, 57, 3348–3357. [Google Scholar] [CrossRef] [Scilit] [PubMed]
- Wattam, A.R.; Davis, J.J.; Assaf, R.; Boisvert, S.; Brettin, T.; Bun, C.; Conrad, N.; Dietrich, E.M.; Disz, T.; Gabbard, J.L.; et al. Improvements to PATRIC, the all-bacterial bioinformatics database and analysis resource center. Nucleic Acids Res. 2016, 45, D535–D542. [Google Scholar] [CrossRef] [Scilit] [PubMed]
- Zankari, E.; Hasman, H.; Cosentino, S.; Vestergaard, M.; Rasmussen, S.; Lund, O.; Aarestrup, F.M.; Larsen, M.V. Identification of acquired antimicrobial resistance genes. J. Antimicrob. Chemother. 2012, 67, 2640–2644. [Google Scholar] [CrossRef] [Scilit] [PubMed]
- Zhou, X.; Cui, Y.; He, Y.; Zhang, L.; Shi, X. Characteristics analysis of pan-resistant genome of Salmonella. Acta Microbiol. Sin. 2021, 61, 2358–2369. [Google Scholar]
- Fang, G.Y.; Mu, X.J.; Huang, B.W.; Jiang, Y.J. Monitoring Longitudinal Trends and Assessment of the Health Risk of Shigella flexneri Antimicrobial Resistance. Environ. Sci. Technol. 2023, 57, 4971–4983. [Google Scholar] [CrossRef] [Scilit] [PubMed]
- Yang, L.; Shen, Y.; Jiang, J.; Wang, X.; Shao, D.; Lam, M.M.C.; Holt, K.E.; Shao, B.; Wu, C.; Shen, J.; et al. Distinct increase in antimicrobial resistance genes among Escherichia coli during 50 years of antimicrobial use in livestock production in China. Nat. Food 2022, 3, 197–205. [Google Scholar] [CrossRef] [Scilit] [PubMed]
- Hendriksen, R.S.; Munk, P.; Njage, P.; van Bunnik, B.; McNally, L.; Lukjancenko, O.; Röder, T.; Nieuwenhuijse, D.; Pedersen, S.K.; Kjeldgaard, J.; et al. Global monitoring of antimicrobial resistance based on metagenomics analyses of urban sewage. Nat. Commun. 2019, 10, 1124. [Google Scholar] [CrossRef] [Scilit] [PubMed] [PubMed Central]
- Zhang, Z.; Zhang, Q.; Wang, T.; Xu, N.; Lu, T.; Hong, W.; Penuelas, J.; Gillings, M.; Wang, M.; Gao, W.; et al. Assessment of global health risk of antibiotic resistance genes. Nat. Commun. 2022, 13, 1553. [Google Scholar] [CrossRef] [Scilit] [PubMed] [PubMed Central]
- Jiang, C.; Zhao, Z.; Zhu, D.; Pan, X.; Yang, Y. Rare resistome rather than core resistome exhibited higher diversity and risk along the Yangtze River. Water Res. J. Int. Water Assoc. 2024, 249, 120911. [Google Scholar] [CrossRef] [Scilit] [PubMed]
- Browne, A.J.; Chipeta, M.G.; Haines-Woodhouse, G.; Kumaran, E.P.A.; Hamadani, B.H.K.; Zaraa, S.; Henry, N.J.; Deshpande, A.; Reiner, R.C., Jr.; Day, N.P.J.; et al. Global antibiotic consumption and usage in humans, 2000–2018: A spatial modelling study. Lancet Planet Health 2021, 5, e893–e904. [Google Scholar] [CrossRef] [Scilit] [PubMed] [PubMed Central]
- Bai, Y.; Yang, Q.; Sun, Y.; Li, F.; Sun, J.; Yang, S.; Yang, D.; Peng, Z.; Yang, B.; Xu, J.; et al. Antimicrobial susceptibility and genomic characterization of Vibrio parahaemolyticus isolated from aquatic foods in 15 provinces, China, 2020. Int. J. Food Microbiol. 2024, 418, 110737. [Google Scholar] [CrossRef] [Scilit] [PubMed]
- Fang, G.Y.; Liu, X.Q.; Mu, X.J.; Huang, B.W.; Jiang, Y.J. Distinct increase in antimicrobial resistance genes among Vibrio parahaemolyticus in recent decades worldwide. Chemosphere 2023, 340, 139905. [Google Scholar] [CrossRef] [Scilit] [PubMed]
- Zhang, S.; Abbas, M.; Rehman, M.U.; Huang, Y.; Zhou, R.; Gong, S.; Yang, H.; Chen, S.; Wang, M.; Cheng, A. Dissemination of antibiotic resistance genes (ARGs) via integrons in Escherichia coli: A risk to human health. Environ. Pollut. 2020, 266, 115260. [Google Scholar] [CrossRef] [Scilit] [PubMed]
- Aleksandrowicz, A.; Carolak, E.; Dutkiewicz, A.; Błachut, A.; Waszczuk, W.; Grzymajlo, K. Better together-Salmonella biofilm-associated antibiotic resistance. Gut Microbes 2023, 15, 2229937. [Google Scholar] [CrossRef] [Scilit] [PubMed] [PubMed Central]
- Yang, C.; Xiang, Y.; Qiu, S. Resistance in Enteric Shigella and nontyphoidal Salmonella: Emerging concepts. Curr. Opin. Infect. Dis. 2023, 36, 360–365. [Google Scholar] [CrossRef] [Scilit] [PubMed] [PubMed Central]
- Jacobsen, A.; Hendriksen, R.S.; Aaresturp, F.M.; Ussery, D.W.; Friis, C. The Salmonella enterica pan-genome. Microb. Ecol. 2011, 62, 487. [Google Scholar] [CrossRef] [Scilit] [PubMed]
- Liu, Y.; Zhang, D.F.; Zhou, X.J.; Xu, L.; Zhang, L.D.; Shi, X.M. Comprehensive analysis reveals two distinct evolution patterns of Salmonella flagellin gene clusters. Front. Microbiol. 2017, 8, 2604. [Google Scholar] [CrossRef] [Scilit] [PubMed]
- Nishibuchi, M.; Fasano, A.; Russell, R.G.; Kaper, J.B. Enterotoxigenicity of Vibrio parahaemolyticus with and without genes encoding thermostable direct hemolysin. Infect. Immun. 1992, 60, 3539–3545. [Google Scholar] [CrossRef] [Scilit] [PubMed]
- Honda, T.; Ni, Y.X.; Miwatani, T. Purification and characterization of a hemolysin produced by a clinical isolate of Kanagawa phenomenon-negative Vibrio parahaemolyticus and related to the thermostable direct hemolysin. Infect. Immun. 1988, 56, 961–965. [Google Scholar] [CrossRef] [Scilit] [PubMed]
- Ceccarelli, D.; Hasan, N.A.; Huq, A.; Colwell, R.R. Distribution and dynamics of epidemic and pandemic Vibrio parahaemolyticus virulence factors. Front. Cell Infect. Microbiol. 2013, 3, 97. [Google Scholar] [CrossRef] [Scilit] [PubMed]
- Divya, S.P.; Chandradasan, A.; Pranav, P.K.; Antony, A.C.; Mohamed Hatha, A.A. Prevalence of Plasmid-mediated Quinolone Resistance (PMQR) Genes and Beta-lactamase Genes among Salmonella, Vibrio parahaemolyticus and Escherichia coli from Shellfish. Fish. Technol. 2020, 57, 41–50. [Google Scholar] [CrossRef]
- Mendelson, M.; Røttingen, J.-A.; Gopinathan, U.; Hamer, D.H.; Wertheim, H.; Basnyat, B.; Butler, C.; Tomson, G.; Balasegaram, M. Maximising access to achieve appropriate human antimicrobial use in low-income and middle-income countries. Lancet 2016, 387, 188–198. [Google Scholar] [CrossRef] [Scilit] [PubMed]
- Murray, C.J.L.; Ikuta, K.S.; Sharara, F.; Swetschinski, L.; Robles Aguilar, G.; Gray, A.; Han, C.; Bisignano, C.; Rao, P.; Wool, E.; et al. Global burden of bacterial antimicrobial resistance in 2019: A systematic analysis. Lancet 2022, 399, 629–655. [Google Scholar] [CrossRef] [Scilit] [PubMed]
- Baker-Austin, C.; Oliver, J.D.; Alam, M.; Ali, A.; Waldor, M.K.; Qadri, F.; Martinez-Urtaza, J. Vibrio spp. infections. Nat. Rev. Dis. Primers 2018, 4, 8, Erratum in Nat. Rev. Dis. Primers 2021, 7, 15. https://doi.org/10.1038/s41572-021-00250-9. [Google Scholar] [CrossRef] [Scilit] [PubMed]
- Dutta, D.; Kaushik, A.; Kumar, D.; Bag, S. Foodborne Pathogenic Vibrios: Antimicrobial Resistance. Front. Microbiol. 2021, 12, 638331. [Google Scholar] [CrossRef] [Scilit] [PubMed] [PubMed Central]
- Jin, J.; Zhou, Y.; Zhang, Z.; Wang, H.; Hou, W.; Wang, H.; Li, R.; Zhou, M. Characteristics of Antimicrobial-Resistant Vibrio parahaemolyticus Strains and Identification of Related Antimicrobial Resistance Gene Mutations. Foodborne Pathog. Dis. 2021, 18, 873–879. [Google Scholar] [CrossRef] [Scilit] [PubMed]
- Jain, C.; Rodriguez-R, L.M.; Phillippy, A.M.; Konstantinidis, K.T.; Aluru, S. High throughput ANI analysis of 90K prokaryotic genomes reveals clear species boundaries. Nat. Commun. 2018, 9, 5114. [Google Scholar] [CrossRef] [Scilit] [PubMed] [PubMed Central]
- Canisius, S.; Martens, J.W.M.; Wessels, L.F.A. A novel independence test for somatic alterations in cancer shows that biology drives mutual exclusivity but chance explains most co-occurrence. Genome Biol. 2016, 17, 261. [Google Scholar] [CrossRef] [Scilit] [PubMed]
- Bastian, M.; Heymann, S.; Jacomy, M. Gephi: An open source software for exploring and manipulating networks. In Proceedings of the International AAAI Conference on Web and Social Media, San Jose, CA, USA, 17–20 May 2009; Volume 3, pp. 361–362. [Google Scholar]
- Zhang, A.-N.; Gaston, J.M.; Dai, C.L.; Zhao, S.; Poyet, M.; Groussin, M.; Yin, X.; Li, L.-G.; van Loosdrecht, M.C.M.; Topp, E.; et al. An omics-based framework for assessing the health risk of antimicrobial resistance genes. Nat. Commun. 2021, 12, 4765. [Google Scholar] [CrossRef] [Scilit] [PubMed]

Disclaimer/Publisher’s Note: The statements, opinions and data contained in all publications are solely those of the individual author(s) and contributor(s) and not of MDPI and/or the editor(s). MDPI and/or the editor(s) disclaim responsibility for any injury to people or property resulting from any ideas, methods, instructions or products referred to in the content. |
© 2026 by the authors. Licensee MDPI, Basel, Switzerland. This article is an open access article distributed under the terms and conditions of the Creative Commons Attribution (CC BY) license.