


Abstract
Background/Objectives: Whether the COVID-19 pandemic uniformly increased antimicrobial resistance (AMR) is contested, and aggregate analyses may mask organism-specific patterns. The objective of the study was to characterize changes in the level and slope of monthly multidrug-resistant (MDR), possible extensively drug-resistant (pXDR), possible pandrug-resistant (pPDR), vancomycin-resistant enterococci (VRE), and methicillin-resistant Staphylococcus aureus (MRSA) positivity at a Mexican tertiary-care hospital, and to assess heterogeneity by organism, antimicrobial class, specimen type, and hospital service. Methods: Retrospective interrupted time-series of deduplicated bacterial isolates (October 2017 to January 2026), analyzed by segmented regression across pre-pandemic, pandemic, and post-peak phases. Results: Cohort-wide MDR positivity had been declining before 2020 and rose abruptly at pandemic onset (level shift +6.81 percentage points, p = 0.0092) with a simultaneous slope reversal, reaching 24.27 percentage points above the extrapolated pre-pandemic trend by February 2022 (95% CI 14.26–34.28, p < 0.0001). The decline resumed after the pandemic peak, but the two slope changes did not offset one another (joint p = 0.0064). pXDR and pPDR moved in the same direction (+8.93, p = 0.0233; +15.40, p = 0.0113). VRE showed no significant departure, whereas MRSA declined in every phase yet departed significantly from its extrapolated trajectory (+23.68, p = 0.0040). Among species, Escherichia coli showed the largest departure from its counterfactual (+48.82 percentage points, p < 0.0001) and Klebsiella pneumoniae had the largest abrupt level rise (+14.46 percentage points, p = 0.0055), while S. aureus declined in every phase despite an abrupt rise in level at pandemic onset. At the class level, carbapenem and third-/fourth-generation cephalosporin non-susceptibility rose at pandemic onset and returned to baseline afterwards (19.1% to 28.0% to 18.7%, and 51.7% to 59.4% to 52.5%; all q < 0.001), whereas fluoroquinolone non-susceptibility rose and did not revert, climbing further in E. coli (61.5% to 65.2% to 72.7%, q = 0.0012) and plateauing at an elevated level in K. pneumoniae (37.6% to 46.5% to 49.3%, q = 0.1919 post-peak). Conclusions: Resistance trajectories across pandemic-related phases were divergent and, for the Gram-negative organisms, incompletely reversed, with the highest burden of advanced resistance in high-intensity settings. Organism-resolved surveillance and sustained stewardship are needed.
1. Introduction
Antimicrobial resistance (AMR) is a leading threat to global health. In 2019, it was associated with an estimated 4.95 million deaths worldwide, of which 1.27 million were directly attributable [1], and the attributable burden is projected to reach approximately 1.91 million deaths annually by 2050, with Latin America and the Caribbean among the most affected regions [2]. In the Americas, 569,000 deaths were associated with bacterial AMR in 2019, and 141,000 were directly attributable, unevenly distributed among pathogens; Escherichia coli, Staphylococcus aureus, Klebsiella pneumoniae, Pseudomonas aeruginosa, and Acinetobacter baumannii contributed most, reflecting their clinical frequency, hospital-acquired infection transmissibility, and capacity to accumulate resistance determinants [1,3].
The 2024 WHO Bacterial Priority Pathogens List placed carbapenem-resistant A. baumannii and Enterobacterales in the critical category, alongside carbapenem-resistant P. aeruginosa, methicillin-resistant S. aureus (MRSA), and vancomycin-resistant Enterococcus faecium as major priorities [4,5]. Several belong to the ESKAPE group (Enterococcus faecium, Staphylococcus aureus, Klebsiella pneumoniae, Acinetobacter baumannii, Pseudomonas aeruginosa and Enterobacter spp.), whose success reflects intrinsic resistance, mobile genetic elements, genomic plasticity, and environmental persistence [6]. Because Escherichia coli rivals or exceeds these organisms in clinical frequency and in attributable mortality, it is increasingly grouped with them as ESKAPE-E, and we adopt that grouping here. Standardized multidrug-resistant (MDR), extensively drug-resistant (XDR), and pandrug-resistant (PDR) definitions improve comparability but depend on the organism-specific panel tested and on breakpoint standards, so a pathogen may show a high MDR proportion without a comparable XDR or PDR burden [7]. These distinctions are particularly relevant in intensive care, where Gram-negative organisms predominate among culture-positive infections and selected resistant phenotypes are associated with higher mortality [8].
The COVID-19 pandemic disrupted this landscape. Antibiotics were prescribed to 74.6% of patients with COVID-19, whereas bacterial co-infection was documented in only 8.6% [9], a prescribing-need mismatch echoed across co-infection reviews [10,11]. Opposing pressures could raise or lower resistance, broad-spectrum use, prolonged intensive care unit (ICU) stay, invasive devices and interrupted stewardship on one side against masking, hand hygiene, and visitor restrictions on the other, so that the net direction depends on which set dominated in a given hospital [12]. Empirical evidence reflects this heterogeneity: a meta-analysis of pandemic-associated resistance rates found no significant overall change in MRSA or vancomycin-resistant enterococci and only heterogeneous signals for Gram-negative organisms [13], while a separate systematic review reported that resistance was nonetheless common among COVID-19 patients with documented bacterial infections, although susceptibility data were reported for at least one species in only 63% of the included studies and between-study heterogeneity was substantial [14]. National U.S. surveillance reported a combined 20% rise in seven hospital-onset resistant infections, peaking in 2021, yet trajectories differed by pathogen, with hospital-onset MRSA the exception: it remained essentially stable and was the only one of the seven to decline from 2021 to 2022 [15]. A. baumannii, favored by environmental persistence and clonal spread [16], roughly doubled during the pandemic in one ICU cohort [17], but this cannot be extrapolated to other organisms.
In Mexico, phenotypic surveillance had already documented high and heterogeneous resistance before COVID-19, including extended-spectrum β-lactamase-producing E. coli and K. pneumoniae and carbapenem resistance in non-fermenting Gram-negative bacilli [18,19], an elevated baseline that any pandemic-associated change must be read against. Pandemic-era data likewise showed divergence: A. baumannii resistance increased, while K. pneumoniae remained unchanged and quinolone resistance declined in E. coli and P. aeruginosa [20]. Most studies, however, relied on simple pre-pandemic versus pandemic comparisons over short periods, which cannot separate an abrupt level change from continuation of a pre-existing trend. Aggregate estimates are weighted by isolate volume and therefore follow the most frequently isolated organisms, so that a less common organism carrying a disproportionate share of extensively or pandrug-resistant isolates leaves the cohort figure largely unchanged.
We therefore analyzed deduplicated bacterial isolates from a tertiary-care referral hospital in Guadalajara, México (October 2017 to January 2026), using segmented interrupted time-series regression to assess changes in the level and slope of monthly MDR, possible XDR (pXDR), possible PDR (pPDR), VRE, and MRSA proportions across three pandemic-related phases, with secondary analyses by organism, antimicrobial class, specimen type, and hospital service. We hypothesized divergent rather than uniform trajectories, with the greatest burden of advanced resistance occurring in hospital-adapted pathogens and high-intensity clinical settings.
2. Results
2.1. Organism Distribution and Resistance Patterns
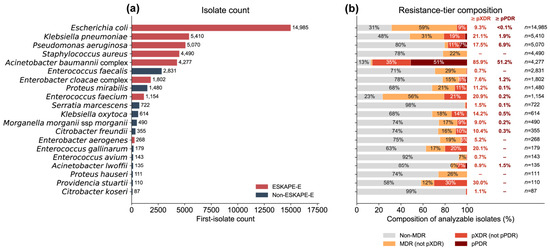
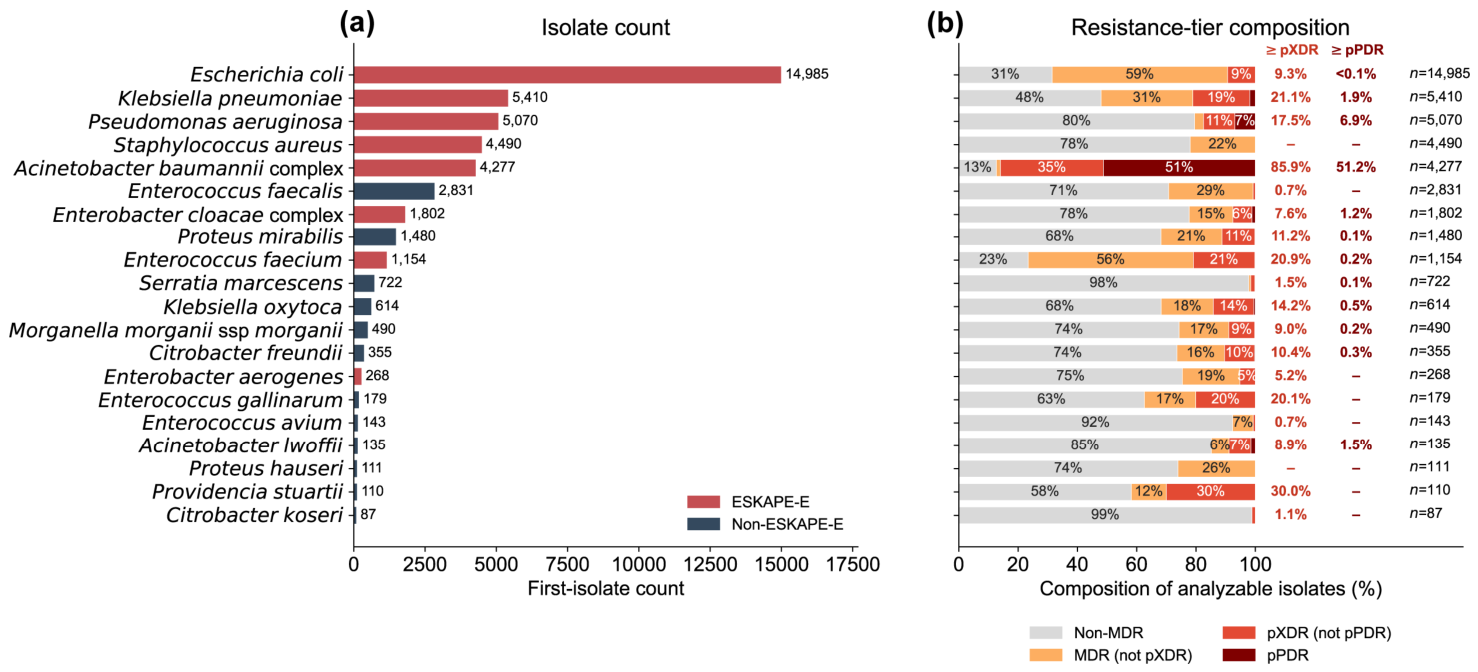
Across the study period, Escherichia coli was by far the most frequent organism (14,985 first isolates), followed by Klebsiella pneumoniae (5410), Pseudomonas aeruginosa (5070), Staphylococcus aureus (4490), and the Acinetobacter baumannii complex (4277), with several belonging to the ESKAPE-E group (Figure 1a). Figure 1 is restricted to organisms for which the Magiorakos criteria define an applicable-category set; coagulase-negative staphylococci, the most frequent organisms falling outside those criteria, are consequently not shown. Resistance-tier composition varied markedly by organism (Figure 1b): the A. baumannii complex carried by far the highest advanced-resistance burden (85.9% pXDR or higher, of which 51.2% pPDR), whereas E. coli, despite its dominance, combined a high MDR proportion (68.5%) with little advanced resistance (9.3% pXDR or higher, <0.1% pPDR); K. pneumoniae was intermediate (52.0% MDR, 21.1% pXDR or higher).
Figure 1.
Isolate counts and resistance-tier composition by organism. (a) Total first-isolate counts for the 20 most frequently recovered organisms, colored by ESKAPE-E status. (b) Resistance-tier composition among evaluable isolates as mutually exclusive categories (pPDR > pXDR > MDR > non-MDR); categories sum to 100% per organism; n indicates the evaluable denominator.
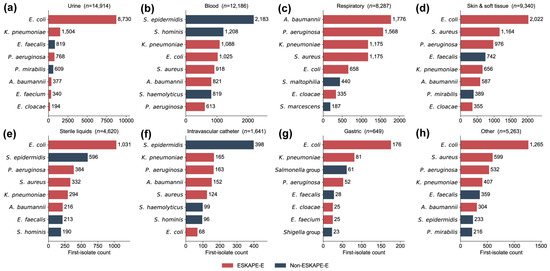
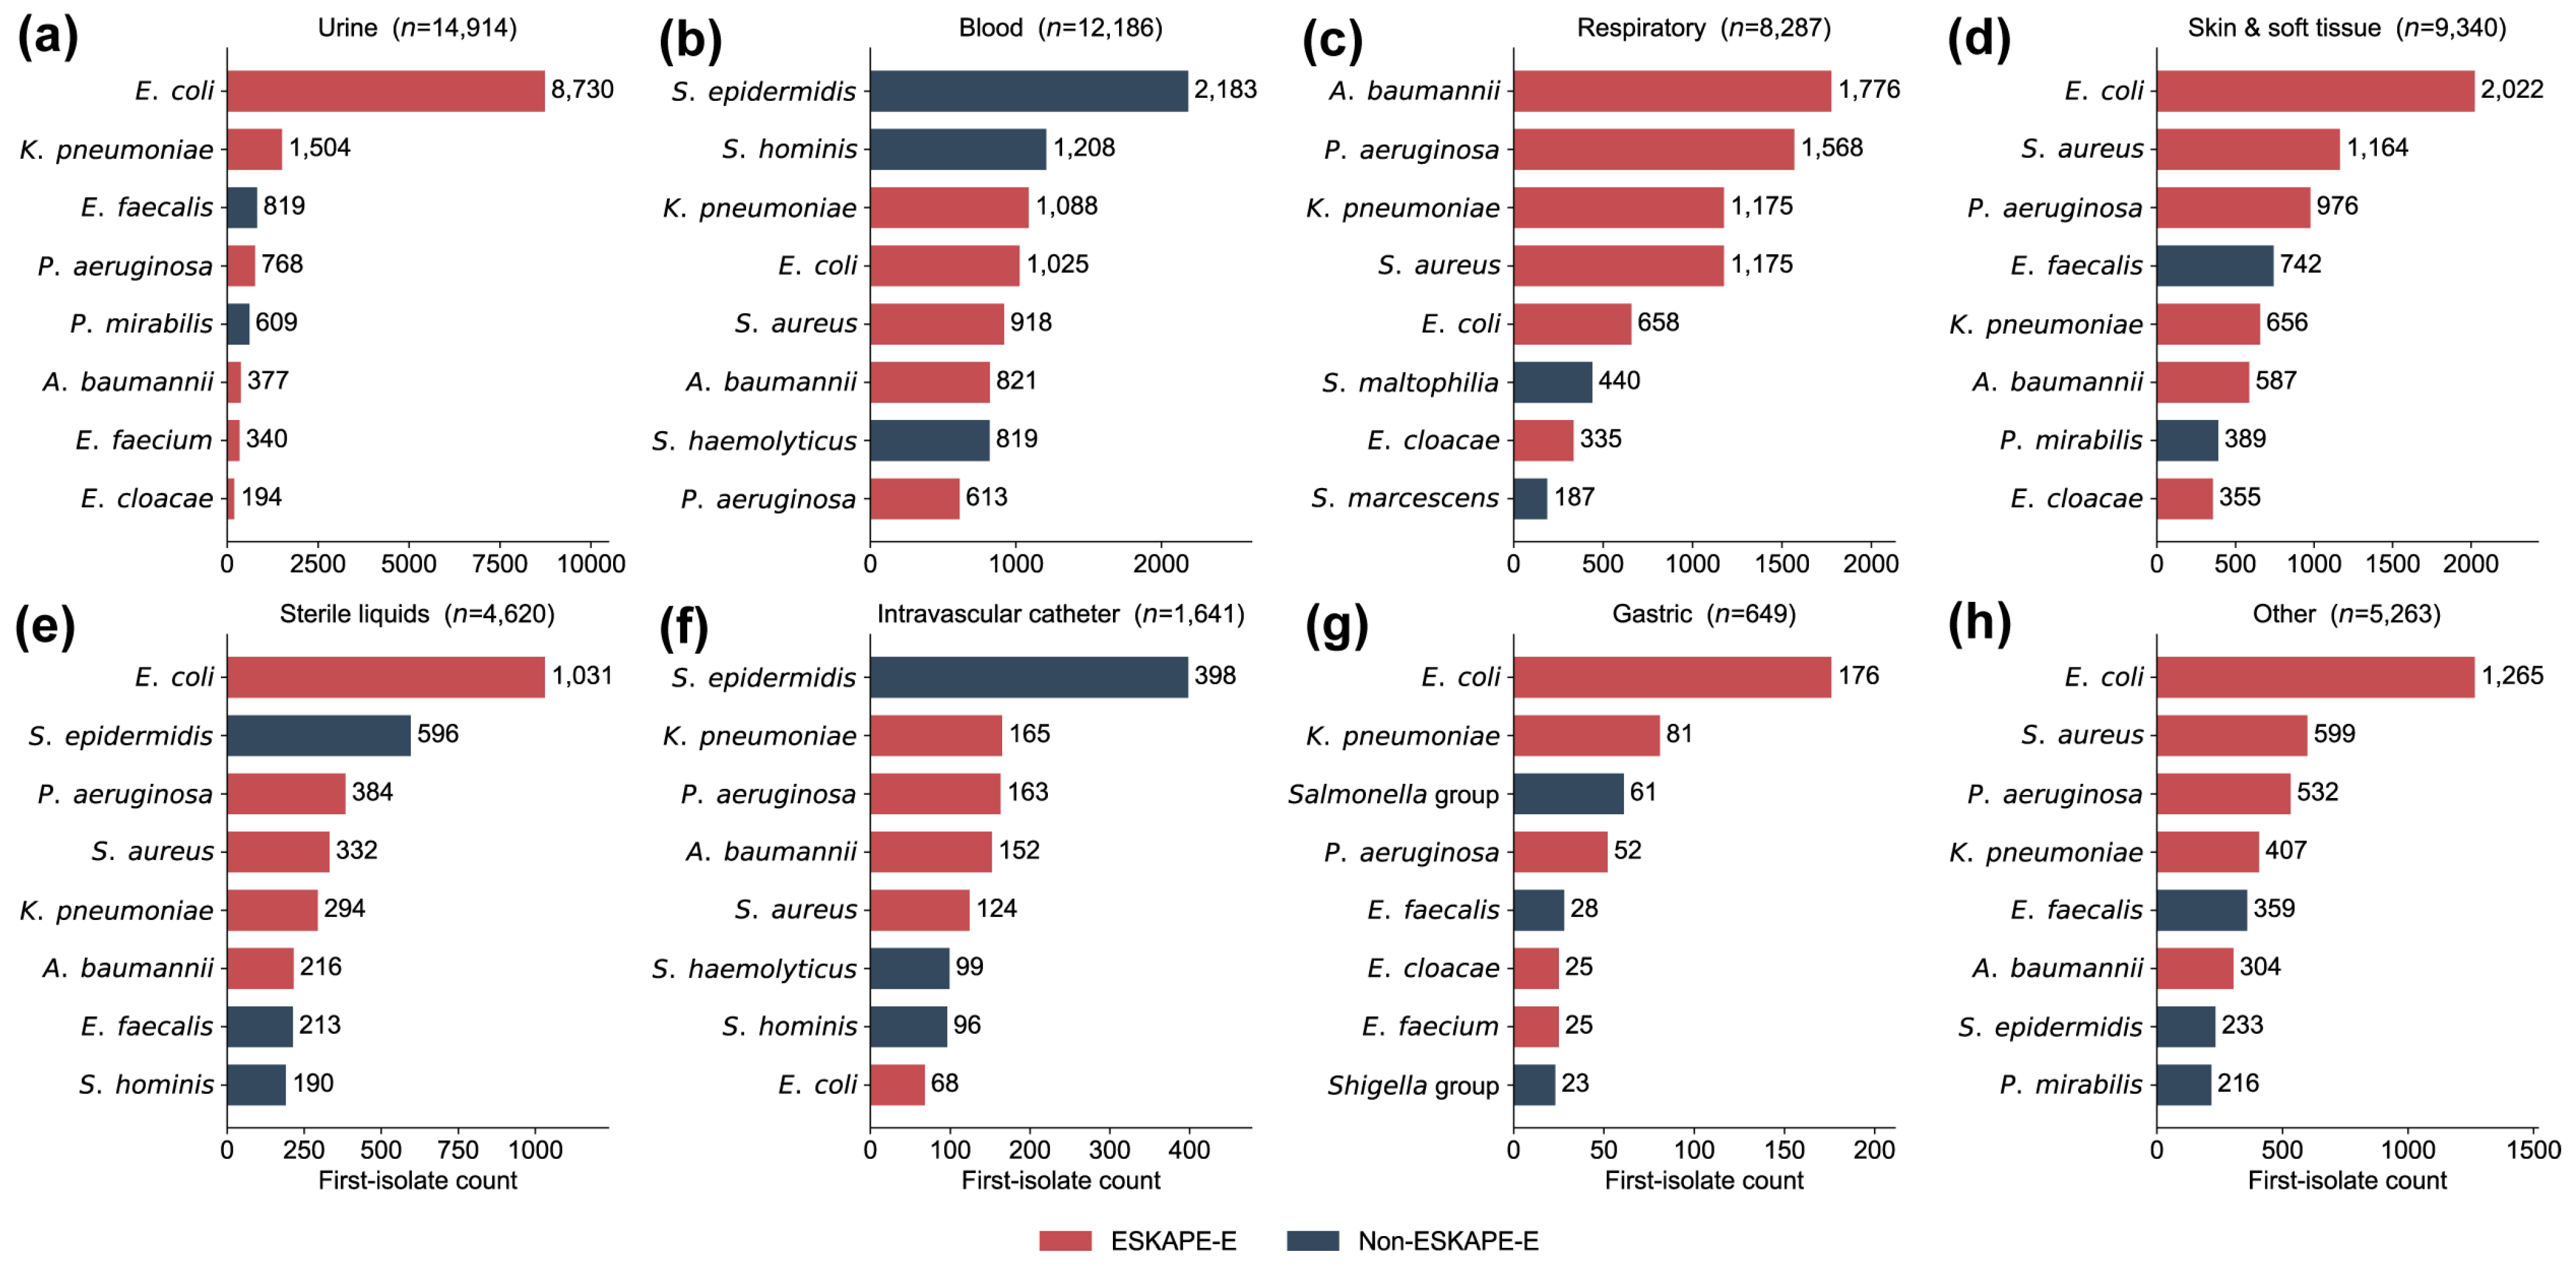
Organism composition also differed by specimen (Figure 2): E. coli led urine (8730/14,914), skin and soft tissue, and gastric and “other” specimens; blood and intravascular-catheter specimens were led by S. epidermidis; and respiratory specimens were led by the ESKAPE-E organisms (A. baumannii complex (1776), P. aeruginosa (1568)).
Figure 2.
Top eight bacterial organisms by clinical specimen type. First-isolate counts for the eight most frequently recovered organisms across eight specimen categories: (a) urine, (b) blood, (c) respiratory, (d) skin and soft tissue, (e) sterile fluids, (f) intravascular catheter, (g) gastric, (h) other. Bars colored by ESKAPE-E status; n indicates total first isolates per specimen.
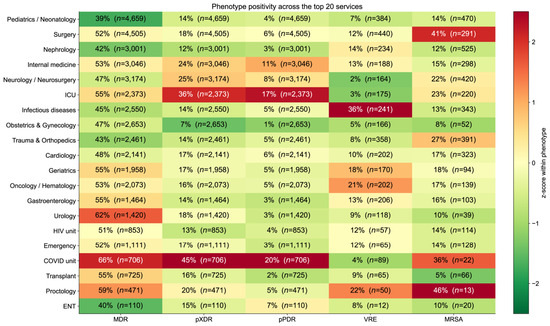
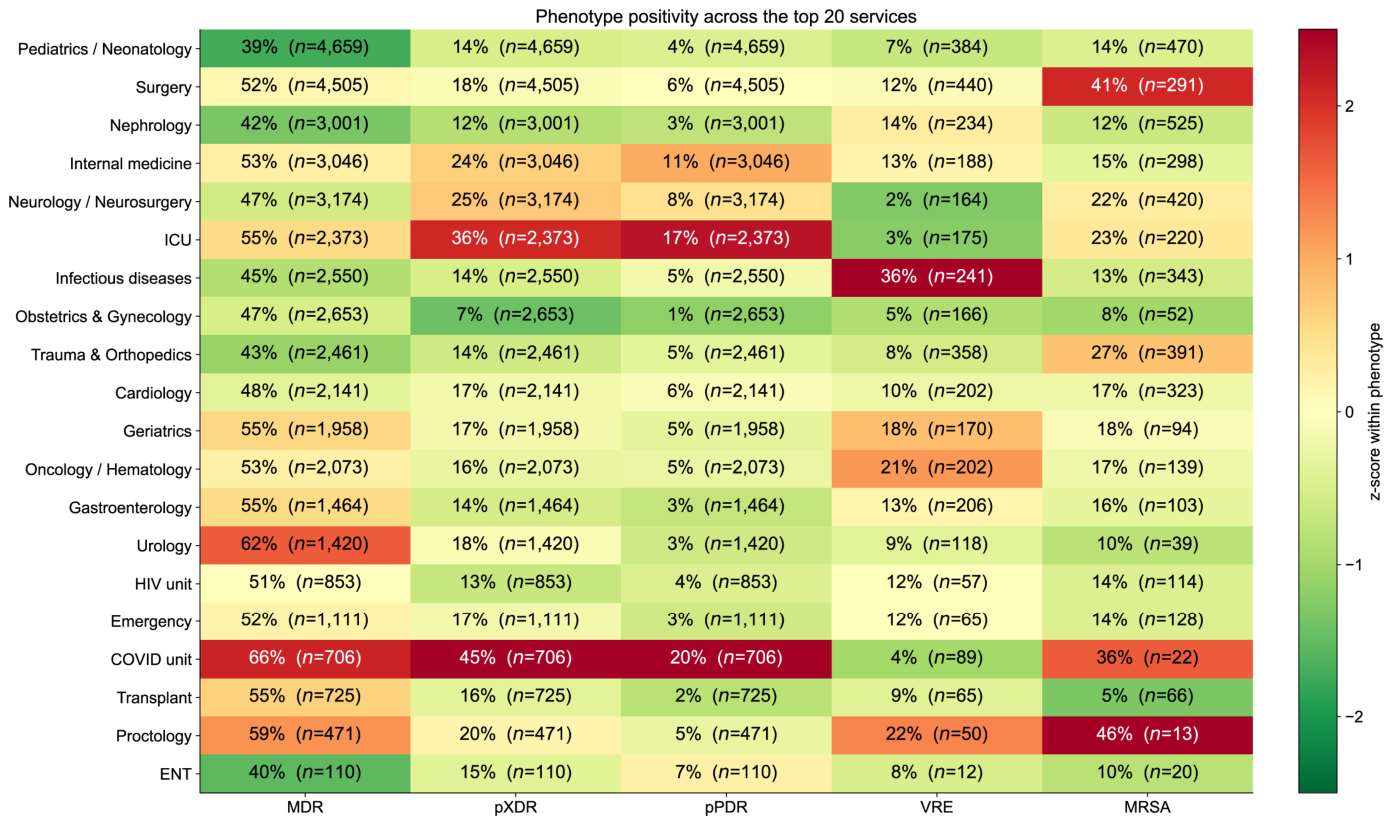
Across the 20 highest-volume services (Figure 3), the COVID unit carried the highest positivity for all three multidrug-resistant tiers (MDR 65.7%, pXDR 44.6%, pPDR 20.3%; n = 706), followed by the ICU (54.7%, 35.7%, 16.9%; n = 2373). The gradient was clearest for the advanced tiers; high MDR positivity also occurred in lower-acuity services (Urology 62.3%, n = 1420). VRE positivity was highest in Infectious Diseases (35.7% of 241 enterococcal isolates) and MRSA was highest in Surgery (41.2% of 291 S. aureus isolates); the numerically highest MRSA value, in Proctology, rested on 13 isolates and is not interpreted.
Figure 3.
Resistance phenotype positivity across the 20 highest-volume clinical services. Heatmap of MDR, pXDR, pPDR, VRE, and MRSA (%) by service, color-scaled as a within-phenotype z-score across services; cell values show raw positivity; n is the evaluable denominator.
2.2. Cohort-Wide Temporal Trends
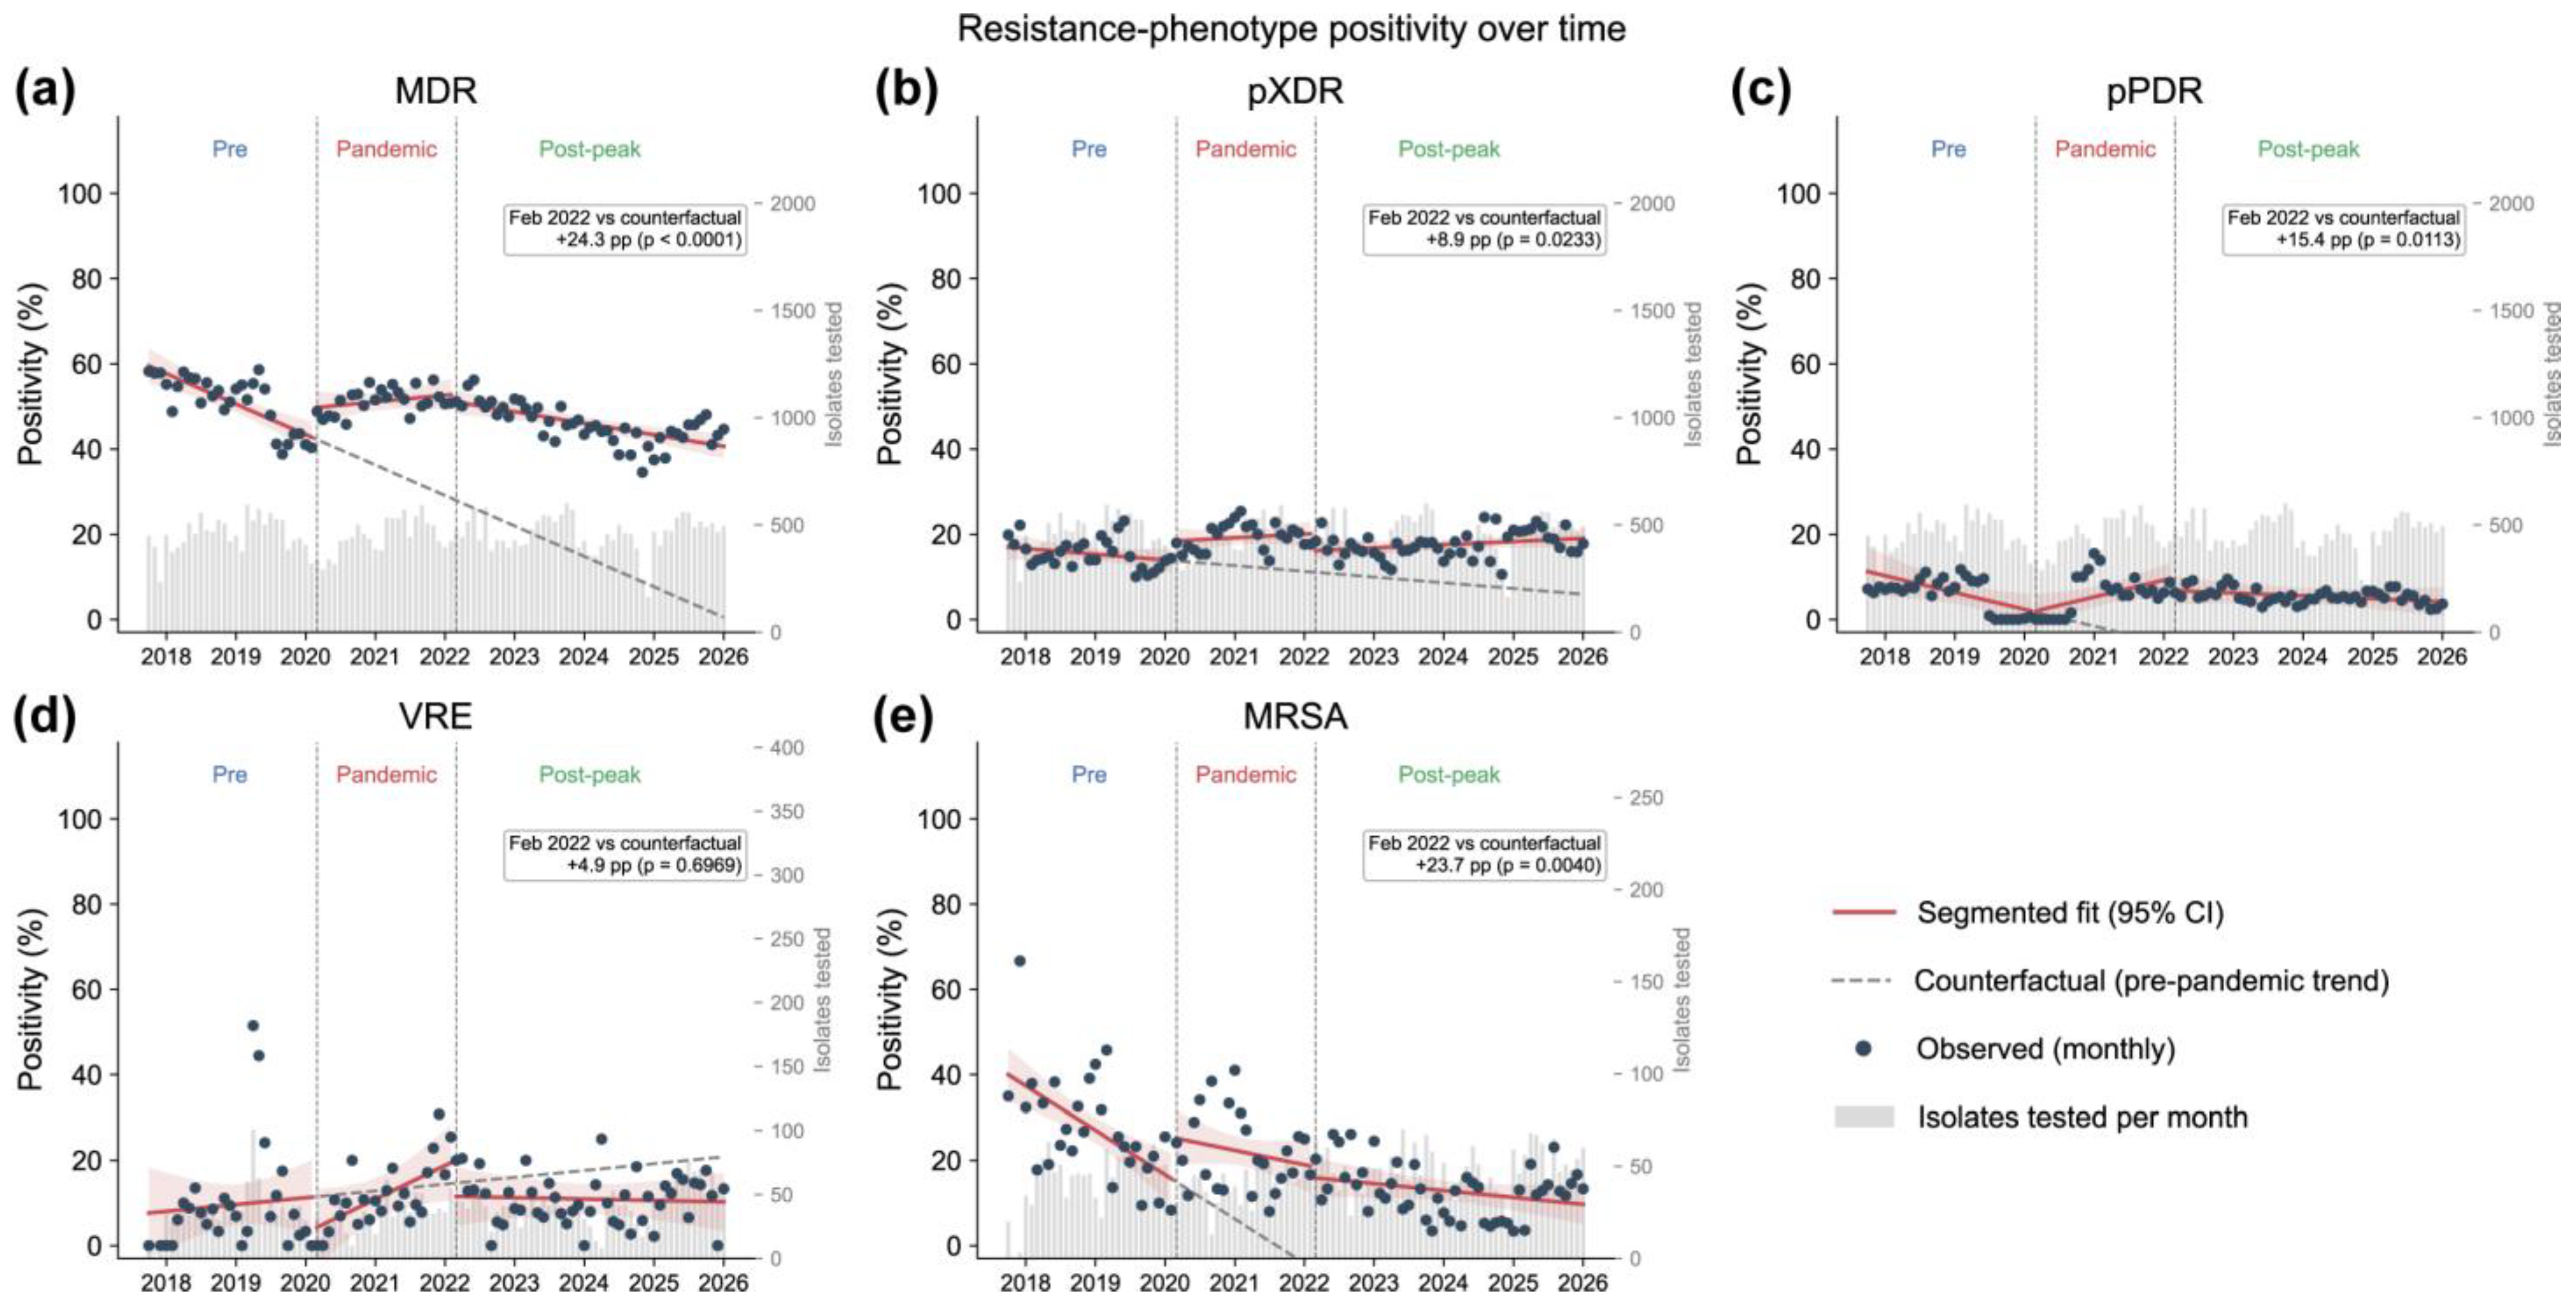
Segmented regression was applied to MDR, pXDR, pPDR, VRE, and MRSA (Table 1, Figure 4). For MDR (fitted by generalized least squares with an AR(1) term owing to residual autocorrelation, Durbin–Watson 1.23), baseline positivity was 60.09% and declined before the pandemic (β1 = −0.60 percentage points (pp)/month, p < 0.0001). At pandemic onset, positivity rose abruptly (β2 = +6.81 pp, p = 0.0092), and the decline was arrested (β3 = +0.73 pp/month, p = 0.0003; net pandemic slope +0.13 pp/month, p = 0.3488). After the pandemic peak, the decline resumed at a shallower rate than before 2020 (β5 = −0.36 pp/month, p = 0.0220; net post-peak slope −0.23 pp/month, p = 0.0001), with no significant level shift at that boundary (β4 = −1.54 pp, p = 0.5050). The joint test of the two slope changes was significant (p = 0.0064). Both slope changes held under Newey–West standard errors. The fitted level exceeded the extrapolated pre-pandemic trend by 24.27 pp in February 2022 (95% CI 14.26–34.28, p < 0.0001) and by 40.14 pp in January 2026 (95% CI 19.64–60.63, p = 0.0002).
Table 1.
Segmented regression model coefficients for MDR positivity in the full cohort.
Figure 4.
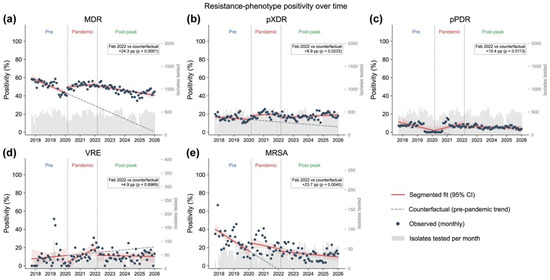
(a) MDR, (b) pXDR, (c) pPDR, (d) VRE, (e) MRSA. Monthly observed positivity (points), segmented regression fit with 95% CI (line and band) and pre-pandemic counterfactual (dashed line); phase labels mark the three phases; grey bars show monthly isolates tested. Annotation reports the February 2022 counterfactual contrast and p-value.
The more severe tiers moved in the same direction by the end of the pandemic phase: pXDR exceeded its extrapolated trend by 8.93 pp (95% CI 1.24–16.62, p = 0.0233), and pPDR exceeded it by 15.40 pp (95% CI 3.58–27.23, p = 0.0113) (Figure 4b,c; Table A2 and Table A3). The two single-genus phenotypes diverged: VRE showed no significant departure (+4.89 pp, p = 0.6969), whereas MRSA departed significantly (+23.68 pp, p = 0.0040), while its net slope remained negative in every phase (−0.87, −0.28 and −0.14 pp/month) (Figure 4d,e; Table A4 and Table A5). Sensitivity analyses covering interruption dates, panel coverage, model specification, and case mix are reported in Tables S1–S6.
2.3. Species-Level MDR
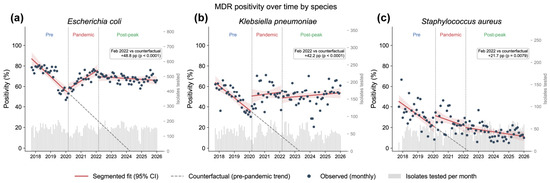
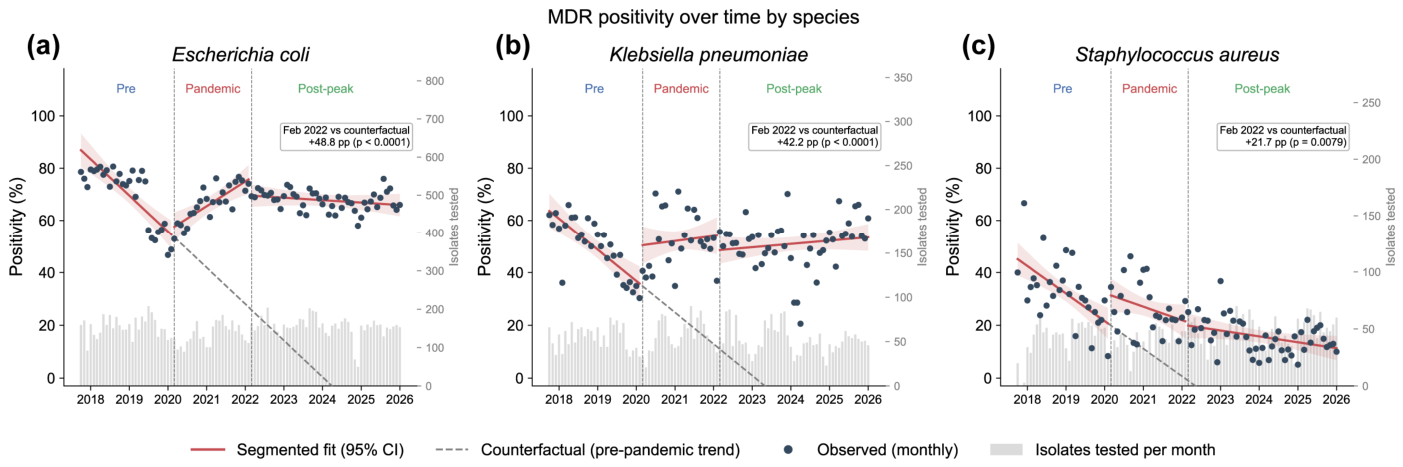
Because the cohort-wide trajectory can mask species differences, E. coli, K. pneumoniae, and S. aureus were modeled individually (Figure 5). All three departed significantly from their extrapolated pre-pandemic trajectories, but through different mechanisms.
Figure 5.
MDR positivity over time by species. (a) Escherichia coli, (b) Klebsiella pneumoniae, (c) Staphylococcus aureus. Elements as in Figure 4.
E. coli (Table 2) had baseline of 88.03% and the steepest pre-pandemic decline of the three (β1 = −1.15 pp/month, p < 0.0001). At pandemic onset, the slope reversed (β3 = +1.94 pp/month, p < 0.0001) to a significantly positive net pandemic slope (+0.79 pp/month, p = 0.0002), without an abrupt change in level (β2 = +2.24 pp, p = 0.5370). The post-peak level shift was not significant in the primary model (β4 = −6.11 pp, p = 0.0659), although it was under Newey–West standard errors (p < 0.0001), and the post-peak net slope was flat (−0.08 pp/month, p = 0.3356). The joint test of the two slope changes was significant (p < 0.0001); the counterfactual difference was +48.82 pp in February 2022 (95% CI 33.75–63.88, p < 0.0001); the January 2026 value (+93.23 pp) is not reported as supporting because the pre-pandemic slope extrapolates below zero before that point.
Table 2.
Segmented regression model coefficients for MDR positivity in Escherichia coli.
K. pneumoniae (Table 3) differed in mechanism: baseline 64.68%, a pre-pandemic decline of −1.00 pp/month (p < 0.0001; ordinary least squares, Durbin–Watson 1.64), and an abrupt level rise at pandemic onset (β2 = +14.46 pp, p = 0.0055) alongside a slope change (β3 = +1.16 pp/month, p = 0.0009), with neither post-peak term significant (β4, p = 0.2137; β5, p = 0.8496). Its net pandemic and post-peak slopes did not differ from zero (+0.16 pp/month, p = 0.5530; +0.11 pp/month, p = 0.2840). The joint test was significant (p < 0.0001), and the counterfactual difference was +42.21 pp in February 2022 (95% CI 24.93–59.49, p < 0.0001); the January 2026 value (+88.31 pp) is not reported as supporting because the pre-pandemic slope extrapolates below zero before that point.
Table 3.
Segmented regression model coefficients for MDR positivity in Klebsiella pneumoniae.
S. aureus (Table A6) declined before the pandemic (β1 = −0.87 pp/month, p < 0.0001), and its net slope remained negative in every phase (−0.87, −0.43 and −0.19 pp/month; p = 0.0800 and p = 0.0380 for the pandemic and post-peak phases). It nonetheless showed an abrupt level rise at pandemic onset (β2 = +11.02 pp, p = 0.0178) and a significant counterfactual difference (+21.66 pp, 95% CI 5.82–37.51, p = 0.0079; joint test p = 0.0015).
2.4. Antibiotic-Class Non-Susceptibility
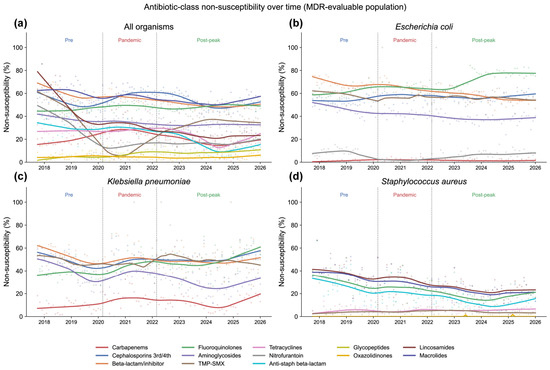
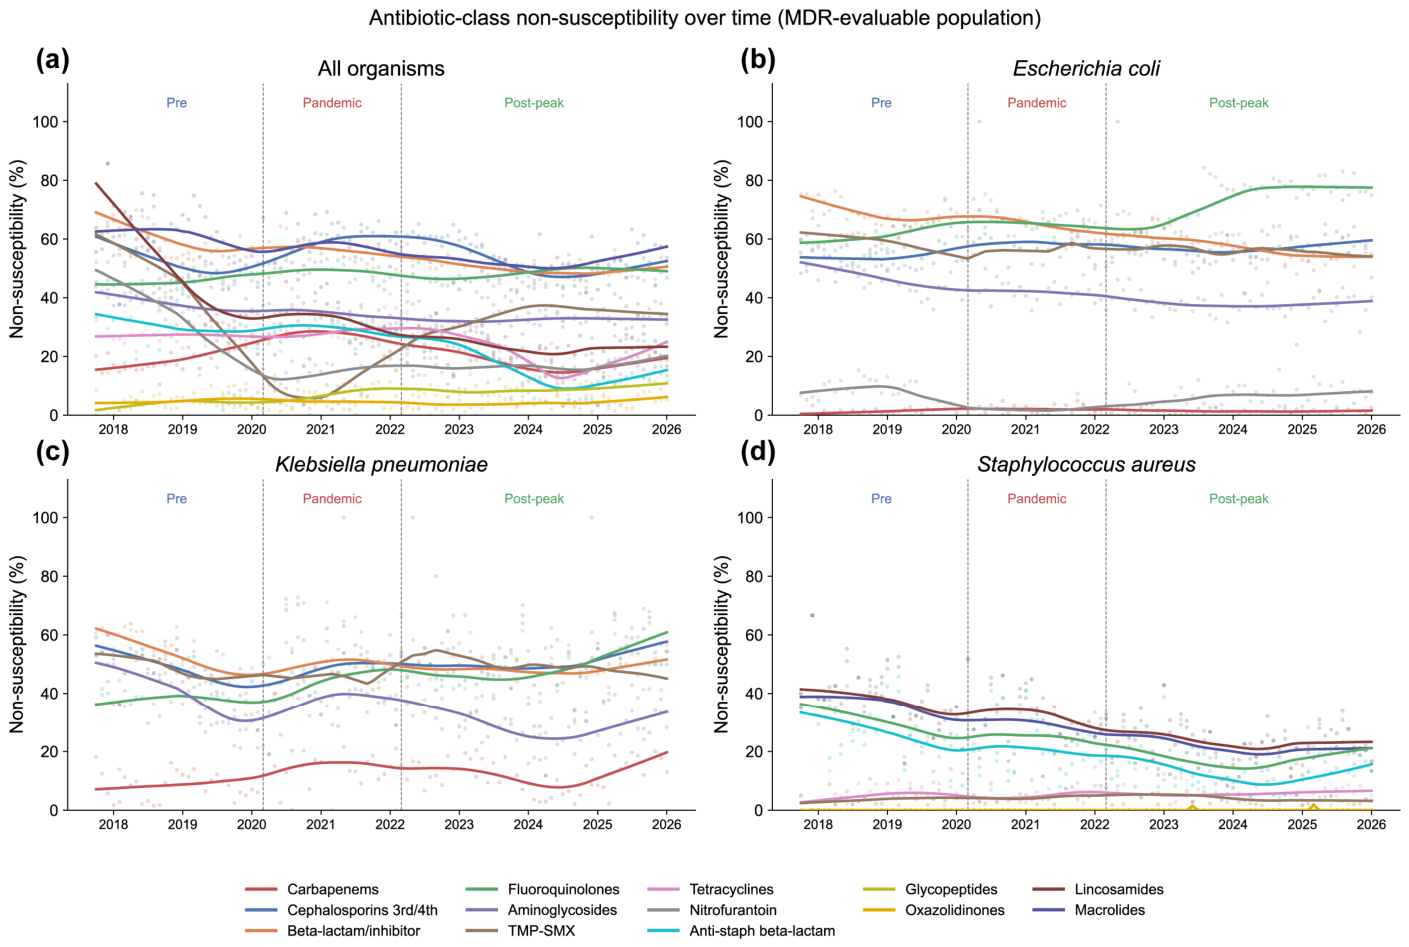
Class-level non-susceptibility clarified which classes underlay these shifts (Figure 6, Table 4). Across all organisms, carbapenem non-susceptibility rose at pandemic onset and returned to baseline afterwards (19.1% pre-pandemic, 28.0% pandemic, 18.7% post-peak; q < 0.0001 for both transitions). Third-/fourth-generation cephalosporin non-susceptibility followed the same shape with smaller amplitude (51.7% to 59.4%, 52.5%; q = 0.0007 and q = 0.0005). Fluoroquinolone non-susceptibility did not revert: in E. coli, it rose at pandemic onset and again afterwards (61.5% to 65.2%, 72.7%, q = 0.0073 and q = 0.0012), whereas in K. pneumoniae, it rose and then plateaued (37.6% to 46.5%, 49.3; q = 0.0034 and q = 0.1919). S. aureus showed the opposite pattern, with no pandemic-onset rise in either class and declines that reached significance only afterwards (fluoroquinolones 29.6%, 25.9%, 18.1%; q = 0.1920 and q = 0.0014; anti-staphylococcal β-lactams 25.6%, 21.5%, 12.9%; q = 0.1603, q = 0.0004). Because these comparisons treat consecutive monthly proportions as independent observations, they are reported as descriptive rather than as tests of interruption.
Figure 6.
Antibiotic-class non-susceptibility over time in the MDR-evaluable population. (a) all organisms, (b) Escherichia coli, (c) Klebsiella pneumoniae, (d) Staphylococcus aureus. LOESS-smoothed monthly non-susceptibility (%) per antibiotic class, restricted to classes with ≥200 isolates tested and ≥24 months with ≥20 tested; points show monthly values; phase labels as in Methods. TMP-SMX, trimethoprim-sulfamethoxazole.
Table 4.
Antibiotic-class non-susceptibility across pandemic phases, selected classes and organisms.
Because the ciprofloxacin breakpoint was revised during the study period, the direction of the post-peak fluoroquinolone trend depends on which criterion is applied throughout: among Enterobacterales, ciprofloxacin non-susceptibility across the three phases was 45.9%, 49.0%, and 56.7% as reported, 50.2%, 49.0%, and 56.7% under the current breakpoint, and 42.1%, 41.2%, and 39.9% under the earlier one (Table S5). The composite MDR counterfactual for the same organisms was robust to this manipulation (+35.3, +33.9 and +38.8 pp under the three criteria, each p < 0.0001; Table S6).
3. Discussion
In this near-decade-long interrupted time series from a Mexican tertiary-care referral hospital, the COVID-19 pandemic was not associated with a uniform rise in antimicrobial resistance but with organism- and phenotype-specific trajectories. Cohort-wide MDR positivity, which had been declining before 2020, rose abruptly at pandemic onset and its decline was arrested. That decline resumed after the pandemic peak but at a shallower rate, and the two slope changes did not offset one another (joint p = 0.0064). The fitted level exceeded the extrapolated pre-pandemic trend by 24.27 percentage points in February 2022. The more severe pXDR and pPDR tiers moved in the same direction, whereas the two single-genus phenotypes diverged: VRE showed no significant pandemic departure, while MRSA departed significantly from its pre-pandemic trajectory in the primary model even though its positivity continued to fall in every phase. At the class level, carbapenem and third-/fourth-generation cephalosporin non-susceptibility rose and returned to baseline with the pandemic phase, whereas fluoroquinolone non-susceptibility in E. coli and K. pneumoniae did not revert. Together, these patterns were consistent with our a priori hypothesis of divergent rather than convergent resistance dynamics.
These findings help reconcile apparently conflicting reports. Aggregate national surveillance, such as the U.S. analysis of seven hospital-onset resistant infections, documented a combined ~20% pandemic increase that peaked in 2021 [15], whereas systematic reviews found no consistent overall effect for MRSA or vancomycin-resistant enterococci and only heterogeneous signals among Gram-negative organisms [13]. Our data show that both observations can hold within a single institution: a real, Gram-negative-dominated increase that did not fully reverse, superimposed on divergent organism-specific baselines. Our VRE result is consistent with the pooled estimate; MRSA is where we differ, departing significantly from its pre-pandemic trajectory while continuing to decline in absolute terms. That combination is invisible to a pre-versus-post comparison, and separating it is what segmented regression is for: distinguishing an abrupt pandemic-associated change from the continuation of a pre-existing trend.
The organism-resolved results are the most informative. E. coli showed the largest departure from its extrapolated pre-pandemic trajectory, driven entirely by a slope reversal rather than an abrupt change in level, and it had not returned to that trajectory by 2026. K. pneumoniae differed in form rather than in magnitude, with an abrupt level rise at pandemic onset together with a slope change that never reverted. This contrasts with an earlier Mexican tertiary-care series in which K. pneumoniae resistance appeared stable during 2021–2022 [20], underscoring how sensitive such conclusions are to the observation window and analytic method. S. aureus, by contrast, continued to decline in every phase, although it too showed an abrupt rise in level at pandemic onset. Consistent with its recognized capacity for environmental persistence and clonal nosocomial spread [16,17], the A. baumannii complex carried the highest combined pXDR/pPDR burden of any organism, and the COVID and ICU unit—setting in which mechanical ventilation, invasive devices and patient cohorting are common—carried the highest pXDR and pPDR positivity, in keeping with the exposure-related epidemiology described in large ICU cohorts [8].
A plausible contributor to the reverting component of these class-level signals is the well-documented surge in antibiotic exposure during the early pandemic [21]. In México, this pattern is quantifiable: in a national IMSS cohort of 214,171 adult COVID-19 inpatients, 25.3% received empirical antibiotics, of which cephalosporins accounted for 75.7% [22]; and in a Mexican secondary-care hospital, total antibiotic consumption peaked in 2020 at 330 defined daily doses (DDD)/100 bed days, dominated by WHO Watch-group agents (83.1%), before falling by roughly half in 2021–2022 [23]. Community prescribing followed suit, with ceftriaxone (25%), azithromycin (19%), and clarithromycin among the most prescribed drugs in México City outpatients and 28% of prescriptions self-initiated [24]. The temporal correspondence is notable, since carbapenem and cephalosporin non-susceptibility rose and returned to baseline over the same interval in which that consumption peak was reported and then receded, whereas fluoroquinolone non-susceptibility did not return. Part of that difference is methodological rather than biological, since the ciprofloxacin breakpoint was revised during the study period and the post-peak fluoroquinolone trend is sensitive to which criterion is applied throughout (Table S5).
The concordance is in any case ecological and hypothesis-generating rather than causal, and no inference about individual-level exposure and resistance follows from it; the documented decrease in consumption at a Mexican pediatric center over the same period [25] further cautions against assuming uniform national exposure and mirrors the phenotype-specific heterogeneity in our data.
These observations carry policy relevance. México has progressively strengthened antimicrobial governance: the 2010 restriction of over-the-counter antibiotic sales coincided with a fall in national consumption from 10.5 to 7.5 DDD/1000 inhabitants/day [26], and the Estrategia Nacional de Acción contra la Resistencia a los Antimicrobianos, made mandatory in 2018, aligned national policy with the WHO Global Action Plan under a One Health framework [27,28]. Also, data from the PUCRA network, which include Jalisco, showed a considerable increase in hospital antibiotic consumption over the pandemic period: the median consumption of cephalosporins, the most frequently used class across participating hospitals, rose from 17.8 DDD per 100 bed days in 2020 to a peak of 27 in 2022 and stayed elevated thereafter (24.48 in 2024) [29]. This trend parallels the rise in cephalosporin non-susceptibility we observed at pandemic onset, although our institutional non-susceptibility returned to baseline after 2022, while regional consumption continued to rise. Analyses such as the present one illustrate the granularity that organism-resolved surveillance within such networks can add to aggregate benchmarking. However, implementation of hospital antimicrobial stewardship remains uneven across México [30], and stewardship activities were widely disrupted during the pandemic even as empirical prescribing rose [31]. Reinforcing stewardship and infection prevention during future surges could blunt comparable increases, since structured hospital stewardship interventions improve prescribing and reduce resistant infections without compromising clinical outcomes [32]. Metrics such as the WHO AWaRe classification [33], under which Watch-group agents dominated early pandemic consumption [23], offer a practical stewardship target for the recovery period.
The principal strengths of this study are a long, continuous series spanning distinct pre-pandemic, pandemic, and post-peak phases, a large isolate volume, and an analytic approach that separates levels from slope change and resolves trajectories by organism, antimicrobial class, specimen, and service rather than reporting a single aggregated outcome. Several limitations should nonetheless be considered. This was a retrospective, single-center study at a tertiary-level referral hospital, and its case-mix limits generalizability to other settings; whether the trajectories described here are institution-specific or reflect broader regional patterns will require multicenter surveillance using comparable phase definitions. Resistance phenotypes were derived from routine antibiogram results rather than molecular confirmation, so a phenotype is not equated with a resistance mechanism. Because routine panels were often incomplete, the extensively and pandrug-resistant tiers are reported as possible rather than confirmed, and incomplete panels bias the tiers in opposite directions: MDR requires non-susceptibility in at least three categories and is therefore harder to meet when fewer categories are tested, whereas pXDR and pPDR are defined relative to the categories that were evaluable and are correspondingly easier to meet. Both the number of categories tested and the agents within them varied over the study period (Table S2), although restricting the cohort to isolates with progressively broader panel coverage did not abolish the cohort MDR counterfactual (Table S2b). Interpretive criteria also changed, since successive CLSI editions were applied as they came into force; the effect of holding breakpoints fixed is shown in Tables S5 and S6. Monthly denominators varied substantially, and each month contributed equally to the segmented models irrespective of the number of isolates tested (Table S3). The composition of the cohort by organism, specimen, and service also shifted across phases; an isolate-level model adjusted for these factors and clustered by patient preserved the pandemic-onset slope change, although the onset level shift was attenuated (Table S4). Antimicrobial consumption data for this hospital were not available for the study period, so the comparison with prescribing rests on national and regional sources rather than on institutional exposure.
The analytic approach carries limitations of its own. The counterfactual rests on an assumption that cannot be tested: that the pre-pandemic trend would have continued unchanged in the absence of the pandemic. Segmented linear regression was selected because its coefficients are directly interpretable as percentage points per month, but a linear model on a bounded proportion is not constrained to admissible values, and for three series the extrapolated pre-pandemic trend falls below zero at the primary contrast point; pPDR (−5.8%), MRSA (−5.0%), and S. aureus MDR (−0.2%). In January 2026, the same is true of five of the eight series, so that contrast is reported for completeness rather than as an estimate. For these three, the linear counterfactual overstates the departure, and the bounded refit below is the preferable estimate. Refitting on the logit scale with a quasi-binomial variance, which cannot generate inadmissible values, yields smaller differences in all three cases: +8.80 pp for pPDR (p < 0.0001), +9.06 pp for MRSA (p = 0.0598), and +9.03 pp for S. aureus MDR (p = 0.0777), so that the MRSA and S. aureus departures are not significant under the bounded specification (Table S3b). Where the extrapolations remain admissible, the two specifications are close in direction and magnitude; cohort MDR +24.27 against +22.38 pp, pXDR +8.93 against +8.85 pp, E. coli MDR +48.82 against +49.79 pp, K. pneumoniae MDR +42.21 against +35.64 pp, each significant under both, while VRE remains null under both (p = 0.6969 and p = 0.3830), so the principal findings do not depend on the choice of link. Phase boundaries were specified a priori rather than identified from the data, and the three phases differ substantially in length; shifting both interruption dates by up to 2 months in either direction gave counterfactuals between 19.37 and 24.27 pp, significant in every variant (all p ≤ 0.0002), with the pre-specified dates yielding the largest estimate (Table S1).
4. Materials and Methods
4.1. Study Design and Setting
This retrospective interrupted time-series study was conducted at the Antiguo Hospital Civil de Guadalajara “Fray Antonio Alcalde”, a tertiary-care referral hospital in Guadalajara, México. Isolate-level identification and antimicrobial susceptibility data for bacteria processed between October 2017 and January 2026, with valid identification and interpretable susceptibility results, were extracted from the clinical microbiology laboratory information system. The period was divided into three phases: pre-pandemic (October 2017 to February 2020), pandemic (March 2020 to February 2022), and post-peak (March 2022 to January 2026). The first interruption marked the onset of COVID-19 and hospital reorganization; the second coincided with México’s transition to the lowest national epidemiological-risk category and progressive hospital reconversion [34].
4.2. Isolate Selection and Deduplication
To limit overrepresentation of repeated cultures from the same episode, isolates were deduplicated by retaining the first isolate of each microorganism per patient within a rolling 14-day window, regardless of susceptibility profile; a later isolate of the same microorganism was eligible only if recovered more than 14 days after the previous eligible one. This follows the first-isolate principle used for cumulative antibiogram reporting, in which the susceptibility profile is deliberately not considered; admitting a later isolate because its profile had changed would preferentially retain isolates from treated patients and bias resistance proportions upward. Fungal and other non-bacterial isolates were excluded.
4.3. Identification and Antimicrobial Susceptibility Testing
Specimens were processed by routine diagnostic procedures. Colony suspensions were adjusted to 0.5 McFarland (VITEK DensiCHEK; bioMérieux, Marcy-l’Étoile, France) and identified on the VITEK 2XL platform with GN or GP cards. Susceptibility testing used organism-specific AST cards (AST-GP75, AST-P663, AST-N271, AST-N272, AST-N401, AST-N402, AST-N403) as available; the agents included on each card are listed in Table A1. Results were interpreted using the edition of the Clinical and Laboratory Standards Institute M100 standard in force at the time of testing [35], so that interpretive criteria followed successive editions across the study period rather than a single retrospective standard. The identification and susceptibility-testing platform was unchanged throughout the study period.
4.4. Resistance Phenotype Classification
Phenotypes were assigned per isolate using the organism-specific antimicrobial category sets of Magiorakos et al. [7]: 16 categories for Enterobacterales (Enterobacteriaceae in the source’s nomenclature), 8 for Pseudomonas aeruginosa, 9 for Acinetobacter spp., 16 of the 17 listed for Staphylococcus aureus, and 9 and 8 for Enterococcus faecium and the remaining enterococci, respectively. As the source requires, categories to which a species is intrinsically resistant were removed before the criteria were applied: penicillins for Klebsiella spp. and Raoultella spp.; penicillins, non-extended-spectrum cephalosporins, and cephamycins for the AmpC-producing genera (Enterobacter spp., Citrobacter spp., Hafnia, Klebsiella aerogenes, Serratia spp., Morganella morganii, and Providencia spp.), in which the penicillin plus β-lactamase inhibitor category was also restricted to piperacillin-tazobactam, with polymyxins removed for Serratia spp.; polymyxins, tetracyclines, and glycylcyclines for Proteus spp., Morganella spp., and Providencia spp.; streptogramins for Enterococcus faecalis and the other non-faecium enterococci; and glycopeptides for the vanC species E. gallinarum and E. casseliflavus. Carbapenems were not treated as an applicable category for any enterococcus. Organisms for which the source defines no category set (coagulase-negative staphylococci, streptococci, Stenotrophomonas maltophilia, other non-fermenting Gram-negative bacilli and fungi) and the taxa it places outside its scope (Salmonella spp., Shigella spp., Streptococcus pneumoniae, Neisseria gonorrhoeae) were non-evaluable and were excluded from every phenotype numerator and denominator.
MRSA was defined as S. aureus non-susceptible to oxacillin or cefoxitin. VRE were E. faecalis, E. faecium, or unspeciated enterococci resistant to vancomycin, excluding the intrinsically vanC species E. gallinarum and E. casseliflavus.
Resistant and intermediate results were treated as non-susceptible, and untested or uninterpretable results as missing. A category was evaluable when at least one applicable agent returned an interpretable result, and non-susceptible when at least one tested agent was non-susceptible; MDR was non-susceptibility in at least three categories. No isolate was tested against every category applicable to its organism, and the source states that under incomplete testing isolates, it can only be characterized as possible XDR or possible PDR, and that such results are not comparable with confirmed ones [7]. Both tiers are therefore reported as pXDR and pPDR throughout, assigned as follows: pXDR, an MDR isolate non-susceptible in all evaluable categories except at most two; pPDR, an MDR isolate with no susceptible result among the agents tested within its applicable categories.
4.5. Statistical Analysis
For each phenotype, the unit of analysis was the monthly proportion of phenotype-positive among evaluable isolates [100 × positive/(positive + negative)]; non-evaluable phenotype months were excluded from both numerator and denominator. Each series was modeled by segmented (interrupted) time-series regression, an established approach for estimating level and slope changes at pre-specified interruptions [36,37]:
where Yt is the monthly positivity (%); Tt is the number of months since study start; D2t and D3t indicate the pandemic and post-peak phases (1 from phase onset, 0 before); and K2, K3 are the months at which those phases begin. β0 and β1 give the pre-pandemic intercept and slope, β2 and β3 the level and slope change at the pandemic onset, and β4 and β5 at the post-peak onset. Net slopes were calculated as β1 (pre-pandemic), β1 + β3 (pandemic), and β1 + β3 + β5 (post-peak); models were fitted by ordinary least squares. Residual first-order autocorrelation was tested (Breusch–Godfrey) and, when significant (p < 0.05), refitted by generalized least squares with a first-order autoregressive error structure; the Durbin–Watson statistic and the estimated autoregressive coefficient (AR(1)φ) are reported for each model. Newey–West autocorrelation- and heteroscedasticity-consistent standard errors were also reported. Counterfactual contrasts—the difference between the fitted value and the extrapolated pre-pandemic trend—were reported in percentage points with 95% confidence intervals at the end of the pandemic phase (February 2022; primary) and at study end (January 2026). A joint Wald test of β3 + β5 = 0 assessed the combined slope change. The pre-pandemic slope is estimated 29 months, which is why February 2022, 24 months on, is the primary contrast.
Yₜ = β0 + β1Tₜ + β2D2ₜ + β3D2ₜ(Tₜ − K2) + β4D3ₜ + β5D3ₜ(Tₜ − K3) + εₜ
Sensitivity analyses are reported in the Supplementary Materials: shifting both interruption dates by up to 2 months (Table S1); panel coverage by phase, and the cohort model refitted under progressively stricter coverage requirements (Table S2); weighted, binomial, and quasi-binomial specifications, with the February 2022 counterfactual refitted on the logit scale for every series (Table S3); an isolate-level segmented logistic model adjusted for species, specimen type, and service with robust standard errors clustered by patient, together with cohort composition by phase (Table S4); and non-susceptibility recomputed with breakpoints held fixed across the study period (Tables S5 and S6).
Antibiotic-class non-susceptibility was smoothed by locally weighted scatterplot smoothing (LOESS); a span of 0.3 was chosen because, in a 100-month series, it resolves change over roughly 30 months while suppressing month-to-month sampling variation, and the smoother is used for display only. Between-phase differences were compared by Mann–Whitney U on the monthly proportions, each month treated as the unit of observation, with Benjamini–Hochberg false-discovery-rate correction (adjusted values denoted q). Because consecutive monthly proportions are not independent, these class-level comparisons are descriptive and are not interpreted as tests of interruption. Analyses used Python 3.13.3 (pandas 2.2.3, NumPy 2.3.4, statsmodels 0.14.6, SciPy 1.16.0, Matplotlib 3.10.3); all tests were two-sided with p < 0.05 significant.
4.6. Ethics
This retrospective study used deidentified routine microbiological records and was approved by the Comité de Ética en Investigación of the Antiguo Hospital Civil de Guadalajara “Fray Antonio Alcalde” (approval number HCG/FAA/CEI-914/26), a committee registered with the Comisión Nacional de Bioética (registration validity reference no. 3018), in accordance with the Reglamento de la Ley General de Salud en Materia de Investigación para la Salud. Data extraction was performed in June 2026, after the study period closed and after the committee’s approval. The study was conducted in accordance with the Declaration of Helsinki.
5. Conclusions
Our principal findings show that the COVID-19 pandemic was associated with divergent changes in antimicrobial resistance at this Mexican referral hospital: an abrupt rise at pandemic onset followed by an incomplete return, concentrated in Gram-negative organisms, with Escherichia coli and Klebsiella pneumoniae departing from their pre-pandemic trajectories by different mechanisms and not returning to them. The pattern was mirrored at class level, where carbapenem and cephalosporin non-susceptibility returned to baseline, while fluoroquinolone non-susceptibility did not, in part reflecting a change in breakpoint. The highest burden of possible extensive and pandrug-resistant phenotypes occurred in the COVID unit and the intensive care unit. Aggregate measures risk both overstating a uniform pandemic resistance surge and masking the pathogens that matter most. Our analysis illustrates the value of organism-resolved, appropriately modelled surveillance, which distinguished pathogen-specific trajectories that aggregate analysis would have missed. Such surveillance, coupled with sustained antimicrobial stewardship, should inform preparedness for future health-system shocks. To our knowledge, this is one of the few studies in Mexico to characterize these resistance trajectories across the pre-pandemic, pandemic, and recovery periods using a long, continuous, organism-resolved time series.
Supplementary Materials
The following supporting information can be downloaded at: https://www.mdpi.com/article/10.3390/antibiotics15101005/s1. Table S1: Alternative placement of the interruptions (cohort-wide MDR); Table S2: Panel coverage by phase; Table S3: Robustness of February 2022 counterfactual to model specification; Table S4: Case-mix adjustment (isolate-level segmented logistic regression, cohort-wide MDR); Table S5: Fixed-breakpoint sensitivity for agents revised during the study period (Enterobacterales); Table S6: Robustness of the composite MDR trajectory to fixed breakpoints (Enterobacterales).
Author Contributions
Conceptualization, J.G.-G. and A.S.M.-C.; methodology, A.S.M.-C., L.F.J.-S., G.H.-F., B.R.R.-M. and L.I.-G.; software, M.A.A.-A. and M.C.R.-L.; validation, M.M.V.-G., M.C.R.-L., B.R.R.-M., M.A.A.-A., L.E.d.M.-T., T.D.J.H.-F. and A.A.-L.; formal analysis, J.G.-G. and L.E.d.M.-T.; investigation, M.A.A.-A., L.E.d.M.-T., T.D.J.H.-F. and A.A.-L.; resources, L.F.J.-S., G.H.-F., L.I.-G., M.A.A.-A. and T.D.J.H.-F.; data curation, M.M.V.-G., M.C.R.-L. and B.R.R.-M.; writing—original draft preparation, A.S.M.-C., J.G.-G. and L.E.d.M.-T.; writing—review and editing, B.R.R.-M., L.F.J.-S., A.A.-L., M.M.V.-G., G.H.-F., L.I.-G. and A.S.M.-C.; visualization, J.G.-G., T.D.J.H.-F. and M.C.R.-L.; supervision, B.R.R.-M., L.F.J.-S., A.A.-L., M.M.V.-G., G.H.-F. and L.I.-G. All authors have read and agreed to the published version of the manuscript.
Funding
This research received no external funding.
Institutional Review Board Statement
The study was conducted in accordance with the Declaration of Helsinki and approved by the Ethics Committee of the Antiguo Hospital Civil de Guadalajara “Fray Antonio Alcalde” (protocol HCG/FAA/CEI-914/26, approved 2 June 2026).
Informed Consent Statement
Patient consent was waived by the Comité de Ética en Investigación, código HCG/FAA/CEI-914/26 because the study was retrospective and non-interventional, involved no collection of biological samples, and used a fully de-identified database containing no direct or indirect patient identifiers; results are reported only in aggregate.
Data Availability Statement
The data presented in this study are available on request from the corresponding author due to privacy and ethical restrictions, as the dataset derives from patient clinical microbiology records under applicable Mexican regulations.
Acknowledgments
The authors thank the staff of the Laboratorio de Microbiología at the Antiguo Hospital Civil de Guadalajara “Fray Antonio Alcalde” for their daily work that made this analysis feasible. J.G.-G. (CVU 1256380) is grateful for the scholarship awarded from the Secretaría de Ciencias, Humanidades, Tecnología e Innovación (SECIHTI)-México. Artificial intelligence (a large language model (Claude, Anthropic)) was used solely for English language editing; all research, conceptual design, data analysis, and manuscript content are entirely the work of the authors. The authors have reviewed and edited the output and take full responsibility for the content of this publication.
Conflicts of Interest
The authors declare no conflicts of interest.
Abbreviations
The following abbreviations are used in this manuscript:
| AMR | antimicrobial resistance |
| AR(1) | first-order autoregressive |
| AST | antimicrobial susceptibility testing |
| AWaRe | Access, Watch, Reserve (WHO antibiotic classification) |
| CI | confidence interval |
| CLSI | Clinical and Laboratory Standards Institute |
| COVID-19 | coronavirus disease 2019 |
| DDD | defined daily dose |
| ESBL | extended-spectrum β-lactamase |
| ESKAPE | Enterococcus faecium, Staphylococcus aureus, Klebsiella pneumoniae, Acinetobacter baumannii, Pseudomonas aeruginosa and Enterobacter spp. |
| ESKAPE-E | Enterococcus faecium, Staphylococcus aureus, Klebsiella pneumoniae, Acinetobacter baumannii, Pseudomonas aeruginosa, Enterobacter spp. and Escherichia coli |
| GLS | generalized least squares |
| GN/GP | Gram-negative/Gram-positive (VITEK identification card) |
| ICU | intensive care unit |
| IMSS | Instituto Mexicano del Seguro Social |
| LOESS | locally weighted scatterplot smoothing |
| MDR | multidrug-resistant |
| MRSA | methicillin-resistant Staphylococcus aureus |
| OLS | ordinary least squares |
| PDR | pandrug-resistant |
| pp | percentage points |
| pPDR | possible pandrug-resistant |
| PUCRA | Plan Universitario de Control de la Resistencia Antimicrobiana |
| pXDR | possible extensively drug-resistant |
| VRE | vancomycin-resistant enterococci |
| WHO | World Health Organization |
| XDR | extensively drug-resistant |
Appendix A
Table A1.
Antimicrobial agents included on each VITEK AST card.
Table A2.
Segmented regression model coefficients for possible extensively drug-resistant (pXDR) positivity in the full cohort.
Table A3.
Segmented regression model coefficients for possible pandrug-resistant (pPDR) positivity in the full cohort.
Table A4.
Segmented regression model coefficients for vancomycin-resistant enterococci (VRE) positivity.
Table A5.
Segmented regression model coefficients for methicillin-resistant Staphylococcus aureus (MRSA) positivity.
Table A6.
Segmented regression model coefficients for multidrug-resistant (MDR) positivity in Staphylococcus aureus.
References
- Murray, C.J.L.; Ikuta, K.S.; Sharara, F.; Swetschinski, L.; Robles Aguilar, G.; Gray, A.; Han, C.; Bisignano, C.; Rao, P.; Wool, E.; et al. Global burden of bacterial antimicrobial resistance in 2019: A systematic analysis. Lancet 2022, 399, 629–655. [Google Scholar] [CrossRef] [Scilit] [PubMed]
- Naghavi, M.; Vollset, S.E.; Ikuta, K.S.; Swetschinski, L.R.; Gray, A.P.; Wool, E.E.; Robles Aguilar, G.; Mestrovic, T.; Smith, G.; Han, C.; et al. Global burden of bacterial antimicrobial resistance 1990–2021: A systematic analysis with forecasts to 2050. Lancet 2024, 404, 1199–1226. [Google Scholar] [CrossRef] [Scilit] [PubMed]
- The burden of antimicrobial resistance in the Americas in 2019: A cross-country systematic analysis. Lancet Reg. Health Am. 2023, 25, 100561. [CrossRef] [Scilit] [PubMed]
- World Health Organization. WHO Bacterial Priority Pathogens List, 2024: Bacterial Pathogens of Public Health Importance to Guide Research, Development and Strategies to Prevent and Control Antimicrobial Resistance; World Health Organization: Geneva, Switzerland, 2024. [Google Scholar]
- Sati, H.; Carrara, E.; Savoldi, A.; Hansen, P.; Garlasco, J.; Campagnaro, E.; Boccia, S.; Castillo-Polo, J.A.; Magrini, E.; Garcia-Vello, P.; et al. The WHO Bacterial Priority Pathogens List 2024: A prioritisation study to guide research, development, and public health strategies against antimicrobial resistance. Lancet Infect. Dis. 2025, 25, 1033–1043. [Google Scholar] [CrossRef] [Scilit] [PubMed]
- De Oliveira, D.M.P.; Forde, B.M.; Kidd, T.J.; Harris, P.N.A.; Schembri, M.A.; Beatson, S.A.; Paterson, D.L.; Walker, M.J. Antimicrobial Resistance in ESKAPE Pathogens. Clin. Microbiol. Rev. 2020, 33, e00181-19. [Google Scholar] [CrossRef] [Scilit] [PubMed]
- Magiorakos, A.P.; Srinivasan, A.; Carey, R.B.; Carmeli, Y.; Falagas, M.E.; Giske, C.G.; Harbarth, S.; Hindler, J.F.; Kahlmeter, G.; Olsson-Liljequist, B.; et al. Multidrug-resistant, extensively drug-resistant and pandrug-resistant bacteria: An international expert proposal for interim standard definitions for acquired resistance. Clin. Microbiol. Infect. 2012, 18, 268–281. [Google Scholar] [CrossRef] [Scilit] [PubMed]
- Vincent, J.L.; Sakr, Y.; Singer, M.; Martin-Loeches, I.; Machado, F.R.; Marshall, J.C.; Finfer, S.; Pelosi, P.; Brazzi, L.; Aditianingsih, D.; et al. Prevalence and Outcomes of Infection Among Patients in Intensive Care Units in 2017. JAMA 2020, 323, 1478–1487. [Google Scholar] [CrossRef] [Scilit] [PubMed]
- Langford, B.J.; So, M.; Raybardhan, S.; Leung, V.; Soucy, J.-P.R.; Westwood, D.; Daneman, N.; MacFadden, D.R. Antibiotic prescribing in patients with COVID-19: Rapid review and meta-analysis. Clin. Microbiol. Infect. 2021, 27, 520–531. [Google Scholar] [CrossRef] [Scilit] [PubMed]
- Langford, B.J.; So, M.; Raybardhan, S.; Leung, V.; Westwood, D.; MacFadden, D.R.; Soucy, J.R.; Daneman, N. Bacterial co-infection and secondary infection in patients with COVID-19: A living rapid review and meta-analysis. Clin. Microbiol. Infect. 2020, 26, 1622–1629. [Google Scholar] [CrossRef] [Scilit] [PubMed]
- Russell, C.D.; Fairfield, C.J.; Drake, T.M.; Turtle, L.; Seaton, R.A.; Wootton, D.G.; Sigfrid, L.; Harrison, E.M.; Docherty, A.B.; de Silva, T.I.; et al. Co-infections, secondary infections, and antimicrobial use in patients hospitalised with COVID-19 during the first pandemic wave from the ISARIC WHO CCP-UK study: A multicentre, prospective cohort study. Lancet Microbe 2021, 2, e354–e365. [Google Scholar] [CrossRef] [Scilit] [PubMed]
- Knight, G.M.; Glover, R.E.; McQuaid, C.F.; Olaru, I.D.; Gallandat, K.; Leclerc, Q.J.; Fuller, N.M.; Willcocks, S.J.; Hasan, R.; van Kleef, E.; et al. Antimicrobial resistance and COVID-19: Intersections and implications. eLife 2021, 10, e64139. [Google Scholar] [CrossRef] [Scilit] [PubMed]
- Langford, B.J.; Soucy, J.R.; Leung, V.; So, M.; Kwan, A.T.H.; Portnoff, J.S.; Bertagnolio, S.; Raybardhan, S.; MacFadden, D.R.; Daneman, N. Antibiotic resistance associated with the COVID-19 pandemic: A systematic review and meta-analysis. Clin. Microbiol. Infect. 2023, 29, 302–309. [Google Scholar] [CrossRef] [Scilit] [PubMed]
- Langford, B.J.; So, M.; Simeonova, M.; Leung, V.; Lo, J.; Kan, T.; Raybardhan, S.; Sapin, M.E.; Mponponsuo, K.; Farrell, A.; et al. Antimicrobial resistance in patients with COVID-19: A systematic review and meta-analysis. Lancet Microbe 2023, 4, e179–e191. [Google Scholar] [CrossRef] [Scilit] [PubMed]
- Yek, C.; Mancera, A.G.; Diao, G.; Walker, M.; Neupane, M.; Chishti, E.A.; Amirahmadi, R.; Richert, M.E.; Rhee, C.; Klompas, M.; et al. Impact of the COVID-19 Pandemic on Antibiotic Resistant Infection Burden in U.S. Hospitals: Retrospective Cohort Study of Trends and Risk Factors. Ann. Intern. Med. 2025, 178, 796–807. [Google Scholar] [CrossRef] [Scilit] [PubMed]
- Wong, S.C.; Lam, G.K.; Chen, J.H.; Li, X.; Ip, F.T.; Yuen, L.L.; Chan, V.W.; AuYeung, C.H.; So, S.Y.; Ho, P.L.; et al. Air dispersal of multidrug-resistant Acinetobacter baumannii: Implications for nosocomial transmission during the COVID-19 pandemic. J. Hosp. Infect. 2021, 116, 78–86. [Google Scholar] [CrossRef] [Scilit] [PubMed]
- Boral, J.; Genç, Z.; Pınarlık, F.; Ekinci, G.; Kuskucu, M.A.; İrkören, P.; Kapmaz, M.; Tekin, S.; Çakar, N.; Şentürk, E.; et al. The association between Acinetobacter baumannii infections and the COVID-19 pandemic in an intensive care unit. Sci. Rep. 2022, 12, 20808. [Google Scholar] [CrossRef] [Scilit] [PubMed]
- Miranda-Novales, M.G.; Flores-Moreno, K.; López-Vidal, Y.; Rodríguez-Álvarez, M.; Solórzano-Santos, F.; Soto-Hernández, J.L.; Ponce de León-Rosales, S. Antimicrobial resistance and antibiotic consumption in Mexican hospitals. Salud Publica Mex. 2020, 62, 42–49. [Google Scholar] [CrossRef] [Scilit] [PubMed]
- Garza-González, E.; Bocanegra-Ibarias, P.; Bobadilla-Del-Valle, M.; Ponce-de-León-Garduño, L.A.; Esteban-Kenel, V.; Silva-Sánchez, J.; Garza-Ramos, U.; Barrios-Camacho, H.; López-Jácome, L.E.; Colin-Castro, C.A.; et al. Drug resistance phenotypes and genotypes in Mexico in representative gram-negative species: Results from the infivar network. PLoS ONE 2021, 16, e0248614. [Google Scholar] [CrossRef] [Scilit] [PubMed]
- Cureño-Díaz, M.A.; Plascencia-Nieto, E.S.; Loyola-Cruz, M.; Cruz-Cruz, C.; Nolasco-Rojas, A.E.; Durán-Manuel, E.M.; Ibáñez-Cervantes, G.; Gómez-Zamora, E.; Tamayo-Ordóñez, M.C.; Tamayo-Ordóñez, Y.J.; et al. Gram-Negative ESKAPE Bacteria Surveillance in COVID-19 Pandemic Exposes High-Risk Sequence Types of Acinetobacter baumannii MDR in a Tertiary Care Hospital. Pathogens 2024, 13, 50. [Google Scholar] [CrossRef] [Scilit] [PubMed]
- Rawson, T.M.; Moore, L.S.P.; Zhu, N.; Ranganathan, N.; Skolimowska, K.; Gilchrist, M.; Satta, G.; Cooke, G.; Holmes, A. Bacterial and Fungal Coinfection in Individuals with Coronavirus: A Rapid Review to Support COVID-19 Antimicrobial Prescribing. Clin. Infect. Dis. 2020, 71, 2459–2468. [Google Scholar] [CrossRef] [Scilit] [PubMed]
- Murillo-Zamora, E.; Trujillo, X.; Huerta, M.; Mendoza-Cano, O.; Guzmán-Esquivel, J.; Guzmán-Solórzano, J.A.; Ochoa-Castro, M.R.; Ortega-Macías, A.G.; Zepeda-Anaya, A.L.; Ruiz-Montes de Oca, V.; et al. Empirical Antibiotic Prescribing in Adult COVID-19 Inpatients over Two Years in Mexico. Antibiotics 2022, 11, 764. [Google Scholar] [CrossRef] [Scilit] [PubMed]
- Dávila-López, E.C.; Berumen-Lechuga, M.G.; Molina-Pérez, C.J.; Jimenez-Juarez, R.N.; Leaños-Miranda, A.; Robles-Ordoñez, N.; Peña-Cano, M.I.; Venegas-Esquivel, G.A. Antimicrobial Resistance and Antibiotic Consumption in a Secondary Care Hospital in Mexico. Antibiotics 2024, 13, 178. [Google Scholar] [CrossRef] [Scilit] [PubMed]
- Fuentes-Gonzalez, M.F.; Ordinola Navarro, A.; Carmona-Aguilera, Z.; Hernández-Jimenez, C.A.; Benitez-Altamirano, G.M.; Beltran-Ontiveros, L.D.; Lopez-Vejar, C.; Ramirez-Hinojosa, J.P.; Vera-Lastra, O.; Lopez Luis, B.A. Outpatient prescription patterns of COVID-19 drugs in the metropolitan area of Mexico City. Fam. Pract. 2022, 39, 515–518. [Google Scholar] [CrossRef] [Scilit] [PubMed]
- Pérez-Morales, A.M.; Jiménez-Juárez, R.N.; Morales-Ríos, O.M.; Reyes-López, A.; Clark, P.; Islas-Ortega, E.J.; Ortega-Riosvelasco, F.; Gómez-Gaytán, H.; Castellanos-Cruz, M.d.C.; Vargas-Neri, J.L.; et al. Antibacterial consumption before, during, and after the COVID-19 pandemic in a tertiary care pediatric hospital in Mexico. PLoS ONE 2025, 20, e0329220. [Google Scholar] [CrossRef] [Scilit] [PubMed]
- Santa-Ana-Tellez, Y.; Mantel-Teeuwisse, A.K.; Dreser, A.; Leufkens, H.G.M.; Wirtz, V.J. Impact of Over-the-Counter Restrictions on Antibiotic Consumption in Brazil and Mexico. PLoS ONE 2013, 8, e75550. [Google Scholar] [CrossRef] [Scilit] [PubMed]
- World Health Organization. Global Action Plan on Antimicrobial Resistance; World Health Organization: Geneva, Switzerland, 2015. [Google Scholar]
- Giono, S.; Santos-Preciado, J.; Morfin-Otero, R.; Torres, J.; Alcantar-Curiel, D. Resistencia antimicrobiana. Importancia y esfuerzos por contenerla. Gac. Médica De México 2020, 156, 172–180. [Google Scholar] [CrossRef] [Scilit]
- Universidad Nacional Autónoma de México; Plan Universitario de Control de la Resistencia Antimicrobiana. Resistencia Antimicrobiana en México 2017 a 2024. Reporte de Los Hospitales de la Red PUCRA: Resistencia Antimicrobiana y Consumo de Antibióticos; Universidad Nacional Autónoma de México: Ciudad de México, Mexico, 2025. [Google Scholar]
- Dreser, A.; Hegewisch-Taylor, J.; Cortés-Ortiz, M.A.; Levy-Hara, G. Progress and challenges in the implementation of antimicrobial stewardship programs in 50 hospitals in Mexico. J. Glob. Antimicrob. Resist. 2025, 43, 40–50. [Google Scholar] [CrossRef] [Scilit] [PubMed]
- Rawson, T.M.; Ming, D.; Ahmad, R.; Moore, L.S.P.; Holmes, A.H. Antimicrobial use, drug-resistant infections and COVID-19. Nat. Rev. Microbiol. 2020, 18, 409–410. [Google Scholar] [CrossRef] [Scilit] [PubMed]
- Baur, D.; Gladstone, B.P.; Burkert, F.; Carrara, E.; Foschi, F.; Döbele, S.; Tacconelli, E. Effect of antibiotic stewardship on the incidence of infection and colonisation with antibiotic-resistant bacteria and Clostridium difficile infection: A systematic review and meta-analysis. Lancet Infect. Dis. 2017, 17, 990–1001. [Google Scholar] [CrossRef] [Scilit] [PubMed]
- Sharland, M.; Pulcini, C.; Harbarth, S.; Zeng, M.; Gandra, S.; Mathur, S.; Magrini, N. Classifying antibiotics in the WHO Essential Medicines List for optimal use-be AWaRe. Lancet Infect. Dis. 2018, 18, 18–20. [Google Scholar] [CrossRef] [Scilit] [PubMed]
- Gobierno de México, Secretaría de Salud. Semáforo de Riesgo Epidemiológico COVID-19. Available online: https://coronavirus.gob.mx/semaforo/ (accessed on 20 August 2026).
- Clinical and Laboratory Standards Institute (CLSI). Performance Standards for Antimicrobial Susceptibility Testing, M100, Editions in Force During the Study Period (M100-S27 [2017] and M100-S28 [2018] Through M100-Ed35 [2025]); CLSI: Wayne, PA, USA, 2017–2025. [Google Scholar]
- Wagner, A.K.; Soumerai, S.B.; Zhang, F.; Ross-Degnan, D. Segmented regression analysis of interrupted time series studies in medication use research. J. Clin. Pharm. Ther. 2002, 27, 299–309. [Google Scholar] [CrossRef] [Scilit] [PubMed]
- Bernal, J.L.; Cummins, S.; Gasparrini, A. Interrupted time series regression for the evaluation of public health interventions: A tutorial. Int. J. Epidemiol. 2017, 46, 348–355. [Google Scholar] [CrossRef] [Scilit] [PubMed]

Disclaimer/Publisher’s Note: The statements, opinions and data contained in all publications are solely those of the individual author(s) and contributor(s) and not of MDPI and/or the editor(s). MDPI and/or the editor(s) disclaim responsibility for any injury to people or property resulting from any ideas, methods, instructions or products referred to in the content. |
© 2026 by the authors. Licensee MDPI, Basel, Switzerland. This article is an open access article distributed under the terms and conditions of the Creative Commons Attribution (CC BY) license.