


Abstract
Executive functions (EFs) and self-regulation (SR) strategies are rarely studied together, particularly in sustained behavioral SR, which overlaps with vigilance demands yet is absent from traditional SR measurement. We examined whether EFs predict SR strategy use or the strategy–performance association during a prolonged, monotonous task. We assessed 254 adults (Mage = 29.24, SD = 7.85) using the Brief Executive Function battery (shifting, inhibition, procedural working memory [pWM]) alongside the Mice Task, intended to elicit self-regulatory friction through boredom and available off-task activity. Participants then reported using cognitive reappraisal, situational strategies, subgoaling, and distraction. Structural equation modeling indicated that pWM predicted reported reappraisal use; its associations with subgoaling and distraction use were not independent of recruitment source. Inhibition, and reported reappraisal and situational-strategy use, were associated with Mice Task performance; so was subgoaling use, though with marginal model fit and indeterminate Bayesian evidence. Bayesian analyses favored the null for all 12 EF-by-strategy interaction terms (BF01 = 6.7–15.9), in a design powered to detect interactions of β ≈ 0.20–0.23. Primary findings used non-preregistered rank-based inverse normal transformed strategy-use scores; the preregistered raw-score models fit poorly. Cognitive capacity and reported strategy use appear to relate to sustained self-regulation independently rather than interactively.
1. Introduction
Self-regulation (SR) is the capacity to orchestrate behavior, emotion, cognition, and motivation in pursuit of personally valued goals; its failures are implicated in obesity, substance dependence, and reckless financial decisions (Heatherton & Wagner, 2011). Strong SR is associated with desirable outcomes across domains, including psychological health, relationship quality, professional achievement, and wealth, even when accounting for intelligence and socioeconomic status (Wennerhold & Friese, 2023).
Despite its prominence, the construct remains a subject of debate: Popular self-control measures show weak or nonsignificant intercorrelations, suggesting that different instruments tap partially distinct SR aspects (Wennerhold & Friese, 2023). Relationships among SR constructs (e.g., trait self-control, effortful control) and the cognitive abilities supporting them remain poorly understood. Clarifying these links could reveal the mechanisms on which different SR forms rely and enable personalized interventions that target individual cognitive profiles.
Two frameworks inform the present study. To classify the strategies studied here, we draw on the process model of self-control (Duckworth et al., 2016), which expands the process model of emotion regulation to other types of conflict. The model groups strategies by where they act: on the situation (situation selection and modification), on attention (attentional deployment), on appraisal (cognitive change), or on the response itself (response modulation). Three of the present strategies fall within these families: situational strategies within situation modification, distraction within attentional deployment, and reappraisal within cognitive change. Subgoaling is not one of the model’s families and is grounded instead in goal-setting theory (Locke & Latham, 1990). For the role of cognitive capacity, we follow Hofmann et al. (2012), who treat executive functions as the domain-general machinery that makes such strategies available and keeps them running. Our question sits at the join between the two: whether individual differences in that machinery determine which strategies people use, how strongly those strategies relate to success, or both.
Moreover, the traditional SR assessment repertoire may not encompass all relevant facets of the construct. Researchers studying vigilant attention have recognized that sustaining focus on prolonged, monotonous, intrinsically unrewarding tasks requires constant self-regulation (Langner & Eickhoff, 2013; Pershin et al., 2023). Boredom during such tasks has been characterized as a failure of self-regulation and of executive control (Danckert & Merrifield, 2018; Thomson et al., 2015). Despite these connections, this vigilance-related dimension has not been integrated into what is typically considered SR measurement.
1.1. The Role of Executive Functions in Self-Regulation
Among the cognitive capacities proposed to support SR, executive functions have received particular attention. Executive functions (EFs)—specifically shifting, working-memory (WM) updating, and inhibition (Miyake et al., 2000)—are typically described as domain-general mechanisms that regulate cognition for goal-directed behavior (Friedman & Miyake, 2017). EFs exhibit both unity and diversity: they share a common underlying ability while retaining unique variance (Miyake & Friedman, 2012). Individual differences in these highly heritable capacities (Friedman et al., 2008) are associated with self-regulatory outcomes across domains (Hofmann et al., 2012; Mann et al., 2015). However, EFs are not the sole route to successful SR. Individuals with high trait self-control often rely on habits that minimize the need for EF (Williamson & Wilkowski, 2020). EFs thus form a foundational, partly genetic architecture for regulating thought and action (Baggetta & Alexander, 2016). This raises the question: to what extent is self-regulatory success constrained by EF endowment, and to what extent can it be shaped by the strategies people adopt?
1.2. Self-Regulation Strategies and Their Relationship to Executive Functions
SR strategies are engaged when a discrepancy between desired and current states is detected (Carver & Scheier, 1998) and operate by altering internal cognitive processes or restructuring the environment (Fujita, 2011). Because these operations seem to involve shifting attention, inhibiting responses, and maintaining WM representations, theorists propose that EFs scaffold strategy selection and implementation (Hofmann et al., 2012). Indeed, researchers have suggested that individuals with higher levels of executive functioning may be better able to flexibly deploy their regulatory knowledge (Scholer et al., 2018). An individual’s EF profile could moderate strategy selection and success: Strong EFs may bolster cognitively demanding strategies, while certain strategies may compensate for specific EF deficits. Nonetheless, the extent to which EFs moderate the strategy–success relation remains under-explored. The present research focuses on four SR strategies selected for their prominence in the literature; their frequent use in daily life (Middelweerd et al., 2014; O’Connell et al., 2007; Vilardaga et al., 2019); their recognized effectiveness, including as Cognitive Behavioral Therapy components (Roos et al., 2020; Williamson & Wilkowski, 2020); and—central to the current investigation—their theoretically differential demands on various EFs. Each denotes a category of actions rather than a single act. The four are: (1) reappraisal—changing the interpretation of a stimulus to alter its influence; (2) situational strategies—modifying one’s environment to encourage desired behaviors; (3) subgoaling—breaking a larger goal into manageable sub-goals and monitoring progress; and (4) distraction—diverting attention away from stimuli to attenuate their influence.
1.3. Executive Functions and Specific Self-Regulation Strategies
The following sections elaborate on the four SR strategies selected for this study, outlining their theoretical links to specific EFs that may moderate their effect on SR success.
1.3.1. Cognitive Reappraisal
Reappraisal involves changing the interpretation of a stimulus to alter its influence. Although primarily studied as a form of emotion regulation, it has also shown effectiveness for regulating cravings (Giuliani et al., 2013; Szasz et al., 2012). However, reappraisal is less effective for intense stimuli (Sheppes et al., 2009), individual differences in its application are substantial (Ford & Troy, 2019), and individuals who experience emotions intensely are less likely to employ it (Karmon-Presser et al., 2018). Working memory supports the generation and maintenance of new appraisals; WM capacity is the most reliable EF predictor of emotion regulation success (Schmeichel & Tang, 2015), was shown to moderate reappraisal efficacy (Hendricks & Buchanan, 2016), and high WM load impairs reappraisal efficiency (Adamczyk et al., 2022). The role of inhibition is debated and the role of shifting has received little attention (Schmeichel & Tang, 2015). Nonetheless, shifting theoretically underpins the ability to change perspectives. We therefore predicted that higher WM and possibly also shifting abilities would be associated with greater reappraisal effectiveness.
1.3.2. Situational Strategies
Situational strategies arrange the environment to prevent self-regulatory conflict before it emerges—for instance, by removing tempting snacks from home or by lending out one’s car to necessitate traveling on foot (Duckworth et al., 2016). By avoiding direct exposure to temptation, these strategies reduce the need for inhibition (Williamson & Wilkowski, 2020). Evidence linking EFs to strategy choice indicates that older adults use situational strategies relatively frequently, possibly due to age-related EF declines (Urry & Gross, 2010). Consequently, individuals with lower inhibitory control may derive particular benefit from situational strategies, as they provide a compensatory mechanism. While employing situational modifications may require WM (Braver, 2012), their precise relationship with WM and shifting is still unclear. We therefore predicted that lower inhibition would be associated with a stronger link between situational strategy use and SR success, based on the assumption that individuals who suspect they will be tempted will choose such strategies to reduce temptation.
1.3.3. Subgoaling Strategies
Subgoaling breaks a large goal into smaller, manageable units. This approach may enhance confidence in one’s ability to succeed (S.-C. Huang et al., 2017), provide regular performance feedback (Locke & Latham, 1990), and generate incremental rewards that sustain motivation over prolonged effort (Zhang & Gao, 2016). The “small victories” effect illustrates this principle: individuals in debt who repay the smallest debts first show the greatest motivational benefit (Brown & Lahey, 2015). Unlike reappraisal, situational modification, or distraction, subgoaling does not reduce or circumvent the self-regulatory conflict itself; rather, the individual must continue to confront and resist temptation at each step. We therefore expected that higher inhibition would support greater SR success when implementing subgoals, as the capacity to suppress competing impulses remains necessary throughout the process.
1.3.4. Distraction
Distraction diverts attention away from motivationally relevant stimuli to attenuate their influence (Van Dillen & Papies, 2015). Distraction requires relatively limited WM resources, but its relationship with WM capacity is unclear: Low WM might favor distraction due to its minimal demands, or high WM might facilitate the efficient management of distracting content (Adamczyk et al., 2022). We predicted that WM and inhibition would moderate the association between distraction use and SR success, whereas shifting would not. We reasoned that distraction involves suppressing attention to a motivationally relevant stimulus and repeatedly redirecting it toward alternative content, drawing more on inhibitory control than on shifting, which concerns alternating between mental sets applied to the same stimulus rather than replacing one stimulus with another (Miyake et al., 2000).
1.4. Sustained Behavioral Self-Regulation
As noted above, existing self-regulation assessment approaches—including self-report questionnaires, delay of gratification and delay discounting paradigms, and performance-based executive function tasks (Duckworth & Kern, 2011; Eisenberg et al., 2019)—do not capture the sustained process of maintaining goal-directed behavior under ongoing monotony and temptation over extended periods. Delay discounting tasks capture initial preferences but not the ongoing effort required to sustain a goal-directed choice over time (Duckworth et al., 2013). Executive function tasks, meanwhile, typically focus on brief, trial-level cognitive operations rather than sustained performance across an extended, monotonous context.
A key mechanism challenging sustained SR is boredom, which devalues current activities, increases reward sensitivity, and prompts exploratory behavior (Bieleke et al., 2024; Radtke et al., 2025). At the trait or state level, boredom can make self-control more challenging and frustrating (Bieleke et al., 2021); indeed, boredom can be aversive enough to lead participants to self-administer electric shocks to alleviate it (Havermans et al., 2015). To study sustained SR behaviorally, we developed the Mice Task, a task designed to create continuous self-regulatory demands. The task shares key features with classical vigilance paradigms (see Langner & Eickhoff, 2013): it requires sustaining readiness to respond to infrequent targets within a prolonged, monotonous context. Specifically, participants were instructed to “catch” 20 mouse silhouettes appearing sequentially on a screen. Because the inter-stimulus intervals were prolonged and highly variable, the task was structurally monotonous. Crucially, and unlike typical vigilance paradigms, participants were free to engage in off-task activities while waiting. By coupling under-stimulating conditions with unrestricted access to temptations, the task seemingly creates an ecologically valid competition between goal-directed persistence and the boredom-induced urge to disengage (Hancock, 2017). As in the classic marshmallow test, several design features are preserved: Participants commit to the goal, temptation lies within reach, compliance with authority is minimized, and the task requires sustaining that commitment over time (Duckworth et al., 2013), with the aim of capturing the continuous friction of self-regulation in adults.
1.5. The Present Study
Large-scale ontological analyses suggest that trait-level (self-reported) SR and cognitive capacities (like EFs) capture largely independent dimensions (Eisenberg et al., 2019). It is therefore critical to examine how active behavioral strategies bridge this gap by interacting with EFs to produce SR outcomes. Prior research has mostly tested strategies in isolation or relied on EF measures with poor test–retest reliability (Enkavi et al., 2019).
Prior research shows that direct empirical associations between EF tasks and self-control measures are consistently weak (r = 0.10–0.15; Duckworth & Kern, 2011). Similarly, meta-analytic evidence indicates a weak overall association between EFs and reappraisal (rs ≈ 0.13–0.19; Toh et al., 2024). This attenuation likely reflects both measurement limitations—including mostly poor reliability—and possibly also a context mismatch between affectively neutral EF assessments and the motivational conflicts that characterize self-regulation. Hofmann et al. (2009) proposed that EFs matter most when impulse and goal are in active competition; consistent with this, Hofmann et al. (2008) found that WM capacity moderated the influence of automatic versus controlled dispositions on behavior in temptation contexts (β = −0.21 to −0.37). However, their design could not tell whether WM capacity predicted strategy selection, the strategy–success association, or both. The present study addresses these gaps by using latent EF variables (extracted using structural equation modeling [SEM] of EF measures from the Brief Executive Function [BEF] battery; Bakun Emesh et al., 2022), a task designed to create sustained self-regulatory demands (the Mice Task), and self-reports of strategy use during that task, collected immediately afterward.
The BEF captures shifting, inhibition, and procedural working memory (pWM; assessed via Decision under Load [DuL]) while accounting for speed–accuracy tradeoffs. Notably, the BEF’s Inhibition measure is based entirely on the antisaccade task. Perhaps more importantly, DuL is not a measure of WM updating, as in Miyake and Friedman’s studies (e.g., Miyake et al., 2000). Rather, it reflects “rule WM” (Garbi & Meiran, 2024): performance in a task involving multiple novel rules. The strategies examined were cognitive reappraisal, situational strategies, subgoaling, and distraction. The intensity of the desire to quit the task was assessed via self-report and was included as a covariate. The study tested (1) strategy use: whether EFs predict the frequency of strategy use; and (2) strategy–performance associations: whether strategies, EFs, and their interaction are associated with Mice Task performance.
Three sets of hypotheses were tested: H1 hypotheses pertain to strategy usage; H2 hypotheses pertain to strategy–performance associations; and H3 hypotheses pertain to overall SR success. In the preregistered hypotheses, SR success refers to performance on the Mice Task.
1.5.1. Executive Functions and Strategy Use
These predictions were highly tentative due to limited prior research linking EFs to the amount of strategy use. They are reported as preregistered; we were less interested in each specific EF–strategy pairing than in whether EFs relate to strategy use in general.
H1a.
Higher shifting and inhibition abilities will predict greater use of cognitive reappraisal.
H1b.
Higher inhibition will predict greater use of situational strategies.
H1c.
Higher pWM will predict greater use of subgoaling strategies.
H1d.
Higher inhibition will predict greater use of distraction.
Moderation-related hypotheses (H2) refer to the standardized coefficient of the EF × strategy-use interaction term predicting SR success in the SEM strategy–performance association models.
1.5.2. Executive Functions and Strategy–Performance Associations
H2a.
The Shifting × Reappraisal Use and pWM × Reappraisal Use interaction coefficients will be positive and significant, such that higher shifting and higher pWM abilities strengthen the positive effect of reappraisal use on SR success.
H2b.
The Inhibition × Situational Strategy Use interaction coefficient will be negative, such that individuals with lower inhibition would show greater SR success as situational strategy use increases.
H2c.
The Inhibition × Subgoaling Use interaction coefficient will be positive, such that higher inhibition would support greater SR success as subgoaling use increases.
H2d.
The pWM × Distraction Use interaction coefficient will be significant. The direction is not predicted: low pWM may facilitate distraction due to limited WM capacity, whereas high pWM may facilitate effective management of distraction.
H2e.
The Inhibition × Distraction Use interaction coefficient will be positive, such that higher inhibition is associated with greater SR success as distraction use increases.
H2f.
The Shifting × Distraction Use interaction coefficient will not be significant.
1.5.3. Overall SR Success
H3.
Individuals with higher EFs will achieve greater overall SR success.
Note: The preregistration also included hypotheses regarding the Emotion Regulation Choice task, attrition, and total strategy count. These are not addressed in the present article, which focuses exclusively on behavioral SR strategies and their relation to EFs.
In addition to the above hypotheses, we explored the overall association of each strategy with Mice Task performance. These analyses were exploratory and no directional predictions were made.
The present findings detailed below indicate that EFs are associated both with Mice Task performance and with reported SR strategy use, but, contrary to expectation, that Bayesian evidence favored the absence of moderation of the association between strategy use and Mice Task performance—that is, cognitive capacity and reported strategy use appear to relate to sustained self-regulation independently rather than interactively.
2. Materials and Methods
The study was preregistered (https://osf.io/k84jw/, accessed on 8 October 2026).
2.1. Participants
The target sample was 246 participants, determined by an SEM power analysis (d = 0.25, power = 0.80, α = 0.05; Cohen, 1988; Soper, 2023; Westland, 2010). To establish which latent interaction effects this sample could detect, we conducted a Monte Carlo sensitivity analysis using a population model matching the measurement structure, inter-factor correlations, and structural coefficients estimated in this sample, with N = 254 and product indicators as specified in the reported models. Across 200 replications per condition (100% convergence), the design afforded 80% power to detect latent interaction coefficients of β = 0.200 for Inhibition × strategy use, β = 0.233 for Shifting × strategy use, and β = 0.229 for DuL × strategy use. Power was substantially lower for smaller effects (β = 0.15: 0.39–0.61; β = 0.10: 0.18–0.35). Type I error rates at β = 0 were 0.045–0.085 (Monte Carlo SE ≈ 0.015 with 200 replications). Participants were a convenience sample drawn from two sources: undergraduate students at the authors’ institution, who received course credit, and workers on Prolific™, an online participant-recruitment platform, who received £11.50. Prolific prescreening restricted participation to residents of the United States or the United Kingdom, aged 18–50, with an approval rate of at least 97%, who had confirmed willingness to view potentially upsetting material (required by the Emotion Regulation Choice task) and who used a Windows computer; the operating-system filter is a standing precaution in our laboratory against device-related timing variability and was not applied to the university sample. Inclusion criteria specified ages 18–50; older individuals were excluded due to age-related EF changes (Veríssimo et al., 2022), which could influence strategy use and performance differently. Data files were recorded for 383 participants across the four study components. Of these, 81 lacked executive-function data, 9 had missing data on another preregistered variable, 15 were performance outliers (>3.5 SD), and 24 showed strategy misinterpretation, leaving 254 (see Section 2.4 for details). This starting figure is the union of participant identifiers across the four data files; the number of people who opened the recruitment link was not recorded. The final sample comprised 254 participants (135 women, 118 men, 1 who reported another gender; Mage = 29.24, SD = 7.85). Of these, 127 were university undergraduates and 127 Prolific workers. The two sources differed demographically: undergraduates were younger (M = 24.1, SD = 2.31) than Prolific participants (M = 34.3, SD = 8.12) and more often women (92 of 127 versus 43 of 127), and almost all were studying for a Bachelor’s degree (119 of 127), whereas Prolific participants were spread across secondary (47), Bachelor’s (63), and Master’s (17) levels. Employment status was not collected. The design is cross-sectional: all measures were obtained within a single session, apart from the 18 participants noted below whose executive-function scores were collected earlier.
2.2. Measures
2.2.1. Mice Task Performance
We used a custom-developed task, the “Mice Task”, designed to place prolonged demands on behavioral SR: it requires sustained attention over a monotonous period (Figure 1A shows the trial structure). Participants’ goal was to “catch” white mouse silhouettes (125 × 125 px) by clicking the screen using a computer mouse when each appeared.
Figure 1.
(A) Schematic illustration of the Mice Task trial structure. (B) Mean response time on correctly detected trials (upper panel, with standard deviation error bars) and the percentage of correct detections (lower panel), both plotted over cumulative waiting time. Color indicates the stimulus presentation time (stimulus duration). Points and bars show observed means, not model estimates. RT = response time.
The task was presented within a black 1000 × 1024 px frame. A fixation point was consistently displayed at the center, with the mouse stimuli appearing 128 px above it. The task was rendered in pixel units, so physical stimulus size varied across participants’ displays, and no screen-calibration procedure was used. The procedure began with instructions and a four-mouse practice trial, followed by the main experimental phase, which consisted of 20 mice in total. During each trial, the mouse appeared on the screen for an average of 1079 ms (SD = 480 ms). The presented mouse was caught by clicking anywhere on the screen with the computer mouse. A successful catch triggered immediate visual feedback: a green frame (712 × 800 px) flashed for 200 ms. A continuous score counter at the bottom of the screen provided ongoing feedback on the number of caught, missed, and remaining mice.
The key design element intended to challenge SR was the long and variable inter-stimulus interval, with mice appearing only about once per minute on average (M = 55.8 s, SD = 14.6 s). These long pauses were designed to induce boredom, requiring participants to actively maintain focus. To create a more realistic self-regulation challenge, participants were permitted to engage in other activities (e.g., use their cell phone), which served as potential temptations. Mice Task performance was measured with two indicators: (1) the negatively signed mean response time on correctly detected trials, and (2) the number of mice detected. The decision to model Mice Task performance as a latent variable combining these two indicators was made prior to hypothesis testing but was not specified in the preregistration. The two loadings were constrained to equality (a tau-equivalent specification; Graham, 2006). A two-indicator factor with freely estimated loadings is under-identified on its own; constraining the loadings to equality results in a gain of one degree of freedom and renders the Mice Task performance measurement model just-identified (df = 0). This part of the model, therefore, cannot be tested on its own and is evaluated only within the full structural model. The constraint also yielded proper solutions in all four strategy–performance association models, which free estimation did not (see the note to Table S15 in the Supplementary Materials). Because an equality constraint on loadings is only meaningful when the indicators share a scale, both Mice Task performance indicators were standardized before estimation (raw SDs = 2.24 and 123.35; see Table S2).
Participants were instructed to complete the study on a desktop or laptop computer, and mobile and touchscreen devices were not permitted; device characteristics were not recorded, so compliance was not verified. Browser, screen size, display resolution, and refresh rate were neither recorded nor controlled, and browser-based timing is less precise than laboratory software (Anwyl-Irvine et al., 2021; Bridges et al., 2020); both are addressed in Section 4.5.
2.2.2. Strategy Use
Immediately following the Mice Task, participants completed a questionnaire (presented using Qualtrics™ (Qualtrics, 2023); see Text S1) reporting strategy use. Adapted from prior instruments (Lopez et al., 2021; Williamson & Wilkowski, 2020), the questionnaire elicited specific descriptions of strategy application. Participants received descriptions and examples for each strategy. The strategies assessed were reappraisal, situational strategies, subgoaling, and distraction. Participants wrote down how they used each strategy, listed all actions performed, and reported how many times each action was performed. They then reported the total action count per strategy, which served as the measure of strategy use. Open-text descriptions were reviewed by the first author to check that the reported actions matched the intended strategy; responses were flagged as misattributions only where the described behavior was clearly inconsistent with the strategy definition. There was no second coder, so inter-rater reliability was not assessed, and the coder was not blinded to task performance; misattribution decisions rested solely on the match between description and definition.
2.2.3. Desire Intensity
Desire intensity was measured through a post-task questionnaire item: “At the moment when the feeling [of wanting to stop the task] was at its peak, how much money were you willing to give up so that the task would stop?” This measure was included as a covariate to control for varying levels of desire to quit, since the same level of Mice Task performance may reflect more self-regulatory effort when the desire to quit is strong than when it is weak.
2.2.4. Executive Functions
Executive functions were assessed using the Brief Executive Function (BEF) battery (Bakun Emesh et al., 2022), a set of computerized performance tasks, rather than a self-report instrument, evaluating three core abilities: Inhibition (antisaccade task), Shifting (task-switching), and pWM (Decision under Load, DuL). The BEF demonstrates good-to-excellent test–retest reliability: Bakun Emesh et al. (2022) reported intraclass correlation coefficients (ICCs) for the aggregated Balanced Integration Score (BIS; Liesefeld et al., 2015) difference scores of 0.70 (Shifting), 0.86 (DuL), and 0.84 (Inhibition). Eighteen participants had completed the BEF battery in two earlier studies several weeks to months before taking part in our research, and were not asked to repeat it; their earlier scores were matched to the present dataset by participant identifier. Eleven took part in a study that used this battery and is currently under review (Amir et al., 2026); the other seven come from an unpublished dataset. The two reports address different questions and no result appears twice. Because these scores were collected earlier than the rest, the interval between EF testing and the Mice Task varied across participants; we treat this as a limitation. Additionally, the construct validity of pWM was established in two large-scale studies (Garbi & Meiran, 2024). EFs were modeled as latent variables: BIS values for each of the three content types (letters, digits, shapes) of DuL and Shifting, and the four stimulus-onset asynchronies (SOAs) of the antisaccade task served as observed indicators explained by the three latent factors (see Garbi et al., 2024).
2.3. Procedure
The study was conducted online. After providing informed consent (approved by the departmental ethics committee), participants completed the study in a single session lasting approximately one hour. Participants were instructed to complete the study on a computer, in a quiet room, between 07:00 and 22:00 local time. No time limit was imposed on questionnaire completion. Time of participation was recorded but was not analyzed, since participants were spread across several time zones. The session proceeded in the following order: (1) the Mice Task (~20 min; programmed in OpenSesame version 3.3.14, Mathôt et al., 2012, and hosted on JATOS, Lange et al., 2015); (2) a post-task questionnaire assessing strategy use, desire intensity, and demographic information (presented via Qualtrics™; Qualtrics, 2023); (3) the Emotion Regulation Choice task (~10–15 min; Sheppes et al., 2011; not reported here); and (4) the BEF battery (~25 min). Participants who had previously completed the BEF in another study were exempt from this portion. No breaks were prescribed between sections.
2.4. Data Analysis
All analyses used R version 4.2.1 (R Core Team, 2022) with SEM via lavaan version 0.6.12 (Rosseel, 2012) using the MLM estimator. This estimator provides maximum likelihood parameter estimates with the Satorra–Bentler scaled chi-squared test statistic and robust standard errors (Satorra & Bentler, 1988), guarding against non-normality bias. All variables were centered and standardized prior to analysis. An alpha of 0.05 was adopted for statistical inference. Bayes factors (BFs) were computed as BIC-based approximations (Bayesian information criterion; Neath & Cavanaugh, 2012; Schwarz, 1978), comparing an unconstrained model to a model in which the coefficient was fixed to zero; BF < 1/3 was interpreted as supporting H0, BF > 3 as supporting H1, and 1/3 ≤ BF ≤ 3 as undecided. Generative AI (Claude, Anthropic; Opus 4.6 and Opus 5) was used to assist with writing the analysis and figure-plotting code, and for language editing. All code was reviewed and verified by the authors against the underlying data, and all output was checked against the reported estimates. The authors take full responsibility for the content. Model fit was evaluated using the Comparative Fit Index (CFI ≥ 0.95 good, ≥ 0.90 acceptable) and Root Mean Square Error of Approximation (RMSEA ≤ 0.06 good, ≤0.08 acceptable; Hu & Bentler, 1999). The Tucker–Lewis Index (TLI) is reported alongside these for completeness but was not used as a fit criterion. Fit indices are reported in their robust form (Brosseau-Liard & Savalei, 2014; Brosseau-Liard et al., 2012), appropriate for MLM estimation under non-normality. Because participants were recruited from two sources that differed demographically, all models were re-estimated with recruitment source (0 = university sample, 1 = Prolific) added as a predictor. Source was entered as a fixed exogenous variable: allowing it to covary freely with the other predictors made the strategy-use models under-identified and stopped the strategy–performance models converging.
Prior to testing the hypothesized models, the three-factor EF measurement model (inhibition, shifting, DuL) was confirmed in the present sample using the same specification as in prior work (Garbi et al., 2024). Two categories of SEM models were then fitted:
- (a)
- Strategy-Use Models. These models predicted strategy use from EFs and desire intensity. A separate model was constructed for each strategy (reappraisal, situational, subgoaling, distraction), with covariances specified among all predictors (Figure 2A).Figure 2. (A) Theoretical schema of strategy-use models. Desire intensity was included as a covariate. The indicators and covariances between the predictors are omitted for simplicity. (B) Empirical results of strategy-use models. Statistical significance is indicated by filled versus open markers, as shown in the legend; error bars are 95% confidence intervals. DuL = Decision under Load; CFI = comparative fit index; RMSEA = root mean square error of approximation; n.s. = not significant.
- (b)
- Strategy–Performance Association Models. These models predicted Mice Task performance from EFs, strategy use, EF × strategy-use interactions, and desire intensity. A separate model was developed for each strategy (Figure 3A).Figure 3. (A) Theoretical schema of strategy–performance association models. SU = strategy use. Desire intensity was included as a covariate. The indicators and covariances between the predictors are omitted for simplicity. (B) Empirical results of strategy–performance association models. Statistical significance is indicated by filled versus open markers, as shown in the legend; error bars are 95% confidence intervals. BFs for all interactions were below 1/3. DuL = Decision under Load; CFI = comparative fit index; RMSEA = root mean square error of approximation; n.s. = not significant.
Preregistered analytic decisions. The SEM model structures, predictor variables, and hypotheses (H1–H3) were specified in the preregistration. The preregistered approach used untransformed raw scores; these analyses are fully reported in the Supplementary Materials (Tables S9, S11, S14 and S17).
Non-preregistered analytic decisions. Several decisions were made after preregistration but prior to hypothesis testing. (a) Normalization: Several variables exhibited severe skewness exceeding 3.0 (Kline, 2016): reappraisal use (5.56), situational strategy use (6.38), distraction use (11.21), and desire intensity (8.21; see Table S1). Although the MLM estimator provides robust standard errors under non-normality, it still assumes linear relationships between variables. Severe skewness and kurtosis of the observed magnitude (kurtosis up to 155.03) may induce non-linear relationships that robust estimators alone cannot address (Kline, 2016). Therefore, a rank-based inverse normal transformation (INT) was applied to these four variables prior to estimation. The INT preserves the rank ordering of the counts but does not distinguish no use from some use; count, hurdle, or zero-inflated models would separate these components directly and are a natural next step for data of this kind. The remaining variables, including subgoaling use, were not transformed. Differences in statistical significance between the INT and raw-score approaches are noted where they occur. (b) Mice Task performance specification: Modeling Mice Task performance as a latent variable combining caught mice and mean response time was decided prior to hypothesis testing but was not specified in the preregistration. A sensitivity analysis using a unit-weighted composite of the two standardized indicators is reported in Table S19. (c) Post hoc analyses: Internal reliability of the Mice Task was assessed using McDonald’s Omega and Cronbach’s Alpha. Individual differences in task performance were examined using a multilevel model predicting correct-trial response times from stimulus time, preparation time (the waiting interval preceding that mouse), and cumulative waiting time, with random intercepts and random slopes for cumulative waiting time per participant. (d) Exclusion criteria: The preregistration specified excluding participants with missing EF data; the other exclusions listed in Section 2.1 were added prior to hypothesis testing. Several participants had misplaced strategy counts or used incorrect counting methods (n = 7) but could be corrected manually and were retained. Additionally, 24 participants provided numerical strategy reports but left open-text fields blank; these were retained in primary analyses. A sensitivity analysis excluding them is described in Section 3.4. (e) Missing Mice Task data: Three participants had one Mice Task trial absent (19 instead of 20 trials) due to technical issues. These were retained with prorated scores (n_caught = raw_caught × 20 / trials_completed) but were excluded from Mice Task reliability and its individual-differences analyses (N = 251); all other analyses used the full sample (N = 254).
3. Results
3.1. Mice Task Performance and Individual Differences
Mean Mice Task performance is presented in Figure 1. Successful mice responses yielded response times substantially slower than those typically observed in simple reaction tasks (~231 ms; Woods et al., 2015). This suggests (but does not prove) that participants were frequently distracted and were engaged in competing activities. Additionally, participants succeeded in responding to the mice less frequently when stimulus presentation times were shorter. Despite these challenges, overall performance significantly improved over the course of the task: as cumulative waiting time (i.e., the total elapsed inter-stimulus time, excluding stimulus presentation time) progressed, participants became both more accurate and quicker at responding, indicating improvement on both dimensions rather than a speed–accuracy tradeoff (see Tables S3–S6 for full response time and accuracy models).
Post hoc analyses assessed the internal reliability of the Mice Task using McDonald’s Omega and Cronbach’s Alpha (see Taber, 2018, for interpretations of Alpha values). Reliability estimates were moderate: for response time, ωtotal = 0.88, ωhierarchical = 0.67, α = 0.86; for correctness, ωtotal = 0.68, ωhierarchical = 0.48, α = 0.64.
To examine individual differences further, a multilevel model was fitted to correct-trial response times, with stimulus time, preparation time, and cumulative waiting time as fixed effects, and random intercepts and random slopes for cumulative waiting time per participant (see Tables S3–S5 for full model results). This model enabled us to determine the sources of individual differences in performance in this task, which include individual differences in overall RT (random intercept) and individual differences in RT change as a function of cumulative waiting time (random slope). The inclusion of a random intercept in the model generated a significant improvement in model fit, χ2(1) = 820.18, p < .001, and the same was true for the random slope, χ2(2) = 96.55, p < .001, meaning that participants differed significantly in their general performance and also in how their performance changed over the task: while response times decreased on average as the task progressed, individual slopes varied around this average.
3.2. Measurement Model of EF
Descriptive statistics and zero-order correlations among all variables entered into the SEM models are presented in Table S2. The three-factor EF measurement model (inhibition, shifting, DuL) and associated BEF tasks were established and validated in prior work (Bakun Emesh et al., 2022; Garbi et al., 2024). We confirmed the same structure in the present sample: the correlated three-factor model showed acceptable fit and was decisively preferred over a single-factor model (BIC difference corresponding to BF > 1000; see Table S7 for full fit indices and model comparison). All factor loadings were significant and were at least 0.607 (see Table S8 for full loading table).
3.3. Strategy-Use Models
All four strategy-use models fit well (see Table S9 for fit indices). EF factor loadings were stable across models (all ≥ 0.603; see Table S10 for ranges).
Figure 2B presents the key results (for standardized coefficients, p-values, and BFs of both analytic approaches; see Table S11). Before controlling for recruitment source, DuL—a measure of pWM—was the only EF that predicted strategy use, doing so for reappraisal, subgoaling, and distraction. Desire intensity also predicted reappraisal and distraction use. No predictor reached significance for situational strategy use, where all BFs fell below 1/3 (0.063–0.249), providing positive evidence against these associations.
Repeating these models with recruitment source as a predictor left the DuL–reappraisal association unchanged (β = 0.19, p = .026) but reduced the subgoaling and distraction associations to non-significance, with Bayes factors below 1/3 in both cases (see Tables S12 and S13). We therefore interpret only the DuL–reappraisal association as independent of recruitment source.
3.4. Strategy–Performance Association Models
Three of the four models fit well (see Table S14 for fit indices). The subgoaling model was the exception, with a robust CFI at the 0.90 boundary and a robust RMSEA of 0.081, above the conventional cutoff; its results should be interpreted with caution. Loadings on the Mice Task performance indicators were high and consistent across models (0.925–0.942; see Table S15 for full ranges), and no improper solutions arose under the tau-equivalent specification. All interaction-term loadings were significant (ps < .001). Inter-factor correlations are reported in Table S16.
Preregistered raw-score moderation models, estimated under the same tau-equivalent specification, all converged but fit poorly, and the situational and distraction models produced degenerate solutions (see Table S14), consistent with the distributional non-normalities (coefficients from all four are reported for transparency in Table S17). Figure 3B presents the primary results from the analyses using the normalized-score models (see full results in Table S17). In contrast to the models using raw scores, the models using normalized scores fit the data well, with the exception noted above (see Table S14). Reappraisal, situational-strategy, and subgoaling use were each positively associated with Mice Task performance; distraction use was not. Inhibition was the only EF associated with Mice Task performance, and this was consistent across all four models, independent of strategy. Neither shifting nor DuL was associated with Mice Task performance.
None of the 12 EF × strategy-use interaction latent-path terms reached significance. BFs for all interactions were below 1/3 (range: 0.063–0.150, with |β| = 0.002 to 0.098), providing positive evidence in favor of the null hypothesis. The interaction results thus converge across frequentist and Bayesian approaches: Bayesian evidence favored the absence of EF moderation of the strategy–performance association for all 12 interaction terms. None of the 12 interaction terms reached significance in the preregistered raw-score models either (ps = .185 to .985; Table S17), although those models fit poorly and therefore should not be interpreted.
Three additional analyses assessed the robustness of the strategy–performance association models. First, replacing the latent Mice Task performance factor with the mean of the two standardized indicators left all coefficients within 0.015 of the reported values and all inferential conclusions unchanged (Table S19). Second, adding recruitment source changed no coefficient by more than 0.032 and no interaction coefficient by more than 0.013; source was not associated with Mice Task performance (ps = .10–.51, BFs = 0.08–0.19). No significance verdict changed except for distraction use, which became significant (β = 0.13, p = .042) but with indeterminate Bayesian evidence (BF = 0.37; Table S18). Third, 24 participants who provided numerical strategy reports but left the open-text strategy description fields blank were excluded (remaining N = 230). These participants had valid quantitative data but could not be verified for correct strategy interpretation. The analysis yielded comparable standardized coefficients (mean |Δβ| = 0.018, range 0.002 to 0.052 for primary predictors); all four strategy-use paths retained their verdicts, while three of the four inhibition paths crossed the significance threshold on exclusion, consistent with reduced statistical power rather than changes in the underlying effects (see Table S20 for full results).
4. Discussion
The present study investigated the interplay between executive functions and self-regulation strategies employed during the Mice Task. We asked three questions: (a) Do EFs predict which SR strategies people report using? (b) Are EFs and SR strategies associated with Mice Task performance? (c) Do EFs moderate the relationship between strategy use and Mice Task performance? Contrary to our hypotheses emphasizing inhibition and shifting, pWM (DuL) uniquely predicted the reporting of reappraisal; associations with subgoaling and distraction use were not independent of recruitment source and are not interpreted further. Both strategy use (particularly reappraisal) and inhibition were independently associated with Mice Task performance. Crucially, the central hypothesis—that EFs would moderate the strategy–performance association—was not supported, with Bayesian evidence consistently favoring the null for all 12 tested interactions. The findings suggest that EFs are associated both with the reporting of self-regulation strategy use and with performance on a task designed to demand sustained self-regulation, but Bayesian evidence favored the absence of moderation of the association between strategy use and Mice Task performance.
4.1. DuL and Strategy Use
DuL positively predicted the reported use of reappraisal. Associations with subgoaling and distraction use were also observed, but were not independent of recruitment source and are therefore not interpreted further (see Section 3.3). Post hoc, this finding suggests that the reported use of reappraisal may depend more on working memory—such as the capacity to generate and hold alternative construals—than on the ability to inhibit prepotent responses or shift between mental sets. This interpretation is consistent with Braver’s (2012) dual-mechanisms framework, in which proactive control involves the sustained maintenance of goal-relevant information in working memory prior to challenging events. Reappraisal is, by nature, a generative activity: reinterpreting a situation requires producing and evaluating alternative construals of it.
That DuL predicted reappraisal use resonates with Schmeichel and Tang’s (2015) conclusion that WM capacity is the most reliable EF predictor of emotion regulation success, and with prior findings linking higher WM capacity to reappraisal (Hendricks & Buchanan, 2016; McRae et al., 2012/2013). Whereas prior work has focused primarily on WM’s role in the implementation of reappraisal, the present findings suggest that pWM may also relate to how often reappraisal is used, at least as reported. This association is small but reliable in the current meta-analytic literature (r = 0.128; Toh et al., 2024), though DuL is a pWM measure and is not interchangeable with the canonical updating paradigms on which that estimate rests.
This finding may also converge with Hofmann et al.’s (2008) demonstration that WM capacity (WMC) determines whether the reflective system overrides automatic impulses in temptation contexts. If the reported strategies were deployed deliberately, doing so would be an act of the reflective system, and the present finding would suggest that one manifestation of this WMC-dependent influence is the extent to which people engage in strategic regulatory behavior. Nonetheless, there is no evidence in the current study that the strategies reported were chosen deliberately, only that participants were able to report using them. Whereas Hofmann et al. could not tell whether WMC predicted strategy use or strategy effectiveness—because strategy use was not measured independently—the present design distinguishes these steps: DuL predicted reported reappraisal use but did not moderate the strategy–performance association.
Recent evidence converges, though tentatively. In exploratory analyses within a preregistered experience-sampling study, WMC predicted planning—the only one of eight coping strategies it predicted—and the number of strategies deployed per stressor (Wahlers et al., 2025). That study concerned everyday stressors rather than a laboratory persistence task, and the strategy differs from the one identified here. What recurs is the shape of the finding: a capacity measure relating to one particular strategy rather than to strategic regulation in general.
Despite the temptation to interpret the DuL results in this fashion, the findings were not as predicted, and another viable alternative is that DuL influenced reports rather than actual strategy use. The fact that DuL predicted only reappraisal use argues against this interpretation. All four strategies were elicited and counted in the same way, so an account in which DuL drives fluency in describing one’s own behavior predicts an association with every count. Instead, the association was confined to a single strategy. Experimental evidence argues against a reporting account as well. In a paradigm where regulation choices were recorded behaviorally rather than reported, depleting cognitive resources shifted choices away from distraction, though not away from reappraisal (R. Huang et al., 2025). This suggests that resource availability can alter which strategy a person actually deploys, not only which one they later report. This does not entirely rule out reporting artifacts in the present measure.
Bayes factors for the strategy-use models ranged from 0.063 to 0.948. Where p-values reached conventional thresholds, the Bayesian evidence was indeterminate rather than confirmatory, so those effects should be read as suggestive rather than definitive. The non-significant paths behaved differently, most yielding Bayes factors below 1/3 (e.g., shifting → situational strategy use, BF = 0.063; inhibition → distraction use, BF = 0.064) and thus providing positive evidence for the absence of those associations. The strategy-use findings are therefore asymmetrically supported: that shifting and inhibition do not predict strategy use is well evidenced, whereas that DuL predicts reappraisal use is suggestive only.
4.2. Strategy–Performance Associations and the Role of Inhibition
Three of the four strategies were associated with Mice Task performance. Reappraisal showed the largest coefficient (β = 0.26) and was the only strategy associated with strong Bayesian support (BF = 96.67); because each strategy was estimated in a separate model, the coefficients were not formally compared and the ordering should be read descriptively. Situational strategy use was also associated with Mice Task performance (β = 0.20, BF = 5.48), converging with experience-sampling evidence in which removing oneself from the situation predicted successful desire resistance (Milyavskaya et al., 2021). Subgoaling use was significant by the frequentist criterion, while its Bayes factor remained indeterminate (β = 0.18, p = .006, BF = 1.13), making this a mixed result. Comparable strategies in the literature behave as the significant path suggests, with monitoring goal progress and thinking of the near finish both predicting perceived persistence success in everyday aversive activities (Hennecke et al., 2019). Reappraisal has no comparator there, having been used too rarely to enter their effectiveness models. Distraction use was not associated with Mice Task performance (β = 0.12, p = .065, BF = 0.28). Distraction has been effective elsewhere, reducing emotional expression in the laboratory (Kobylińska et al., 2023) and predicting successful desire resistance in daily life (Milyavskaya et al., 2021), though both concern emotion regulation and momentary temptation rather than sustained behavioral persistence.
The subgoaling and distraction coefficients were similar in magnitude and were not formally compared, so the following considerations concern why distraction might be less effective in a task of this kind rather than an established contrast between the two. The first is the type of conflict. Those studies—viewing emotional images in the laboratory and resisting momentary desires in daily life—involve conflicts in which attention can be turned away from a discrete stimulus or temptation. The Mice Task instead requires continued monitoring of the screen on which the targets appear, so turning attention away has a direct cost. In a study of persistence at everyday aversive activities, distracting oneself from the activity was the only strategy that negatively predicted perceived self-regulatory success (Hennecke et al., 2019). Distraction may therefore help where attention can be withdrawn freely, and impair or fail where the task requires sustained monitoring.
The second consideration concerns the resolution of the strategy measure. Hennecke et al. (2019) distinguish two strategies: distracting oneself from the activity, which negatively predicted perceived success, and task enrichment—adding an external pleasant stimulus alongside the activity without changing it—which predicted greater success when boredom was high, and whose examples include listening to music while working. The present distraction item covers both, since its examples included singing or listening to music while performing the task. Subgoaling is similarly mixed, combining progress monitoring and near-finish focus, both positive predictors in their data, with goal setting, which was not. Reappraisal maps onto a single category. We offer this as a hypothesis about measurement rather than a demonstrated mechanism. No standard taxonomy of self-regulation strategies exists, and studies differ in how they define and group them; the present items were informed by prior measures (Lopez et al., 2021; Williamson & Wilkowski, 2020) but, like others, reflect choices specific to this study (see Section 2.2.2). Comparisons across studies are therefore approximate.
Inhibition, operationalized with the antisaccade task, was consistently associated with Mice Task performance across all four strategy–performance association models (β = 0.18–0.20), independent of which strategy was included as a predictor. This pattern suggests that inhibitory control relates to Mice Task performance regardless of the strategy being employed. However, the Bayesian evidence for the inhibition association was indecisive in all four models (BFs = 1.10–2.49). A sensitivity analysis excluding participants with incomplete strategy descriptions (N = 230) left the coefficients essentially unchanged but reduced power, such that three of the four inhibition paths no longer reached significance. Together, these indicate small effects estimated with limited precision rather than unstable ones.
These small effects are consistent with prior work reporting weak or null associations between task-based EF and self-regulation outcomes. Behavioral flanker indices did not predict everyday goal progress (Saunders et al., 2022), neither inhibition nor working memory predicted emotion-downregulation success (Rodas et al., 2024), and cognitive tasks predicted real-world outcomes considerably less well than self-report measures (Eisenberg et al., 2019).
A possible dissociation emerged between DuL and inhibition across the two sets of models: DuL predicted the reported use of reappraisal but not how successful participants were, whereas inhibition was associated with Mice Task performance (at least by the frequentist criterion) but not which strategies people reported. This pattern is consistent with the two EFs relating to different aspects of self-regulation: DuL to the reported use of reappraisal, inhibition to maintaining goal-directed behavior in the face of competing impulses. This dissociation is not anticipated by the broader literature. Toh et al. (2024) found that EF related to reappraisal about equally whether reappraisal was measured as how often people report using it or how well they perform it when instructed; on that evidence, inhibition should relate to strategy use and to performance comparably, whereas here it related only to the latter, with the Bayes factor for the inhibition–reappraisal use path providing positive evidence against an association (BF = 0.167). Toh et al. also found the inhibition–reappraisal association to be larger when the inhibition task used affective material (r = 0.33) than when it did not (r = 0.16), and the present antisaccade measure is nonaffective, so the smaller estimate is the relevant comparison.
4.3. The Null Moderation Finding
The central hypothesis of this study was that individual differences in EFs would moderate the relationship between SR strategy use and SR success, tested here as Mice Task performance. We predicted that certain strategies would be more effective for individuals with particular EF profiles—for example, that reappraisal would be more effective for those with higher shifting and WM abilities (H2a), or that situational strategies would be more effective for those with lower inhibition (H2b). This hypothesis was motivated by theoretical accounts proposing that different SR strategies place differential demands on distinct EFs (Hofmann et al., 2012; Schmeichel & Tang, 2015), and by the practical implication that individuals might optimize their SR efforts by selecting strategies that match their cognitive strengths.
This hypothesis was not supported. Across all four strategy models, none of the 12 EF × strategy-use interaction terms reached significance (all ps > .05). The Bayes factors for these interactions ranged from 0.063 to 0.150—all below the conventional threshold of 1/3, with the weakest corresponding to BF01 = 6.7—providing positive evidence in favor of the null hypothesis. Unlike the main effects, where p-values and BFs often diverged, the interaction results converged: neither approach supported moderation, and the Bayesian evidence favored its absence for all 12 terms. The same null held in the preregistered raw-score models, although those models fit poorly (Table S17) and therefore should not be interpreted.
This null finding is noteworthy, as the moderation hypothesis represented the primary theoretical contribution of this study and motivated the examination of multiple strategies and EFs within a single design. The proposal that individual differences in EFs should shape the effectiveness of specific SR strategies remains current rather than historical: a recent person-specific framework of emotion-regulation flexibility notes that it does not address executive functioning, and suggests integrating it with the cognitive control account of Pruessner et al. (2020) as a future direction (Kaur et al., 2025). On that account, stopping or switching strategies particularly requires a shifting mode of cognitive control, whereas maintaining a strategy particularly requires a shielding mode supported by inhibition and updating. The account is framed for emotion regulation and has not been tested directly. The present results are only partially relevant to its second component: sustaining a strategy across 20 min of monotonous responding, with off-task alternatives continuously available, is plausibly a shielding demand, and inhibition was associated with Mice Task performance across all four strategy models, whereas DuL was not—although DuL is not an updating measure.
Several interpretations merit consideration. The first concerns whether participants chose their strategies or were assigned them. Kobylińska et al. (2023) instructed participants to use each of three strategies in turn, alongside a no-regulation control, and found that reinterpretation reduced emotional expression relative to control among participants with higher baseline regulatory capacity but not among those with lower capacity, whereas distraction reduced it in both groups. The group difference was not itself tested, so this is a pattern of the hypothesized form rather than a demonstrated moderation. In that design every participant used every strategy, including strategies poorly matched to their capacity. Participants here were free to use any strategy or none, and those poorly served by a strategy could simply refrain from deploying it. If individuals already gravitate toward strategies suited to their profile, the marginal return per unit of use would be approximately constant across levels of EF within the range each participant exhibits, and the interaction term would carry little additional variance. This is consistent with metamotivational accounts, on which people hold beliefs about which regulatory approaches work for them (Scholer et al., 2018), and it predicts that assigning strategies rather than permitting free selection should restore the moderation if it exists. This account, however, requires EFs to relate to which strategies are used, and the present strategy-use models support that only for pWM and reappraisal. Van Bockstaele et al. (2020), who also permitted free choice among three strategies, likewise found no relation between a flanker-based measure of cognitive control and strategy preference in either experiment, though with fewer than 40 participants each, that null is weakly informative.
Second, EFs and strategies may contribute through additive, parallel pathways, each conferring an independent advantage without amplifying or constraining the other. This configuration recurs elsewhere. A preregistered replication obtained a main effect of WMC on momentary negative emotion while the capacity × stressor interaction failed to replicate, and reported coping did not mediate the relationship (Wahlers et al., 2025). Hennecke et al. (2019) likewise found that strategy use did not mediate the relationship between trait self-control and perceived self-regulatory success, concluding that the two represent separate routes. Testing whether strategy effectiveness varied across four types of situational demand, they obtained few interactions and concluded that this would limit the advantages attributable to regulatory flexibility, while noting that some strategies were rarely paired with certain demands. Experimental evidence of an interaction is suggestive rather than decisive. Adamczyk et al. (2022) manipulated working memory load and concluded that its effect depends on the strategy used, but reappraisal and distraction were tested in separate experiments with no shared comparison condition, so the two strategies were never compared directly. Within each experiment, including the load × regulation interaction improved on a main-effects-only model by factors of 1.26 and 1.58, which is indecisive.
Third, the design may test the wrong form of fit. Flexibility accounts define flexibility as the covariation between strategy use and changes in context, and treat its adaptiveness as a separate empirical question (Aldao et al., 2015). Here, all participants faced the same task under the same conditions, so nothing about the situation varied. A fit effect between person and situation has no variance to attach to, and the present null therefore concerns fit between person and strategy only. Consistent with this, a person-level tendency to match strategy to stimulus intensity predicted lower immediate negative affect, although the trial-level comparison between strategies was null (Specker et al., 2024).
A final consideration is the evidence pointing the other way. WMC has been reported to moderate reappraisal efficacy (Hendricks & Buchanan, 2016), which the present results, obtained with a procedural WM measure, do not reproduce. A second frequently cited result concerns whether automatic or controlled dispositions drive behavior in temptation contexts (Hofmann et al., 2008); this speaks to which process governs action rather than to how well a chosen strategy works, and is not a direct comparator. The discrepancy is not resolved here, though it is consistent with the first interpretation above: in Hendricks and Buchanan’s study, reappraisal was instructed rather than chosen. None of these interpretations was specified in advance. The additive-pathway account in particular was formulated after the hypothesized interactions went unsupported; it is a post hoc reading that requires direct testing rather than a result. The present study therefore limits person–strategy fit accounts rather than advancing them: it argues against moderation within the range of effect sizes the design could detect, without establishing an alternative.
Three practical readings follow, each provisional. The pWM measure related to how often reappraisal was reported rather than to how well it worked, so interventions that teach reappraisal may need to address whether a person will deploy it and not only whether they can. Inhibition was associated with Mice Task performance in every model, independent of strategy, which points to a general rather than a strategy-specific role. And within the range of EF observed here, how strongly a strategy related to success did not depend on cognitive profile, so matching strategy to profile—the practical promise that motivated this study—finds no support in these data.
4.4. Sustained Attention, Boredom, and the Mice Task
Performance improved rather than declined over the course of the task. The Mice Task shares features with vigilance paradigms, but its purpose was to sustain a conflict between goal-directed persistence and the urge to disengage while off-task alternatives remained available, rather than to produce a vigilance decrement. Sustained attention is itself operationalized in more than one way, and decline over time is only one of them; attentional consistency is an alternative that does not presuppose a decrement (Welhaf & Kane, 2024). Improvement over the session is therefore not at odds with the paradigm, provided the conflict remains. Improvement may also reflect learning of when targets appear. The multilevel model included each trial’s preparation time, so the improvement over cumulative waiting time is not merely better anticipation of individual targets, and learning the approximate rate of targets would itself be a way of regulating attention. The improvement also differs from the performance pattern associated with accumulating boredom. Boredom rises across blocks of fixed-duration self-control tasks while effort declines, and is associated with a shift toward speed at the expense of accuracy (Bieleke et al., 2021). Here, participants became both faster and more accurate as the session progressed, which does not show that tradeoff.
4.5. Limitations
Several limitations should be considered. First, although the sample size (N = 254) was adequate for detecting moderate main effects, many Bayes factors for the main effects were indecisive (between 1/3 and 3), suggesting that a larger sample would be needed to distinguish small true effects from null effects. The interaction analyses, which typically require larger samples than main-effect analyses, may have been particularly sensitive to this constraint: detecting interactions of the magnitude observed here (|β| ≤ 0.10) with 80% power would require a sample roughly four times larger for Inhibition × strategy use (N ≈ 1000) and roughly five times larger for Shifting × and DuL × strategy use (N ≈ 1350), extrapolating from the simulated minimum detectable effects. Second, the strategy-use variables were based on self-report, introducing potential biases related to memory and limited introspective access to one’s own regulatory processes. The response format avoids one known problem: participants described specific actions and counted them, rather than rating agreement with positively and negatively worded statements, where reverse-coding can generate a factor reflecting item valence rather than the construct (Paap et al., 2024). This does not establish that the counts reflect actual deployment rather than fluency in describing one’s own behavior, and because strategy use and Mice Task performance were obtained in the same session, participants who performed well may have recalled and reported more strategizing. Future research could benefit from behavioral coding, experience-sampling or ecological momentary assessment, and from longitudinal designs that follow strategy use and EF over time. Third, our operationalization of EF is inspired by but not identical with the popular triad conceptualization by Friedman, Miyake and their colleagues, mainly because we did not measure WM updating in the canonical sense (e.g., n-back or complex-span paradigms) and measured DuL instead, and because Inhibition was represented by a single task (antisaccade). See Garbi et al. (2024) for a more extended discussion of this point. Last, the study relied on a single task designed to create self-regulatory demands (the Mice Task); moderation effects absent here might emerge in tasks with different cognitive demands, time horizons, or types of temptation.
Three features of the design constrain what the measures can show. Off-task activity was permitted but neither standardized nor recorded, and boredom—the mechanism the task is built on—was not measured during the session, so we cannot confirm that participants experienced it. The open-text strategy descriptions were reviewed by a single coder who was not blinded to task performance; independent blinded coding with inter-rater reliability would be preferable. And the design is cross-sectional: EFs are treated as predictors on theoretical grounds, as relatively stable capacities, rather than because they were measured first.
The study was administered online, where response timing is less precise than in native laboratory applications and varies across browsers (Bridges et al., 2020; see also Anwyl-Irvine et al., 2021). The EF measures are relatively robust to this, as switch costs and load costs are within-participant difference scores in which a participant’s timing lag largely cancels—a point Bridges et al. make directly, noting that a constant lag is of little consequence where response times are compared across conditions within participants. The Mice Task performance indicators depend less on fine-grained timing: stimulus durations averaged approximately 1079 ms. Such error is in any case unrelated to executive function and would attenuate rather than inflate the associations reported here.
Mean response time was computed only over trials in which a mouse was successfully caught, so participants who missed more targets contributed fewer observations to this indicator. Two consequences follow. First, the precision of the response-time indicator varies across participants as a function of their accuracy, with the least accurate participants contributing the noisiest estimates. Second, part of the association between the two Mice Task performance indicators is structural rather than substantive, because both are derived from the same subset of trials. Participants who detected fewer mice did so disproportionately on longer-duration stimuli (r = −0.67 between mean hit-trial stimulus duration and number of detections, 95% confidence interval [CI] [−0.73, −0.59]), and stimulus duration predicts response time. This dependency is intrinsic to the task, since a missed trial yields no response time by definition, but it means that part of the correlation between the indicators (r = 0.87; see Table S2) follows from how they were computed, so it overstates how far the two measure the same ability. Because trial composition depends only on task performance and not on any predictor, this concerns the measurement model rather than the structural estimates.
The strategy-use measure indexes the reported frequency of regulatory actions rather than the quality or appropriateness of their implementation. A participant who reported repeating a single reappraisal several times receives a higher score than one who reappraised once but effectively, so the measure cannot separate frequent use from skilled use. Relatedly, it captures what participants reported doing, which may diverge from what they did; better-performing participants may also have recalled or described their regulatory activity more fully, which would inflate the observed association in the absence of any causal effect. We therefore refer throughout to reported strategy use rather than to strategy deployment, strategy skill, or strategy efficacy.
The two recruitment samples differed in reported strategy use: participants recruited through Prolific reported fewer situational, subgoaling, and distraction actions than university participants, but comparable numbers of reappraisals. This difference may reflect the circumstances under which the two samples completed the task rather than a difference in regulation itself; the present design cannot distinguish these accounts. The associations between pWM and subgoaling and distraction use were not independent of recruitment source and should not be interpreted as individual-difference relationships.
5. Conclusions
Using a novel behavioral paradigm—the Mice Task—that was designed to elicit sustained self-regulatory effort, and EF measures that account for both speed and accuracy (the BEF battery), this study found that pWM is associated with the reported use of cognitive reappraisal specifically; that inhibitory control is associated with Mice Task performance independently of strategy use; and that the Bayesian evidence favored the absence of EF moderation of the strategy–performance association, within the range of effect sizes this design could detect. These findings come from non-preregistered models using transformed strategy-use scores; the preregistered raw-score models fit poorly.
Supplementary Materials
The following are available online at https://www.mdpi.com/article/10.3390/jintelligence14110283/s1. Text S1: Post-Mice Task Strategy Questionnaire Items; Table S1: Distributional Properties of Study Variables; Table S2: Zero-Order Correlations Among Study Variables; Tables S3–S6: Multilevel Model Results for the Mice Task (Response Time and Accuracy); Tables S7 and S8: EF Measurement Model; Tables S9–S13: Strategy-Use Models; Tables S14–S19: Strategy–Performance Association (Moderation) Models; Table S20: Sensitivity Analysis: Strategy–Performance Association Model Results Excluding Non-Responders.
Author Contributions
Conceptualization, S.L. and N.M.; methodology, S.L. and N.M.; software, S.L.; formal analysis, S.L.; investigation, S.L.; resources, N.M.; data curation, S.L.; writing—original draft preparation, S.L.; writing—review and editing, S.L. and N.M.; visualization, S.L.; supervision, N.M.; project administration, S.L. All authors have read and agreed to the published version of the manuscript.
Funding
This research received no external funding.
Institutional Review Board Statement
The study was approved by the departmental ethics committee of the Department of Psychology, Ben-Gurion University of the Negev (approved 24 March 2024).
Informed Consent Statement
Informed consent was obtained from all participants involved in the study.
Data Availability Statement
The consent form explicitly guaranteed participants that their data would only be available to the authors, so we are unable to share the data publicly. The analysis code, however, will be made available on the study’s OSF project (https://osf.io/uxa75/, accessed on 8 October 2026) upon publication.
Acknowledgments
During the preparation of this manuscript, the authors used Claude (Anthropic; Opus 4.6 and Opus 5) for language editing and to assist with writing the analysis and figure-plotting code. The authors have reviewed and edited the output and take full responsibility for the content of this publication.
Conflicts of Interest
S.L. declares no conflicts of interest. N.M. declares a potential conflict of interest, as they hold an executive role at a company that commercially uses some of the tasks included in the BEF battery.
Abbreviations
The following abbreviations are used in this manuscript:
| BEF | Brief Executive Function (battery) |
| BF | Bayes factor |
| BIC | Bayesian information criterion |
| BIS | Balanced Integration Score |
| CFI | Comparative fit index |
| CI | Confidence interval |
| DuL | Decision under Load |
| EF | Executive function |
| ICC | Intraclass correlation coefficient |
| INT | Inverse normal transformation (rank-based) |
| MLM | Maximum likelihood estimation with robust standard errors and a mean-adjusted test statistic |
| pWM | Procedural working memory |
| RMSEA | Root mean square error of approximation |
| RT | Response time |
| SEM | Structural equation modeling |
| SOA | Stimulus-onset asynchrony |
| SR | Self-regulation |
| TLI | Tucker–Lewis index |
| WM | Working memory |
| WMC | Working memory capacity |
References
- Adamczyk, A. K., Wyczesany, M., & van Peer, J. M. (2022). High working memory load impairs reappraisal but facilitates distraction: An event-related potential investigation. Biological Psychology, 171, 108327. [Google Scholar] [CrossRef] [Scilit] [PubMed]
- Aldao, A., Sheppes, G., & Gross, J. J. (2015). Emotion regulation flexibility. Cognitive Therapy and Research, 39(3), 263–278. [Google Scholar] [CrossRef] [Scilit]
- Amir, I., Rubinstein, K., & Meiran, N. (2026). Individual differences in instruction-following efficiency: Evidence for a general factor distinct from accuracy [Manuscript submitted for publication]. Department of Psychology and Zelman Center for Neuroscience, Ben-Gurion University of the Negev. [Google Scholar]
- Anwyl-Irvine, A., Dalmaijer, E. S., Hodges, N., & Evershed, J. K. (2021). Realistic precision and accuracy of online experiment platforms, web browsers, and devices. Behavior Research Methods, 53(4), 1407–1425. [Google Scholar] [CrossRef] [Scilit] [PubMed]
- Baggetta, P., & Alexander, P. A. (2016). Conceptualization and operationalization of executive function. Mind, Brain, and Education, 10(1), 10–33. [Google Scholar] [CrossRef] [Scilit]
- Bakun Emesh, T., Garbi, D., Kaplan, A., Zelicha, H., Yaskolka Meir, A., Tsaban, G., Rinott, E., & Meiran, N. (2022). Retest reliability of integrated speed–accuracy measures. Assessment, 29(4), 717–730. [Google Scholar] [CrossRef] [Scilit] [PubMed]
- Bieleke, M., Barton, L., & Wolff, W. (2021). Trajectories of boredom in self-control demanding tasks. Cognition & Emotion, 35(5), 1018–1028. [Google Scholar] [CrossRef] [Scilit] [PubMed]
- Bieleke, M., Wolff, W., Martarelli, C. S., Artak, C. E. T., Asani, N., Baillifard, A., & Yakobi, O. (2024). Overview of current directions in boredom research. In M. Bieleke, W. Wolff, & C. S. Martarelli (Eds.), The Routledge international handbook of boredom (pp. 382–391). Routledge. [Google Scholar]
- Braver, T. S. (2012). The variable nature of cognitive control: A dual mechanisms framework. Trends in Cognitive Sciences, 16(2), 106–113. [Google Scholar] [CrossRef] [Scilit] [PubMed]
- Bridges, D., Pitiot, A., MacAskill, M. R., & Peirce, J. W. (2020). The timing mega-study: Comparing a range of experiment generators, both lab-based and online. PeerJ, 8, e9414. [Google Scholar] [CrossRef] [Scilit] [PubMed]
- Brosseau-Liard, P. É., & Savalei, V. (2014). Adjusting incremental fit indices for nonnormality. Multivariate Behavioral Research, 49(5), 460–470. [Google Scholar] [CrossRef] [Scilit] [PubMed]
- Brosseau-Liard, P. É., Savalei, V., & Li, L. (2012). An investigation of the sample performance of two nonnormality corrections for RMSEA. Multivariate Behavioral Research, 47(6), 904–930. [Google Scholar] [CrossRef] [Scilit] [PubMed]
- Brown, A. L., & Lahey, J. N. (2015). Small victories: Creating intrinsic motivation in task completion and debt repayment. Journal of Marketing Research, 52(6), 768–783. [Google Scholar] [CrossRef] [Scilit]
- Carver, C. S., & Scheier, M. F. (1998). On the self-regulation of behavior. Cambridge University Press. [Google Scholar] [CrossRef] [Scilit]
- Cohen, J. (1988). Statistical power analysis for the behavioral sciences (2nd ed.). Lawrence Erlbaum Associates. [Google Scholar]
- Danckert, J., & Merrifield, C. (2018). Boredom, sustained attention and the default mode network. Experimental Brain Research, 236(9), 2507–2518. [Google Scholar] [CrossRef] [Scilit] [PubMed]
- Duckworth, A. L., Gendler, T. S., & Gross, J. J. (2016). Situational strategies for self-control. Perspectives on Psychological Science, 11(1), 35–55. [Google Scholar] [CrossRef] [Scilit] [PubMed]
- Duckworth, A. L., & Kern, M. L. (2011). A meta-analysis of the convergent validity of self-control measures. Journal of Research in Personality, 45(3), 259–268. [Google Scholar] [CrossRef] [Scilit] [PubMed]
- Duckworth, A. L., Tsukayama, E., & Kirby, T. A. (2013). Is it really self-control? Examining the predictive power of the delay of gratification task. Personality and Social Psychology Bulletin, 39(7), 843–855. [Google Scholar] [CrossRef] [Scilit] [PubMed]
- Eisenberg, I. W., Bissett, P. G., Enkavi, A. Z., Li, J., MacKinnon, D. P., Marsch, L. A., & Poldrack, R. A. (2019). Uncovering the structure of self-regulation through data-driven ontology discovery. Nature Communications, 10(1), 2319. [Google Scholar] [CrossRef] [Scilit] [PubMed]
- Enkavi, A. Z., Eisenberg, I. W., Bissett, P. G., Mazza, G. L., MacKinnon, D. P., Marsch, L. A., & Poldrack, R. A. (2019). Large-scale analysis of test-retest reliabilities of self-regulation measures. Proceedings of the National Academy of Sciences, 116(12), 5472–5477. [Google Scholar] [CrossRef] [Scilit] [PubMed]
- Ford, B. Q., & Troy, A. S. (2019). Reappraisal reconsidered: A closer look at the costs of an acclaimed emotion-regulation strategy. Current Directions in Psychological Science, 28(2), 195–203, (Correction in 2019, Current Directions in Psychological Science, 28(3), 327). [Google Scholar] [CrossRef] [Scilit]
- Friedman, N. P., & Miyake, A. (2017). Unity and diversity of executive functions: Individual differences as a window on cognitive structure. Cortex, 86, 186–204. [Google Scholar] [CrossRef] [Scilit] [PubMed]
- Friedman, N. P., Miyake, A., Young, S. E., DeFries, J. C., Corley, R. P., & Hewitt, J. K. (2008). Individual differences in executive functions are almost entirely genetic in origin. Journal of Experimental Psychology: General, 137(2), 201–225. [Google Scholar] [CrossRef] [Scilit] [PubMed]
- Fujita, K. (2011). On conceptualizing self-control as more than the effortful inhibition of impulses. Personality and Social Psychology Review, 15(4), 352–366. [Google Scholar] [CrossRef] [Scilit] [PubMed]
- Garbi, D., & Meiran, N. (2024). The structure of individual differences in procedural working memory: Comparing task switching and stimulus response rule information load. Intelligence, 104, 101817. [Google Scholar] [CrossRef] [Scilit]
- Garbi, D., Noam, Y., Sorek-Pozes, H., Hefetz-Haroush, U., & Meiran, N. (2024). Sex similarities and differences in executive functions: Examining measurement invariance in a multi-group confirmatory factor analysis with replication. Personality and Individual Differences, 227, 112712. [Google Scholar] [CrossRef] [Scilit]
- Giuliani, N. R., Calcott, R. D., & Berkman, E. T. (2013). Piece of cake: Cognitive reappraisal of food craving. Appetite, 64, 56–61. [Google Scholar] [CrossRef] [Scilit] [PubMed]
- Graham, J. M. (2006). Congeneric and (essentially) tau-equivalent estimates of score reliability: What they are and how to use them. Educational and Psychological Measurement, 66(6), 930–944. [Google Scholar] [CrossRef] [Scilit]
- Hancock, P. A. (2017). On the nature of vigilance. Human Factors, 59(1), 35–43. [Google Scholar] [CrossRef] [Scilit] [PubMed]
- Havermans, R. C., Vancleef, L., Kalamatianos, A., & Nederkoorn, C. (2015). Eating and inflicting pain out of boredom. Appetite, 85, 52–57. [Google Scholar] [CrossRef] [Scilit] [PubMed]
- Heatherton, T. F., & Wagner, D. D. (2011). Cognitive neuroscience of self-regulation failure. Trends in Cognitive Sciences, 15(3), 132–139. [Google Scholar] [CrossRef] [Scilit] [PubMed]
- Hendricks, M. A., & Buchanan, T. W. (2016). Individual differences in cognitive control processes and their relationship to emotion regulation. Cognition & Emotion, 30(5), 912–924. [Google Scholar] [CrossRef] [Scilit] [PubMed]
- Hennecke, M., Czikmantori, T., & Brandstätter, V. (2019). Doing despite disliking: Self-regulatory strategies in everyday aversive activities. European Journal of Personality, 33(1), 104–128. [Google Scholar] [CrossRef] [Scilit]
- Hofmann, W., Friese, M., & Strack, F. (2009). Impulse and self-control from a dual-systems perspective. Perspectives on Psychological Science, 4(2), 162–176. [Google Scholar] [CrossRef] [Scilit] [PubMed]
- Hofmann, W., Gschwendner, T., Friese, M., Wiers, R. W., & Schmitt, M. (2008). Working memory capacity and self-regulatory behavior: Toward an individual differences perspective on behavior determination by automatic versus controlled processes. Journal of Personality and Social Psychology, 95(4), 962–977. [Google Scholar] [CrossRef] [Scilit] [PubMed]
- Hofmann, W., Schmeichel, B. J., & Baddeley, A. D. (2012). Executive functions and self-regulation. Trends in Cognitive Sciences, 16(3), 174–180. [Google Scholar] [CrossRef] [Scilit] [PubMed]
- Hu, L., & Bentler, P. M. (1999). Cutoff criteria for fit indexes in covariance structure analysis: Conventional criteria versus new alternatives. Structural Equation Modeling, 6(1), 1–55. [Google Scholar] [CrossRef] [Scilit]
- Huang, R., Le, M., Yuan, J., & Yang, J. (2025). Depletion effects reduce the preference for distraction (but not reappraisal) during emotion regulation. PsyCh Journal, 14(4), 583–590. [Google Scholar] [CrossRef] [Scilit] [PubMed]
- Huang, S.-C., Jin, L., & Zhang, Y. (2017). Step by step: Sub-goals as a source of motivation. Organizational Behavior and Human Decision Processes, 141, 1–15. [Google Scholar] [CrossRef] [Scilit]
- Karmon-Presser, A., Sheppes, G., & Meiran, N. (2018). How does it “feel”? A signal detection approach to feeling generation. Emotion, 18(1), 94–115. [Google Scholar] [CrossRef] [Scilit] [PubMed]
- Kaur, K., Lohani, M., Williams, P., & Asnaani, A. (2025). A person-specific emotion regulation flexibility framework: Taking an integrative approach. Emotion Review, 17(4), 229–246. [Google Scholar] [CrossRef] [Scilit]
- Kline, R. B. (2016). Principles and practice of structural equation modeling (4th ed.). Guilford Press. [Google Scholar]
- Kobylińska, D., Lewczuk, K., Wizła, M., Marcowski, P., Blaison, C., Kastendieck, T., & Hess, U. (2023). Effectiveness of emotion regulation strategies measured by self-report and EMG as a result of strategy used, negative emotion strength and participants’ baseline HRV. Scientific Reports, 13(1), 6226. [Google Scholar] [CrossRef] [Scilit] [PubMed]
- Lange, K., Kühn, S., & Filevich, E. (2015). “Just Another Tool for Online Studies” (JATOS): An easy solution for setup and management of web experiments. PLoS ONE, 10(6), e0130834, (Correction in 2015, PLoS ONE, 10(7), e0134073). [Google Scholar] [CrossRef] [Scilit] [PubMed]
- Langner, R., & Eickhoff, S. B. (2013). Sustaining attention to simple tasks: A meta-analytic review of the neural mechanisms of vigilant attention. Psychological Bulletin, 139(4), 870–900. [Google Scholar] [CrossRef] [Scilit] [PubMed]
- Liesefeld, H. R., Fu, X., & Zimmer, H. D. (2015). Fast and careless or careful and slow? Apparent holistic processing in mental rotation is explained by speed-accuracy trade-offs. Journal of Experimental Psychology: Learning, Memory, and Cognition, 41(4), 1140–1151. [Google Scholar] [CrossRef] [Scilit] [PubMed]
- Locke, E. A., & Latham, G. P. (1990). A theory of goal setting & task performance. Prentice Hall. [Google Scholar]
- Lopez, R. B., Cosme, D., Werner, K. M., Saunders, B., & Hofmann, W. (2021). Associations between use of self-regulatory strategies and daily eating patterns: An experience sampling study in college-aged women. Motivation and Emotion, 45(6), 747–758. [Google Scholar] [CrossRef] [Scilit]
- Mann, D. P., Snover, R., Boyd, J. R., List, A. J., Kuhn, A. J., Devereaux, B. N., Chenoweth, S. M., & Middaugh, G. L. (2015). Executive functioning: Relationship with high school student role performance. The Open Journal of Occupational Therapy, 3(4), 2. [Google Scholar] [CrossRef] [Scilit]
- Mathôt, S., Schreij, D., & Theeuwes, J. (2012). OpenSesame: An open-source, graphical experiment builder for the social sciences. Behavior Research Methods, 44(2), 314–324. [Google Scholar] [CrossRef] [Scilit] [PubMed]
- McRae, K., Jacobs, S. E., Ray, R. D., John, O. P., & Gross, J. J. (2012). Individual differences in reappraisal ability: Links to reappraisal frequency, well-being, and cognitive control. Journal of Research in Personality, 46(1), 2–7, (Correction in 2013, Journal of Research in Personality, 47(3), 226). [Google Scholar] [CrossRef] [Scilit]
- Middelweerd, A., Mollee, J. S., van der Wal, C. N., Brug, J., & Te Velde, S. J. (2014). Apps to promote physical activity among adults: A review and content analysis. International Journal of Behavioral Nutrition and Physical Activity, 11, 97. [Google Scholar] [CrossRef] [Scilit] [PubMed]
- Milyavskaya, M., Saunders, B., & Inzlicht, M. (2021). Self-control in daily life: Prevalence and effectiveness of diverse self-control strategies. Journal of Personality, 89(4), 634–651. [Google Scholar] [CrossRef] [Scilit] [PubMed]
- Miyake, A., & Friedman, N. P. (2012). The nature and organization of individual differences in executive functions: Four general conclusions. Current Directions in Psychological Science, 21(1), 8–14. [Google Scholar] [CrossRef] [Scilit] [PubMed]
- Miyake, A., Friedman, N. P., Emerson, M. J., Witzki, A., Howerter, A., & Wager, T. D. (2000). The unity and diversity of executive functions and their contributions to complex “frontal lobe” tasks: A latent variable analysis. Cognitive Psychology, 41(1), 49–100. [Google Scholar] [CrossRef] [Scilit] [PubMed]
- Neath, A. A., & Cavanaugh, J. E. (2012). The Bayesian information criterion: Background, derivation, and applications. WIREs Computational Statistics, 4(2), 199–203. [Google Scholar] [CrossRef] [Scilit]
- O’Connell, K. A., Hosein, V. L., Schwartz, J. E., & Leibowitz, R. Q. (2007). How does coping help people resist lapses during smoking cessation? Health Psychology, 26(1), 77–84. [Google Scholar] [CrossRef] [Scilit] [PubMed]
- Paap, K. R., Anders-Jefferson, R. T., Balakrishnan, N., & Majoubi, J. B. (2024). The many foibles of Likert scales challenge claims that self-report measures of self-control are better than performance-based measures. Behavior Research Methods, 56(2), 908–933. [Google Scholar] [CrossRef] [Scilit] [PubMed]
- Pershin, I., Candrian, G., Münger, M., Baschera, G.-M., Rostami, M., Eich, D., & Müller, A. (2023). Vigilance described by the time-on-task effect in EEG activity during a cued Go/NoGo task. International Journal of Psychophysiology, 183, 92–102. [Google Scholar] [CrossRef] [Scilit] [PubMed]
- Pruessner, L., Barnow, S., Holt, D. V., Joormann, J., & Schulze, K. (2020). A cognitive control framework for understanding emotion regulation flexibility. Emotion, 20(1), 21–29. [Google Scholar] [CrossRef] [Scilit] [PubMed]
- Qualtrics. (2023). Qualtrics survey software. Available online: https://www.qualtrics.com (accessed on 8 October 2026).
- Radtke, V. C., Wolff, W., & Martarelli, C. S. (2025). How effortful is boredom? Studying self-control demands through pupillometry. Collabra: Psychology, 11(1), 151266. [Google Scholar] [CrossRef] [Scilit]
- R Core Team. (2022). R: A language and environment for statistical computing. R Foundation for Statistical Computing. Available online: https://www.R-project.org/ (accessed on 8 October 2026).
- Rodas, J. A., León-Rojas, J. E., & Rooney, B. (2024). Mind over mood: Exploring the executive function’s role in downregulation. Frontiers in Psychology, 15, 1322055. [Google Scholar] [CrossRef] [Scilit] [PubMed]
- Roos, C. R., Kober, H., Trull, T. J., MacLean, R. R., & Mun, C. J. (2020). Intensive longitudinal methods for studying the role of self-regulation strategies in substance use behavior change. Current Addiction Reports, 7(3), 301–316. [Google Scholar] [CrossRef] [Scilit] [PubMed]
- Rosseel, Y. (2012). lavaan: An R package for structural equation modeling. Journal of Statistical Software, 48(2), 1–36. [Google Scholar] [CrossRef] [Scilit]
- Satorra, A., & Bentler, P. (1988). Scaling corrections for statistics in covariance structure analysis. UCLA Department of Statistics. [Google Scholar]
- Saunders, B., Milyavskaya, M., & Inzlicht, M. (2022). Longitudinal evidence that event-related potential measures of self-regulation do not predict everyday goal pursuit. Nature Communications, 13(1), 3201. [Google Scholar] [CrossRef] [Scilit] [PubMed]
- Schmeichel, B. J., & Tang, D. (2015). Individual differences in executive functioning and their relationship to emotional processes and responses. Current Directions in Psychological Science, 24(2), 93–98. [Google Scholar] [CrossRef] [Scilit]
- Scholer, A. A., Miele, D. B., Murayama, K., & Fujita, K. (2018). New directions in self-regulation: The role of metamotivational beliefs. Current Directions in Psychological Science, 27(6), 437–442. [Google Scholar] [CrossRef] [Scilit]
- Schwarz, G. (1978). Estimating the dimension of a model. The Annals of Statistics, 6(2), 461–464. [Google Scholar] [CrossRef] [Scilit]
- Sheppes, G., Catran, E., & Meiran, N. (2009). Reappraisal (but not distraction) is going to make you sweat: Physiological evidence for self-control effort. International Journal of Psychophysiology, 71(2), 91–96. [Google Scholar] [CrossRef] [Scilit] [PubMed]
- Sheppes, G., Scheibe, S., Suri, G., & Gross, J. J. (2011). Emotion-regulation choice. Psychological Science, 22(11), 1391–1396. [Google Scholar] [CrossRef] [Scilit] [PubMed]
- Soper, D. S. (2023). Calculator: A-priori sample size for structural equation models [Web application]. Free Statistics Calculators. Available online: https://www.danielsoper.com/statcalc/calculator.aspx?id=89 (accessed on 8 October 2026).
- Specker, P., Sheppes, G., & Nickerson, A. (2024). Does emotion regulation flexibility work? Investigating the effectiveness of regulatory selection flexibility in managing negative affect. Social Psychological and Personality Science, 15(5), 561–569. [Google Scholar] [CrossRef] [Scilit]
- Szasz, P. L., Szentagotai, A., & Hofmann, S. G. (2012). Effects of emotion regulation strategies on smoking craving, attentional bias, and task persistence. Behaviour Research and Therapy, 50(5), 333–340. [Google Scholar] [CrossRef] [Scilit] [PubMed]
- Taber, K. S. (2018). The use of Cronbach’s alpha when developing and reporting research instruments in science education. Research in Science Education, 48(6), 1273–1296. [Google Scholar] [CrossRef] [Scilit]
- Thomson, D. R., Besner, D., & Smilek, D. (2015). A resource-control account of sustained attention: Evidence from mind-wandering and vigilance paradigms. Perspectives on Psychological Science, 10(1), 82–96. [Google Scholar] [CrossRef] [Scilit] [PubMed]
- Toh, W. X., Keh, J. S., Gross, J. J., & Carstensen, L. L. (2024). The role of executive function in cognitive reappraisal: A meta-analytic review. Emotion, 24(7), 1563–1581. [Google Scholar] [CrossRef] [Scilit] [PubMed]
- Urry, H. L., & Gross, J. J. (2010). Emotion regulation in older age. Current Directions in Psychological Science, 19(6), 352–357. [Google Scholar] [CrossRef] [Scilit]
- Van Bockstaele, B., Atticciati, L., Hiekkaranta, A. P., Larsen, H., & Verschuere, B. (2020). Choose change: Situation modification, distraction, and reappraisal in mild versus intense negative situations. Motivation and Emotion, 44(4), 583–596. [Google Scholar] [CrossRef] [Scilit]
- Van Dillen, L. F., & Papies, E. K. (2015). From distraction to mindfulness: Psychological and neural mechanisms of attention strategies in self-regulation. In G. Gendolla, M. Tops, & S. Koole (Eds.), Handbook of biobehavioral approaches to self-regulation (pp. 141–154). Springer. [Google Scholar] [CrossRef] [Scilit]
- Veríssimo, J., Verhaeghen, P., Goldman, N., Weinstein, M., & Ullman, M. T. (2022). Evidence that ageing yields improvements as well as declines across attention and executive functions. Nature Human Behaviour, 6(1), 97–110. [Google Scholar] [CrossRef] [Scilit] [PubMed]
- Vilardaga, R., Casellas-Pujol, E., McClernon, J. F., & Garrison, K. A. (2019). Mobile applications for the treatment of tobacco use and dependence. Current Addiction Reports, 6(2), 86–97. [Google Scholar] [CrossRef] [Scilit] [PubMed]
- Wahlers, J. N., Garrison, K., & Schmeichel, B. J. (2025). Working memory capacity relates to reduced negative emotion in daily life. Cognition & Emotion, 39(2), 453–464. [Google Scholar] [CrossRef] [Scilit] [PubMed]
- Welhaf, M. S., & Kane, M. J. (2024). A combined experimental–correlational approach to the construct validity of performance-based and self-report-based measures of sustained attention. Attention, Perception, & Psychophysics, 86(1), 109–145. [Google Scholar] [CrossRef] [Scilit] [PubMed]
- Wennerhold, L., & Friese, M. (2023). Challenges in the conceptualization of trait self-control as a psychological construct. Social and Personality Psychology Compass, 17(3), e12726. [Google Scholar] [CrossRef] [Scilit]
- Westland, J. C. (2010). Lower bounds on sample size in structural equation modeling. Electronic Commerce Research and Applications, 9(6), 476–487, (Erratum in 2012, Electronic Commerce Research and Applications, 11(4), 445). [Google Scholar] [CrossRef] [Scilit]
- Williamson, L. Z., & Wilkowski, B. M. (2020). Nipping temptation in the bud: Examining strategic self-control in daily life. Personality and Social Psychology Bulletin, 46(6), 961–975. [Google Scholar] [CrossRef] [Scilit] [PubMed]
- Woods, D. L., Wyma, J. M., Yund, E. W., Herron, T. J., & Reed, B. (2015). Factors influencing the latency of simple reaction time. Frontiers in Human Neuroscience, 9, 131. [Google Scholar] [CrossRef] [Scilit] [PubMed]
- Zhang, Y., & Gao, L. (2016). Wanting ever more: Acquisition procedure motivates continued reward acquisition. Journal of Consumer Research, 43(2), 230–245. [Google Scholar] [CrossRef] [Scilit]
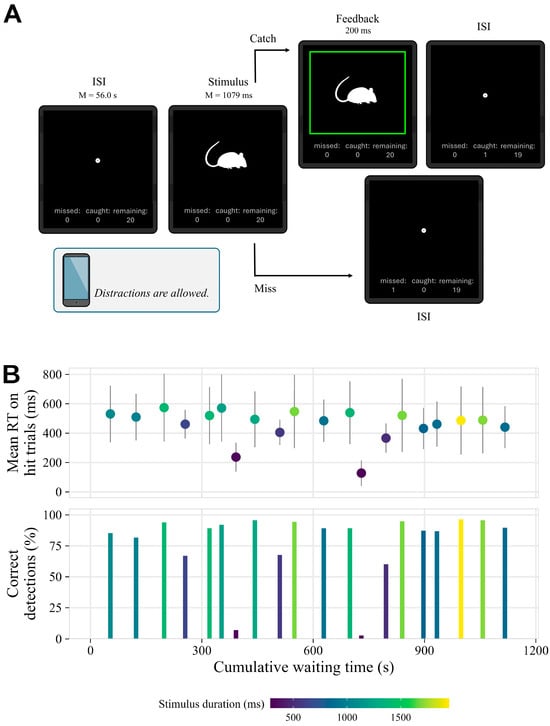
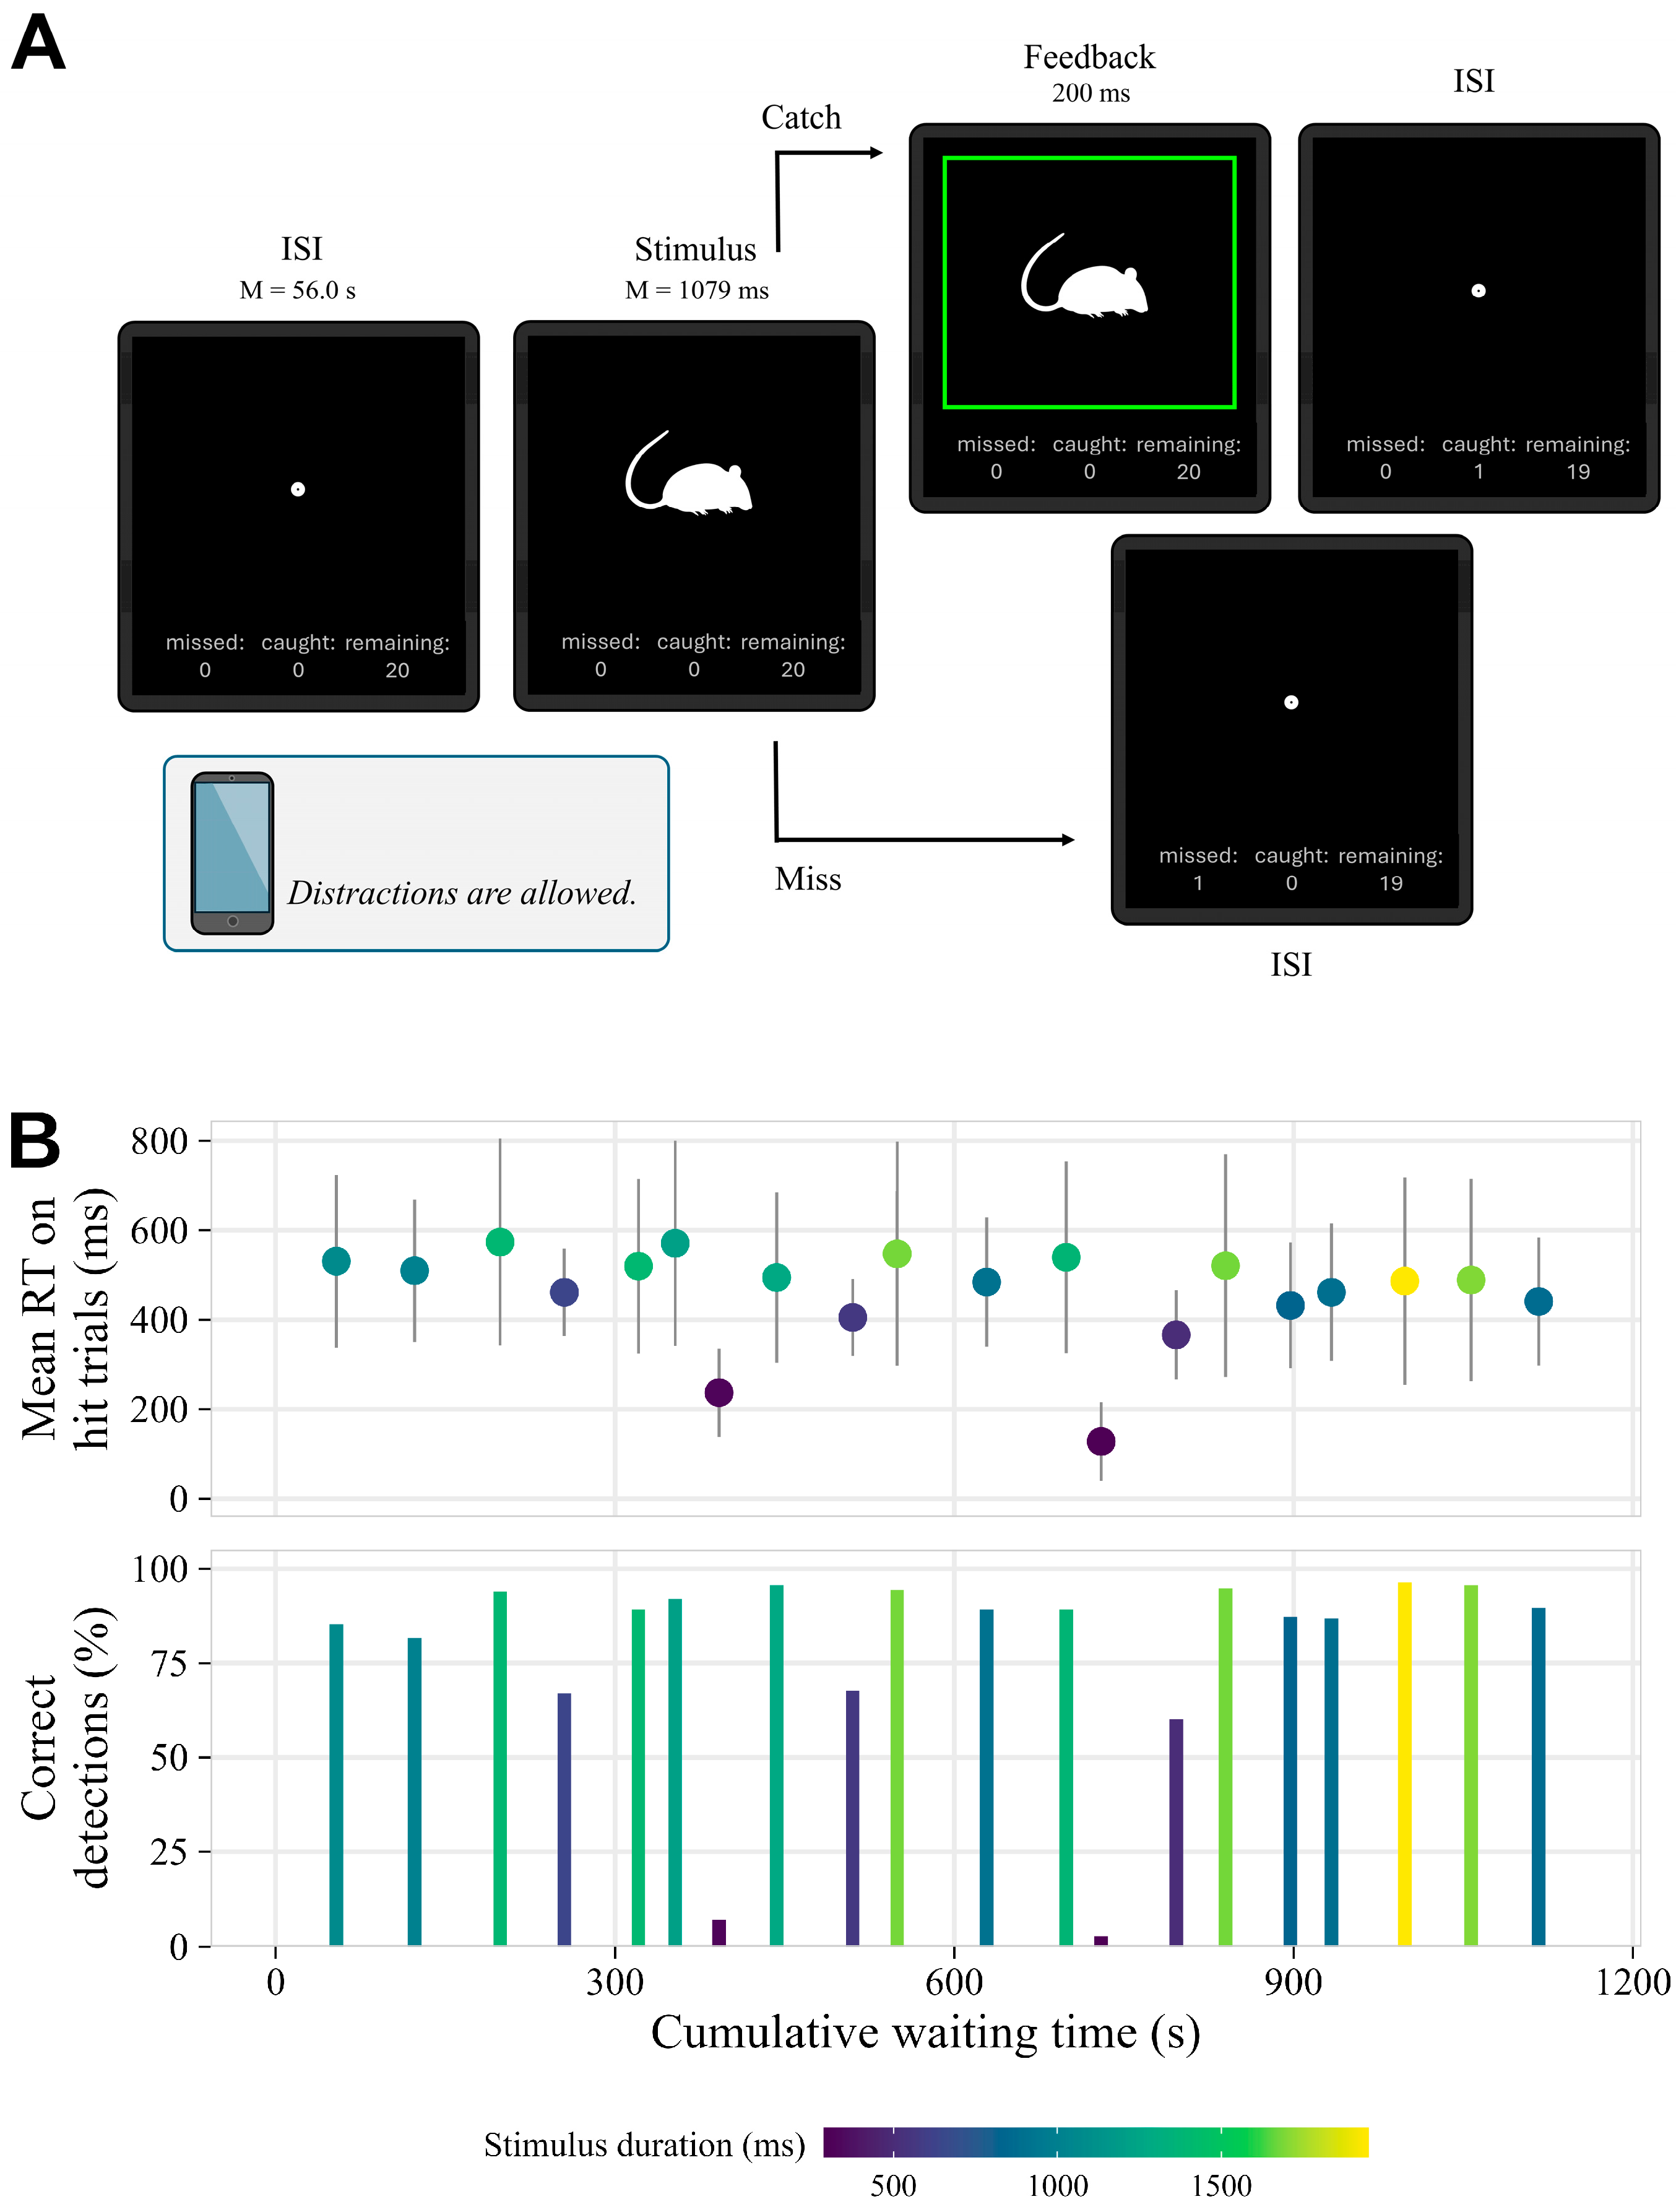
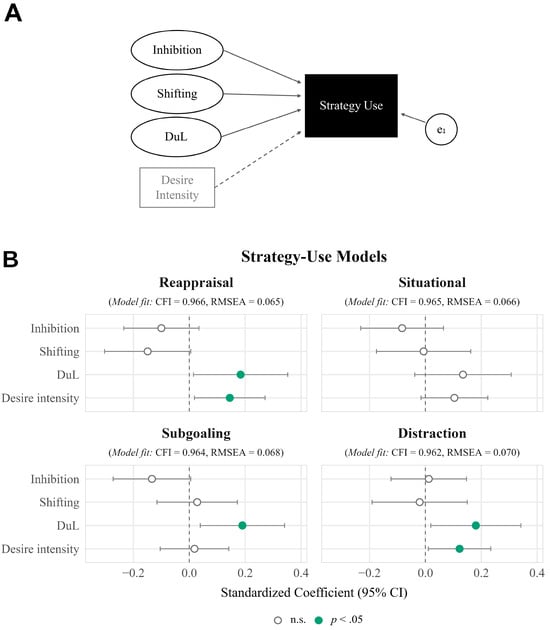
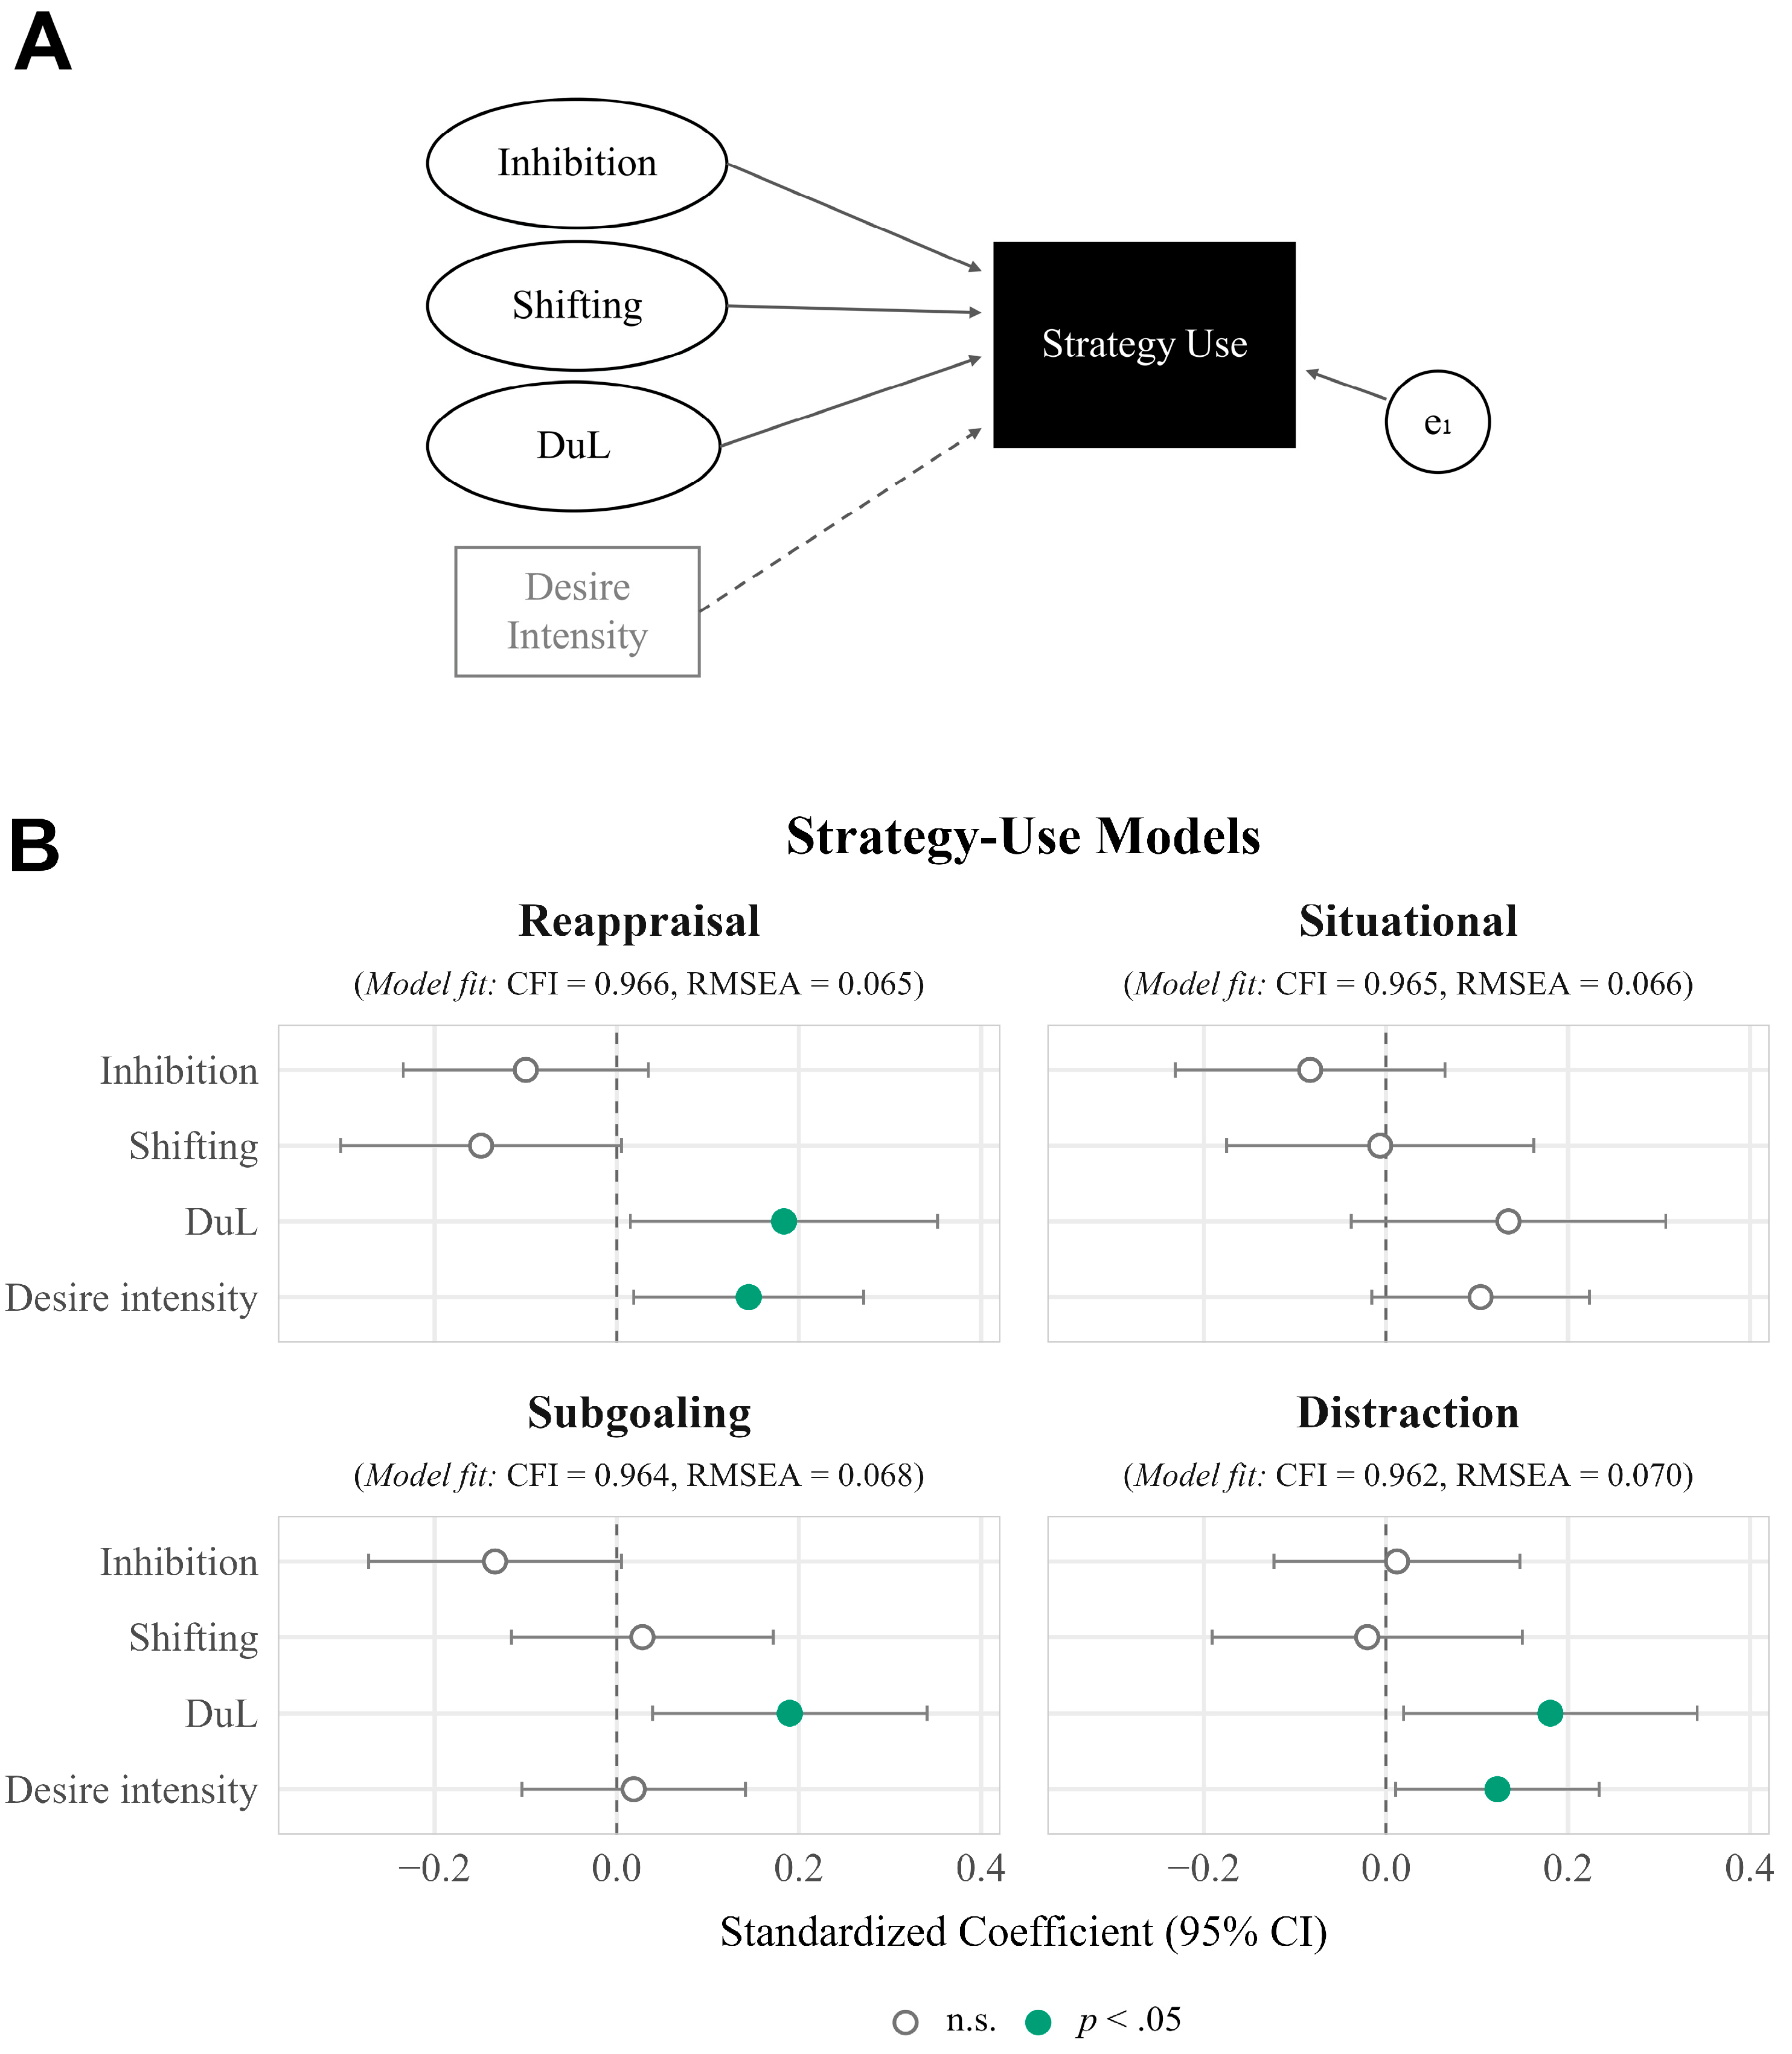
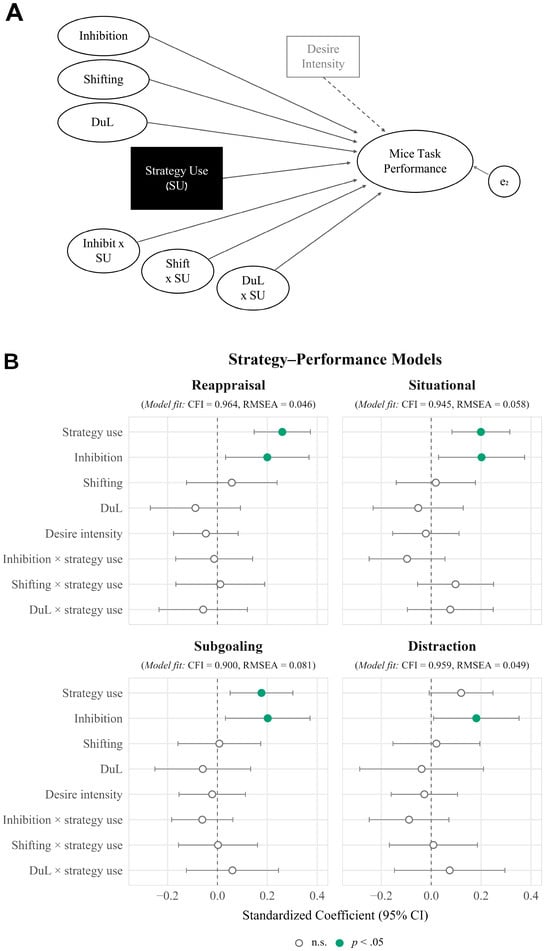
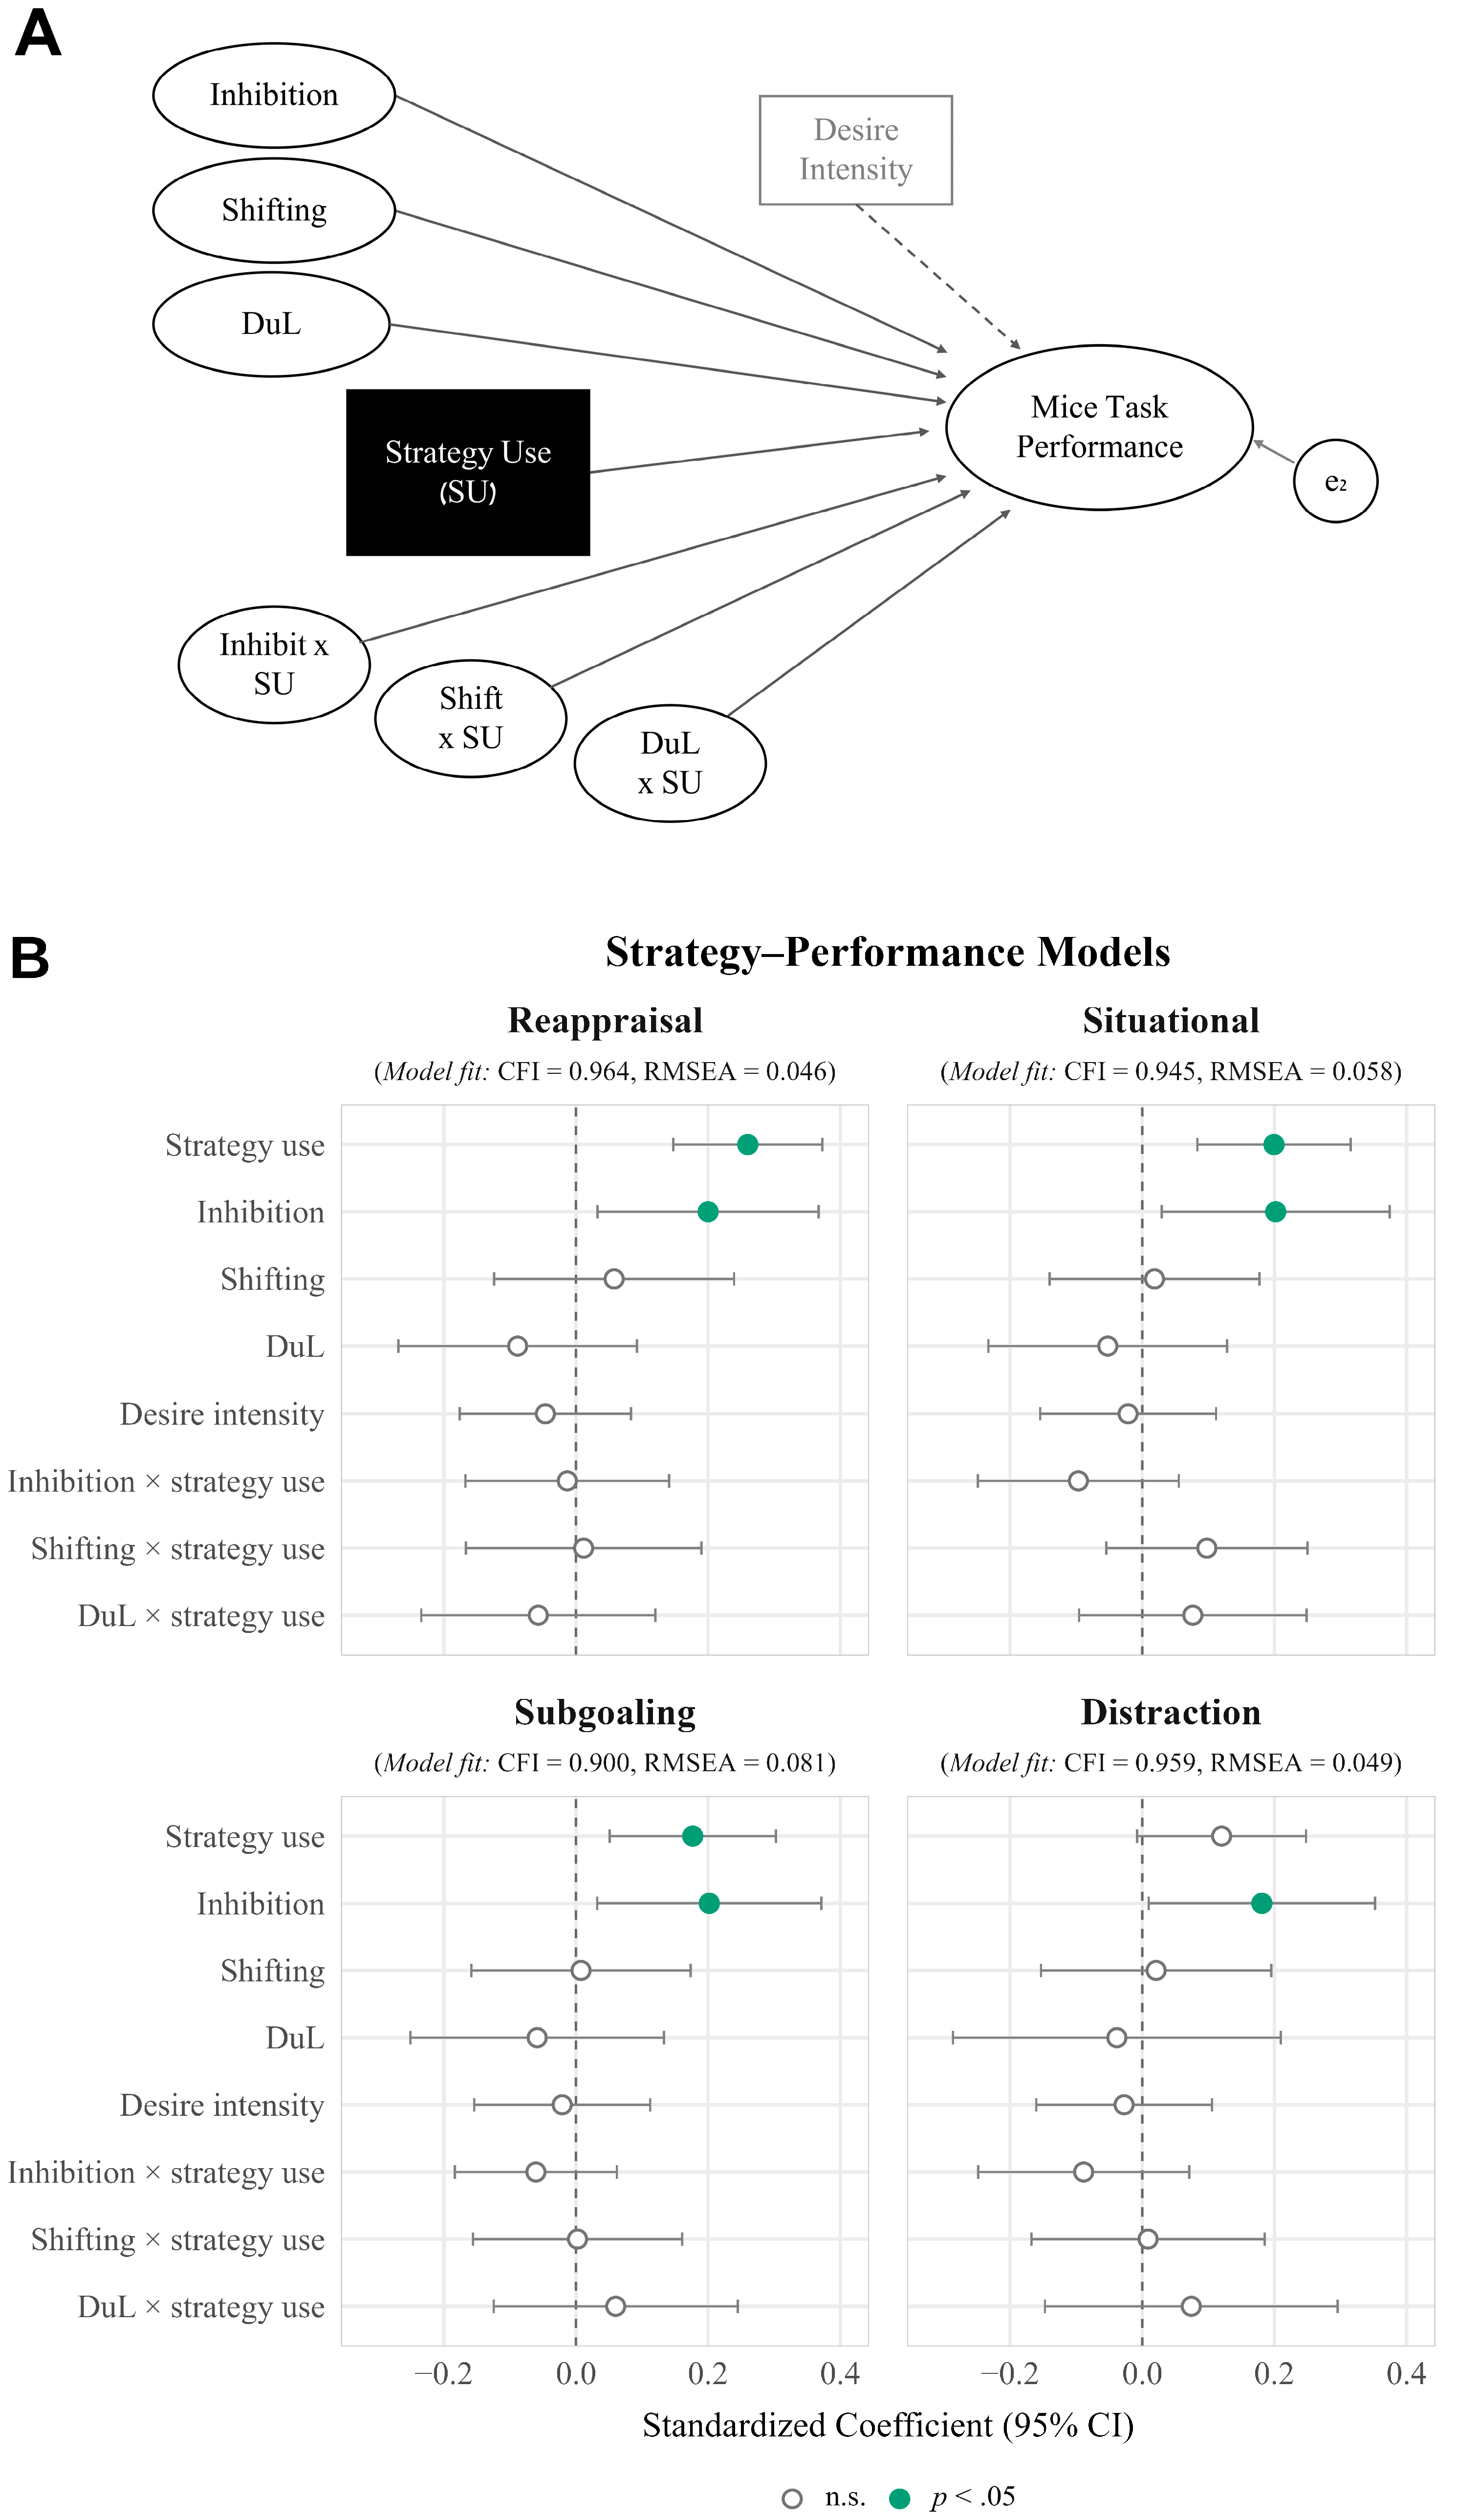
Disclaimer/Publisher’s Note: The statements, opinions and data contained in all publications are solely those of the individual author(s) and contributor(s) and not of MDPI and/or the editor(s). MDPI and/or the editor(s) disclaim responsibility for any injury to people or property resulting from any ideas, methods, instructions or products referred to in the content. |
© 2026 by the authors. Licensee MDPI, Basel, Switzerland. This article is an open access article distributed under the terms and conditions of the Creative Commons Attribution (CC BY) license.