


Abstract
Although hydrogen plays a crucial role in the EU’s strategy to reduce greenhouse gas emissions, its storage and transport are technically challenging. If ammonia is produced efficiently, it can be a promising hydrogen carrier, especially in decentralized and flexible conditions. The Horizon EU HySTrAm project addresses this problem by developing a small-scale, containerized demonstration plant consisting of (1) a short-term hydrogen storage container using novel ultraporous materials optimized through machine learning, and (2) an ammonia synthesis reactor based on an improved low-pressure Haber–Bosch process. This paper presents an initial version of a Python (v3.9)-based dashboard designed to visualize and optimize the simulation workflow of the ammonia synthesis process. Designed as a baseline for a future online, automated tool, the dashboard allows the comparison of three reactor configurations already defined through simulations and aligned with the upcoming experimental campaign: single tube, two reactors in parallel swing mode and two reactors in series. Pressures at the inlet/outlet, temperatures across the reactor, operation recipe and ammonia production over time are displayed dynamically to evaluate the performance of the reactor. Future versions will include optimization features, such as the identification of optimal operating modes, the reduction of production time, an increase of productivity, and catalyst degradation estimation.
1. Introduction
1.1. Climate Targets, Renewable Energy and Storage Challenges
The Paris Agreement’s aim is to keep the global temperature increase under 2 °C compared with pre-industrial levels, while aiming to limit it to 1.5 °C, through the implementation of low-carbon technologies [1]. Achieving the goals of the Paris Agreement, along with the European Union’s (EU) ambition to be climate neutral by 2050, requires a shift to a zero-emission society [1]. Despite greater use of renewable energy sources (RES), global greenhouse gas (GHG) emissions have continued their upward trend, reaching around 51.8 billion CO2-equivalent tonnes in 2023, with the energy sector being the primary source [2,3]. In order to achieve net-zero emissions by 2050, RES need to account for 60% of electricity generation by 2030, compared with 29.1% in 2022 [4,5].
In northern regions such as Europe, renewable energy production varies depending on the season [6]. Consequently, energy storage solutions that can operate for extended periods (months to seasons) and at significant capacities (GWh–TWh) are valuable for aligning seasonal energy production with consumption. The rapid increase of global energy demand due to extreme temperatures, higher industrial consumption, the electrification of transport and the expansion of the data centre and artificial intelligence sector [7], necessitates a shift towards sustainably produced carbon-free fuel. Hydrogen is gaining importance in the global effort to achieve zero emissions by 2050. This clean energy source is particularly significant for reducing CO2 emissions in sectors that are difficult to decarbonise by other methods, such as heavy industry, transport and heating [8].
1.2. Hydrogen as a Low-Carbon Energy Carrier: Potential and Limitations
Hydrogen (H2), a low-carbon energy source, has the potential to be a significant fuel substitute for industries with high energy needs. It can also act as an energy storage medium by converting extra renewable energy into H2 through electrolysis and storing it for later use when energy demand is high [3,4,5].
Hydrogen is a promising alternative to traditional energy sources that are finite and contribute significantly to CO2 emissions and global warming. Because of its characteristics—it is the lightest and most abundant element in the universe [9], can be produced domestically, and burns cleanly, releasing only water—hydrogen is a strong candidate for reducing GHG emissions in several sectors [10]. Hydrogen is very efficient in fuel cell vehicles, providing two to three times more energy per unit compared with gasoline [8]. Hydrogen is also expected to have a significant impact because, unlike solar or wind power, it can be produced on a large scale regardless of weather conditions [11]. However, its widespread use is limited by its low energy density per unit volume, high flammability risk, and the considerable energy needed for storage [12].
2. Literature Review: Hydrogen Storage and Monitoring Technologies
2.1. Hydrogen Storage Technologies
Existing techniques generally store hydrogen (H2) in liquid form or within high-pressure containers. Both approaches necessitate considerable initial expenses, as H2 must be cooled to extremely low temperatures (−253 °C) to maintain liquid or must be compressed to very high pressures (up to 70 MPa) at ambient temperature [13]. Moreover, the transportation and storage of H2 in any state can pose safety risks to the general population because of its flammability [12].
Employing carriers like compressed hydrogen, liquid hydrogen, methanol, liquid organic hydrogen carriers, and ammonia (NH3) can alleviate storage and transport issues while increasing volumetric energy density [14]. CO2 emissions of green methanol for hydrogen storage, transport and regeneration are significantly higher (by 272.7%) when compared with green ammonia [15]. Thus, green ammonia appears as a sustainable, environmentally friendly hydrogen carrier. To effectively reduce CO2 emissions in the energy industry, NH3 must be produced from RES. Currently, only a small fraction of the world’s ammonia, about 0.01%, is produced using RES, with the majority still relying on fossil fuels [16].
2.2. Digital Monitoring and Dashboard Development for Hydrogen and Ammonia Systems
In modern industrial and energy systems, supervising systems are increasingly adapting digital solutions that integrate real-time data acquisition, visualization and analysis to support process monitoring and decision-making [17]. Recent literature shows that data visualization tools and dashboards are becoming increasingly important for modern monitoring systems. These tools enable operators and engineers to evaluate system performance, compare different process settings, and understand complex operational data as it occurs. This development is part of a broader trend toward the use of digital monitoring tools in modern advanced industrial and energy applications [18]. Similar approaches have been applied in various sectors, where dashboards enable real-time monitoring and data collection for complex processes [19,20,21,22,23,24]. Cyber–physical systems and interconnected intelligent devices provide the foundation for advanced monitoring and control, where collected data can be analysed and visualized to support decision-making and system operation [25,26].
Choi et al. [27] described an example of creating an overall equipment effectiveness dashboard. They achieved this by using a reference model from the National Institute of Standards and Technology in combination with a commercial IoT platform, with the aim of building a smart factory. For interfacing with the factory, they presented examples of the application of standards such as Open Platform Communications Unified Architecture (OPC-UA) and MTConnect [28], as well as examples that create a smart production environment based on manufacturing execution system (MES) [29].
Some years later, Choi et al. [30] developed a user-friendly monitoring dashboard that allows employees to monitor the status of machines and the factory directly and comprehensively. The user can configure the factory layout like a game, using a library of machines and material handling systems. The virtual 3D model is generated automatically and can be displayed on the web, on mobile devices, or in VR. Sensor data and key performance indicators (KPIs) are connected via a representational state transfer (REST) application programming interface (API) to the physical factory, enabling real-time monitoring. The user can easily change the layout or update KPIs and APIs, while the machines display their operating status with realistic movements and alarms in case of anomalies.
Folgado et al. [31] presented a pilot plant for green hydrogen applications in industrial and domestic sectors, where a PV array powers a PEM electrolyzer, producing hydrogen stored for later use in a PEM fuel cell, while a programmable load simulates consumption profiles. An open-source supervisory system collects, stores, and visualizes real-time and historical data, emphasizing inverter monitoring. The system is low-cost, scalable, and aligned with IoT and Industry 4.0.
3. Methodology and System Description: The HySTrAm Project
3.1. HySTrAm Project Overview
The Hydrogen Storage and Transport using Ammonia (HySTrAm) project [32], funded by Horizon Europe, aims to address significant challenges in the hydrogen sector by creating a sustainable, efficient and adaptable method of hydrogen storage and transport. By recognizing the potential of ammonia to act as a high-density hydrogen carrier, HySTrAm is developing a small-scale, containerized demonstration plant. This unit combines two main innovations: (1) a short-term hydrogen storage element using advanced ultraporous materials improved through machine learning and (2) a low-pressure ammonia synthesis reactor based on an improved Haber–Bosch process.
This method integrates temporary hydrogen storage in tanks utilizing highly porous substances, along with an adapted Haber–Bosch reactor that features advanced catalysts and absorbents. The objective is to showcase a budget-friendly, expandable system at the pilot stage, thereby aiding the EU’s decarbonization targets.
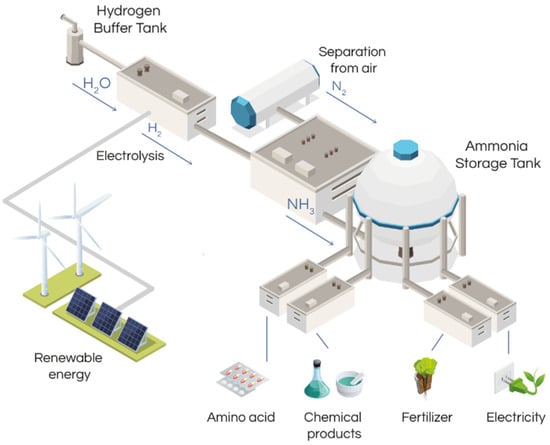
HySTrAm supports the EU’s decarbonization targets by facilitating hydrogen storage and local production of ammonia from RES, which reduces the need for large fossil fuel infrastructure. In Figure 1 the concept of HySTrAm project is presented.
Figure 1.
The concept of HySTrAm project.
The Hydrogen Storage and Transport using Ammonia (HySTrAm) project is developing a decentralized, containerized system for hydrogen storage and green ammonia production under mild operating conditions. The basic idea combines short-term hydrogen storage with ammonia production at the point of use, enabling the efficient use of renewable electricity. This approach also addresses important issues related to the storage, transport, and overall integration of the hydrogen system.
The HySTrAm system combines two connected subsystems; one of them focuses on short-term hydrogen storage, using advanced porous materials inside reinforced pressure vessels, enabling storage at lower pressures compared with traditional methods, and the other is a low-pressure ammonia synthesis reactor, which is based on an improved Haber–Bosch process and is designed for efficient performance under dynamic conditions.
In the HySTrAm project, various reactor configurations are being examined, including a single-tube reactor, two reactors operating in parallel swing mode, and two reactors operating in series, allowing their comparison.
The integrated system aims to be developed and tested on a pilot demonstrator in order to assess its performance under realistic operating conditions relevant to decentralized ammonia production. Experiments on a laboratory scale and the classification of the materials contribute to the design of the hydrogen storage vessel and ammonia synthesis reactor, while the pilot-scale demonstrator allows for the evaluation of the system’s performance, functionality, and scalability.
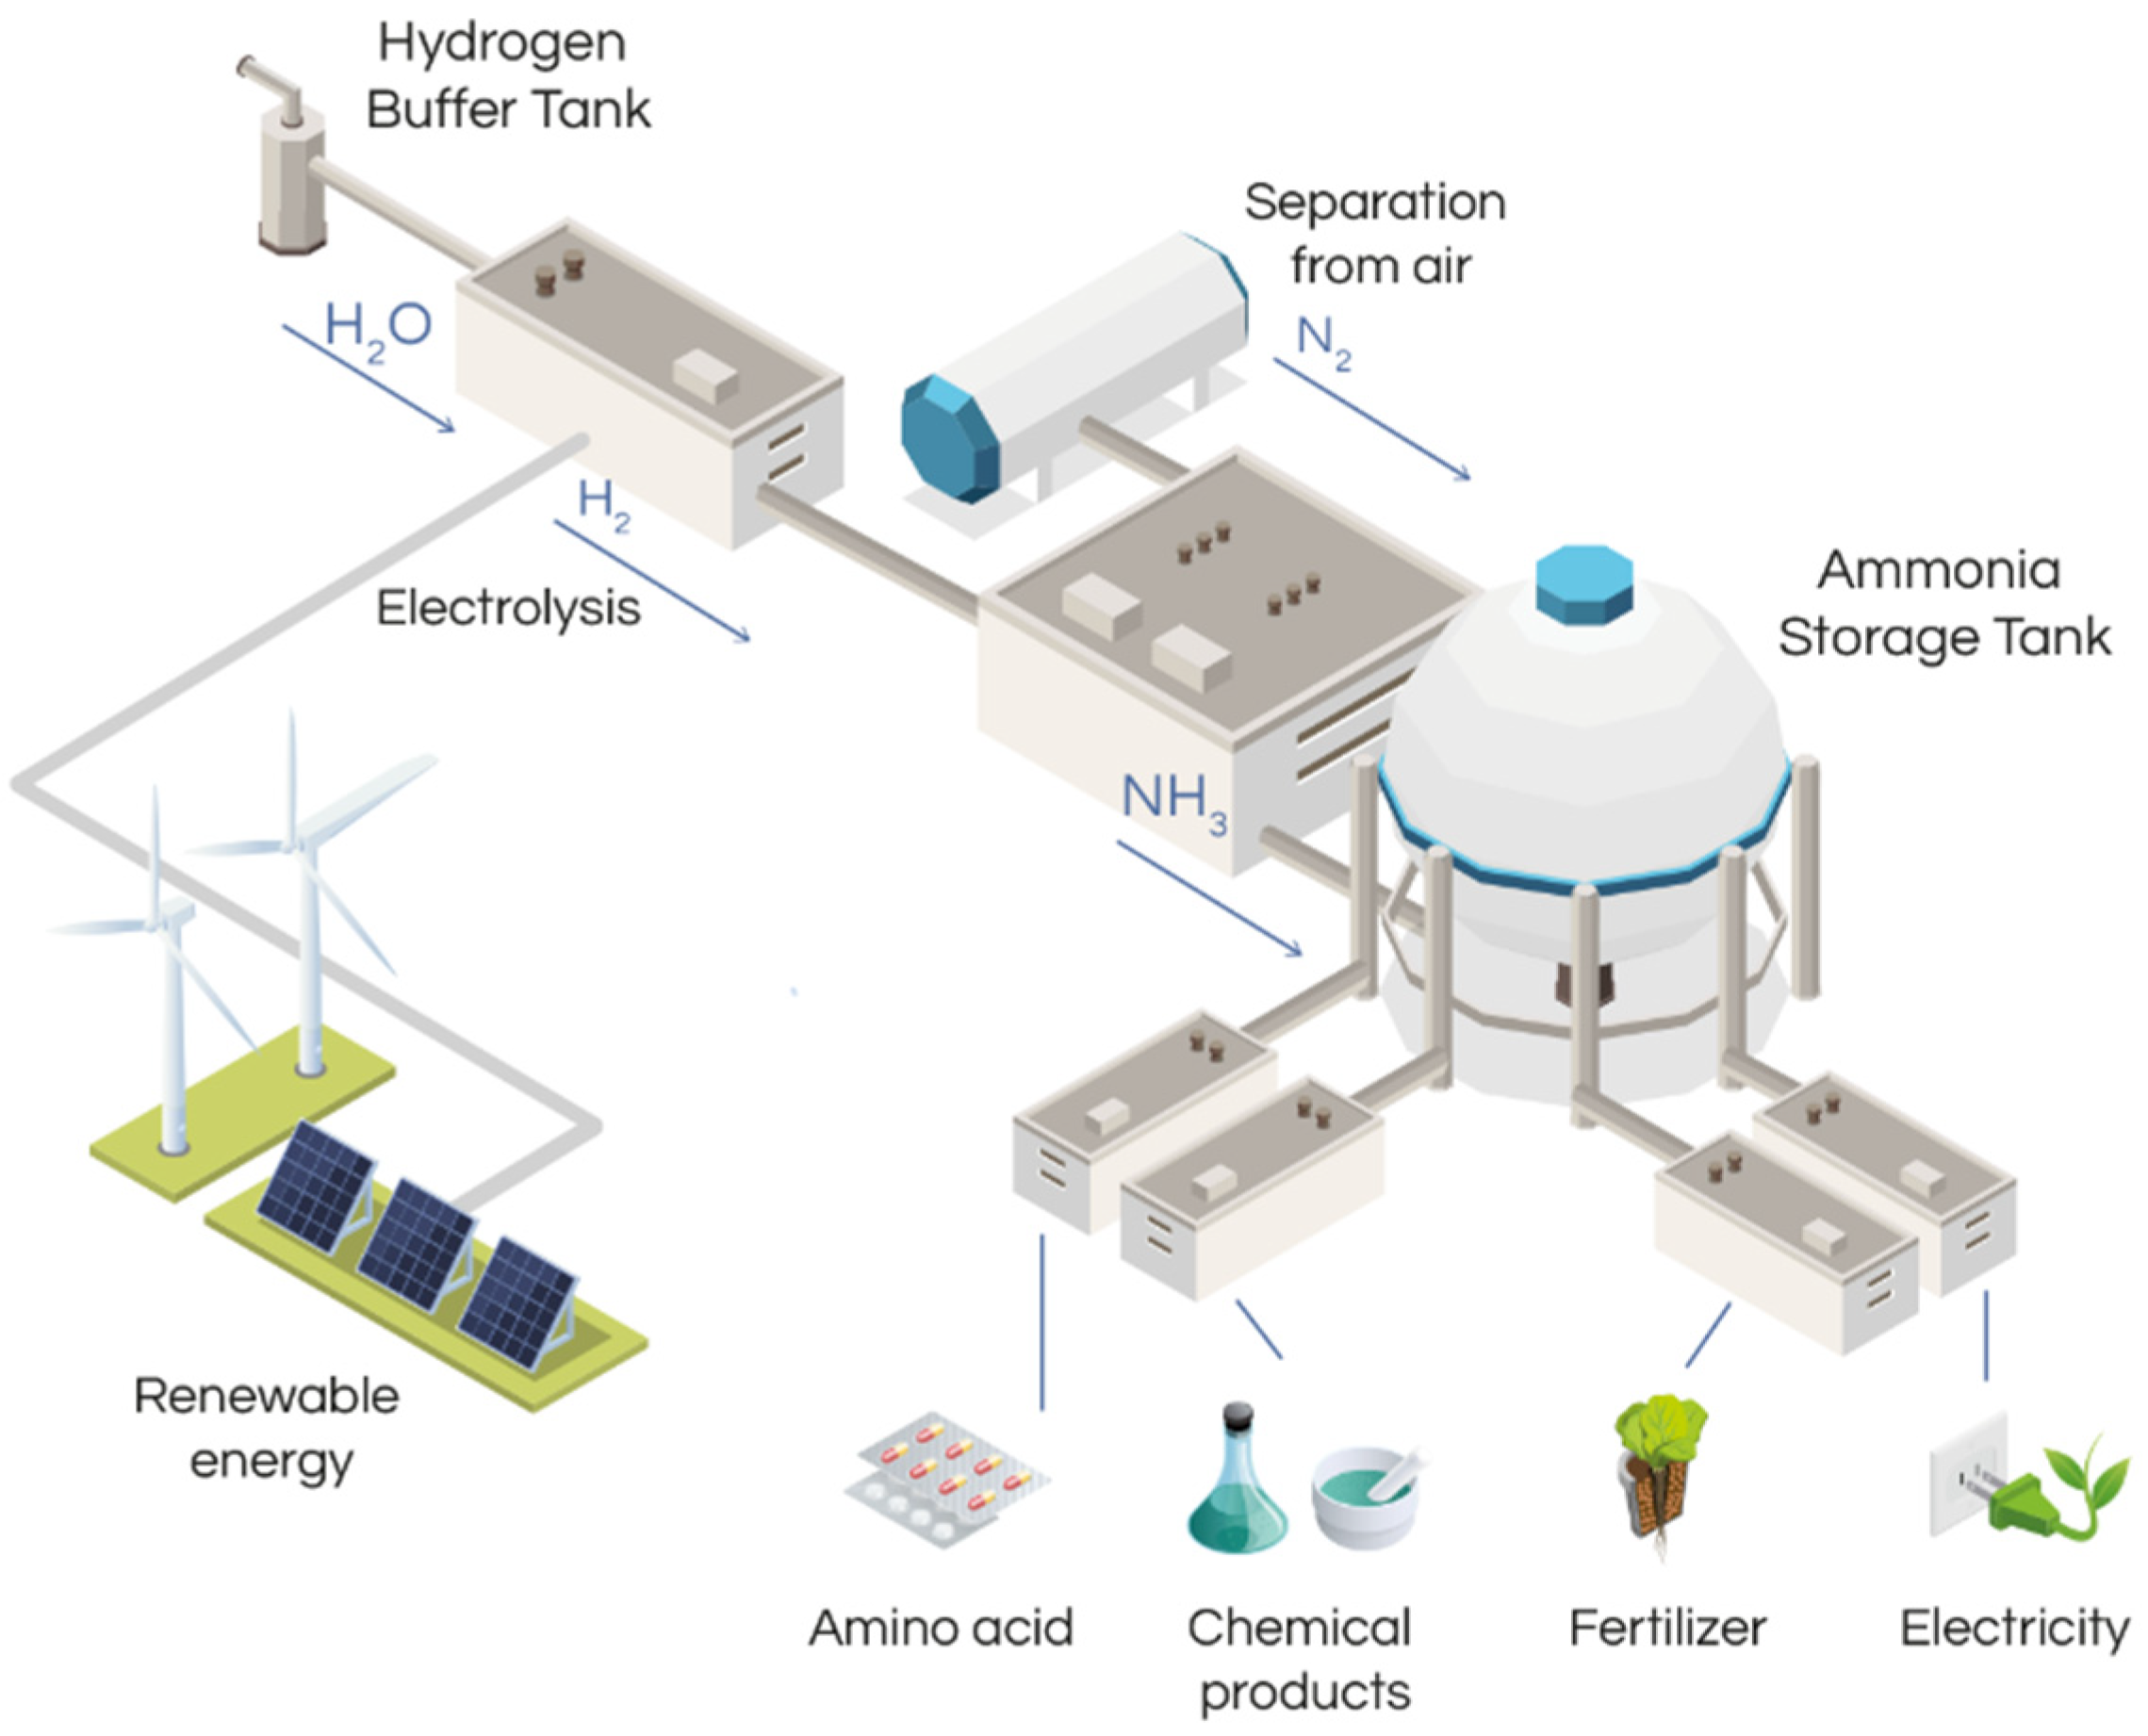
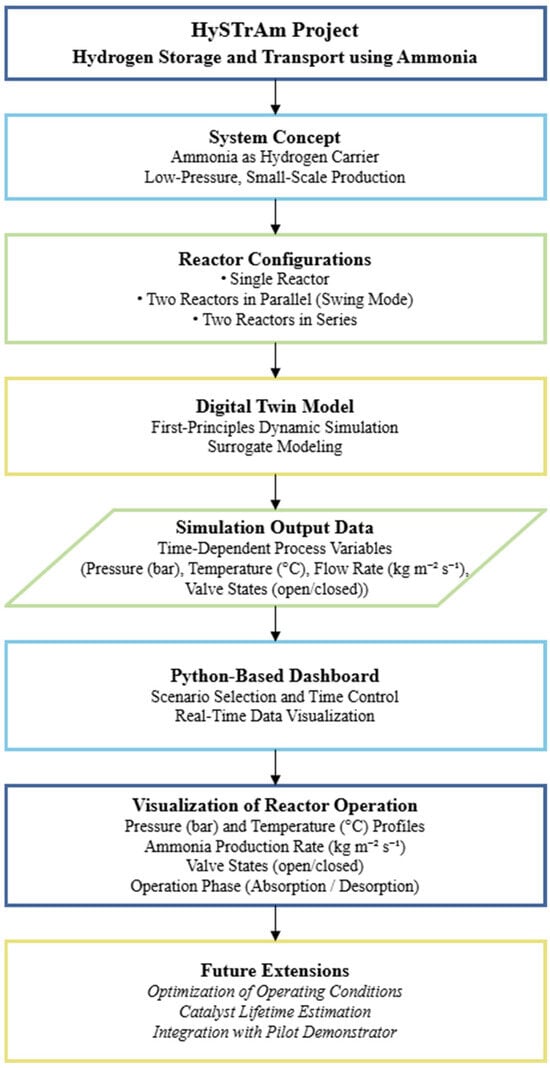
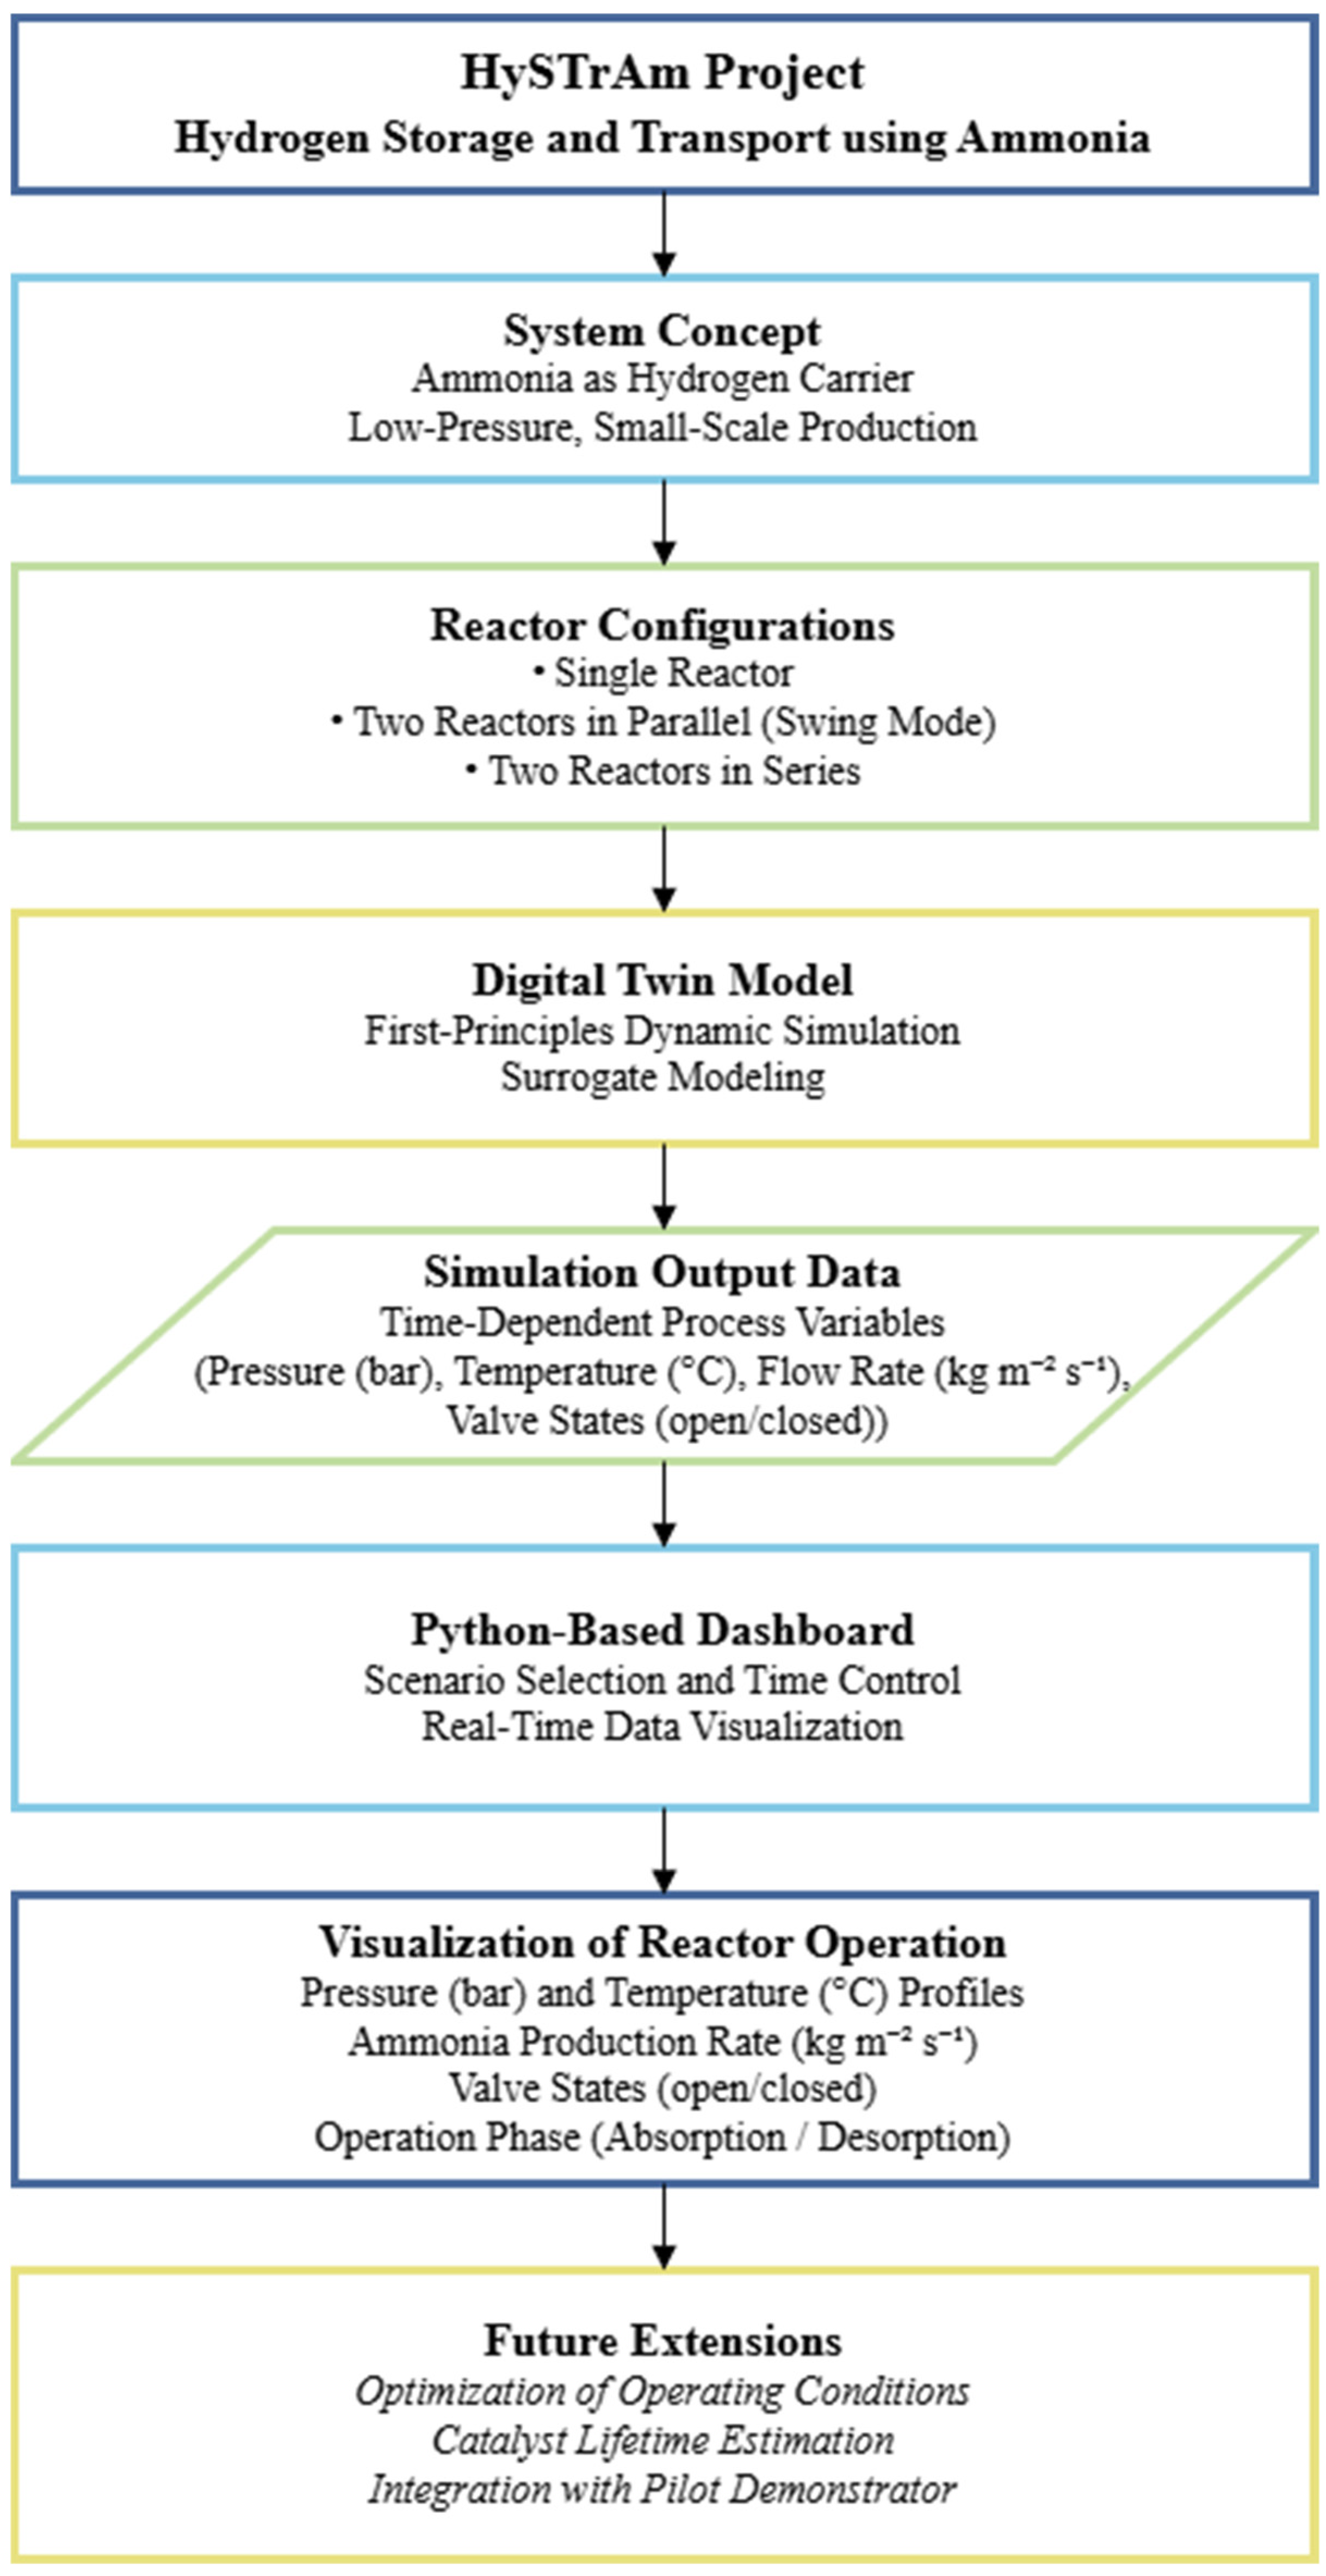
Within this context, digital tools are essential for analysing system dynamics and supporting informed design and operational decisions. The aim of the present work is the development of a Python-based dashboard for monitoring and optimization, that supports the evaluation of different reactor configurations and operating strategies. Figure 2 presents the theoretical workflow of the HySTrAm project, illustrating the relationship between reactor configuration selection, process simulation dynamics, data generation, and visualization and analysis based on the dashboard.
Figure 2.
Conceptual workflow of the HySTrAm digital framework, linking reactor configurations, dynamic simulation, and a python-based dashboard.
More specifically, each step of the conceptual workflow relates to specific process variables and operating parameters. The “Reactor Configurations” step refers to the selection among a single reactor, two reactors in parallel (swing mode), or two reactors in series. The next step, “Digital Twin Model,” performs dynamic first-principles simulations and surrogate modelling to capture the time-dependent behaviour of the process. In the “Simulation Output Data” step, key variables such as reactor pressure (bar), temperature (°C), ammonia flow rate (kg m−2 s−1), valve states (open/closed) are generated for each reactor configuration. The “Python-Based Dashboard” allows the selection of different scenarios; allows the interactive control of the simulation time; provides the user with the ability to start, pause, fast-forward, or slow down the simulation time; and allows for real-time visualization of these variables. Finally, the “Visualization of Reactor Operation” step displays quantitative pressure and temperature profiles along the reactor, ammonia production rate over time, and absorption/desorption phase, while the “Future Extensions” step includes optimization of operating conditions, estimation of catalyst lifetime, and integration with the pilot demonstrator.
3.2. HySTrAm Dashboard
For this project, a Python-based dashboard was developed to visualize and optimize the ammonia synthesis process. The dashboard, which will be further developed to be an automated and online tool, allows the comparison of different reactor designs, such as designs incorporating a single tube, two reactors in parallel swing mode, or two reactors in series. To evaluate reactor efficiency, real-time displays show inlet/outlet pressures, reactor temperature variations, the current operation recipe, and ammonia production over time. Future versions will incorporate optimization tools, including features to identify ideal operating conditions, shorten production cycles, improve output, and catalyst lifespan.
The simulation results used in the dashboard were developed by the Process Dynamics and Operations Group of Technische Universität Berlin within the framework of the HySTrAm project [33,34,35,36]. HySTrAm aims to demonstrate adaptable, small-scale ammonia production using low-pressure hydrogen storage. A comprehensive digital twin (DT) of the pilot ammonia synthesis plant is currently under development, combining rigorous first-principles simulations with surrogate modelling techniques. This simulation setup allows the analysis of the process dynamic behaviour. The dashboard visualizes this predictive simulation data, enabling users to explore system behaviour and evaluate operating scenarios without requiring direct interaction with the underlying models or the rules controlling the plant operation.
Previous studies have applied dynamic modelling approaches to investigate the temporal behaviour of ammonia synthesis and related processes. These studies indicates that temperature and pressure can vary significantly during operation, making their accurate representation important for performance evaluation [37,38]. The simulation results can support the development of more robust operational strategies and provide a reference for reactor performance assessment.
To evaluate performance under various conditions, three reactor configurations were simulated: a single tube reactor, two reactors in parallel, and two reactors in series. Dynamic simulation is commonly employed to compare reactor designs in terms of flexibility, operational stability, and overall performance and several studies illustrate this approach. Rosbo et al. [39] developed dynamic models for various reactors in power-to-ammonia processes, examining stability and efficiency under different scenarios. Similarly, Khademi & Sabbaghi [40] compared reactor configurations with different cooling designs, focusing on conversion and transient behaviour under the same operating conditions. Based on these studies, the present work uses dynamic simulation results to compare different reactor configurations and assess process flexibility.
The simulation results are visualized in a Python-based dashboard developed in this study, which enables real-time monitoring of key process variables such as inlet and outlet pressures, temperature distribution along the reactor, ammonia production rate, and the operation recipe which reflects different stages of the process.
The dashboard is based on the Python programming language and the Dash framework, which enables the creation of interactive web-based graphical user interfaces (GUIs). It displays simulation data from the DT, which is loaded in table format and includes time-dependent variables such as temperatures at different points of the reactor, valve states, inlet and outlet pressures, and mass flow rate. The integration of simulation outputs with interactive visualization tools follows recent approaches in DT frameworks for chemical and process systems. Dashboards are often used to support real-time monitoring, interpret system behaviour, and assist decision-making. Pluth et al. [41] presented a systematic visualization methodology that uses a GUI dashboard to display real-time alerts and monitor information in DT applications. Similarly, Yin et al. [42] demonstrated a visual monitoring system architecture for DT workshops, enabling the real-time visualization of manufacturing process status.
Different scenarios can be selected by the user by using a dropdown menu. Moreover, control buttons allow one to start, pause, and adjust the speed of the simulation timesteps. Such interactive features have been identified as key for enhancing operator comprehension of transient system behaviour in DT environments [43]. The dashboard also includes gauge indicators for pressure and outflow flow rate, which are updated dynamically and use colour codes to reflect value ranges, consistent with best practices in interactive DT visualization [41]. In addition, the current values of time, temperature and valve status are displayed, while the visual content is completed by a dynamic scalable vector graphic (SVG) showing the charging/discharging of the reactor and animations illustrating the direction of flow.
The current version of the dashboard is a starting point for a more advanced form, and its architecture is designed to easily add new scenarios, information and data sources. In addition to the current dashboard, a future version is under development to interface directly with the demonstrator of the HySTrAm project. Future improvements will include optimization of operation, the shortening of production times, the boosting of productivity, and the ability to predict the catalyst lifespan. Moreover, a dedicated database will be developed to store the simulation and experimental data, enabling efficient retrieval and visualization of key process parameters, and at the same time supporting real-time monitoring, performance evaluation, and future optimization tasks. While the simulations were accomplished by project partners, the authors of this paper were responsible for the dashboard’s design, development, and integration.
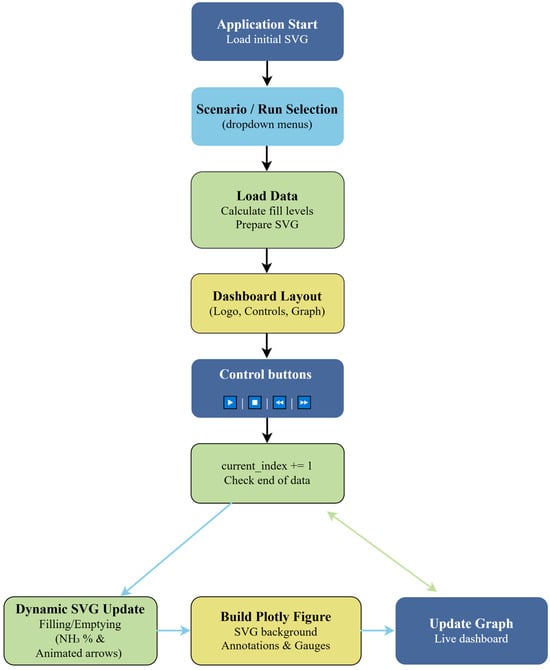
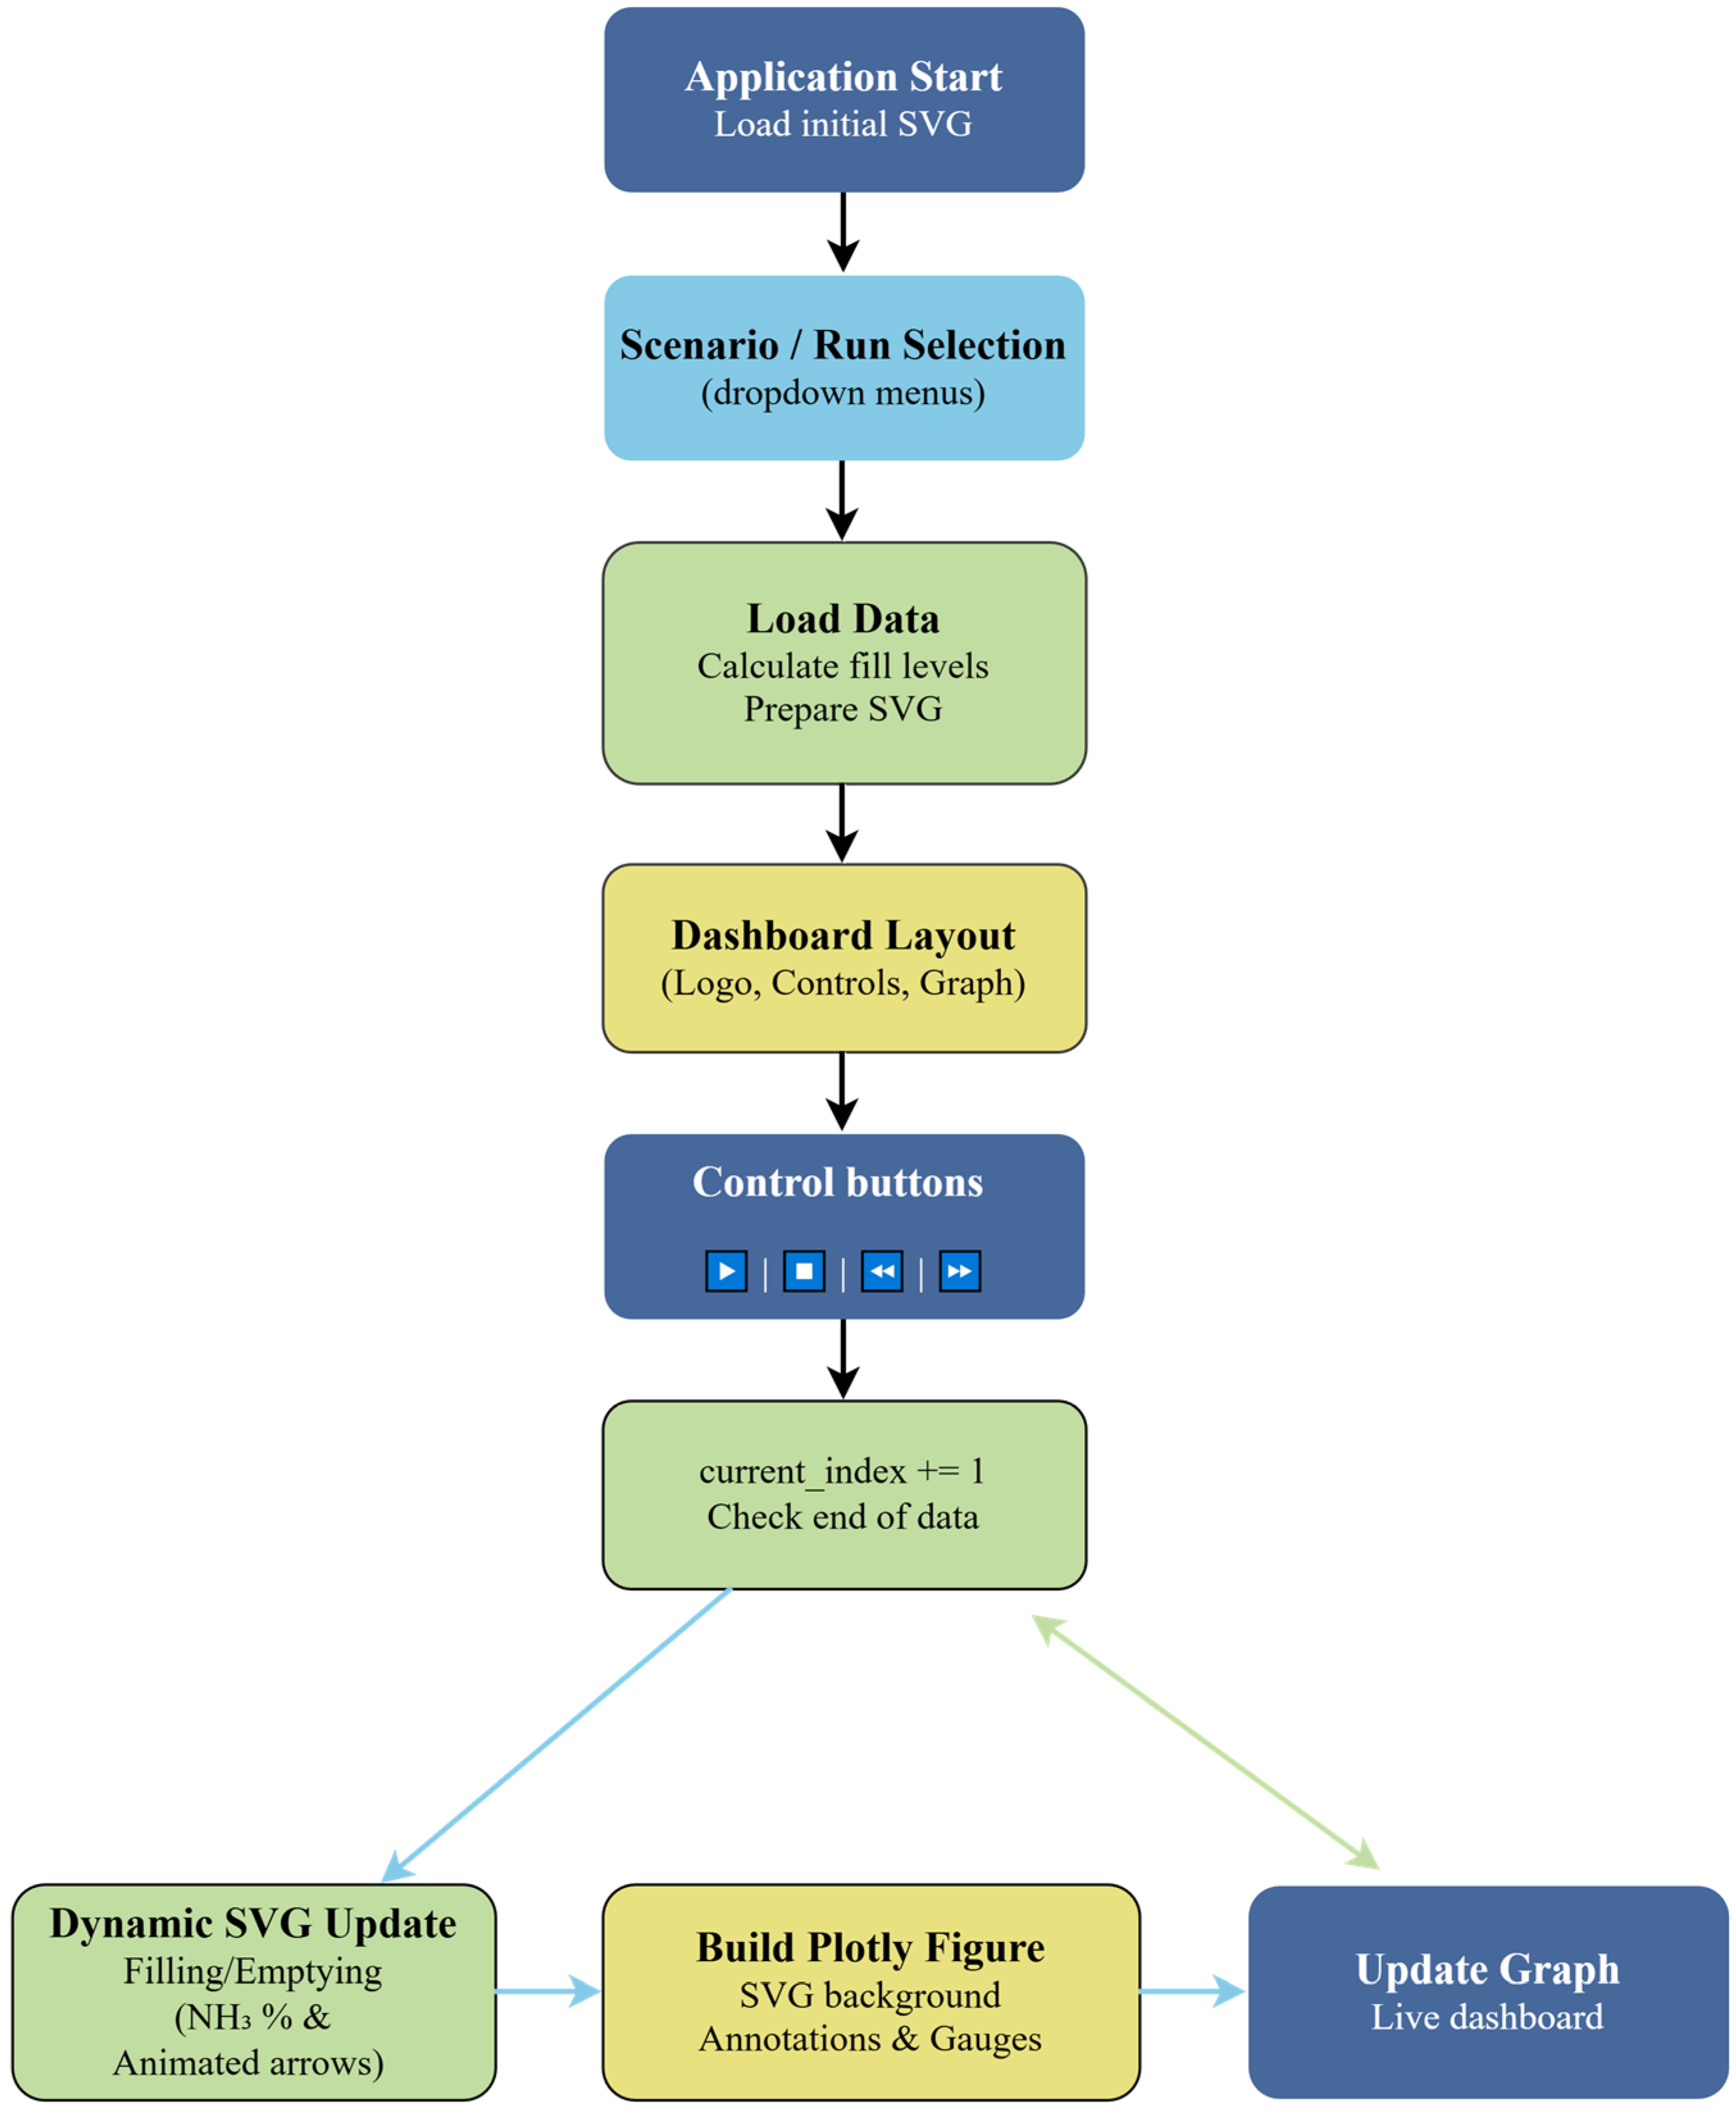
The overall workflow of the HySTrAm dashboard is shown in Figure 3. It describes the main steps of the application, from scenario selection and data preparation to dashboard layout construction, control operation, and real-time updates of the dynamic visualization. The workflow highlights key processes such as fill-level calculation, control button interaction, and continuous updating of the SVG-based visualization during simulation runtime.
Figure 3.
Flowchart of the HySTrAm dashboard.
Process simulations are performed by the Process Dynamics and Operations Group of Technische Universität Berlin, which provides numerical results, including temperatures, pressures, mass flow rates, and additional process variables as a function of time. These simulation results are imported into the HySTrAm dashboard as structured data files, in CSV format. Once a simulation has been selected, the dashboard performs a number of simple but essential computational operations in a local interactive environment (localhost-based application), without requiring significant computational resources. Initially, the input data are preprocessed, sorted, and ordered chronologically. By using the ammonia concentration at each time step and its maximum concentration, the dashboard dynamically calculates the reactor filling level at the current time step. To achieve smooth and continuous visualization, the dashboard decouples the visualization refresh rate from the original simulation time resolution. Although simulation outputs are available at discrete time steps (every 10 s), the animation engine ensures visually smooth transitions when the user accelerates or decelerates the playback speed. Simulation values are updated strictly at their original time steps, while graphical elements are rendered continuously to avoid sudden visual changes during interactive playback control.
4. Evolution of the Dashboard
The digital twin dashboard was developed gradually, and each version presents specific use cases. Each version added features such as enhanced visualization, real-time monitoring, and scenario-based analysis, following principles of iterative dashboard design widely adopted in healthcare and industrial systems [44,45]. As the reactor configurations became more and more complex, this approach was necessary for a deeper understanding of the system’s dynamic behaviour. Each version was designed to show specific simulation scenarios, while progressively improving visualization clarity, user interaction, and computational efficiency. The development of the dashboard was based on three main criteria: (i) scalability in relation to reactor configuration, (ii) clarity of process visualization, and (iii) sufficient robustness for real-time analysis.
4.1. Dashboard Version 0.1
The initial version (v0.1) included the analysis of a single-tube ammonia synthesis reactor. It provided basic monitoring of key process variables, such as simulation time, inlet pressure, axial temperature distribution along the reactor, ammonia outlet flow rate, and valves status. Users could interact with the dashboard via control buttons to start, pause, or adjust the time-step rate. This version established the basic layout and functionality required to integrate the results of dynamic simulation with real-time visualization, although interaction options were limited at this stage.
4.2. Dashboard Version 0.2
In addition to the variables available in version v0.1, outlet pressure was added in version v0.2 to enable direct evaluation of the pressure drop in the reactor. The layout was also improved by repositioning the simulation time counter for better readability. These improvements allowed for a more comprehensive evaluation of reactor operation, particularly with regard to pressure drop, while maintaining a single reactor configuration.
4.3. Dashboard Version 0.3
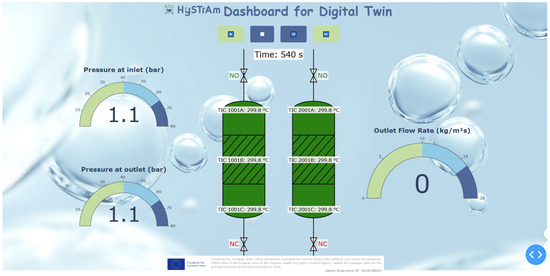
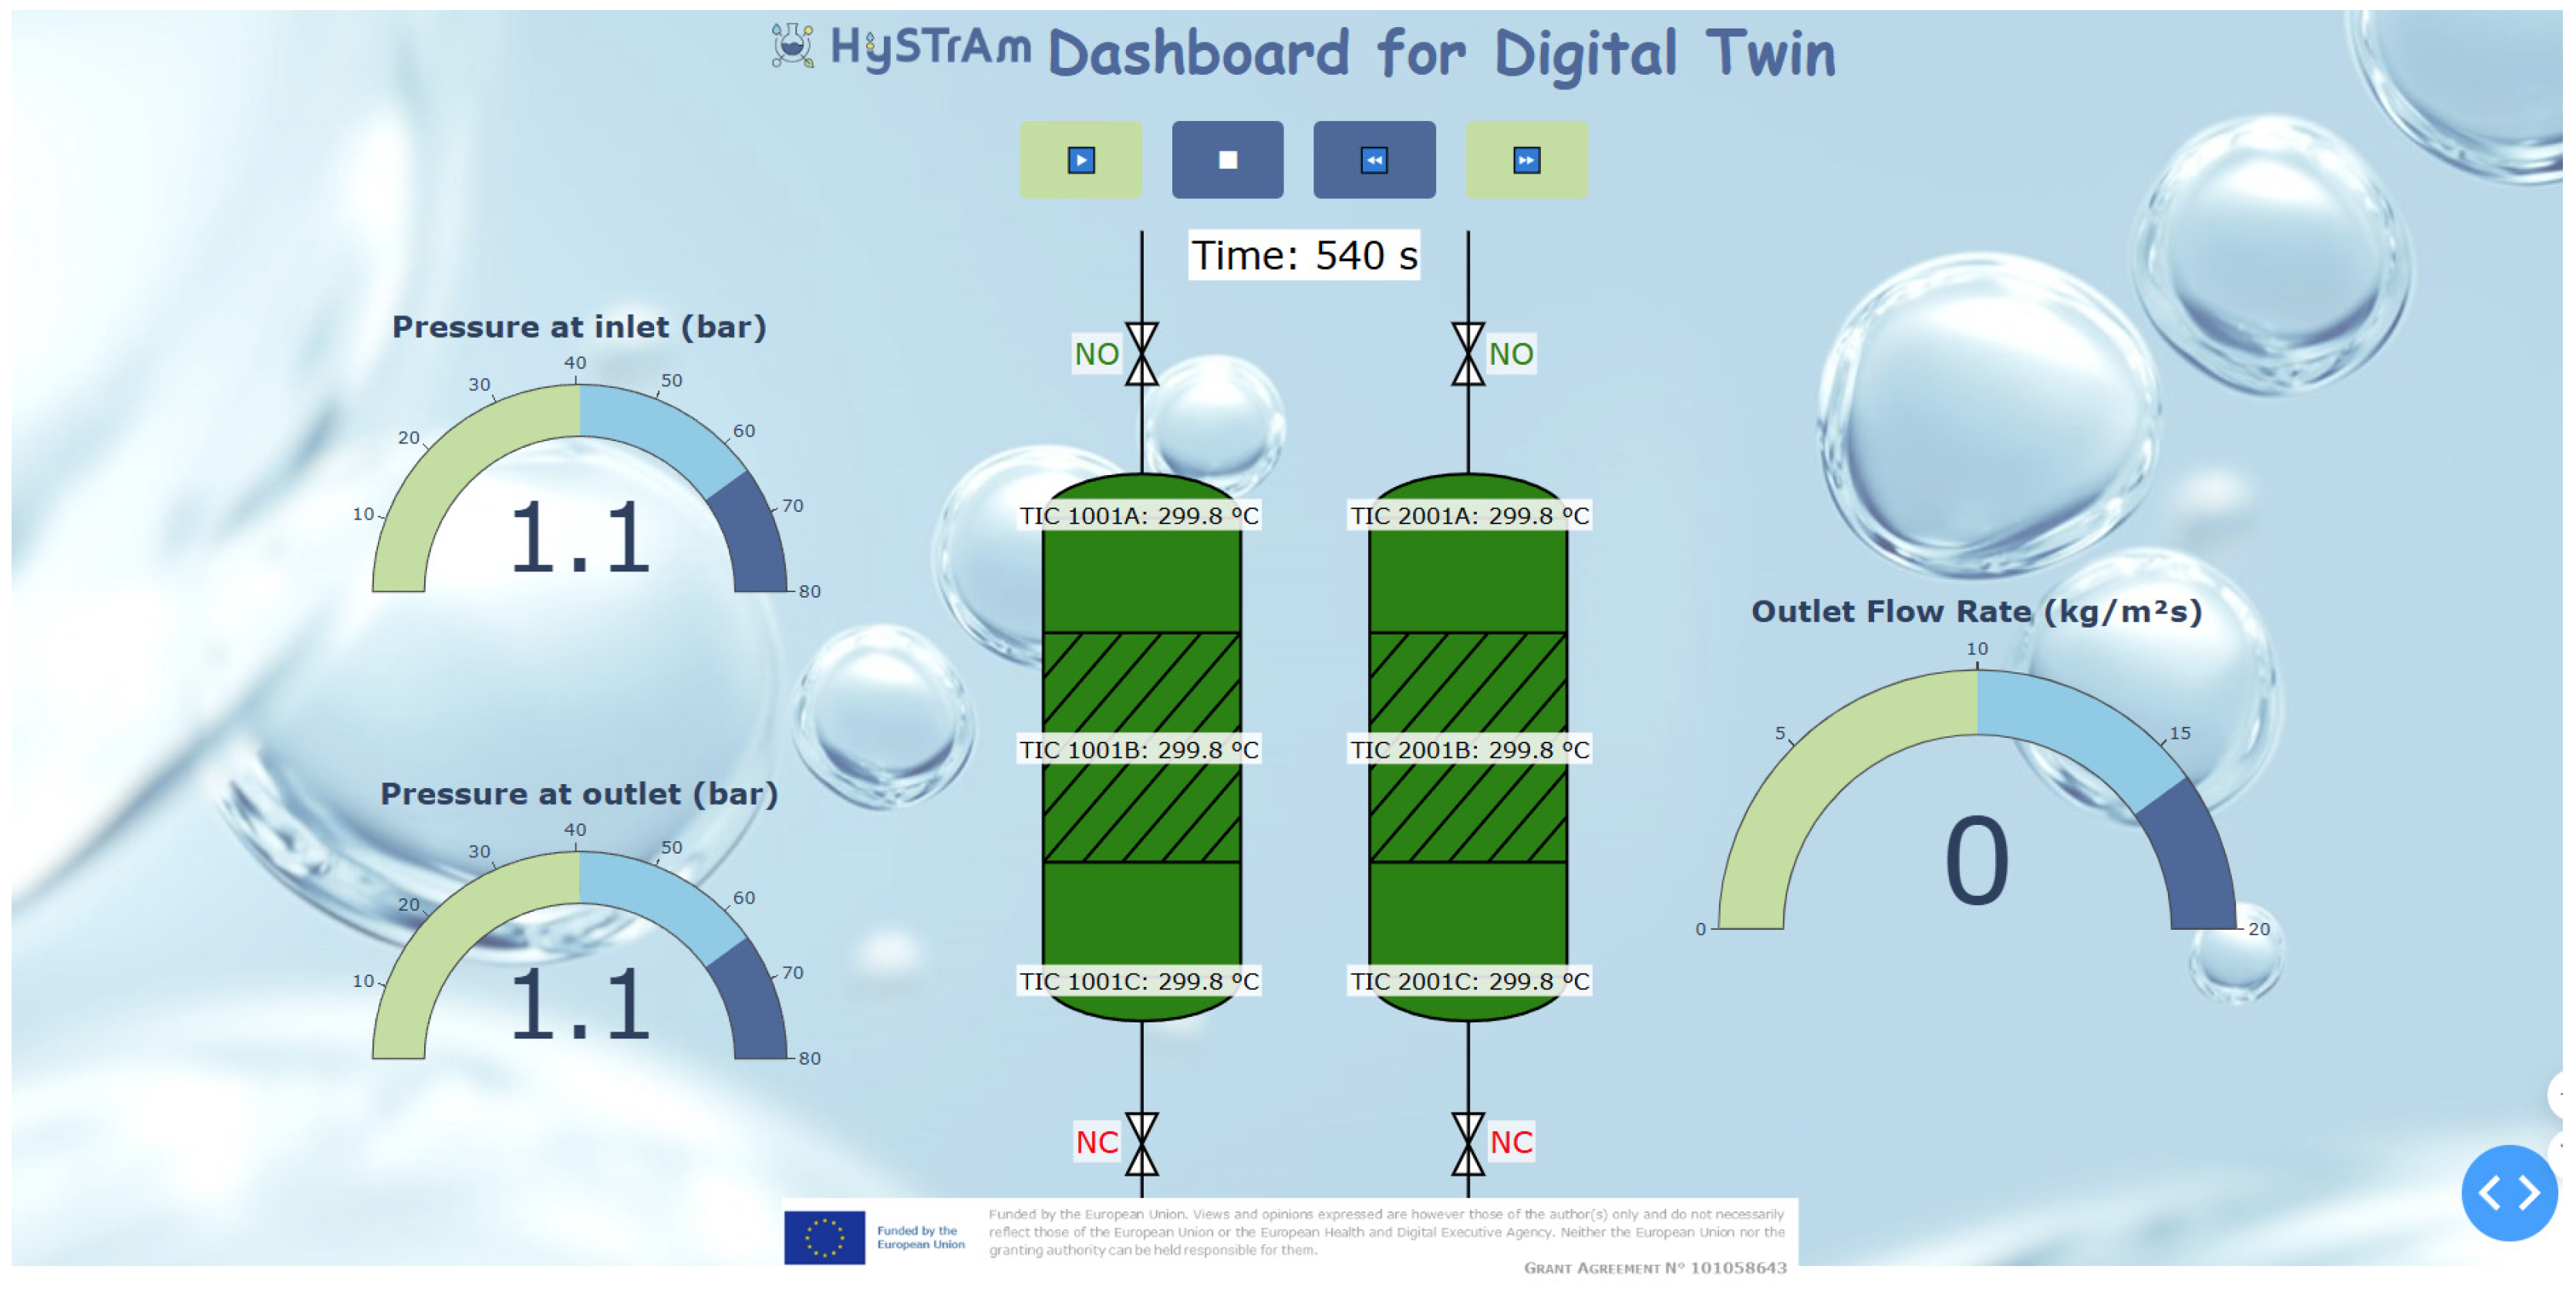
In the third version (v0.3) a second reactor was added, enabling the simultaneous visualization of temperature profiles and valve states for both reactors. This allowed the dashboard to represent scenarios involving reactors operating in series or in parallel swing mode, while preserving the structure and interaction logic of v0.2 (Figure 4).
Figure 4.
Screenshot of the developed dashboard for digital twin version 0.3.
4.4. Dashboard Version 0.4
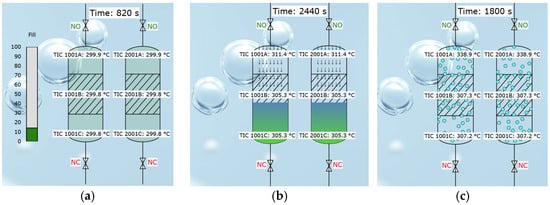
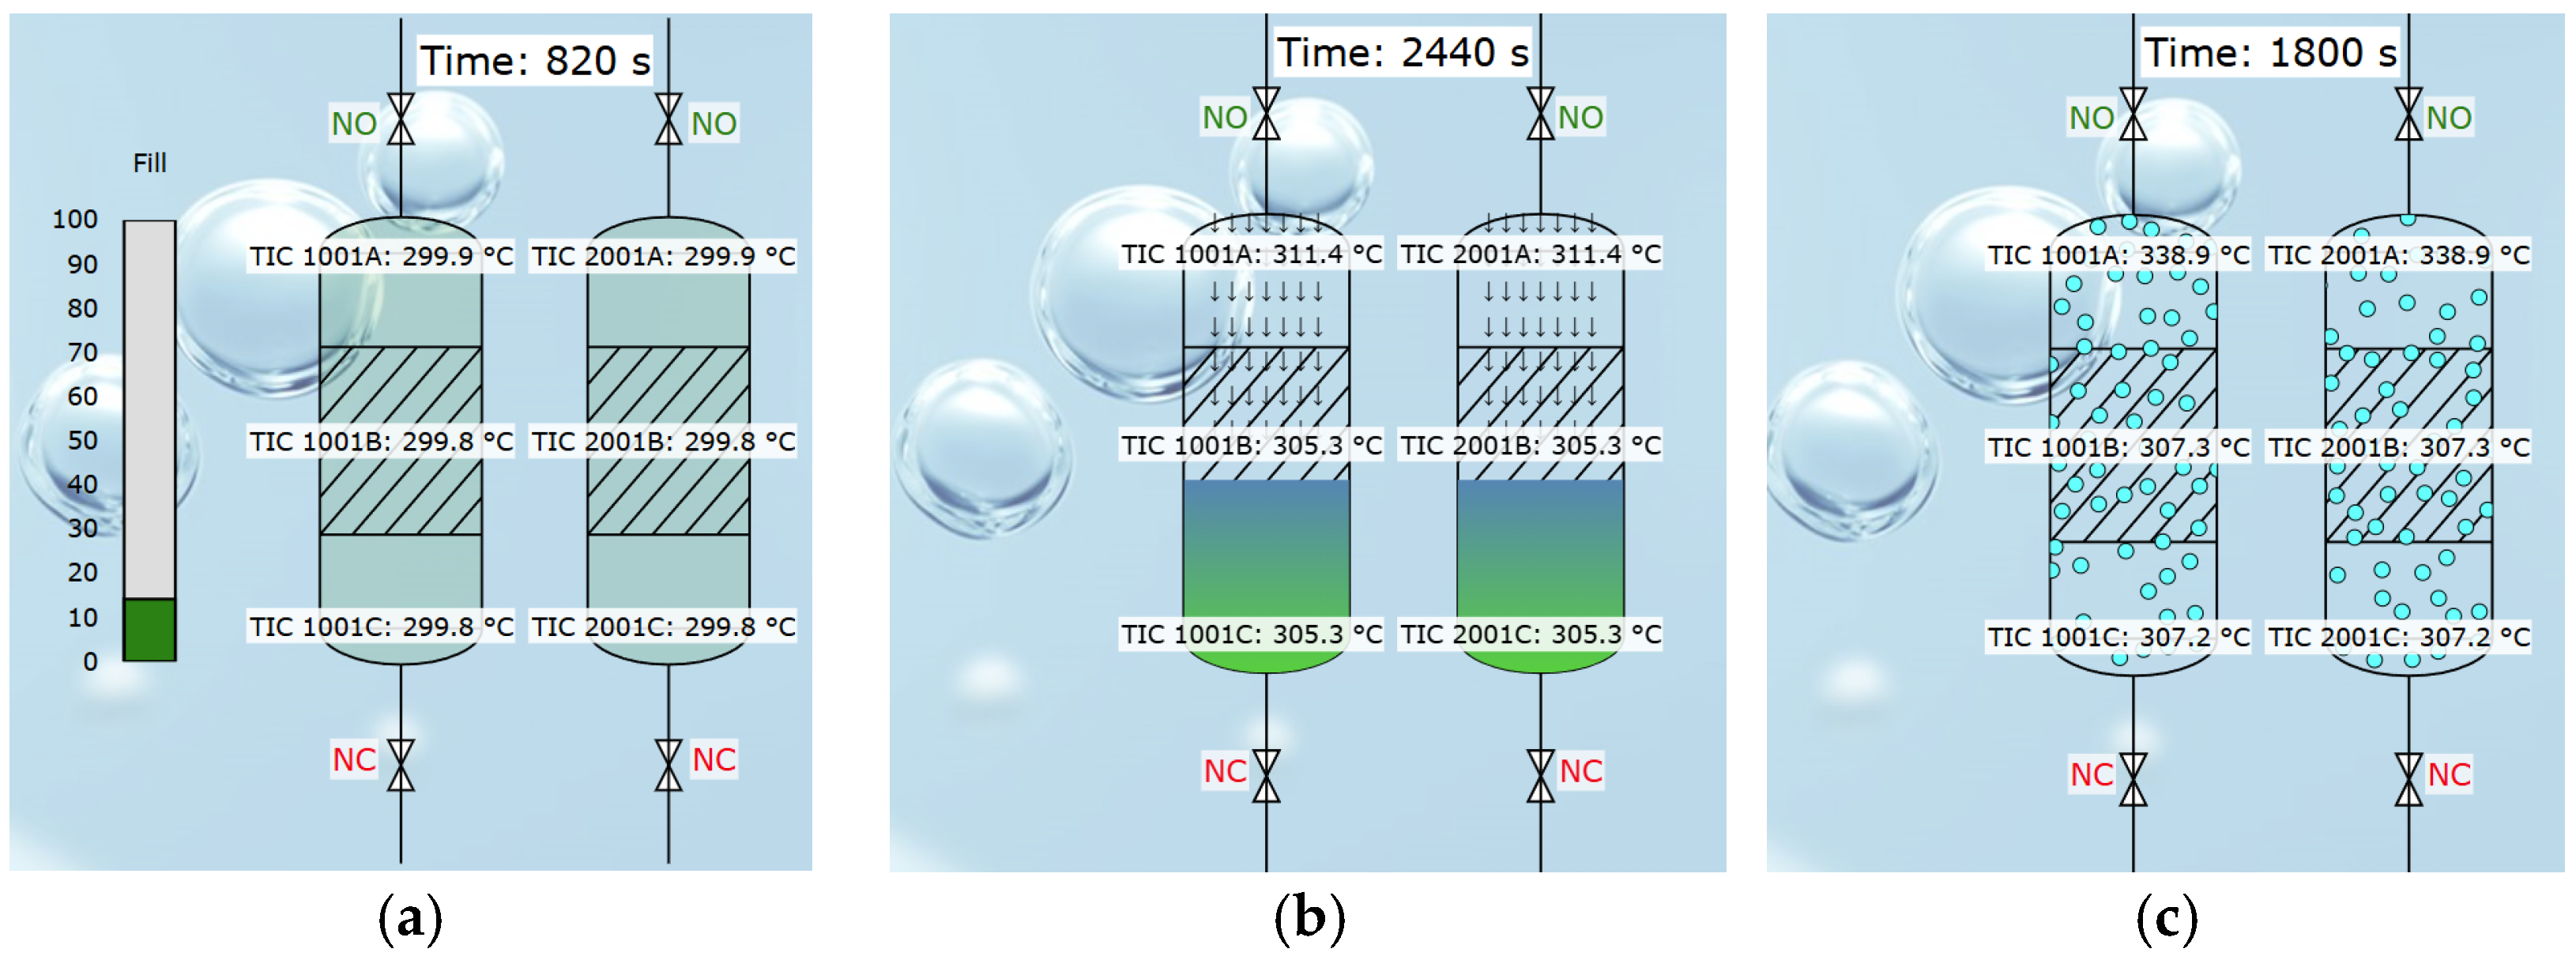
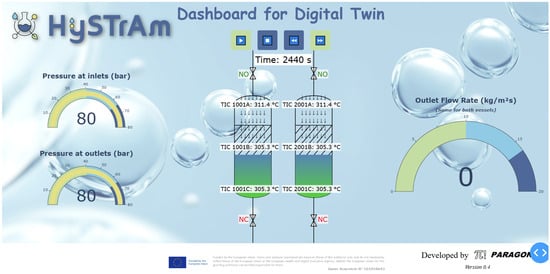
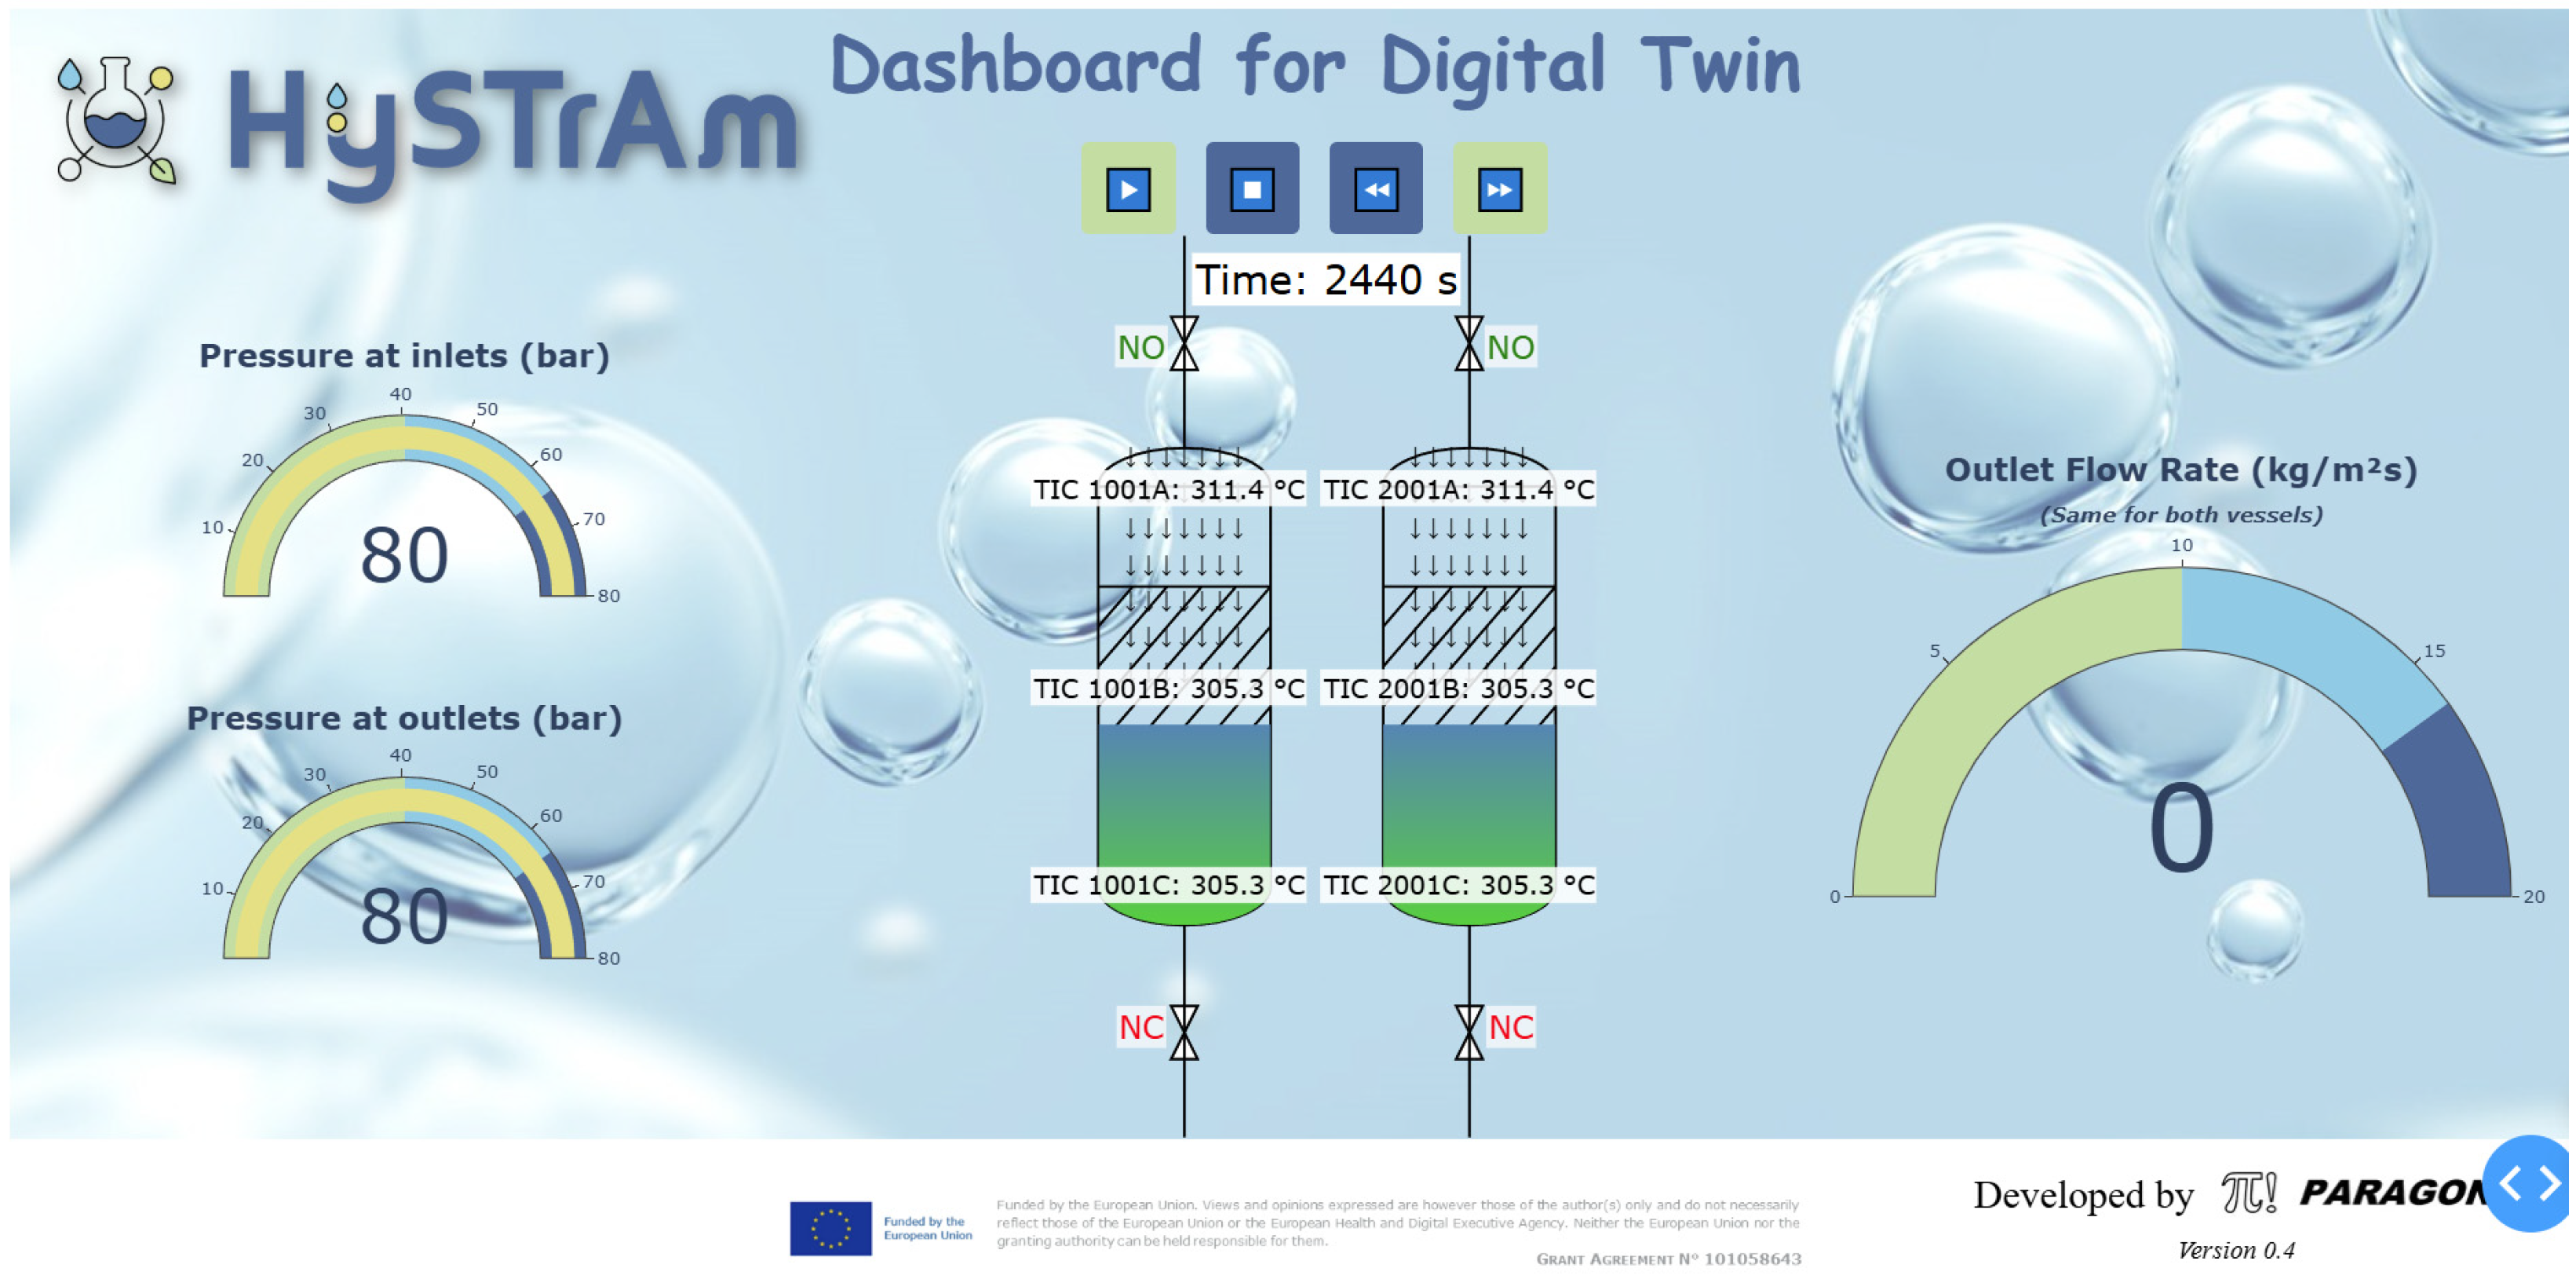
Version 0.4 is focused on improving the visual representation of dynamic reactor operation. Multiple visualization approaches were systematically evaluated to represent reactor filling and emptying during absorption and desorption phases. The chosen representation combined filling/emptying animations with colour coding for NH3, H2, and N2, as well as animated flow indicators. This approach was selected because it clearly conveyed the process states without imposing high computational demands (Figure 5 and Figure 6).
Figure 5.
(a) Gradient filling/emptying and a bar showing percentage; (b) filling/emptying with colours representing NH3, H2, N and animated arrows; and (c) filling/emptying with bubbles.
Figure 6.
Screenshot of the developed dashboard for digital twin version 0.4.
4.5. Dashboard Version 0.5
The final version (v0.5) includes the ability to compare scenarios between one reactor and two reactors operating in parallel swing mode configurations. It includes a structured visualization of the operating recipe, clearly indicating the operating phase (absorption or desorption) at each time step. These improvements allow users to directly evaluate reactor utilization, operating steps, and process dynamics, which was not possible in previous versions.
Through these versions, the dashboard evolved from a basic tool for monitoring a single reactor to a powerful platform that supports multiple reactor scenarios, dynamic process visualization, and scenario-based operational analysis. Each version increased the analytical capabilities and usability of the dashboard, resulting in version v0.5, which allows for the comparison of reactor configurations and provides the basis for future extensions.
The version v0.5 introduced scenario-based analysis functionality, allowing direct comparison between the various configurations of the reactor(s). By explicitly highlighting the active operation recipe at each time step, this version allows for quantitative and qualitative evaluation of the reactor(s).
5. Results
The simulation results shown in Figure 7, Figure 8, Figure 9, Figure 10 and Figure 11 were generated by the HySTrAm project partners and have been previously validated and published [33,34,35,36]. These results provide a reliable basis for the dashboard, supporting the analysis of pressure, temperature, ammonia production rate, and operating recipes for both a single reactor and when two reactors are operating in parallel (swing mode).
Figure 7.
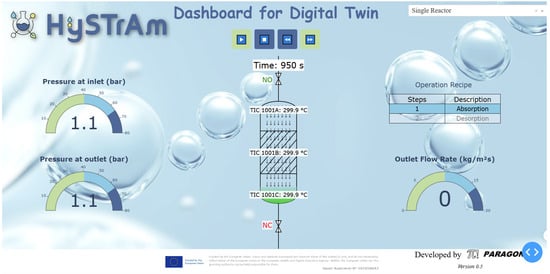
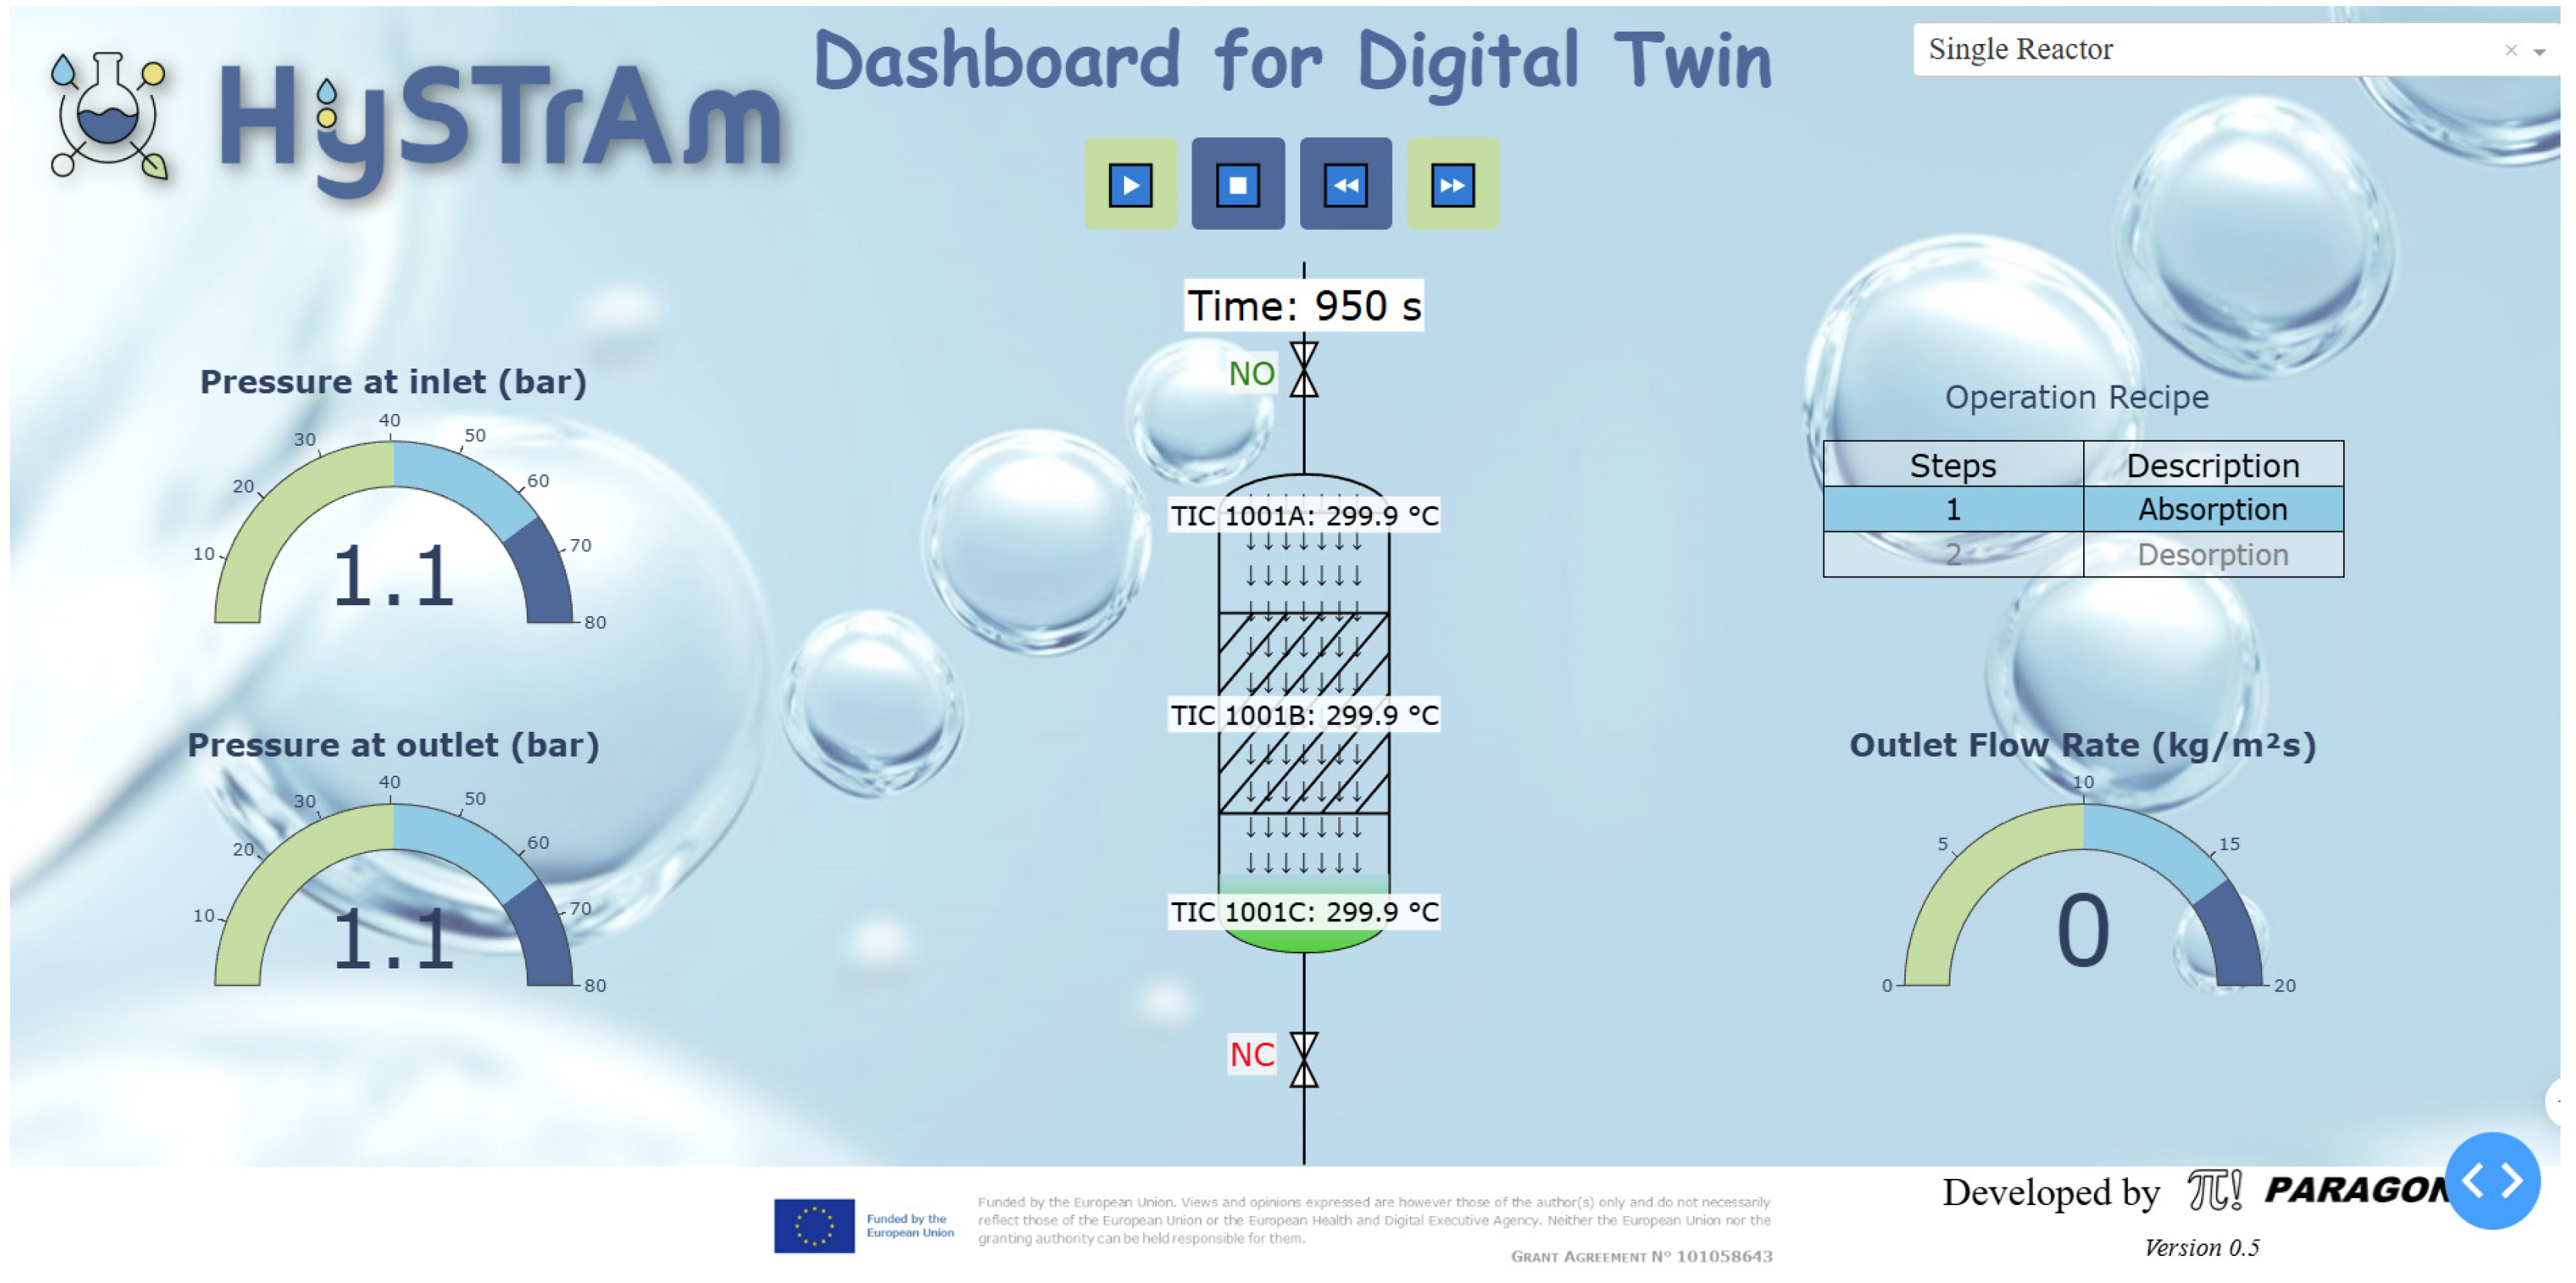
HySTrAm dashboard view of a single reactor at t = 950 s.
Figure 8.
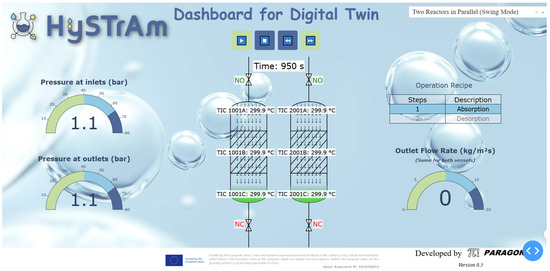
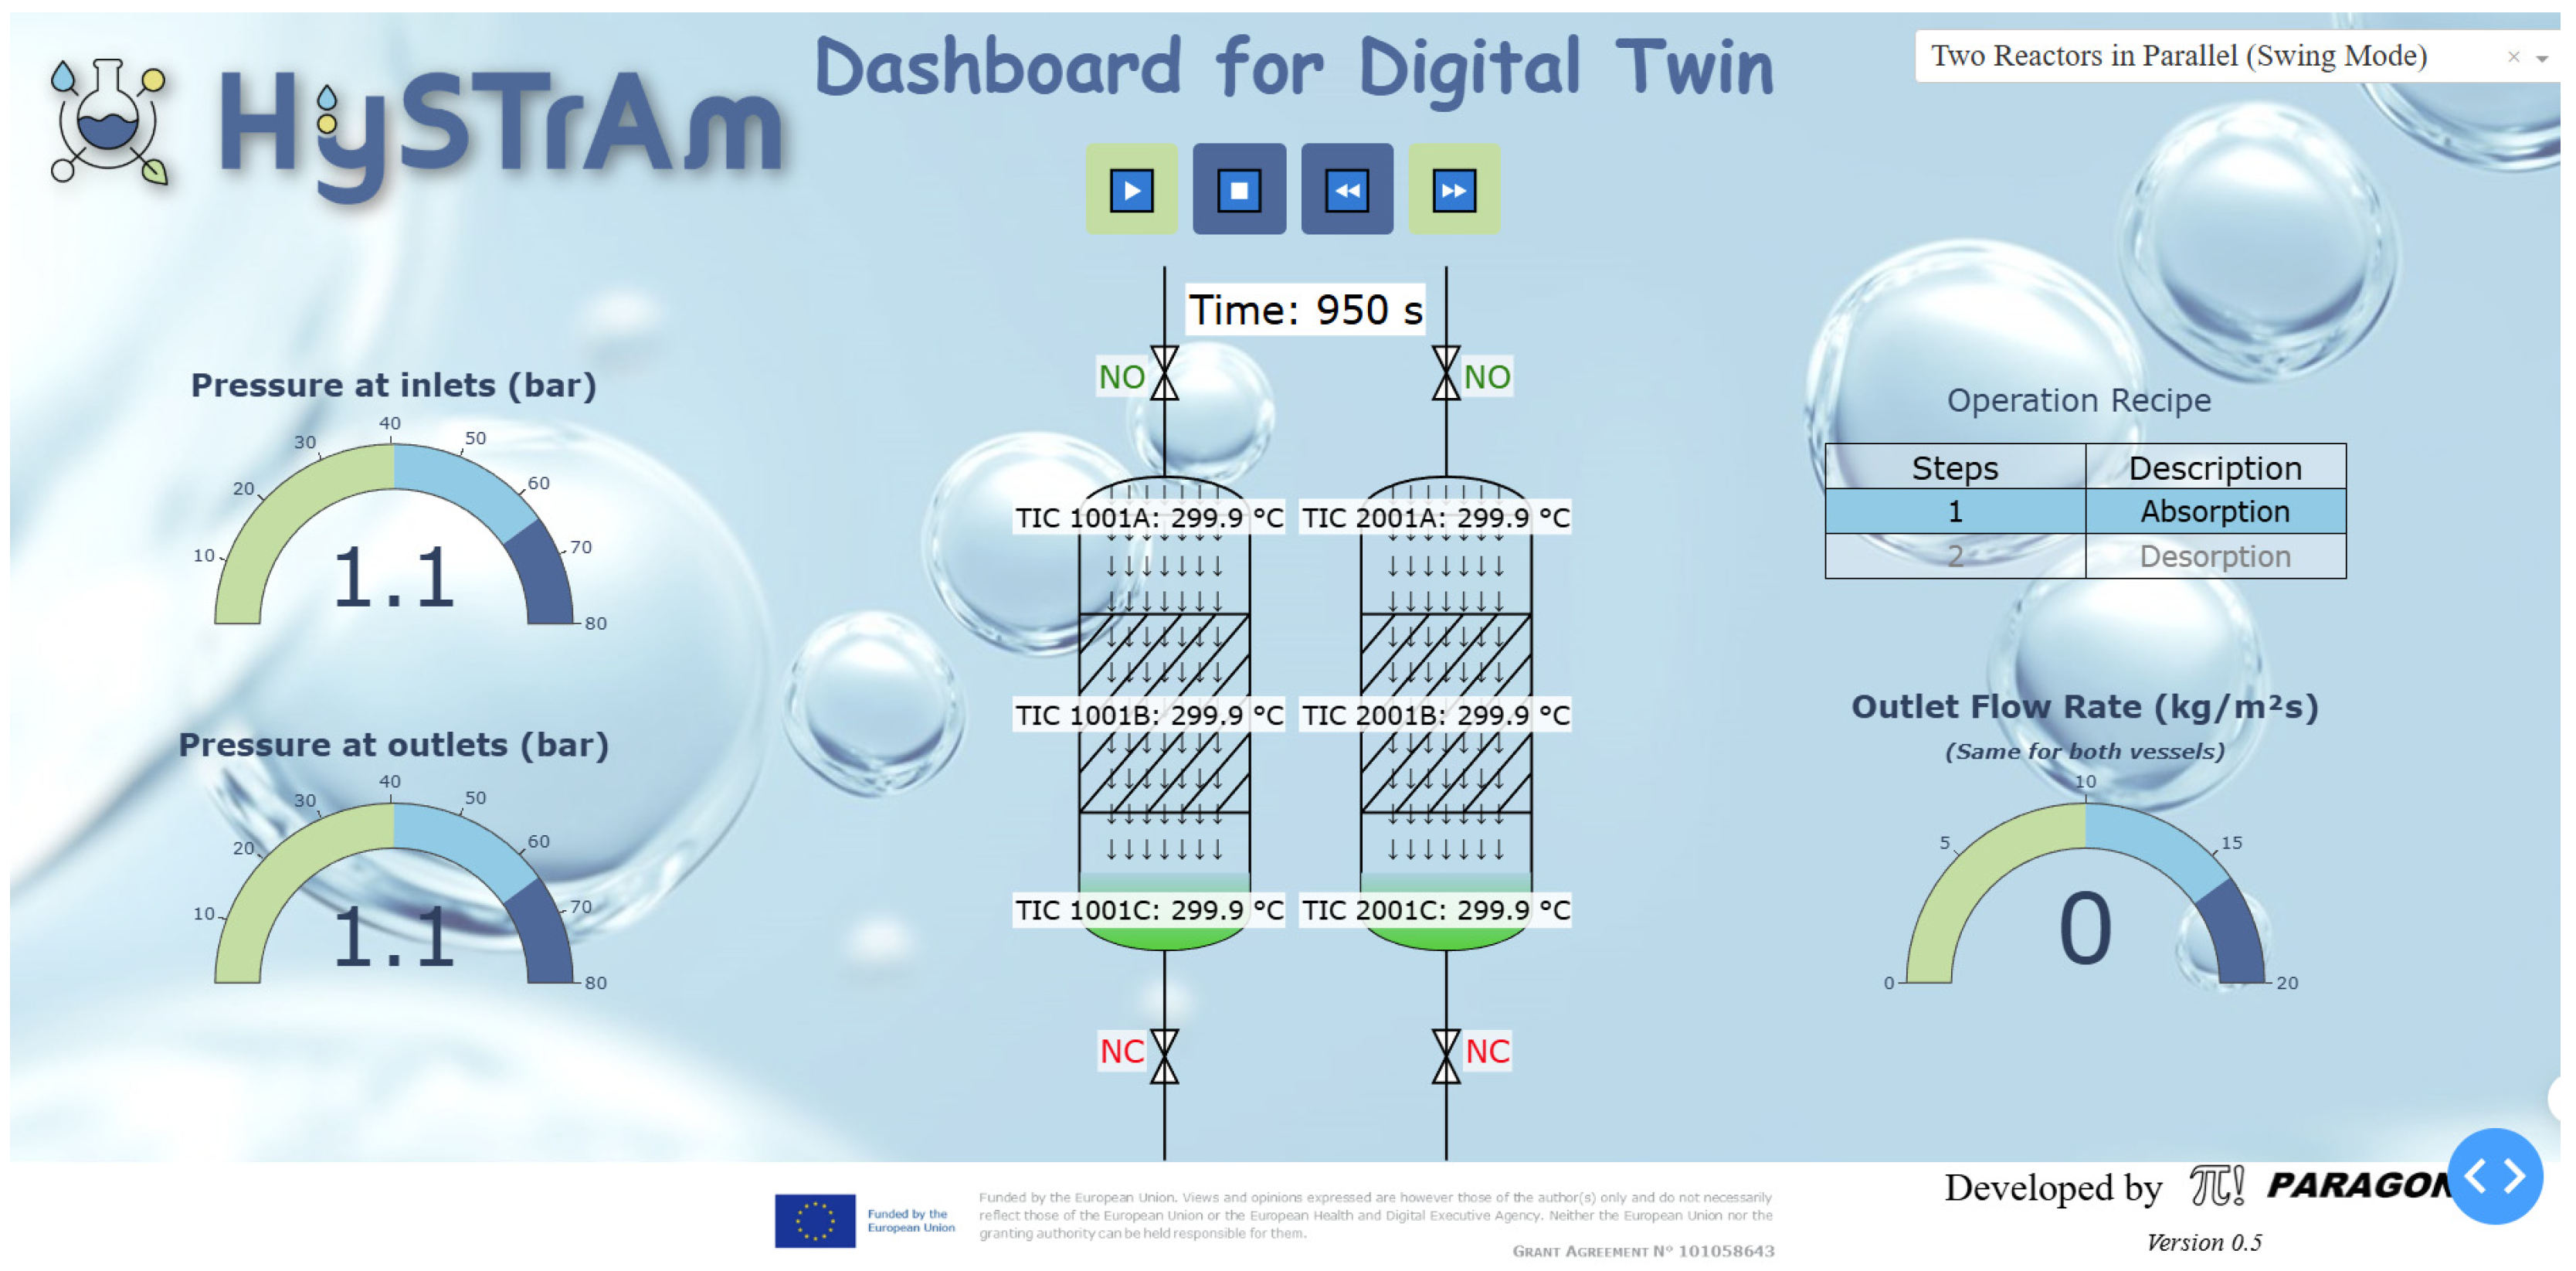
HySTrAm dashboard view of two reactors in parallel (swing mode) at t = 950 s.
Figure 9.
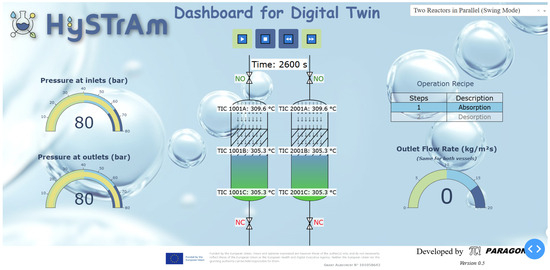
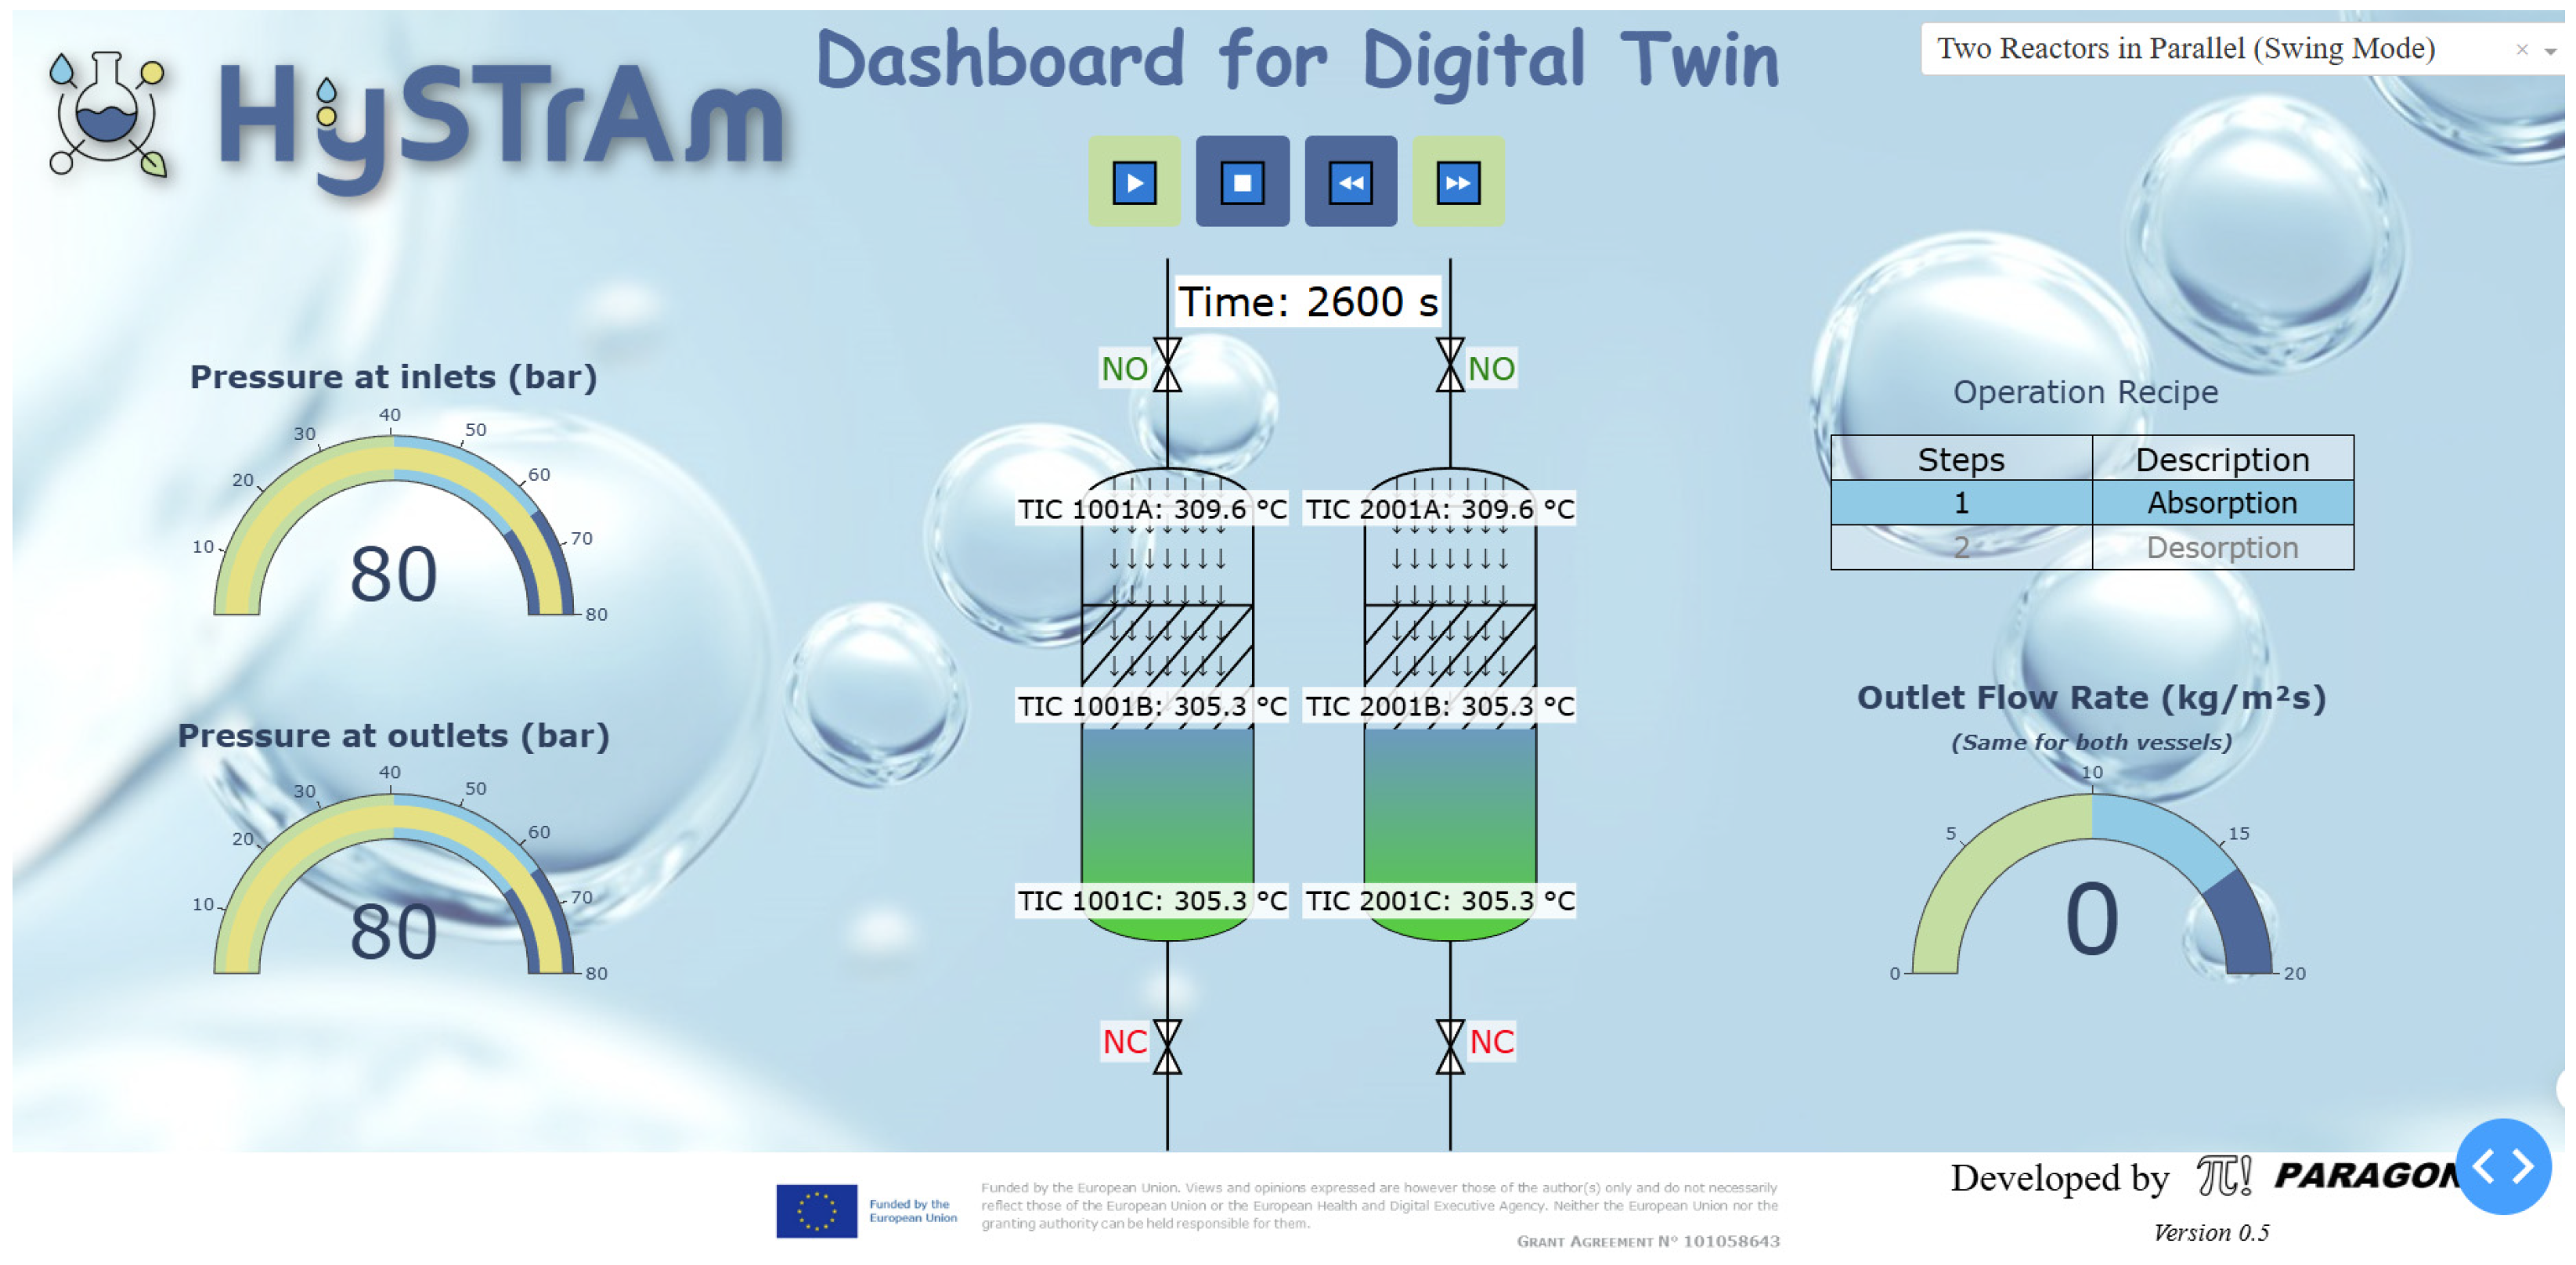
HySTrAm dashboard view of two reactors in parallel (swing mode) at t = 2600 s.
Figure 10.
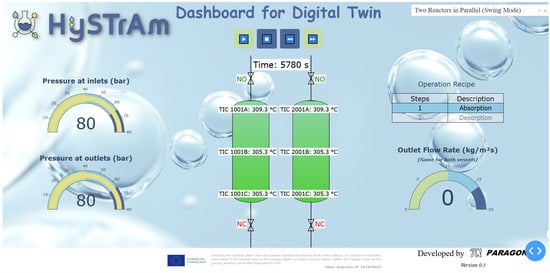
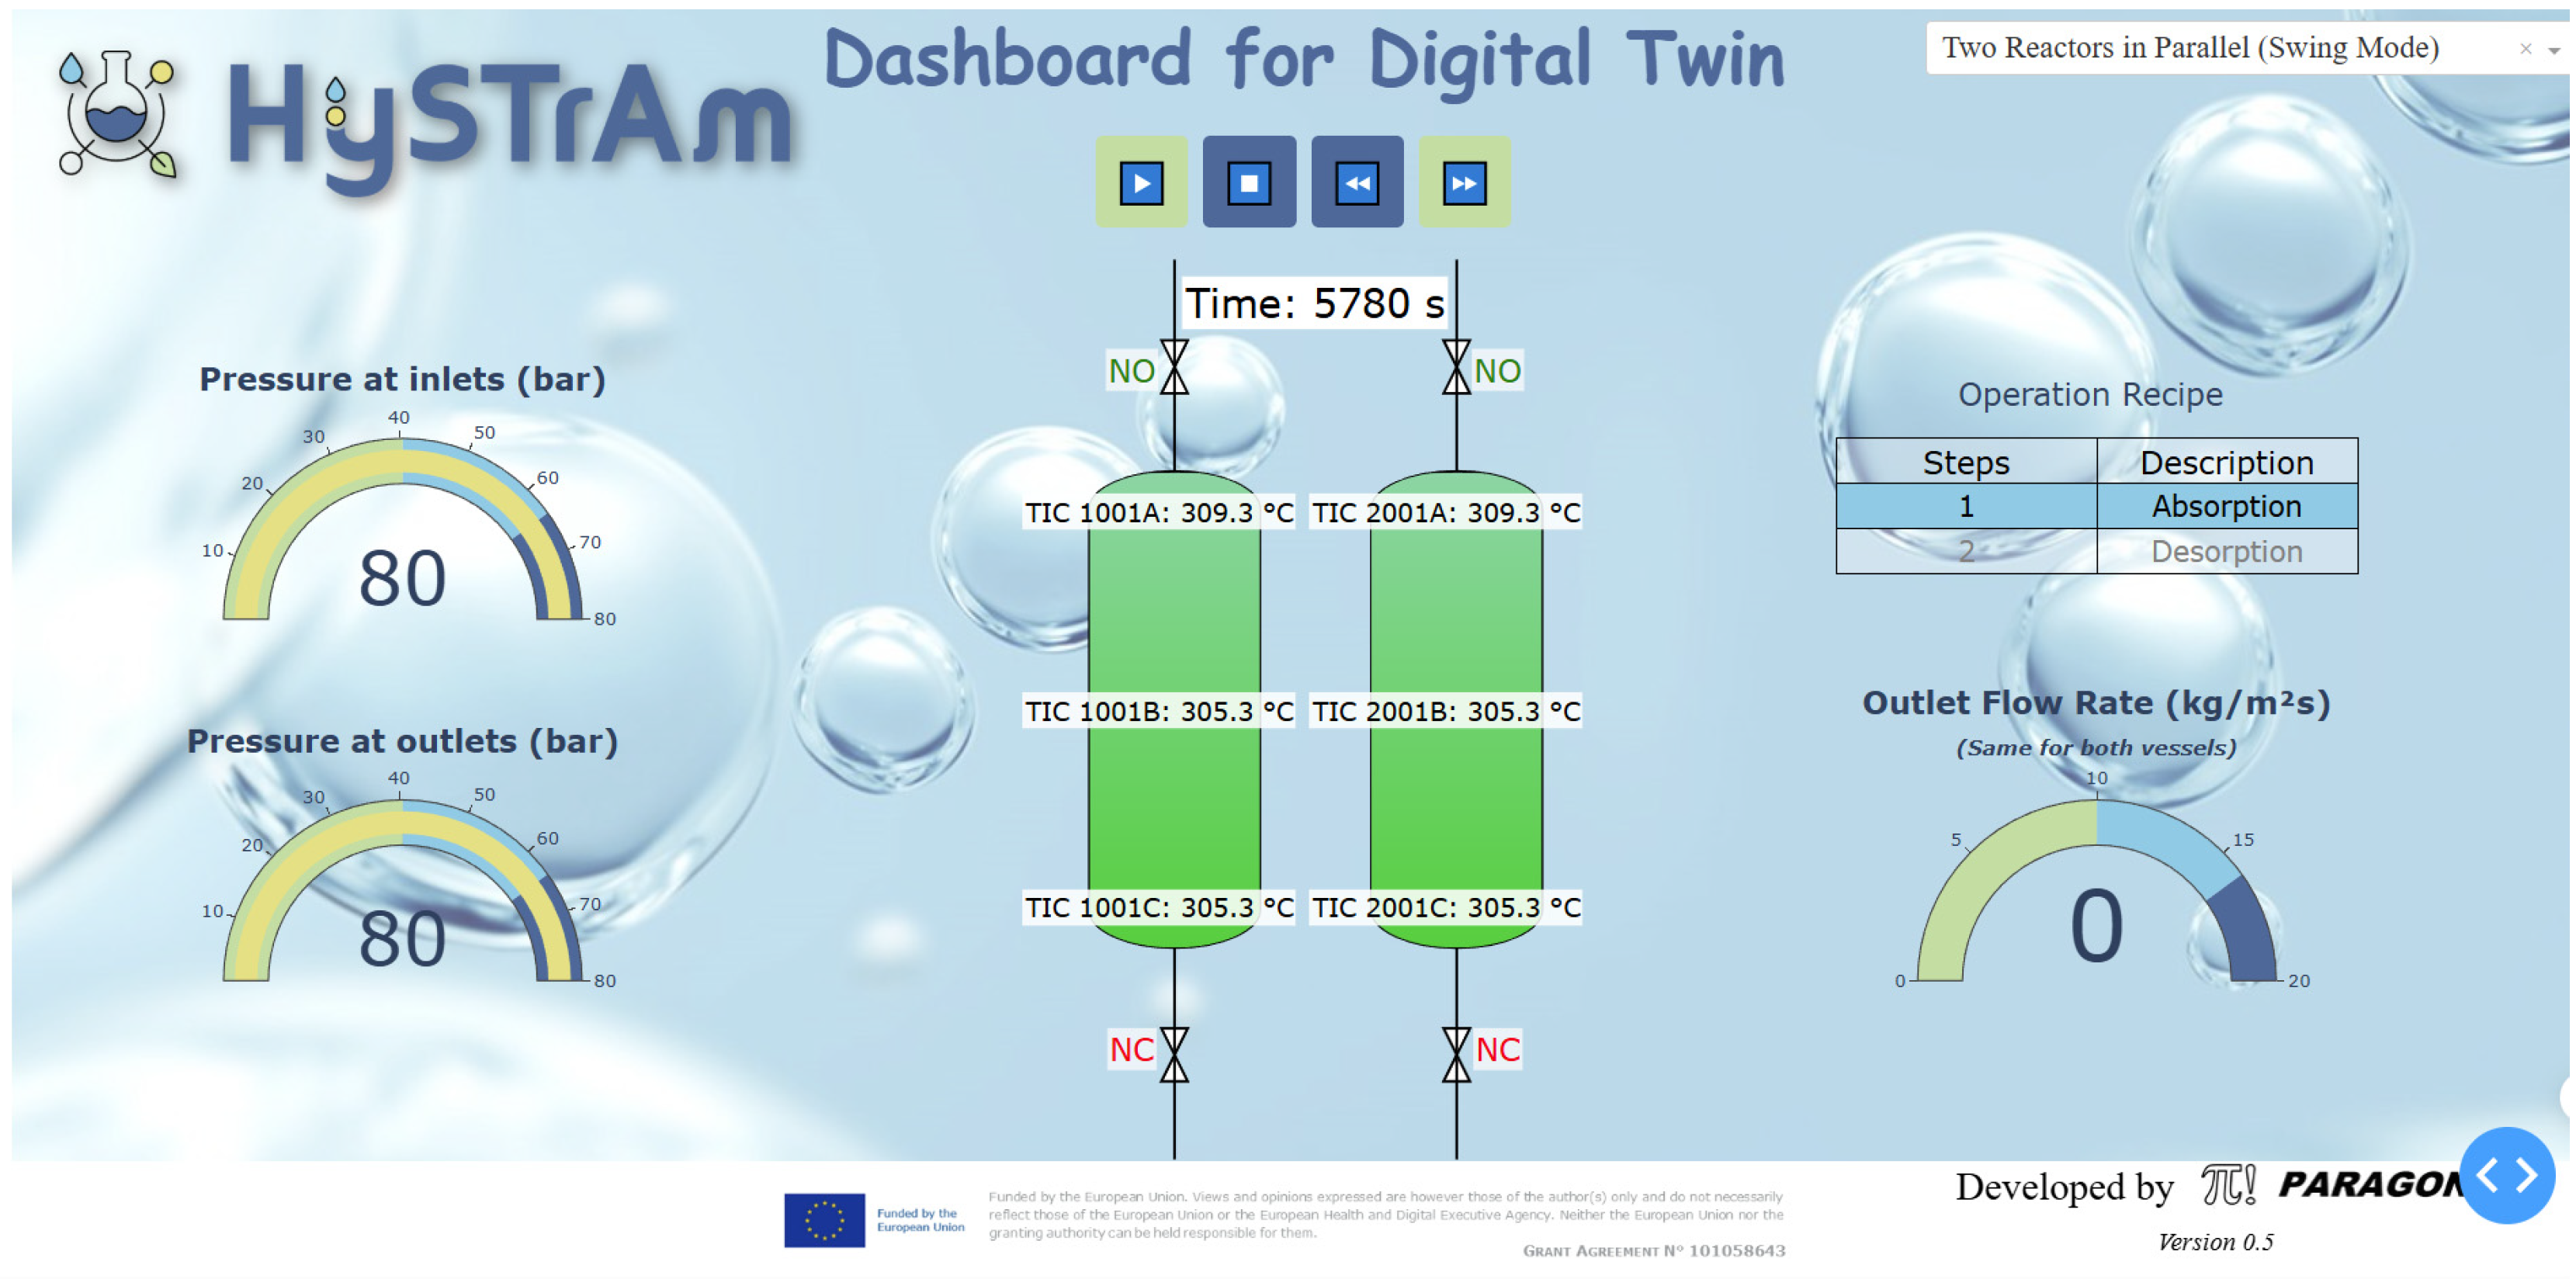
HySTrAm dashboard view of two reactors in parallel (swing mode) at t = 5780 s.
Figure 11.
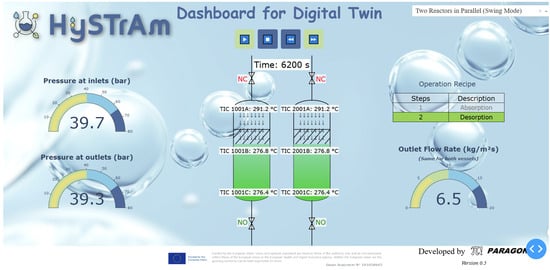
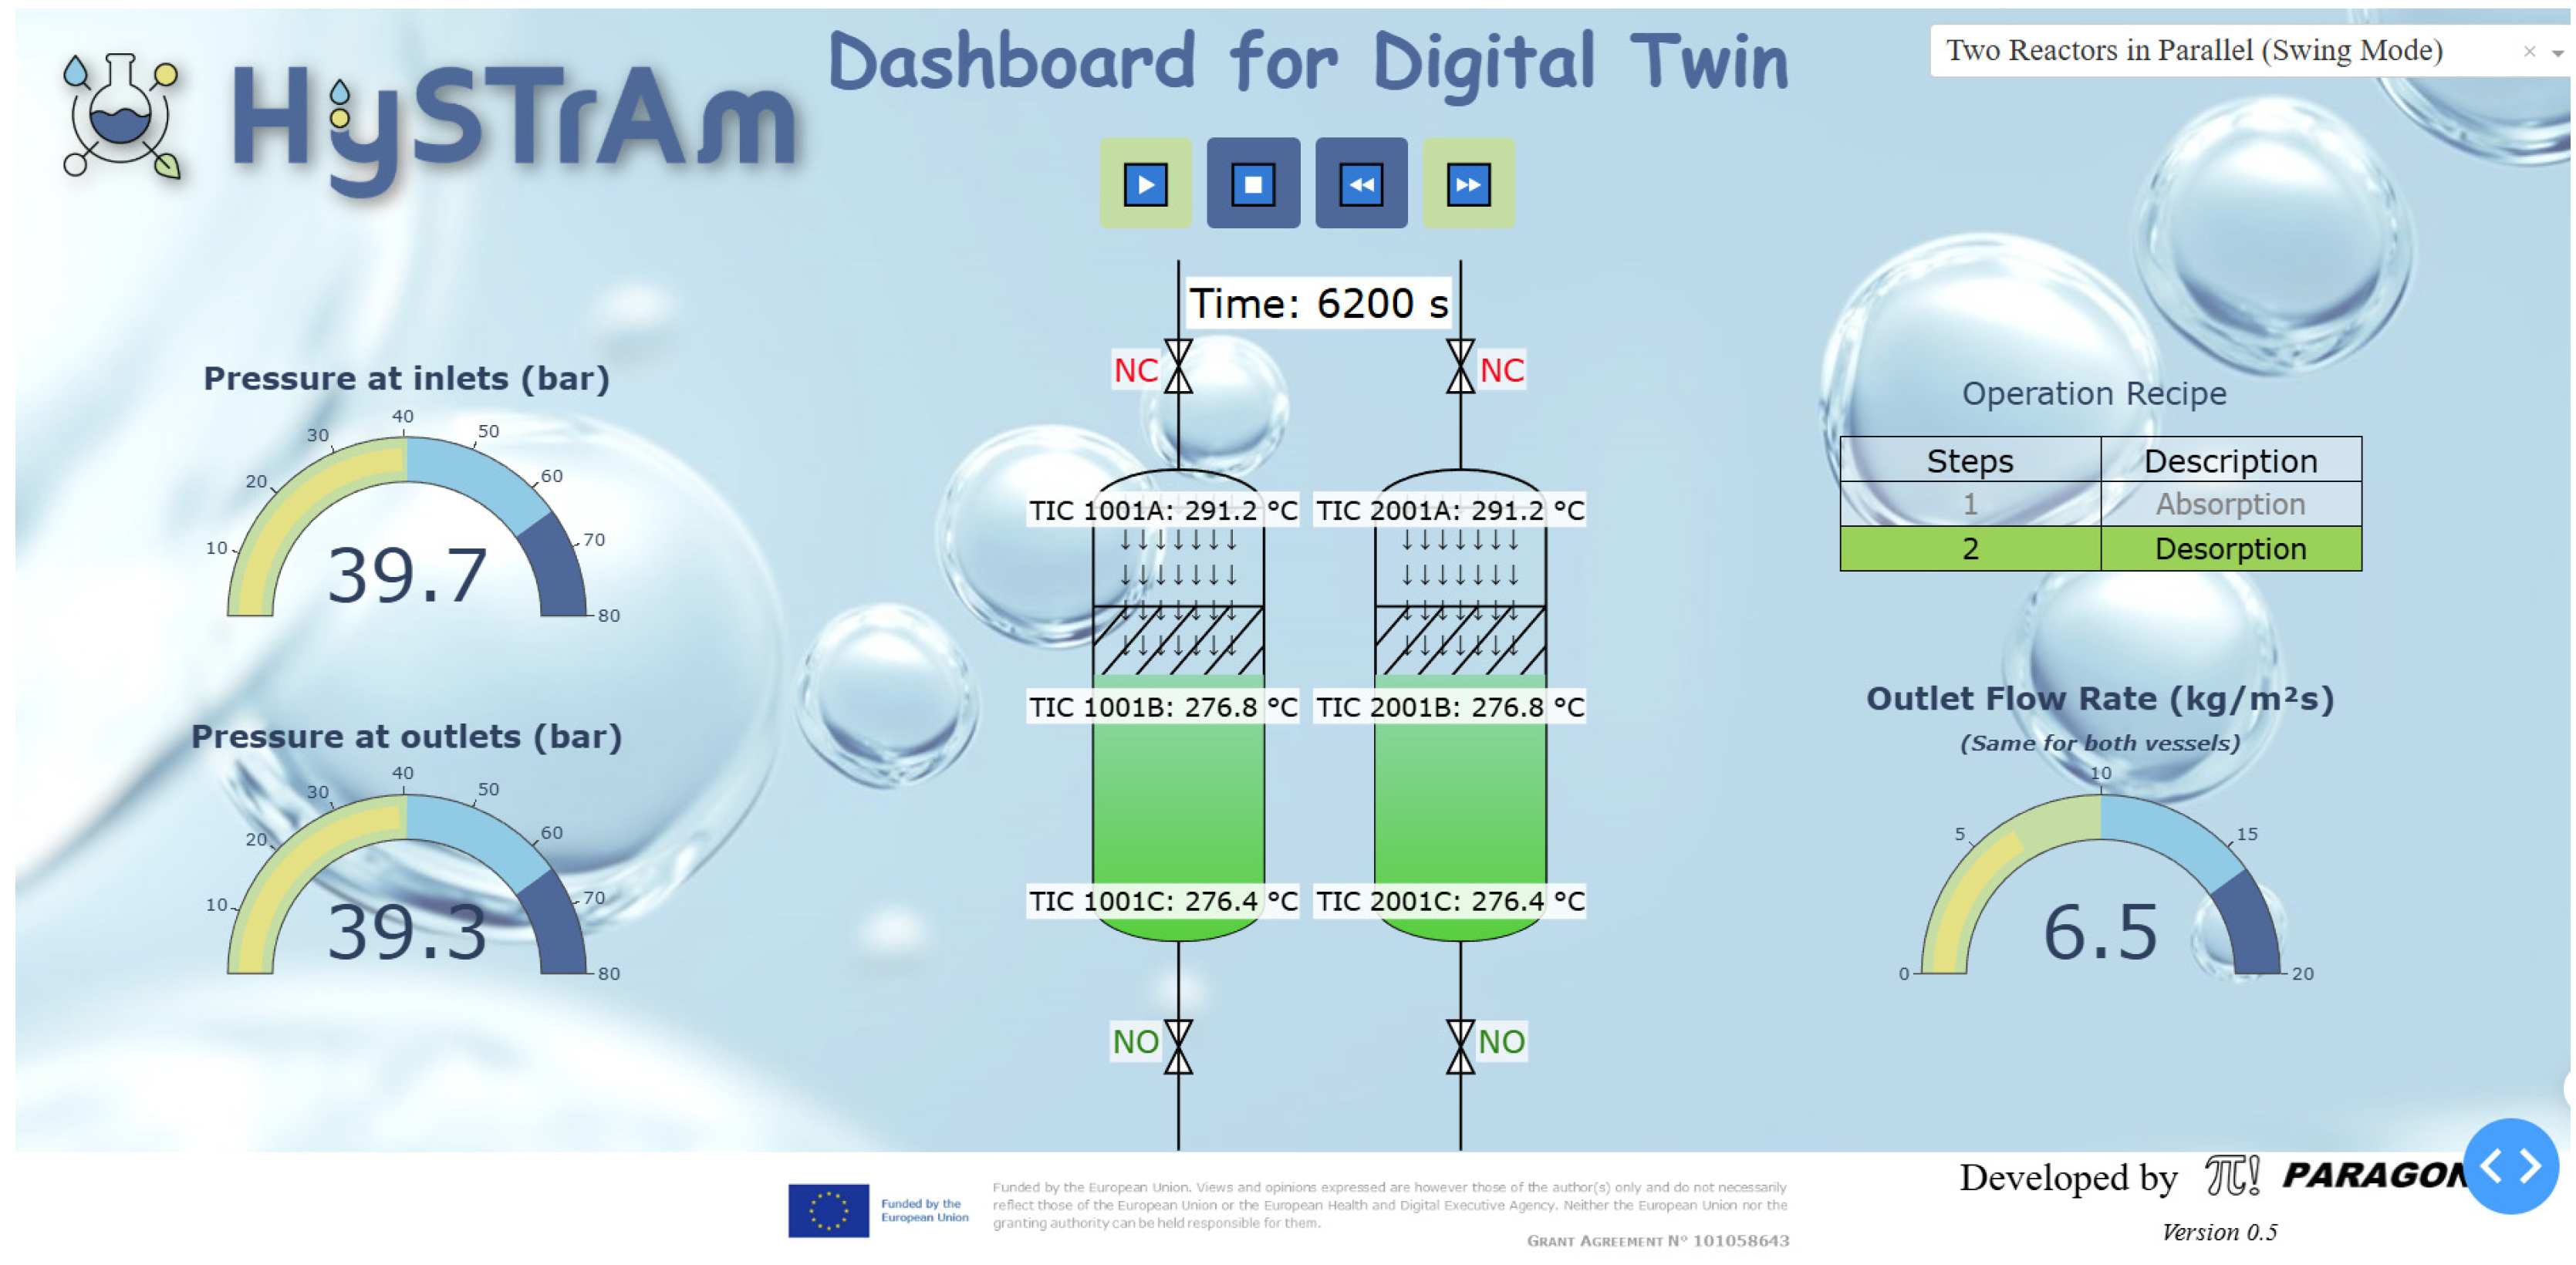
HySTrAm dashboard view of two reactors in parallel (swing mode) at t = 6200 s.
Figure 7, Figure 8, Figure 9, Figure 10 and Figure 11 show the HySTrAm dashboard for the digital twin of the ammonia synthesis (v0.5), focusing on pressure, temperature, outlet flow rate, and operation recipe. These figures are useful for monitoring the dynamic changes in reactors over time, providing an informative representation of the operating conditions. Figure 7 presents the simulation results for the single reactor at 950 s, operating at a low pressure of 1.1 bar at both inlet and outlet. The temperature across the reactor is constant at 299.9 °C. In this operation step, i.e., the absorption phase, the inlet valve is normally open (marked “NO”) while the outlet valve is normally closed (marked “NC”), and no ammonia is produced. The dashboard highlights these states clearly, allowing users to understand the initial conditions before further reactor dynamics occur.
Figure 8 shows the simulation results for the two reactors operating in parallel (swing mode) at the same simulation time (t = 950 s). Both reactors are in the absorption phase, with matching operating conditions between them and with the single reactor operating at low pressure (1.1 bar) and constant temperatures (299.9 °C). Both outlet valves are closed, and the outlet flow rate is zero. The side-by-side display of the reactors allows the reader to observe the synchronization between the two reactors and compare their operating conditions, helping to understand the behaviour of the system in multi-reactor operation.
Figure 9 shows a later moment in the operating procedure at t = 2600 s. Both reactors remain in the absorption phase, with identical operating conditions. The inlet and outlet pressures are equal, reaching a high value of 80 bars. Temperatures in the reactors range from 305.3 °C to 309.6 °C, with higher values on the inlets. Both inlet valves are open, the outlet valves are closed, and the outlet flow rate remains at zero. The dashboard visualizes the increase in pressure and temperature, providing the reader with a clear picture of the absorption process. Figure 10 presents the HySTrAm dashboard for DT at 5780 s. At this moment, both reactors are filled, as indicated by the green colour, reflecting the production of ammonia. Inlet and outlet pressures are stable at 80 bar, and temperatures range from 305.3 °C to 309.3 °C, and the outlet flow rate is 0 kg m−2 s−1·with closed outlet valves. This figure highlights the accumulation phase and prepares the reader for the transition to desorption, showing visually that ammonia is stored but not yet released. In Figure 11, the simulation results at the time of 6200 s are presented. At this point, the outlet valves are open, while the inlet valves are closed. The pressure at both the inlets and outlets decreases, and the temperature within the reactor also drops. Ammonia is produced with an outlet flow rate of 6.5 kg m−2 s−1. The dashboard allows the reader to observe the dynamic release of ammonia and understand the transition from the absorption to the desorption phase.
The dashboard allows for the visualization of changes in real time, enhancing the user’s understanding of the reactor status and helping decision making. It displays, in a user-friendly way, the operational recipe, the activation of valves, the direction of flow, the pressures and the temperatures of the system, making it a useful tool for both monitoring and future optimization.
6. Discussion
This section discusses the results presented in Section 4 in a broader technological, operational, and sustainability context. Emphasis is given to the limitations of the process, energy management, environmental and safety issues, as well as the impact of the digital framework on industrial upgrading and the integration of RES.
6.1. Constraints in Optimizing Operational Conditions
These results show that the dynamic interactions of pressure, temperature, and adsorption–desorption cycles can significantly affect low-pressure ammonia synthesis systems, like HySTrAm. Despite the detailed, real-time observation of these variables on the dashboard, the inherent constraints of the process limit the selection of truly optimal operating conditions. The increase of the operating pressure can improve ammonia production and reaction kinetics [46]. However, this improvement demands higher energy consumption and increased mechanical stress on system components, reflecting the fundamental thermodynamic and material limitations of ammonia synthesis processes [47].
These limitations intensify under dynamic operating conditions associated with green ammonia and electricity-to-ammonia systems [48,49,50]. The intermittency of RES leads to variability in hydrogen supply. As a result, the operation of the reactor is not stable, and frequent load adjustments are required, negatively affecting the overall performance and the component lifetime [51,52,53,54]. Maintaining high efficiency while preserving operational flexibility under such conditions is recognized as a major challenge in electricity-to-ammonia conversion systems [55,56,57].
Low-pressure ammonia synthesis with enhanced absorption has been proposed to reduce equilibrium constraints and allow more flexible operation at pressures around 20–30 bar [58,59,60]. While these approaches lower compression requirements and improve compatibility with variable energy input, they also introduce trade-offs such as reduced single-pass conversion and the need for optimized recycling and separation strategies.
Analyses of small-scale and modular green ammonia plants suggest that operational flexibility can be improved through careful system design and integration, although this often increases specific energy consumption and system complexity [61]. Advanced dashboards and monitoring tools improve process visibility but cannot overcome the fundamental physical and thermodynamic constraints; instead, they support informed operational decisions by clarifying the trade-offs between efficiency, flexibility, and system durability.
6.2. Energy Management and System Limitations
Under real operating conditions, managing energy effectively is particularly demanding for decentralized ammonia synthesis units powered by fluctuating RES. In systems that rely exclusively on intermittent sources, such as wind or solar, energy must be carefully distributed to balance production, storage charging, and continuous ammonia synthesis, preventing shutdowns or idle periods [62].
Previous studies have indicated that advanced energy management strategies, including the allocation of renewable energy across electrolyzers, storage, and synthesis units, can reduce operational limitations and improve load efficiency [51,63,64]. Intelligent control frameworks and real-time decision support tools, including visual dashboards, help operators detect mismatches between energy supply and demand and adjust absorption/desorption phases accordingly [65].
Although maximizing the use of renewable energy is desirable, seasonal and daily fluctuations can create conflicts with cost-effective ammonia production [51,66]. Flexible operating strategies and adaptive energy management systems can mitigate these constraints, prioritizing system stability and responding to variability in renewable supply.
In this context, decentralized green ammonia production can provide long-term energy storage while contributing to reduced CO2 emissions. However, achieving stable operation requires careful integration of storage, component sizing, and adaptive control [67].
6.3. Environmental Considerations
In the present work, the HySTrAm project supports decarbonization by enabling local, low-pressure ammonia synthesis powered by renewable electricity. This reduces dependence on centralized fossil fuel-based plants and the associated emissions from long-distance transport. Conventional ammonia production accounts for approximately 2% of global fossil energy use and over 420 million tons of CO2 annually, emphasizing the importance of decarbonization [68]. Electrolysis-based ammonia production using RES can cut GHG emissions by up to ~91% compared with conventional steam methane reforming under optimal conditions [69].
However, the overall environmental performance of decentralized ammonia systems depends also on life cycle assessments (LCAs). LCAs show that, while green ammonia significantly reduces global warming potential, other categories such as land use, mineral resource scarcity, and acidification may increase, depending on system design and electricity mix [69,70,71].
Although performing a full LCA is beyond the scope of this study, these results emphasize the importance of evaluating ammonia synthesis holistically. LCA studies, focusing specifically on ammonia synthesis and utilization, show that electrolysis-based production from RES presents lower cradle-to-gate GHG emissions (in some cases as low as 0.2–0.5 t CO2-eq per ton of ammonia) compared with high emissions from conventional fossil pathways, demonstrating the climate benefit of renewable integrations [68,72,73]. Moreover, recovering ammonia from waste streams using biological or electrochemical methods can reduce both energy consumption and emissions [74,75].
The results of this study suggest that the developed dashboard may provide a framework for integrating environmental performance indicators in future work, enabling more informed sustainability-related decisions [76].
6.4. Safety Provisional Measures
Safety is a key concern in ammonia-based systems due to the substance’s toxic, corrosive, and potentially flammable properties. This concern is particularly relevant in decentralized or small-scale applications, where even minor exposure can cause serious harm. Workplace limits for ammonia typically range from 25–35 ppm, with concentrations above 300 ppm considered immediately dangerous to life or health [77,78,79].
The developed dashboard improves operational reliability by continuously monitoring pressures, temperatures, valve states, ammonia concentration, and flow directions. Detecting abnormal conditions early allows operators to take timely corrective actions, which is essential given the rapid escalation of risks such as sudden releases.
Hazard identification and risk assessment methods help proactively identify potential dangers in ammonia synthesis, storage, and handling [80]. Implementing leak detection systems, automated shutdown mechanisms, and redundant pressure relief valves is essential. Continuous monitoring technologies and adherence to standard detection thresholds are key to ensuring safe operation of ammonia as an energy carrier or industrial feedstock [81].
Reliable operation also relies on well-defined procedures, including operator training, emergency response planning, and documented safety management systems. Best practices include multi-sensor leak detection, clear access zones, engineered ventilation, and comprehensive training programs to minimize human-related risks [82,83].
Understanding material compatibility and planning for corrosion control are critical because ammonia can aggressively corrode certain metals, especially in the presence of moisture. Proper material selection and maintenance strategies are essential to prevent equipment degradation and failures [84,85].
In summary, the developed dashboard contributes to an integrated safety strategy by facilitating early hazard detection, improved process transparency, and more informed operational decisions. However, it must complement robust hardware safeguards, and structured operational procedures to maintain reliable and safe ammonia systems.
6.5. Generalization and Industrial Applicability
The computational and operational features of the HySTrAm dashboard—including real-time visualization, process monitoring, and optimization—can extend beyond low-pressure ammonia synthesis. These tools are adaptable to other industrial processes involving hydrogen storage, renewable energy integration, or modular chemical production. The framework provides a basis for efficient operation, energy optimization, and flexible system control, emphasizing the potential of HySTrAm as a transferable tool for broader industrial applications.
7. Future Dashboard Development
In addition to the current dashboard, which visualizes the DT results, a future version is under development to interface directly with the demonstrator developed under the HySTrAm project. This new dashboard version will collect experimental data and display it in a user-friendly way, including safety alarms based on predefined thresholds.
Except for monitoring, the dashboard is planned to be upgraded into a control panel for both DT and demonstrator. For instance, a specific type of simulation scenario involving both systems could be requested. The dashboard would optimize the necessary sub-simulations, then coordinate with project partners to ensure that each simulation is run in the correct order and within the appropriate time frame before finally summarizing the results.
Moreover, the dashboard should be able to present optimised process data based on specific criteria, such as reduced costs, shorter production time or lower catalyst degradation. In this way, it will not only serve as a visualisation tool but also as a smart assistant for process optimization.
8. Conclusions
The development of a dashboard to visualize and optimize the simulation workflow of the ammonia synthesis reactor within the Horizon EU HySTrAm project is presented in this paper. The dashboard was developed using Py0thon (v3.9) and the Dash framework, and displays dynamic simulation results for different reactor configurations, such as a single reactor, and two reactors operating in parallel (swing mode). Future versions will include simulation results for two reactors operating in series. The dashboard provides valuable information on reactor performance by allowing a visualization of process variables, such as pressure at the inlets/outlets, temperature distribution along the reactor, ammonia outlet flow rate, and the current operation recipe (absorption or desorption), during reactor operation.
The results confirm that the dashboard is able to visualize the system behaviour during different operation recipes, such as absorption and desorption, as time passes. By showing valve states, reactor filling/emptying, flow direction, and ammonia production, the dashboard made it easier for users to understand the simulation results and evaluate the efficiency of the system. The design of the dashboard allows for future improvements, such as the addition of optimization features that will help identify optimal operating modes, reduce production time, increase productivity and estimate catalyst performance. In addition, planned improvements include a fully automated, web-based version with integration of data from the experimental campaign. In conclusion, this dashboard is a key tool not only for visualization, but also for the implementation of optimization strategies that will support the broader objectives of the HySTrAm project. Moreover, the insights and operational features demonstrated by the HySTrAm dashboard suggest potential generalization to other industrial processes, enabling integration with renewable hydrogen technologies and supporting broader industrial applications.
Author Contributions
Conceptualization, E.D., D.D. and J.T.; methodology, E.D., D.D. and J.T.; software, E.D. and D.D.; validation, J.T. and H.-T.T.; formal analysis, D.D.; investigation, E.D.; resources, J.T. and H.-T.T.; data curation, E.D.; writing—original draft preparation, E.D.; writing—review and editing, D.D. and J.T.; visualization, E.D.; supervision, J.T. and H.-T.T.; project administration, J.T. and H.-T.T.; funding acquisition, J.T. and H.-T.T. All authors have read and agreed to the published version of the manuscript.
Funding
This work was supported by the European Union—Horizon Europe, Grant Agreement [101058643], and HySTrAm: Hydrogen Storage and Transport using Ammonia.
Data Availability Statement
All data generated or analysed during this study are included in this published article.
Conflicts of Interest
Authors Eleni Douvi and Dimitra Douvi were employed by the company Paragon S.A. Jason Tsahalis and Haralabos-Theodoros Tsahalis are owners of the company Paragon S.A. All authors declare that the research was conducted in the absence of any commercial or financial relationships that could be construed as a potential conflict of interest.
Abbreviations
The following abbreviations are used in this manuscript:
| HySTrAm | Hydrogen Storage and Transport using Ammonia |
| GHG | Greenhouse gas |
| RES | Renewable energy sources |
| OPC-UA | Open Platform Communications Unified Architecture |
| MES | Manufacturing execution system |
| KPIs | Key performance indicators |
| REST | Representational state transfer |
| API | Application programming interface |
| DT | Digital twin |
| GUIs | Graphical user interfaces |
| SVGs | Scalable vector graphics |
| LCAs | Life cycle assessments |
References
- United Nations. The Paris Agreement; United Nations Framework Convention on Climate Change: Paris, France, 2015. [Google Scholar] [CrossRef] [Scilit]
- Rhodium Group. Global Greenhouse Gas Emissions 1990–2022 and Preliminary 2023 Estimates; Rhodium Group: New York, NY, USA, 2024. [Google Scholar]
- United Nations Environment Programme. Emissions Gap Report 2024: No More Hot Air … Please! With a Massive Gap Between Rhetoric and Reality, Countries Draft New Climate Commitments; United Nations Environment Programme: Nairobi, Kenya, 2024. [Google Scholar] [CrossRef] [Scilit]
- International Renewable Energy Agency (IRENA). Renewable Capacity Statistics 2024; IRENA: Abu Dhabi, United Arab Emirates, 2024; Available online: https://www.irena.org/-/media/Files/IRENA/Agency/Publication/2024/Mar/IRENA_RE_Capacity_Statistics_2024.pdf (accessed on 22 December 2025).
- International Energy Agency (IEA). Global Energy Review 2025; International Energy Agency Publications: Paris, France, 2025; Available online: https://www.iea.org/reports/global-energy-review-2025 (accessed on 22 December 2025).
- Ravestein, P.; van der Schrier, G.; Haarsma, R.; Scheele, R.; van den Broek, M. Vulnerability of European intermittent renewable energy supply to climate change and climate variability. Renew. Sustain. Energy Rev. 2018, 97, 497–508. [Google Scholar] [CrossRef] [Scilit]
- International Energy Agency (IEA). Electricity 2025: Analysis and Forecast to 2027; International Energy Agency Publications: Paris, France, 2025. [Google Scholar]
- Chaube, A.; Chapman, A.; Shigetomi, Y.; Huff, K.; Stubbins, J. The role of hydrogen in achieving long term Japanese energy system goals. Energies 2020, 13, 4539. [Google Scholar] [CrossRef] [Scilit]
- Greenwood, N.N.; Earnshaw, A. Hydrogen. In Chemistry of the Elements, 2nd ed.; Butterworth-Heinemann: Oxford, UK, 1997; pp. 32–67. [Google Scholar] [CrossRef] [Scilit]
- Nnabuife, S.; Oko, E.; Kuang, B.; Bello, A.; Onwualu, A.; Oyagha, S.; Whidborne, J. The prospects of hydrogen in achieving net zero emissions by 2050: A critical review. Sustain. Chem. Clim. Action 2023, 2, 100024. [Google Scholar] [CrossRef] [Scilit]
- Megia, P.; Vizcaino, A.; Calles, J.; Carrero, A. Hydrogen production technologies: From fossil fuels toward renewable sources—A mini review. Energy Fuels 2021, 35, 16403–16415. [Google Scholar] [CrossRef] [Scilit]
- Rolo, I.; Costa, V.; Brito, F. Hydrogen-based energy systems: Current technology development status, opportunities and challenges. Energies 2024, 17, 180. [Google Scholar] [CrossRef] [Scilit]
- Sanni, O.; Dyosiba, X.; Ren, J. A brief overview of hydrogen production and storage. S. Afr. J. Chem. Eng. 2025, 53, 60–72. [Google Scholar] [CrossRef] [Scilit]
- Sánchez, A.; Blanco, E.C.; Martín, M. Comparative assessment of methanol and ammonia: Green fuels vs. hydrogen carriers in fuel cell power generation. Appl. Energy 2024, 374, 124009. [Google Scholar] [CrossRef] [Scilit]
- Alghool, D.; Haouari, M.; Trucco, P. It is not the same green: A comparative LCA study of green hydrogen supply network pathways. Int. J. Hydrogen Energy 2024, 140, 958–970. [Google Scholar] [CrossRef] [Scilit]
- Bora, N.; Singh, K.; Pal, A.; Sahoo, K.; Seth, U.; Rathore, D.; Bhadra, S.; Sevda, S.; Venkatramanan, V.; Prasad, S.; et al. Green ammonia production: Process technologies and challenges. Fuel 2024, 369, 131808. [Google Scholar] [CrossRef] [Scilit]
- Folgado, F.J.; Calderón, D.; González, I.; Calderón, A.J. Review of Industry 4.0 from the Perspective of Automation and Supervision Systems: Definitions, Architectures and Recent Trends. Electronics 2024, 13, 782. [Google Scholar] [CrossRef] [Scilit]
- Santos, J.F.D.; Tshoombe, B.K.; Santos, L.H.B.; Araujo, R.C.F.; Manito, A.R.A.; Fonseca, W.S.; Silva, M.O. Digital Twin-Based Monitoring System of Induction Motors Using IoT Sensors and Thermo-Magnetic Finite Element Analysis. IEEE Access 2023, 11, 1682–1693. [Google Scholar] [CrossRef] [Scilit]
- Alves, R.G.; Souza, G.; Maia, R.F.; Tran, A.L.H.; Kamienski, C.; Soininen, J.P.; Lima, F. A digital twin for smart farming. In Proceedings of the 2019 IEEE Global Humanitarian Technology Conference (GHTC), Santa Clara, CA, USA, 17 October 2019; pp. 1–4. [Google Scholar]
- Haghshenas, A.; Hasan, A.; Osen, O.; Mikalsen, E.T. Predictive digital twin for offshore wind farms. Energy Inf. 2023, 6, 1. [Google Scholar] [CrossRef] [Scilit]
- Provolo, G.; Brandolese, C.; Grotto, M.; Marinucci, A.; Fossati, N.; Ferrari, O.; Beretta, E.; Riva, E. An Internet of Things Framework for Monitoring Environmental Conditions in Livestock Housing to Improve Animal Welfare and Assess Environmental Impact. Animals 2025, 15, 644. [Google Scholar] [CrossRef] [Scilit]
- Schulze, K.; Mišić, M.; Radojičić, N.; Serin, B. Evaluating Partners for Renewable Energy Trading: A Multidimensional Framework and Tool. Sustainability 2024, 16, 3632. [Google Scholar] [CrossRef] [Scilit]
- Patel, D.H.; Shah, K.P.; Gupta, R.; Jadav, N.K.; Tanwar, S.; Neagu, B.C.; Attila, S.; Alqahtani, F.; Tolba, A. Blockchain-Based Crop Recommendation System for Precision Farming in IoT Environment. Agronomy 2023, 13, 2642. [Google Scholar] [CrossRef] [Scilit]
- Thyagarajan, A.; Hamer, W.; Phophichitra, J.; Valliappan, V.; Ramesh, A.; Shenai, P.; Laycock, N. The Virtual Corrosion Engineer. Corros. Mater. Degrad. 2021, 2, 762–769. [Google Scholar] [CrossRef] [Scilit]
- Yan, X.T.; Bradley, D. Reinventing Mechatronics. In Reinventing Mechatronics, 1st ed.; Xiu, Y., Bradley, D., Russell, D., Moore, P., Eds.; Springer: Cham, Switzerland, 2020; pp. 1–10. [Google Scholar]
- Guérineau, B.; Bricogne, M.; Durupt, A.; Rivest, L. Mechatronics vs. cyber physical systems: Towards a conceptual framework for a suitable design methodology. In Proceedings of the 2016 11th France-Japan & 9th Europe-Asia Congress on Mechatronics (MECATRONICS)/17th International Conference on Research and Education in Mechatronics (REM), Compiegne, France, 15–17 June 2016; pp. 314–320. [Google Scholar]
- Choi, S.; Kang, G.; Jun, C.; Lee, J.Y.; Han, S. Cyber-physical systems: A case study of development for manufacturing industry. Int. J. Comput. Appl. Technol. 2017, 55, 289–297. [Google Scholar] [CrossRef] [Scilit]
- Liu, C.; Vengayil, H.; Lu, Y.; Xu, X. A cyber-physical machine tools platform using OPC UA and MTConnect. J. Manuf. Syst. 2019, 51, 61–74. [Google Scholar] [CrossRef] [Scilit]
- Almada-Lobo, F. The Industry 4.0 revolution and the future of Manufacturing Execution Systems (MES). J. Innov. Manag. 2015, 3, 16–21. [Google Scholar] [CrossRef] [Scilit]
- Choi, S.; Woo, J.; Kim, J.; Lee, J.Y. Digital Twin-Based Integrated Monitoring System: Korean Application Cases. Sensors 2022, 22, 5450. [Google Scholar] [CrossRef] [Scilit]
- Folgado, F.J.; Millán, P.; Calderón, D.; González, I.; Calderón, A.J.; Calderón, M. Industry 4.0-Compliant IoT Supervisory System for Green Hydrogen Applications in Industrial and Domestic Sectors. Eng. Proc. 2025, 118, 37. [Google Scholar] [CrossRef] [Scilit]
- Hydrogen Storage and TRansport Using Ammonia (HySTrAm). Available online: https://www.hystram.eu/ (accessed on 25 May 2025).
- Sengoba, C.; Illner, M.; Repke, J.-U. Recipe-based 1-D dynamic modeling of an integrated NH3-synthesis-sorption reactor. Chem. Eng. Process. Process Intensif. 2025, 216, 110387. [Google Scholar] [CrossRef] [Scilit]
- Sengoba, C.; Illner, M.; Repke, J.-U. Optimal Control of an Integrated Sorption–Reaction Unit for Ammonia Synthesis. In Proceedings of the 34th European Symposium on Computer Aided Process Engineering/15th International Symposium on Process Systems Engineering (ESCAPE34/PSE24), Florence, Italy, 2–6 June 2024; Manenti, F., Reklaitis, G.V., Eds.; Elsevier: Amsterdam, The Netherlands, 2024. [Google Scholar]
- Sengoba, C.; Illner, M.; Repke, J.-U. Recipe-based Dynamic Optimization of an Integrated Ammonia Synthesis–Sorption Reactor. In Proceedings of the Annual Meeting of Process Engineering and Materials Technology; DECHEMA-House: Frankfurt am Main, Germany, 2024. [Google Scholar]
- Sengoba, C.; Hoffmann, C.; Illner, M.; Repke, J.-U. A Novel Continuous Reformulation for Recipe-based Dynamic Optimization of Batch Processes. In Proceedings of the 35th European Symposium on Computer Aided Process Engineering (ESCAPE 35), Ghent, Belgium, 6–9 July 2025; Van Impe, J.F.M., Léonard, G., Bhonsale, S.S., Polańska, M.E., Logist, F., Eds.; The CACHE Foundation, Inc.: Glendale, AZ, USA, 2025. [Google Scholar]
- Deng, W.; Huang, C.; Li, X.; Zhang, H.; Dai, Y. Dynamic Simulation Analysis and Optimization of Green Ammonia Production Process under Transition State. Processes 2022, 10, 2143. [Google Scholar] [CrossRef] [Scilit]
- Shaker, I.; Mohamed, S.; Habiba, E.; Hamdy, O.; Bassyouni, M.; Aboelela, D.; Abou Seada, N.; El-Bagoury, M. Process simulation and design of green ammonia production plant for carbon neutrality. Int. J. Ind. Sustain. Dev. 2024, 5, 79–103. [Google Scholar] [CrossRef] [Scilit]
- Rosbo, J.W.; Jensen, A.D.; Jørgensen, J.B.; Huusom, J.K. Comparison, operation and cooling design of three general reactor types for Power-to-Ammonia processes. Chem. Eng. J. 2024, 496, 153660. [Google Scholar] [CrossRef] [Scilit]
- Khademi, M.H.; Sabbaghi, R.S. Comparison between three types of ammonia synthesis reactor configurations in terms of cooling methods. Chem. Eng. Res. Des. 2017, 128, 306–317. [Google Scholar] [CrossRef] [Scilit]
- Pluth, A.; Heaps, K.; Thueson, S.; Dunker, J.; Shields, A. Developing digital twin visualizations: A methodology and case study on chemical separation processing. J. Chemom. 2025, 39, e70085. [Google Scholar] [CrossRef] [Scilit]
- Yin, Y.; Feng, J.; Yi, B.; Li, W.; Yin, Q. Visual monitoring system of digital twin workshop for process manufacturing. J. Syst. Simul. 2024, 36, 9. [Google Scholar] [CrossRef]
- Wibowo, F.; Putra, K.T.; Syamsudin, M.; Suheri; Vasseur, C. A 3D digital twin dashboard for enhanced IoT-based smart building monitoring and control. In Proceedings of the 2024 IEEE International Conference on Emerging Electronics, Energy and Information Systems (ICE3IS), Yogyakarta, Indonesia, 7–8 August 2024; pp. 438–443. [Google Scholar] [CrossRef] [Scilit]
- Randell, R.; Alvarado, N.; Elshehaly, M.; McVey, L.; West, R.; Doherty, P.; Dowding, D.; Farrin, A.; Feltbower, R.; Greenhalgh, J.; et al. Design and evaluation of an interactive quality dashboard for national clinical audit data: A realist evaluation. Health Soc. Care Deliv. Res. 2022, 10, 1–156. [Google Scholar] [CrossRef] [Scilit]
- Dowding, D.; Randell, R.; Gardner, P.; Fitzpatrick, G.; Dykes, P.; Favela, J.; Hamer, S.; Whitewood-Moores, Z.; Hardiker, N.; Borycki, E.; et al. Dashboards for improving patient care: Review of the literature. Int. J. Med. Inform. 2015, 84, 87–100. [Google Scholar] [CrossRef] [Scilit]
- Cussler, E.; McCormick, A.; Reese, M.; Malmali, M. Ammonia Synthesis at Low Pressure. J. Vis. Exp. 2017, 126, 55691. [Google Scholar] [CrossRef] [Scilit]
- MacFarlane, D.R.; Cherepanov, P.V.; Choi, J.; Suryanto, B.H.R.; Hodgetts, R.Y.; Bakker, J.M.; Ferrero Vallana, F.M.; Simonov, A.N. A roadmap to the ammonia economy. Joule 2020, 4, 1186–1205. [Google Scholar] [CrossRef] [Scilit]
- Bañares-Alcántara, R.; Dericks, G., III; Fiaschetti, M.; Grünewald, P.; Masa Lopez, J.; Tsang, E.; Yang, A.; Ye, L.; Zhao, S. Analysis of Islanded Ammonia-Based Energy Storage Systems; University of Oxford: Oxford, UK, 2015; Available online: https://media.eng.ox.ac.uk/11082/ammonia-based_ess.pdf (accessed on 16 January 2026).
- Narciso, D.A.C.; Pires, J.M.; Fortunato, J.; Teixeira, P.; Castro, P.M.; Pinheiro, C.I.C.; Matos, H.A. Design and operation of Power-to-Ammonia systems: A review. Energy Convers. Manag. 2025, 327, 119494. [Google Scholar] [CrossRef] [Scilit]
- Wen, D.; Aziz, M. Design and analysis of biomass-to-ammonia-to-power as an energy storage method in a renewable multi-generation system. Energy Convers. Manag. 2022, 261, 115611. [Google Scholar] [CrossRef] [Scilit]
- Salmon, N.; Bañares-Alcántara, R. Impact of process flexibility and imperfect forecasting on the operation and design of Haber–Bosch green ammonia. RSC Sustain. 2023, 1, 923–937. [Google Scholar] [CrossRef] [Scilit]
- Rouwenhorst, K.H.R.; Van der Ham, A.G.J.; Mul, G.; Kersten, S.R.A. Islanded Ammonia Power Systems: Technology Review & Conceptual Process Design. Renew. Sustain. Energy Rev. 2019, 114, 109339. [Google Scholar] [CrossRef] [Scilit]
- Brown, T. Ammonia for Energy Storage: Economic and Technical Analysis; Ammonia Energy Association: Brooklyn, NY, USA, 2017; Available online: https://ammoniaenergy.org/articles/ammonia-for-energy-storage-economic-and-technical-analysis/ (accessed on 16 January 2026).
- Sousa, J.; Waiblinger, W.; Friedrich, K.A. Techno-economic Study of an Electrolysis-Based Green Ammonia Production Plant. Ind. Eng. Chem. Res. 2022, 61, 14515–14530. [Google Scholar] [CrossRef] [Scilit]
- Liu, B.; Maréchal, F. Optimal design and operation of a green ammonia production system considering multi-electrolyzer operation. Appl. Therm. Eng. 2025, 274, 126534. [Google Scholar] [CrossRef] [Scilit]
- Spatolisano, E.; Figini, D. Absorption-enhanced Haber-Bosch for small-scale green NH3 production: A feasibility study. Energy Convers. Manag. 2025, 337, 119904. [Google Scholar] [CrossRef] [Scilit]
- Sun, M.; Ling, Z.; Mao, J.; Zeng, X.; Yuan, D.; Liu, M. Ammonia-Based Clean Energy Systems: A Review of Recent Progress and Key Challenges. Energies 2025, 18, 2845. [Google Scholar] [CrossRef] [Scilit]
- Palys, M.J.; McCormick, A.; Cussler, E.L.; Daoutidis, P. Modeling and Optimal Design of Absorbent Enhanced Ammonia Synthesis. Processes 2018, 6, 91. [Google Scholar] [CrossRef] [Scilit]
- Andrés-Martínez, O.; Zhang, Q.; Daoutidis, P. Optimal Operation of a Reaction-Absorption Process for Ammonia Production at Low Pressure. Ind. Eng. Chem. Res. 2023, 62, 14456–14466. [Google Scholar] [CrossRef] [Scilit]
- Malmali, M.; McCormick, A.; Cussler, E.; Prince, J.; Reese, M. Lower Pressure Ammonia Synthesis. In Proceedings of the NH3 Fuel Conference 2017, Ammonia Energy Association, Brooklyn, NY, USA, 1 November 2017; Available online: https://ammoniaenergy.org/presentations/lower-pressure-ammonia-synthesis/ (accessed on 17 January 2026).
- de la Hera, G.; Ruiz-Gutiérrez, G.; Viguri, J.R.; Galán, B. Flexible Green Ammonia Production Plants: Small-Scale Simulations Based on Energy Aspects. Environments 2024, 11, 71. [Google Scholar] [CrossRef] [Scilit]
- Smith, C.; Torrente-Murciano, L. Cost efficiency versus energy utilization in green ammonia production from intermittent renewable energy. Nat. Chem. Eng. 2025, 2, 261–272. [Google Scholar] [CrossRef] [Scilit]
- Bouaboula, H.; Ouikhalfan, M.; Saadoune, I.; Chaouki, J.; Zaabout, A.; Belmabkhout, Y. Addressing sustainable energy intermittence for green ammonia production. Energy Rep. 2023, 9, 4507–4517. [Google Scholar] [CrossRef] [Scilit]
- Zheng, Y.; Zhu, S.; Yang, D.; Li, J.; Rong, F.; Ji, X.; He, G. A Multi-Time Scale Optimal Dispatch Strategy for Green Ammonia Production Using Wind–Solar Hydrogen Under Renewable Energy Fluctuations. Energies 2025, 18, 6518. [Google Scholar] [CrossRef] [Scilit]
- International Renewable Energy Agency (IRENA). Innovation Landscape for a Renewable-Powered Future: Solutions to Integrate Variable Renewables; International Renewable Energy Agency: Abu Dhabi, United Arab Emirates, 2019; Available online: https://www.irena.org/publications/2019/Feb/Innovation-landscape-for-a-renewable-powered-future (accessed on 17 January 2026).
- Pistolesi, C.; Giaconia, A.; Bassano, C.; De Falco, M. Flexible Green Ammonia Production: Impact of Process Design on the Levelized Cost of Ammonia. Fuels 2025, 6, 39. [Google Scholar] [CrossRef] [Scilit]
- Wen, Z.; Huang, B.; Wang, Y.; Wang, K.; Tu, X.; Xie, P.; Fu, X. Ammonia as a renewable energy carrier from synthesis to utilization. Nat. Rev. Clean Technol. 2025, 1, 755–770. [Google Scholar] [CrossRef] [Scilit]
- Liu, X.; Elgowainy, A.; Wang, M. Life cycle energy use and greenhouse gas emissions of ammonia production from renewable resources and industrial by-products. Green Chem. 2020, 22, 5752–5765. [Google Scholar] [CrossRef] [Scilit]
- Mayer, P.; Ramirez, A.; Pezzella, G.; Winter, B.; Sarathy, S.M.; Gascon, J.; Bardow, A. Blue and green ammonia production: A techno-economic and life cycle assessment perspective. iScience 2023, 26, 107389. [Google Scholar] [CrossRef] [Scilit]
- Shi, Y.; Li, H.; Liu, X.; Zhang, X.; Zhan, G.; Cheng, J.; Wang, J.; Mao, C.; Zhang, L. Green energy-driven ammonia production for sustainable development goals. Chem 2024, 10, 2636–2650. [Google Scholar] [CrossRef] [Scilit]
- Zhang, Z.; Zhang, H.; Jiang, H.; Li, L. Green ammonia: Revolutionizing sustainable energy for a carbon-free future. J. Mater. Chem. A 2024, 12, 33334–33361. [Google Scholar] [CrossRef] [Scilit]
- Liu, X.; Elgowainy, A. Life-cycle analysis of green ammonia and its application as fertilizer building block. In Proceedings of the Ammonia Energy Conference 2019, Orlando, FL, USA, 12 November 2019; Available online: https://ammoniaenergy.org/presentations/life-cycle-analysis-of-green-ammonia-and-its-application-as-fertilizer-building-block/ (accessed on 18 January 2026).
- Ukoba, K.; Onisuru, O.R.; Jen, T.H. Life cycle assessment of green ammonia production at a coastal facility in South Africa. Front. Energy 2025, 19, 1013–1015. [Google Scholar] [CrossRef] [Scilit]
- Maqdasi, B.; Alhseinat, E.; Rodríguez, J.; Al-Ali, K. Ammonia recovery from wastewater: A critical review of technologies with emphasis on capacitive deionization. Chem. Eng. J. Adv. 2025, 24, 100901. [Google Scholar] [CrossRef] [Scilit]
- Farghali, M.; Chen, Z.; Osman, A.I.; Ali, I.M.; Hassan, D.; Ihara, I.; Rooney, D.W.; Yap, P.-S. Strategies for ammonia recovery from wastewater: A review. Environ. Chem. Lett. 2024, 22, 2699–2751. [Google Scholar] [CrossRef] [Scilit]
- Davidson, E.A.; Raghuram, N. Green ammonia presents an opportunity to advance energy and food system sustainability in India. Commun. Sustain. 2026, 1, 14. [Google Scholar] [CrossRef] [Scilit]
- National Institute for Occupational Safety and Health (NIOSH). Ammonia (CAS 7664-41-7)—Immediately Dangerous to Life or Health (IDLH). NIOSH IDLH Database; Centers for Disease Control and Prevention: Atlanta, GA, USA. Available online: https://www.cdc.gov/niosh/idlh/7664417.html (accessed on 18 January 2026).
- National Institute for Occupational Safety and Health (NIOSH). Ammonia Solution, Ammonia, Anhydrous: Lung Damaging Agent. CDC NIOSH Emergency Response Card; Centers for Disease Control and Prevention: Atlanta, GA, USA. Available online: https://www.cdc.gov/niosh/ershdb/emergencyresponsecard_29750013.html (accessed on 18 January 2026).
- Occupational Safety and Health Administration (OSHA). Ammonia Refrigeration Hazards. U.S. Department of Labor: Washington, DC, USA. Available online: https://www.osha.gov/ammonia-refrigeration/hazards (accessed on 18 January 2026).
- Trivyza, N.L.; Cheliotis, M.; Boulougouris, E.; Theotokatos, G. Safety and Reliability Analysis of an Ammonia-Powered Fuel-Cell System. Safety 2021, 7, 80. [Google Scholar] [CrossRef] [Scilit]
- Ammonia Energy Association (AEA). Ammonia Gas Detection: Core Technologies and Standards. Ammonia Energy Association: Ashburn, VA, USA; Available online: https://ammoniaenergy.org/gasdetection/ (accessed on 17 January 2026).
- Lloyd’s Register Maritime Decarbonisation Hub (LRMDH); Mærsk McKinney Møller Center for Zero Carbon Shipping (MMMCZCS). Human Factors Considerations: Ammonia Fuel End-of-Stage Report; Zero Carbon Shipping: Copenhagen, Denmark, 2023; Available online: https://www.zerocarbonshipping.com/files/human-factors-project-report_ammonia-fuel-operations_report.pdf (accessed on 17 January 2026).
- Lloyd’s Register Maritime Decarbonisation Hub (MDH); Mærsk Mc-Kinney Møller Center for Zero Carbon Shipping (MMMCZCS). Recommendations for Design and Operation of Ammonia-Fueled Vessels Based on Multi-Disciplinary Risk Analysis; Zero Carbon Shipping: Copenhagen, Denmark, 2023; Available online: https://www.zerocarbonshipping.com/publications/recommendations-for-design-and-operation-of-ammonia-fueled-vessels-based-on-multi-disciplinary-risk-analysis (accessed on 16 January 2026).
- European Maritime Safety Agency (EMSA). Study Investigating the Safety of Ammonia as Fuel on Ships; EMSA: Lisbon, Portugal, 2024; Available online: https://emsa.europa.eu/publications/item/5264-study-investigating-the-safety-of-ammonia-as-fuel-on-ships.html (accessed on 18 January 2026).
- Alnajideen, M.; Shi, H.; Northrop, W.; Emberson, D.; Kane, S.; Czyzewski, P.; Alnaeli, M.; Mashruk, S.; Rouwenhorst, K.; Yu, C.; et al. Ammonia combustion and emissions in practical applications: A review. Carb. Neutrality 2024, 3, 13. [Google Scholar] [CrossRef] [Scilit]
Disclaimer/Publisher’s Note: The statements, opinions and data contained in all publications are solely those of the individual author(s) and contributor(s) and not of MDPI and/or the editor(s). MDPI and/or the editor(s) disclaim responsibility for any injury to people or property resulting from any ideas, methods, instructions or products referred to in the content. |
© 2026 by the authors. Licensee MDPI, Basel, Switzerland. This article is an open access article distributed under the terms and conditions of the Creative Commons Attribution (CC BY) license.