


Abstract
Boundary uncertainty arises when a continuous insurance-based severity ratio is converted into ordered damage states using crisp thresholds, causing nearly identical claims to receive different labels solely because they fall on opposite sides of a decision boundary. This study presents a transparent computational framework that explicitly represents this uncertainty through predeclared piecewise-linear transition bands and soft labels while retaining probabilistic damage-state exceedance modelling and ordinal coherence within a transparent and auditable computational workflow. The empirical study uses 802 residential storm-wind insurance claims from Vojvodina, Serbia, recorded during 2013–2018. The response is the Relative Damage Ratio (RDR), calculated as the ratio of Insurance Claim Payout to policy Sum Insured and expressed as a percentage. The framework combines matched hard-label and soft-label cumulative logistic models with leakage-controlled calendar-month-blocked validation, paired blocked-bootstrap comparison and prespecified robustness analyses. Hard-label and soft-label models produced nearly identical proper-score and AUC point estimates; all paired 95% blocked-bootstrap confidence intervals for Brier-score, cross-entropy and calibration-slope differences included zero. Transition-width and local threshold-perturbation analyses likewise showed no consistent empirical advantage of either target representation. A secondary mathematically coupled specification incorporating log(Sum Insured), which also enters the denominator of RDR, yielded higher AUC values of approximately 0.76–0.80 compared with 0.58–0.63 in the primary wind-only models; these results are therefore interpreted as diagnostic rather than as evidence of independent physical predictive information. Rather than claiming predictive superiority for soft labels, the proposed framework makes boundary assumptions explicit while maintaining ordinal coherence by construction and yielding comparable calibration metrics, thereby providing a transparent, auditable and fully specified computational framework for ordinal probabilistic modelling in which continuous outcomes are converted into threshold-based cumulative states, with potential applicability to other ordinal risk-assessment settings.
1. Introduction
This study develops a transparent computational framework for insurance-based damage-state exceedance modelling under boundary uncertainty to support risk-informed decision making. The problem arises when a continuous insurance-based severity ratio is mapped to ordered damage states whose boundaries are operationally useful but not physically discontinuous: nearly identical observations can receive opposite 0/1 labels. Storm-wind claims provide a demanding test bed because losses are heterogeneous, building inventories are incomplete, and multiple claims may share a common monthly meteorological context. Wind-loss research includes regional storm-loss models [1,2,3,4,5,6], component-based and fragility approaches [2,3,4,7,8,9], and insurance claim-payout and probabilistic loss models [10,11,12,13,14]. Previous reviews and methodological studies emphasize the need to balance physical detail, regional data availability, uncertainty representation and operational interpretability [15,16,17,18,19].
The empirical basis of this study originates from the regional storm-damage dataset and modelling framework reported by Novaković [20]. The audit performed for the present study confirms that the ratio is Insurance Claim Payout divided by policy Sum Insured. Related work by the authors includes transparent computational frameworks, GIS-supported flood-damage assessment and insurance-oriented risk modelling [21,22,23,24].
The closest application-specific antecedents are the insurer-data studies of Kim et al. [14] and Yum et al. [25]. Kim et al. [14] estimated multi-year regional vulnerability functions from insurer records using wind speed, line of business and property value. Yum et al. [25] derived crisp damage-state exceedance curves from Typhoon Maemi claim payouts normalized by appraised property values. The present archive instead uses the contractual Sum Insured as the denominator. The studies therefore motivate the insurer-data lineage and provide an appropriate crisp hazard-only benchmark. However, they differ from the present study in two important respects: they use appraised property value rather than contractual Sum Insured, and they do not explicitly model ambiguity at damage-state boundaries. This distinction motivates the present focus on an insurance-based severity ratio and on the treatment of observations lying close to operational damage-state thresholds.
In the proposed framework, predeclared piecewise-linear fuzzy transition bands generate soft labels only near each threshold, while fitted exceedance surfaces remain probabilistic. Membership grades encode ambiguity in state assignment, not the probability of a future event. This limited use of fuzzy sets builds on transparent gradual-transition mechanisms [26,27,28,29] and hazard-oriented fuzzy applications [22,27], without replacing stochastic validation or converting the model into a fuzzy inference system.
The main research question is how explicit representation of boundary uncertainty through soft labels affects predictive performance and calibration relative to the matched hard-label formulation and how stable this comparison remains under prespecified threshold and transition-width perturbations. The contribution is broader than the soft-label device itself: within an insurance-based storm-damage setting, the framework integrates a locked domain protocol, matched hard-versus-soft estimation, structurally non-crossing cumulative models, leakage-controlled validation, paired bootstrap comparison and threshold/width sensitivity analysis. Calibration assessment, blocked-bootstrap comparison and sensitivity analyses provide the empirical basis for evaluating this central research question. Although demonstrated on storm-wind claims, the framework targets the broader class of ordinal problems in which a continuous outcome is converted into cumulative threshold-based classes with conventional adjacent-state boundaries. The contributions of the study are summarized as follows:
- A transparent computational framework for boundary-aware insurance-based damage-state exceedance modelling that integrates predeclared boundary representation, matched hard/soft estimation, ordinal constraints, leakage-controlled validation and sensitivity analysis;
- A matched hard-label versus soft-label experimental design using the same wind predictor, curve family, ordinal constraints and held-out crisp outcomes;
- A joint constrained estimation strategy that enforces the ordering of exceedance surfaces in both hard-label and soft-label models;
- A leakage-controlled calendar-month-blocked validation and paired blocked-bootstrap protocol that separates model development from evaluation;
- A sensitivity analysis that quantifies the effects of threshold placement and transition-band width;
- An empirical demonstration using 802 multi-year residential storm-wind claims from Vojvodina, explicitly conditional on claim occurrence.
The remainder of the paper is organized as follows. Section 2 reviews the relevant literature on damage functions, empirical exceedance curves and soft-label representations. Section 3 presents the study data, methodological framework and computational protocol. Section 4 reports the empirical results. Section 5 discusses the findings, and Section 6 concludes the paper.
2. Background and Related Work
This section reviews the methodological background relevant to the proposed framework, progressing from insurance-based relative damage and claim-severity modelling to empirical damage-state exceedance curves and boundary-aware target representations. It then synthesizes these strands to position the present study within the existing insurance-based damage-modelling literature.
2.1. Insurance-Based Relative Damage and Claim-Severity Modelling
Insurance-based damage modelling commonly relies on normalized financial loss measures that enable comparison across heterogeneous claims by expressing financial loss relative to an exposure or contractual value [17,20]. In the audited archive, the response is not a direct engineering estimate of physical damage. Insurance Claim Payout is the amount paid after the insurer’s standardized assessment and claim-settlement process, and it is normalized by the policy Sum Insured. The resulting Relative Damage Ratio is therefore an insurance-based proxy for underlying damage severity. Comparable studies use repair cost, claim payout, insured value or appraised property value to derive operational damage ratios and financial-loss relationships [11,14,25]. The present denominator must nevertheless be called Sum Insured rather than property value because the available documentation confirms only the contractual policy amount.
2.2. Empirical Damage-State and Exceedance Curves
Damage-state exceedance curves estimate the probability that a loss outcome reaches or exceeds an ordered threshold at a given hazard intensity and are commonly represented using parametric fragility or vulnerability functions [8,9,30]. The closest application-specific antecedents are provided by the insurer-data studies of Kim et al. [14] and Yum et al. [25]. Kim et al. [14] estimated multi-year regional vulnerability functions from insurer records using wind speed, line of business and property value. Yum et al. [25] derived crisp damage-state exceedance curves from Typhoon Maemi claim payouts normalized by appraised property values. Together these studies establish an appropriate insurer-data benchmark while also illustrating the distinction between appraised property value and the contractual Sum Insured adopted in the present study.
The broader wind-vulnerability literature includes component-based hurricane models, HAZUS damage-and-loss modules, stochastic loss models and empirical claim-payout models [7,8,9,11,12,13,14]. Collectively, this literature shows that building age, floor area, occupancy, construction type, location, contractual or appraised value and storm characteristics can influence observed losses [7,11,14,15,16]. It also demonstrates the practical value of parsimonious empirical models when detailed building inventories are unavailable [7,11,13,14,16].
Collectively, these studies establish the methodological context for insurance-based damage-state exceedance modelling while highlighting several challenges that remain insufficiently addressed. In particular, they emphasize the importance of accounting for spatial dependence [31] and of clearly reporting model assumptions, transferability and input uncertainty [13,32,33,34,35]. These observations motivate the boundary-aware modelling perspective developed in Section 2.3.
2.3. Boundary Uncertainty and Soft Labels
Boundary uncertainty arises when continuous observations are mapped to ordered categories using conventional cut points. A soft label allows an observation near a boundary to contribute partially to adjacent exceedance classes instead of being assigned by an abrupt 0/1 rule [26,28,29]. Fuzzy membership functions provide one transparent mechanism for constructing such labels, while the computational object used for model estimation remains the numerical target z ∈ [0,1]. This distinction positions the approach within ordinal classification and probabilistic learning: membership grades represent uncertainty in boundary assignment, whereas the fitted exceedance surface retains its probabilistic interpretation. Soft-label representations are designed to reduce sensitivity to abrupt boundary assignments near predefined thresholds, but their construction should remain transparent, and their predictive performance should be evaluated independently of the information used to define them. More generally, the same conceptual structure arises whenever a continuous variable is converted into ordered cumulative classes using conventional thresholds. The storm-wind application considered in this study therefore represents an empirical example of a broader boundary-uncertainty problem rather than a hazard-specific modelling approach.
Recent computational studies provide complementary support for this boundary-aware representation. In ordinal regression, Díaz and Marathe [36] replaced hard ordinal labels with soft probability distributions that encode relationships among ordered categories and can be combined with cross-entropy-based learning. More recently, Vargas et al. [37] proposed soft labelling based on triangular distributions for ordinal classification, explicitly representing uncertainty that is otherwise lost when ordinal observations are reduced to crisp labels. Fuzzy partitioning frameworks represent partially overlapping structures through graded memberships rather than mutually exclusive assignments [38], while optimized fuzzy systems emphasize that membership design should be assessed together with interpretability and predictive performance [39]. Related work on intuitionistic fuzzy label enhancement likewise demonstrates how uncertain or boundary-near observations can be represented by numerical labels instead of abrupt logical assignments [40]. Although these studies are not direct exceedance-curve models, they share the general principle of explicitly representing uncertainty in the target representation. Collectively, they illustrate that uncertainty can be represented explicitly at the target level, while probabilistic prediction and probability calibration remain distinct modelling objectives [41].
2.4. Research Gap and Positioning
The preceding review identifies several complementary methodological approaches but also reveals important differences in how uncertainty is represented and modelled. To synthesize these relationships and position the proposed framework within the existing literature, Table 1 compares the principal methodological approaches in terms of their primary estimand, representation of uncertainty, modelling approach and relevance to the present study.
Table 1.
Methodological positioning of the proposed framework relative to existing approaches.
Taken together, the studies summarized in Table 1 demonstrate that existing insurance-based approaches either model continuous claim severity or estimate exceedance probabilities from conventionally defined crisp damage states. Within the insurer-data literature reviewed here, explicit representation of ambiguity arising when continuous insurance-based damage ratios are mapped to ordered damage-state thresholds has received comparatively limited attention. The present study addresses this methodological gap by integrating explicit boundary representation with matched hard-versus-soft estimation, structurally constrained ordinal modelling and a common validation framework for insurance-based damage-state exceedance analysis.
3. Materials and Methods
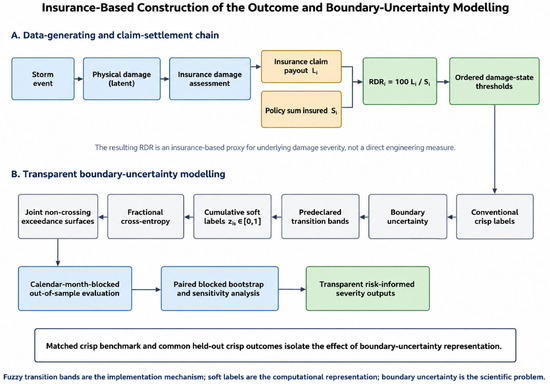
The methodology comprises four linked computational layers: (i) construction of an insurance-based Relative Damage Ratio from claim payout and policy Sum Insured; (ii) generation of ordered soft exceedance targets from predeclared fuzzy transition bands; (iii) estimation of matched crisp and soft-label exceedance surfaces, with joint ordinal optimization that prevents crossing; and (iv) leakage-controlled calendar-month-blocked validation, paired bootstrap comparison and sensitivity analysis. Fuzzy membership encodes boundary uncertainty in the training targets, whereas fitted outputs, calibration criteria and validation remain probabilistic. Figure 1 summarizes both the claim-settlement chain that produces the response and the matched modelling workflow.
Figure 1.
Insurance-based construction of the Relative Damage Ratio and the subsequent boundary-uncertainty modelling workflow. The resulting RDR is an insurance-based proxy for underlying damage severity, not a direct engineering measure. Fuzzy transition bands are the implementation mechanism, soft labels are the computational representation, and boundary uncertainty is the central modelling problem addressed in this study.
3.1. Study Context and Insurance-Claim Data
The empirical basis of this study is a previously developed storm-damage insurance-claim dataset [20]. The audited analytical file contains 802 complete records of paid storm-wind claims for insured residential buildings in Vojvodina during 2013–2018. No missing values or exact duplicate records were identified, and all Sum Insured, Insurance Claim Payout and Relative Damage Ratio (RDR) values were positive. The regional distribution comprises 437 claims from Bačka, 295 from Banat and 70 from Srem.
Insurance Claim Payout and Sum Insured refer to the same insurance policy, with the payout determined through the insurer’s standardized damage-assessment and claim-settlement procedure. Because the response variable is expressed as the normalized Relative Damage Ratio (RDR), no additional inflation adjustment was considered necessary. Conversion from RSD to EUR affects only the reporting currency and not the RDR itself. Accordingly, the Relative Damage Ratio is interpreted as an insurance-based proxy for underlying damage severity rather than as a direct engineering measure of physical damage. In the secondary diagnostic models, Sum Insured is treated exclusively as a contractual policy amount and not as a physical building characteristic or a proxy for structural vulnerability.
The archive contains no direct personal identifiers or exact addresses. A non-identifying row identifier was assigned before modelling to ensure that preprocessing, block assignment and analytical outputs remained fully auditable. Detailed audit results, variable definitions and the complete data audit protocol are provided in Supplementary Table S1.
3.2. Analytical Variables
The primary modelling variables are the Relative Damage Ratio (Di), maximum wind speed (Hi) and policy Sum Insured (Si). Maximum wind speed, available for all claims (8.2–30.8 m/s), serves as the primary hazard predictor. Month, year, region and meteorological station are retained for descriptive analysis and for constructing the calendar-month blocks used in out-of-sample validation. The 802 claims form 51 observed year–month blocks, with block sizes ranging from 1 to 93 claims.
3.3. Scope of the Estimand
The dataset contains paid claims rather than the complete population of exposed policies, including zero-loss properties. Let Ci = 1 denote an observed paid claim. The primary estimand is the conditional probability of exceeding an RDR threshold given maximum wind speed among observed claims. The secondary diagnostic estimand additionally conditions on policy Sum Insured:
where Di denotes the Relative Damage Ratio for claim i, Hi the corresponding maximum wind speed, Si the policy Sum Insured, Ci = 1 an observed paid claim, and τs the predefined threshold for damage state s.
Pr(Di ≥ τs∣Hi, Ci = 1), Pr(Di ≥ τs∣Hi, Si,Ci = 1)
Neither estimand represents an unconditional portfolio probability because the exposure denominator is unavailable. Consequently, all estimates and interpretations are conditional on claim occurrence. The principal notation used throughout the modelling framework is summarized in Appendix A, Table A1.
3.4. Insurance-Based Relative Damage Ratio
Let Li denote the Insurance Claim Payout for claim i and Si the corresponding policy Sum Insured. The Relative Damage Ratio is defined as
The Relative Damage Ratio expresses Insurance Claim Payout as a percentage of the corresponding policy Sum Insured, thereby providing a normalized measure of insurance-based damage severity that is comparable across claims with different insured amounts. Because Di is a ratio, conversion from RSD to EUR affects only the reporting currency and not the value of the response variable. Because Sum Insured is the denominator of the RDR, its additional use as a predictor in the secondary diagnostic models introduces mathematical coupling with the response and is therefore treated as a diagnostic adjustment rather than as independent physical vulnerability information.
3.5. Crisp Damage-State Benchmark
Let τ1 < τ2<⋯<τS denote ordered thresholds of the Relative Damage Ratio (RDR). The crisp exceedance label for observation i and threshold s is defined as
xis = 1{Di ≥ τs}, xis ∈ {0,1}
Before model implementation, the damage-state thresholds were specified according to insurance interpretation, the empirical distribution of the Relative Damage Ratio and predefined minimum-support requirements. Three thresholds were adopted: τ1 = 0.25%, τ2 = 0.75% and τ3 = 1.50%. The predefined thresholds, transition half-widths and minimum-support criteria are summarized in Table 2. The thresholds and transition half-widths were fixed before predictive performance evaluation and were not selected by performance-driven tuning. Their influence on model performance was examined separately in the sensitivity analyses presented in Section 3.12.
Table 2.
Predefined damage-state thresholds, transition half-widths and minimum-support criteria.
Empirical support comprised 532 exceedances across 45 calendar-month blocks for DS1, 204 exceedances across 35 blocks for DS2 and 81 exceedances across 25 blocks for DS3. The corresponding transition bands were [0.20, 0.30], [0.65, 0.85] and [1.30, 1.70]% RDR, containing 100, 72 and 29 claims, respectively. All predefined thresholds satisfied the minimum-support criterion.
3.6. Soft-Label Transition Bands
Crisp damage-state thresholds introduce an algorithmic discontinuity when continuous Relative Damage Ratio (RDR) values are converted into ordered exceedance labels. In this study, boundary uncertainty refers to the representational ambiguity introduced by this deterministic thresholding operation near fixed damage-state boundaries. The thresholds themselves are not treated as random. To represent boundary uncertainty, a symmetric transition band, Bs = [τs − hs, τs + hs], with half-width hs > 0 is defined around each threshold. For claim i, the piecewise-linear soft exceedance target is
where zis denotes the soft exceedance target for claim i and threshold s.
This construction preserves binary labels outside the transition bands. The primary half-widths are h1 = 0.05, h2 = 0.10 and h3 = 0.20 percentage points of RDR. The adopted transition bands [0.20, 0.30], [0.65, 0.85] and [1.30, 1.70]% RDR are ordered and non-overlapping, satisfying τs + hs ≤ τs+1 − hs+1 and therefore preserving zi1 ≥ zi2 ≥ zi3 for every observation. Alternative transition widths are assessed in the predefined sensitivity analyses. The primary half-widths are therefore treated as predeclared sensitivity parameters rather than statistically estimated optimal values. The membership function is used only to implement gradual boundary transitions, not as a stand-alone fuzzy inference system [26,28,29].
For fixed hs > 0, perturbing τs by Δ changes any soft label by at most ∣Δ∣/(2hs) (Appendix A.2, Proposition A3), replacing the unit jump of the crisp indicator by a continuous response. This is a property of the target construction; fitted-model stability is evaluated separately through calendar-month-blocked validation, paired bootstrap comparison and threshold-perturbation analyses.
The zis values are cumulative exceedance targets and therefore are ordered rather than constrained to sum to one. When mutually exclusive soft state weights are required for interpretation, they are obtained as
qi0 = 1 − zi1,
qis = zis − zi,s+1, s = 1,…,S − 1,
qiS = ziS.
qis = zis − zi,s+1, s = 1,…,S − 1,
qiS = ziS.
Under the ordering condition, all qis are non-negative and sum to one (Appendix A.2, Proposition A2).
A soft label quantifies ambiguity in assigning an observed insurance-based Relative Damage Ratio to a threshold-defined exceedance class. It does not represent the probability that a future claim will exceed that threshold. The fitted exceedance surface, ps(H,S), retains its probabilistic interpretation.
3.7. Exceedance-Curve Family
The primary experiment compares two jointly constrained models that differ only in target representation: H0 uses hard exceedance labels, and S0 uses soft exceedance labels, both conditioned on maximum wind speed. A secondary diagnostic matched pair, H1 and S1, additionally includes policy Sum Insured as an adjustment variable.
Let
denote the standardized natural logarithm of policy Sum Insured, where the centering and scaling parameters are estimated exclusively from the corresponding training split. For damage state s, the adjusted exceedance probability is defined as
where αs is the state-specific intercept, βH is the common log-wind coefficient, and βS is the common standardized log-Sum-Insured coefficient. The latter is interpreted as an associational adjustment rather than as a physical vulnerability parameter. The common-slope specification provides a parsimonious primary model and, together with the ordered-intercept parameterization described in Section 3.9, enforces ordinal coherence by construction. The common-slope assumption is additionally examined through a state-specific-slope sensitivity analysis reported in the Supplementary Materials. A probit link is retained as the prespecified link-function sensitivity analysis.
Maximum wind speed is represented continuously as ln(Hi), facilitating comparison with conventional fragility formulations. Yum et al. [25] is retained as the application-specific literature benchmark for crisp insurer-data exceedance curves.
3.8. Soft-Label Estimation Objective
For soft targets, zis, model parameters are estimated by maximizing a fractional cross-entropy estimation objective. Joint estimation across the three damage states uses the sum of the state-specific objectives:
The jointly constrained model maximizes ℓ(θ), with equal weight assigned to each state-specific contribution, subject to the ordered-intercept parameterization described in Section 3.9. No regularization or additional penalty term is included.
Because zis is a constructed fractional target rather than an observed Bernoulli outcome, Equations (8) and (9) are interpreted as an M-estimation objective rather than as a generative probability model. Predictive uncertainty is assessed through calendar-month-blocked validation and blocked bootstrap resampling rather than through Hessian-based standard errors. As hs → 0, zis converges to xis, and the objective function reduces to the conventional Bernoulli objective.
Equations (8) and (9) may also be interpreted as weighting the positive and negative Bernoulli contributions by zis and 1 − zis, respectively. Consequently, observations located near damage-state boundaries contribute graded evidence rather than binary assignments, whereas observations outside the transition bands retain the standard hard-label contribution.
3.9. Ordinal Non-Crossing Constraints
For ordered damage states, the probability of exceeding a lower threshold cannot be smaller than the probability of exceeding a higher threshold for the same predictors. The joint estimator therefore enforces
throughout the predictor domain.
The primary implementation uses a common-slope cumulative logistic specification and enforces ordinal coherence through the intercept parameterization. Define
and parameterize the intercepts as
where γ12 and γ23 are unconstrained parameters. Because the inverse-logit link is monotone and predictor slopes are shared across damage states, this parameterization guarantees
for every predictor combination, not only at a finite set of enforcement points.
softplus(u) = log(1 + eu)
The hard-label and soft-label objectives were optimized using the L-BFGS-B algorithm with analytic gradients and prevalence-based initial intercepts. The same ordered-intercept parameterization was applied to H0, S0, H1 and S1 so that the matched comparisons differed only in target representation and, for H1 and S1, the inclusion of policy Sum Insured. All outer-fold and bootstrap models were fitted using the same specification.
The ordered-intercept parameterization guarantees ordinal coherence by construction but does not imply improved discrimination, calibration or threshold stability. These predictive properties were evaluated independently through the validation and sensitivity-analysis protocols described in Section 3.11 and Section 3.12.
3.10. Computational Workflow
The computational workflow consists of the following steps:
- Data preparation: Audit and anonymize the 802-claim dataset and define the 51 calendar-month validation blocks.
- Predefinition of modelling parameters: Apply the predefined damage-state thresholds τ = (0.25,0.75,1.50)% and transition half-width h = (0.05,0.10,0.20) percentage points of Relative Damage Ratio (RDR). Estimate all training-specific transformation and standardization parameters exclusively from the current training split.
- Model construction: Construct the hard and soft exceedance targets and fit the matched primary (H0/S0) and secondary diagnostic (H1/S1) model pairs using the same ordinal constraints and estimation procedure.
- Model evaluation: Generate predictions for the held-out calendar-month blocks and evaluate discrimination, calibration, proper scoring rules and boundary stability.
- Uncertainty assessment: Quantify uncertainty in the performance differences between hard-label and soft-label models using paired calendar-month-block bootstrap resampling.
3.11. Validation Framework
The audited archive contains the year and month of claim occurrence but no exact claim dates or storm-event identifiers. Validation therefore uses calendar-month blocks, with all claims from one year–month combination assigned to the same block. The 51-block design preserves the strongest temporal grouping supported by the source archive and prevents potentially related claims from the same observed monthly period from being split between training and test data. Calendar-month blocking is consistent with recommendations to keep temporally or contextually dependent observations grouped during validation [31,42,43]. The complete validation hierarchy is summarized in Supplementary Table S3.
3.11.1. Calendar-Month Blocking
Each observed year–month combination defines one indivisible validation block. Block sizes range from 1 to 93 claims (median, 8). Because calendar-month block sizes varied substantially, equal-block weighting was used for Brier scores and cross-entropy to prevent larger calendar-month blocks from dominating these performance measures; consequently, smaller and larger blocks contribute equally at the block level. Meteorological station and geographic location are retained as descriptive variables but are not used to construct additional event identifiers.
3.11.2. Blocked Out-of-Sample Evaluation
Primary performance estimates were obtained using five grouped outer folds constructed from the 51 calendar-month blocks. Entire blocks were assigned to individual folds while maintaining an approximately balanced distribution of observations across folds. Damage-state thresholds, transition widths, link function and ordinal model specification were fixed before performance evaluation. No performance-driven tuning of the predefined thresholds, transition widths or model specification was performed. All preprocessing parameters, including predictor transformations and standardization constants, were estimated exclusively from the corresponding training partition. Predictions from the five held-out outer folds were pooled for the final performance assessment. Leave-one-year-out validation across 2013–2018 and a probit-link specification were evaluated as predefined sensitivity analyses.
3.11.3. Calendar-Month-Blocked Bootstrap
Uncertainty in matched comparisons was quantified using a paired bootstrap of the 51 calendar-month blocks with B = 1000 replicates. For Brier-score, cross-entropy and calibration-slope differences, the bootstrap resampled the pooled out-of-fold predictions; the same sampled blocks and their multiplicities were used for both models in each matched pair. Calibration slope was refitted within every bootstrap sample. Percentile 95% confidence intervals were defined by the 2.5th and 97.5th percentiles of the bootstrap replicate differences. Threshold-stability intervals used the same paired block-resampling principle but additionally refitted the relevant H0/S0 models under each predefined threshold perturbation. Accordingly, the paired bootstrap confidence intervals for the primary performance differences quantify uncertainty in the matched out-of-fold comparisons conditional on the fitted outer-fold models; they do not incorporate additional variability from reconstructing the outer folds or refitting the complete model-training procedure within each bootstrap replicate.
The matched experimental design is summarized in Table 3.
Table 3.
Experimental design of the matched hard-label and soft-label comparisons.
Additional benchmark and diagnostic analyses are reported in the Supplementary Materials and are not included in the primary matched comparisons summarized in Table 3.
3.11.4. Evaluation Metrics
Model performance was evaluated on held-out crisp exceedance outcomes defined at the central damage-state thresholds. Using the same evaluation target for both hard-label and soft-label models ensured a direct comparison independent of the target representation used during model training.
For calendar-month block b containing nb held-out claims, let xis denote the observed crisp exceedance outcome and the corresponding out-of-fold predicted probability. The primary Brier score is the equal-block-weighted average
where Bobs denotes the number of observed calendar-month blocks and nb the number of held-out claims in block b.
Cross-entropy was computed using the same equal-block-weighted aggregation. Calibration intercept, calibration slope and AUC were calculated from all pooled out-of-fold predictions, so blocks containing only one observed class did not produce undefined block-specific AUC values. All reported performance measures were computed exclusively from untouched outer-test predictions. AUC is treated as a secondary point-estimate measure of discrimination; no claim of a statistically resolved AUC difference is made.
Ordinal coherence was assessed by the count, rate and maximum magnitude of curve crossings over the common diagnostic predictor domain. Boundary stability was assessed by refitting under predefined threshold shifts and measuring the normalized integrated absolute distance from the corresponding central-threshold curve. Together, these analyses evaluate empirical robustness separately from the formal continuity of the soft-label construction.
3.12. Robustness and Sensitivity Analyses
The robustness of the proposed framework was evaluated through a series of predefined sensitivity analyses designed to assess the influence of key modelling assumptions and specification choices. The following analyses were performed:
- Threshold perturbation: The primary H0/S0 wind-only models were refitted after shifting each central threshold by δ∈{−0.50hs,−0.25hs,+0.25hs,+0.50hs}, while the remaining thresholds and the model specification were kept unchanged.
- Transition-width sensitivity: Transition half-width multipliers of 0, 0.50, 1.00, 1.50 and 2.00 were evaluated within the same five grouped outer folds. A multiplier of 0 corresponds to the limiting hard-label formulation. All models were evaluated against the same central hard-label outcomes, with all preprocessing repeated exclusively within each training split.
- Predictor specification: The primary H0/S0 wind-only models were compared with the secondary H1/S1 models including standardized log(Sum Insured).
- Model specification: The primary logistic link was replaced with a probit link, and independently fitted hard-label and soft-label diagnostic models were used only for diagnostic assessment of potential ordinal crossings.
- State-specific-slope specification: To assess whether the common-slope assumption could mask differences between hard-label and soft-label models, an additional sensitivity analysis allowed the log-wind coefficient to vary across damage states. Hard-label and soft-label state-specific-slope models were evaluated using the same five calendar-month-blocked outer folds and the same held-out crisp outcomes as the primary analysis. Non-crossing was enforced over the observed wind-speed range (8.2–30.8 m/s). Full specification and results are reported in the Supplementary Materials.
- Validation strategy and threshold stability: Leave-one-year-out validation across 2013–2018 was used as the temporal sensitivity analysis. Threshold stability was quantified by the normalized integrated absolute distance between the perturbed and central exceedance curves:
4. Results
The results are organized according to the three predefined research questions. RQ1 evaluates predictive performance; RQ2 examines reliability through calibration, bootstrap uncertainty and ordinal coherence; and RQ3 assesses robustness to transition-width, threshold and model-specification perturbations.
4.1. RQ1: Does Soft-Label Representation Improve Predictive Performance?
4.1.1. Matched Exceedance Surfaces
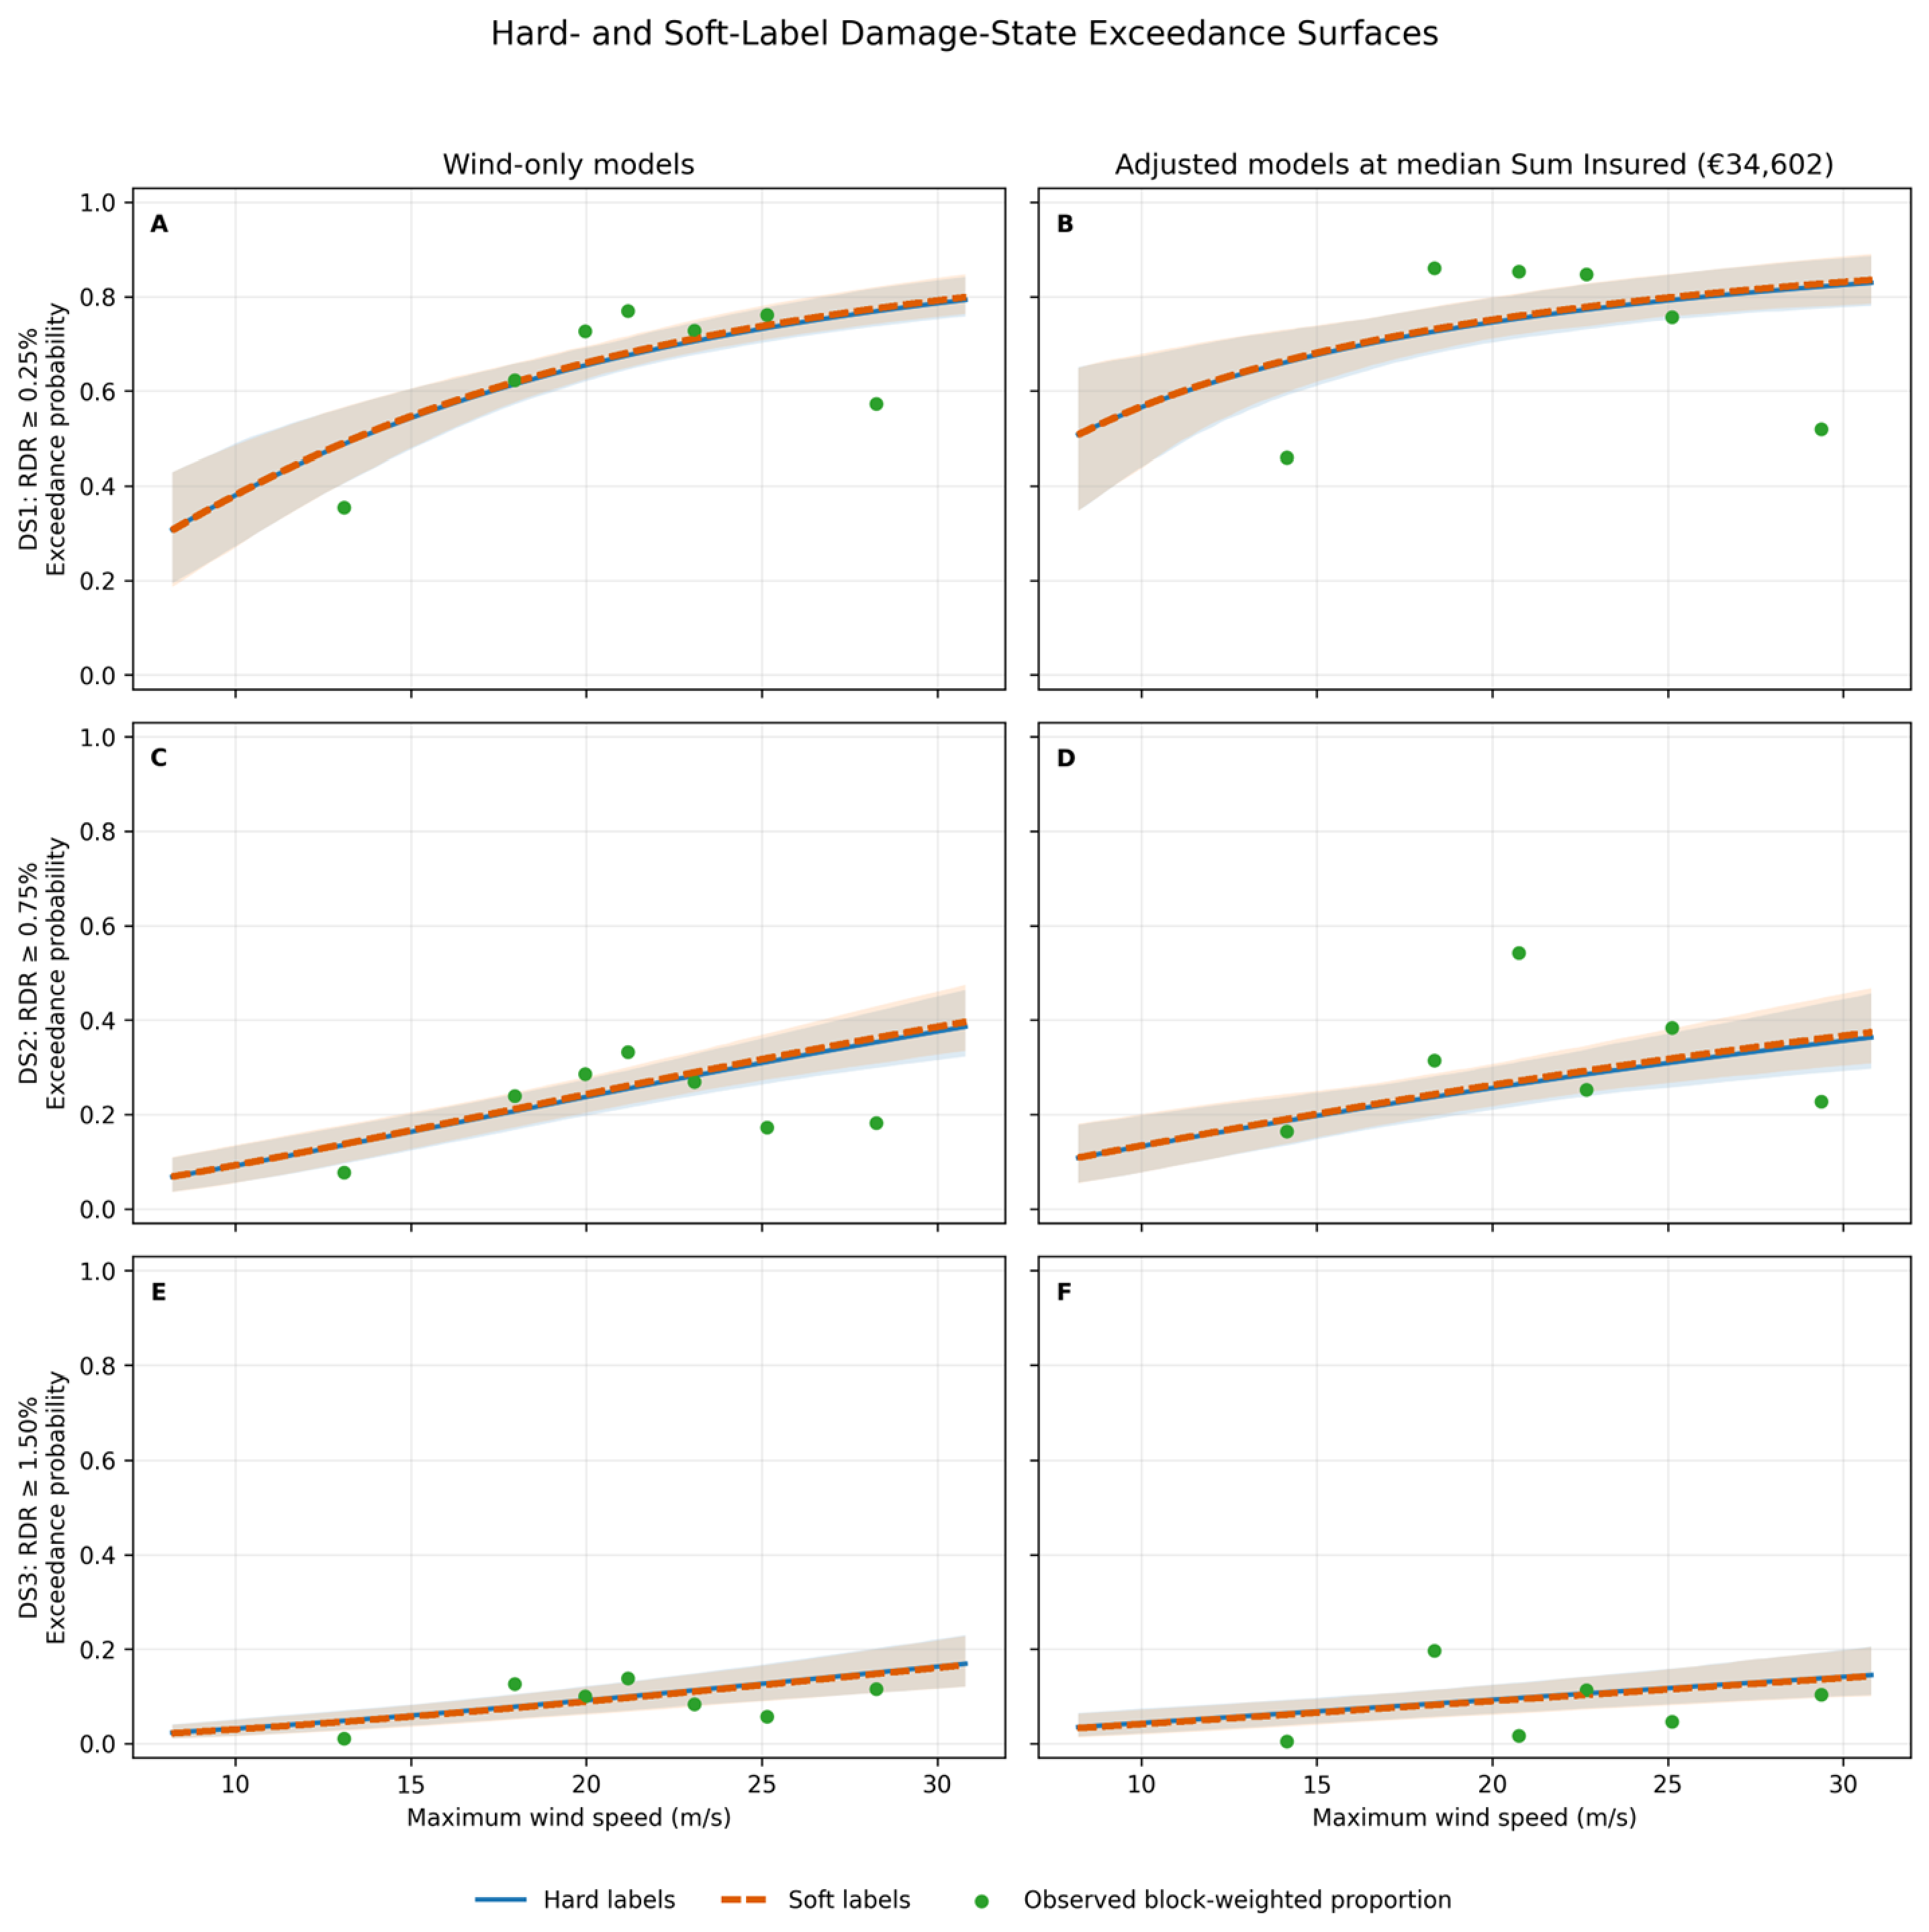
The audited RDR distribution was strongly right-skewed (median, 0.392%; interquartile range, 0.190–0.769%; mean, 0.657%), while maximum wind speed had a median of 21.4 m/s (interquartile range, 18.8–24.7 m/s). Figure 2 shows the fitted H0–S0 and H1–S1 surfaces together with equal-block-weighted observed proportions. Within every damage state, the hard-label and soft-label curves were almost superimposed across the observed wind range, and their 95% block-bootstrap bands overlapped nearly completely. The fitted exceedance probability increased with wind speed and decreased with damage-state severity. The secondary models evaluated at the median Sum Insured exhibited the same hard–soft overlap, indicating that the representation effect remained small under the diagnostic specification including Sum Insured.
Figure 2.
Matched hard-label and soft-label exceedance surfaces for DS1–DS3: (A) DS1, primary wind-only specification (H0/S0); (B) DS1, secondary specification (H1/S1) evaluated at the median Sum Insured (€34,602); (C) DS2, primary wind-only specification (H0/S0); (D) DS2, secondary specification (H1/S1) evaluated at the median Sum Insured (€34,602); (E) DS3, primary wind-only specification (H0/S0); (F) DS3, secondary specification (H1/S1) evaluated at the median Sum Insured (€34,602). Lines are full-sample constrained logistic fits. Shaded regions are pointwise 2.5th–97.5th percentile bands obtained from 1000 calendar-month-block bootstrap refits. Observed proportions were computed using six predefined wind-speed intervals spanning the observed wind-speed range. Within each interval, the plotted value represents the equal-block-weighted exceedance proportion and is displayed at the interval mean maximum wind speed. For the secondary diagnostic models, observed proportions were computed from claims in the middle Sum Insured tertile.
4.1.2. Held-Out Predictive Performance
Table 4 summarizes the calendar-month-blocked out-of-sample performance across the five grouped outer validation folds. In the primary wind-only comparison, H0 and S0 produced nearly identical Brier-score, cross-entropy and AUC point estimates across all three damage states. H0/S0 AUC values were modest (approximately 0.58–0.63), indicating limited discrimination when maximum wind speed was used as the sole predictor.
Table 4.
Calendar-month-blocked out-of-sample performance of the matched hard-label and soft-label models. Brier score and cross-entropy are equal-block-weighted across calendar-month blocks. Calibration intercept, calibration slope and AUC are calculated from pooled outer-fold predictions. Lower proper-score values indicate better performance, whereas higher AUC values indicate better discrimination.
Including log(Sum Insured) in the secondary diagnostic H1 and S1 specifications reduced the Brier score and cross-entropy and increased AUC point estimates to approximately 0.76–0.80. Because Sum Insured is also the denominator of the RDR, these changes are interpreted as descriptive performance differences under a mathematically coupled diagnostic specification rather than as evidence of independent physical predictive information. Within each matched pair, the hard-label and soft-label values remained very close. Statistical inference regarding hard-versus-soft differences is based on the paired blocked-bootstrap confidence intervals reported in Table 5 rather than on AUC point estimates alone.
Table 5.
Paired calendar-month-block bootstrap differences between matched soft-label and hard-label models. Positive Brier-score and cross-entropy differences favor hard labels; confidence intervals containing zero indicate no statistically resolved difference.
4.2. RQ2: Does the Proposed Framework Remain Reliable?
Reliability was evaluated through held-out calibration, paired calendar-month-block bootstrap uncertainty and ordinal coherence. Calibration intercepts and slopes were similar within each matched model pair, with calibration slopes close to one for DS1, below one for the wind-only DS2–DS3 models and above one for the secondary diagnostic models, particularly for DS3. The paired blocked-bootstrap results are summarized in Table 5.
As shown in Table 5, the 95% calendar-month-block bootstrap confidence intervals for the differences between the soft-label and hard-label models included zero for Brier score, cross-entropy and calibration slope across all damage states in both matched comparisons (S0–H0 and S1–H1). These results indicate that the observed differences between target representations were not statistically resolved under the adopted validation protocol.
The jointly constrained models exhibited zero ordinal crossings by construction, and supplementary independently fitted diagnostic models likewise remained ordered over the observed predictor domain.
4.3. RQ3: Is the Framework Robust to Transition-Width, Threshold and Model-Specification Perturbations?
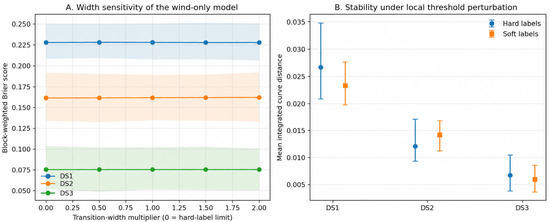
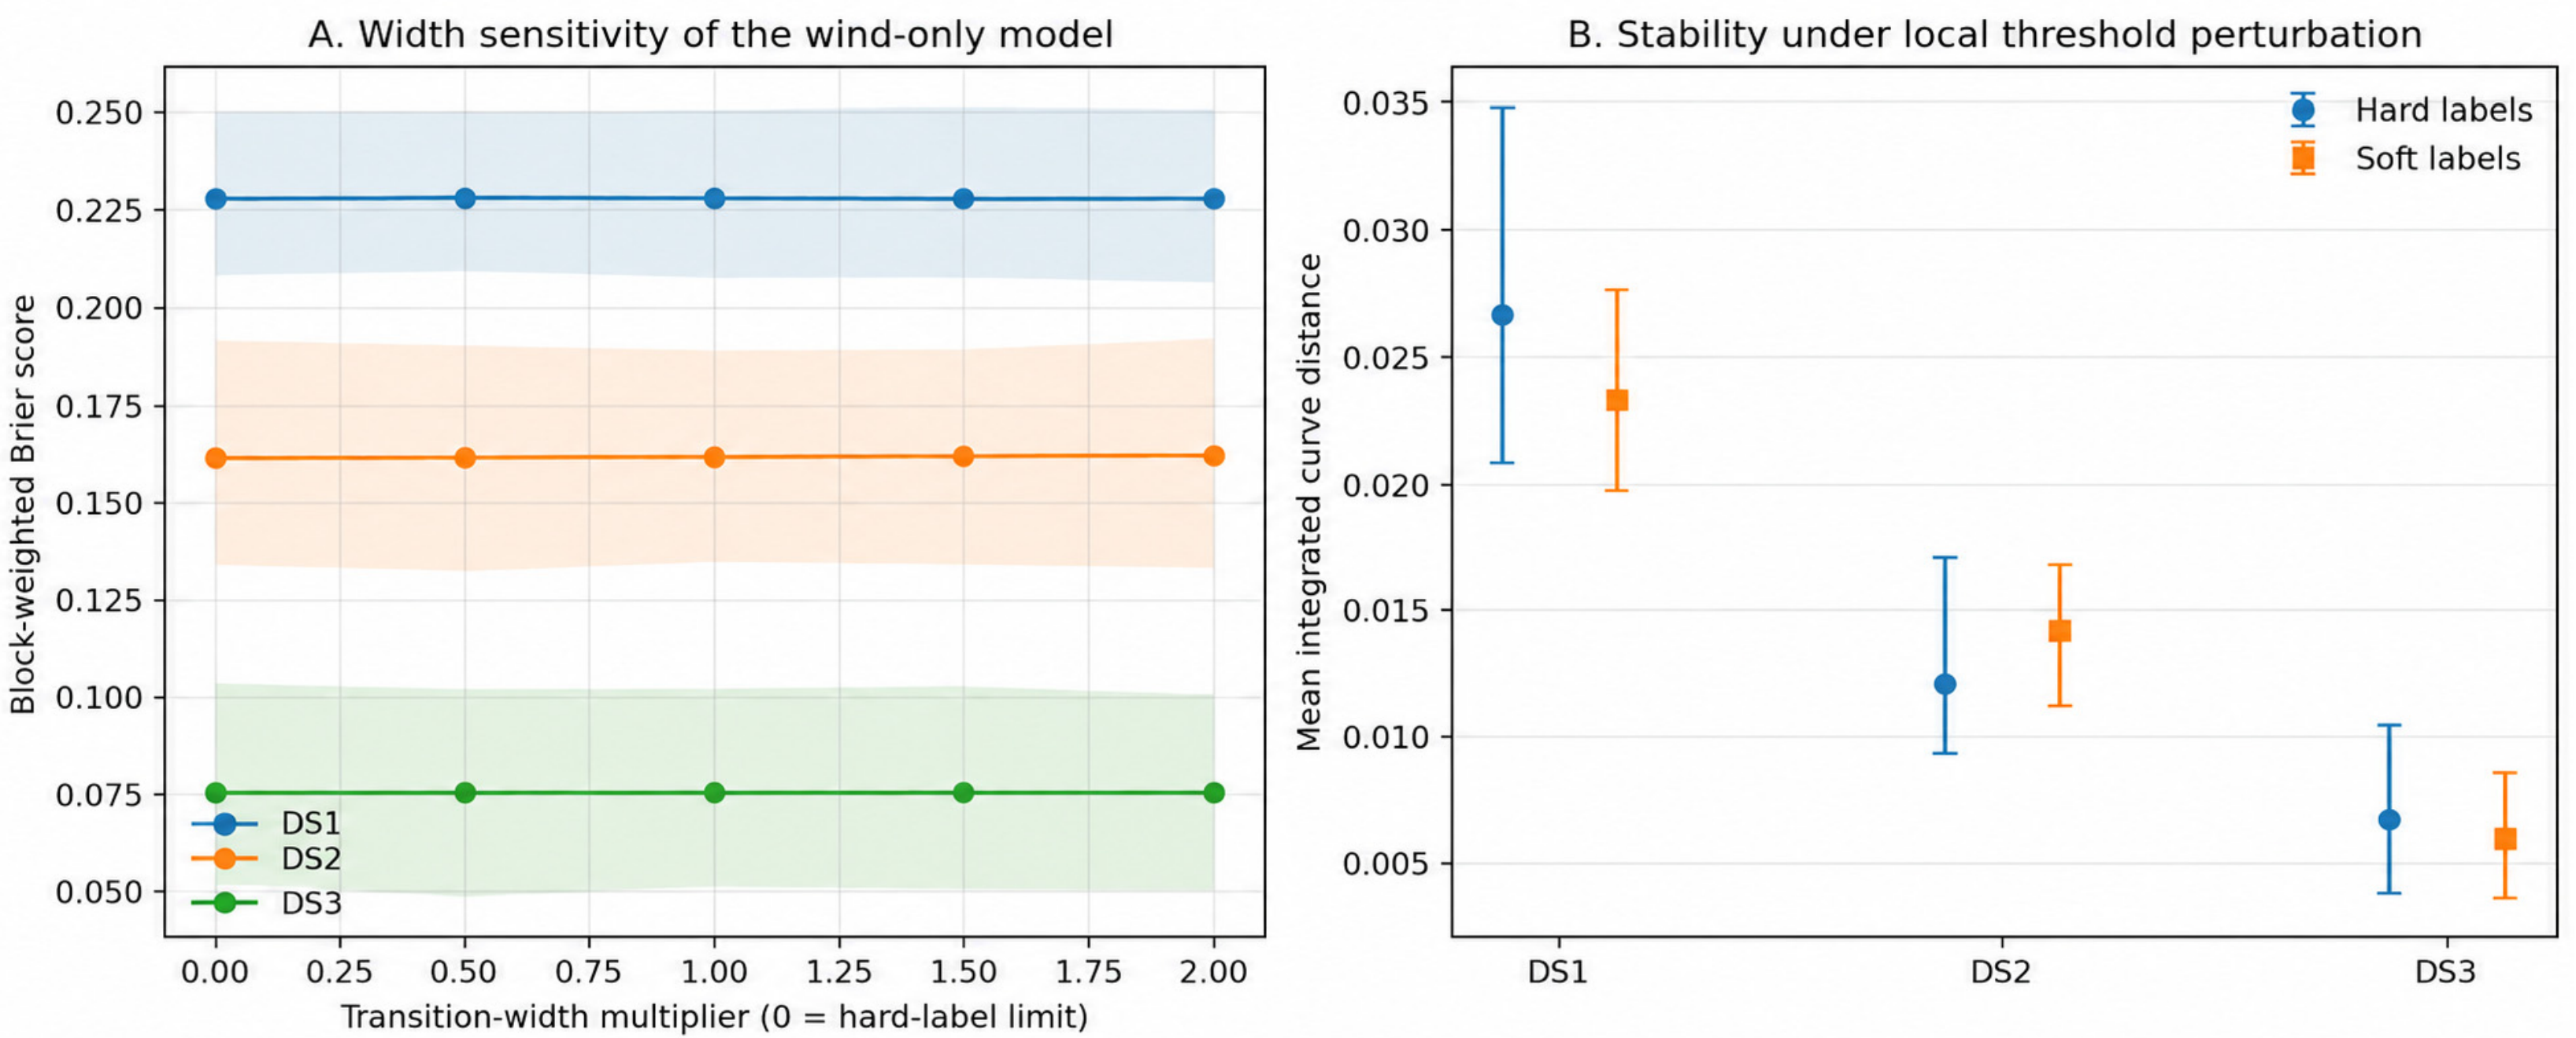
Figure 3 summarizes the robustness analyses for transition-width selection and threshold perturbation. As shown in Figure 3A, transition-width multipliers ranging from the hard-label limit (0) to twice the predefined transition widths produced only negligible changes in held-out Brier scores. Across all multipliers, the Brier score ranged from 0.2277 to 0.2281 for DS1, from 0.1613 to 0.1622 for DS2, and from 0.07545 to 0.07551 for DS3, indicating limited sensitivity to the choice of transition width.
Figure 3.
Robustness analysis. (A) Equal-block-weighted held-out Brier score for the primary wind-only model across transition-width multipliers of 0, 0.50, 1.00, 1.50 and 2.00; shaded regions represent 95% calendar-month-block bootstrap intervals. (B) Mean normalized integrated absolute change in the fitted exceedance curves after refitting under threshold shifts of ±0.25hs and ±0.50hs; error bars represent 95% paired calendar-month-block bootstrap intervals.
Figure 3B presents the response of the fitted exceedance curves to local threshold perturbations of ±0.25hs and ±0.50hs. The mean normalized integrated curve distance was smaller for the soft-label models in DS1 (0.0233 versus 0.0266) and DS3 (0.0060 versus 0.0067), whereas the hard-label model showed a smaller value in DS2 (0.0121 versus 0.0142). The corresponding soft-minus-hard differences were −0.00337, +0.00214 and −0.00077, respectively, and all 95% paired calendar-month-block bootstrap confidence intervals included zero.
Overall, the robustness analyses showed no consistent empirical advantage of either target representation with respect to threshold-perturbation stability. The state-specific-slope sensitivity analysis likewise produced closely matched hard-label and soft-label performance, with all nine paired 95% calendar-month-block bootstrap confidence intervals for Brier score, cross-entropy and calibration-slope differences, including zero (Supplementary Tables S8 and S9). Probit-link and leave-one-year-out sensitivity analyses reproduced the same substantive conclusions.
5. Discussion
This section discusses the empirical findings in relation to the three research questions, their methodological and practical implications, and the principal limitations of the proposed framework. It also considers the role of boundary representation, the interpretation of the secondary diagnostic specifications, and directions for future research.
5.1. RQ1: Predictive Effect of Soft-Label Representation
The matched exceedance surfaces and paired calendar-month-block bootstrap comparisons presented in Section 4.1 indicate that introducing soft-label transition bands had only a minor effect on the fitted exceedance curves. The matched hard-label and soft-label exceedance curves were almost superimposed for both the primary (H0–S0) and secondary diagnostic (H1–S1) model pairs, and every paired blocked-bootstrap confidence interval for Brier score and cross-entropy included zero. This finding shows that smoother target representations do not necessarily improve predictive performance and suggests that the empirical effect of boundary softening depends on the amount of information contained within the transition regions. Because only 100, 72 and 29 claims fell inside the predefined DS1–DS3 transition bands, respectively, the modified targets affected only a limited proportion of the training data. Consequently, boundary uncertainty can be represented explicitly without materially changing predictive performance, but it should be regarded as a transparent representation of uncertainty rather than as a universally superior predictive strategy. Accordingly, the principal methodological contribution of the proposed framework is not improved predictive performance but the explicit representation of boundary uncertainty within a transparent computational framework while maintaining predictive performance comparable to the matched hard-label benchmark and enforcing ordinal coherence by construction.
5.2. RQ2: Reliability, Calibration and Ordinal Coherence
The calibration analyses reported in Section 4.2 show that both target formulations produced nearly identical held-out calibration and proper-score performance when evaluated against common crisp outcomes. This distinction is methodologically important because only the training targets were modified, whereas the evaluation protocol remained identical for both approaches, allowing the influence of boundary representation itself to be isolated. Calibration summaries were similar within each matched pair, and all paired calendar-month-block bootstrap confidence intervals for proper-score and calibration-slope differences included zero, indicating that no statistically resolved differences between the hard-label and soft-label formulations were detected under the adopted validation protocol. The ordered-intercept specification guaranteed structurally non-crossing exceedance curves, while unconstrained diagnostic fits also remained ordered throughout the observed predictor range. The importance of probability calibration in trustworthy predictive modelling has also been emphasized by Nikolić et al. [39], although their study did not consider explicit boundary representations or soft-label target construction. The present study therefore complements this perspective by showing that explicit boundary-aware target construction yielded calibration metrics comparable to the matched hard-label formulation, while ordinal coherence was enforced structurally, without providing evidence of superior predictive reliability.
5.3. RQ3: Robustness to Transition-Width, Threshold and Model-Specification Perturbations
The sensitivity analyses presented in Section 4.3 demonstrate that the principal conclusions remained stable across the investigated transition-width multipliers and local threshold perturbations. Performance changed only marginally as the transition widths increased from the hard-label limit to twice their predefined values. Likewise, although soft labels produced slightly smaller normalized integrated curve distances for DS1 and DS3, the opposite tendency appeared for DS2, with all paired bootstrap confidence intervals, including zero. These findings distinguish mathematical properties of the proposed target representation from empirical properties of the fitted statistical models. The Lipschitz continuity of the soft-label construction guarantees smoother target assignment around conventional thresholds, but it should not be interpreted as implying improved predictive stability under sampling variability. These results suggest that the empirical robustness of the fitted models depends more strongly on the amount of information available near the damage-state boundaries than on the choice between crisp and soft target representations alone. The state-specific-slope sensitivity analysis further showed that this conclusion was not attributable solely to the common-slope restriction: despite allowing the log-wind effect to vary across damage states, all nine paired 95% calendar-month-block bootstrap confidence intervals for hard-label versus soft-label performance differences included zero (Supplementary Tables S8 and S9).
5.4. Comparison with Insurance-Data Benchmarks
The proposed computational framework complements rather than replaces previous insurance-based damage-modelling approaches [14,25]. As summarized in Table 1, the regression-based damage model of Novaković [20] estimated continuous Relative Damage Ratio values, whereas Kim et al. [14] focused on regional claim-severity modelling using insurer portfolios, and Yum et al. [25] estimated exceedance probabilities from conventionally defined crisp damage states. Within the insurer-data studies considered here, explicit treatment of the ambiguity introduced when continuous damage ratios are converted into ordered damage states has received limited attention.
By contrast, the proposed framework isolates the influence of boundary representation while keeping all other modelling components fixed. Because the predictor set, estimation procedure, ordinal constraints and validation protocol remain matched, the comparison evaluates the effect of boundary uncertainty itself rather than changes in model specification. The proposed framework therefore addresses a distinct methodological objective from previous insurer-data studies, which focused primarily on modelling claim severity or exceedance probabilities rather than on the representation of boundary uncertainty.
The secondary diagnostic analysis including log(Sum Insured) further illustrates this distinction. Although the secondary diagnostic models including log(Sum Insured) yielded higher discrimination metrics, this effect should be interpreted as an associational adjustment rather than evidence of a physical vulnerability effect, because Sum Insured is the contractual denominator of the Relative Damage Ratio rather than an independently measured building characteristic. Accordingly, these secondary diagnostic models are interpreted primarily as an extended-specification sensitivity analysis rather than as evidence of an operationally superior predictive model.
5.5. Relationship with Transparent Computational Intelligence
The proposed computational framework is consistent with principles of transparent and interpretable computational modelling, where explicit assumptions, fully specified procedures and transparent probabilistic modelling contribute to model trustworthiness [39,41]. Rather than increasing algorithmic complexity, the framework provides an auditable computational workflow in which every stage of the modelling process, from boundary representation to model validation, is explicitly specified, auditable and open to independent methodological scrutiny.
A distinguishing characteristic of the framework is that boundary uncertainty is represented explicitly rather than being absorbed into model residuals or hidden algorithmic components. Soft labels are deterministic functions of the observed Relative Damage Ratio, predefined thresholds and declared transition widths, while every predicted exceedance probability can be traced directly to observable quantities, documented transformations and documented estimation procedures. The matched evaluation presented in Section 4.1, Section 4.2 and Section 4.3 further shows that explicit representation of boundary uncertainty produced predictive performance and calibration metrics comparable to the matched hard-label formulation, while ordinal coherence was enforced by construction. The framework therefore contributes methodological transparency through explicit target construction and an auditable model specification rather than by increasing algorithmic complexity, consistent with recent developments in interpretable computational modelling [38,39]. Accordingly, the primary contribution of the proposed framework lies in providing an auditable and methodologically transparent approach to computational damage-state modelling while maintaining predictive performance comparable to the matched hard-label benchmark and making boundary assumptions explicit.
5.6. Generalization Beyond Storm-Wind Claims
Although evaluated using residential storm-wind insurance claims, the proposed framework is not hazard specific. The same form of boundary uncertainty arises whenever continuous physical or financial variables are converted into operational damage categories, including flood-depth classes, drought-severity bands, wildfire damage grades, seismic damage states and landslide-susceptibility levels. In all such applications, transition bands should be defined in the units of the underlying continuous variable, whereas predictors, grouping structures and validation strategies remain application specific. These examples should therefore be interpreted as methodological analogies rather than validated application domains. Future applications should define transition bands according to domain-specific knowledge and independently validate predictive performance and calibration. Accordingly, the proposed framework is intended as a transferable computational framework rather than as a universal set of thresholds, predictors or decision rules.
5.7. Practical Implications for Risk-Informed Decision Support
Transparent and auditable analytical workflows are an important component of trustworthy computational modelling in risk-informed decision support [21,39]. The proposed framework contributes to this objective by providing an explicit and auditable mechanism for documenting how observations located near conventional damage-state boundaries are treated during model development. As demonstrated in Section 4.1, Section 4.2 and Section 4.3, explicit boundary representation produced predictive performance and calibration metrics comparable to the matched hard-label formulation, while ordinal coherence was maintained by construction, allowing analysts to make boundary assumptions explicit without evidence of a statistically resolved loss or gain in predictive reliability. Because the available archive contains only paid insurance claims, the present framework should currently be interpreted as supporting conditional damage-severity assessment rather than insurance pricing, portfolio management or regulatory capital estimation. Those broader applications require complete exposure information, zero-loss policies, underwriting variables and richer policy-level data that are outside the scope of the present dataset. Accordingly, the practical contribution of the present study lies in providing a transparent and auditable framework for insurance-based damage-state modelling rather than replacing expert judgement or serving as a stand-alone operational decision-support system.
5.8. Limitations
Several limitations should be considered when interpreting the present findings. First, only 100, 72 and 29 observations fell within the DS1–DS3 transition bands, respectively, limiting the empirical influence of soft-label representation, particularly for the highest damage state. Second, the predefined transition widths remain domain-informed specification choices, although the sensitivity analyses in Section 4.3 indicate that the principal conclusions are robust across the investigated range. Third, the response variable represents an insurance-based proxy rather than a direct engineering measurement of physical damage. Fourth, Sum Insured is both a contractual policy amount and the denominator of the Relative Damage Ratio, introducing an inherent mathematical coupling in the secondary diagnostic models. Fifth, the paired bootstrap confidence intervals quantify uncertainty in the matched out-of-fold comparisons conditional on the fitted outer-fold models and do not incorporate additional variability from reconstructing the outer folds or refitting the complete training procedure within each bootstrap replicate. Finally, the historical archive lacks exact event identifiers and complete exposure information, including zero-loss policies. These limitations primarily constrain interpretation of the empirical case study. The findings should therefore be understood as evidence regarding the proposed computational framework rather than as definitive estimates of physical storm-wind vulnerability.
5.9. Future Work
Future research should evaluate the proposed computational framework using larger insurer archives containing exact event identifiers, richer building characteristics, independent exposure measures and a substantially larger number of observations near the upper damage-state boundaries. Future specification of transition widths could incorporate external information, expert elicitation, measurement-error information or independent validation data, particularly where larger datasets provide sufficient support for evaluating alternative boundary representations. Replication across larger insurer archives and additional hazard types will be necessary to determine whether the observed similarity of the hard-label and soft-label point estimates reflects characteristics of the present dataset or a more general property of boundary-aware ordinal modelling. Such studies will help establish the conditions under which explicit representation of boundary uncertainty produces measurable empirical effects in transparent computational modelling and risk-informed decision support.
6. Conclusions
This study introduced a transparent computational framework for boundary-aware insurance-based damage-state exceedance modelling. The framework makes boundary assumptions explicit while maintaining calibration metrics comparable to the matched hard-label formulation, enforcing ordinal coherence by construction and supporting methodological transparency within an auditable modelling workflow.
The empirical evaluation on 802 residential storm-wind insurance claims found no evidence of a systematic predictive advantage of soft-label models over matched hard-label models. Across the primary matched comparisons, paired calendar-month-block bootstrap confidence intervals for proper-score differences included zero, calibration metrics remained closely matched between target formulations, and ordinal coherence was enforced by construction. Sensitivity analyses showed that the principal conclusions remained stable across the investigated transition-width and threshold perturbations, while the state-specific-slope analysis indicated that the close hard-label/soft-label agreement was not attributable solely to the common-slope restriction. These findings indicate that the primary value of the proposed framework lies not in achieving superior predictive performance but in making boundary assumptions explicit, transparent and auditable while maintaining probabilistic interpretability.
The secondary diagnostic models including log(Sum Insured) improved discrimination but require cautious interpretation because Sum Insured is both a contractual policy amount and the denominator of the Relative Damage Ratio. Consequently, these models should be interpreted as an extended-specification sensitivity analysis rather than as evidence of independent physical predictive information or an operationally superior predictive model.
Although the empirical application focuses on residential storm-wind insurance claims, the proposed computational framework is intentionally more general. The framework is intended for ordinal modelling problems in which continuous outcomes are converted into cumulative states using conventional thresholds and where uncertainty is concentrated around boundary definitions. More broadly, the study shows that explicit representation of boundary uncertainty can make target-construction assumptions transparent and auditable without increasing algorithmic complexity. The proposed framework therefore provides a fully specified computational foundation for future boundary-aware ordinal modelling in insurance and other data-constrained risk-assessment applications, subject to application-specific definition and independent validation of boundary representations.
Supplementary Materials
The following supporting information can be downloaded at: https://www.mdpi.com/article/10.3390/computation14100238/s1, Table S1: Verified analytical variables and audit findings; Table S2a: Predeclared thresholds and empirical support; Table S2b: Transition-band support and regional composition; Table S3: Validation hierarchy and leakage controls; Table S4: Ordinal-coherence diagnostics; Table S5: Transition-width sensitivity of the primary wind-only model. Calendar-month-block-weighted Brier score evaluated against the central hard-label outcomes; Table S6: Sensitivity of Brier score to temporal validation and cumulative link. Entries are DS1/DS2/DS3; Table S7: Full-sample coefficient estimates with 95% calendar-month-block bootstrap intervals. The wind coefficient multiplies ln(H), whereas the Sum Insured coefficient multiplies the standardized ln(Sum Insured); Table S8: Out-of-fold performance of hard-label and soft-label state-specific-slope models; Table S9: Paired SS−HS differences with 95% calendar-month-block bootstrap intervals.
Author Contributions
Conceptualization, T.V. and S.P.; methodology, C.L. and S.P.; software, C.L.; formal analysis, C.L.; investigation, T.V.; data curation, T.V.; validation, T.V., C.L. and S.P.; visualization, C.L.; writing—original draft preparation, T.V. and C.L.; writing—review and editing, T.V., C.L. and S.P.; supervision, S.P. All authors have read and agreed to the published version of the manuscript.
Funding
This research received no external funding.
Data Availability Statement
The claim-level data are not publicly available because they contain confidential insurance information and are subject to contractual restrictions. The analysis code is proprietary and is not publicly released. Aggregated numerical results and the methodological specification necessary to evaluate the analyses are provided in the article and Supplementary Materials.
Acknowledgments
The authors acknowledge the support of the Ministry of Science, Technological Development and Innovation of the Republic of Serbia (Contract No. 451-03-34/2026-03/200156) and the Faculty of Technical Sciences, University of Novi Sad, through the project “Scientific and Artistic Research Work of Researchers in Teaching and Associate Positions at the Faculty of Technical Sciences, University of Novi Sad 2026” (No. 01-3609/1).
Conflicts of Interest
The authors declare no conflicts of interest.
Abbreviations
The following abbreviations are used in this manuscript:
| AUC | Area under the receiver operating characteristic curve |
| DS | Damage state |
| GIS | Geographic information system |
| RDR | Relative Damage Ratio |
Appendix A
Appendix A.1 Notation
For reference, the principal notation used throughout the modelling framework is summarized in Table A1.
Table A1.
Principal notation used in the modelling framework.
Appendix A.2 Formal Properties
The proposed soft-label formulation has six formal properties relevant to its interpretation, mathematical consistency, and methodological transparency: (i) pointwise convergence to the crisp label away from the threshold as hs → 0; (ii) monotonicity of each soft exceedance label in Di; (iii) cumulative-label ordering when adjacent transition bands are ordered and non-overlapping; (iv) non-crossing fitted exceedance surfaces by construction under the ordered-intercept model; (v) recovery of a valid mutually exclusive soft state-weight distribution; and (vi) Lipschitz continuity with respect to threshold perturbation for fixed hs > 0. Proposition A1 establishes properties (i) and (ii), Proposition A2 establishes properties (iii) and (v), and Proposition A3 establishes property (vi). Property (iv) follows directly from the ordered-intercept parameterization described in Section 3.9.
Proposition A1.
For fixed τs and hs > 0, the piecewise-linear label zis defined in Equation (4) is continuous, bounded in [0,1], non-decreasing in Di, and converges pointwise to the crisp indicator xis = 1{Di ≥ τs} at every Di ≠ τs as hs → 0.
Proof of Proposition A1.
Outside the interval [τs − hs, τs + hs] , zis is constant at 0 or 1. Inside the transition band, it is affine with slope 1/(2hs) > 0 , and the interior expression equals 0 and 1 at the lower and upper endpoints, respectively. Hence, the three pieces join continuously, remain bounded in [0,1], and define a non-decreasing function of Di. For fixed Di < τs, we have Di ≤ τs − hs, for all sufficiently small hs > 0, so zis = 0 = xis. For fixed Di > τs, we have Di ≥ τs + hs, for all sufficiently small hs > 0, so zis = 1 = xis. At Di = τs, the symmetric construction yields zis = 1/2 for every hs > 0, which is why pointwise convergence is stated only for Di ≠ τs. □
Proposition A2.
Suppose the piecewise-linear transition bands are ordered and non-overlapping, so that
Then
for every observation i. Define the mutually exclusive soft state weights by
and
Then qis ≥ 0 for every state s = 0,…, S and
τs + hs ≤ τs+1 − hs+1, s = 1, …, S−1.
1 ≥ zi1 ≥ zi2≥⋯≥ziS ≥ 0
qi0 = 1 − zi1,
qis = zis − zi,s+1, s = 1, …, S − 1,
qis = zis − zi,s+1, s = 1, …, S − 1,
qiS = ziS.
Proof of Proposition A2.
Consider any adjacent pair s and s + 1 . If zi,s+1 = 0 , then zi,s ≥ 0 = zi,s+1. If zi,s+1 > 0, then Di > τs+1 − hs+1. By the non-overlap condition,
and therefore zis = 1 ≥ zi,s+1. Hence zis ≥ zi,s+1 for every Di and every adjacent pair s, s + 1, which establishes
Consequently,
Finally, the sum telescopes:
□
τs + hs ≤ τs+1 − hs+1 < Di,
1 ≥ zi1 ≥ zi2≥⋯≥ziS ≥ 0.
qi0 = 1 − zi1 ≥ 0, qis = zis − zi,s+1 ≥ 0, qiS = ziS ≥ 0.
Proposition A3.
For fixed Di and hs > 0, let denote the piecewise-linear label defined in Equation (4). For any threshold perturbation, ∆,
Hence, the label is Lipschitz continuous with respect to τs, with Lipschitz constant 1/(2hs).
Proof of Proposition A3.
Write
where
The clipping operator is 1-Lipschitz. Replacing τ by τ+∆ changes the unclipped argument by −∆/(2h), so the clipped value changes by at most |∆|/(2h). For fixed D, in contrast, the crisp indicator 1{D ≥ τ}, viewed as a function of τ, is discontinuous at τ = D. This proposition concerns the stability of the constructed labels. The stability of the fitted exceedance curves is evaluated empirically through the threshold-perturbation analyses described in Section 3.12. □
clip(u,0,1) = min{1,max{0,u}}.
References
- Klawa, M.; Ulbrich, U. A model for the estimation of storm losses and the identification of severe winter storms in Germany. Nat. Hazards Earth Syst. Sci. 2003, 3, 725–732. [Google Scholar] [CrossRef] [Scilit]
- Heneka, P.; Hofherr, T.; Ruck, B.; Kottmeier, C. Winter storm risk of residential structures—Model development and application to the German state of Baden-Württemberg. Nat. Hazards Earth Syst. Sci. 2006, 6, 721–733. [Google Scholar] [CrossRef] [Scilit]
- Heneka, P.; Ruck, B. A damage model for the assessment of storm damage to buildings. Eng. Struct. 2008, 30, 3603–3609. [Google Scholar] [CrossRef] [Scilit]
- Heneka, P.; Hofherr, T. Probabilistic winter storm risk assessment for residential buildings in Germany. Nat. Hazards 2011, 56, 815–831. [Google Scholar] [CrossRef] [Scilit]
- Donat, M.G.; Pardowitz, T.; Leckebusch, G.C.; Ulbrich, U.; Burghoff, O. High-resolution refinement of a storm loss model and estimation of return periods of loss-intensive storms over Germany. Nat. Hazards Earth Syst. Sci. 2011, 11, 2821–2833. [Google Scholar] [CrossRef] [Scilit]
- Etienne, C.; Beniston, M. Wind storm loss estimations in the Canton of Vaud (Western Switzerland). Nat. Hazards Earth Syst. Sci. 2012, 12, 3789–3798. [Google Scholar] [CrossRef] [Scilit]
- Vickery, P.J.; Skerlj, P.F.; Lin, J.; Twisdale, L.A., Jr.; Young, M.A.; Lavelle, F.M. HAZUS-MH hurricane model methodology. II: Damage and loss estimation. Nat. Hazards Rev. 2006, 7, 94–103. [Google Scholar] [CrossRef] [Scilit]
- Ellingwood, B.R.; Rosowsky, D.V.; Li, Y.; Kim, J.H. Fragility assessment of light-frame wood construction subjected to wind and earthquake hazards. J. Struct. Eng. 2004, 130, 1921–1930. [Google Scholar] [CrossRef] [Scilit]
- Pinelli, J.-P.; Simiu, E.; Gurley, K.; Subramanian, C.; Zhang, L.; Cope, A.; Filliben, J.J.; Hamid, S. Hurricane damage prediction model for residential structures. J. Struct. Eng. 2004, 130, 1685–1691. [Google Scholar] [CrossRef] [Scilit]
- Khanduri, A.C.; Morrow, G.C. Vulnerability of buildings to windstorms and insurance loss estimation. J. Wind Eng. Ind. Aerodyn. 2003, 91, 455–467. [Google Scholar] [CrossRef] [Scilit]
- Kim, J.M.; Woods, P.K.; Park, Y.J.; Kim, T.; Son, K. Predicting hurricane wind damage by claim payout based on Hurricane Ike in Texas. Geomat. Nat. Hazards Risk 2016, 7, 1513–1525. [Google Scholar] [CrossRef] [Scilit]
- Katz, R.W. Stochastic modeling of hurricane damage. J. Appl. Meteorol. Clim. 2002, 41, 754–762. [Google Scholar] [CrossRef] [Scilit] [PubMed]
- Khajwal, A.B.; Noshadravan, A. Probabilistic hurricane wind-induced loss model for risk assessment on a regional scale. ASCE-ASME J. Risk Uncertain. Eng. Syst. Part A Civ. Eng. 2020, 6, 04020020. [Google Scholar] [CrossRef] [Scilit]
- Kim, J.M.; Kim, T.; Son, K. Revealing building vulnerability to windstorms through an insurance claim payout prediction model: A case study in South Korea. Geomat. Nat. Hazards Risk 2017, 8, 1333–1341. [Google Scholar] [CrossRef] [Scilit]
- Walker, G.R. Modelling the vulnerability of buildings to wind—A review. Can. J. Civ. Eng. 2011, 38, 1031–1039. [Google Scholar]
- Watson, C.C.; Johnson, M.E. Hurricane loss estimation models: Opportunities for improving the state of the art. Bull. Am. Meteorol. Soc. 2004, 85, 1713–1726. [Google Scholar] [CrossRef] [Scilit]
- Merz, B.; Kreibich, H.; Schwarze, R.; Thieken, A. Assessment of economic flood damage. Nat. Hazards Earth Syst. Sci. 2010, 10, 1697–1724. [Google Scholar] [CrossRef] [Scilit]
- Gerl, T.; Kreibich, H.; Franco, G.; Marechal, D.; Schröter, K. A review of flood loss models as basis for harmonization and benchmarking. PLoS ONE 2016, 11, e0159791. [Google Scholar] [CrossRef] [Scilit] [PubMed]
- Dottori, F.; Figueiredo, R.; Martina, M.L.V.; Molinari, D.; Scorzini, A.R. INSYDE: A synthetic, probabilistic flood damage model based on explicit cost analysis. Nat. Hazards Earth Syst. Sci. 2016, 16, 2577–2591. [Google Scholar] [CrossRef] [Scilit]
- Novaković, T. Damage Function Optimization in Order to Assess Insurance Risk. Doctoral Dissertation, University of Novi Sad, Faculty of Technical Sciences, Novi Sad, Serbia, 2019. [Google Scholar]
- Nedeljković, S.; Vranić, T.; Lazić, C.; Pajić, V.; Laban, M.; Zoraja, B. A transparent framework for climate-adjusted building-level flood damage severity analysis under data-constrained conditions. Sustainability 2026, 18, 6836. [Google Scholar] [CrossRef] [Scilit]
- Vranić, T.; Popov, S.; Simić, J.; Ralević, N.; Krstanović, L. A similarity-based fuzzy framework for flood damage assessment under data-scarce conditions. Mathematics 2026, 14, 760. [Google Scholar] [CrossRef] [Scilit]
- Ćosić, Đ.; Popov, S.; Novaković, T.; Popović, L. Flood damage assessment method: GIS-based approach. Fresenius Environ. Bull. 2019, 28, 1896–1904. [Google Scholar]
- Popov, S.; Popović, L.; Ćosić, Đ.; Novaković, T.; Ćurčić, K. Geography of Things based flood risk insurance modelling. Int. J. Simul. Model. 2020, 19, 267–278. [Google Scholar] [CrossRef] [Scilit]
- Yum, S.-G.; Kim, J.-M.; Wei, H.-H. Development of vulnerability curves of buildings to windstorms using insurance data: An empirical study in South Korea. J. Build. Eng. 2021, 34, 101932. [Google Scholar] [CrossRef] [Scilit]
- Zadeh, L.A. Fuzzy sets. Inf. Control 1965, 8, 338–353. [Google Scholar] [CrossRef] [Scilit]
- Huang, C.F. Fuzzy risk assessment of urban natural hazards. Fuzzy Sets Syst. 1996, 83, 271–282. [Google Scholar] [CrossRef] [Scilit]
- Zimmermann, H.-J. Fuzzy Set Theory and Its Applications, 4th ed.; Springer: Dordrecht, The Netherlands, 2001. [Google Scholar] [CrossRef] [Scilit]
- Klir, G.J. Uncertainty and Information: Foundations of Generalized Information Theory; Wiley: Hoboken, NJ, USA, 2006. [Google Scholar]
- Shinozuka, M.; Feng, M.Q.; Lee, J.; Naganuma, T. Statistical analysis of fragility curves. J. Eng. Mech. 2000, 126, 1224–1231. [Google Scholar] [CrossRef] [Scilit]
- De Silva, D.G.; Kruse, J.B.; Wang, Y. Spatial dependencies in wind-related housing damage. Nat. Hazards 2008, 47, 317–330. [Google Scholar] [CrossRef] [Scilit]
- de Moel, H.; Aerts, J.C.J.H. Effect of uncertainty in land use, damage models and inundation depth on flood damage estimates. Nat. Hazards 2011, 58, 407–425. [Google Scholar] [CrossRef] [Scilit]
- Hasanzadeh Nafari, R.; Ngo, T.; Lehman, W. Calibration and validation of FLFArs—A new flood loss function for Australian residential structures. Nat. Hazards Earth Syst. Sci. 2016, 16, 15–27. [Google Scholar] [CrossRef] [Scilit]
- Li, Y.; Ellingwood, B.R. Hurricane damage to residential construction in the US: Importance of uncertainty modeling in risk assessment. Eng. Struct. 2006, 28, 1009–1018. [Google Scholar] [CrossRef] [Scilit]
- Wang, C.; Zhang, H.; Feng, K.; Li, Q. Assessing hurricane damage costs in the presence of vulnerability model uncertainty. Nat. Hazards 2017, 85, 1621–1635. [Google Scholar] [CrossRef] [Scilit]
- Díaz, R.; Marathe, A. Soft labels for ordinal regression. In Proceedings of the IEEE/CVF Conference on Computer Vision and Pattern Recognition (CVPR), Long Beach, CA, USA, 15–20 June 2019; pp. 4738–4747. [Google Scholar] [CrossRef] [Scilit]
- Vargas, V.M.; Gutiérrez, P.A.; Barbero-Gómez, J.; Hervás-Martínez, C. Soft labelling based on triangular distributions for ordinal classification. Inf. Fusion 2023, 93, 258–267. [Google Scholar] [CrossRef] [Scilit]
- Bulat, A.; Kiseleva, E.; Yakovlev, S.; Prytomanova, O.; Lebediev, D. Solving the problem of fuzzy partition-distribution with determination of the location of subset centers. Computation 2024, 12, 199. [Google Scholar] [CrossRef] [Scilit]
- Villamil, H.C.; Espitia, H.E.; Bejarano, L.A. Multiobjective optimization of fuzzy system for cardiovascular risk classification. Computation 2023, 11, 147. [Google Scholar] [CrossRef] [Scilit]
- Zhao, T.; Zhang, Y.; Miao, D. Intuitionistic fuzzy-based three-way label enhancement for multi-label classification. Mathematics 2022, 10, 1847. [Google Scholar] [CrossRef] [Scilit]
- Nikolić, M.; Nikolić, D.; Stefanović, M.; Koprivica, S.; Stefanović, D. Mitigating algorithmic bias through probability calibration: A case study on lead generation data. Mathematics 2025, 13, 2183. [Google Scholar] [CrossRef] [Scilit]
- Hastie, T.; Tibshirani, R.; Friedman, J. The Elements of Statistical Learning: Data Mining, Inference, and Prediction, 2nd ed.; Springer: New York, NY, USA, 2009. [Google Scholar]
- Allgaier, J.; Pryss, R. Cross-validation visualized: A narrative guide to advanced methods. Mach. Learn. Knowl. Extr. 2024, 6, 1378–1388. [Google Scholar] [CrossRef] [Scilit]

Disclaimer/Publisher’s Note: The statements, opinions and data contained in all publications are solely those of the individual author(s) and contributor(s) and not of MDPI and/or the editor(s). MDPI and/or the editor(s) disclaim responsibility for any injury to people or property resulting from any ideas, methods, instructions or products referred to in the content. |
© 2026 by the authors. Licensee MDPI, Basel, Switzerland. This article is an open access article distributed under the terms and conditions of the Creative Commons Attribution (CC BY) license.