Article

GAD-YOLO: A Multi-Level Feature Enhancement Network for Dense Small Traffic Object Detection in Intelligent Transportation Systems

College of Mathematics and Computer Science, Dali University, Dali 671003, China
*
Author to whom correspondence should be addressed.
Information 2026, 17(8), 797; https://doi.org/10.3390/info17080797
Submission received: 25 July 2026 / Revised: 17 August 2026 / Accepted: 18 August 2026 / Published: 19 August 2026

Abstract

Dense small traffic object detection is essential for intelligent transportation systems but remains challenging because distant targets contain limited visual details, densely distributed objects frequently overlap, and complex road backgrounds introduce substantial interference. To address these limitations, this study proposes GAD-YOLO, a multi-level feature enhancement network based on YOLOv9. Ghost-MSConv performs lightweight multi-receptive-field feature extraction in the backbone, Mixed Local Channel Attention combines local spatial relationships with global channel dependencies during feature refinement, and DySample performs content-adaptive point sampling during feature upsampling. In the primary experiments on a six-class traffic object dataset derived from UA-DETRAC, GAD-YOLO achieved a precision of 78.9%, a recall of 76.4%, an mAP 50 of 82.8%, and an mAP 50 : 95 of 65.5%. Compared with YOLOv9c, precision, recall, mAP 50 , and mAP 50 : 95 increased by 5.4, 0.5, 3.1, and 4.8 percentage points, respectively. Under the complexity statistics used in the primary experiments, GAD-YOLO contains 25.455 M parameters and requires 102.4 GFLOPs, compared with 25.442 M parameters and 103.2 GFLOPs for YOLOv9c. Additional experiments on the public VisDrone2019-DET benchmark were conducted to evaluate cross-dataset applicability, small-object performance, scene-density sensitivity, and standardized inference efficiency. On the VisDrone2019-DET test-dev set, GAD-YOLO improved mAP 50 and mAP 50 : 95 from 26.5% and 15.7% to 27.1% and 16.3%, respectively. A COCO-style analysis further showed that AP S increased from 6.72% to 7.31%, while the dense-subset mAP 50 : 95 increased from 13.95% to 14.44%. Under an RTX 4090, batch-size-one, 640 × 640 , FP32 inference protocol, GAD-YOLO achieved a mean latency of 9.98 ms and a throughput of 100.20 FPS. These results show that GAD-YOLO improves the primary traffic object detection task and yields modest positive performance differences on an independent public benchmark under the fixed experimental setting, while maintaining real-time inference capability.

1. Introduction

Accurate traffic object detection is an important component of intelligent transportation systems (ITS), supporting traffic-flow monitoring, pedestrian and vehicle tracking, congestion analysis, autonomous driving, and road-safety management [1]. With the increasing deployment of roadside cameras, unmanned aerial vehicles, and urban surveillance systems, traffic object detectors must process scenes containing substantial scale variation, complex backgrounds, partial occlusions, and densely distributed objects. These conditions are particularly challenging for small and distant targets because they occupy limited image regions and contain weak texture, boundary, and structural information.
Deep learning has substantially improved object detection performance. Two-stage detectors first generate candidate regions and then perform object classification and bounding-box regression. Faster R-CNN, for example, introduces a region proposal network that shares convolutional features with the detection network [2]. Although two-stage detectors generally provide reliable localization, their sequential processing procedures may introduce additional inference overhead in real-time traffic-monitoring applications.
One-stage detectors directly predict object categories and bounding boxes from input images and therefore provide a more favorable balance between accuracy and computational efficiency. The YOLO family has progressively improved network architecture, multi-scale prediction, feature aggregation, and training strategies [3,4,5,6,7]. YOLOv9 introduces the Generalized Efficient Layer Aggregation Network (GELAN) and Programmable Gradient Information (PGI) to improve feature aggregation and gradient propagation [8]. These characteristics make YOLOv9 a suitable baseline for examining feature-enhancement strategies in dense traffic scenes.
Nevertheless, three limitations remain relevant to dense small traffic object detection. First, repeated downsampling reduces the spatial resolution of shallow features and may remove the weak textures and boundaries associated with small targets. Convolution operations using a single receptive field may also be insufficient to represent both local object details and surrounding context. Second, densely distributed pedestrians, bicycles, and vehicles frequently overlap or appear close to one another. Feature responses from adjacent objects may therefore become ambiguous, reducing classification and localization reliability. Third, fixed interpolation-based upsampling uses predefined sampling positions that do not adapt to object boundaries or local feature structures. Consequently, spatial information lost during downsampling may not be accurately reconstructed.
To address these limitations, this study proposes GAD-YOLO, a multi-level feature enhancement framework based on YOLOv9. The framework coordinates feature processing at three complementary stages. Ghost-MSConv is introduced into the backbone to extract lightweight multi-scale representations using different receptive fields. Mixed Local Channel Attention (MLCA) [9] is employed during feature refinement to combine local spatial relationships with global channel dependencies. DySample [10] replaces fixed upsampling with content-adaptive point sampling to improve spatial-detail reconstruction. Ghost-MSConv is the task-oriented feature-extraction component developed in this study, whereas MLCA and DySample are adopted existing operations. The methodological contribution therefore lies in their stage-specific coordination within the YOLOv9 feature hierarchy rather than in claiming that all three operations are individually new.
The proposed framework is first evaluated through comparative, ablation, class-wise, and qualitative experiments on a six-class traffic object dataset derived from UA-DETRAC. These experiments constitute the primary evaluation of the proposed architecture. To supplement the primary results and improve the public reproducibility of the evaluation, YOLOv9c and the complete GAD-YOLO model are additionally retrained and evaluated on VisDrone2019-DET, a public benchmark containing aerial images with substantial object-scale variation, dense object distributions, occlusion, truncation, and complex urban backgrounds [11].
In the supplementary VisDrone evaluation, the terms “small” and “dense” are quantitatively defined. Object scales follow the COCO area criteria: objects with areas below 32 2  pixels are defined as small, objects with areas from 32 2 to 96 2 pixels are defined as medium, and objects with areas above 96 2 pixels are defined as large. Image density is determined from the number of annotated objects per image. Based on the test-dev distribution, images containing no more than 25 objects are treated as sparse, images containing 26–48 objects are treated as moderately dense, and images containing more than 48 objects are treated as dense.
The main contributions of this study are summarized as follows:
  • A stage-aligned feature enhancement architecture is constructed for dense small traffic object detection. The architecture coordinates lightweight multi-receptive-field extraction, local–global attention refinement, and content-adaptive spatial reconstruction at different positions in the YOLOv9 feature hierarchy.
  • A multi-scale feature extraction module, termed Ghost-MSConv, is developed for the backbone. It combines inexpensive Ghost feature generation [12] with parallel receptive fields to preserve local textures and contextual structures before repeated downsampling. MLCA and DySample are subsequently placed at the feature-refinement and upsampling stages according to their respective functional roles.
  • Primary comparative and ablation experiments on the reannotated UA-DETRAC-derived dataset show that GAD-YOLO achieves an mAP 50 of 82.8% and an mAP 50 : 95 of 65.5%, outperforming YOLOv9c by 3.1 and 4.8 percentage points, respectively. Component-level and pairwise ablations further provide empirical evidence regarding the individual and complementary behavior of Ghost-MSConv, MLCA, and DySample under the archived training configurations.
  • Supplementary experiments on VisDrone2019-DET provide public-benchmark evidence under different categories, aerial viewpoints, object scales, and density distributions. GAD-YOLO improves mAP 50 and mAP 50 : 95 by 0.6 percentage points, increases AP S from 6.72% to 7.31%, and increases dense-subset mAP 50 : 95 from 13.95% to 14.44%.
  • A standardized inference benchmark reports FP32 and FP16 latency, throughput, and peak GPU memory under a common RTX 4090 protocol. GAD-YOLO retains approximately 100 FPS under FP32 inference, while the measured results explicitly reveal the accuracy–efficiency trade-off introduced by the feature-enhancement operations.

2. Related Work

Research related to GAD-YOLO mainly involves real-time traffic object detection, lightweight multi-scale feature extraction, attention-based feature refinement, and adaptive feature reconstruction. This section reviews these directions and clarifies the methodological position of the proposed framework.

2.1. Real-Time Traffic Object Detection

Deep learning-based object detectors are commonly divided into two-stage and one-stage frameworks. Two-stage detectors first generate region proposals and then perform object classification and bounding-box regression. Faster R-CNN introduces a region proposal network that shares convolutional features with the detection network, substantially improving proposal generation and localization performance [2]. However, the sequential proposal and classification procedure generally incurs greater inference overhead, which may restrict deployment in real-time traffic-monitoring systems.
One-stage detectors directly predict object categories and bounding boxes from input images. YOLO formulates object detection as a unified regression problem and enables end-to-end real-time inference [3]. YOLO9000 extends this framework through joint detection and classification training [4], whereas YOLOv3 introduces multi-scale prediction to improve the detection of objects with different sizes [5]. YOLOv4 integrates architectural and training strategies to improve the balance between detection accuracy and computational efficiency [6]. YOLOv7 further develops model scaling and trainable bag-of-freebies strategies for real-time detection [7].
YOLOv9 introduces Programmable Gradient Information (PGI) and the Generalized Efficient Layer Aggregation Network (GELAN) to preserve reliable gradient information and improve feature aggregation [8]. These properties provide a suitable foundation for dense traffic object detection. Nevertheless, small and distant targets may still lose discriminative details after repeated downsampling, while densely distributed objects may produce mutually interfering feature responses.
Recent traffic-oriented detectors have introduced lightweight components, attention mechanisms, and adaptive convolutions to address these challenges. Zhao et al. developed YOLOv8-BASW through structural optimization and attention-based feature enhancement for real-time vehicle detection [13]. Song et al. combined lightweight Mamba and Vision Transformer components to improve multi-scale vehicle representation [14]. Liu et al. incorporated deformable convolution and cross-channel coordinate attention into YOLO-DC to strengthen feature adaptation in complex traffic scenes [15]. These studies demonstrate the effectiveness of improving individual feature-processing stages. However, coordinated enhancement across backbone extraction, feature refinement, and spatial reconstruction remains insufficiently investigated for dense small traffic objects.

2.2. Lightweight Multi-Scale Feature Extraction

Traffic-monitoring systems require models that retain adequate representation capacity without introducing prohibitive computational cost. Lightweight network design therefore aims to reduce redundant parameters and operations while preserving task-relevant visual information.
EfficientNet studies the relationships among network depth, width, and input resolution and proposes compound scaling to balance these dimensions [16]. Although increasing network capacity can improve recognition performance, directly enlarging a detector is unsuitable for applications with strict real-time and hardware constraints.
GhostNet observes that many convolutional feature maps contain redundant information and generates additional features from a small number of intrinsic feature maps using inexpensive linear transformations [12]. This design provides an efficient basis for lightweight feature extraction. However, a single receptive field may not adequately represent traffic targets exhibiting substantial scale variation. Small objects require fine-grained local details, whereas partially occluded or densely arranged objects also benefit from broader contextual information.
Feature Pyramid Networks construct hierarchical representations through top-down propagation and lateral connections, allowing semantic information to be utilized at multiple resolutions [17]. Nevertheless, feature pyramids mainly aggregate representations that have already been extracted. If weak textures and boundaries are removed during early downsampling, later feature fusion may not fully recover them.
The Ghost-MSConv module proposed in this study addresses this limitation at the backbone stage. It combines inexpensive Ghost feature generation with parallel depthwise convolution branches using different receptive fields. The objective is to enrich local and contextual information before repeated resolution reduction, rather than simply increasing network width or depth.

2.3. Attention-Based Feature Refinement

Attention mechanisms improve representation quality by assigning different importance weights to feature channels or spatial positions. They enable a network to emphasize task-relevant responses while suppressing irrelevant background information.
The Squeeze-and-Excitation network models channel dependencies through global feature aggregation and channel-wise recalibration [18]. It improves semantic feature selection with limited additional computation, but does not explicitly represent local spatial relationships. The Convolutional Block Attention Module combines channel and spatial attention to refine features from complementary dimensions [19]. However, attention derived from an entire feature map may incorporate irrelevant global responses, particularly when many small objects occupy only limited local regions.
Transformer-based detectors further extend global relation modeling. DETR uses Transformer encoders and decoders to formulate object detection as an end-to-end set-prediction problem [20]. Global self-attention is effective for modeling long-range dependencies, but its computational and memory costs can become substantial for high-resolution traffic imagery.
Mixed Local Channel Attention (MLCA) combines local spatial interaction with global channel dependency modeling [9]. Local pooling preserves neighborhood-level responses, while global channel information provides broader semantic guidance. This characteristic is relevant to densely distributed traffic objects, where adjacent targets may be spatially close but still require distinct feature responses. In GAD-YOLO, MLCA is adopted as an existing attention operation and positioned in the feature-refinement stage; the study does not claim MLCA itself as a newly proposed module.

2.4. Adaptive Feature Reconstruction

Repeated downsampling increases semantic abstraction but decreases feature-map resolution. This process may weaken positional, boundary, and texture information, especially for objects covering only a small number of pixels. High-resolution feature reconstruction is therefore important before final object prediction.
Nearest-neighbor and bilinear interpolation use fixed sampling positions and predefined reconstruction rules. Although computationally efficient, these methods do not adapt sampling locations to local object structures. As a result, small-object boundaries and spatial details may be inaccurately reconstructed.
CARAFE introduces content-aware feature reassembly by predicting adaptive reconstruction kernels from local features [21]. Its enlarged reassembly region improves reconstruction flexibility compared with fixed interpolation, but dynamic kernel prediction and reassembly introduce additional computation.
DySample reformulates upsampling as a dynamic point-sampling process and predicts sampling offsets directly from input features [10]. It avoids the generation of complex dynamic kernels and provides a relatively lightweight content-adaptive upsampling strategy. By adjusting sampling positions according to local feature content, DySample can better preserve object boundaries and spatial structures. In the proposed framework, DySample is adopted as an existing operator and placed in the feature-fusion path to improve the reconstruction of high-resolution features.

2.5. Research Gap and Methodological Positioning

Existing studies have separately demonstrated the value of lightweight convolution, multi-scale representation, attention-based refinement, and content-adaptive upsampling. However, directly adding several modules to a detector does not necessarily produce complementary behavior. Their effectiveness depends on whether each operation is placed at a stage consistent with its functional role.
It should also be noted that the acronym “GAD-YOLO” has been used independently in several recent studies from different application domains. Huang et al. [22] proposed a gastrointestinal abnormality detection model based on YOLOv8s, whereas Wu et al. [23] developed a sight-distance adaptive YOLOv11n-based detector for general aviation aircraft skin damage. These methods address different detection tasks, datasets, baseline architectures, and feature-processing mechanisms from those considered in this study. The use of the same acronym is therefore coincidental. In the present work, GAD-YOLO specifically denotes the YOLOv9-based stage-aligned feature-enhancement framework developed for dense small traffic object detection.
The proposed GAD-YOLO framework is therefore organized around a stage-aligned design. Ghost-MSConv is developed for early multi-receptive-field extraction in the backbone; MLCA is introduced at the feature-refinement stage to combine local spatial interaction with global channel dependencies; and DySample is used during upsampling to adaptively reconstruct spatial details. Among these components, Ghost-MSConv is the task-oriented module proposed in this study, whereas MLCA and DySample are existing methods. The contribution of GAD-YOLO lies in the coordinated feature-processing pipeline and its quantitative evaluation for small and densely distributed traffic objects, rather than in presenting all incorporated operations as individually novel.

3. Methodology

YOLOv9 combines the Generalized Efficient Layer Aggregation Network (GELAN) with Programmable Gradient Information (PGI) to improve feature aggregation and gradient propagation [8]. Although this architecture provides a strong real-time detection baseline, repeated spatial downsampling may weaken the texture and boundary information of small objects, while fixed upsampling operations cannot adapt their sampling positions to local object structures.
GAD-YOLO retains the principal GELAN, PGI, feature-fusion, and detection structures of YOLOv9 and introduces three stage-specific modifications. First, Ghost-MSConv is used in selected early downsampling positions to generate intrinsic features and additional multi-receptive-field features with inexpensive depthwise operations. Second, Mixed Local Channel Attention (MLCA) is applied to the highest-level backbone feature before spatial-pyramid aggregation to combine local spatial responses with global channel dependencies. Third, the two nearest-neighbor upsampling operations in the top-down feature-fusion path are replaced by DySample, which predicts content-dependent sampling offsets.
The three components correspond to feature extraction, feature refinement, and spatial reconstruction, respectively. The original YOLOv9 detection objective is retained so that the architectural comparison is not confounded by changes to the loss formulation. Differences in the archived learning-rate settings are reported separately in Section 4.1.

3.1. Overall Architecture

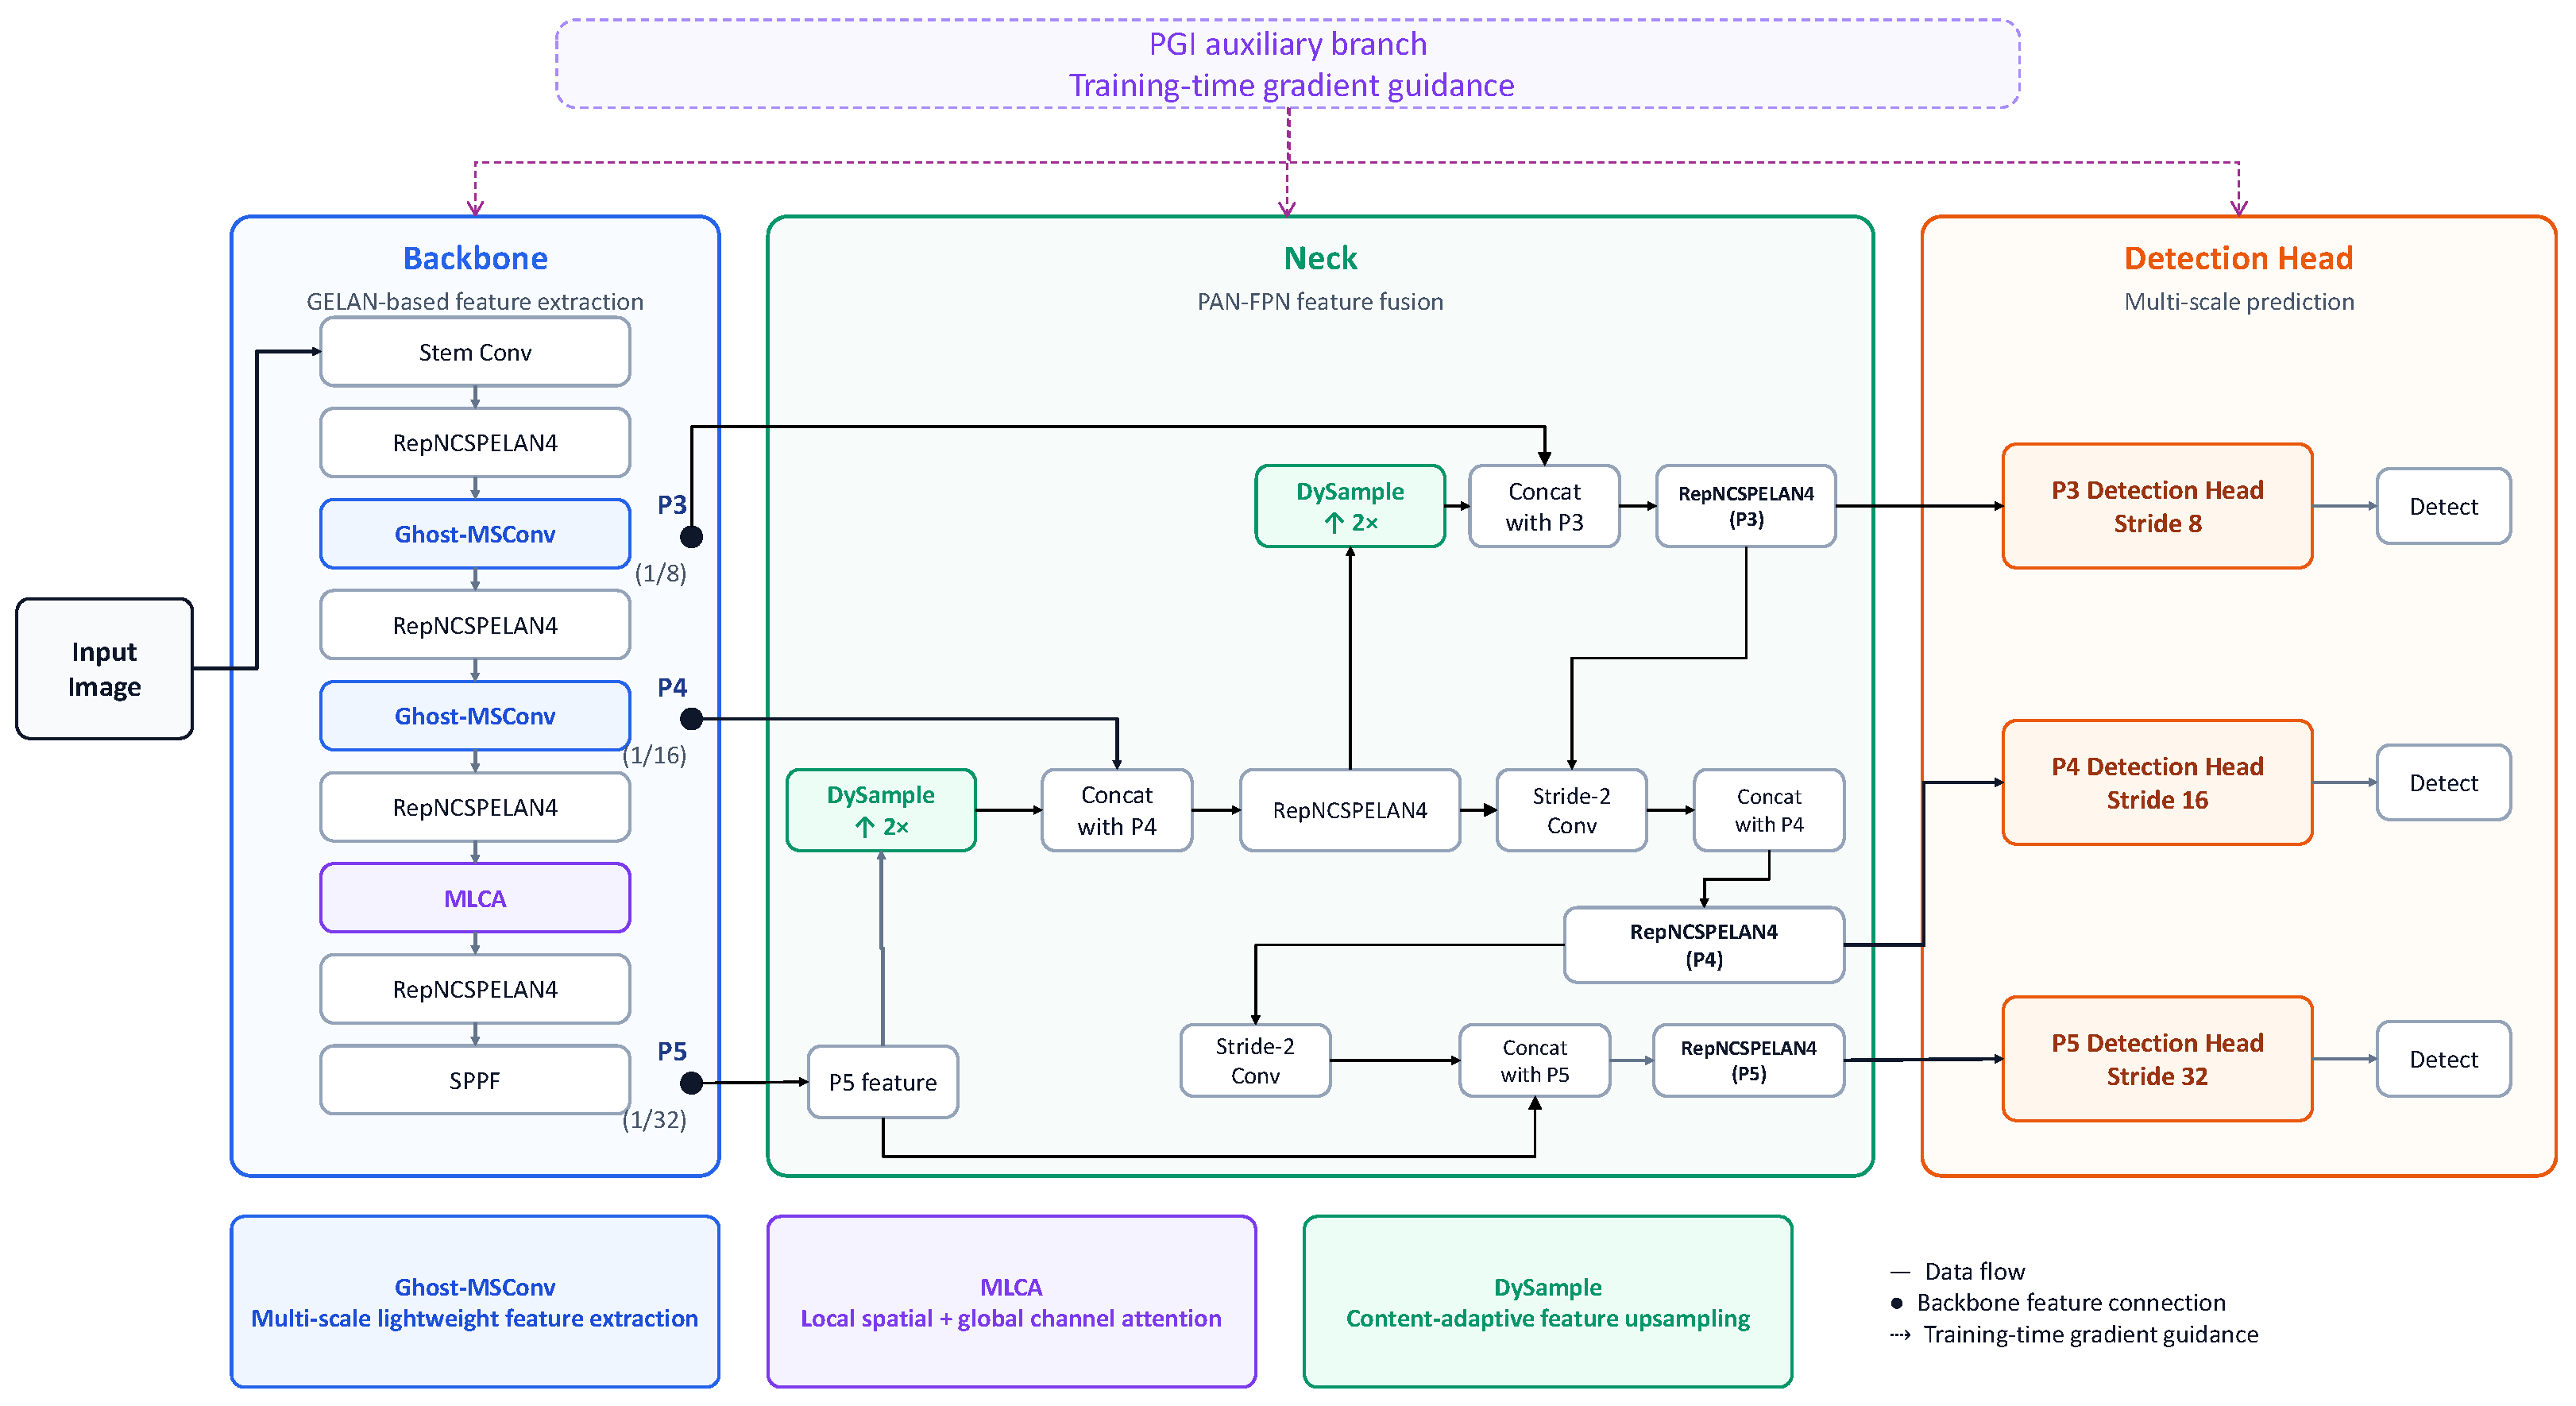
Figure 1 illustrates the overall architecture of GAD-YOLO. The network contains a GELAN-based backbone, a bidirectional multi-scale feature-fusion path, a PGI auxiliary branch, and three detection heads operating at strides of 8, 16, and 32.
In the principal feature-extraction branch, the second stride-2 convolution is replaced by Ghost-MSConv. The module produces the P 2 / 4 feature before the subsequent RepNCSPELAN4 and ADown blocks construct the P 3 / 8 , P 4 / 16 , and P 5 / 32 representations. In the PGI auxiliary branch, the first two stride-2 convolution operations are also replaced by Ghost-MSConv. These placements strengthen early feature extraction in both the principal and auxiliary training paths.
After the final backbone RepNCSPELAN4 block, MLCA refines the highest-level feature before it is processed by SPPELAN. The refined feature is then propagated through the top-down feature-fusion path. Two DySample modules, each with an upsampling factor of 2, replace the corresponding nearest-neighbor upsampling operations. The reconstructed features are concatenated with the P 4 and P 3 backbone features and subsequently processed by RepNCSPELAN4 blocks.
The bottom-up path retains the ADown, concatenation, and RepNCSPELAN4 operations of the YOLOv9c baseline. The final DualDDetect module receives three auxiliary features and three principal detection features during training. No additional prediction scale or independent detection head is introduced.

3.2. Ghost-MSConv Module

Small traffic objects generally contain weak textures, narrow boundaries, and limited shape information. A conventional convolution with a single kernel size extracts information under only one receptive field and may therefore provide insufficient local and contextual representation. Increasing the number of standard convolution branches can improve multi-scale feature extraction, but also increases computational cost.
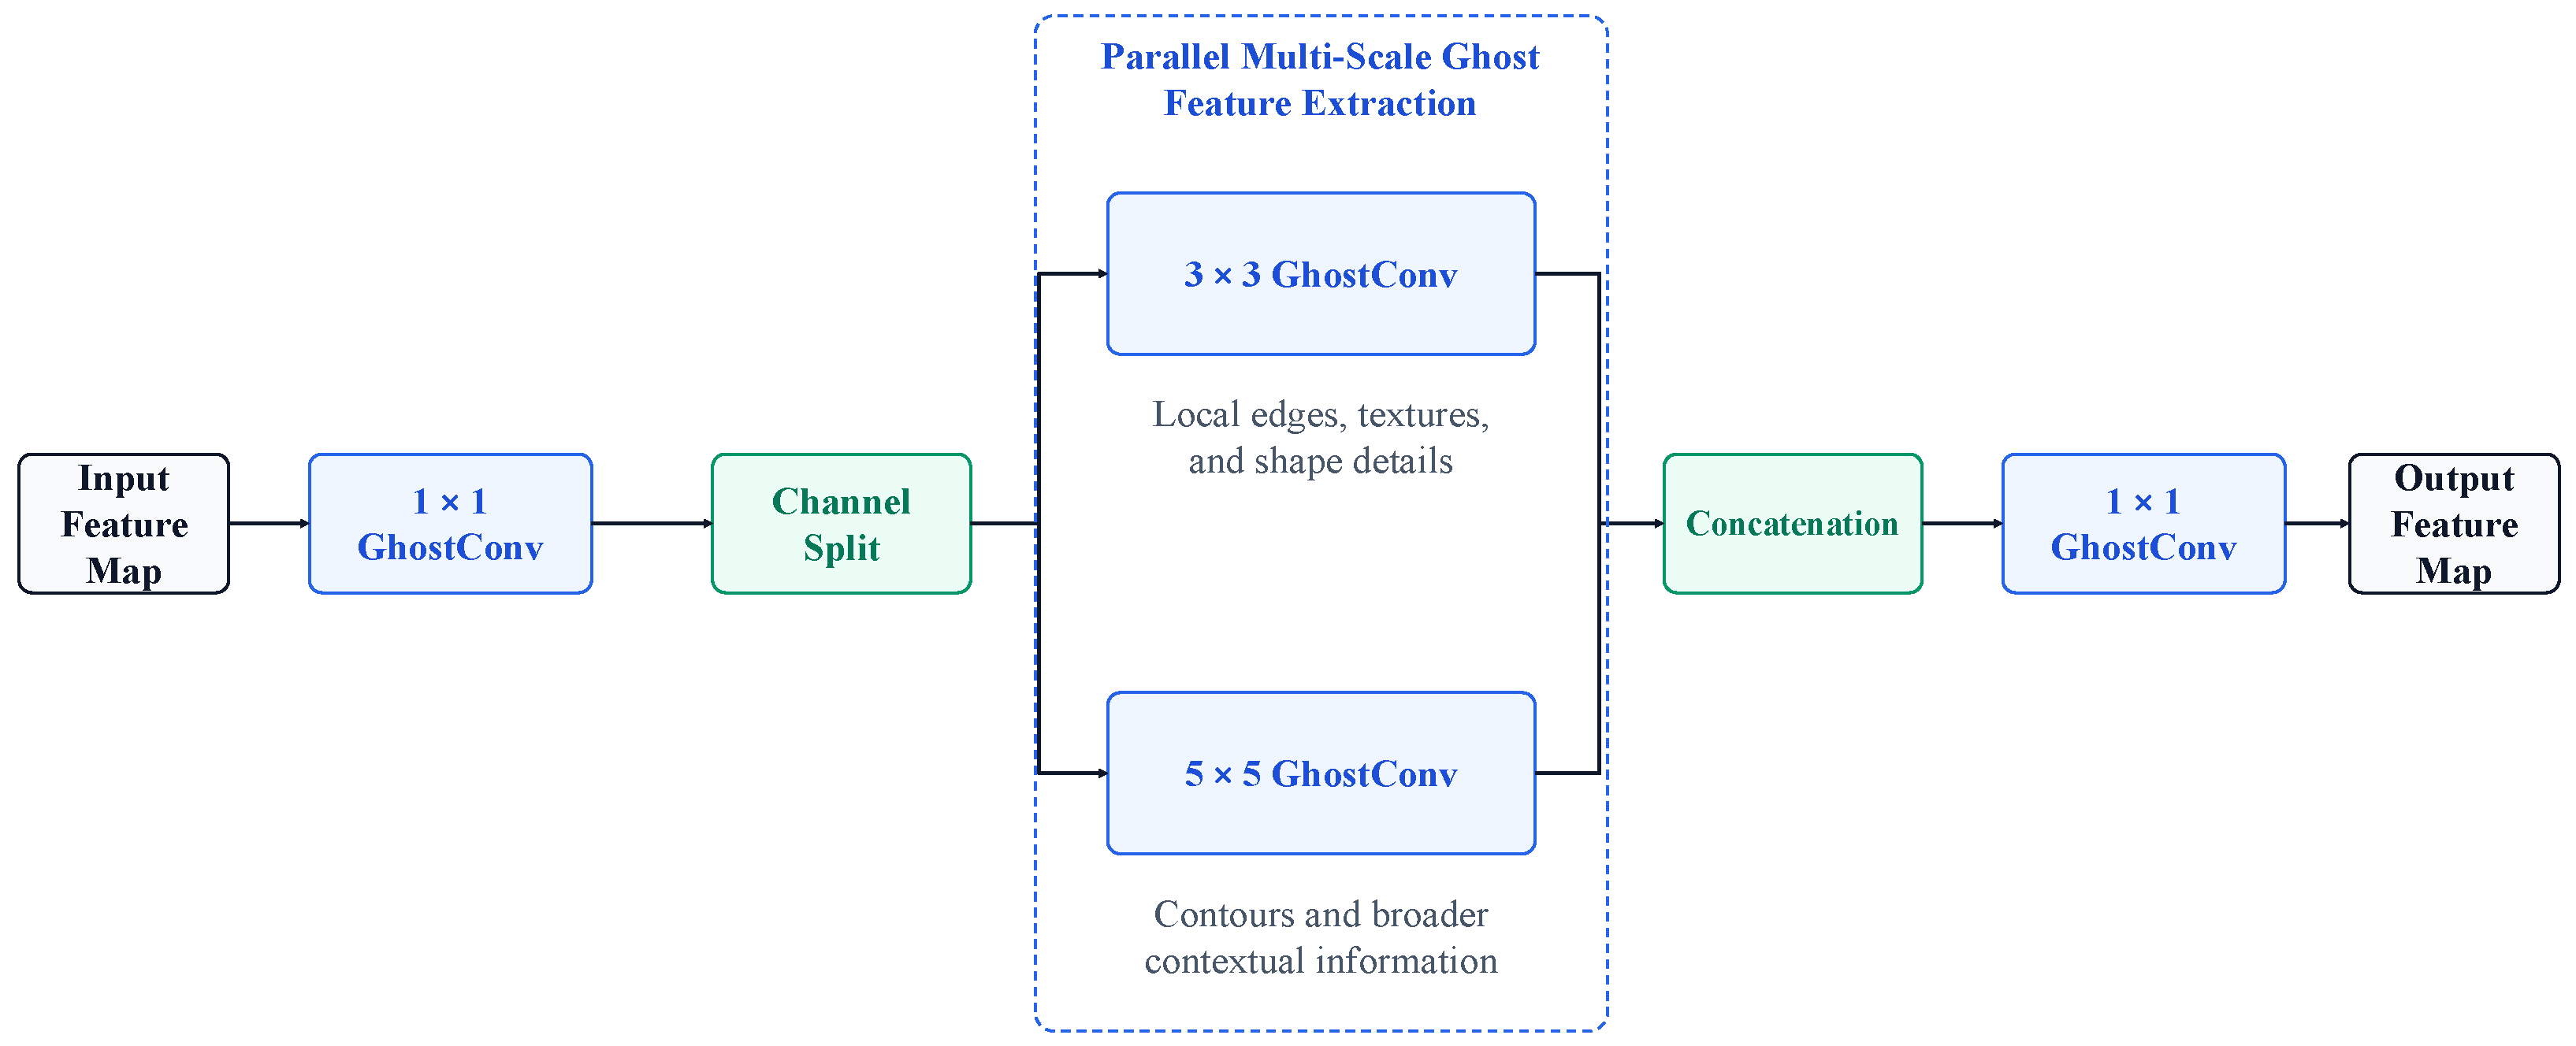
Ghost-MSConv follows the intrinsic-feature and inexpensive-feature generation principle of GhostNet [12]. Instead of generating all output channels through full convolution, the module first produces a set of primary features and then applies inexpensive depthwise convolutions with different kernel sizes to channel groups of the primary feature map.
Let the input feature map be
X R C in × H × W
A convolution block consisting of convolution, batch normalization, and SiLU activation first generates half of the target output channels:
X p = C k × k , s ( X ) , X p R C out 2 × H × W
where k and s denote the kernel size and stride of the primary convolution, respectively. In the final GAD-YOLO configuration, the Ghost-MSConv modules used for downsampling employ k = 3 and s = 2 .
The primary feature map is divided equally into two channel groups:
X p = Concat X p ( 1 ) , X p ( 2 )
where each group contains C out / 4 channels. The two groups are processed by depthwise convolutions with kernel sizes of 3 × 3 and 5 × 5 :
X 3 = DWConv 3 × 3 X p ( 1 ) , X 5 = DWConv 5 × 5 X p ( 2 )
The 3 × 3 branch emphasizes local edges, textures, and short-range spatial relationships, whereas the 5 × 5 branch captures broader object structures and contextual information. Since the number of groups in each convolution equals the number of input channels, these operations are depthwise and introduce fewer parameters than full convolutions.
The primary feature map and the two generated feature groups are concatenated, after which a 1 × 1 convolution performs channel interaction and output fusion:
F GMS = C 1 × 1 , 1 Concat X p , X 3 , X 5
The total number of channels in the concatenated tensor is
C out 2 + C out 4 + C out 4 = C out
Consequently, Ghost-MSConv enriches the primary feature map with two inexpensive receptive-field-specific transformations without expanding the final channel dimension.
The structure of the Ghost-MSConv module is illustrated in Figure 2.

3.3. Mixed Local Channel Attention

Dense traffic scenes frequently contain neighboring objects with similar appearance and partially overlapping spatial regions. Global channel attention can emphasize semantic responses, but global pooling alone may remove local spatial differences. Conversely, purely local attention may lack sufficient global semantic guidance.
MLCA combines local spatial interaction and global channel dependency modeling [9]. In GAD-YOLO, one MLCA module is placed after the final backbone RepNCSPELAN4 block and before SPPELAN.
Given an input feature map
X R C × H × W
adaptive average pooling first maps the feature map to a fixed local spatial size of 5 × 5 :
X local = AAP 5 × 5 ( X )
A global descriptor is then obtained from the local representation:
X global = AAP 1 × 1 X local
The kernel size of the one-dimensional convolution is determined from the number of input channels. The implementation first calculates
t = log 2 ( C ) + b γ
and then selects an odd kernel size:
k = t , t is odd t + 1 , t is even
where γ = 2 and b = 1 .
For the local branch, the C × 5 × 5 representation is rearranged into a one-dimensional sequence. A one-dimensional convolution is applied, and the result is restored to its local spatial structure:
A local = σ R local 1 Conv1D k R local X local
where R local ( · ) denotes the tensor rearrangement operation and σ ( · ) denotes the sigmoid function.
For the global branch, the channel descriptor is processed by a separate one-dimensional convolution:
A global = E 5 × 5 σ Conv1D k R global X global
where E 5 × 5 ( · ) maps the global channel attention to the same 5 × 5 spatial size as the local attention.
The two attention maps are combined using a weighted sum:
A mix = α A local + ( 1 α ) A global
where the local weight is fixed as α = 0.5 in the final model. The mixed attention map is mapped to the original spatial resolution and applied to the input feature:
F MLCA = X R H × W A mix
where ⊙ represents element-wise multiplication and R H × W ( · ) denotes the adaptive spatial mapping used to restore the attention map to the input resolution.
The local branch preserves neighborhood-level differences among adjacent objects, while the global branch provides channel-level semantic context. Their weighted combination allows the detector to refine local responses without discarding global category information.

3.4. Dynamic Point-Sampling Upsampling

Nearest-neighbor interpolation uses fixed sampling positions and assigns the same reconstruction rule to all input regions. Although this operation is computationally efficient, it cannot adapt to object boundaries, local textures, or spatial variations between adjacent objects.
GAD-YOLO replaces the two nearest-neighbor upsampling operations in the top-down feature-fusion path with DySample [10]. The implementation uses the linear-projection-first configuration, denoted as LP, with an upsampling factor of s = 2 , four channel groups, and no additional dynamic scope branch.
Let the input feature map be
X R B × C × H × W
where B denotes the batch size. A 1 × 1 convolution predicts the sampling-offset tensor:
O = Conv 1 × 1 ( X ) O R B × 2 g s 2 × H × W
where g = 4 denotes the number of channel groups, s = 2 is the upsampling factor, and the factor 2 represents horizontal and vertical coordinate offsets.
The predicted offsets are scaled and combined with a predefined subpixel initialization:
Δ = 0.25 O + P 0
where P 0 denotes the regular initial subpixel positions. The factor 0.25 restricts the magnitude of the initial learned displacement and stabilizes offset learning.
Let P denote the regular pixel-center coordinates of the input feature map. The sampling coordinates are normalized to the interval [ 1 , 1 ] :
Q = 2 P + Δ W H 1
where ⊘ denotes element-wise division.
Pixel Shuffle rearranges the offset dimensions into the target spatial resolution:
Q ^ = PixelShuffle s ( Q )
The input channels are divided into g groups, and group-wise bilinear grid sampling reconstructs the output feature:
F DySample = GridSample X , Q ^
where
F DySample R B × C × s H × s W
The implementation uses bilinear sampling, border padding, and align_corners=False. Unlike fixed interpolation, DySample adjusts the reconstruction positions according to the current feature content, which can preserve more boundary and positional information during high-resolution feature reconstruction.

3.5. Detection Objective

GAD-YOLO modifies the feature-processing architecture without introducing a new loss function. Both YOLOv9c and GAD-YOLO use task-aligned assignment and the same dual-branch detection objective.
The total training loss consists of Complete Intersection over Union (CIoU) regression loss, binary cross-entropy classification loss, and Distribution Focal Loss (DFL):
L = λ box L CIoU main + η L CIoU aux + λ cls L BCE main + η L BCE aux + λ dfl L DFL main + η L DFL aux
where the superscripts main and aux denote the principal and PGI auxiliary detection branches, respectively. According to the training configuration used in this study,
λ box = 7.5 , λ cls = 0.5 , λ dfl = 1.5 , η = 0.25 .
CIoU loss optimizes bounding-box overlap, center distance, and aspect-ratio consistency. Binary cross-entropy loss supervises category prediction, and DFL models the discrete probability distribution of bounding-box boundaries. The auxiliary branch provides additional gradient guidance during training, while the principal branch remains responsible for the main prediction output.
YOLOv9c and GAD-YOLO use the same assignment strategy, loss components, and loss weights. This design controls differences in the detection objective, whereas the archived learning-rate configurations are reported separately in Section 4.1.

4. Experiments and Results

4.1. Primary Dataset and Original Experimental Setup

The primary experiments were conducted using a traffic object detection dataset derived from the UA-DETRAC benchmark [24]. UA-DETRAC contains traffic-surveillance videos recorded under diverse road, illumination, weather, and traffic-density conditions. To reduce the redundancy of adjacent video frames and support multi-class traffic object detection, 8127 frames were sampled from the original videos and reannotated.
The reannotated dataset contains six traffic object categories: bus, car, bicycle, person, truck, and motorcycle. These images include distant objects, densely distributed targets, partial occlusions, and complex urban road backgrounds. Following the original experimental protocol, the dataset was divided into training, testing, and validation subsets using an approximate ratio of 7:2:1.
The archived materials do not retain sufficiently detailed records regarding the identities of the individual annotators or a formal inter-annotator agreement and annotation-quality verification protocol. Therefore, only the dataset-construction information that can be reliably verified from the archived materials is reported in this study. To reduce the reproducibility limitation associated with this historical reannotated dataset, an additional evaluation on the fully public VisDrone2019-DET benchmark is provided in Section 4.7.
The validation subset contains 829 images and 13,123 annotated object instances. Table 1 reports the number of instances in each category. The distribution is highly imbalanced, with cars accounting for most annotated objects, whereas bicycles and motorcycles occur considerably less frequently.
The original experiments were conducted on a Linux server equipped with two NVIDIA GeForce RTX 3090 GPUs (NVIDIA Corporation, Santa Clara, CA, USA), each with 24 GB of video memory. The server used an AMD EPYC 9754 processor (Advanced Micro Devices, Inc., Santa Clara, CA, USA) and 60 GB of system memory. The software environment included Python 3.8, PyTorch 2.0.0, and CUDA 11.8. Although two GPUs were installed on the server, the archived training configurations assigned each recorded run to a single GPU (device=0). Therefore, the reported primary results correspond to single-GPU training rather than distributed two-GPU training. The hardware, software, and principal training configuration used in the primary experiments are summarized in Table 2.
The archived experiments used the same dataset configuration, input resolution, training duration, batch size, optimizer type, data-augmentation configuration, loss weights, and random seed. The initial learning rate was set to 0.03 for the YOLOv9c baseline and the single-module configurations, 0.027 for the pairwise module combinations, and 0.025 for the complete GAD-YOLO model. In all cases, the learning rate was linearly reduced to 0.01 of its initial value by the end of training.
The common data-augmentation configuration included HSV perturbation with hue, saturation, and value factors of 0.015, 0.7, and 0.4, respectively; a translation factor of 0.1; a scale factor of 0.9; and a horizontal-flip probability of 0.5. Mosaic, MixUp, and Copy-Paste were applied with probabilities of 1.0, 0.15, and 0.30, respectively. Rotation, shear, perspective transformation, and vertical flipping were disabled. Mosaic augmentation was closed during the final 15 epochs.
The bounding-box regression, classification, and Distribution Focal Loss weights were set to 7.5, 0.5, and 1.5, respectively. All archived runs used a fixed random seed of 0. Consequently, the reported primary results represent the corresponding archived configurations rather than averages over repeated random seeds.

4.2. Evaluation Metrics

Precision, recall, mean average precision, parameter count, and floating-point operations are used to evaluate detection performance and model complexity in the primary experiments.
Precision measures the proportion of correctly detected objects among all positive predictions, whereas recall measures the proportion of ground-truth objects that are successfully detected:
P = T P T P + F P , R = T P T P + F N ,
where T P , F P , and F N denote the numbers of true-positive, false-positive, and false-negative predictions, respectively.
For a dataset containing C traffic object categories, the mean average precision at an intersection-over-union threshold of 0.5 is calculated as
mAP 50 = 1 C c = 1 C AP c , 0.5 ,
where AP c , 0.5 denotes the average precision of category c at an IoU threshold of 0.5.
The stricter mAP 50 : 95 metric averages AP over ten IoU thresholds from 0.50 to 0.95 at intervals of 0.05:
mAP 50 : 95 = 1 10 C c = 1 C t T AP c , t , T = { 0.50 , 0.55 , , 0.95 } .
The number of parameters, reported in millions, reflects model size, and computational complexity is evaluated using GFLOPs. The supplementary VisDrone experiment further reports scale-specific AP, density-specific AP, forward-pass latency, throughput, and peak allocated GPU memory.

4.3. Selection of the Baseline Model

Before constructing GAD-YOLO, representative models from YOLOv5 to YOLOv10 were evaluated under the primary dataset and original experimental conditions. The comparison includes YOLOv5m [25], YOLOv6m [26], YOLOv7 [7], YOLOv8m [27], YOLOv9c [8], and YOLOv10l [28]. The results are presented in Table 3.
This comparison is restricted to detectors that were evaluated under the same archived primary protocol. Although Transformer-based and two-stage detectors are discussed in Section 2, published results from different datasets or training protocols are not directly merged into Table 3, because such cross-study numerical comparisons would not provide a controlled benchmark. Accordingly, the present experimental comparison is intended to evaluate GAD-YOLO relative to its direct architectural family rather than to establish universal superiority over all detector families.
Among the unmodified detectors, YOLOv10l obtains the highest mAP 50 and mAP 50 : 95 , reaching 79.8% and 61.5%, respectively. However, its computational cost is 127.2 GFLOPs, which is higher than the 103.2 GFLOPs required by YOLOv9c. YOLOv9c achieves an mAP 50 of 79.7%, only 0.1 percentage points below YOLOv10l, and provides the highest recall of 75.9% among the unmodified models.
These results indicate that YOLOv9c offers a suitable balance between detection accuracy, target coverage, parameter count, and computational complexity. It was therefore selected as the baseline architecture.
After integrating Ghost-MSConv, MLCA, and DySample, GAD-YOLO achieves the highest results across all four accuracy metrics. Compared with YOLOv9c, it improves precision by 5.4 percentage points, recall by 0.5 percentage points, mAP 50 by 3.1 percentage points, and mAP 50 : 95 by 4.8 percentage points. Meanwhile, its reported computational cost decreases from 103.2 to 102.4 GFLOPs.

4.4. Ablation Study

Ablation experiments were conducted on the primary dataset to evaluate the individual and combined effects of Ghost-MSConv, MLCA, and DySample. Ghost-MSConv, MLCA, and the LP configuration of DySample are denoted by G, A, and D, respectively. In addition to the single-module experiments, all pairwise combinations and the complete three-module configuration were evaluated.
The principal training settings were shared across the ablation runs. However, the archived configurations used initial learning rates of 0.03 for the baseline and single-module models, 0.027 for the pairwise combinations, and 0.025 for the complete model. Therefore, the ablation results provide empirical evidence for the behavior of the architectural configurations under their archived training settings, rather than a strict architecture-only comparison with an identical initial learning rate. The detailed ablation results are summarized in Table 4.
Ghost-MSConv increases mAP 50 from 79.7% to 80.5% and mAP 50 : 95 from 60.7% to 62.3%. It also increases precision from 73.5% to 77.3%. The parameter count decreases by 0.019 M, and the computational cost decreases by 1.0 GFLOPs. These results show that the proposed multi-receptive-field feature extraction improves detection performance without increasing model complexity.
The block-wise results show that MLCA has a context-dependent effect. When MLCA is introduced alone, precision increases from 73.5% to 77.7% and mAP 50 increases from 79.7% to 80.5%; however, recall decreases from 75.9% to 71.4%, and mAP 50 : 95 changes from 60.7% to 60.6%. When MLCA is combined with Ghost-MSConv, the G+A configuration reaches 82.3% mAP 50 and 64.2% mAP 50 : 95 , while the A + D configuration reaches 82.4% and 63.9%, respectively. The complete G + A + D configuration further increases these metrics to 82.8% and 65.5%. These results indicate that MLCA provides limited benefit as an isolated replacement but contributes more effectively when operating within the coordinated feature-extraction and reconstruction pipeline.
Among the individual modules, DySample produces the largest improvement in mAP 50 , increasing it from 79.7% to 81.6%. Its mAP 50 : 95 also increases by 1.9 percentage points. The parameter count increases by only 0.033 M, while the reported computational cost remains unchanged. These results support the use of content-adaptive sampling for recovering spatial information during feature upsampling.
The pairwise experiments reveal complementary performance characteristics. The combination of Ghost-MSConv and MLCA achieves the highest recall of 76.7%, indicating improved target coverage. The combination of Ghost-MSConv and DySample produces the highest precision of 81.5%, although its recall decreases to 73.2%.
The complete GAD-YOLO model achieves the highest mAP 50 of 82.8% and the highest mAP 50 : 95 of 65.5%. Compared with the baseline, the parameter count increases by only 0.013 M, whereas the reported computational cost decreases by 0.8 GFLOPs. The full model therefore provides the best overall balance among precision, recall, localization quality, and model complexity.

4.5. Class-Wise Detection Performance on the Primary Dataset

To examine whether the primary improvement is concentrated in only a few dominant categories, the class-wise AP 50 values of YOLOv9c and GAD-YOLO are compared in Table 5.
GAD-YOLO improves the AP 50 of all six categories. The improvements for bus and car are relatively limited because the baseline already achieves high detection accuracy for these categories. In contrast, bicycle detection improves by 9.7 percentage points, representing the largest category-level gain.
Bicycles and motorcycles contain only 111 and 116 validation instances, respectively, which is substantially fewer than the 9888 car instances. Therefore, the relatively large category-level improvement for bicycle should be interpreted cautiously. The increase from 67.1% to 76.8% provides empirical evidence under the archived validation split, but the current fixed-seed experiments do not establish a statistically stable minority-class advantage. Nevertheless, the positive changes observed for both bicycle and motorcycle suggest that the proposed architecture can retain useful performance for underrepresented categories under the current experimental setting.
The improvements for person, truck, and motorcycle are 3.0, 2.3, and 3.0 percentage points, respectively. These results show that GAD-YOLO improves not only the dominant vehicle categories but also categories that are more sensitive to dense distributions, occlusion, limited visual information, and class imbalance.

4.6. Qualitative Analysis on the Primary Task

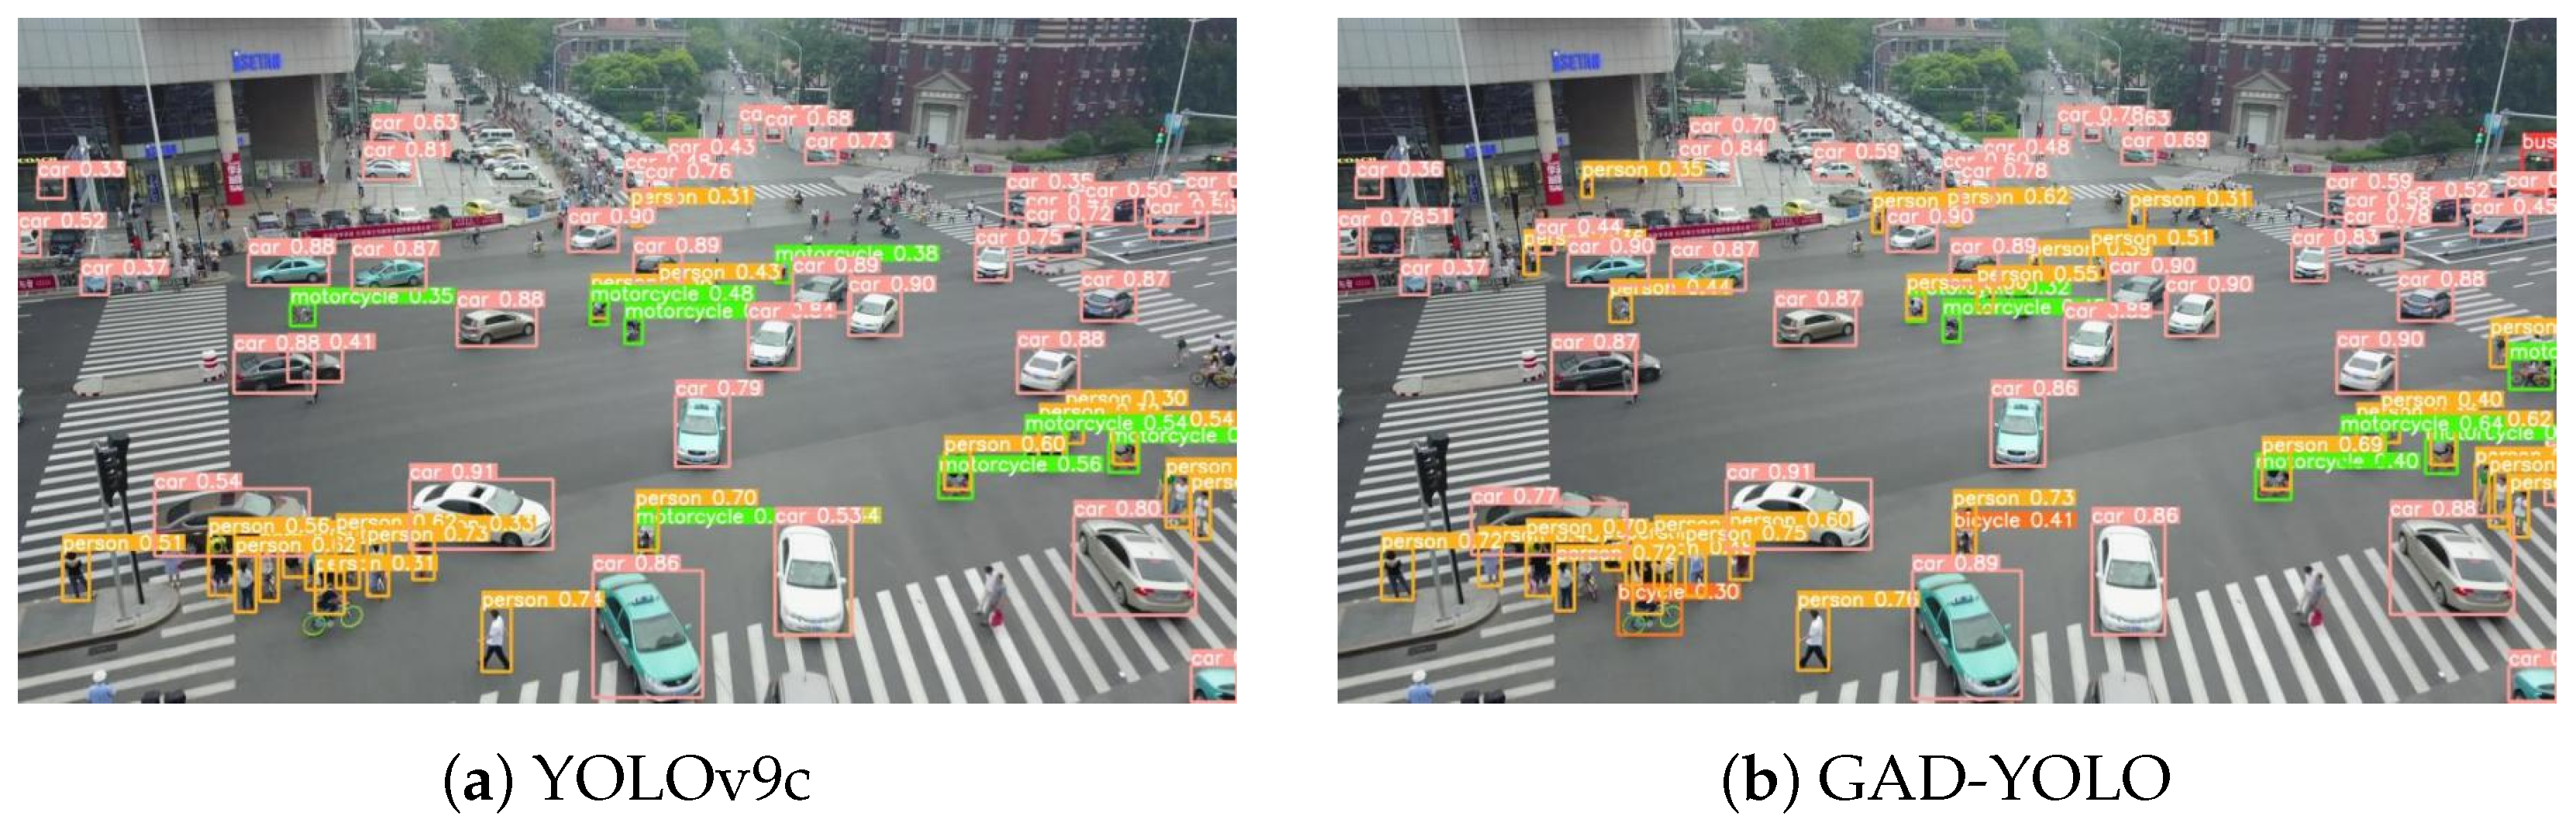
To supplement the primary quantitative evaluation, YOLOv9c and GAD-YOLO were applied to the same representative dense traffic scene. The selected scene contains distant targets, overlapping objects, and complex road background interference.
As shown in Figure 3, both models detect the main traffic objects in the scene. GAD-YOLO produces more complete responses in several regions containing small and densely distributed targets and provides more stable localization for adjacent objects.
The qualitative observations are consistent with the primary quantitative results. Nevertheless, this image-level comparison is regarded as supplementary qualitative evidence rather than a substitute for controlled cross-dataset evaluation.

4.7. Supplementary Evaluation on VisDrone2019-DET

The primary comparative, ablation, and class-wise experiments were conducted on the reannotated UA-DETRAC-derived dataset. To examine the behavior of the complete GAD-YOLO architecture on a public benchmark with different categories, aerial viewpoints, object scales, and density distributions, an additional controlled experiment was conducted on VisDrone2019-DET [11].
This experiment is intended as supplementary cross-dataset evidence rather than a replacement for the primary experiments. YOLOv9c and the complete GAD-YOLO model were retrained from scratch under the same VisDrone protocol. The individual modules were not separately retrained in this supplementary experiment.

4.7.1. Dataset and Additional Experimental Setup

VisDrone2019-DET contains ten valid detection categories: pedestrian, people, bicycle, car, van, truck, tricycle, awning-tricycle, bus, and motor. During preprocessing, these categories were mapped to class indices from 0 to 9. Annotations corresponding to ignored regions and the “others” category were excluded.
The official training, validation, and test-dev partitions were retained. The converted dataset contains 6471 training images, 548 validation images, and 1610 test-dev images. The corresponding numbers of retained object instances are 343,204, 38,759, and 75,102, respectively. The image and object-instance statistics of the three official subsets are summarized in Table 6.
According to the COCO object-area criteria, the test-dev subset contains 50,816 small objects, 21,876 medium objects, and 2410 large objects. Small objects account for 67.66% of all test-dev instances. The corresponding object-size distribution is summarized in Table 7.
Among the 75,102 test-dev objects, 42,219 are labeled as unoccluded, 25,894 as partially occluded, and 6989 as heavily occluded. In addition, 3269 objects are marked as truncated.
The additional experiments were performed on an Ubuntu Linux server equipped with one NVIDIA GeForce RTX 4090 GPU (NVIDIA Corporation, Santa Clara, CA, USA). The software environment consisted of Python 3.10.20, PyTorch 2.2.2, and CUDA 12.1. YOLOv9c and GAD-YOLO were trained from scratch for 220 epochs using an input resolution of 640 × 640 , a batch size of 8, the Adam optimizer, an initial learning rate of 0.03, and a fixed random seed of 0. No pretrained weights were used. Mosaic augmentation was disabled during the final 15 epochs.
Because repeated VisDrone experiments with multiple random seeds were not conducted, the supplementary results represent performance under the fixed experimental configuration and are not used to claim statistical significance.

4.7.2. Overall and Class-Wise Detection Performance

The best checkpoints were evaluated on the test-dev subset using a confidence threshold of 0.001, an NMS IoU threshold of 0.7, and a maximum of 300 retained detections per image. The overall detection results on the VisDrone2019-DET test-dev subset are summarized in Table 8.
GAD-YOLO increases precision by 1.4 percentage points and increases both mAP 50 and mAP 50 : 95 by 0.6 percentage points, while recall changes by only 0.1 percentage points. These modest positive AP differences were observed under the fixed-seed VisDrone protocol. Because only one training seed was evaluated, the 0.6-percentage-point gains should be interpreted as configuration-specific empirical results rather than as statistically stable improvements. Their smaller magnitude relative to the primary dataset further indicates that the observed effect is dataset-dependent. The class-wise detection results are reported in Table 9.
GAD-YOLO improves AP 50 for nine of the ten VisDrone categories. Truck is the only category with a negative change: AP 50 decreases from 27.9% to 27.2%, while AP 50 : 95 decreases from 17.7% to 17.6%.

4.7.3. Scale-Specific Detection Performance

For an object with bounding-box width w and height h, its area is A = w h . The COCO scale groups are defined as
Scale ( A ) = Small , A < 32 2 , Medium , 32 2 A < 96 2 , Large , A 96 2 .
The scale-specific detection results on the VisDrone2019-DET test-dev subset are summarized in Table 10.
GAD-YOLO increases AP S by 0.58 percentage points and AP M by 0.78 percentage points. In contrast, AP L decreases by 1.54 percentage points. This provides direct supplementary evidence for small- and medium-object improvement while revealing a scale-dependent limitation.
The overall COCO-style AP values differ slightly from the native YOLO values in Table 8 because the two evaluation implementations use different interpolation and prediction-aggregation procedures. Comparisons within each table use the same metric implementation.

4.7.4. Density-Specific Detection Performance

Let N i denote the number of annotated objects in image i. Based on the one-third and two-thirds quantiles of the test-dev distribution, image density is defined as
Density ( N i ) = Sparse , N i 25 , Moderate , 25 < N i 48 , Dense , N i > 48 .
This division produces 538 sparse images, 543 moderately dense images, and 529 dense images.
The density definition above is an image-level evaluation criterion rather than a temporally updated state variable. GAD-YOLO performs frame-wise object detection and does not maintain object identities or trajectories across consecutive video frames. Therefore, no temporal overlap ratio is updated by the detector during inference.
For spatially overlapping detections within an individual frame, bounding-box overlap is measured using intersection over union (IoU):
IoU ( B a , B b ) = | B a B b | | B a B b | ,
where B a and B b denote two predicted bounding boxes. In the supplementary VisDrone evaluation, non-maximum suppression uses an IoU threshold of 0.7 to remove highly redundant predictions. Thus, scene density is quantified from the number of annotated objects per image, whereas spatial overlap between predicted objects is handled separately through IoU-based post-processing. Figure 3 provides a qualitative example containing adjacent and overlapping traffic objects. The density-specific quantitative results are summarized in Table 11.
GAD-YOLO improves AP 50 and AP 50 : 95 across all three density groups. Most directly relevant to the dense small-object setting considered in this study, AP S within the dense subset increases from 6.69% for YOLOv9c to 7.19% for GAD-YOLO, corresponding to an improvement of 0.50 percentage points. Within the same dense subset, AP 50 increases from 24.27% to 24.71%, AP 50 : 95 increases from 13.95% to 14.44%, and AP M increases from 23.94% to 24.55%. These results provide a direct quantitative evaluation of small-object detection under high-density image conditions.
The largest overall difference occurs in the sparse subset rather than the dense subset. Therefore, the supplementary results show positive AP differences across the evaluated density levels, including crowded scenes, but do not indicate a stronger effect at the highest density.

4.7.5. Standardized Inference Efficiency

Both VisDrone models were evaluated on the same RTX 4090 GPU using a batch size of 1 and an input resolution of 640 × 640 . Each model was first executed for 100 warm-up iterations and then measured over 1000 CUDA-synchronized forward passes. The measurements represent network forward-pass efficiency and exclude image decoding, storage transfer, and non-maximum suppression.
Under FP32 inference, GAD-YOLO retains a throughput of 100.20 FPS, although its mean latency is 0.53 ms higher and its FPS is approximately 5.3% lower than YOLOv9c. Under FP16 inference, GAD-YOLO reaches 133.89 FPS, compared with 154.11 FPS for YOLOv9c. The FP16 peak allocated memory values of the two models are nearly identical. The standardized inference-efficiency results are summarized in Table 12.
The measured results reveal an accuracy–efficiency trade-off. GAD-YOLO improves the supplementary AP metrics but does not outperform YOLOv9c in latency or throughput. The runtime results are reported separately from the parameter and GFLOP statistics of the primary experiments because the two evaluations use different hardware platforms and model-statistics procedures.

5. Discussion

5.1. Primary Experimental Findings

The primary experiments show that GAD-YOLO provides a clear improvement over YOLOv9c on the reannotated UA-DETRAC-derived dataset. Precision increases from 73.5% to 78.9%, recall increases from 75.9% to 76.4%, mAP 50 increases from 79.7% to 82.8%, and mAP 50 : 95 increases from 60.7% to 65.5%.
The improvement in mAP 50 : 95 is larger than that in mAP 50 , indicating that the proposed model improves not only object recognition at a loose overlap threshold but also localization quality under stricter IoU requirements. The increase in precision further shows that the model reduces false-positive detections, while the small recall increase indicates that target coverage is maintained.
The comparison with YOLOv5m, YOLOv6m, YOLOv7, YOLOv8m, YOLOv9c, and YOLOv10l shows that GAD-YOLO achieves the highest values for all four accuracy metrics under the primary experimental protocol. Its reported parameter count remains close to that of YOLOv9c, and its reported GFLOP count is slightly lower.

5.2. Component Contributions

The primary ablation experiments provide empirical evidence regarding the individual and combined behavior of Ghost-MSConv, MLCA, and DySample under the archived training configurations. Because the initial learning rate was adjusted across the single-module, pairwise, and complete configurations, the observed differences should not be interpreted as a strict architecture-only causal decomposition.
MLCA produces a mixed individual result: precision and mAP 50 increase, whereas recall and mAP 50 : 95 decrease slightly. However, when MLCA is combined with Ghost-MSConv and DySample, the complete model achieves the highest overall AP values. This indicates that MLCA functions more effectively as part of the coordinated feature-processing pipeline than as an isolated replacement.
The pairwise experiments also reveal different performance tendencies. Ghost-MSConv combined with MLCA provides the highest recall, whereas Ghost-MSConv combined with DySample provides the highest precision. The complete three-module model provides the strongest balance between precision, recall, and localization quality.

5.3. Class-Wise Behavior on the Primary Dataset

GAD-YOLO improves the AP 50 of all six primary categories. The largest improvement occurs for bicycle, whose AP 50 increases from 67.1% to 76.8%, corresponding to a gain of 9.7 percentage points. The improvements for person, truck, and motorcycle are 3.0, 2.3, and 3.0 percentage points, respectively.
However, these class-wise results should be interpreted in the context of the substantial class imbalance in the primary validation subset. Cars account for 9888 annotated instances, whereas bicycles and motorcycles contain only 111 and 116 instances, respectively. Consequently, the comparatively large improvement for bicycles may be more sensitive to minority-sample composition than the results for the dominant car category. The current fixed-seed experiment therefore provides empirical evidence of improved bicycle and motorcycle detection under the present experimental setting, but does not establish a statistically stable advantage for these minority categories.
Previous empirical research has also shown that performance estimates for underrepresented classes can be sensitive to class distribution and the availability of labeled samples [29]. Accordingly, the class-wise gains reported here are interpreted as configuration-specific empirical observations rather than universally stable minority-class improvements.

5.4. Supplementary Evidence on VisDrone2019-DET

The supplementary VisDrone2019-DET experiment provides additional evidence regarding the behavior of the complete GAD-YOLO architecture under a different category system, aerial viewpoint distribution, and evaluation setting.
On the VisDrone test-dev set, GAD-YOLO shows a 1.4-percentage-point increase in precision and 0.6-percentage-point increases in both mAP 50 and mAP 50 : 95 , while recall decreases by 0.1 percentage points. These modest differences are observed under a single fixed-seed configuration and therefore should not be interpreted as statistically stable improvements. Their smaller magnitude relative to the primary experiments further indicates that the observed effect is dataset-dependent.
The scale-specific analysis shows that AP S increases from 6.72% to 7.31% and AP M increases from 23.16% to 23.94%. In contrast, AP L decreases from 31.37% to 29.83%, revealing a scale-dependent trade-off.
The density-specific results show positive AP differences in sparse, moderate, and dense subsets. For dense images containing more than 48 annotated objects, AP 50 : 95 increases from 13.95% to 14.44%. However, the largest difference occurs in the sparse subset. These results provide empirical evidence across the evaluated density levels, including crowded scenes, but do not establish a uniformly stronger effect in dense scenes.
The class-wise VisDrone results are positive for nine of the ten categories. Truck is the only category with a small decrease. This finding further indicates that the architectural modifications do not improve every category or scale uniformly.

5.5. Accuracy–Efficiency Trade-Off

The primary complexity statistics show that GAD-YOLO has nearly the same parameter count as YOLOv9c and a slightly lower reported GFLOP count. However, the standardized RTX 4090 benchmark shows that GAD-YOLO has higher measured latency.
Under FP32 inference, GAD-YOLO achieves 9.98 ms mean forward latency and 100.20 FPS, compared with 9.45 ms and 105.83 FPS for YOLOv9c. Peak allocated GPU memory increases from 615.94 to 651.49 MiB. Under FP16 inference, GAD-YOLO achieves 133.89 FPS, compared with 154.11 FPS for YOLOv9c.
The difference between theoretical complexity and actual runtime is reasonable because MLCA and DySample introduce tensor rearrangement, adaptive coordinate generation, grid sampling, and additional memory access. These operations are not fully represented by parameter count or nominal GFLOPs.
The proposed method therefore presents an explicit accuracy–efficiency trade-off. It improves the primary and supplementary AP results but does not outperform YOLOv9c in measured latency. Nevertheless, its FP32 throughput remains approximately 100 FPS on the tested RTX 4090 platform.

5.6. Limitations

Several limitations should be considered when interpreting the results. The primary experiments were conducted on a six-class reannotated subset derived from UA-DETRAC. Although the original UA-DETRAC benchmark is publicly available and the archived model configurations, trained weights, training records, and experimental results have been retained, the exact historical image subset, source-video mapping, and complete split manifest are no longer available. Consequently, strict video-sequence-level independence among the archived training, validation, and test subsets cannot be retrospectively verified. To provide additional publicly reproducible evidence independent of this historical split, the present study includes supplementary experiments on VisDrone2019-DET using its official data partitions and a fully specified training and evaluation protocol.
The archived primary experiments were conducted using a fixed random seed of 0, and repeated multi-seed training was not available. Deep-learning training can nevertheless be affected by stochastic and configuration-dependent factors, including data splitting, weight initialization, data ordering, data augmentation, and optimization-related variations. Therefore, the present single-seed results do not permit the variance or statistical significance of the reported performance differences to be quantified. The reported improvements are consequently interpreted as empirical observations under the fixed experimental configuration rather than as statistically significant effects.
Previous empirical studies have also demonstrated that deep-learning performance can vary with labeled-data availability, class distribution, training conditions, and data augmentation strategies [29,30,31]. These findings further support a cautious interpretation of results obtained from a single training configuration. In particular, the comparatively large improvement for the bicycle category should not be interpreted as a statistically stable minority-class advantage without repeated multi-seed evaluation.
Finally, the current supplementary evaluation is limited to VisDrone2019-DET and does not establish universal generalization across all traffic-monitoring domains. Other detector families, including Transformer-based and two-stage detectors, were not retrained under the same supplementary protocol. Moreover, the standardized runtime evaluation was conducted on a single NVIDIA GeForce RTX 4090 GPU using PyTorch 2.2.2 and should therefore be regarded as hardware- and framework-specific.
These limitations define the scope within which the present results should be interpreted. In particular, no claim of statistical significance is made from the current fixed-seed experiments. Multi-seed evaluation on fully reproducible datasets, broader cross-family comparisons, and deployment-oriented evaluation on embedded or edge-computing platforms would provide additional validation beyond the evidence reported in the present study.

6. Conclusions

This study proposes GAD-YOLO, a stage-aligned feature-enhancement framework for dense small traffic object detection. The architecture introduces Ghost-MSConv into early feature extraction, MLCA into high-level feature refinement, and DySample into top-down feature reconstruction.
In the primary experiments on a six-class traffic object dataset derived from UA-DETRAC, GAD-YOLO achieved a precision of 78.9%, a recall of 76.4%, an mAP 50 of 82.8%, and an mAP 50 : 95 of 65.5%. Compared with YOLOv9c, these metrics increased by 5.4, 0.5, 3.1, and 4.8 percentage points, respectively. The primary ablation experiments further provided empirical evidence of complementary behavior among Ghost-MSConv, MLCA, and DySample under the archived training configurations, with the complete model achieving the strongest overall AP results.
Supplementary experiments on VisDrone2019-DET produced modest positive performance differences under the fixed experimental setting. mAP 50 increased from 26.5% to 27.1%, while mAP 50 : 95 increased from 15.7% to 16.3%. The COCO-style evaluation showed that AP S increased from 6.72% to 7.31%, and the dense-subset mAP 50 : 95 increased from 13.95% to 14.44%.
These supplementary results should be interpreted cautiously. Only one training seed was evaluated, large-object AP decreased, the truck category did not improve, and the magnitude of the VisDrone gain was smaller than that observed on the primary dataset. The current evidence therefore supports dataset-specific performance improvements under the evaluated configurations, rather than a universal advantage for dense small- object detection.
Under FP32 inference on an RTX 4090, GAD-YOLO achieved a mean forward-pass latency of 9.98 ms and a throughput of 100.20 FPS. Although the model is slower than YOLOv9c in the standardized benchmark, it retains real-time inference capability.
The current results support the effectiveness of GAD-YOLO under the evaluated UA-DETRAC-derived and VisDrone2019-DET settings, but they do not establish universal effectiveness across dense small-object detection tasks. The conclusions are therefore restricted to the fixed-seed and dataset-specific experimental conditions reported in this study. Further validation using multi-seed experiments, additional public benchmarks, broader detector families, and embedded or edge-computing platforms would help determine the stability and generalization scope of the observed improvements.


Author Contributions

Conceptualization, Y.H. and J.Z.; methodology, Y.H., J.Z. and X.L. (Xing Li); software, J.Z. and X.L. (Xing Li); validation, X.L. (Xing Li); formal analysis, X.L. (Xing Li) and Y.H.; investigation, X.L. (Xing Li) and J.Z.; resources, Y.H., L.Z., D.Y. and X.L. (Xiaowei Li); data curation, X.L. (Xing Li); writing—original draft preparation, X.L. (Xing Li) and J.Z.; writing—review and editing, Y.H., X.L. (Xing Li), J.Z., L.Z., D.Y. and X.L. (Xiaowei Li); visualization, X.L. (Xing Li); supervision, Y.H. and L.Z.; project administration, Y.H. and L.Z.; funding acquisition, Y.H., L.Z., D.Y. and X.L. (Xiaowei Li). All authors have read and agreed to the published version of the manuscript.

Funding

This work was supported in part by the Doctoral Research Initiation Fund Project, grant numbers KYBS2021084 and KYBS2023027; the Special Basic Cooperative Research Programs of the Yunnan Provincial Undergraduate Universities’ Association, grant numbers 202301BA070001-036 and 202101BA070001-093; the Yunnan Computer Teaching Reform and Research Project, grant number 2024028; the Special Project of the National Natural Science Foundation of China, grant number 62341203; the National Natural Science Foundation of China, grant numbers 32260131 and 62262001; the Yunnan Province Professional Degree Graduate Teaching Case Library Construction Project, grant number 230202011190; the Second Batch of Ideological and Political Education Special Project of Dali University, grant number SZ022025117; the Tenth Batch of Key Teaching Reform Project of Dali University, grant number JG10102; and the Yunnan Young and Middle-Aged Academic and Technical Leaders Reserve Talent Project in China, grant number 202405AC350023.

Institutional Review Board Statement

Not applicable.

Informed Consent Statement

Not applicable.

Data Availability Statement

The original UA-DETRAC benchmark is publicly available from its dataset provider. The primary experiments used a six-class reannotated subset derived from UA-DETRAC. The exact reannotated image subset and original split manifest are no longer available for redistribution. The archived model configurations, trained weights, training records, and reported experimental results have been retained. VisDrone2019-DET, which was used for the supplementary public-benchmark evaluation, is publicly available from the official VisDrone dataset provider. The VisDrone annotation-conversion script, dataset configuration files, model configuration files, evaluation scripts, trained weights, and supplementary experimental records are available from the corresponding author upon reasonable request.

Acknowledgments

During the preparation of this manuscript, ChatGPT (GPT-5.6 Sol, OpenAI) was used solely for English-language polishing. The authors reviewed and revised the AI-assisted text and take full responsibility for the final content.

Conflicts of Interest

The authors declare no conflicts of interest.

References

  1. Damaj, I.W.; Al Khatib, S.K.; Naous, T.; Lawand, W.; Abdelrazzak, Z.Z.; Mouftah, H.T. Intelligent transportation systems: A survey on modern hardware devices for the era of machine learning. J. King Saud. Univ.-Comput. Inf. Sci. 2022, 34, 5921–5942. [Google Scholar] [CrossRef] [Scilit]
  2. Ren, S.; He, K.; Girshick, R.; Sun, J. Faster R-CNN: Towards real-time object detection with region proposal networks. In Advances in Neural Information Processing Systems 28; Curran Associates, Inc.: Red Hook, NY, USA, 2015; pp. 91–99. [Google Scholar]
  3. Redmon, J.; Divvala, S.; Girshick, R.; Farhadi, A. You only look once: Unified, real-time object detection. In Proceedings of the 2016 IEEE Conference on Computer Vision and Pattern Recognition (CVPR), Las Vegas, NV, USA, 27–30 June 2016; IEEE: New York, NY, USA, 2016; pp. 779–788. [Google Scholar] [CrossRef] [Scilit]
  4. Redmon, J.; Farhadi, A. YOLO9000: Better, faster, stronger. In Proceedings of the 2017 IEEE Conference on Computer Vision and Pattern Recognition (CVPR), Honolulu, HI, USA, 21–26 July 2017; IEEE: New York, NY, USA, 2017; pp. 7263–7271. [Google Scholar] [CrossRef] [Scilit]
  5. Redmon, J.; Farhadi, A. YOLOv3: An incremental improvement. arXiv 2018, arXiv:1804.02767. [Google Scholar] [CrossRef] [Scilit]
  6. Bochkovskiy, A.; Wang, C.Y.; Liao, H.Y.M. YOLOv4: Optimal speed and accuracy of object detection. arXiv 2020, arXiv:2004.10934. [Google Scholar] [CrossRef] [Scilit]
  7. Wang, C.Y.; Bochkovskiy, A.; Liao, H.Y.M. YOLOv7: Trainable bag-of-freebies sets new state-of-the-art for real-time object detectors. In Proceedings of the 2023 IEEE/CVF Conference on Computer Vision and Pattern Recognition (CVPR), Vancouver, BC, Canada, 17–24 June 2023; IEEE: New York, NY, USA, 2023; pp. 7464–7475. [Google Scholar] [CrossRef] [Scilit]
  8. Wang, C.Y.; Yeh, I.H.; Liao, H.Y.M. YOLOv9: Learning what you want to learn using programmable gradient information. In Computer Vision–ECCV 2024; Springer: Cham, Switzerland, 2024; Volume 15089, pp. 1–21. [Google Scholar] [CrossRef] [Scilit]
  9. Wan, D.; Lu, R.; Shen, S.; Xu, T.; Lang, X.; Ren, Z. Mixed local channel attention for object detection. Eng. Appl. Artif. Intell. 2023, 123, 106442. [Google Scholar] [CrossRef] [Scilit]
  10. Liu, W.; Lu, H.; Fu, H.; Cao, Z. Learning to upsample by learning to sample. In Proceedings of the 2023 IEEE/CVF International Conference on Computer Vision (ICCV), Paris, France, 1–6 October 2023; IEEE: New York, NY, USA, 2023; pp. 6027–6037. [Google Scholar] [CrossRef] [Scilit]
  11. Zhu, P.; Wen, L.; Du, D.; Bian, X.; Fan, H.; Hu, Q.; Ling, H. Detection and tracking meet drones challenge. IEEE Trans. Pattern Anal. Mach. Intell. 2022, 44, 7380–7399. [Google Scholar] [CrossRef] [Scilit] [PubMed]
  12. Han, K.; Wang, Y.; Tian, Q.; Guo, J.; Xu, C.; Xu, C. GhostNet: More features from cheap operations. In Proceedings of the 2020 IEEE/CVF Conference on Computer Vision and Pattern Recognition (CVPR), Seattle, WA, USA, 13–19 June 2020; IEEE: New York, NY, USA, 2020; pp. 1580–1589. [Google Scholar] [CrossRef] [Scilit]
  13. Zhao, Z.; Chen, S.; Zhang, P.; Chen, J.; Liao, L. Research on the construction of real-time vehicle detection model based on YOLOv8-BASW. IEEE Access 2025, 13, 183519–183533. [Google Scholar] [CrossRef] [Scilit]
  14. Song, Z.; Wang, Y.; Xu, S.; Wang, P.; Liu, L. Lightweight vehicle detection based on Mamba_ViT. Sensors 2024, 24, 7138. [Google Scholar] [CrossRef] [Scilit] [PubMed]
  15. Liu, Z.; Zhu, M.; Gao, B.; Zhao, K. YOLO-DC for vehicle detection using deformable convolutional networks and cross-channel coordinate attention. Sci. Rep. 2026, 16, 6284. [Google Scholar] [CrossRef] [Scilit] [PubMed]
  16. Tan, M.; Le, Q.V. EfficientNet: Rethinking model scaling for convolutional neural networks. In Proceedings of the 36th International Conference on Machine Learning, Long Beach, CA, USA, 9–15 June 2019; PMLR: Cambridge, MA, USA, 2019; Volume 97, pp. 6105–6114. Available online: https://proceedings.mlr.press/v97/tan19a.html (accessed on 17 August 2026).
  17. Lin, T.Y.; Dollár, P.; Girshick, R.; He, K.; Hariharan, B.; Belongie, S. Feature pyramid networks for object detection. In Proceedings of the 2017 IEEE Conference on Computer Vision and Pattern Recognition (CVPR), Honolulu, HI, USA, 21–26 July 2017; IEEE: New York, NY, USA, 2017; pp. 2117–2125. [Google Scholar] [CrossRef] [Scilit]
  18. Hu, J.; Shen, L.; Sun, G. Squeeze-and-excitation networks. In Proceedings of the 2018 IEEE/CVF Conference on Computer Vision and Pattern Recognition (CVPR), Salt Lake City, UT, USA, 18–22 June 2018; IEEE: New York, NY, USA, 2018; pp. 7132–7141. [Google Scholar] [CrossRef] [Scilit]
  19. Woo, S.; Park, J.; Lee, J.Y.; Kweon, I.S. CBAM: Convolutional block attention module. In Computer Vision–ECCV 2018; Springer: Cham, Switzerland, 2018; Volume 11211, pp. 3–19. [Google Scholar] [CrossRef] [Scilit]
  20. Carion, N.; Massa, F.; Synnaeve, G.; Usunier, N.; Kirillov, A.; Zagoruyko, S. End-to-end object detection with transformers. In Computer Vision–ECCV 2020; Springer: Cham, Switzerland, 2020; pp. 213–229. [Google Scholar] [CrossRef] [Scilit]
  21. Wang, J.; Chen, K.; Xu, R.; Liu, Z.; Loy, C.C.; Lin, D. CARAFE: Content-aware reassembly of features. In Proceedings of the 2019 IEEE/CVF International Conference on Computer Vision (ICCV), Seoul, Republic of Korea, 27 October–2 November 2019; IEEE: New York, NY, USA, 2019; pp. 3007–3016. [Google Scholar] [CrossRef] [Scilit]
  22. Huang, F.; Li, J.; Zhang, Y.; Li, X. GAD-YOLO: A gastrointestinal abnormality detection YOLO model with multi-scale channel attention and residual fusion. Med. Biol. Eng. Comput. 2026, 64, 1727–1744. [Google Scholar] [CrossRef] [Scilit] [PubMed]
  23. Wu, T.; Zhong, J.; Wang, Z.; Chen, C.; Xia, Z. GAD-YOLO: A Sight-Distance Adaptive Detection Algorithm for General Aviation Aircraft Skin Damage. Algorithms 2026, 19, 61. [Google Scholar] [CrossRef] [Scilit]
  24. Wen, L.; Du, D.; Cai, Z.; Lei, Z.; Chang, M.C.; Qi, H.; Lim, J.; Yang, M.H.; Lyu, S. UA-DETRAC: A new benchmark and protocol for multi-object detection and tracking. Comput. Vis. Image Underst. 2020, 193, 102907. [Google Scholar] [CrossRef] [Scilit]
  25. Jocher, G. YOLOv5 by Ultralytics, version 7.0; Computer software; Zenodo: Geneva, Switzerland, 2020. [Google Scholar] [CrossRef]
  26. Li, C.; Li, L.; Jiang, H.; Weng, K.; Geng, Y.; Li, L.; Ke, Z.; Li, Q.; Cheng, M.; Nie, W.; et al. YOLOv6: A single-stage object detection framework for industrial applications. arXiv 2022, arXiv:2209.02976. [Google Scholar] [CrossRef] [Scilit]
  27. Ultralytics. Ultralytics YOLO, version 8.0.0; Computer software; Zenodo: Geneva, Switzerland, 2023; Available online: https://github.com/ultralytics/ultralytics (accessed on 25 July 2026).
  28. Wang, A.; Chen, H.; Liu, L.; Chen, K.; Lin, Z.; Han, J.; Ding, G. YOLOv10: Real-time end-to-end object detection. arXiv 2024, arXiv:2405.14458. [Google Scholar] [CrossRef] [Scilit]
  29. Wang, S. Class-Aware Temporal and Contextual Contrastive Framework for Semi-Supervised Automated Fault Detection and Diagnosis in Air Handling Units. Energy Build. 2026, 358, 117233. [Google Scholar] [CrossRef] [Scilit]
  30. Wang, S. Temporal–Contextual Self-Supervised Time-Series Learning for Automated Fault Detection and Diagnosis of Air Handling Units in Buildings. Build. Environ. 2026, 292, 114300. [Google Scholar] [CrossRef] [Scilit]
  31. Wang, S. Effectiveness of Traditional Augmentation Methods for Rebar Counting Using UAV Imagery with Faster R-CNN and YOLOv10-Based Transformer Architectures. Sci. Rep. 2025, 15, 33702. [Google Scholar] [CrossRef] [Scilit] [PubMed]
Figure 1. Overall architecture of the proposed GAD-YOLO network.
Information 17 00797 g001
Figure 2. Structure of the Ghost-MSConv module.
Information 17 00797 g002
Figure 3. Qualitative detection comparison on a representative dense traffic scene: (a) YOLOv9c; (b) GAD-YOLO.
Information 17 00797 g003
Table 1. Distribution of object instances in the validation subset of the primary dataset.
CategoryNumber of Instances
Bus502
Car9888
Bicycle111
Person2047
Truck459
Motorcycle116
Total13,123
Table 2. Hardware, software, and principal training configuration used in the primary experiments.
ItemConfiguration
Operating systemUbuntu Linux
CPUAMD EPYC 9754 Processor
GPU server 2 × NVIDIA GeForce RTX 3090
GPU used per recorded runOne GPU
GPU memory24 GB per GPU
System memory60 GB
Python3.8
PyTorch2.0.0
CUDA11.8
Dataset configurationdata/data721.yaml
Input resolution 640 × 640
Training epochs220
Batch size8
OptimizerAdam
Data-loader workers8
Warm-up epochs3
Momentum coefficient0.937
Weight decay0.0005
Final learning-rate factor0.01
Learning-rate scheduleLinear decay
Early-stopping patience100 epochs
Final epochs without Mosaic15
Random seed0
Pretrained weightsNot used
Table 3. Comparison of YOLO-series detectors under the primary experimental protocol.
ModelPrecision (%)Recall (%)mAP50 (%)mAP50:95 (%)Params (M)GFLOPs
YOLOv5m76.171.178.958.525.164.4
YOLOv6m70.667.773.456.052.0161.6
YOLOv772.673.077.054.537.2105.2
YOLOv8m74.373.778.959.225.979.1
YOLOv9c73.575.979.760.725.442103.2
YOLOv10l76.772.079.861.525.8127.2
GAD-YOLO78.976.482.865.525.455102.4
Note: Bold values indicate the best performance for the corresponding accuracy metric.
Table 4. Ablation results for the proposed modules on the primary dataset.
MethodPrecision (%)Recall (%)mAP50 (%)mAP50:95 (%)Params (M)GFLOPs
YOLOv9c73.575.979.760.725.442103.2
YOLOv9c + G77.374.080.562.325.423102.2
YOLOv9c + A77.771.480.560.625.442103.3
YOLOv9c + D77.373.981.662.625.475103.2
YOLOv9c + G + A77.476.782.364.225.423102.3
YOLOv9c + A + D79.073.882.463.925.475103.3
YOLOv9c + G + D81.573.282.564.625.455102.3
GAD-YOLO (G + A + D)78.976.482.865.525.455102.4
Note: G denotes Ghost-MSConv, A denotes MLCA, and D denotes the linear-projection-before-Pixel-Shuffle configuration of DySample. Bold values indicate the best performance for the corresponding accuracy metric.
Table 5. Class-wise AP 50 comparison on the primary dataset.
CategoryYOLOv9c (%)GAD-YOLO (%)Improvement (Percentage Points)
Bus94.395.1+0.8
Car96.797.0+0.3
Bicycle67.176.8+9.7
Person84.287.2+3.0
Truck66.969.2+2.3
Motorcycle68.771.7+3.0
Mean79.782.8+3.1
Table 6. Image and object-instance statistics of VisDrone2019-DET.
SubsetNumber of ImagesNumber of Instances
Training6471343,204
Validation54838,759
Test-dev161075,102
Total8629457,065
Table 7. Object-size distribution in the VisDrone2019-DET test-dev subset.
Object ScaleNumber of InstancesProportion (%)
Small50,81667.66
Medium21,87629.13
Large24103.21
Total75,102100.00
Table 8. Supplementary overall detection performance on the VisDrone2019-DET test-dev subset.
ModelPrecision (%)Recall (%)mAP50 (%)mAP50:95 (%)
YOLOv9c40.727.926.515.7
GAD-YOLO42.127.827.116.3
Difference+1.4 0.1 +0.6+0.6
Note: Bold values indicate the better result between YOLOv9c and GAD-YOLO for the corresponding metric.
Table 9. Class-wise supplementary performance on the VisDrone2019-DET test-dev subset.
CategoryAP50 (%)AP50:95 (%)
YOLOv9cGAD-YOLOYOLOv9cGAD-YOLO
Pedestrian21.722.48.729.21
People10.911.23.533.78
Bicycle6.466.582.492.54
Car68.569.544.645.6
Van37.037.924.726.0
Truck27.927.217.717.6
Tricycle10.411.05.725.96
Awning-tricycle12.312.87.047.41
Bus50.351.735.336.5
Motor19.521.07.488.19
Note: Bold values indicate the higher value between YOLOv9c and GAD-YOLO for each category and evaluation metric.
Table 10. COCO-style scale-specific performance on the VisDrone2019-DET test-dev subset.
ModelAP50 (%)AP50:95 (%)APS (%)APM (%)APL (%)
YOLOv9c25.2914.886.7223.1631.37
GAD-YOLO25.9615.437.3123.9429.83
Difference+0.67+0.54+0.58+0.78 1.54
Note: Bold values indicate the higher value between YOLOv9c and GAD-YOLO for the corresponding evaluation metric.
Table 11. COCO-style supplementary performance under different image-density levels on VisDrone2019-DET.
Density GroupModel AP 50 (%) AP 50 : 95 (%) AP S (%) AP M (%) AP L (%)
SparseYOLOv9c27.6617.356.7321.9031.99
GAD-YOLO29.2518.537.7423.1136.98
ModerateYOLOv9c26.0415.386.9723.0933.37
GAD-YOLO26.7115.797.5623.7932.93
DenseYOLOv9c24.2713.956.6923.9432.52
GAD-YOLO24.7114.447.1924.5528.89
Note: Bold values indicate the higher value between YOLOv9c and GAD-YOLO within each density group for the corresponding evaluation metric.
Table 12. Standardized inference-efficiency comparison on a single NVIDIA GeForce RTX 4090 with batch size 1 and an input resolution of 640 × 640 .
ModelNumeric FormatMean Latency (ms)P95 Latency (ms)FPSPeak Memory (MiB)
YOLOv9cFP329.459.47105.83615.94
GAD-YOLOFP329.9810.00100.20651.49
YOLOv9cFP166.496.53154.11481.42
GAD-YOLOFP167.477.53133.89481.66
Note: Bold values indicate the better inference-efficiency result between YOLOv9c and GAD-YOLO under the same numeric format, where lower latency and memory usage and higher FPS are preferred.
Disclaimer/Publisher’s Note: The statements, opinions and data contained in all publications are solely those of the individual author(s) and contributor(s) and not of MDPI and/or the editor(s). MDPI and/or the editor(s) disclaim responsibility for any injury to people or property resulting from any ideas, methods, instructions or products referred to in the content.