


Abstract
Benefiting from the merit of independent calibration without external reference, the shadow feature is investigated to retrieve wave steepness and wave height from X-band marine radar images. However, the wave period is currently required. Although the wave period could be achieved using the fundamental spectrum analysis technology from a radar image sequence, an external measuring device, like a wave buoy, is essential for the calibration of the wave spectrum. To solve this problem, an improved method for deriving significant wave height (SWH) is proposed by fusing the wave steepness extracted from the shadow feature of the radar image and the wavelength derived through rotated empirical orthogonal function analysis technology. Considering the attenuation relation of received echo in the distance direction, echo intensity calibration is adopted before extracting principal components. The collected X-band marine radar images are applied to verify the performance of the established SWH retrieval approach, with the observation of the wave buoy serving as the ground truth. Compared with the fundamental shadow statistical method, the correlation coefficient of the proposed approach rises by 0.08, while the root mean square error drops by 0.05 m.
1. Introduction
In current ocean remote sensing, the incoherent X-band marine radar has become one of the most important tools by transmitting electromagnetic waves to the sea surface and receiving sea clutter signals to generate high spatial–temporal resolution ocean images [1]. By using the acquired radar images, a variety of ocean dynamic parameters, such as sea surface wind field [2,3], surface current [4], wave information [5,6], and rainfall intensity, can be further obtained [7]. As the core parameter to measure the energy and characteristics of ocean waves, the wave height has an important application value in the fields of marine engineering, disaster warning, and navigation safety [8,9]. Therefore, the retrieval technology of sea wave height based on incoherent radar has been widely considered by the academic community and has become one of the research hotspots.
At present, the method based on three-dimensional Fourier spectrum analysis is one of the mainstream technologies for determining the significant wave height (SWH) from X-band radar images [10]. Combining the physical model of ocean wave imaging with empirical correction, a method of estimating SWH is proposed, and the reconstruction of the wave elevation field from the sea clutter image sequence is primarily realized [11]. Subsequently, a linear relationship between the SWH and the square root of the signal-to-noise ratio (SNR) is employed based on the wave field analysis technology of synthetic aperture radar and the spectral energy estimated by the radar image [12]. The dependence of wave spectral parameters on distance and azimuth is studied, and the dependence is most significant in the SNR. The peak SNR in the wave front and along the wave direction are identified using the least square regression method, and the optimal estimation result is obtained by setting the analysis window in the medium distance region [13,14]. In addition, support vector regression is applied to estimate the wave height. The results show that the prediction accuracy is significantly improved under a variety of sea conditions [15]. Based on radar images, methods to estimate the SWH utilizing ensemble empirical mode decomposition [16,17] and principal components are also proposed [18].
The shadow method is also a widely used inversion technology for SWH. Although the spectral analysis method has high accuracy, it usually relies on the field sensor to correct the relationship between the SWH and SNR. This practice not only increases the complexity and cost of the system but also leads to the problem that the relationship is often not strictly linear. Therefore, the wave height estimation method without on-site calibration has become the focus of research. Based on the shadowing and illumination probability model, a wave height inversion algorithm is derived based on image shadow statistics, significantly reducing the operation cost of the observation system and improving the automation level [19]. The core of the shadow method is to analyze the shadow area formed by mutual occlusion of waves in the image [20,21]. In order to improve the stability of shadow threshold selection, a variety of optimization strategies [22], such as data quality control, histogram smoothing and upwind sub-region time series analysis, and an adaptive shadow region segmentation method based on differential edge detection [23] are subsequently proposed. To realize wave height inversion without calibration, combined image reconstruction and matching technology, the wave slope is estimated by maximizing the correlation coefficient of non-shadow areas between the collected radar image and the reconstructed image [24]. To replace the traditional empirical calibration method, image interpolation and filtering techniques are used to compensate for signal distortion and range attenuation [25]. Aiming at the instability of difference operators on edge detection and inversion accuracy, the Prewitt operator is employed to enhance the accuracy of shadow segmentation [26]. Due to the restriction of the angle between the azimuth partitions of the radar image and the wave direction, the accurate estimation of sea surface slope and wave height still needs further study. Since the shadow threshold estimation of the traditional shadow statistical method is sensitive to noise, the improved CycleGAN deep learning model is introduced to achieve more intelligent and efficient shadow estimation. The inversion results of wave height are in good agreement with the buoy data, but there are problems of strong model dependence and long processing time [27]. To effectively improve accuracy and robustness, a shadow segmentation threshold that can be adjusted adaptively with radar radial distance is proposed, and a wave slope eigenvector that retains azimuth details is constructed to estimate the wave height combined with the support vector regression model. However, the method based on the shadow feature still relies on the wave period data provided by the buoy for training and verification [28,29].
With the development of pattern recognition technology, a new approach to estimate the SWH from incoherent radar images using a multi-layer perceptron is proposed to remedy the drawbacks of traditional spectrum analysis methods under sea states dominated by swell. In this method, the peak wavelength and average wave period are introduced as additional inputs to construct a nonlinear mapping relationship, which effectively avoids the overestimation of wave height by traditional methods under swells and sea conditions, and shows higher accuracy and robustness in multi-area testing [30]. The radial basis function network is also used to predict wave height, where the environmental factors, wave slope, and SNR are applied to construct the feature vector as the model input [31]. In recent years, the method based on artificial neural networks has been further optimized [32,33]. A deep learning model based on U-Net significantly improves the accuracy and stability of sea surface information reconstruction, but its application in the actual scene still needs further verification [34,35]. By blocking, embedding and encoding a single radar image, an improved visual transformer architecture aggregates the output of the model to estimate wave height, which performs well in accuracy and efficiency [36]. A two-stage training framework is proposed, which enables the artificial intelligent model to learn the inherent correlation among ocean wave texture, shadow features, and wave height in advance [37]. Compared with the traditional empirical approaches, deep learning technologies directly learn the mapping relationship to wave height through the high-dimensional training data and simplify the inversion process. However, the relationship among features is not transparent, and it is difficult to explain the physical mechanism of inversion results.
For deriving SWH from the radar image, the method using the shadow feature of the radar image does not rely on any external reference for adjustment. However, the wave period is currently required from reference equipment, which limits the application of the shadow statistical method in practice. To address this problem, an improved method, which combines the wave steepness derived from the radar image sequence and the wavelength extracted by the rotated empirical orthogonal function (REOF) analysis technology, is proposed for derived SWH. The REOF rotates the spatial modes decomposed by empirical orthogonal function (EOF), making the rotated modes more concentrated in space and more clearly reflecting the independent variation characteristics of different regions. The paper is arranged as follows: Section 2 elaborates the fundamental wave steepness and SWH estimation using the shadow feature of the radar image. Based on the echo correction and coordinate transformation, the radar image sequence selected is used to extract the principal component based on REOF. Then, the wavelength is obtained using the power spectral density (PSD) of the first principal component with the Burg algorithm. The wave height, which is determined using the relationship between wave steepness and wavelength, is presented in Section 3. Section 4 describes the field data and accuracy analysis of experimental results. Eventually, the discussion and conclusion are summarized.
2. Achieving Wave Steepness Based on the Shadow Feature of Radar Image
Due to the modulation effect of ocean waves, the marine radar image is composed of bright and dark stripes, and the wave steepness can be calculated based on the shadow feature in the radar image. Edge detection is performed on the selected image analysis area to estimate the shadow segmentation threshold for radar images, which is used to separate the shadow and non-shadow areas within the image [19,20].
2.1. Obtain the Shadow Threshold from the Radar Image
Based on the selected analysis area , the convolution operation is carried out based on the difference operator in adjacent directions to obtain different gradient images in each direction, where indicates the distance to the radar, and denotes the azimuth angle of the polar radar image formed between the emitted electromagnetic wave and the forward direction of the bow of the ship. By superimposing derived gradient images, a complete edge image is achieved. Commonly, filter technology is used to remove isolated noise to obtain an edge image .
The echo value corresponding to the edge image, which is used to produce a histogram function , is determined by performing the Hadamard product operation on matrices edge image and analysis area of the original radar image. For the sake of obtaining the shadow segmentation threshold , the strategy of taking the mode operation on the histogram function is adopted [19].
A binary shadow image is obtained by segmenting the pixels of thee radar image into shaded and non-shaded regions using the calculated shadow threshold , which is [19,20]
2.2. Calculate Wave Steepness Based on Smith Function
Segmenting the shadow image into sub-blocks along the range direction, the proportion of non-shaded pixels in a block is used as the illumination probability . The illumination probability fluctuates and decreases as the distance from the radar increases. Guided by the geometric shadow mechanism of random rough sea surface, the root mean square (RMS) wave steepness is deduced by fitting the illumination probability along the distance direction with the Smith fitting function, which is given as [19]
where
and
where the symbol is the co-error function, and is the corresponding grazing incidence.
Suppose the selected single analysis area is divided into several partitions in azimuth; the averaged steepness is achieved by averaging wave steepness obtained in different partitions. In view of the correlation between wave height and wave steepness, the SWH is [28]
where and are the values of the boundary condition, refers to the water depth within the radar observation zone, is the gravity acceleration, is the mean zero-crossing wave period obtained from the wave buoy or the radar image sequence. Although the existing shadow statistical method requires no extra instruments for calibration, the wave period, which is currently provided by external reference devices like ocean buoys, is essential for retrieving wave height.
3. Calculating Wave Height by Combining Surface Slope and Wavelength Based on Extracted Principal Component
Commonly, when extracting the wave spectrum, employing the spectrum analysis approach, the sea surface current and water depth are fully considered by the dispersion bandpass filter. The main wavenumber and wave period can be extracted by the conventional spectral analysis strategy. Nevertheless, the modulation transfer function is still required based on external equipment and an accurate estimation of surface current is needed. Thus, when utilizing the shadow feature of radar image, further improvement is required for the method of estimating wave height without external reference equipment only using radar images.
The EOF is a data analysis method widely used in meteorology and oceanography, which is utilized to decompose complex spatial fields and extract the main spatio-temporal variation patterns. Traditional EOF has a strong dependence on the size and shape of the region, while REOF relaxes geometric constraints through rotation techniques to reduce the impact of sampling errors. Compared to traditional EOF, REOF can more clearly separate the changing characteristics of different regions and improve the accuracy of spatio-temporal data analysis.
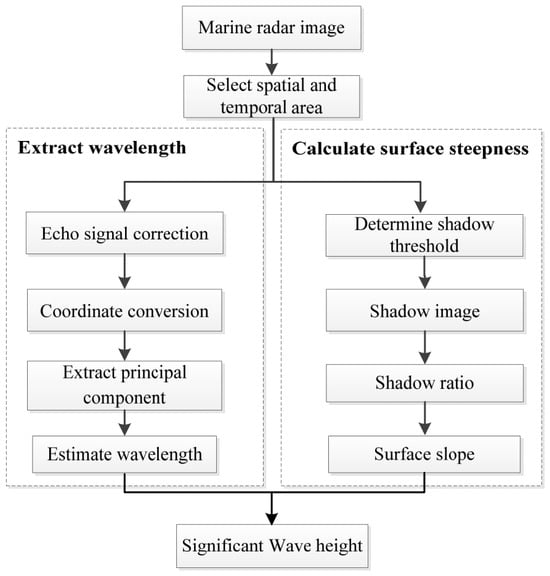
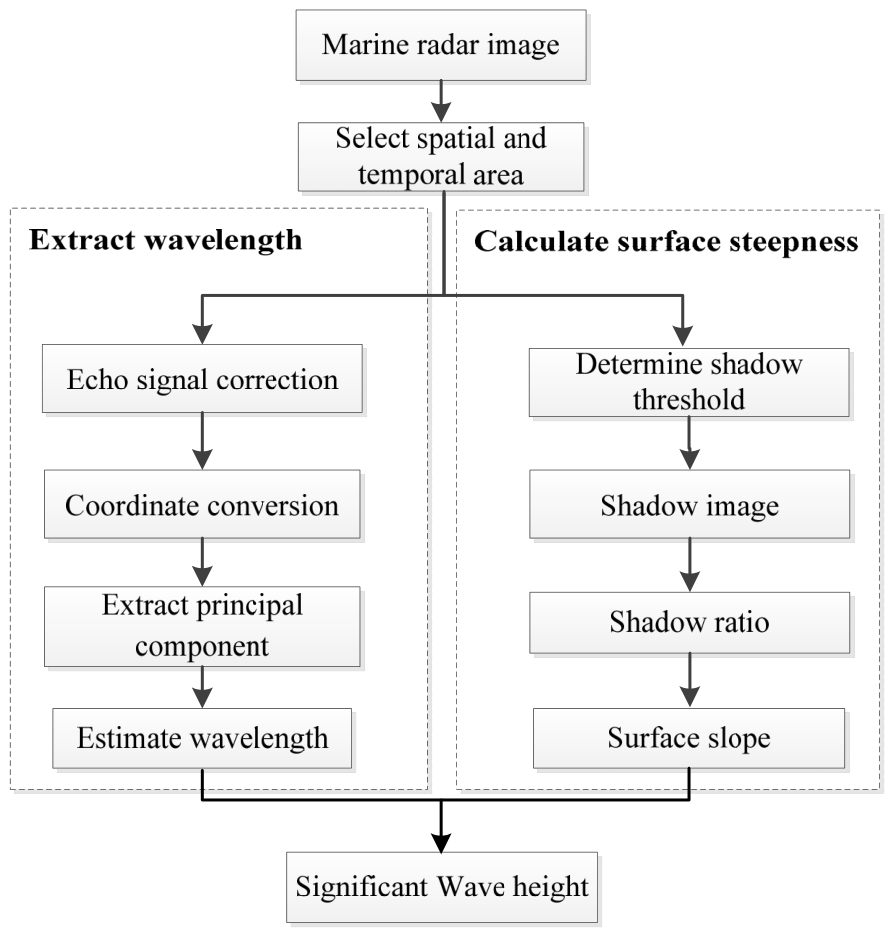
In this paper, by combining the REOF analysis technology with the shadow feature, the SWH is retrieved by using the sea surface slope and the wavelength extracted from the radar image. Before extracting the wavelength, the echo signal correction and coordinate conversion are executed due to the echo attenuation characteristic and the radar scanning pattern. Although the wave surface steepness is calculated based on a single radar image, the estimated wave steepness changes with azimuth. Rather than relying on a single radar image, a spatio-temporal sequence of analysis areas is employed in this paper. For the proposed approach, the workflow of deriving wave height is presented in Figure 1.
Figure 1.
Schematic diagram of estimating wave height based on wave steepness and wavelength.
3.1. Correct Echo Signal in Radial Direction Using Optimal Fitting Function
A marine radar image is characterized by radial range and azimuth angle. Due to the working mechanism of radar, attenuation exists in both radial and azimuth directions. Therefore, the radar echo signal should be corrected before wave inversion. The echo value of a single marine radar image shows a nonlinear attenuation trend with the increase of radial distance.
According to the nonlinear attenuation characteristics, the adaptive subsection fitting of radar radial echo intensity based on the least square method is applied, and then the fitting function is applied to correct the radar image [38]. For the single radar image , the optimal fitting function of radar radial echo intensity is obtained by the least square adaptive piecewise fitting algorithm, where , , and are the pixel numbers in radial and azimuth. Then, for the fixed azimuth angle , the corrected marine radar image is
3.2. Coordinate Conversion for Captured Fan-Shaped Area
Owing to the rotational operation mode of marine radar, the radar receiver presents a circular area in the image. Radar images are formed in polar coordinates, and the captured analysis area is a fan-shaped area. For extracting the principal component of wavelength from the radar image, the conversion from polar coordinates to Cartesian coordinates for captured the fan-shaped area is needed.
Usually, the captured sub-image in the polar coordinate system is transformed to the Cartesian coordinate system using the nearest point interpolation method. The coordinate transformation is as follows:
where and respectively represent the horizontal and vertical coordinates in the Cartesian coordinate system. The interpolation relationship of the nearest point corresponding to the Cartesian coordinate system and the polar coordinate system is constructed, and the radar echo intensity in the polar coordinate system is assigned to the Cartesian coordinate. Thus, the sub-image in the Cartesian coordinate system is obtained for the extraction of subsequent wavelengths.
3.3. Extract Principal Component of Sea Wave Based on REOF
In this paper, the radar image sequence is decomposed into various modes using the REOF. For convenience, suppose that the sampled radar image is expressed by
where and denote the sampled times at a position and the sample numbers in the distance direction. Standardization and normalization are essential preprocessing steps in REOF analysis that cannot be ignored. Due to the dependence of REOF analysis on covariance and correlation coefficient matrices, the dimensional differences of different variables can lead to certain variables dominating the analysis.
For estimating the wavelength, the REOF is utilized to reveal the main spatial patterns of radar data. In REOF analysis, matrix factorization is the core computational step and used to determine the extracted main temporal modes and corresponding spatial coefficients from the raw radar data.
After obtaining the interesting analysis area , the REOF decomposes the radar data into a product of one temporal matrix and the spatial matrix , which is [18]
where each column of is the normalized eigenvectors, and matrix contains the corresponding weight coefficients of feature vectors, which denotes the spatial pattern of the sea wave. After obtaining the eigenvalues and eigenvectors of the covariance matrix, we arrange the eigenvalues in descending order and manipulate the eigenvectors to construct the temporal matrix . Commonly, the top few main eigenvalues and eigenvectors are selected, which can explain most of the data variance.
Suppose is the diagonal matrix composed of eigenvalues, we have
where is the factor loading matrix, and is the factor matrix. Commonly, the cumulative variance contribution rate is utilized to confirm the vector number of the rotation matrix. Utilizing the obtained eigenvalues of matrix , the variance contribution rate of different modes is [18]
where . According to the principle of orthogonal rotation with maximum variance, the matrices and are rotated so that the sum of the variances of the squares of the elements in the factor loading matrix reaches the maximum. After achieving the factor matrix, the first principal component of the factor matrix is used to estimate the wavelength.
3.4. Derive Wavelength from Obtained Wave Principal Component
The derived principal components characterize the spatial fluctuation of ocean waves. After decomposing the wave field into different modes by REOF analysis, the first principal component of the wave field can be obtained. Then, the PSD of the first principal component is obtained using the Burg algorithm. Compared to the auto correlation estimation method, the process of solving auto regressive model by the Burg algorithm is stable and has high spectrum resolution.
The peak of the wavenumber spectrum is close to the real value and can be extrapolated when using the Burg algorithm. For the obtained first principal component, the PSD is given as [39]
where denotes the wavenumber, is the order of the auto regressive model for the selected principal component, is the variance for order , and is the corresponding coefficient of the regressive model. The optimal order is achieved by minimizing the final prediction error rule. For the Burg algorithm, selecting an optimal model order is vital. Commonly, the final prediction error rule and Akaike information criterion are used to select the ideal order of auto regressive model. The used final prediction error criterion in this paper is [39]
where . After determining the optimal order and achieving the coefficients of regressive model using the Burg algorithm, the PSD of the sea wave is obtained. The maximum PSD is the peak wavenumber of the sea wave. Thus, the peak wavelength is .
For the shore-based marine radar, the ideal sub-image aligned with the wave direction is not always available. A certain angle is formed between the wave propagation direction and emitted electromagnetic signals. Thus, further spatial dimension data is also used to extract principal components. The two perpendicular spatial data are respectively utilized to estimate the first principal component and calculate the wavelength. Suppose the obtained two wavelengths are and , the wavelength of sea wave is [18]
3.5. Estimate Wave Height Utilizing the Obtained Wavelength
In this paper, instead of using a single image, the spatial and temporal sub-image sequence is applied to derive wave steepness. Since the echo intensity in a radar image changes with wave and wind directions, instead of using estimated wave steepness from all the partitions, the partition near the wave direction is only utilized to calculate wave steepness in this paper. Thus, the derived wave steepness in the temporal sub-image sequence is averaged and the averaged wave steepness in the temporal domain is applied to estimate the wave height.
Wave steepness is commonly expressed as the ratio of the crest-to-trough wave height to the corresponding wavelength. In general, the wavelength of ocean waves cannot be measured directly, which makes it difficult to calculate wave steepness according to its definition. In this paper, after obtaining the wave steepness, the wavelength is directly calculated from a radar image sequence based on the extracted principal component using REOF. Thus, the wave height is derived using the estimated wave steepness and wavelength from radar images, instead of using the extracted wave period from reference equipment. The conversion relations between RMS wave steepness, sea surface fluctuation, and SWH are rigorously derived and validated [40,41]. The SWH is universally defined as four times the RMS sea surface fluctuation , namely, . Under narrowband deep water conditions, a theoretical binding relationship exists among the RMS wave steepness , sea surface undulation, and wavelength , which is [40,41]
Thus, the SWH is theoretically linked to the RMS wave steepness derived from radar shadow statistics and wavelength , which is
When the derived RMS wave steepness is substituted with the averaged steepness in an image sequence for a fixed azimuth section, the SWH is given as
4. Experimental Results
To retrieve SWH independent of additional reference equipment and improve the retrieval accuracy, the extracted wavelength from the radar image sequence is adopted, which is completely independent of the reference equipment. Since the texture feature of the radar image is related to the wavelength and the grazing angle, an improved method of extracting SWH from a radar image sequence is proposed using the sea surface slope derived from the shadow features and the wavelength extracted via the REOF. Against the reference value and the conventional shadow statistical method, the retrieval performance of the presented approach for retrieving SWH is verified and analyzed using collected radar images.
4.1. Description of Experimental Data and the SNR-Based Method
The marine radar data with abundant sea clutter features are employed in our experiment. Radar images acquired on 10–20 January 2015 and 8–19 November 2014 at Haitan Island of the Fujian Province are employed to verify the effectiveness and analyze the performance of the presented approach.
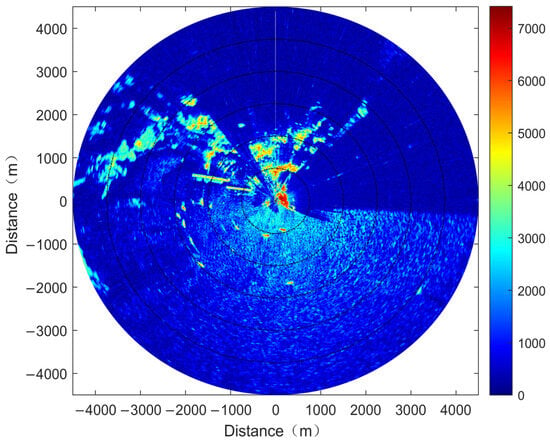
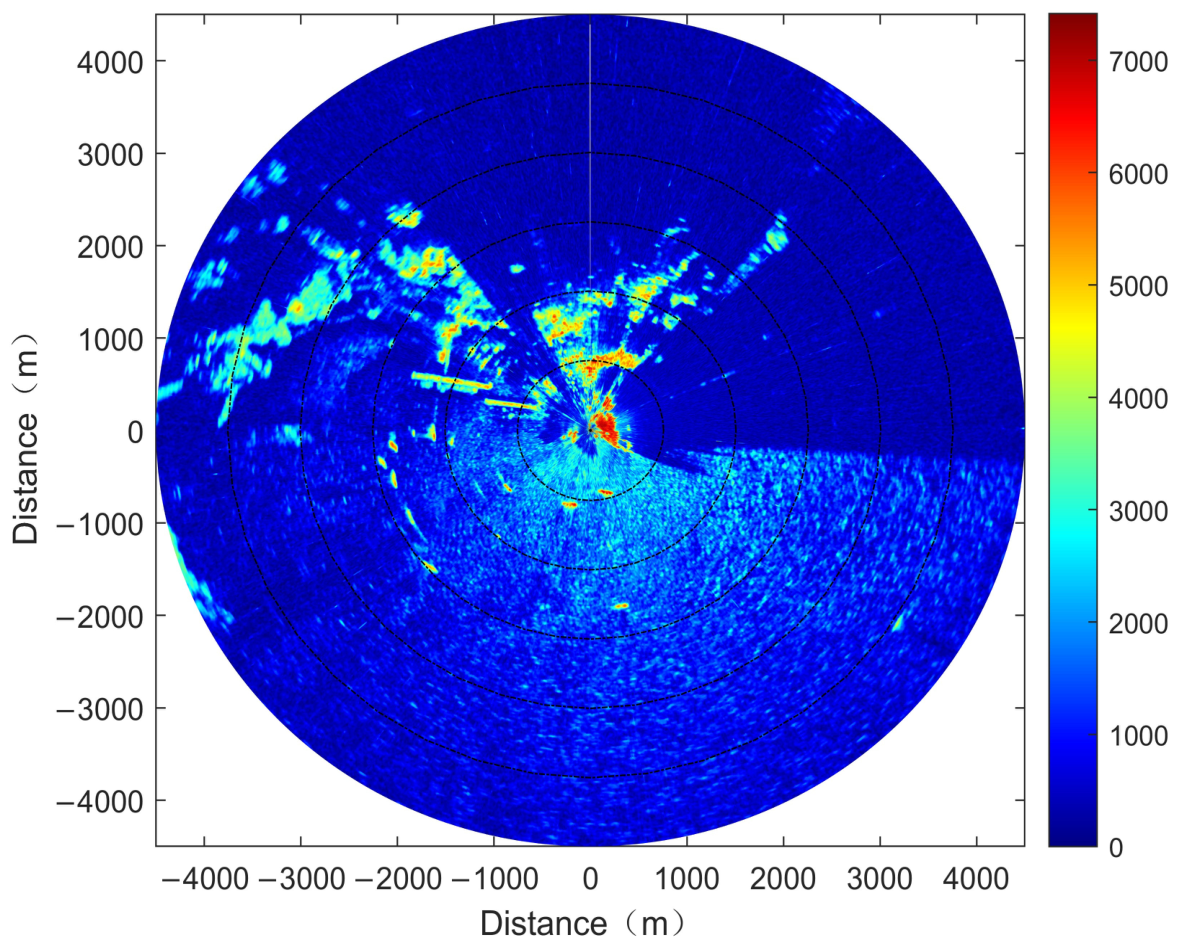
At the data collection site, the wind direction is mainly around 45 degrees, and the average wind speed is above 10 m/s. Owing to the effect of topography, the observed wave has certain surge forcing characteristics. The SBF3 buoy is deployed at the 168-degree azimuth position in the radar image and is about 800 m away from the radar antenna. Figure 2 is the original radar image collected at 18:39 on 10 January 2015, which is the pseudo color display mode with a coverage radius of about 4500 m. There are 600 sampling points in the range direction of the radar images and the resolution of the pixels is 7.5 m. The color scale corresponds to sampled echo intensity values using the 14-bit digital acquisition card.
Figure 2.
Collected radar image at 18:39 on 10 January 2015.
In the subsequent comparative experiments, the SNR-based spectral method is adopted as a benchmark algorithm for performance evaluation. The three-dimensional wavenumber frequency energy spectrum can be achieved by using the Fourier transform on the acquired image sequence [11,12,13,14]. A bandpass filter using the dispersion relation is adopted to filter out the non-wave components. After integrating the filtered spectrum with frequency, a two-dimensional image spectrum is obtained. Then, the wave spectrum is achieved by adopting an empirical modulation transfer function. The SWH is retrieved by using the established empirical correlation to the extracted SNR and is given as [11,12,13,14]
where is the angular frequency, and are the wavenumbers, and are the empirical coefficients, and variable denotes the calculated SNR derived from the energy spectrum , image spectrum , and wave spectrum [12].
4.2. Experimental Result and Performance Comparison
For obtaining wave steepness, a fan-shaped sector is chosen where echo intensity presents a nonlinear attenuation trend with rising radar distance. The near boundary and far boundary of the fan-shaped area are 400 m and 2400 m, respectively. Considering the position of the selected analysis area for estimating wavelength, the corresponding fan-shaped area near 130 degree in azimuth is applied for wave steepness calculation. Since a sector is chosen from a radar image, the estimated 32 wave steepnesses from an image sequence are averaged in this paper, instead of averaging the wave steepnesses achieved from multiple sectors in a radar image.
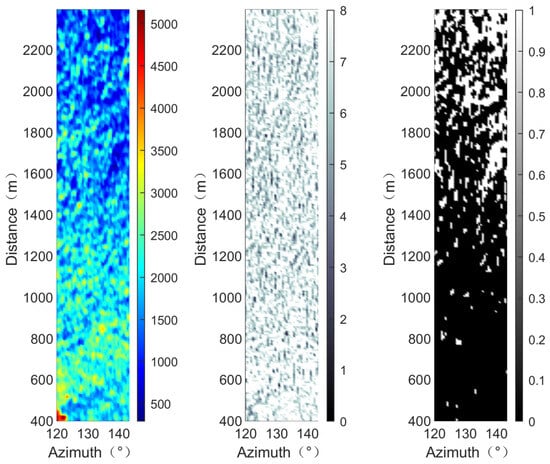
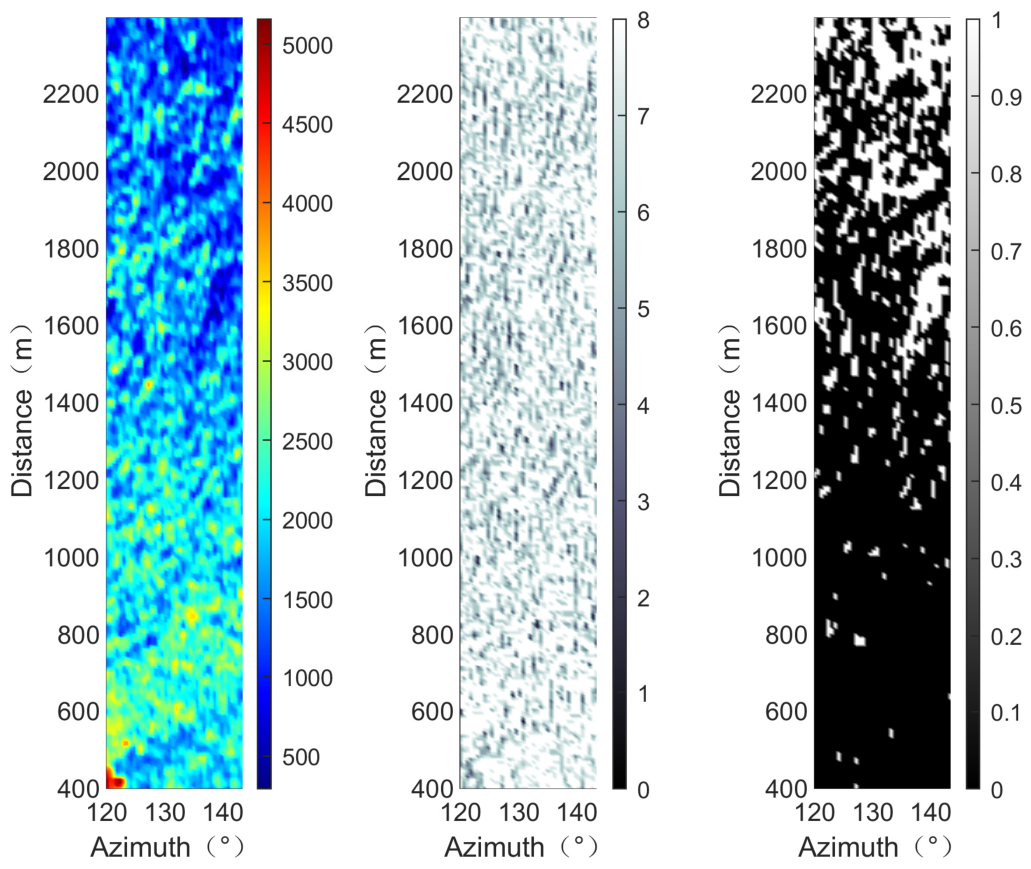
Considering the angle between the wave direction and the electromagnetic wave emitted by the radar, a sector proximate to the wave direction is selected. The left figure in Figure 3 is the analysis area selected in polar coordinates. The abscissa denotes azimuth, while the ordinate represents the range direction. Sea clutter in the radar image presents the characteristic of texture distribution. Sea clutter in the radar image shows the characteristics of texture distribution with light and dark.
Figure 3.
Selected analysis region, derived edge gradient image and shadow map.
The corresponding edge gradient image and the shadow image based on the derived shadow segmentation threshold are given in the middle and right figures of Figure 3. Based on the differential operation in different directions and gradient superposition, it can be seen from the middle figure that the gray stripes are the obtained wave texture boundary. The recorded echo information at the edge position in the radar image is applied to set the shadow segmentation threshold. The dark and white areas in the middle figure are the non-shadow and shadow areas. Dark zones stand for waves captured by the radar, while bright zones are wave-blocked shadow areas. The texture characteristics of the waves are clearly visible in the middle figure. With growing distance away from the radar antenna, image shadows become progressively larger.
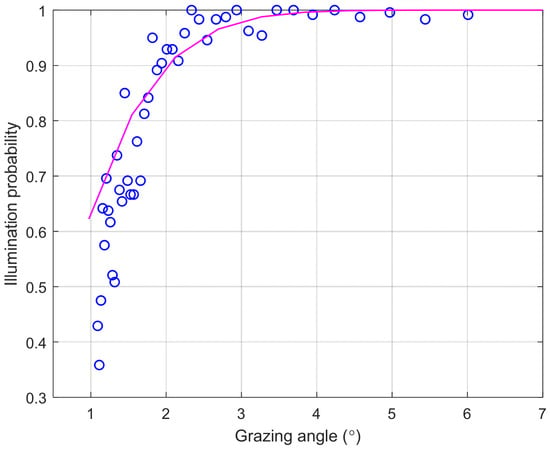
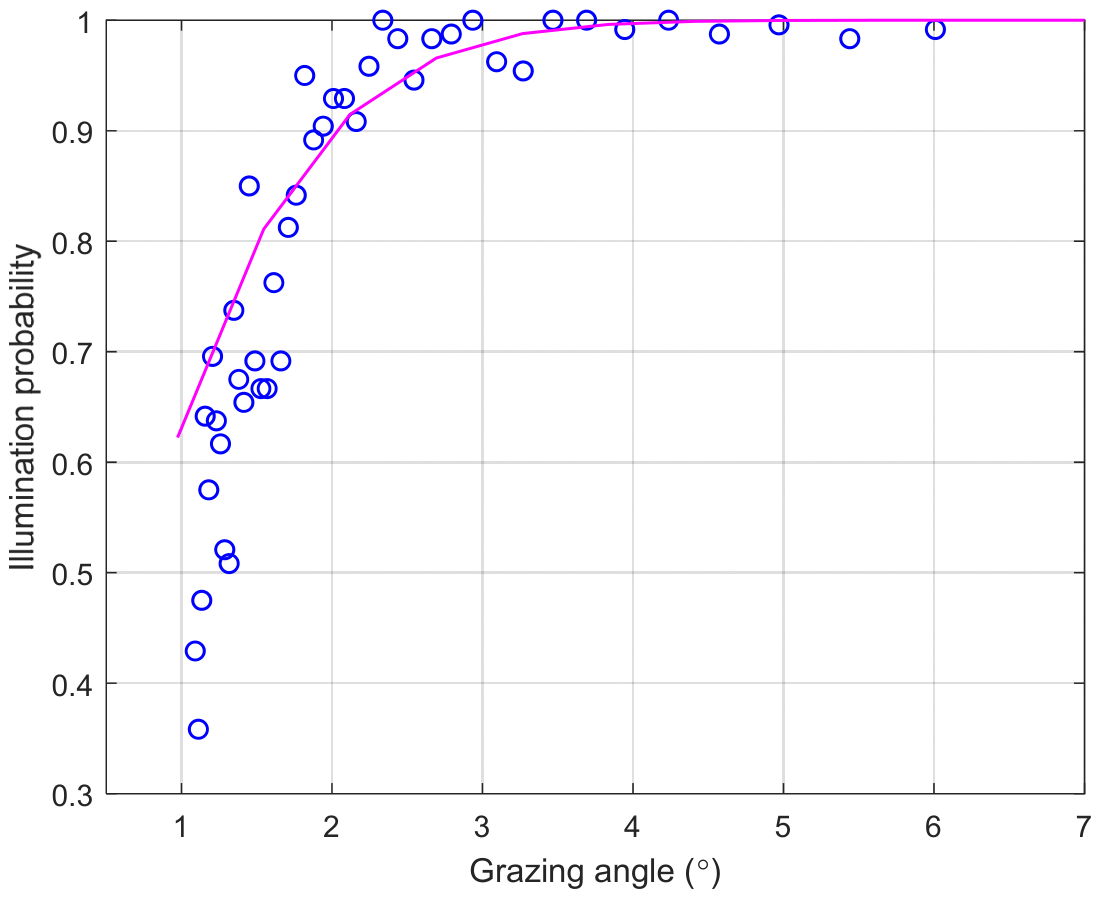
The chosen analysis region as a sector in azimuth is separated into into 44 blocks for calculating the illumination probability in different distance positions. The calculated illumination probability at different distances is presented in Figure 4. The abscissa indicates the grazing angle along the range direction, and the ordinate stands for the computed illumination probability. For a determined block, the ratio of the number of pixels in the unshaded area to the total number of pixels is the illumination probability. The blue circle is the obtained illumination probability in each blocks. It can be observed that the illumination probability increases as the distance from the radar decreases and is close to 1 near the radar antenna. According to the functional relations of wave steepness with grazing angle and illumination probability, the wave steepness could be derived via the Smith fitting function. The pink solid line is the fitted Smith function using the estimated wave steepness.
Figure 4.
Calculated illumination probability and the fitted Smith function for a sector.
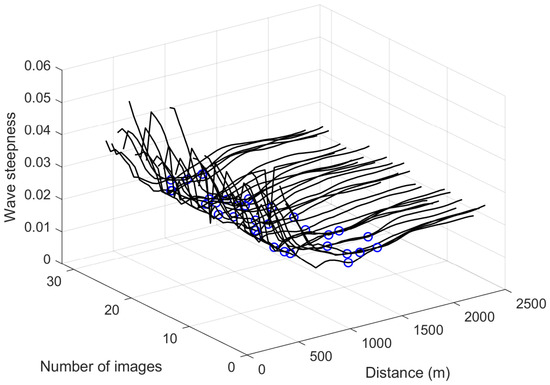
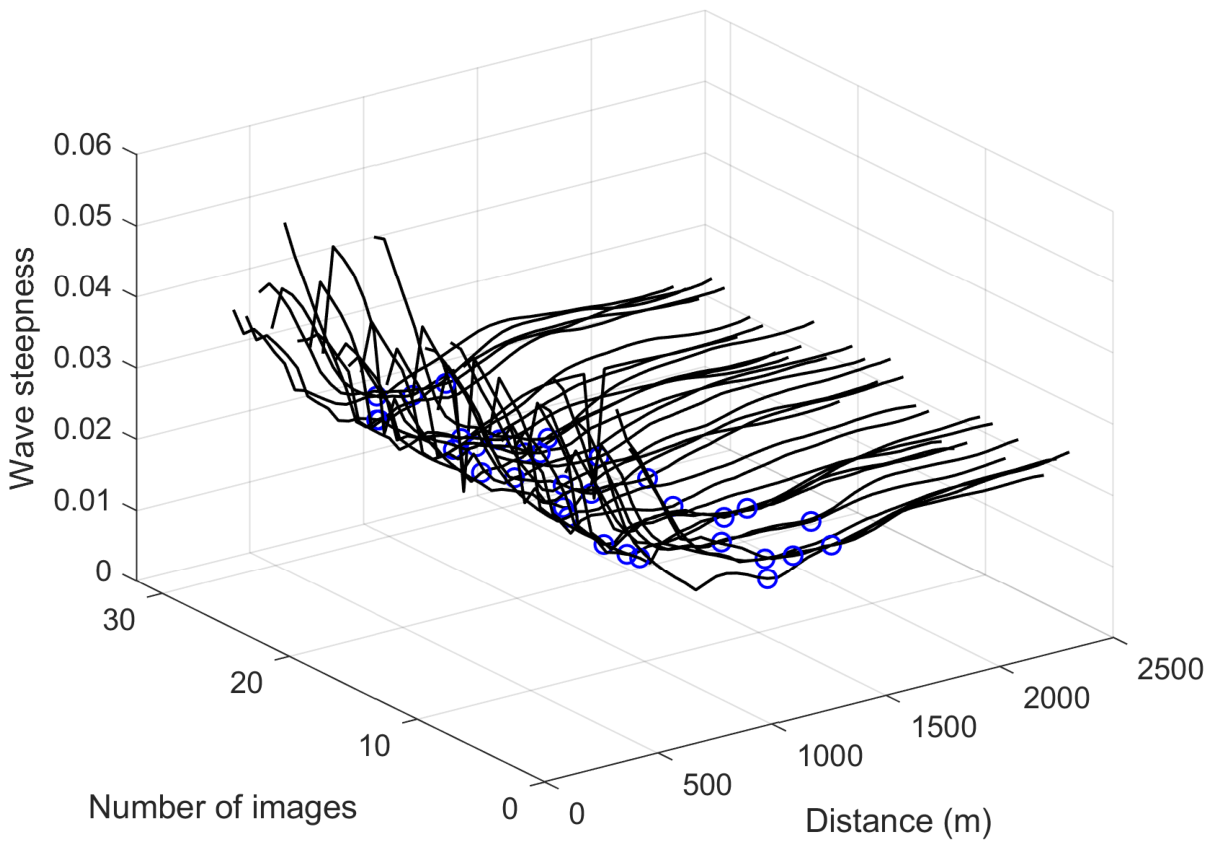
In this paper, since an azimuth partition in the radar image is adopted to compute the illumination probability, the obtained wave steepness using a radar image sequence is depicted in Figure 5. The two axes in the horizontal plane represent the distance from the radar observation point to the sea surface and the image index of the time series sequence. The vertical axis shows wave steepness. The black curve represents the variation trend of the estimated wave steepness with distance. When performing wave height inversion via the shadow method, the minimum value in the wave steepness curve is selected as the core parameter. The blue circles represent the wave steepness data extracted from the fixed analysis partition in different radar images. The wave steepness estimated from a single section of a single frame image is susceptible to the influence of the angle between the radar line of sight and the wave direction. By performing statistical fusion on the wave steepness data of the multi-frame image sequence, the deviation caused by a single direction can be offset to a certain extent.
Figure 5.
Three-dimensional distribution of wave steepness as a function of distance and radar image sequence.
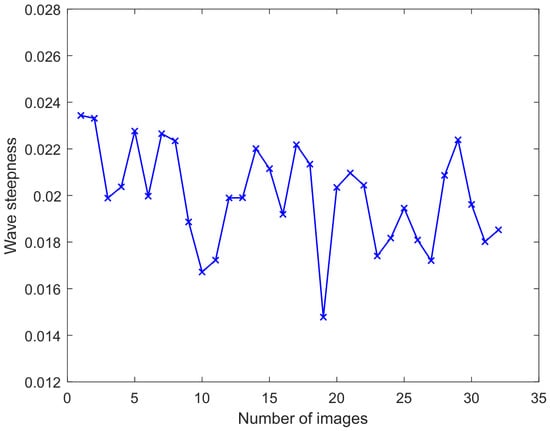
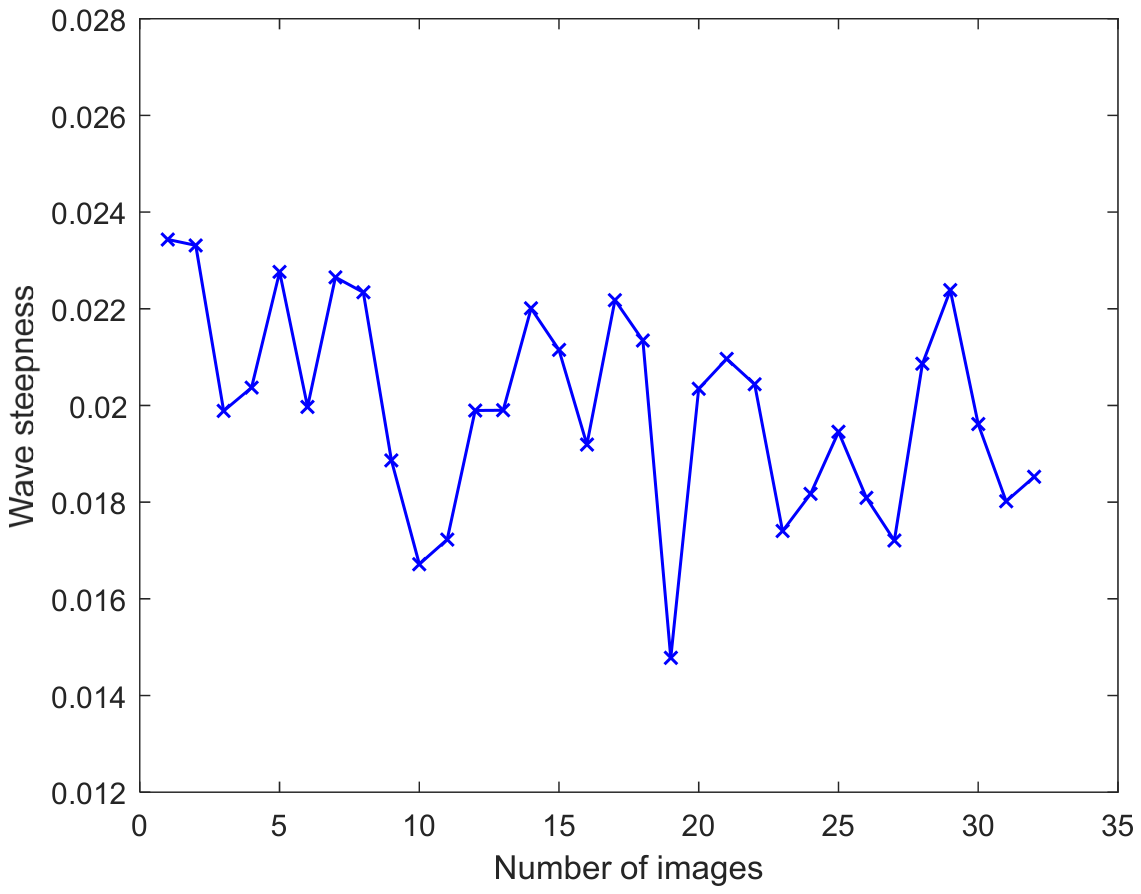
The obtained wave steepness in a radar image sequence is given in Figure 6. The vertical axis corresponds to the retrieved sea surface wave steepness, and the horizontal axis corresponds to the index of radar images in the time series. The blue discrete markers represent the calculated wave steepness achieved from the shadow statistical method. It is observed that the wave steepness values remain relatively stable, with limited variation across the image sequence. To minimize the instability effect of using a wave steepness obtained from a single partition, the mean RMS wave steepness is derived by averaging the wave slope in each radar image.
Figure 6.
Obtained wave steepness in a radar image sequence.
To achieve the wavelength from a radar image sequence consisting of 32 frames, a rectangular sub-image is selected. The center is about 1080 m away from the radar and at an azimuth of 135 degrees. Based on the selected sub-image sequence, the original radar echo is corrected in the radial direction using the optimal fitting function. Then, the captured fan-shaped area is converted to rectangular coordinates based on the interpolation algorithm of the nearest point. Based on the REOF, the first principal component is used to estimate PSD with the Burg algorithm. The wavenumber and the corresponding wavelength are derived by analyzing the position of the capturing peak in the PSD.
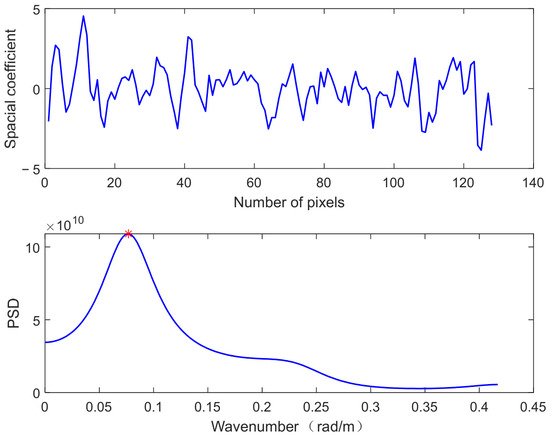
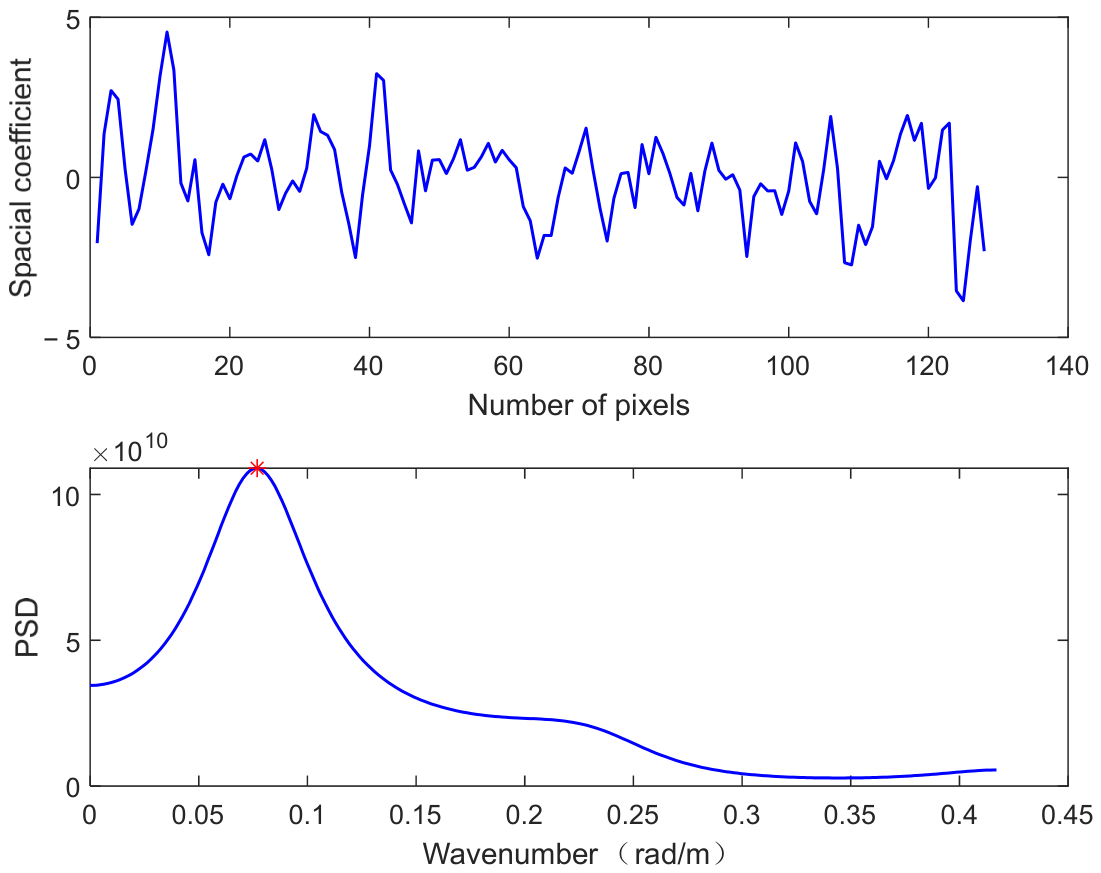
The spatial and temporal matrix data, which are sampled from the radar image sequence, is used to extract principal components based on the REOF. The distribution of the first principal component in the factor matrix is presented in the upper half of Figure 7. The horizontal axis denotes the number of sampled pixels, and the vertical axis corresponds to the amplitude value of the principal component. The sample resolution is 7.5 m. Then, the first principal component of the factor matrix is used to estimate the wavelength.
Figure 7.
Achieved first principal component and the corresponding PSD using the Burg algorithm.
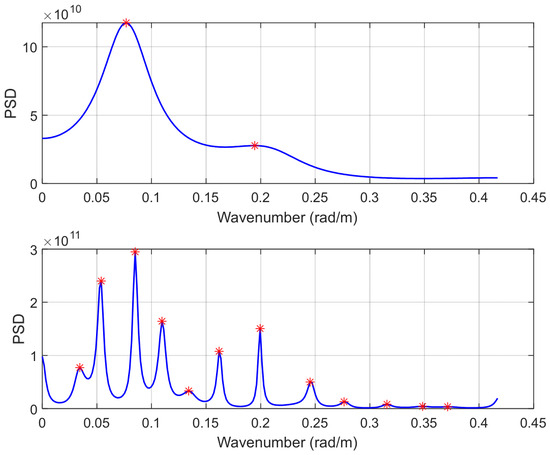
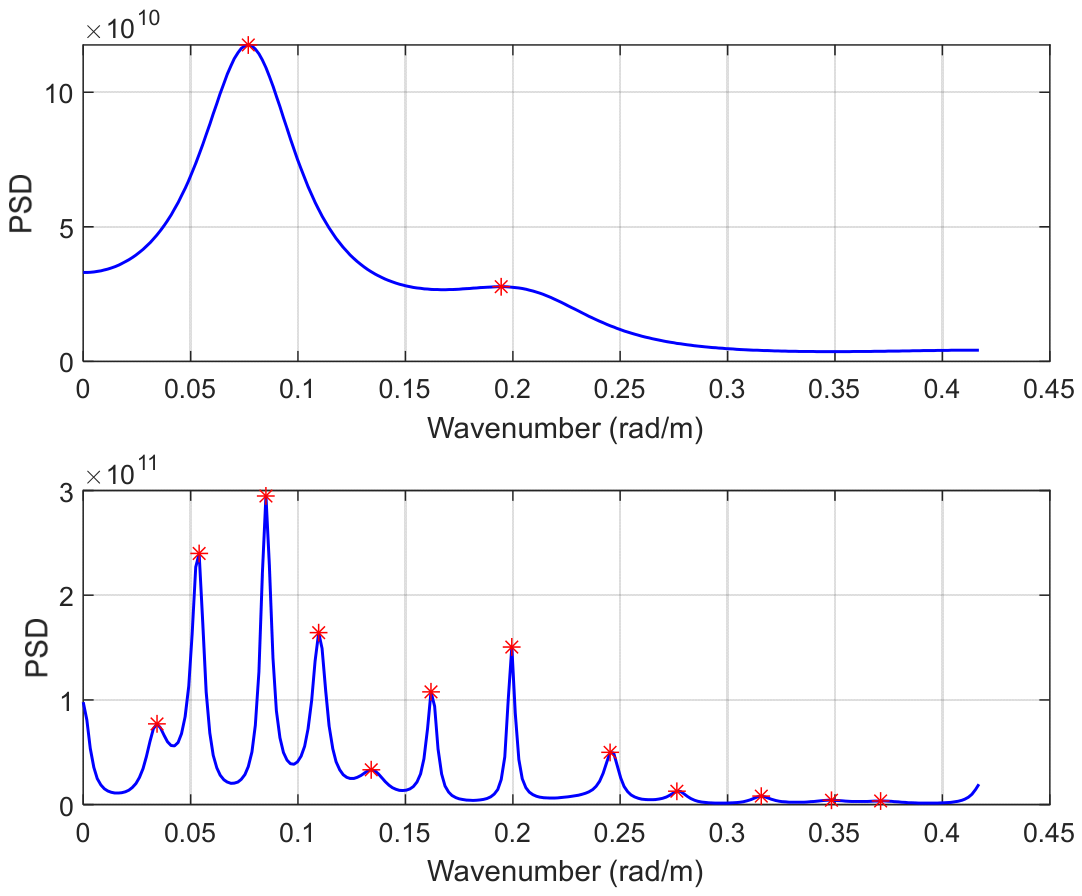
After determining the order of the auto regressive model for the selected principal component, the PSD of the first principal component can be obtained based on the Burg algorithm. The PSD of the first principal component is given in the lower half of Figure 7. The horizontal axis denotes wavenumber, and the vertical axis indicates the PSD. The red star denotes the peak value captured from the obtained wavenumber spectrum. Using the ideal order based on the Akaike information criterion, the obtained PSD is stable and has high spectrum resolution. It could be observed that the peak value could be accurately captured. Based on the position of the captured peak value, the wavenumber and corresponding candidate wavelength in two directions are achieved. Then, using Equation (17), the wavelength is derived.
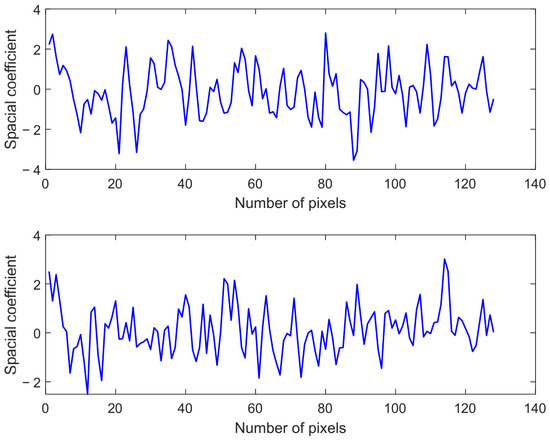
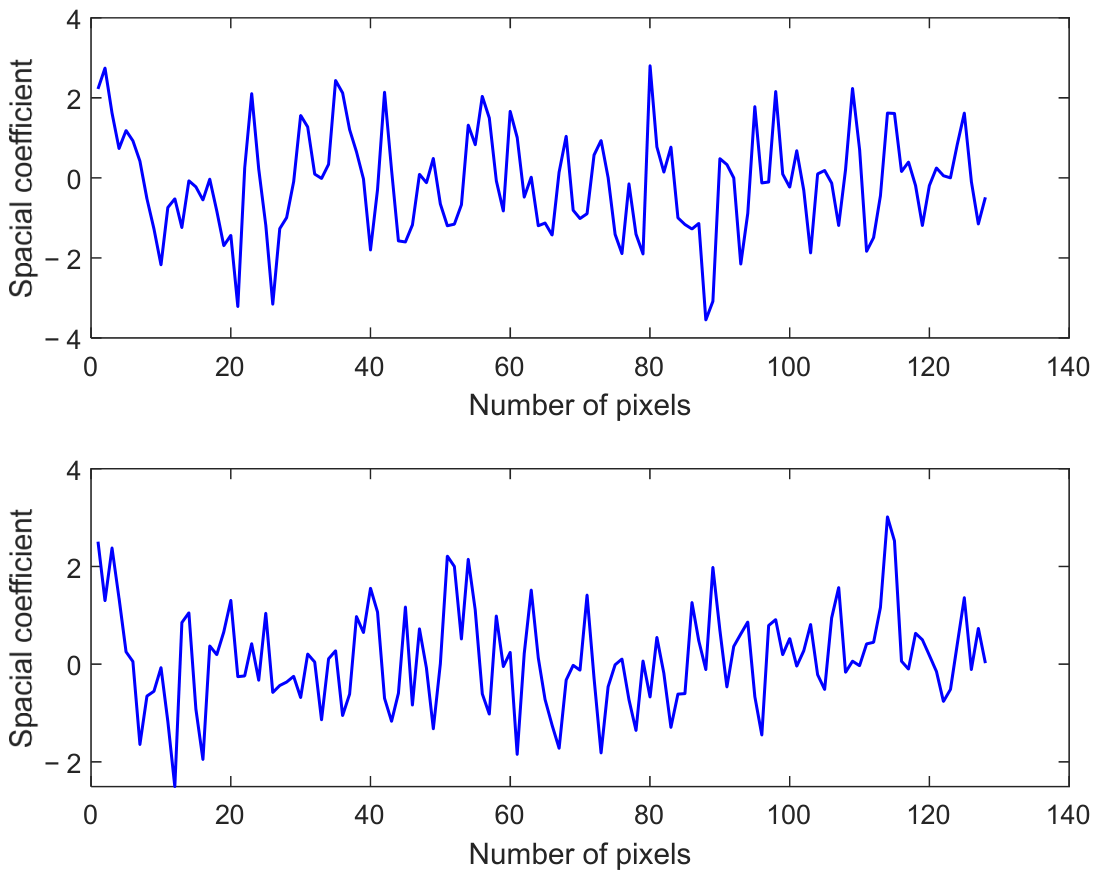
In this paper, after REOF decomposition, the obtained first principal component is adopted for subsequent wavelength retrieval, rather than retaining multiple modes according to the cumulative variance contribution. Range-dependent echo attenuation manifests as a smooth and monotonic radial decay trend from near to far radar range, which is fully removed in the preprocessing echo calibration step before REOF decomposition and cannot be embedded into the first principal component. In Figure 7, the spatial distribution of the first REOF mode exhibits clear, consistent periodic fluctuations with a stable dominant spatial scale and high amplitude, fully reflecting the dynamic characteristics of real ocean waves. The spatial load field of the fifth principal component and the tenth principal component are presented in Figure 8. The fifth mode shows weakened periodicity and reduced amplitude, reflecting a growing contribution of non-wave clutter and local disturbances. The tenth mode lacks identifiable periodic structure, containing not much useful information about the dominant wave. The comparison demonstrates that the first REOF mode presents a distinct periodic waveform and is well suited for wavelength extraction.
Figure 8.
Achieved fifth and tenth principal components.
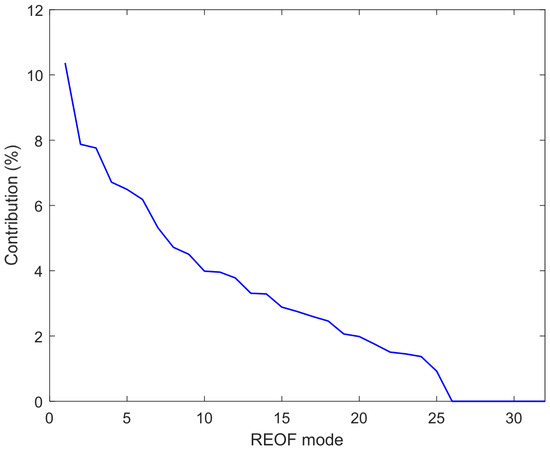
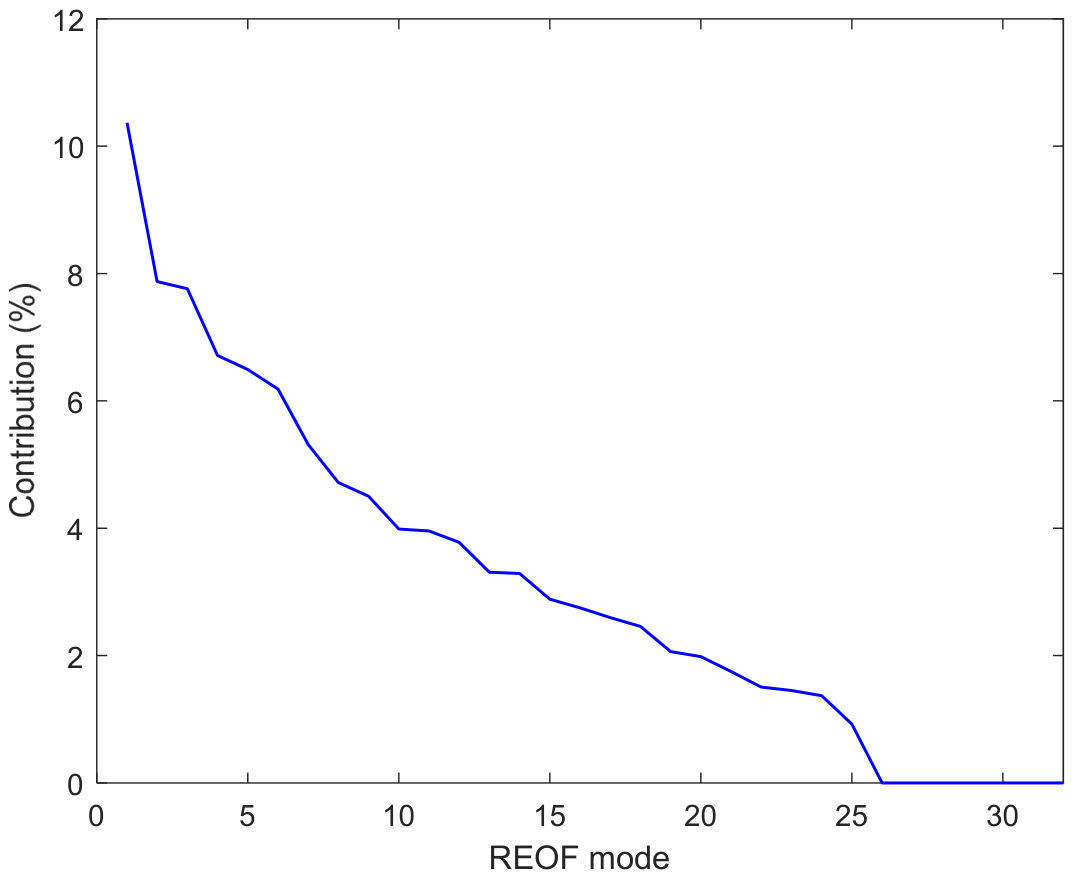
The variance contribution of the 32 REOF modes is shown in Figure 9. It can be found that the contributions decrease rapidly with increasing mode order and the first mode has the highest contribution. The first mode exhibits clear, stable periodic fluctuations corresponding to the dominant wave scale and carries the largest proportion of wave energy, representing the dominant spatial variability. The experimental results in Figure 7 show that the PSD obtained from the first mode shows a single, clear dominant peak corresponding to the wavenumber.
Figure 9.
Contribution of different REOF modes.
The choice of Burg model order can influence spectral peak detection. In this paper, the optimal Burg order configuration adopted is automatically determined based on the final prediction error criterion for the first REOF mode, which balances spectral resolution and noise suppression [39]. The PSD spectrum obtained with the optimal order is shown in the lower panel of Figure 7, exhibiting a single, well-defined dominant peak at the expected wavenumber, corresponding to the dominant wavelength. Based on the first principal component, the corresponding PSD spectra using 5 and 30 orders are presented in Figure 10. The top panel of the PSD obtained with 5 order yields an over-smoothed power spectrum, blurring the spectral peak corresponding to dominant waves and bringing systematic wavelength deviation. The spectrum is overly smoothed, with reduced resolution. For the 30-order Burg PSD in the lower panel, the spectrum is dominated by numerous spurious peaks, including many high-frequency components, which interfere with the subsequent REOF decomposition and increase the uncertainty of the wavelength output.
Figure 10.
Achieved PSD under 5 and 30 model orders.
Thus, the SWH is achieved by using the estimated wave slope and the wavelength extracted by using the REOF and the Burg algorithm. Since the wave buoy outputs one record per hour which works in the last 20 min per hour, the wave height retrieved from radar image sequences is averaged during 20 min, which is validated against the SNR-based method, the fundamental shadow statistical method, and the reference values, respectively.
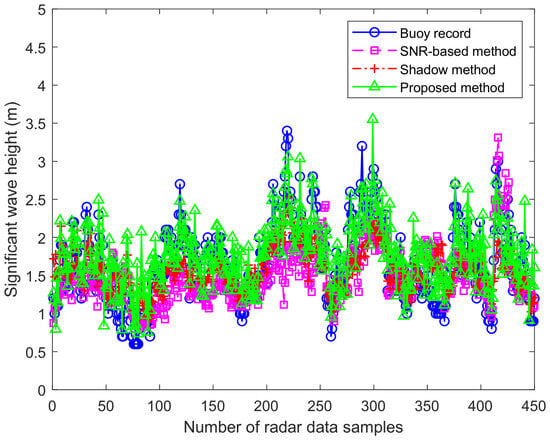
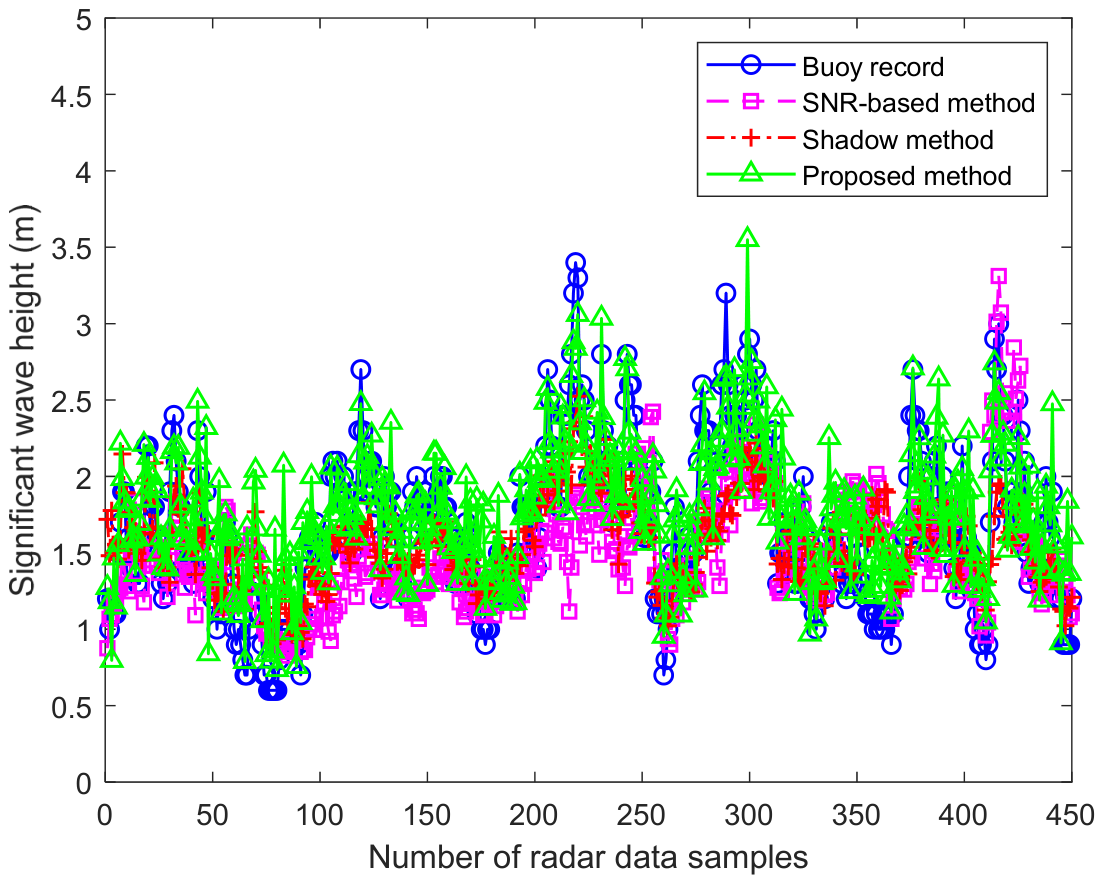
After processing the acquired image sequence, the wave height could be derived. The buoy record wave height and derived SWH based on the proposed approach, fundamental shadow statistical method, and SNR-based method are described in Figure 11. In the experiment, the radar data spanning 450 h are used to verify the algorithm performance. The horizontal axis indicates the number of samples, while the vertical axis corresponds to SWH. Wave height data acquired by the ocean buoy ranges from 0.5 m to 3.5 m. The time interval is one hour between two neighboring data points on the horizontal axis.
Figure 11.
Comparison between derived SWH and recorded value of wave buoy.
The time interval is one hour between two neighboring data points on the horizontal axis. The solid line with blue circle represents the SWH measured by the wave buoy. The dashed line with pink square is the extracted SWH using the SNR-based method. The solid line with green triangle and the dashed line with red cross denote the SWH extracted using the proposed approach and the fundamental shadow statistical method, respectively. In Figure 11, the results show that the wave height derived from the fundamental shadow statistical method can better dynamically follow the true value fluctuation. The SWH values obtained via the proposed approach show higher consistency with buoy-recorded data than those from the original shadow statistical method. The SNR-based method shows acceptable consistency with buoy measurements within several local segments. However, severe underestimation is exhibited in the range of 100~250 samples, and abnormal overestimated values appear near the peak at sample 420, which indicates limited robustness.
Unlike the shadow statistical method and the proposed algorithm that require no empirical calibration, the SNR-based spectral method contains undetermined empirical coefficients that require calibration using measured buoy data. Strictly separating independent calibration and test sets would force nearly half of the field data to be excluded from evaluation. Given the limited quantity of synchronous radar-buoy observations in the experiment, half of all synchronous radar-buoy samples are randomly selected for calibrating the empirical coefficients of the relationship between SNR and SWH. Considering the limited samples of synchronous radar-buoy observations, all available samples are adopted for performance evaluation of the SNR-based method. The calibration dataset overlaps with the test dataset, which may bring a slight favorable bias to the SNR-based method. However, the overall accuracy of the SNR-based method is still inferior to the proposed method and the shadow statistical method, which further demonstrates the reliability and superiority of the proposed approach.
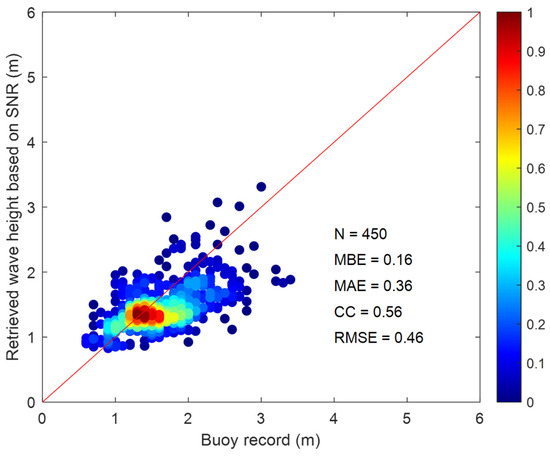
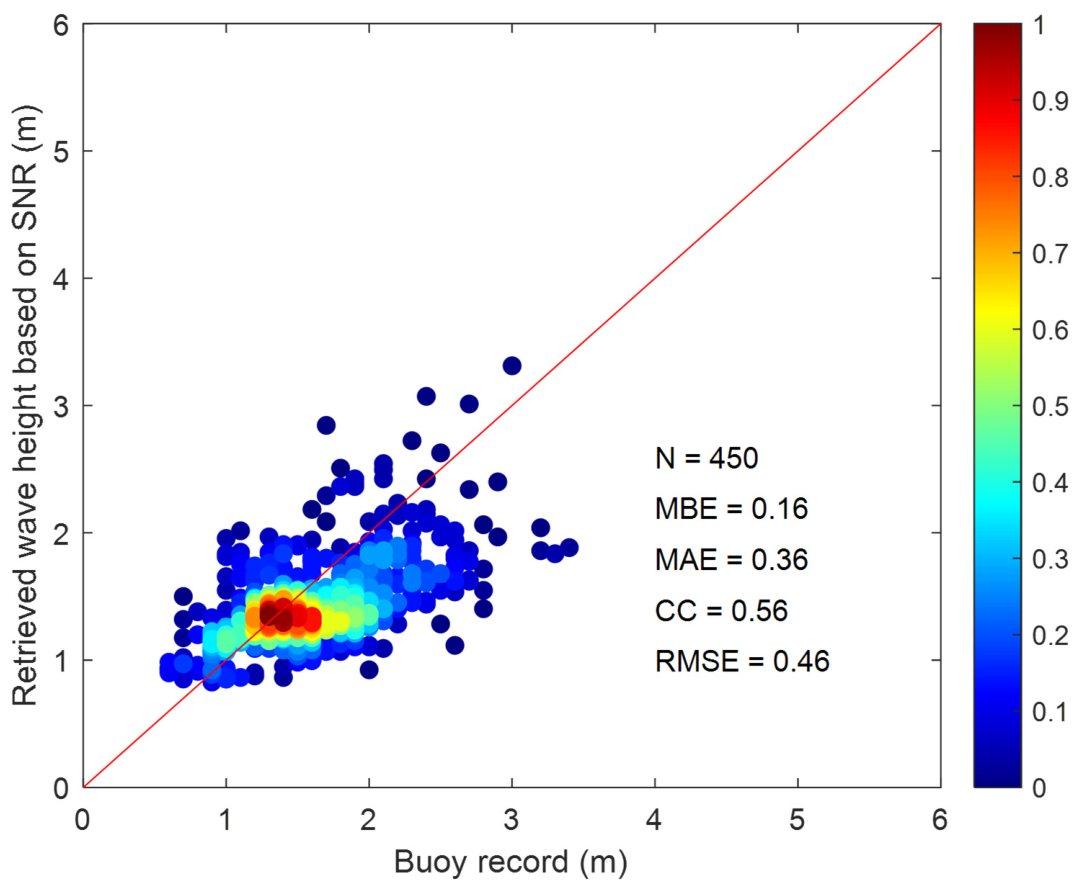
The scatter plot between the buoy measurement and the SWH retrieved by the SNR-based method is represented in Figure 12. The red diagonal line is the reference line. Most data points of SWH are concentrated in the range of 1~2 m based on the color density distribution, which demonstrates that the SNR-based method can estimate the SWH effectively. The mean absolute error (MAE) and mean bias error (MBE) are 0.36 m and 0.16 m, respectively. In this paper, MBE is defined as the buoy record minus the retrieved SWH from radar images. However, the correlation coefficient (CC) is only 0.56, and the root mean square error (RMSE) is 0.46 m, which presents a moderate linear correlation between the retrieved SWH and buoy record. The SNR-based method performs reasonably well in low-to-moderate sea states but exhibits notable limitations for high sea conditions.
Figure 12.
Scatter plot between derived wave height using SNR-based approach and buoy value.
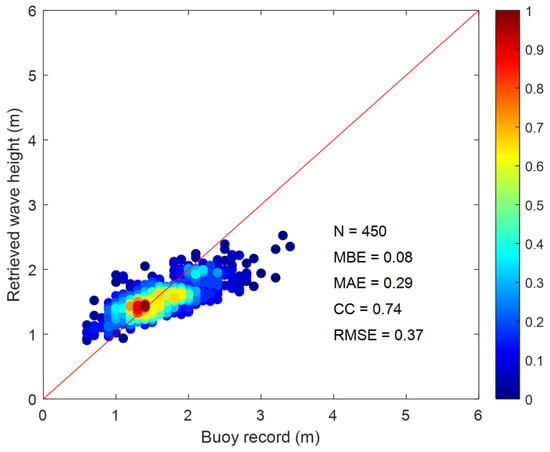
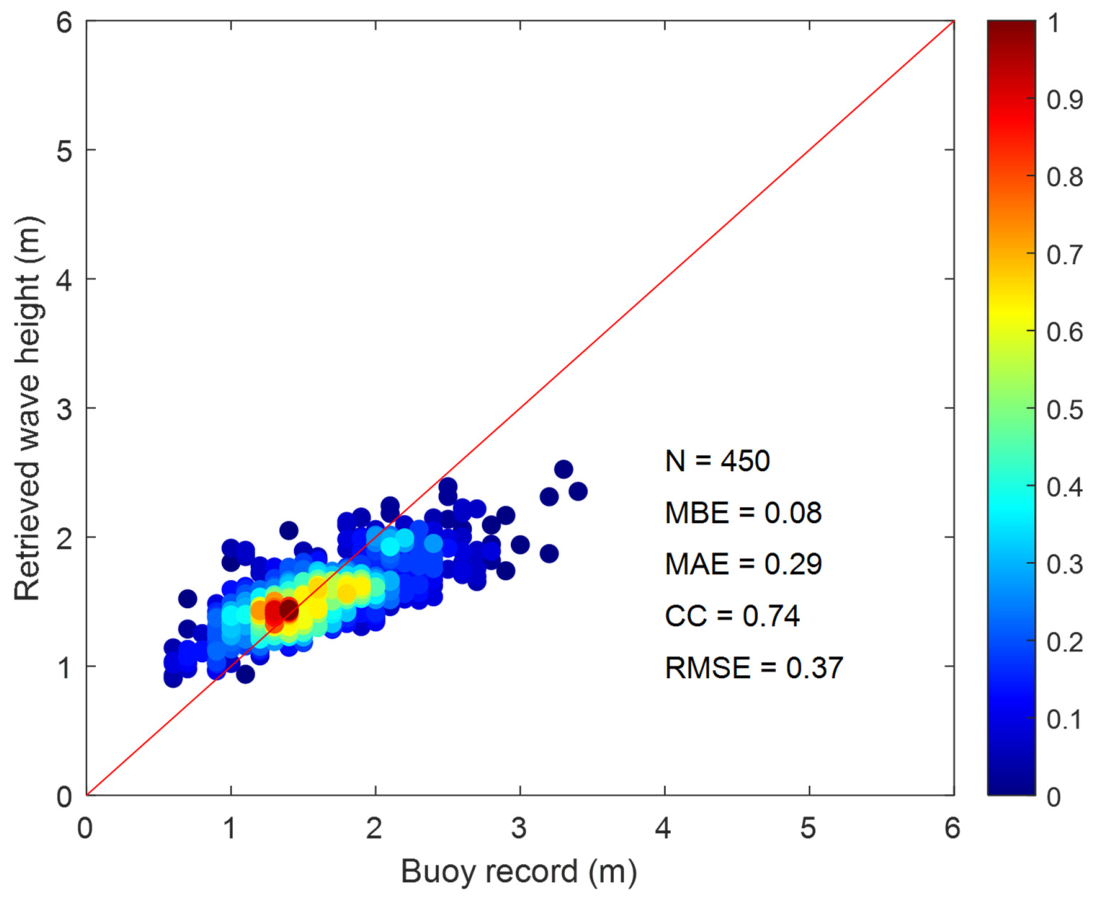
The scatter diagram of wave heights retrieved via the shadow statistical method versus buoy-measured values is illustrated in Figure 13. The horizontal axis corresponds to the recorded wave height of the wave buoy, and the vertical axis stands for the retrieved SWH. The red solid line indicates the line of ideal positive correlation. The color circle denotes the scatter density distribution of wave height between buoy-measured values and the conventional shadow-based approach. As indicated by the inversion result in Figure 9, the MAE, MBE, and RMSE are 0.29 m, 0.08 m and 0.37 m, respectively. The fundamental shadow statistical method shows good performance and stability under different sea conditions. The retrieved wave heights show a relatively tight distribution around the 1:1 line, with a clear positive correlation with the buoy measurements. Between the shadow-based method and the reference value, the achieved CC is 0.74.
Figure 13.
Scatter plot between derived wave height using fundamental shadow-based approach and buoy value.
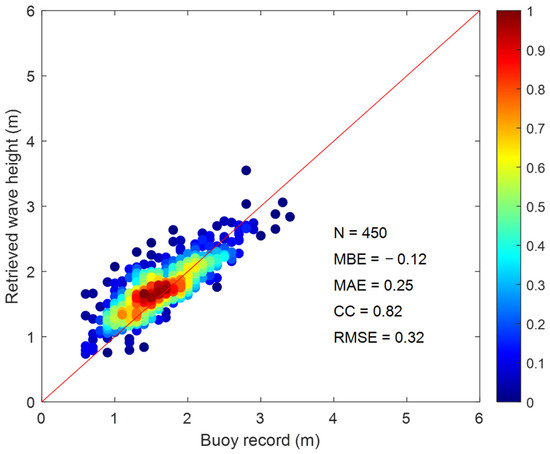
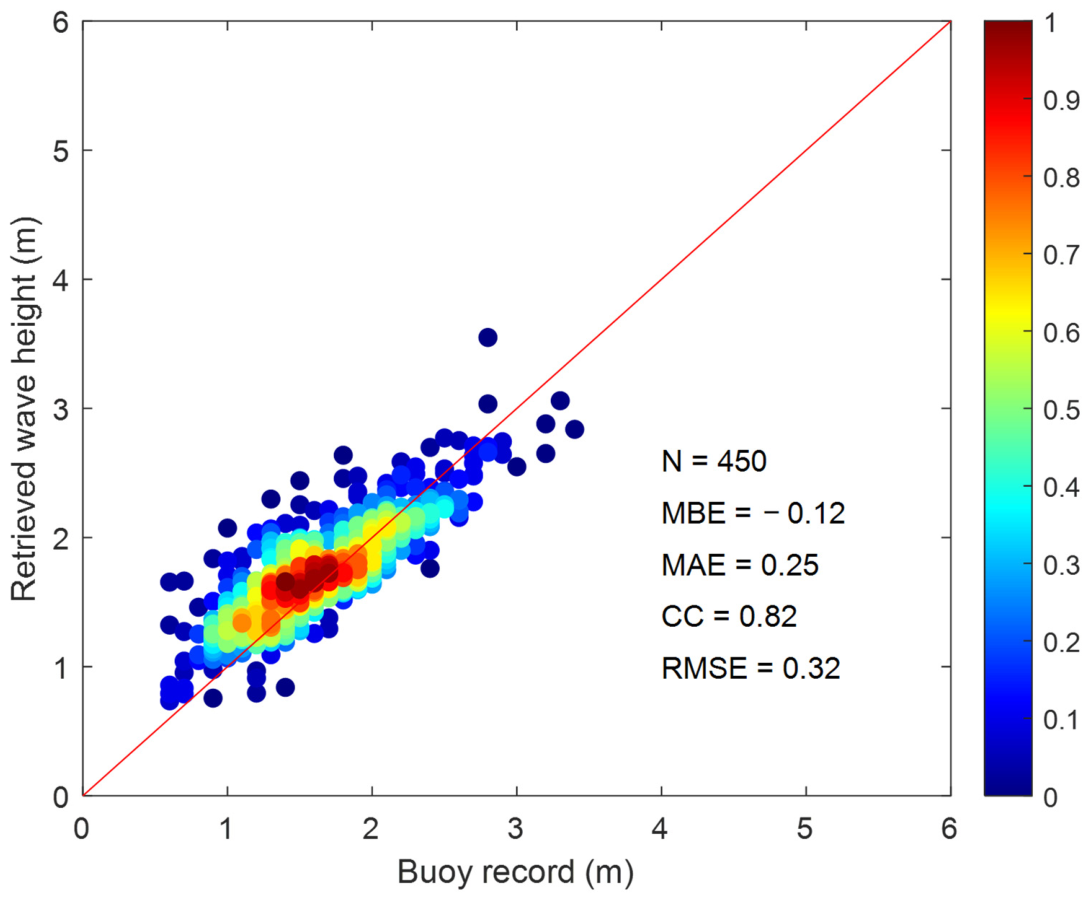
Figure 14 is the scatter plot of wave height between the proposed method and the wave buoy. The vertical axis denotes the retrieved SWH based on the proposed method, which uses the REOF and Burg algorithm. The SWH calculated using the proposed method is much closer to the buoy record compared to that calculated by the fundamental shadow statistical method. It can be observed that the scatter points are near the complete correlation line. However, the derived wave height is overestimated when the wave height is less than 1 m. Under fully developed sea conditions, the empirical relationship of SWH to wavelength and wave steepness is derived. For low sea states with SWH less than 1 m, the ocean wave is often not fully developed, and the sea surface is relatively smooth. In addition, the radar backscattered echo intensity decays rapidly with increasing range. The weak echo in the far range is mistakenly identified as shadow regions, which leads to an overestimated shadow ratio. Then, the retrieved RMS wave steepness and SWH are positively biased. In the future, an adaptive threshold for separating the radar images should be generated to accurately calculate the shadow ratio and wave steepness. Meanwhile, a calibrated piecewise correction factor could be incorporated to reduce the overestimation bias. For the proposed method, the MAE, MBE, and RMSE are 0.25 m, −0.12 m and 0.32 m, respectively. The experimental results show that the RMSE is reduced by 0.05 m compared with the fundamental shadow statistical method. The CC of the proposed method increased by 0.08 and reached 0.82. The inversion accuracy of the SWH is significantly enhanced. Although the wavelength measured from the radar image is used, accuracy is still improved compared with the existing shadow method and the reference equipment. Compared with the reference value, the method proposed has a larger correlation coefficient, and the absolute error of the wave height is smaller.
Figure 14.
Scatter plot between derived wave height based on the proposed method and buoy value.
For the traditional shadow statistical method, the wave height is calculated by using the relationship to wave steepness and wave period. The wave period is commonly derived from temporal wave spectrum analysis or in-situ buoy observation. For the proposed method, the achieved wave steepness and wavelength using the extracted principal component are utilized to estimate wave height. The wavelength is stably extracted via REOF spatial decomposition and Burg spatial spectrum estimation, which fully utilizes the spatial periodicity of ocean waves. The wave steepness calculation is completely identical for both the proposed method and the shadow statistical method. The performance improvement is uniquely attributable to the novel wavelength retrieval scheme, rather than random experimental error.
To further demonstrate the accuracy improvement, the 95% confidence interval (CI) uncertainty analysis is supplemented using buoy measurements as ground truth. The 95% CIs for the SNR-based spectral analysis method, the shadow statistical method, and the proposed method are [0.1213, 0.2021] m, [0.0503, 0.1174] m and [−0.1434, −0.0889] m, respectively. The SNR-based method exhibits the largest deviation and the widest CI, which shows severe systematic underestimation and the highest uncertainty. The traditional shadow statistical method improves accuracy by using wave steepness. Compared to the SNR-based method and the shadow statistical method, the proposed method achieves the narrowest 95% CI. The proposed method fully utilizes the stable spatial characteristics of ocean waves. Although a slight positive deviation exists, the overall error range is the most concentrated and stable. Based on the 95% CI, the performance differences are statistically significant, which fully proves that the accuracy improvement of the proposed method is reliable.
The proposed method improves the retrieval accuracy of SWH by combing the estimated wave steepness using the shadow statistical method with the wavelength derived based on the REOF. In this paper, the analysis regions for wave steepness and wavelength are aligned, and richer spatial and temporal information is introduced during wave height inversion. The calculations of wavelength and wave steepness are based on sea surface observations at the same spatio-temporal scale, fundamentally eliminating the systematic bias caused by inconsistent analysis windows in the traditional shadow statistical method. Meanwhile, the fusion of multi-frame image sequences improves the stability and robustness of wave height estimation.
5. Discussion
The effectiveness and accuracy of the shadow statistical method have been verified using shore-based and ship-based X-band marine radar images. However, external reference is still used to provide the wave period for retrieving the SWH. To retrieve wave height without external reference equipment and improve the retrieval accuracy, the extracted wavelength based on the principal component is adopted, which is completely independent of the reference equipment. Thus, by using the calculated sea surface steepness in the temporal sub-image sequence and the extracted main wavenumber from the wave spectrum. The obtained wave height only depends on the radar images and is completely independent of the reference equipment.
Radar backscattered echo intensity from the sea surface shows distinct directional characteristics. The oncoming wave direction produces strong backscatter, and the direction perpendicular to wave propagation suffers from weakened echoes. Selecting a sub-image near the oncoming wave direction is the optimal region for wave inversion. Due to limited scanning coverage, coastline occlusion, and complex seabed topography, the ideal analysis region cannot always be achieved for shore-based radar observations in practice. When the optimal sub-region is unavailable, the fixed analysis window inevitably deviates from the wave direction. The calculated wave steepness from a radar image based on shadow statistics changes with the azimuth of the selected analysis area and is highly sensitive to azimuth variation and cannot be easily calibrated. The wave steepness is often overestimated using the shadow statistical method, introducing a positive systematic bias. Since wavelength can be effectively corrected via geometric calculation based on the angle between the sampling direction and the actual wave direction, the deviation caused by azimuth offset is relatively controllable. Although wavelength can still be reasonably corrected using angle relationships to reduce errors, the overestimated wave steepness dominates the final calculation, ultimately leading to fluctuations of retrieved wave height. Thus, the retrieved wave height and calculated steepness depend on the position of the analysis area. To mitigate the azimuth-dependent bias of wave steepness and improve the overall robustness of the algorithm, the impact of the analysis area position at different azimuths on wave steepness and wavelength could be investigated in the future.
REOF solves the limitations of EOF in spatial locality, sampling error, and physical interpretation through rotation technology, making it particularly suitable for research fields that require precise regional feature analysis. Restricted by the radar antenna rotation speed, the acquired radar image sequence has low temporal resolution. The space observation area of marine radar in the distance direction is sufficiently used based on the obtained spatial information using REOF. Compared to the fundamental shadow statistical method, instead of using wave period, the wavelength is estimated based on the REOF. Thus, the wave height is directly derived according to the relationship to wave steepness and wavelength.
Although the test site has geographic uniqueness, the dataset and experimental results remain credible and sufficient to verify the core superiority of the improved shadow statistical wave inversion approach. (1) A total of 450 matched radar-buoy synchronous data pairs are adopted, which form a statistically adequate sample size for quantitative performance evaluation. As shown in Figure 13 and Figure 14, the scatter density distribution fully covers the entire measured wave height interval of 0.5~3.5 m, and dense sampling points are concentrated in the most frequent sea states with SWH of 1~2 m at Haitan Island, which is the dominant working condition of shore-based marine radar in this coastal zone. (2) The Haitan Island site is a typical swell-influenced coastal area, which is a common working scenario for shore-based X-band radar in southeast China coastal waters. Even under the complex local geographic conditions, the model maintains stable inversion accuracy, which proves the practical value of the proposed approach for similar swell-dominated coastal observation sites. However, all measurements are obtained at one coastal site with unique topographic swell interference. The available in-situ buoy data only covers a moderate wave height range of 0.5~3.5 m, lacking extremely large storm waves greater than 3.5 m. In addition, only one single buoy was used as ground truth reference, without cross-verification from multiple synchronous offshore measuring devices.
Considering the high cost of field marine radar observation, long-term synchronous data collection with buoys requires substantial resources. Restricted by the local marine environment, seasonal meteorological conditions and the cost of long-term observation arrangements, the measured SWH is mainly concentrated in moderate sea states. For extreme storm sea states with SWH greater than 3.5 m, severe storms and huge waves are rare in the surveyed nearshore area. For extremely calm sea conditions with SWH less than 0.5 m, the sea surface is nearly smooth. Radar backscatter signals are extremely weak and easily overwhelmed by thermal noise and sea clutter, which makes it difficult to extract valid wave information stably via radar images. Based on the existing data, the proposed method performs well and works stably for moderate sea states. However, the performance and robustness under extreme sea states remain unconfirmed.
6. Conclusions
In order to reduce the dependence of the fundamental shadow statistical method on the reference device, combining the shadow statistical method and principal component analysis technology, a method for extracting the SWH from X-band marine radar images is presented in this paper. The fundamental shadow statistical method is used to extract wave steepness, and the wavelength is obtained using the principal component methodology. The proposed method has the advantage of no external reference equipment for calibration and can complete the task of SWH inversion. The performance of the retrieved wave height illuminates that the proposed method in this paper can improve the inversion accuracy of the SWH. The CC between the proposed method and the reference is increased by 0.08, and the RMSE is reduced by 0.05 m, compared with that of the traditional shadow statistical method.
The wave height has been calculated based on the definition of wave steepness. The calculated steepness depends on the position of the analysis area. The impact of the analysis area position at different azimuths on wave steepness and wavelength could be investigated in the future. In the experiment, the wavelength extraction based on REOF and PSD analysis is vulnerable to echo attenuation and multiple spectral peaks. Considering the range-induced echo attenuation, a distance attenuation correction function has been applied to calibrate the amplitude of radar echoes at different ranges, so as to restore the true spatial characteristics of waves. After obtaining the PSD curve based on the Burg algorithm, physical constraints combined with prior wavelength ranges are set to distinguish real wave spectral peaks from spurious peaks caused by noise and interference, which greatly improves the success rate and accuracy of wavelength extraction. With the mentioned distance attenuation correction and dominant peak screening strategies, the reliability of wavelength extraction has been significantly improved. Further optimization of signal processing modules will be carried out to adapt the algorithm to more complex sea environments. Due to the limitations of the experimental environment, the wave height of the sea state data used in this paper is mainly distributed between 0.5~3.5 m, and the applicability of the proposed method under different sea conditions needs to be further verified.
Author Contributions
Conceptualization, Y.M. and J.W.; methodology, Y.M.; software, J.W.; validation, Y.M. and J.W.; investigation, Y.W.; writing—original draft preparation, Y.M.; writing—review and editing, Y.W.; visualization, F.N.; supervision, T.Z.; project administration, T.Z. All authors have read and agreed to the published version of the manuscript.
Funding
This research was funded in part by Henan Province Science and Technology Research and Development Program under grant No. 262102240014, 252102110381, 252102220128, and the Key Scientific Research Project in Colleges and Universities of Henan Province under Grant No. 25B170006 and 24A120012.
Institutional Review Board Statement
Not applicable.
Informed Consent Statement
Not applicable.
Data Availability Statement
The data presented in this study are available on request from the corresponding author due to proprietary restrictions of the coastal radar observation platform and the confidentiality agreement of in-situ buoy monitoring data.
Acknowledgments
The authors greatly appreciate the editors and anonymous reviewers for their efforts in improving the quality of this article.
Conflicts of Interest
The authors declare no conflict of interest.
References
- Huang, W.; Liu, X.; Gill, E.W. Ocean wind and wave measurements using X-band marine radar: A comprehensive review. Remote Sens. 2017, 9, 1261. [Google Scholar] [CrossRef] [Scilit]
- Wang, H.; Qiu, H.; Wang, L.; Huang, J.; Ruan, X. Sea surface wind speed retrieval from marine radar image sequences based on GLCM-derived texture features. Entropy 2025, 27, 877. [Google Scholar] [CrossRef] [Scilit] [PubMed]
- Chen, J.; Li, S.; Zhu, J.; Liu, M.; Li, R.; Cui, X.; Li, L. Significant wave height prediction based on variational mode decomposition and dual network model. Ocean Eng. 2025, 323, 120533. [Google Scholar] [CrossRef] [Scilit]
- Huang, W.; Yang, Z. Ocean wave classification and wave direction estimation from marine radar images. Ocean Eng. 2026, 356, 125096. [Google Scholar] [CrossRef] [Scilit]
- Zuo, S.; Wang, D.; Wang, X.; Suo, L.; Liu, S.; Zhao, Y.; Liu, D. Wave height and period estimation from X-band marine radar images using convolutional neural network. J. Mar. Sci. Eng. 2024, 12, 311. [Google Scholar] [CrossRef] [Scilit]
- Wei, Y.; Zheng, Y.; Lu, Z. A method for retrieving wave parameters from synthetic X-band marine radar images. IEEE Access. 2020, 8, 204880–204890. [Google Scholar] [CrossRef] [Scilit]
- Sun, L.; Lu, Z.; Wei, Y.; Wang, H. A new method to retrieve rainfall intensity level from rain-contaminated X-band marine radar image. Int. J. Remote Sens. 2023, 44, 585–608. [Google Scholar] [CrossRef] [Scilit]
- Lund, B.; Collins, C.O.; Tamura, H.; Graber, H.C. Multi-directional wave spectra from marine X-band radar. Ocean Dyn. 2016, 66, 973–988. [Google Scholar] [CrossRef] [Scilit]
- Yang, Z.; Huang, W.; Chen, X. Mitigation of rain effect on wave height measurement using X-band radar sensor. IEEE Sens. J. 2022, 22, 5929–5938. [Google Scholar] [CrossRef] [Scilit]
- Stle-Hentschel, S.; Carrasco, R.; Nieto Borge, J.C.; Seemann, J.; Toledo, Y. Improved estimation of the directional wave spectrum from marine radar images by employing a directional modulation transfer function (MTF). Ocean Eng. 2024, 307, 118126. [Google Scholar] [CrossRef] [Scilit]
- Nieto-Borge, J.C.; Rodríguez, G.R.; Hessner, K.; Gonzalez, P.I. Inversion of marine radar images for surface wave analysis. J. Atmos. Ocean. Technol. 2004, 21, 1291–1300. [Google Scholar] [CrossRef] [Scilit]
- Nieto-Borge, J.C.; Hessner, K.; Jarabo-Amores, P.; de la Mata-Moya, D. Signal-to-noise ratio analysis heights from X-band marine to estimate ocean wave radar image time series. IET Radar Sonar Navig. 2008, 2, 35–41. [Google Scholar] [CrossRef] [Scilit]
- Lund, B.; Collins, C.O.; Graber, H.C.; Terrill, E.; Herbers, T.H.C. Marine radar ocean wave retrieval’s dependency on range and azimuth. Ocean Dyn. 2014, 64, 999–1018. [Google Scholar] [CrossRef] [Scilit]
- Al-Habashneh, A.A.; Moloney, C.; Gill, E.W.; Huang, W. An adaptive method of wave spectrum estimation using X-band nautical radar. Remote Sens. 2015, 7, 16537–16554. [Google Scholar] [CrossRef] [Scilit]
- Salcedo-Sanz, S.; Nieto-Borge, J.C.; Carro-Calvo, L.; Cuadra, L.; Hessner, K.; Alexandre, E. Significant wave height estimation using SVR algorithms and shadowing information from simulated and real measured X-band radar images of the sea surface. Ocean Eng. 2015, 101, 244–253. [Google Scholar] [CrossRef] [Scilit]
- Liu, X.; Huang, W.; Gill, E.W. Estimation of significant wave height from X-band marine radar images based on ensemble empirical mode decomposition. IEEE Geosci. Remote Sens. Lett. 2017, 14, 1740–1744. [Google Scholar] [CrossRef] [Scilit]
- Yang, Z.; Huang, W. Wave height estimation from X-band radar data using variational mode decomposition. IEEE Geosci. Remote Sens. Lett. 2022, 19, 5. [Google Scholar] [CrossRef] [Scilit]
- Chen, Z.; He, Y.; Zhang, B.; Qiu, Z.; Yin, B. A new algorithm to retrieve wave parameters from marine X-band radar image sequences. IEEE Trans. Geosci. Remote Sens. 2014, 52, 4083–4091. [Google Scholar] [CrossRef] [Scilit]
- Gangeskar, R. An algorithm for estimation of wave height from shadowing in X-band radar sea surface images. IEEE Trans. Geosci. Electron. 2014, 52, 3373–3381. [Google Scholar] [CrossRef] [Scilit]
- Plant, W.J.; Farquharson, G. Wave shadowing and modulation of microwave backscatter from the ocean. J. Geophys. Res. Oceans 2012, 117, 14. [Google Scholar] [CrossRef] [Scilit]
- Atkinson, J.; Esteves, L.S.; Williams, J.J.; Bell, P.S.; McCann, D.L. Nearshore monitoring with X-band radar: Maximizing utility in dynamic and complex environments. J. Geophys. Res. Oceans 2021, 126, 19. [Google Scholar] [CrossRef] [Scilit]
- Liu, X.; Huang, W.; Gill, E.W. Wave height estimation from shipborne X-band nautical radar images. J. Sens. 2016, 2016, 1078053. [Google Scholar] [CrossRef] [Scilit]
- Meng, Y.; Wang, J.; Tian, Z.; Niu, F.; Wei, Y. Method of estimating wave height from radar images based on genetic algorithm back-propagation (GABP) neural network. Information 2026, 17, 109. [Google Scholar] [CrossRef] [Scilit]
- Ludeno, G.; Serafino, F. Estimation of the significant wave height from marine radar images without external reference. J. Mar. Sci. Eng. 2019, 7, 432. [Google Scholar] [CrossRef] [Scilit]
- Navarro, W.; Velez, J.C.; Orfila, A. A shadowing mitigation approach for sea state parameters estimation using X-band remotely sensing radar data in coastal areas. IEEE Trans. Geosci. Remote Sens. 2019, 57, 6292–6310. [Google Scholar] [CrossRef]
- Yao, Z.; Chu, X.; Fan, J.; Wang, F. Retrieving significant wave height based on prewitt operator from X-band radar images. Syst. Eng. Electron. 2022, 44, 1182–1187. [Google Scholar] [CrossRef] [Scilit]
- Wang, L.; Mei, H.; Yi, K. Improved CycleGAN-based shadow estimation for ocean wave height inversion from marine X-band radar images. Geocarto Int. 2022, 37, 14050–14064. [Google Scholar] [CrossRef] [Scilit]
- Wei, Y.; Wang, Y.; He, C.; Song, H.; Lu, Z.; Wang, H. A method of extracting the SWH based on a constituted wave slope feature vector (WSFV) from X-band marine radar images. Remote Sens. 2023, 15, 5355. [Google Scholar] [CrossRef] [Scilit]
- Wei, Y.; Song, H.; Lei, Y.; Liu, K.; Lu, Z. A method of retrieving significant wave height based on shadowing from X-band marine radar images. Int. J. Remote Sens. 2023, 44, 5259–5282. [Google Scholar] [CrossRef] [Scilit]
- Vicen-Bueno, R.; Lido-Muela, C.; Nieto-Borge, J.C. Estimate of significant wave height from non-coherent marine radar images by multilayer perceptrons. EURASIP J. Adv. Signal Process. 2012, 2012, 84. [Google Scholar] [CrossRef] [Scilit]
- Zong, C.; Lu, Z.; Wei, Y. Wave height measurement based on feature fusion extracted from marine radar images. J. Sea Res. 2025, 208, 102626. [Google Scholar] [CrossRef] [Scilit]
- Park, J.; Ahn, K.; Oh, C.; Chang, Y.S. Estimation of significant wave heights from X-band radar using artificial neural network. J. Korean Soc. Coast. Ocean Eng. 2020, 32, 561–568. [Google Scholar] [CrossRef] [Scilit]
- Huang, W.; Yang, Z.; Chen, X. Wave height estimation from X-band nautical radar images using temporal convolutional network. IEEE J. Sel. Top. Appl. Earth Obs. Remote Sens. 2021, 14, 11395–11405. [Google Scholar] [CrossRef] [Scilit]
- Zhao, M.; Zheng, Y.; Lin, Z. Sea surface reconstruction from marine radar images using deep convolutional neural networks. J. Ocean Eng. Sci. 2023, 8, 647–661. [Google Scholar] [CrossRef] [Scilit]
- Ludeno, G.; Esposito, G.; Lugni, C.; Soldovieri, F.; Gennarelli, G. A deep learning strategy for the retrieval of sea wave spectra from marine radar data. J. Mar. Sci. Eng. 2024, 12, 1609. [Google Scholar] [CrossRef] [Scilit]
- Yang, Z.; Huang, W. Wave height estimation from radar images under rainy conditions based on context-aware segmentation and iterative dehazing. IEEE Trans. Radar Syst. 2025, 3, 101–114. [Google Scholar] [CrossRef] [Scilit]
- Rezvov, V.Y.; Krinitskiy, M.A.; Golikov, V.A.; Tilinina, N.D. Improvement of the AI-based estimation of significant wave height based on preliminary training on synthetic X-band radar sea clutter images. Mosc. Univ. Phys. Bull. 2023, 78, 188–201. [Google Scholar] [CrossRef] [Scilit]
- Wang, H.; Lu, Z. Research on small scale wind streak factor of navigation radar-image sequences. In Proceedings of the 8th International Symposium on Computational Intelligence and Design (ISCID), Hangzhou, China, 12–13 December 2015; pp. 335–339. [Google Scholar]
- Kazlauskas, K. The Burg algorithm with extrapolation for improving the frequency estimation. Informatica 2011, 22, 177–188. [Google Scholar] [CrossRef] [Scilit]
- Tucker, M.J.; Pitt, E.G. Waves in Ocean Engineering; Elsevier: Amsterdam, The Netherlands, 2001. [Google Scholar]
- Secretariat of the World Meteorological Organization. Guide to Wave Analysis and Forecasting; World Meteorological Organization: Geneva, Switzerland, 1998. [Google Scholar]
Disclaimer/Publisher’s Note: The statements, opinions and data contained in all publications are solely those of the individual author(s) and contributor(s) and not of MDPI and/or the editor(s). MDPI and/or the editor(s) disclaim responsibility for any injury to people or property resulting from any ideas, methods, instructions or products referred to in the content. |
© 2026 by the authors. Licensee MDPI, Basel, Switzerland. This article is an open access article distributed under the terms and conditions of the Creative Commons Attribution (CC BY) license.