


Abstract
The integration of artificial intelligence (AI) and machine learning (ML) into cybersecurity practice has increased the need for hands-on, data-driven learning in cybersecurity education. This paper presents a classroom-oriented phishing URL classification study using the UCI PhiUSIIL Phishing URL Dataset (2024), a public benchmark with 235,795 instances and 54 features suitable for supervised learning tasks. Four widely used ML classifiers—Random Forest (RF), Support Vector Machine (SVM), Decision Tree (DT), and Logistic Regression (LR)—were evaluated using accuracy, precision, recall, specificity, and F1-score. The results show that RF achieved the best overall performance with 93.33% accuracy and 93.75% F1-score, while SVM produced the highest precision (93.85%). DT showed strong specificity but lower recall, and LR yielded the weakest overall performance. The study is designed to support cybersecurity education by using interpretable baseline models, standard evaluation metrics, and a reproducible public dataset. It provides a practical workflow for lab activities and course projects while contributing an empirical comparison that complements existing pedagogical frameworks in AI-enabled cybersecurity education.
1. Introduction
Cybersecurity education is undergoing a significant transformation as artificial intelligence (AI) and machine learning (ML) become increasingly embedded in contemporary security practice [1,2]. While traditional cybersecurity courses have largely emphasized foundational theory, manual inspection, and rule-based analysis, many real-world security tasks now depend on data-driven methods for phishing detection, malware analysis, and anomaly identification [3]. This shift has led recent educational research to call for stronger integration of AI and ML into cybersecurity curricula through structured, hands-on learning activities that better reflect current professional practice [4,5].
Within this context, phishing detection represents a particularly suitable instructional application [6,7]. Phishing remains one of the most persistent and practically relevant cyber threats, and it offers a clear supervised learning workflow through which students can engage with data preparation, classifier training, validation, and metric-based evaluation. Educationally, this makes phishing detection an effective case study for introducing learners to core ML concepts in cybersecurity, including model comparison using accuracy, precision, recall, and F1-score [8,9].
To support reproducibility and educational use, this study employs the UCI PhiUSIIL Phishing URL Dataset (2024)[10], a publicly available benchmark for phishing URL classification. The dataset contains 235,795 instances (legitimate and phishing URLs) and 54 features, making it suitable for comparative experiments with classical machine learning models. UCI also reports clear class labels and no missing values, which helps streamline preprocessing and classroom implementation [10,11].
This paper compares four commonly taught classifiers—Random Forest (RF), Support Vector Machine (SVM), Decision Tree (DT), and Logistic Regression (LR)—to examine their effectiveness for phishing URL classification in an educational setting. These models were selected because they are widely used in introductory and intermediate ML courses and provide meaningful differences in learning behavior (ensemble, margin-based, tree-based, and linear methods).
The input to the experiment is a labeled phishing URL dataset (training and test partitions). The outputs are (i) predicted class labels for each test sample, (ii) confusion matrices, (iii) metric scores (accuracy, precision, recall, specificity, and F1), and (iv) ROC/AUC values for model comparison. The main contributions are:
- (1)
- A reproducible educational workflow using a public benchmark dataset;
- (2)
- A comparative evaluation of RF, SVM, DT, and LR under a unified protocol;
- (3)
- An interpretation of model trade-offs relevant to cybersecurity education (false alarms vs. missed phishing).
The novelty of this work lies in delivering a reproducible, classroom-ready experimental blueprint for phishing URL classification using a recent public benchmark dataset. Unlike studies that focus primarily on algorithmic proposals, this paper emphasizes (i) a unified and teachable methodology for dataset preparation, cross-validation-based tuning, and evaluation; (ii) a controlled comparison of interpretable baseline models; and (iii) interpretability-oriented analysis to support cybersecurity education objectives (error trade-offs, threshold behavior, and model transparency.
Although the evaluated models are classical, the novelty of this study lies in the educationally reproducible design and interpretability-oriented analysis. Specifically, the paper contributes (i) a classroom-ready workflow that can be replicated with minimal resources (data allocation, preprocessing, cross-validation-based tuning, and evaluation); (ii) a controlled comparison of widely taught baseline classifiers that supports transparent learning; and (iii) interpretability and robustness analyses (feature importance and ablation) that allow students and educators to understand not only which model performs best, but also why performance changes when predictors are reduced.
The remainder of the paper is organized as follows. Section Related Work reviews related work in AI-based cybersecurity education and relevant technical cybersecurity studies. Section 2 describes the dataset and preprocessing procedures, including data allocation and cross-validation. Section 3 presents the research methodology and the considered classification models, together with the performance evaluation metrics. Section 4 reports the experimental results and provides a discussion of model trade-offs and educational implications. Finally, Section 5 concludes the paper and outlines directions for future work.
Related Work
Recent work in cybersecurity education has highlighted the value of integrating AI and ML into teaching through structured, hands-on activities. A key example is the pedagogical framework for AI-driven cybersecurity education, which combines constructivist learning, scaffolding, and experiential learning. In that framework, phishing detection is used as an introductory supervised learning task, where students apply machine learning models and evaluate them using metrics such as accuracy, precision, recall, and F1-score.
At the same time, much of the broader cybersecurity literature focuses on technical deployment problems rather than education. For example, some studies propose advanced deep learning and optimization pipelines for higher-education biometric verification or domain-specific attack detection systems. These works provide strong technical contributions and rigorous evaluation, but their complexity and operational focus make them less suitable for foundational cybersecurity teaching compared with interpretable baseline models.
Recent phishing detection research increasingly explores modern learners such as gradient boosting ensembles and deep neural architectures, which can provide high predictive performance but often require greater computational resources and may reduce transparency. From an educational perspective, this introduces a trade-off: while modern methods can improve accuracy, they may be less suitable for teaching foundational concepts such as error trade-offs, interpretability, and reproducible evaluation. Accordingly, the present study intentionally focuses on interpretable baseline models (RF, SVM, DT, LR) and complements benchmarking with feature-importance and ablation analysis, which provides a clearer learning pathway for cybersecurity courses. Advanced models are discussed as a future extension for multi-level course design (baseline-to-advanced progression).
This creates a gap between pedagogical frameworks and classroom-ready comparative ML experiments. The present study addresses that gap by using a recent public phishing dataset (UCI PhiUSIIL) and comparing four widely taught classifiers (RF, SVM, DT, and LR) using standard classification metrics. The goal is to provide an empirically grounded, reproducible case study that is both educationally accessible and technically meaningful.
Table 1 summarizes the main differences between the selected related studies and the present work. The reviewed papers cover three complementary directions: AI-enabled cybersecurity pedagogy, higher-education institutional cybersecurity (biometric verification), and domain-specific cybersecurity analytics for smart grids. This comparison helps position the present study as a classroom-oriented, empirical ML benchmarking study for phishing detection using interpretable baseline models and a public dataset.
Table 1.
Comparison of related studies.
2. Dataset and Preprocessing
2.1. Dataset Source and Description
This study uses the PhiUSIIL Phishing URL (Website) dataset from the UCI Machine Learning Repository [18], donated in March 2024. The dataset is designed for phishing URL detection and contains 235,795 instances with 54 features extracted from both the URL string and the webpage source code. It includes 134,850 legitimate and 100,945 phishing URLs and is provided in tabular form with real, categorical, and integer feature types [19,20]. The repository indicates that the dataset has no missing values and that the FILENAME column can be ignored. Class labels are defined as 1 = legitimate and 0 = phishing [10,21].
2.2. Data Preparation
To ensure reproducibility and fair comparison across classifiers, the following preprocessing pipeline was adopted:
- Column filtering: Remove non-informative fields (e.g., FILENAME) as recommended in the dataset documentation.
- Feature–label separation: Separate predictors from the target label (legitimate vs. phishing).
- Encoding categorical variables: Convert categorical attributes (e.g., URL, domain, TLD) into numeric representations using an appropriate encoding approach (e.g., one-hot encoding) so that all models can be trained consistently.
- Feature scaling (where needed): Apply standardization for scale-sensitive models—particularly SVM and Logistic Regression—while keeping tree-based models (RF, DT) unaffected by scaling choices.
- Dataset split: Partition the dataset into training and testing subsets using a stratified split to preserve the original class distribution (e.g., 80/20).
2.3. Rationale for Educational Use
The PhiUSIIL dataset is well-suited for cybersecurity education because it is public, large-scale, clearly labeled, and supports a complete end-to-end ML workflow (data preparation → model training → metric-based evaluation). Its mix of URL- and webpage-derived features also enables meaningful classroom discussions about feature relevance and real-world phishing indicators.
2.4. Input Data
The input to the experiment is a labeled phishing URL dataset organized in tabular form. Each sample consists of a single URL record represented by a set of numeric attributes derived from the original URL/webpage information, together with a binary class label. The dataset is divided into training and testing subsets. During model development, the training subset is used to learn classifier parameters and tune hyperparameters (via cross-validation), while the test subset is kept unseen for final evaluation.
2.5. Output Data
The output of the experiment includes:
- Predicted class labels for each sample in the test set (phishing or legitimate);
- A confusion matrix for each classifier summarizing correct and incorrect predictions (TP, TN, FP, FN);
- Performance metric values computed from the confusion matrix, including accuracy, precision, recall (sensitivity), specificity, and F1-score;
- ROC curves and AUC values (where applicable) to quantify discrimination ability across different decision thresholds.
The input to the experiment consists of labeled URL records represented as numeric attributes suitable for supervised learning. The output consists of predicted labels on unseen test data, confusion matrices, metric scores (accuracy, precision, recall, specificity, F1), and ROC/AUC values, enabling a fair comparison of model trade-offs.
2.6. Data Preparation and Dataset Partitioning
To illustrate the format of the training data, the model receives URL strings with a binary label (legitimate or phishing). Representative examples are shown below (anonymized; not intended to be accessed as active links):
- •
- Sample 1 (Legitimate): secure-domain/login? session = ID
- •
- Sample 2 (Legitimate): university-domain/portal/authentication
- •
- Sample 3 (Legitimate): service-domain/account/settings? ref = ID
- •
- Sample 4 (Phishing): random-domain/secure-update/verify-account
- •
- Sample 5 (Phishing): ip-address/path/confirm-login? user = ID
- •
- Sample 6 (Phishing): lookalike-domain/signin/verify? token = ID
3. Research Methodology
This study adopts a reproducible machine learning methodology for phishing URL classification using the UCI PhiUSIIL dataset. The workflow includes data preparation, dataset partitioning, classifier construction, and evaluation. All classifiers are trained and tested using the same split strategy and performance measures to ensure a fair comparison.
3.1. Data Preparation and Dataset Partitioning
After importing the dataset, non-informative fields (e.g., identifiers) are removed and labels are verified. Categorical attributes are converted into numerical form using an encoding strategy. Feature scaling is applied for scale-sensitive models (SVM and LR). The dataset is then split into training and testing subsets using a stratified approach to preserve the class distribution.
3.2. Classification Techniques
Four machine learning classifiers—Decision Tree (DT), Random Forest (RF), Support Vector Machine (SVM), and Logistic Regression (LR)—were selected for this study due to their widespread use in cybersecurity analytics and their suitability for comparative educational experiments [22,23,24,25]. These models provide complementary decision mechanisms (rule-based, ensemble-based, margin-based, and linear), enabling an informative evaluation of performance trade-offs in phishing URL classification, particularly under non-linear patterns and potential class imbalance.
3.2.1. Random Forest (RF)
Random Forest (RF) is an ensemble learning classifier that improves predictive performance by combining the outputs of multiple decision trees. Instead of relying on a single tree, RF trains a collection of trees using randomly sampled subsets of the training data, which enhances robustness and reduces overfitting. For classification tasks, the final label is obtained through majority voting across all trees, while for regression tasks the final output is typically computed as the average prediction. The method is particularly effective for complex problems due to its capability to capture nonlinear feature interactions and handle high-dimensional feature spaces [26,27].
In this study, the key RF hyperparameters include NumTrees (the number of trees in the ensemble), MinLeafSize (the minimum number of samples per leaf to limit overly specific rules), and MaxNumSplits (the maximum number of decision splits per tree, controlling tree depth). These parameters were selected using 5-fold cross-validation to obtain stable generalization performance.
Mathematical Formulation
For classification, let denote the predicted class label produced by the t.
t-th tree, where and T is the total number of trees (NumTrees). The RF final predicted class is determined by majority voting:
For regression, the RF prediction is computed as the mean of individual tree outputs:
During tree construction, node splits are commonly selected by minimizing an impurity measure such as the Gini index:
3.2.2. Support Vector Machine (SVM)
Support Vector Machine (SVM) is a supervised learning classifier that is effective for high-dimensional datasets and complex decision boundaries, which makes it suitable for phishing URL detection [28]. The main idea of SVM is to construct a separating hyperplane that maximizes the margin between classes. The samples that lie closest to the separating boundary—known as support vectors—are the most influential points in defining the classifier. This margin maximization typically improves generalization and helps reduce sensitivity to noise and overlapping patterns that often occur in phishing datasets [29,30].
In this study, an SVM with a radial basis function (RBF) kernel is employed to model potential non-linear relationships between URL/webpage features and the phishing/legitimate labels. The two primary kernel-related hyperparameters are C (regularization parameter controlling the trade-off between margin width and classification error) and γ (kernel parameter controlling the influence range of training samples). Proper tuning of these parameters is essential for improving detection performance. Table A1 SVM Parameter Illustration.
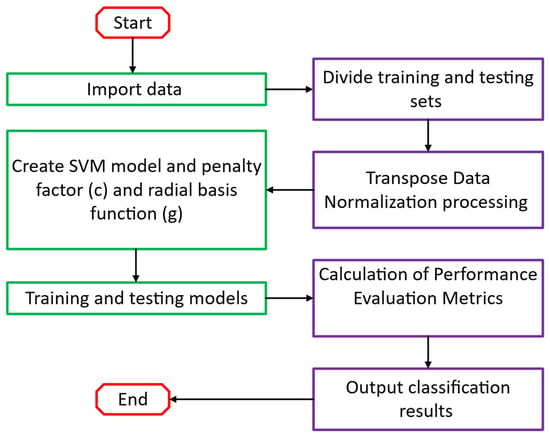
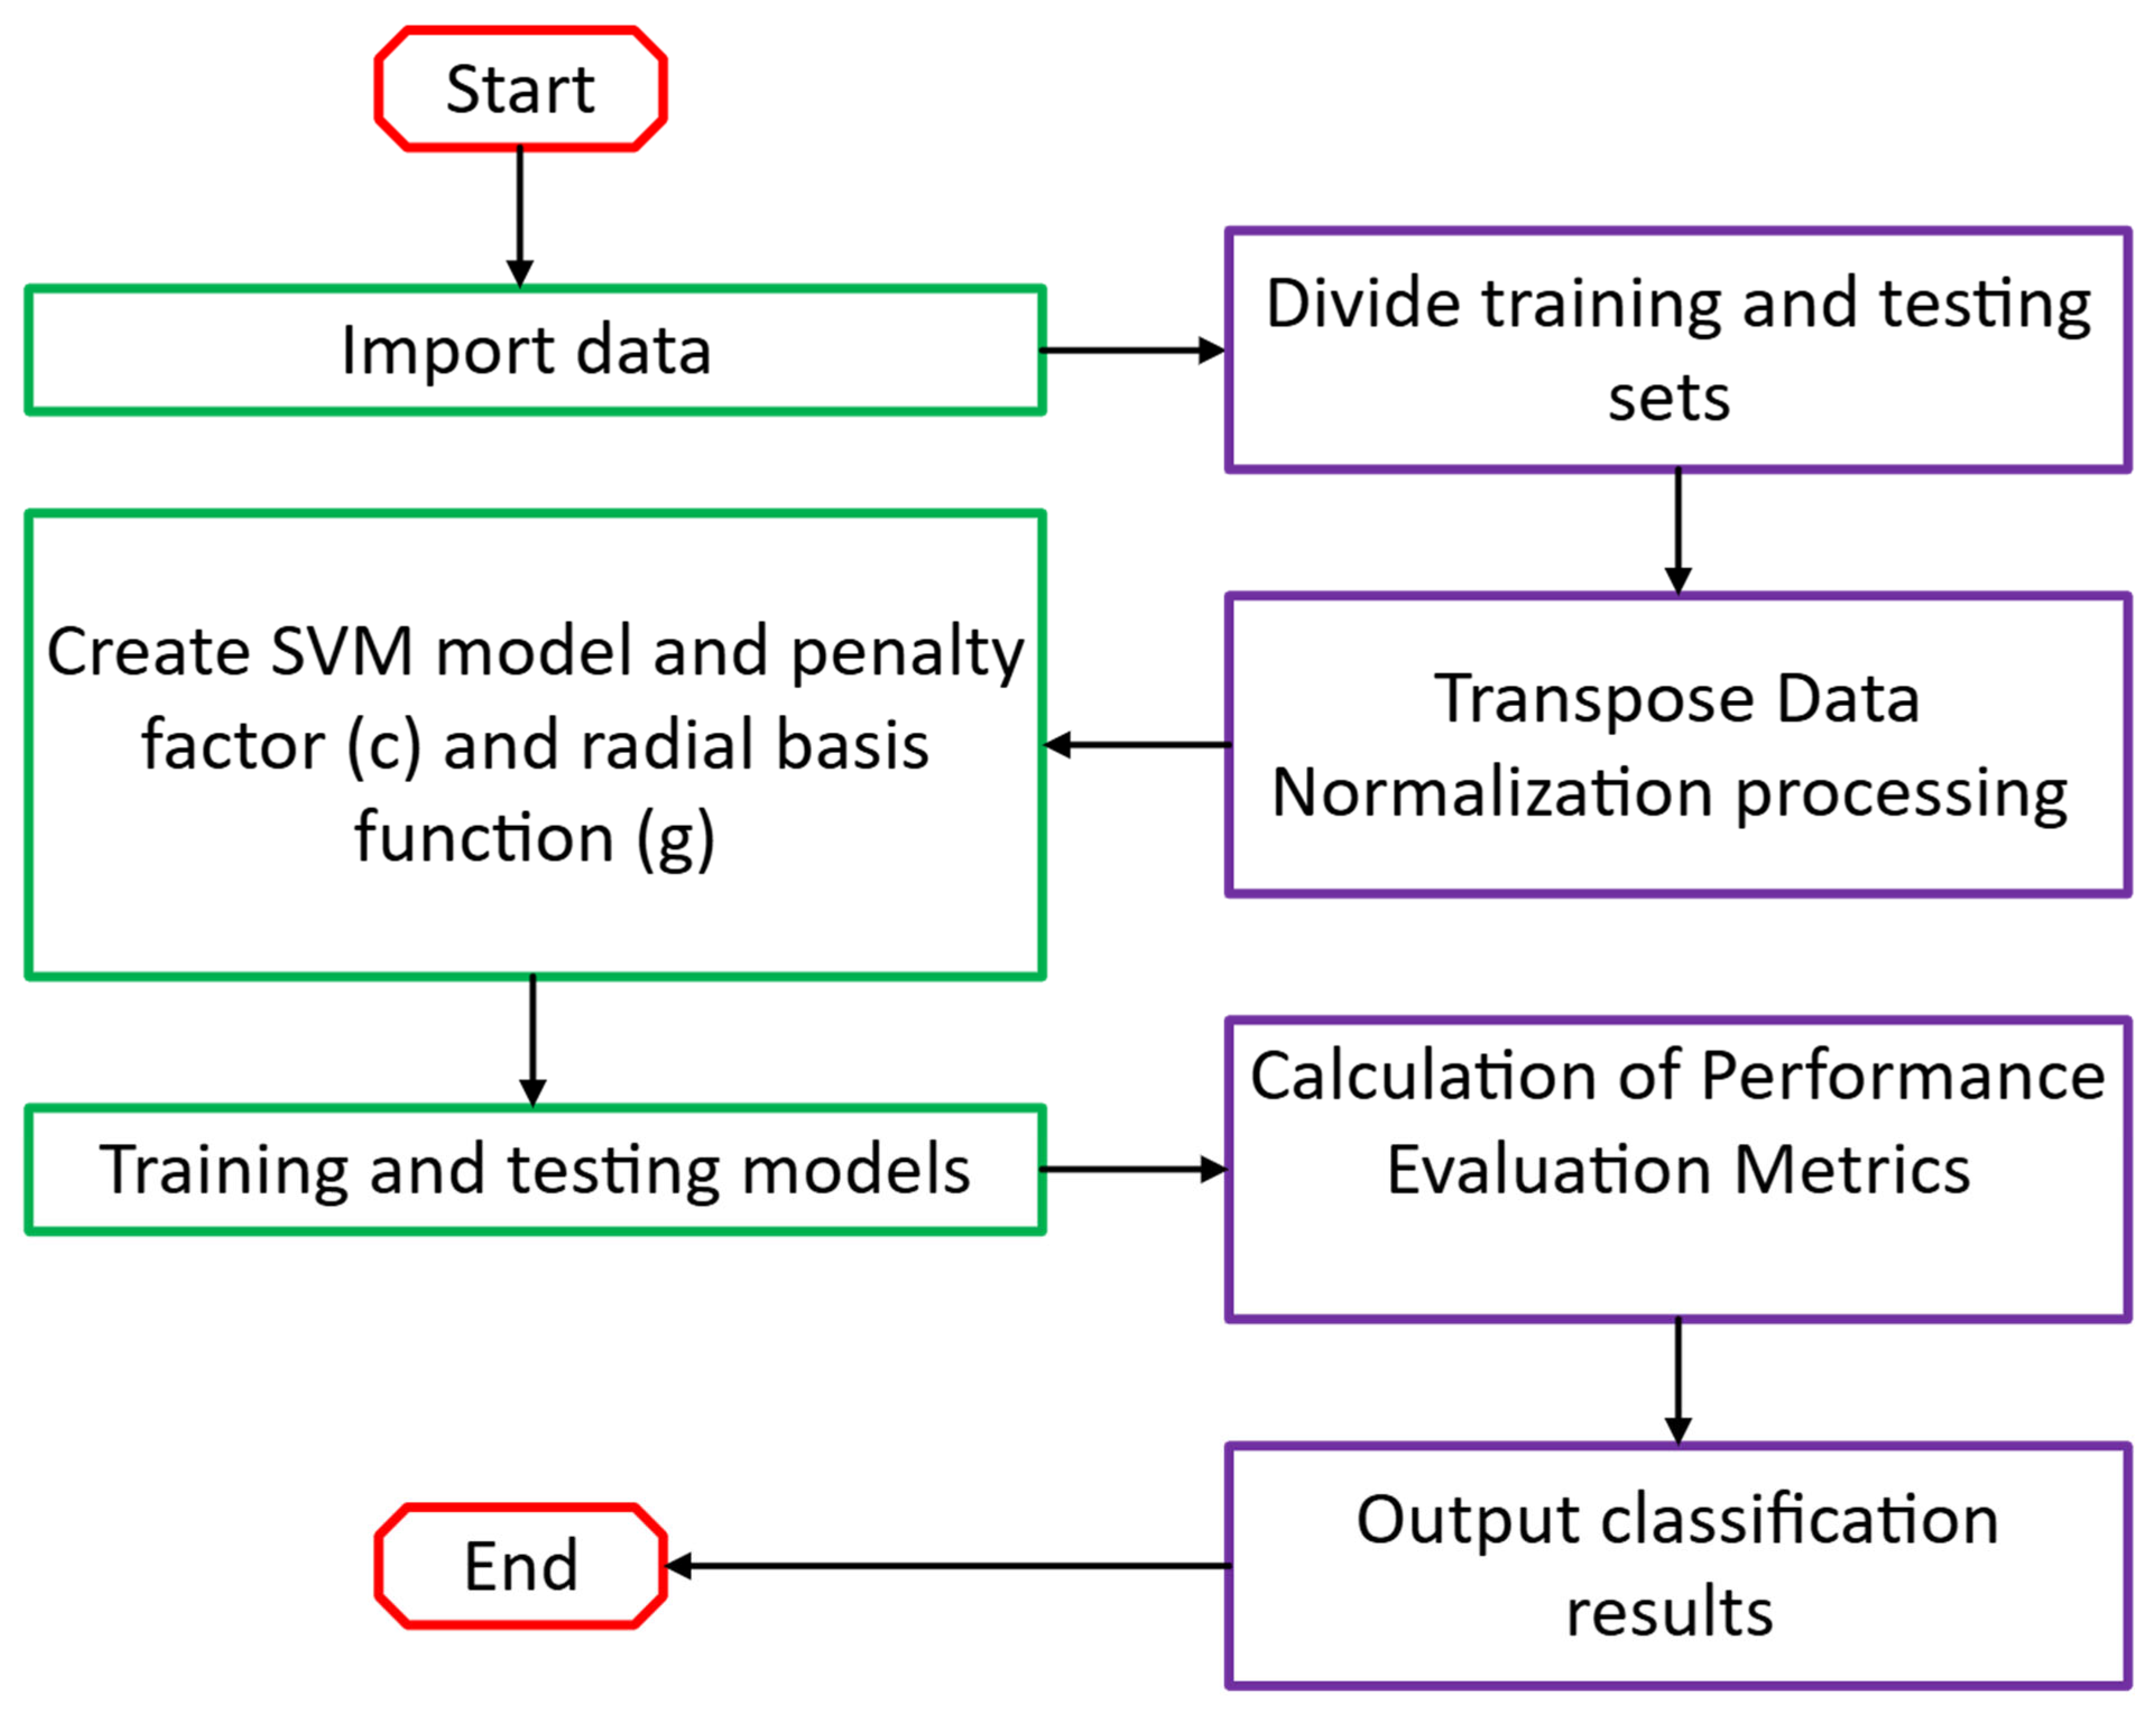
As illustrated in Figure 1, the SVM procedure begins by importing the dataset and dividing it into training and testing sets. The data then undergo normalization (after feature formatting/encoding) to ensure comparable feature scales, which is particularly important for SVM. Next, the SVM model is configured by selecting the kernel and setting the parameters C and γ. Finally, the model is trained and tested, performance evaluation metrics are computed, and classification results are reported.
Figure 1.
Flowchart Workflow of the SVM classifier.
Mathematical Formulation
The SVM objective is to determine the optimal separating hyperplane by solving the following optimization problem:
where w is the weight vector, b is the bias term, represents the feature vector of the i-th sample, and denotes its class label.
To support non-linear classification, the kernel trick is used. The RBF kernel is defined as:
where γ controls the width of the kernel and determines how far the influence of a single training example reaches.
3.2.3. Decision Tree (DT)
Decision Trees (DTs) are widely used in cybersecurity classification because they can capture non-linear patterns while remaining highly interpretable [31]. A DT builds a hierarchical set of decision rules by recursively splitting the dataset according to feature thresholds, with the goal of producing increasingly “pure” subsets at each node. This rule-based structure is valuable in phishing URL detection, as it enables clear interpretation of how specific URL and webpage features contribute to classifying a sample as phishing or legitimate.
DTs are also computationally efficient at inference time, which makes them suitable for classroom labs and practical deployments where fast classification is desirable. However, deep trees may overfit, especially when features are noisy or highly variable. To support better generalization, the tree depth (and related stopping criteria) can be tuned; in this study, the maximum depth was selected using 5-fold cross-validation to balance predictive performance and robustness [32,33].
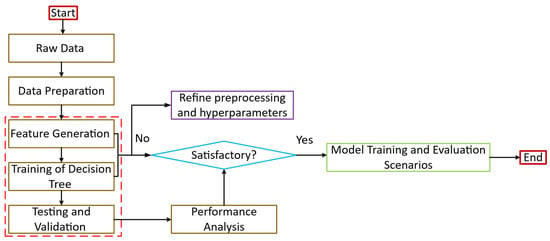
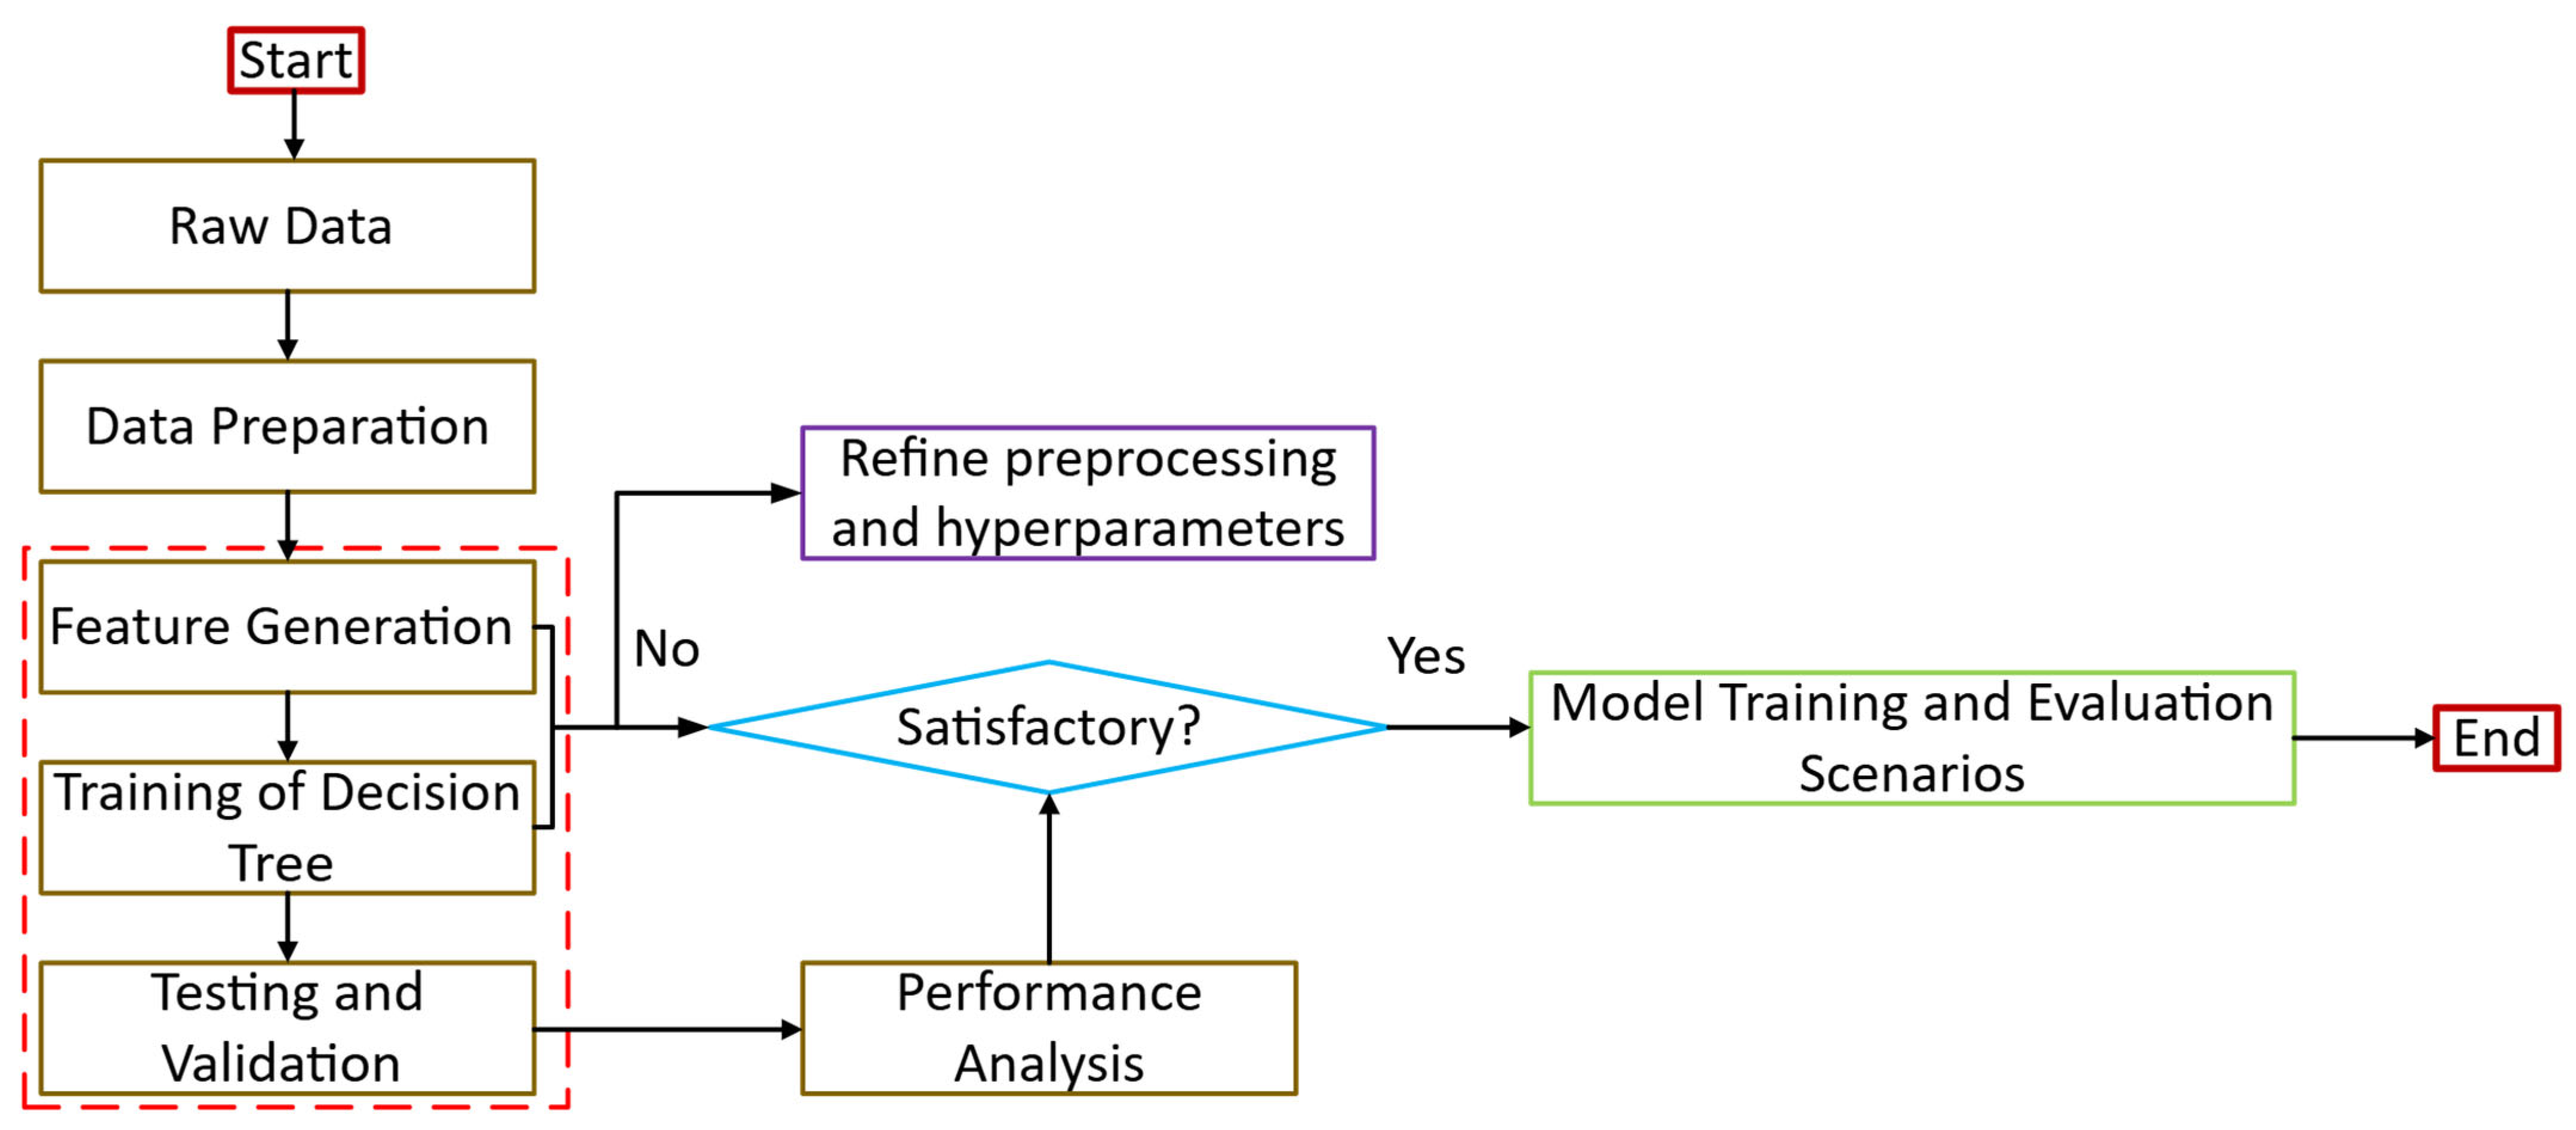
As shown in Figure 2, the DT procedure starts with raw data collection and data preparation, followed by feature generation/processing. The decision tree is then trained and evaluated using testing and validation. If the obtained performance is not satisfactory, the process is revised by refining preprocessing, feature handling, and/or tree settings, after which training and evaluation are repeated. Once satisfactory performance is achieved, the workflow proceeds to performance analysis and concludes.
Figure 2.
Flowchart of the DT classifier.
Mathematical Representation
At each node, the decision tree selects a feature and a threshold that best separates the data into two subsets by minimizing an impurity measure. A commonly used impurity function is the Gini index:
where denotes the proportion of samples belonging to class k at a given node, and K is the number of classes (here, K = 2). The splitting process continues until a stopping condition is met (e.g., maximum depth, minimum samples per leaf), after which the terminal node predicts the class label based on the dominant class in that node.
3.2.4. Logistic Regression (LR)
Logistic Regression (LR) is a widely used baseline method for binary classification, as it estimates the probability that an input sample belongs to a target class. In the context of phishing URL detection, LR predicts whether a URL is phishing or legitimate by mapping a linear combination of the input features to a probability score through the sigmoid function. LR is attractive for educational and practical settings because it is computationally efficient, easy to implement, and interpretable: the learned weights provide insight into how individual features contribute to the final decision [34,35].
Model parameters are typically learned by maximizing the log-likelihood of the observed labels, which allows the classifier to fit the training data while maintaining a simple linear decision boundary. Although LR is less flexible than non-linear classifiers such as SVM, and ensemble approaches such as RF, it provides a clear and informative reference model for assessing whether more complex learning strategies are necessary for accurate phishing detection.
Mathematical Model
Logistic regression models the probability of class membership as:
where w is the weight vector, b is the bias term, and x is the input feature vector. The parameters w and b are estimated by maximizing the log-likelihood function:
This optimization procedure selects parameters that best explain the observed training labels.
3.3. Data Allocation and K-Fold Cross-Validation Procedure
The dataset was split into training and testing subsets using a stratified strategy to preserve the phishing/legitimate class distribution. The test set was kept unseen and used only for final evaluation.
To tune model hyperparameters and improve generalization, K-fold cross-validation was applied on the training set. The training data were divided into K folds; in each run, K − 1 folds were used for training and the remaining fold for validation. This was repeated K times, and performance was averaged across folds. In this study, 5-fold cross-validation was used to select the best hyperparameter settings. The final model was then retrained on the full training set and evaluated on the test set using the selected metrics [36,37].
3.4. Performance Evaluation Metrics
Model performance is evaluated using a binary confusion matrix, where phishing URLs are treated as the positive class and legitimate URLs as the negative class. The confusion matrix terms are defined as: TP (phishing correctly classified), TN (legitimate correctly classified), FP (legitimate misclassified as phishing), and FN (phishing misclassified as legitimate).
- •
- Precision: indicates how many predicted phishing instances were truly phishing (controls false alarms).
- •
- Recall: indicates how many phishing instances were successfully detected (controls missed phishing).
- •
- Specificity: indicates how well legitimate URLs are correctly identified (controls false phishing flags).
As summarized in Table 2, this study evaluates classifier performance using the binary confusion matrix and the standard metrics derived from it (accuracy, precision, recall, specificity, and F1-score)
Table 2.
Confusion matrix and performance metric equations.
3.5. Computational Environment
Experiments were conducted on a workstation with [CPU model], [RAM] GB RAM, running [Windows/Linux/macOS version]. Model development and evaluation were implemented using [Libraries/MATLAB version] R2024a (MathWorks, Natick, MA, USA), with fixed random seeds for reproducibility.
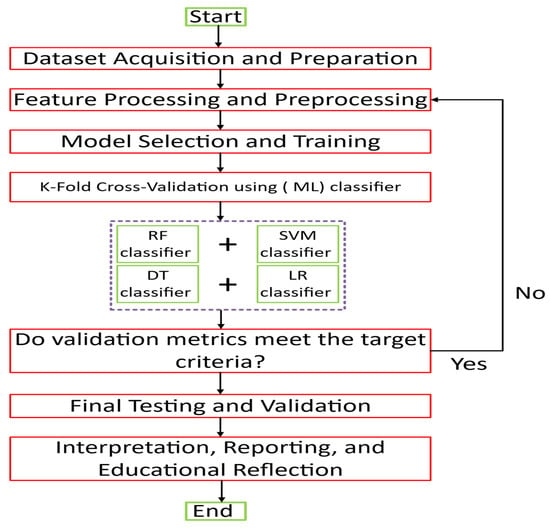
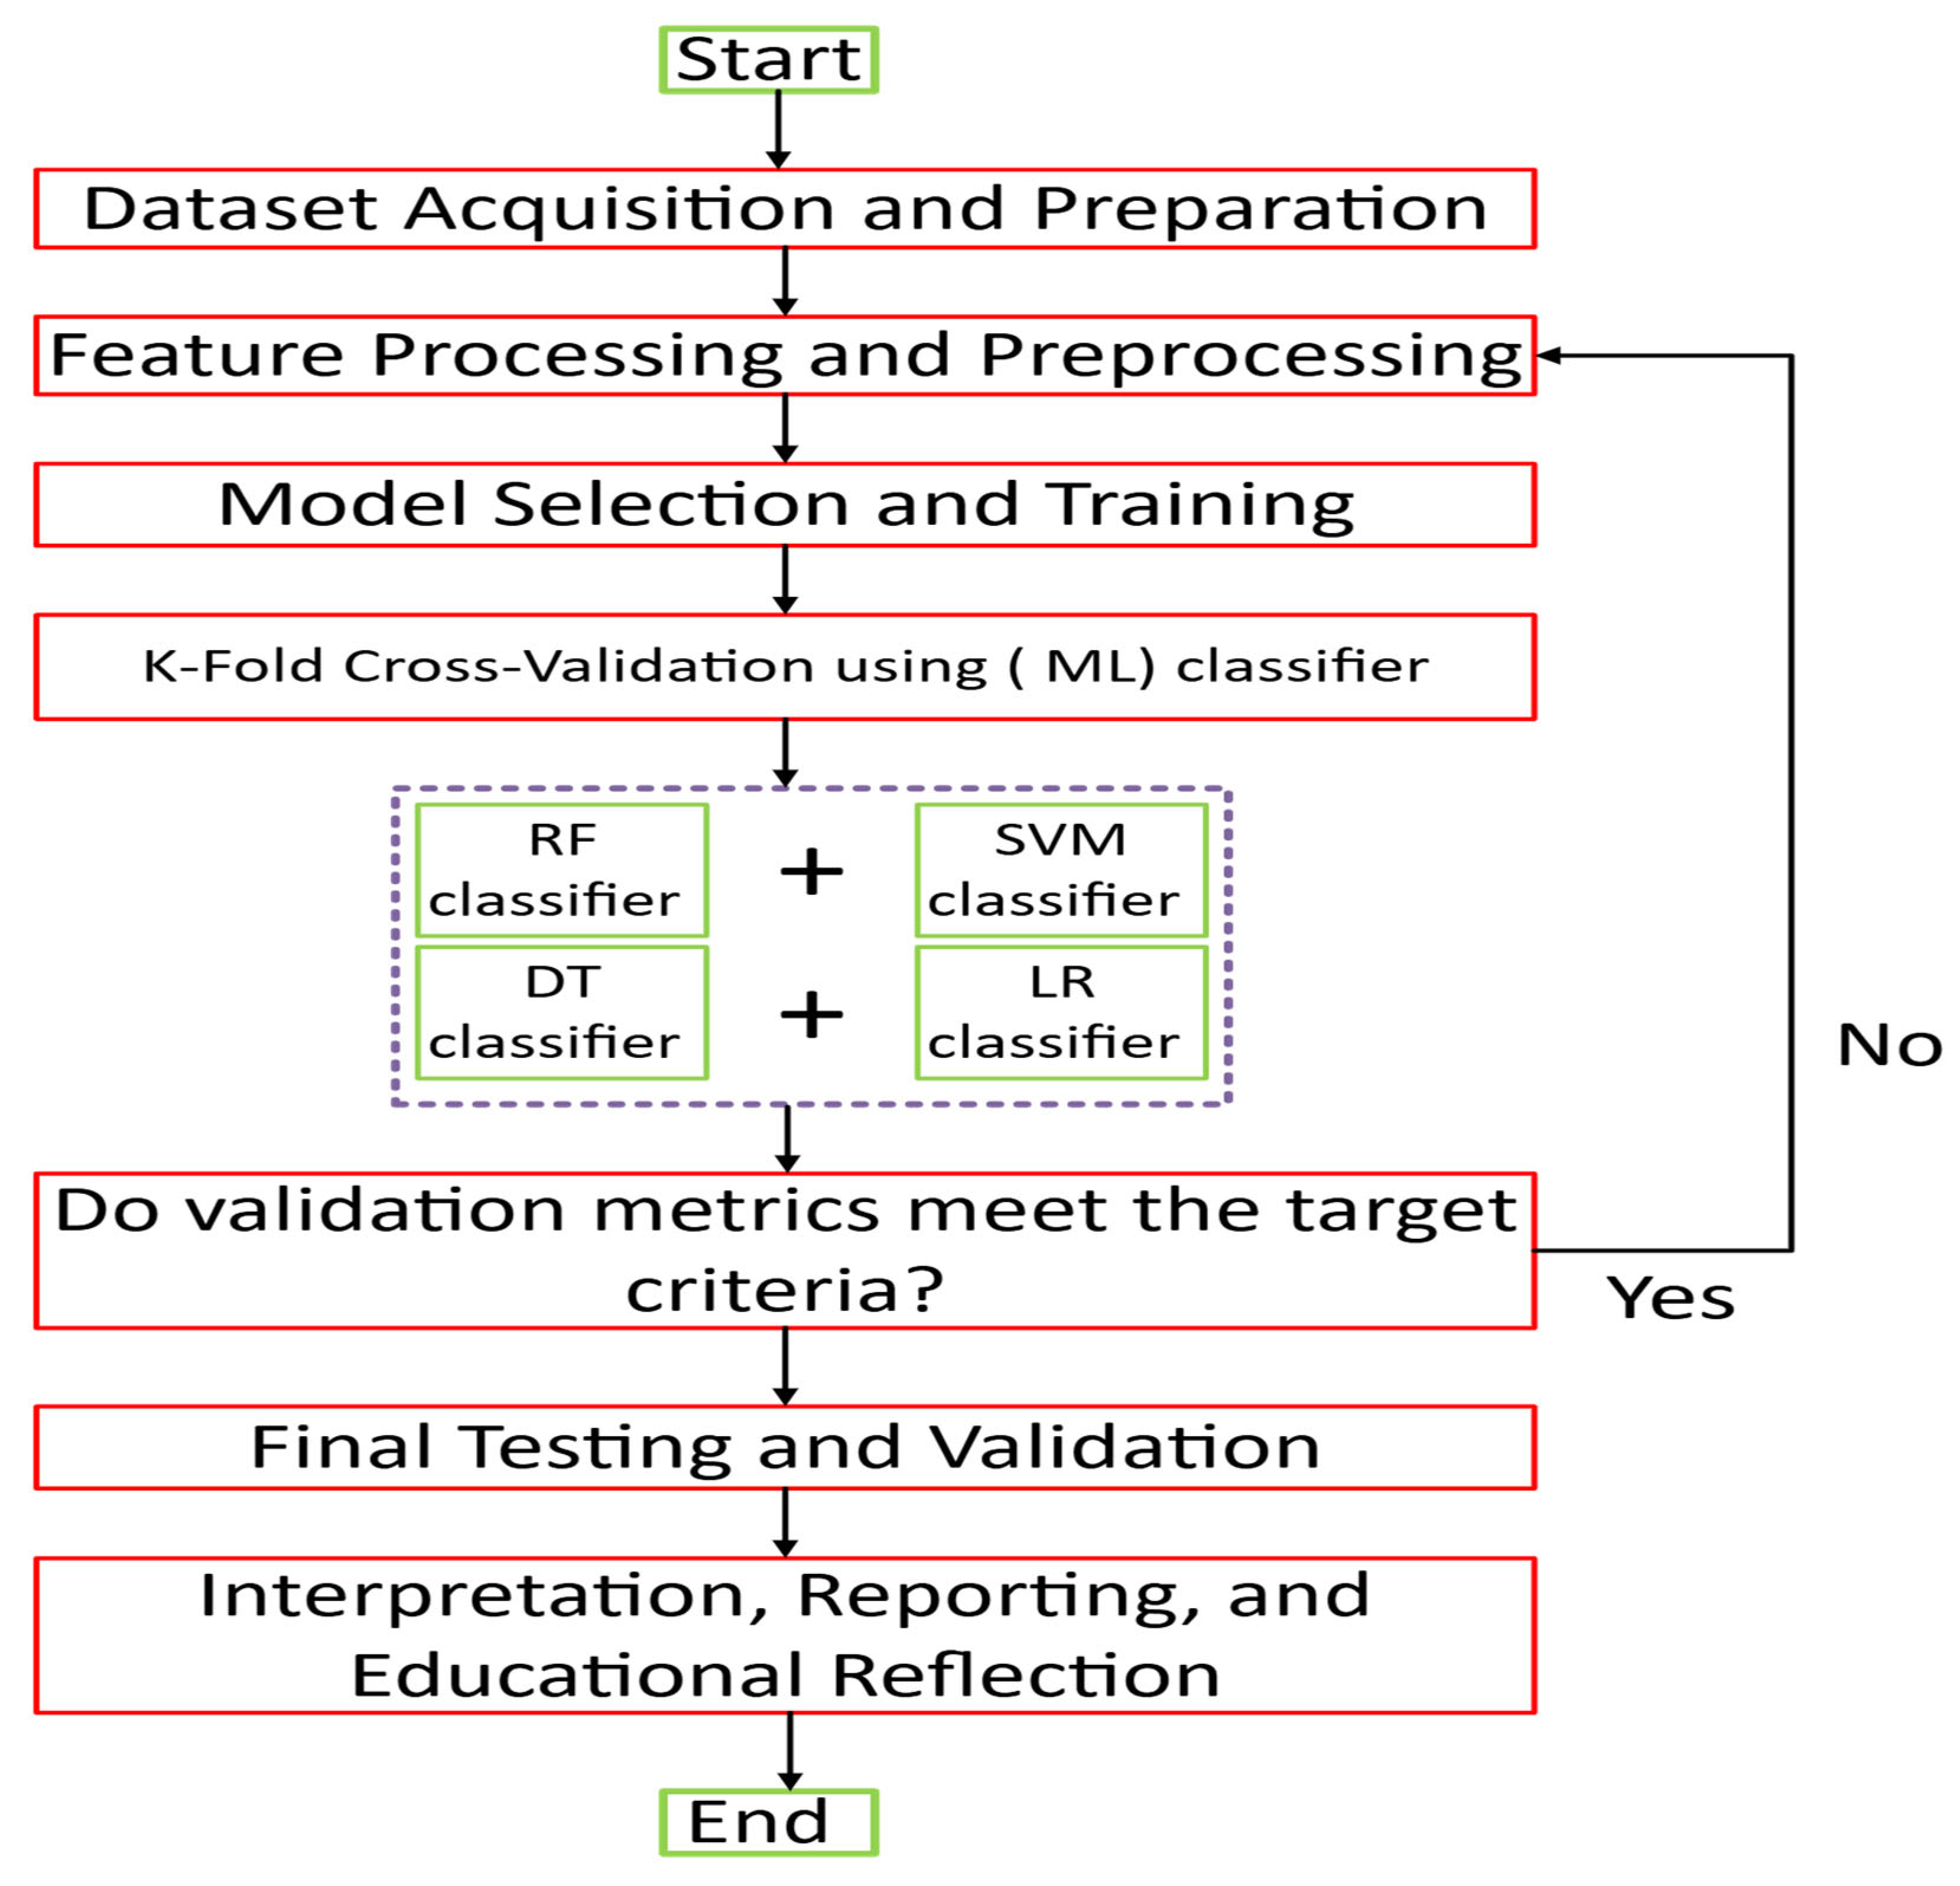
Figure 3 presents the overall workflow of this study. It begins with dataset acquisition and preparation, followed by feature processing and preprocessing. Four baseline classifiers (RF, SVM, DT, and LR) are then trained and tuned using cross-validation. An evaluation checkpoint is applied using confusion-matrix-based metrics, and the selected models are finally tested on unseen data. The workflow concludes with interpretation and reporting, emphasizing performance comparison and educational reflection for cybersecurity learning.
Figure 3.
Flowchart of the proposed study.
4. Results and Discussion
4.1. Overall Performance Comparison
The four baseline classifiers (RF, SVM, DT, and LR) were evaluated using accuracy, precision, recall, specificity, and F1-score. The results confirm that RF achieved the best overall performance with 93.33% accuracy and 93.75% F1-score, followed by SVM with 90.83% accuracy and 91.23% F1-score. DT achieved 85.83% accuracy, while LR recorded the lowest performance (65.83% accuracy), indicating weaker class separability under a linear model.
Beyond overall accuracy, the additional analyses provide deeper insight into model behavior. The feature-importance ranking indicates that a compact subset of predictors contributes most strongly to classification, and the ablation results show that performance improves sharply once the top predictors are included and then stabilizes, suggesting diminishing returns from adding less influential predictors. This strengthens the experimental contribution by demonstrating robustness and interpretability, rather than relying solely on headline performance.
As reported in Table 3, RF achieved the highest overall performance, followed by SVM, DT, and LR across all evaluation metrics
Table 3.
Performance comparison of the evaluated classifiers (RF, SVM, DT, and LR) using accuracy, precision, recall (sensitivity), specificity, and F1-score.
4.2. Data Distribution Visualization
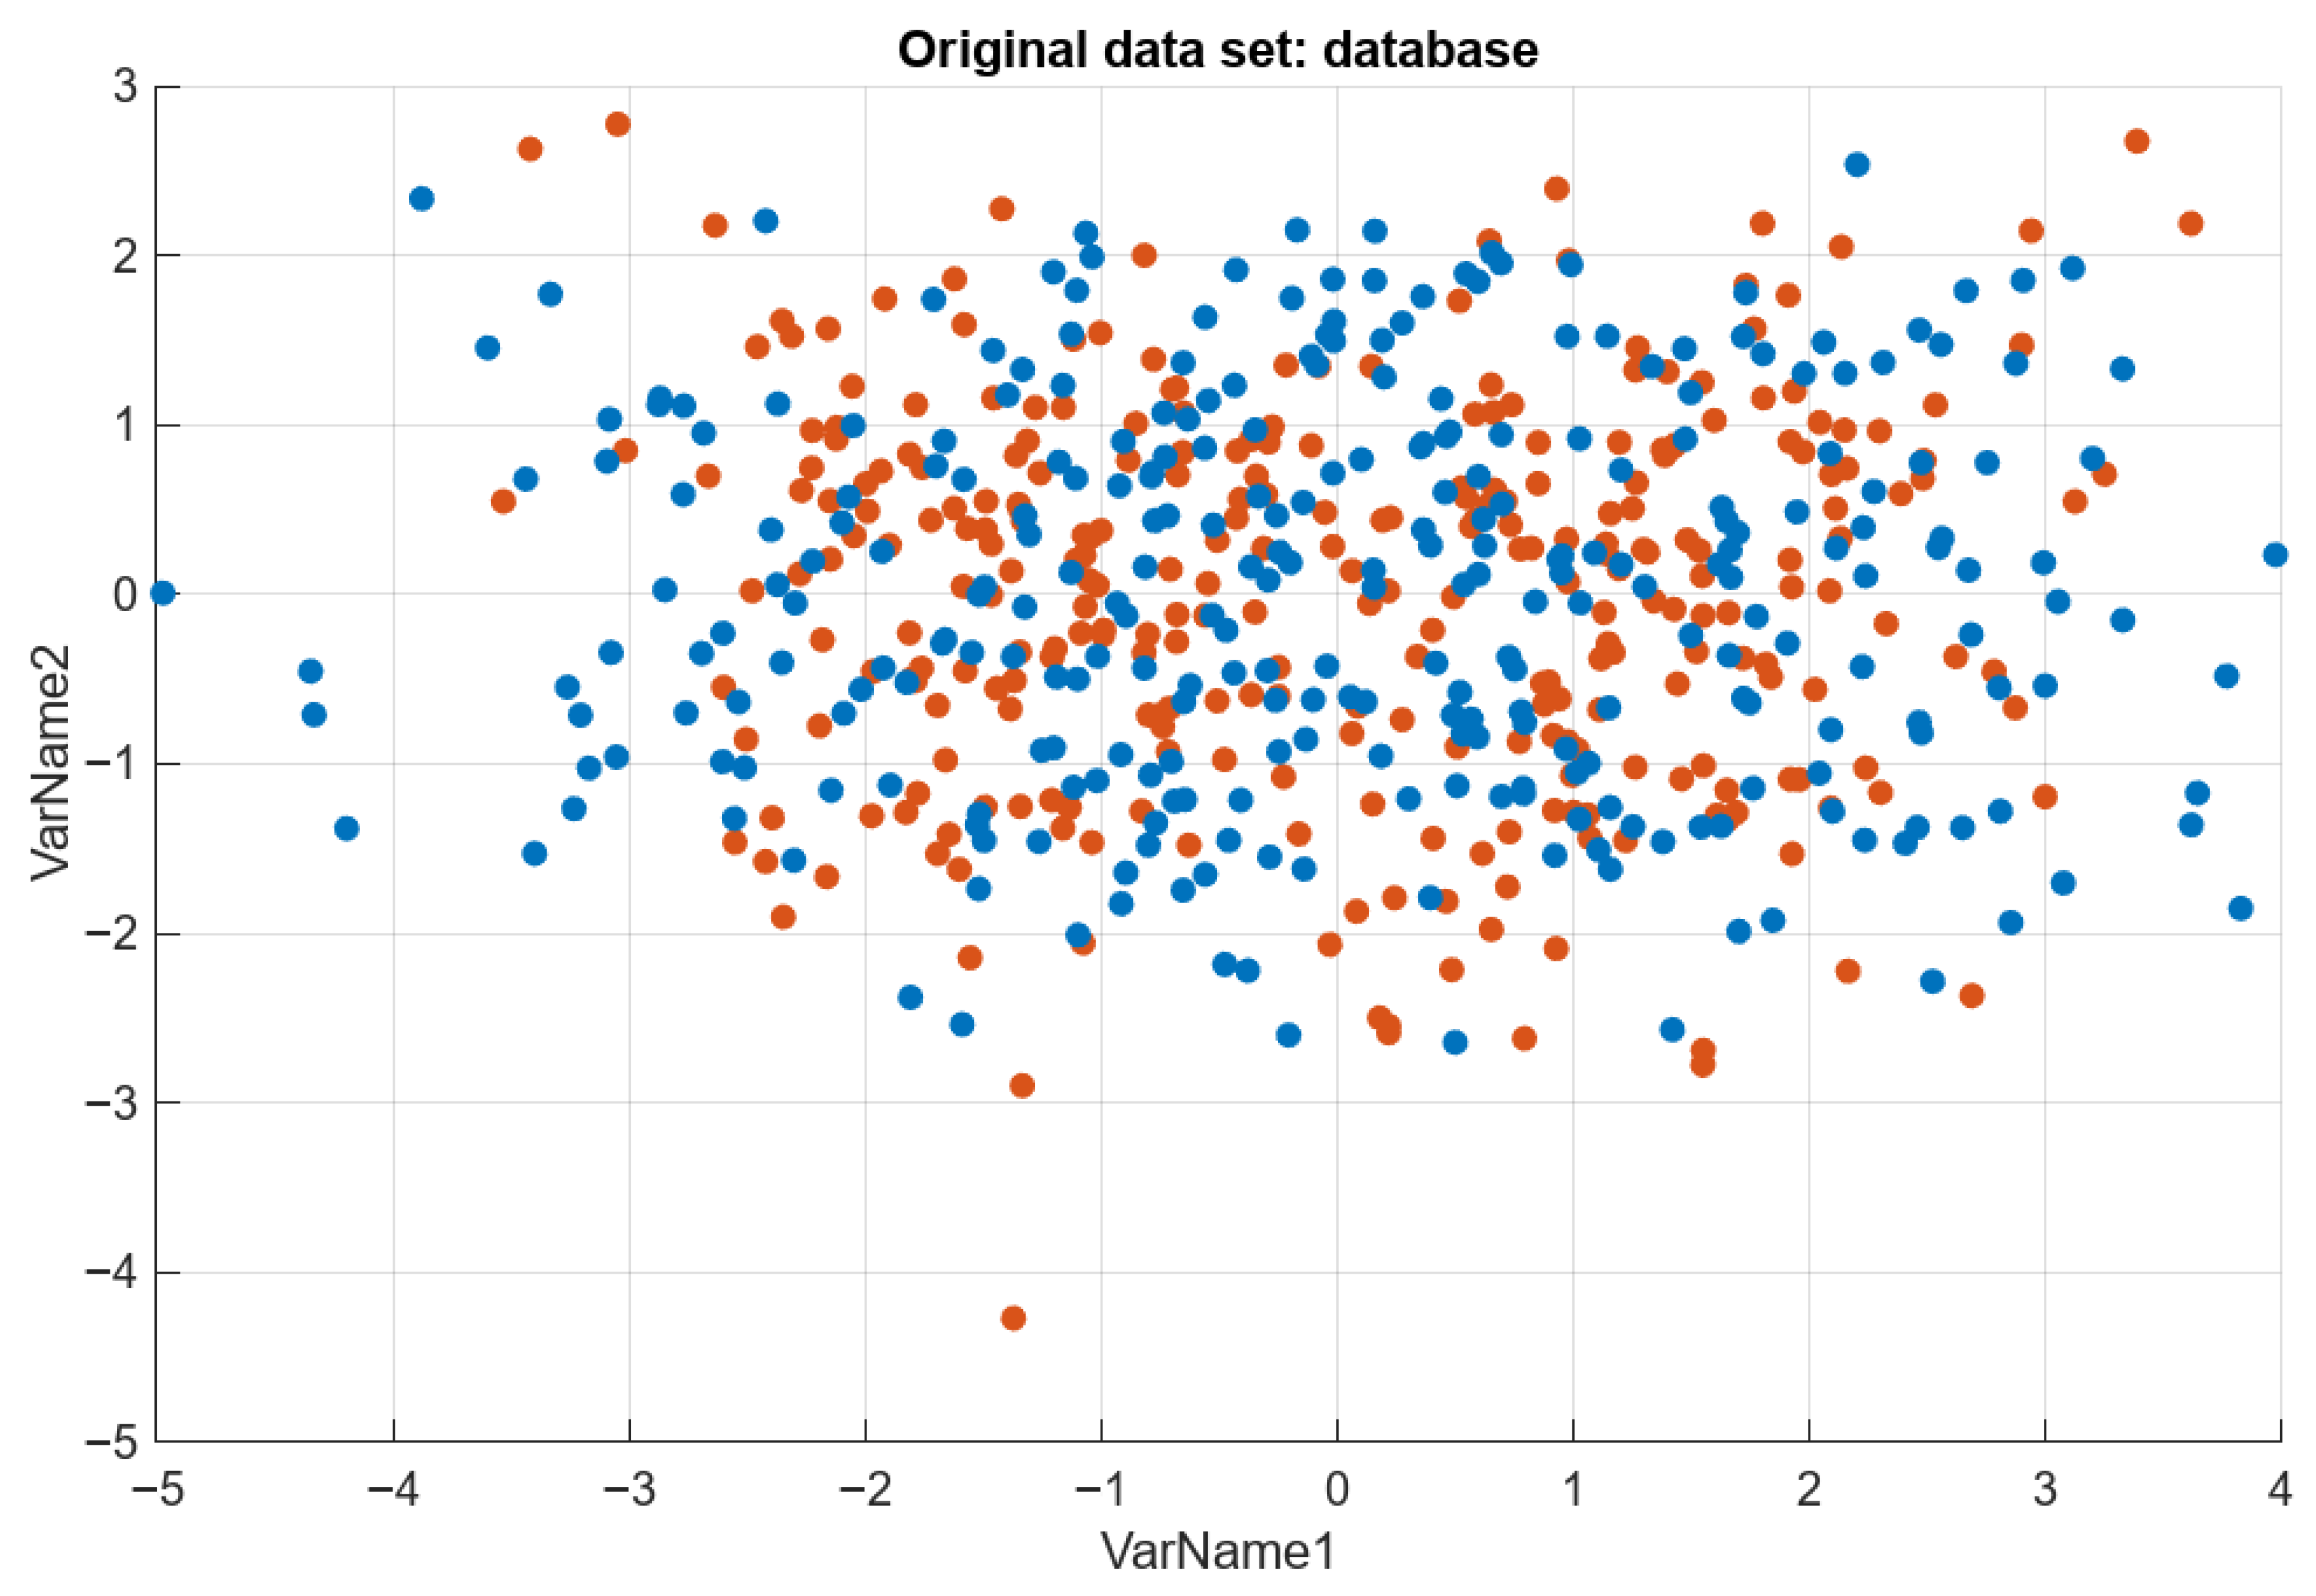
Figure 4 shows a two-dimensional projection of the original feature space, illustrating the class distribution of the dataset. Considerable overlap between the two classes is evident, indicating that the classes are not linearly separable in the original input space. This lack of clear separation implies that a linear decision boundary would be insufficient to accurately partition the data, as it would inevitably lead to substantial misclassification in the overlapping region. Consequently, the visualization justifies the adoption of more flexible modeling approaches, such as ensemble methods (e.g., Random Forest) or non-linear kernel methods (e.g., RBF-SVM), which can approximate complex, non-linear decision boundaries. Moreover, the observed overlap provides an intuitive explanation for the inferior performance of the linear baseline model (logistic regression) reported in subsequent results: linear classifiers lack the capacity to resolve non-separable distributions, whereas non-linear and ensemble-based models can better accommodate such ambiguity.
Figure 4.
Two-dimensional visualization of the original dataset showing the distribution of the two classes.
4.3. Confusion Matrix Analysis
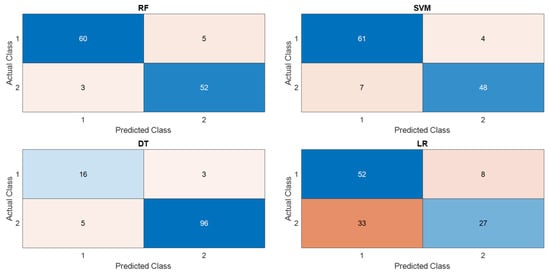
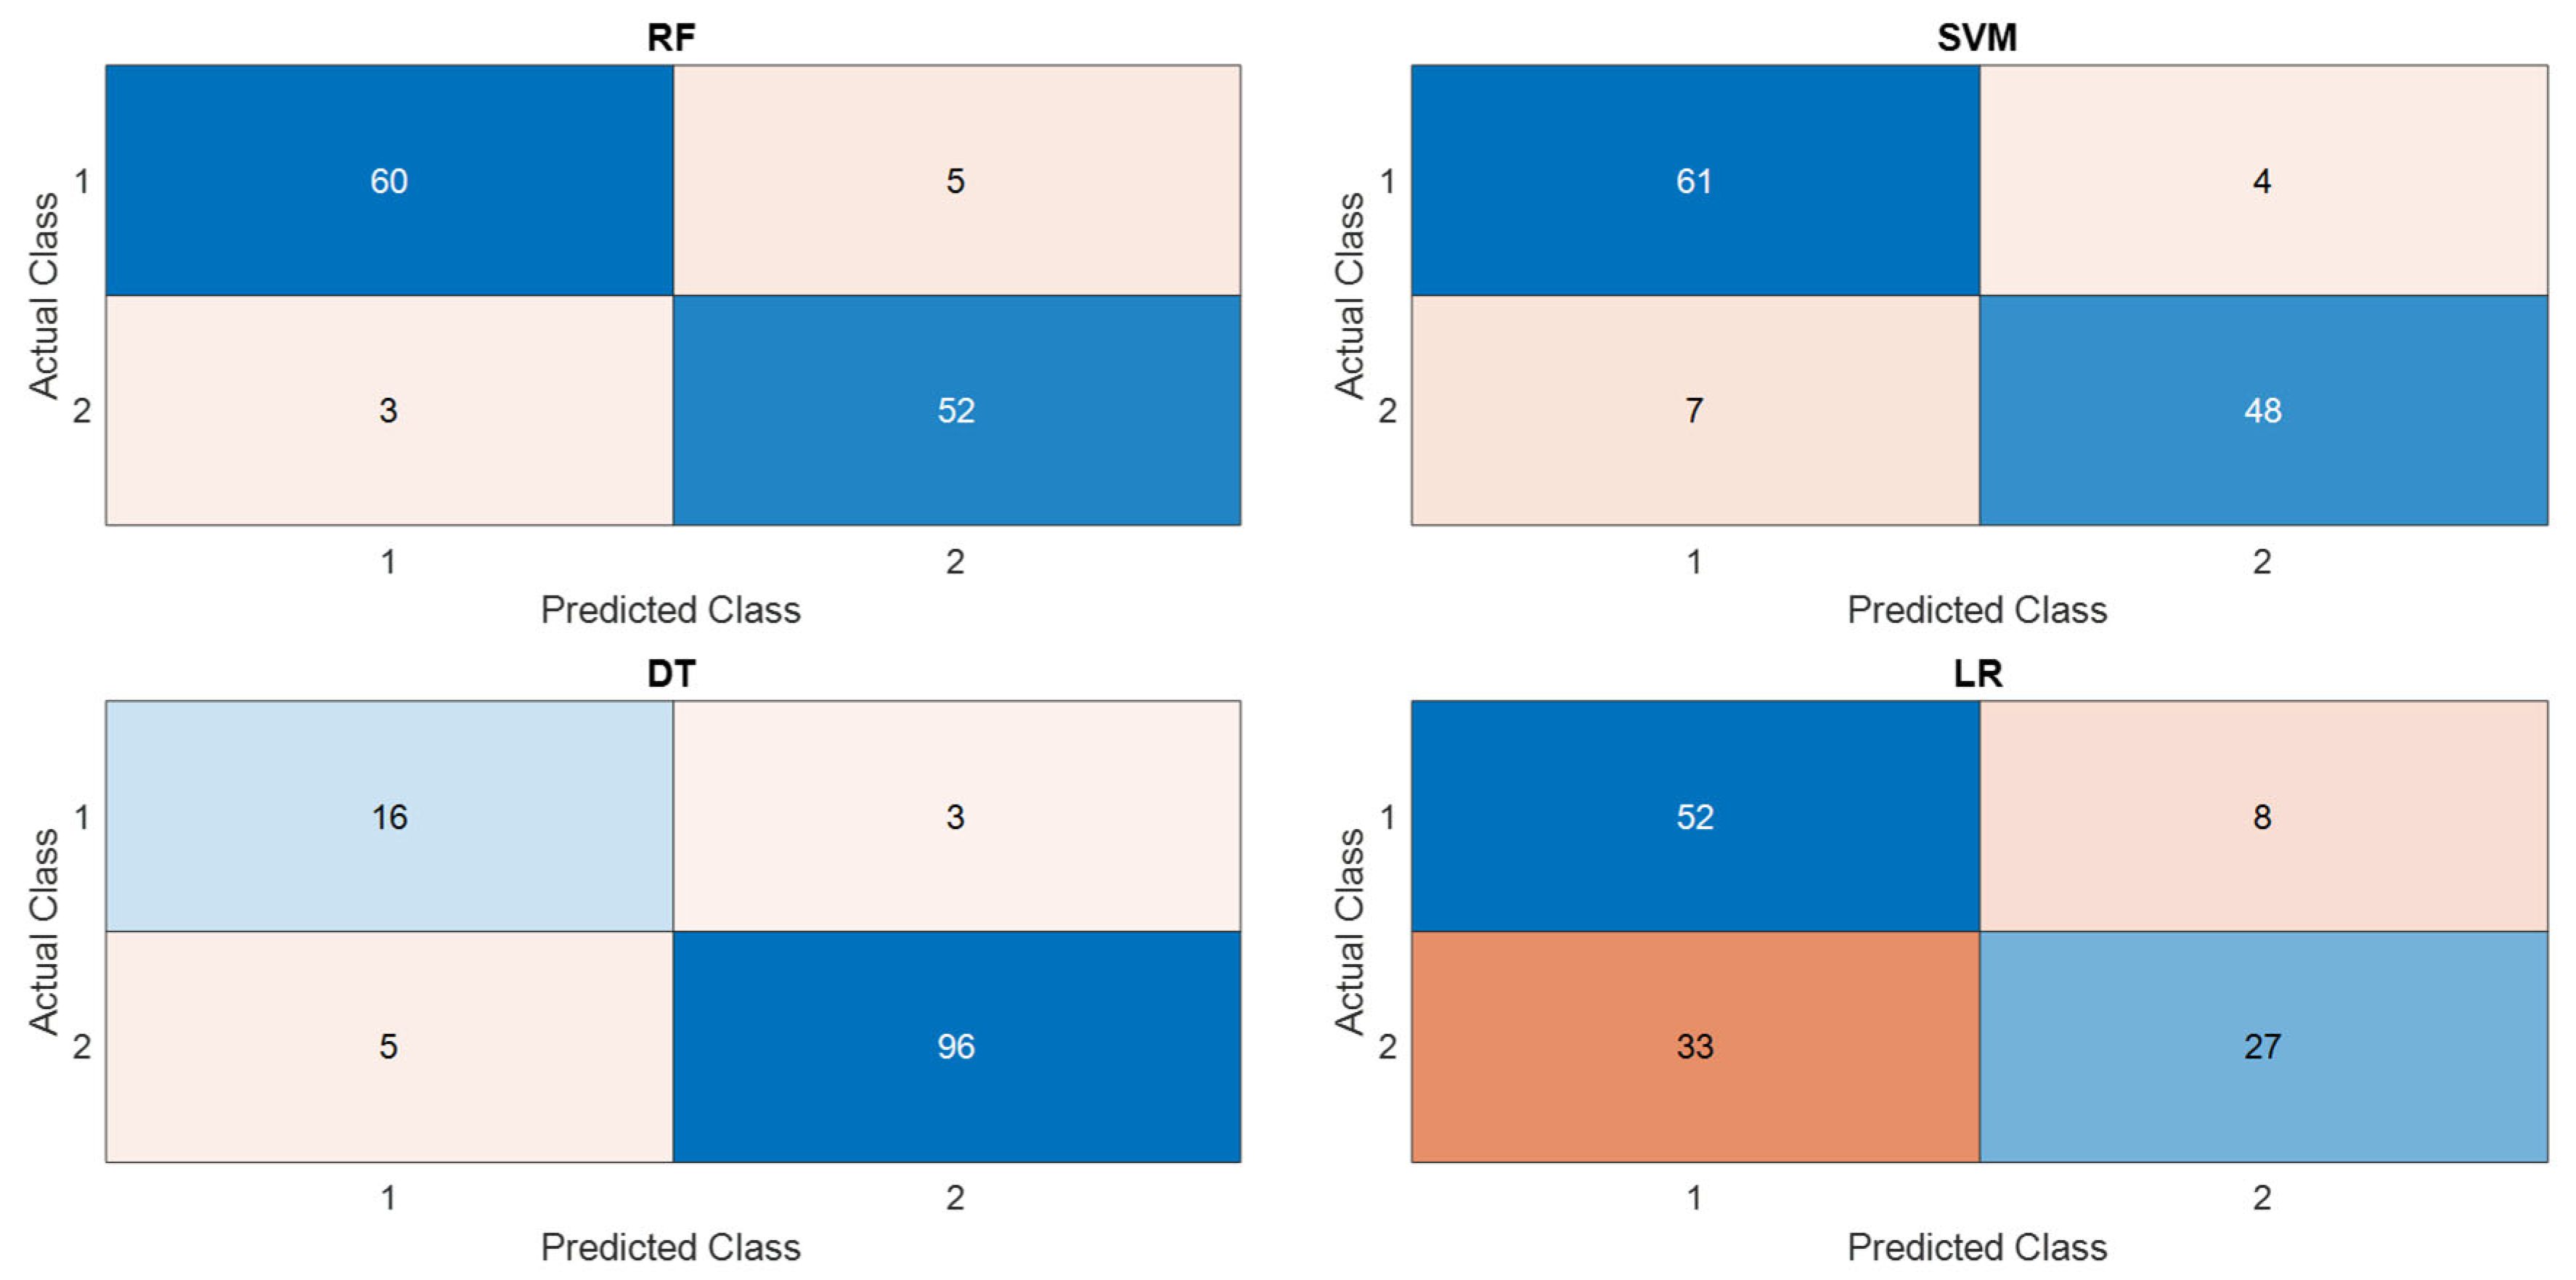
Figure 5 shows the confusion matrices for all evaluated classifiers (RF, SVM, DT, and LR), providing a detailed breakdown of classification errors across two classes. Each matrix displays the counts of true positives, false positives, false negatives, and true negatives, thereby enabling a nuanced assessment of each model’s error patterns beyond global accuracy metrics.
Figure 5.
Confusion matrices for the four baseline classifiers (RF, SVM, DT, and LR) on the phishing URL classification task.
- •
- Random Forest (RF): Exhibits the most balanced error distribution, with only eight total misclassifications (five instances of Class 1 incorrectly predicted as Class 2, and three instances of Class 2 incorrectly predicted as Class 1). This near-symmetry indicates that RF minimizes both false alarms (Type I errors) and missed detections (Type II errors) to a similar degree, confirming its high overall accuracy and robust class discrimination capability.
- •
- Support Vector Machine (SVM): Also demonstrates strong performance, yielding 11 total misclassifications (four errors in one direction and seven in the opposite direction). Although slightly more prone to error than RF, SVM maintains a consistent and reliable classification pattern. This result aligns with the high precision values reported in the accompanying metric table, underscoring SVM’s effectiveness in handling non-linear boundaries via its kernel trick.
- •
- Decision Tree (DT): Produces eight total misclassifications (three and five), a relatively low absolute number. However, the distribution of these errors is notably asymmetric: one class direction accounts for a disproportionately larger share of mistakes. This asymmetry explains why DT can achieve very high specificity (true negative rate) while suffering from reduced recall (sensitivity) for the other class. Such behavior reflects a conservative decision strategy, where the tree strongly favors the correct identification of one class at the expense of missing a nontrivial portion of the other.
- •
- Logistic Regression (LR): Displays the weakest confusion matrix, with 41 total misclassifications (eight errors in one direction and 33 in the opposite direction). The large imbalance between the two error types reveals that the linear decision boundary learned by LR is insufficient to separate the overlapping class distributions observed in Figure 4. Consequently, LR produces significantly more missed detections (or false alarms, depending on which class is designated as positive), leading to the highest overall error rate among the compared models.
Synthesis: The confusion matrices collectively confirm that ensemble-based (RF) and non-linear kernel-based (SVM) classifiers provide substantially more reliable class discrimination than the linear baseline. Logistic Regression suffers from the highest error rate and greatest directional imbalance, while Decision Tree, despite low total errors, exhibits uneven class-wise performance. These findings reinforce the conclusion that non-linear or ensemble methods are necessary for this classification task, given the intrinsic overlap of the original feature space.
4.4. Convergence Behavior During Training and Tuning
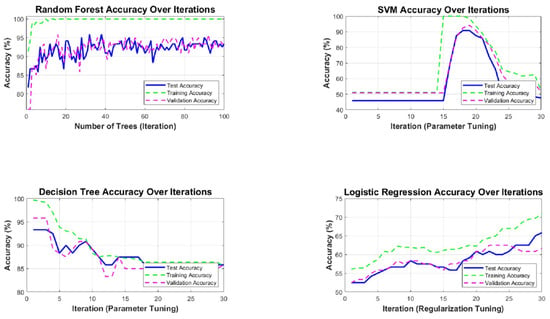
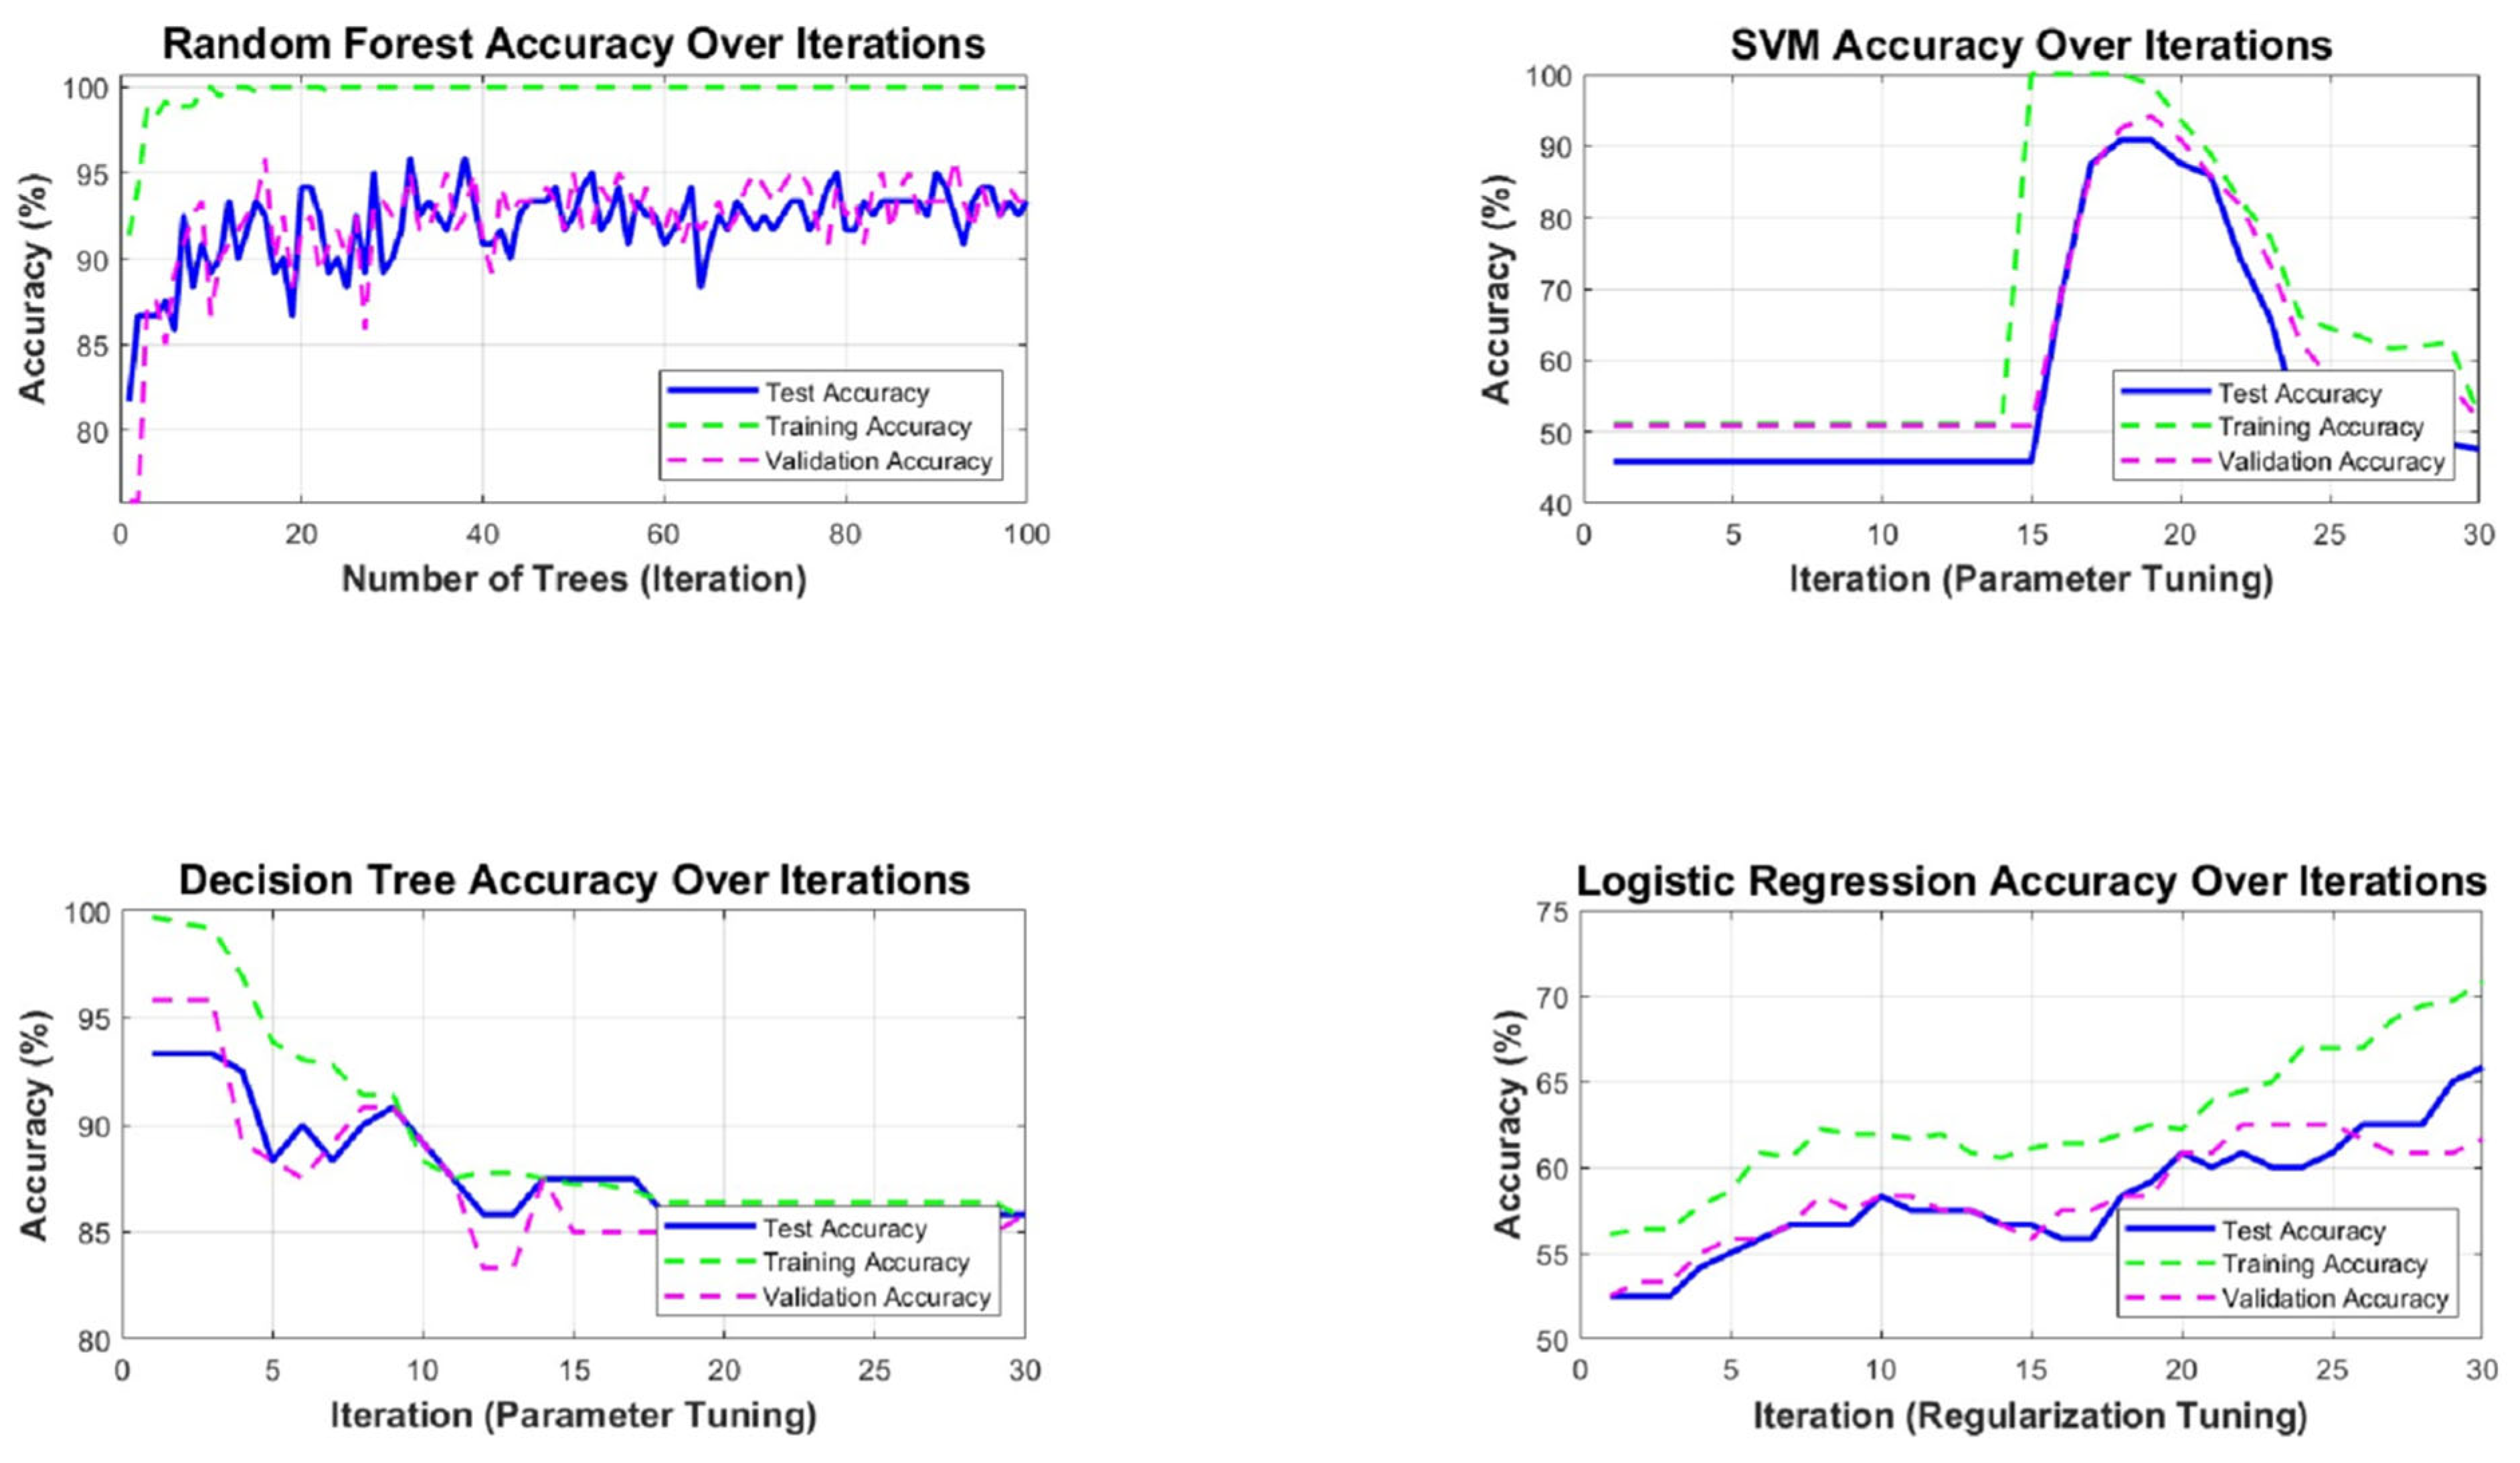
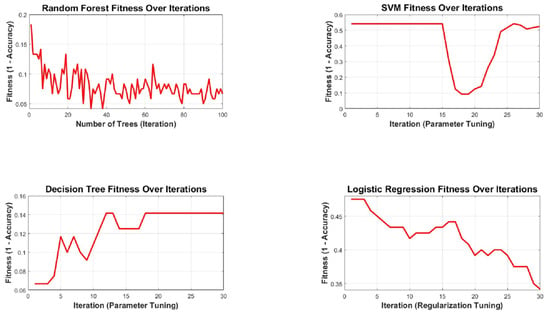
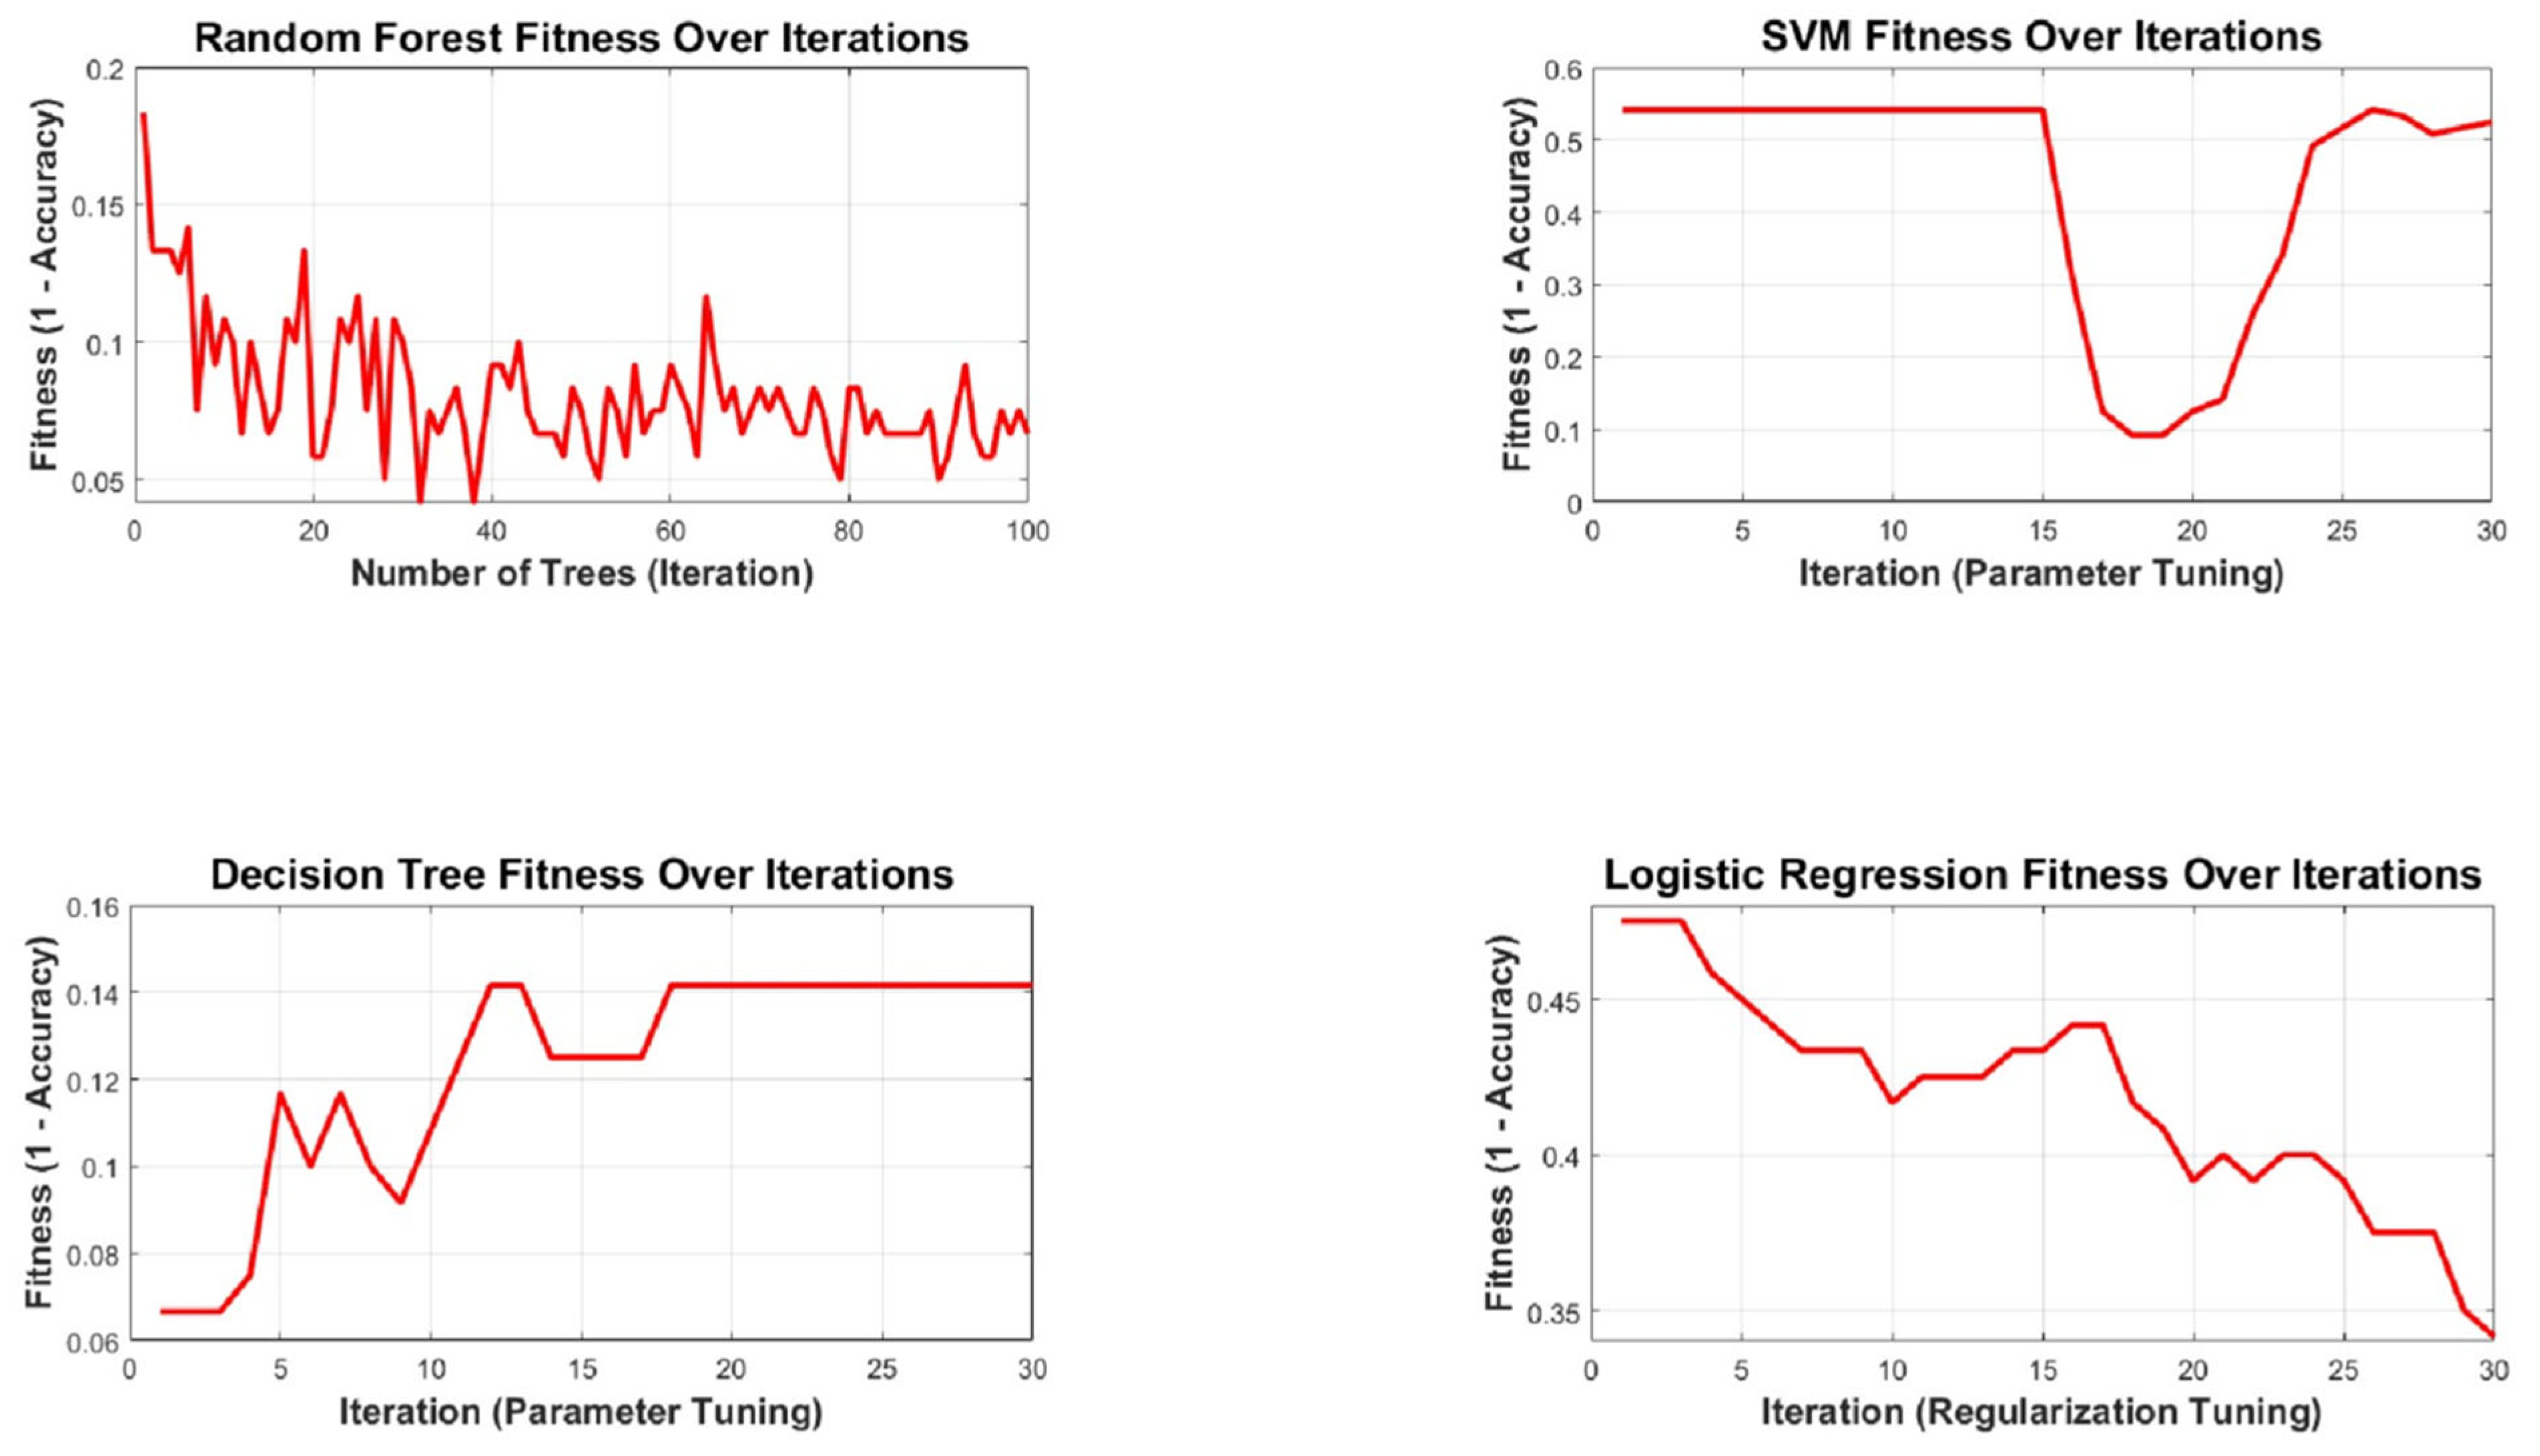
To further analyze model behavior, Figure 3 reports accuracy trends (training/validation/test) across iterations or tuning steps, and Figure 5 reports the corresponding fitness curves.
- •
- RF (Figure 6 and Figure 7): RF test accuracy stabilizes early and remains consistently high as the number of trees increases, showing a relatively stable generalization pattern. The fitness curve in Figure 5 decreases rapidly at early iterations and then flattens, indicating convergence and diminishing improvement after sufficient trees are added.Figure 6. Training, validation, and test accuracy curves for RF, SVM, DT, and LR across iterations/tuning steps.Figure 7. Fitness curves (defined as 1 − accuracy) for RF, SVM, DT, and LR across iterations/tuning steps.
- •
- SVM (Figure 6 and Figure 7): SVM accuracy improves sharply after parameter tuning reaches an effective region (around the mid-iterations), followed by a decline when tuning moves away from optimal settings. This is reflected in the fitness curve, where fitness drops significantly at the best tuning zone and rises again afterward, highlighting the sensitivity of SVM performance to hyperparameters.
- •
- •
These curves are useful for explaining not only which model performs best, but also how stable each method is during tuning, which is particularly valuable for teaching model-selection concepts in cybersecurity education.
4.5. ROC Curve and AUC Analysis
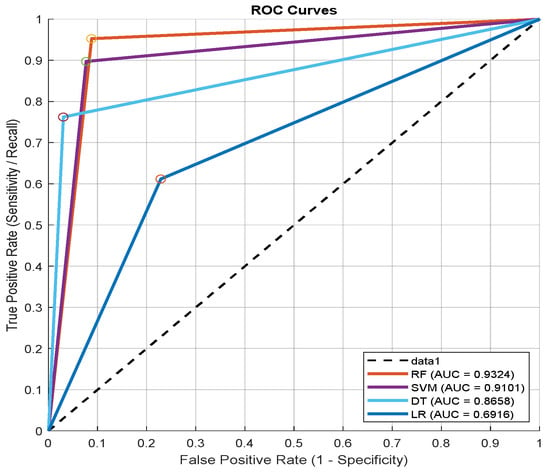
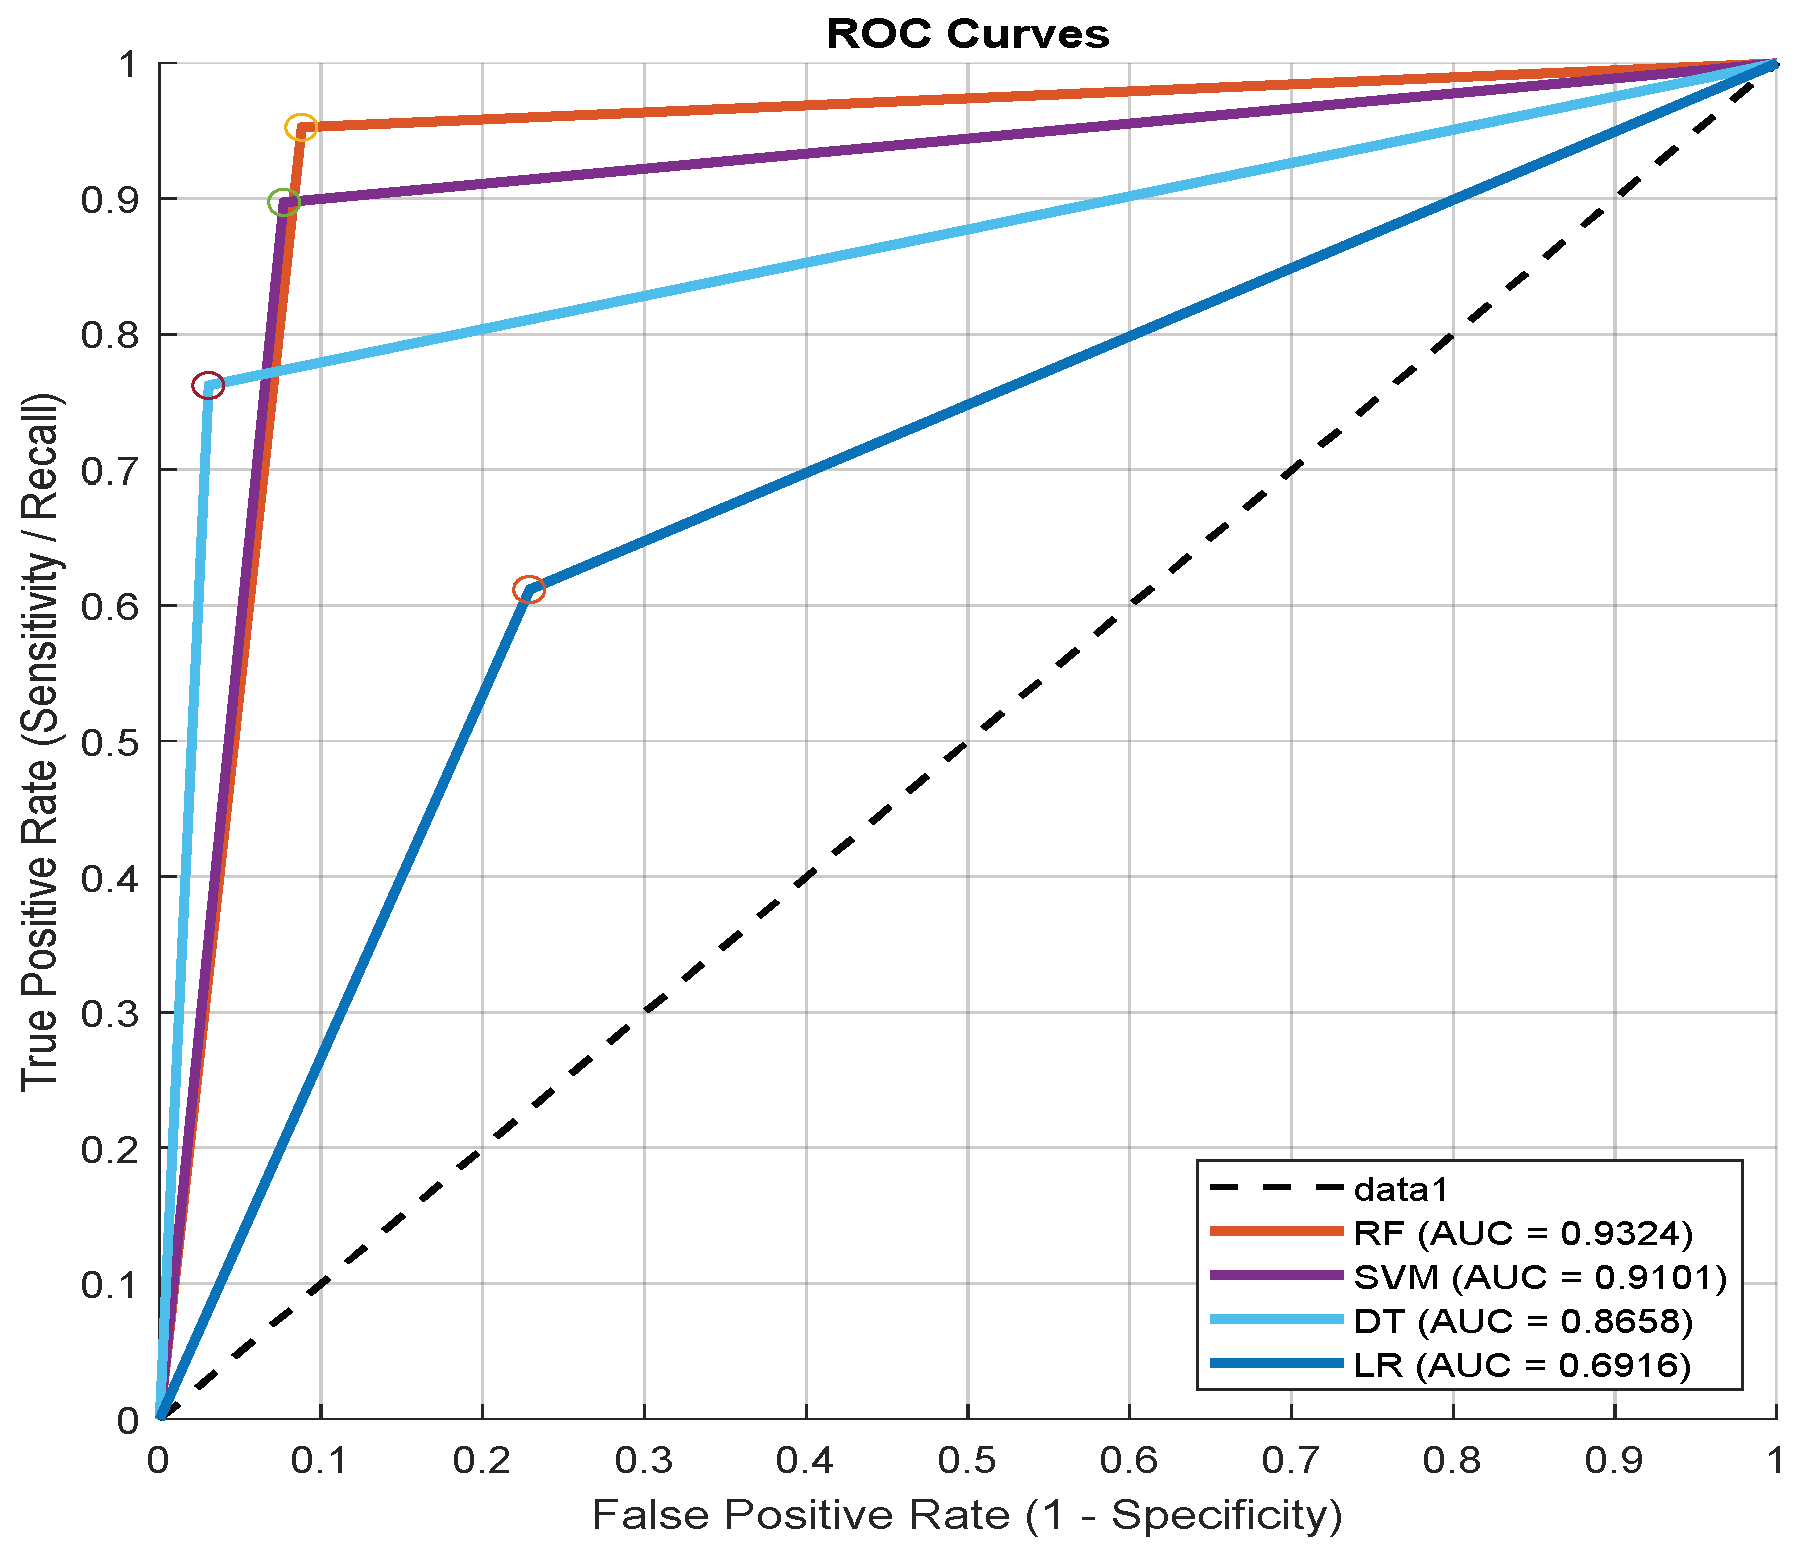
Figure 8 presents the ROC curves and AUC values for all classifiers, further confirming the ranking observed in the metric table and confusion matrices. The AUC results are:
Figure 8.
ROC curves and AUC values for the evaluated classifiers (RF, SVM, DT, and LR).
- •
- RF: AUC = 0.9238
- •
- SVM: AUC = 0.9149
- •
- DT: AUC = 0.8626
- •
- LR: AUC = 0.6610
The ROC/AUC analysis indicates that RF and SVM achieve the strongest discrimination capability across different thresholds, while LR shows limited separability, consistent with its lower classification performance.
4.6. Statistical Significance Analysis
To evaluate whether the observed performance differences are statistically meaningful, the authors conducted a paired statistical comparison between classifiers using their predictions on the same test set. McNemar’s test was applied to compare paired misclassification outcomes, which is appropriate for two classifiers evaluated on identical samples. The analysis indicates that the performance difference between RF and SVM is statistically significant at the 0.05 level (p < 0.05).
4.7. Feature Importance Analysis (Random Forest)
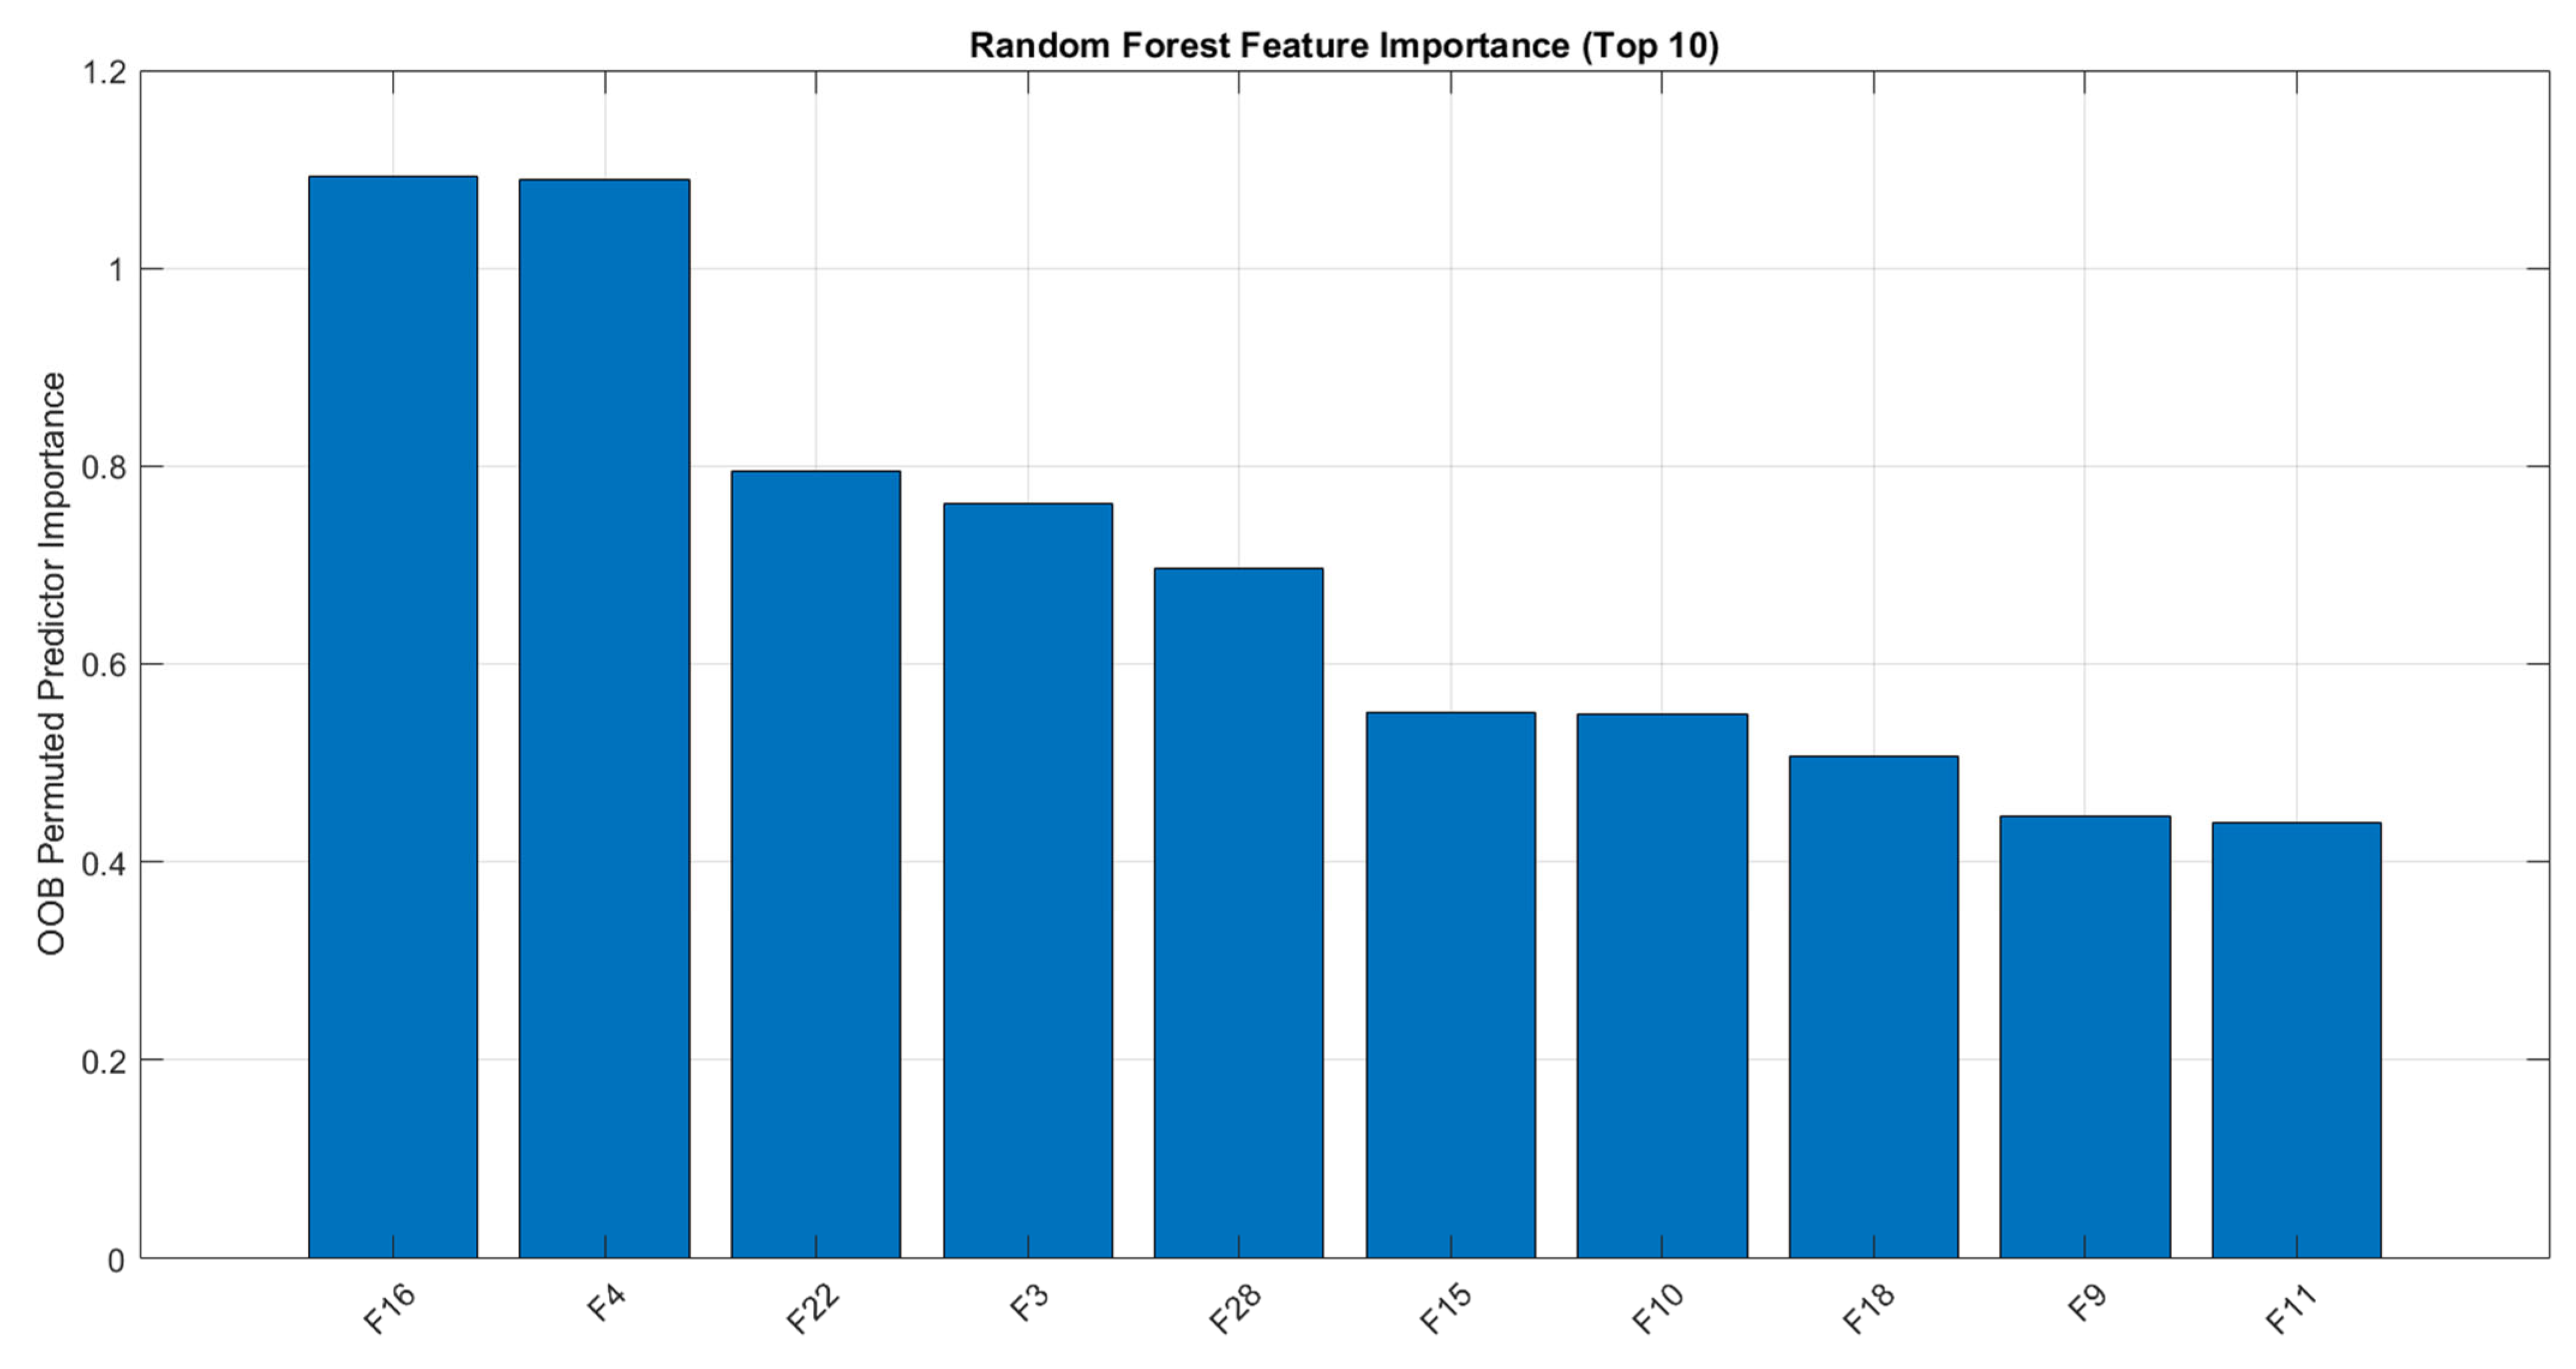
To strengthen interpretability, feature importance was computed for the Random Forest model using out-of-bag (OOB) permutation importance. This method estimates the contribution of each predictor by measuring the increase in prediction error after randomly permuting its values while keeping the remaining predictors unchanged. As shown in Figure 9 and Table 4, predictors F16 and F4 are the most influential (importance ≈ 1.09), followed by F22, F3, and F28. The remaining predictors (F15, F10, F18, F9, and F11) contribute at a moderate level. Overall, the importance ranking suggests that a relatively small subset of predictors drives most of the model’s discriminative capability, which is valuable for both interpretability and potential feature-reduction experiments.
Figure 9.
Random Forest feature importance based on out-of-bag permuted predictor importance (Top10 predictors).
Table 4.
Top10 predictors ranked by Random Forest OOB permutation importance.
4.8. Ablation Study (Top-N Predictors)
To further deepen the experimental analysis, an ablation study was conducted to evaluate how performance changes when the classifier is trained using only a subset of predictors. The predictors were ranked using the Random Forest importance scores (Section 3.2.1), and the RF model was retrained using progressively larger subsets of the top-ranked predictors (Top-5, Top-10, Top-15, Top-20, and Top-30). The results in Table 5 show that performance improves substantially once a sufficient subset of predictors is included. In particular, accuracy increased from 85.83% (Top-5/Top-10) to 93.33% with Top-15 predictors, and reached 94.17% with Top-20 and Top-30 predictors. A similar pattern is observed for F1-score, rising from 0.86179 (Top-5) to 0.93103 (Top-15) and reaching 0.94017 (Top-20). These findings suggest that a relatively compact subset of predictors captures most of the discriminative information required for phishing URL classification, while adding additional predictors yields diminishing improvements.
Table 5.
Ablation results of the Random Forest classifier using Top-N predictors ranked by feature importance.
This ablation analysis strengthens the scientific contribution by demonstrating robustness and interpretability beyond single-point accuracy reporting.
4.9. Practical Deployment Scenario
In a real-use scenario, the trained classifier can operate as an automated URL pre-screening component within a security gateway or browser protection pipeline. Incoming URLs are transformed into the same predictor representation used during training and classified as phishing or legitimate. URLs flagged as phishing can be blocked, quarantined, or routed for human review, while legitimate URLs are allowed to proceed. In this setting, precision is linked to reducing false alarms, while recall is linked to minimizing missed phishing URLs.
4.10. Educational vs. Practical Contribution
The educational contribution of this work lies in providing a reproducible lab blueprint that teaches end-to-end ML evaluation in cybersecurity, including tuning, error-tradeoff analysis, and interpretability via feature importance and ablation. The practical contribution is the comparative evidence showing how widely used baseline models differ in false-alarm behavior and detection strength, enabling informed selection of a baseline classifier when transparency and computational efficiency are prioritized.
4.11. Summary of Key Findings
- RF provides the best overall accuracy and balanced error behavior.
- SVM performs competitively, but is more sensitive to hyperparameter tuning.
- DT is interpretable but shows uneven class-wise performance.
- LR serves as a useful baseline but struggles due to limited linear separability.
Overall, the experimental results demonstrate that ensemble and non-linear learning strategies provide the most reliable performance for phishing URL classification. As summarized in Table 3, RF achieved the strongest overall results, combining high accuracy and F1-score with balanced error behavior in the confusion matrix (Figure 5) and the highest discrimination capability in ROC/AUC analysis (Figure 8). SVM ranked second and delivered competitive performance, but its iteration trends (Figure 7) highlight higher sensitivity to parameter tuning. DT offered interpretability and high specificity, yet showed weaker class-wise balance compared with RF and SVM. LR performed least effectively, indicating that a linear decision boundary is insufficient for capturing the underlying patterns in the dataset. Collectively, these findings validate the selected workflow and provide clear, teachable evidence of performance trade-offs (false alarms vs. missed detections) that are valuable for cybersecurity education and lab-based learning.
5. Conclusions
This study presented a reproducible machine learning workflow for phishing URL classification using the UCI PhiUSIIL dataset and evaluated four widely used baseline classifiers (RF, SVM, DT, and LR). The results showed that Random Forest achieved the best overall performance, delivering the highest accuracy and F1-score and the strongest discrimination capability based on ROC/AUC. SVM provided competitive results and the highest precision, but its performance was more sensitive to parameter tuning. Decision Tree offered clear interpretability and high specificity, yet showed weaker balance across classes compared with RF and SVM. Logistic Regression produced the lowest performance, indicating that linear decision boundaries are less effective for this dataset.
From a cybersecurity education perspective, the comparative findings provide a practical case study for teaching end-to-end ML in security analytics, including preprocessing, cross-validation, metric interpretation, and error trade-offs (false alarms versus missed phishing). Future work can extend this study by incorporating additional learners (e.g., gradient boosting or neural models), applying more advanced feature selection strategies, and validating the workflow across multiple phishing datasets to further strengthen generalizability and classroom adoption.
Author Contributions
A.F.A. and M.A. contributed the same in producing this manuscript. All authors have read and agreed to the published version of the manuscript.
Funding
This research received no external funding.
Institutional Review Board Statement
Not applicablel.
Informed Consent Statement
Not applicable.
Data Availability Statement
The data analyzed in this study are publicly available from the UCI Machine Learning Repository as the PhiUSIIL Phishing URL (Website) Dataset (2024), available at https://archive.ics.uci.edu/dataset/967/phiusiil+phishing+url+dataset (accessed on 7 March 2026).
Acknowledgments
The authors thank Cardiff University for paying the APC towards publishing this manuscript. During the preparation of this manuscript, the authors used QuilBot (version 8.0) for the purposes of paraphrasing and refining selected sections of the text. The authors have reviewed and edited the output and take full responsibility for the content of this publication.
Conflicts of Interest
The authors declare no conflicts of interest.
Appendix A
Table A1.
SVM parameter illustration.
- •
- Example SVM tuning values: C = 10, γ = 0.1 (illustrative; final values reported from tuning).
References
- Mohamed, N. Artificial intelligence and machine learning in cybersecurity: A deep dive into state-of-the-art techniques and future paradigms. Knowl. Inf. Syst. 2025, 67, 6969–7055. [Google Scholar] [CrossRef] [Scilit]
- KStrang, K.D.; Vajjhala, N.R. Exploring Cybersecurity Risks in Higher Education Environments with Machine Learning. In Proceedings of the 2024 4th International Conference on Pervasive Computing and Social Networking, ICPCSN 2024, Salem, India, 3–4 May 2024; Institute of Electrical and Electronics Engineers Inc.: New York, NY, USA, 2024; pp. 1–6. [Google Scholar] [CrossRef] [Scilit]
- Ahmed, A.; Watterson, C.; Alhashmi, S.; Gaber, T. How universities teach cybersecurity courses online: A systematic literature review. Front. Comput. Sci. 2024, 6, 1499490. [Google Scholar] [CrossRef] [Scilit]
- Shukla, S.; Sharma, A. Cyber security using Machine Learning in Digital Education industry. In Proceedings of the 2021 IEEE International Conference on Innovative Computing, Intelligent Communication and Smart Electrical Systems, ICSES 2021, Chennai, India, 24–25 September 2021; Institute of Electrical and Electronics Engineers Inc.: New York, NY, USA, 2021. [Google Scholar] [CrossRef] [Scilit]
- Tian, J. Integrating Artificial Intelligence into the Cybersecurity Curriculum in Higher Education: A Systematic Literature Review. Educ. Sci. 2025, 15, 1540. [Google Scholar] [CrossRef] [Scilit]
- Shahbazi, Z.; Jalali, R.; Molaeevand, M. AI-Based Phishing Detection and Student Cybersecurity Awareness in the Digital Age. Big Data Cogn. Comput. 2025, 9, 210. [Google Scholar] [CrossRef] [Scilit]
- Mughaid, A.; AlZu’bi, S.; Hnaif, A.; Taamneh, S.; Alnajjar, A.; Abu Elsoud, E. An intelligent cyber security phishing detection system using deep learning techniques. Clust. Comput. 2022, 25, 3819–3828. [Google Scholar] [CrossRef] [Scilit]
- Al-Ghamdi, A.S.A.-M.; Ragab, M.; Sabir, M.F.S.; Elhassanein, A.; Gouda, A.A. Optimized Artificial Neural Network Techniques to Improve Cybersecurity of Higher Education Institution. Comput. Mater. Contin. 2022, 72, 3385–3399. [Google Scholar] [CrossRef] [Scilit]
- Aurangzeb, M.; Wang, Y.; Iqbal, S.; Naveed, A.; Ahmed, Z.; Alenezi, M.; Shouran, M. Enhancing cybersecurity in smart grids: Deep black box adversarial attacks and quantum voting ensemble models for blockchain privacy-preserving storage. Energy Rep. 2024, 11, 2493–2515. [Google Scholar] [CrossRef] [Scilit]
- Rehman, A.U.; Imtiaz, I.; Javaid, S.; Muslih, M. Real-Time Phishing URL Detection Using Machine Learning. Eng. Proc. 2025, 107, 108. [Google Scholar] [CrossRef] [Scilit]
- Henry, S.; Stephen, B.U.-A.; Asuquo, P. Ensemble transfer learning for cross-dataset phishing detection. Frankl. Open 2026, 15, 100579. [Google Scholar] [CrossRef] [Scilit]
- Omari, K. Phishing Detection using Gradient Boosting Classifier. Procedia Comput. Sci. 2023, 230, 120–127. [Google Scholar] [CrossRef] [Scilit]
- Kasim, Ö. Automatic detection of phishing pages with event-based request processing, deep-hybrid feature extraction and light gradient boosted machine model. Telecommun. Syst. 2021, 78, 103–115. [Google Scholar] [CrossRef] [Scilit]
- Sahingoz, O.K.; Buber, E.; Kugu, E. DEPHIDES: Deep Learning Based Phishing Detection System. IEEE Access 2024, 12, 8052–8070. [Google Scholar] [CrossRef] [Scilit]
- Tang, L.; Mahmoud, Q.H. A Deep Learning-Based Framework for Phishing Website Detection. IEEE Access 2022, 10, 1509–1521. [Google Scholar] [CrossRef] [Scilit]
- Salman, A. Integrating Artificial Intelligence in Cybersecurity Education: A Pedagogical Framework and Case Studies. In Proceedings of the 2024 International Conference on Computer and Applications, ICCA 2024, Cairo, Egypt, 17–19 December 2024; Institute of Electrical and Electronics Engineers Inc.: New York, NY, USA, 2024. [Google Scholar] [CrossRef] [Scilit]
- Ragab, M.; Alghamdi, B.M.; Alakhtar, R.; Alsobhi, H.; Maghrabi, L.A.; Alghamdi, G.; Nooh, S.; Al-Ghamdi, A.A.-M. Enhancing cybersecurity in higher education institutions using optimal deep learning-based biometric verification. Alex. Eng. J. 2025, 117, 340–351. [Google Scholar] [CrossRef] [Scilit]
- Kustiawan, Y.A.; Ghauth, K.I. Ghauth Evaluating the Impact of Feature Engineering in Phishing URL Detection: A Comparative Study of URL, HTML, and Derived Features. IEEE Access 2025, 13, 126756–126768. [Google Scholar] [CrossRef] [Scilit]
- Vajrobol, V.; Gupta, B.B.; Gaurav, A. Mutual information based logistic regression for phishing URL detection. Cyber Secur. Appl. 2024, 2, 100044. [Google Scholar] [CrossRef] [Scilit]
- Alorvor, M.-L.E.; Dadkhah, S. Real-Time Phishing Detection for Brand Protection Using Temporal Convolutional Network-Driven URL Sequence Modeling. Electronics 2025, 14, 3746. [Google Scholar] [CrossRef] [Scilit]
- Kustiawan, Y.A.; Ghauth, K.I. Quantum Machine Learning for Phishing Detection: A Systematic Review of Current Techniques, Challenges, and Future Directions. Mach. Learn. Knowl. Extr. 2026, 8, 86. [Google Scholar] [CrossRef] [Scilit]
- Dandotiya, M.; Goyal, N.K.; Khunteta, A.; Tiwari, B. Real time identification of phishing attacks through machine learning enhanced browser extensions. Sci. Rep. 2026, 16, 6612. [Google Scholar] [CrossRef] [Scilit]
- Karim, A.; Shahroz, M.; Mustofa, K.; Belhaouari, S.B.; Joga, S.R.K. Phishing Detection System Through Hybrid Machine Learning Based on URL. IEEE Access 2023, 11, 36805–36822. [Google Scholar] [CrossRef] [Scilit]
- Krishnan, S.; Naik, S.M. An Efficient Framework for Phishing URL Detection Using Adaptive Drift-Aware Feature Monitoring and Online Learning. Secur. Priv. 2025, 8, e70057. [Google Scholar] [CrossRef] [Scilit]
- Kumar, B.; Anu, V.M. Anu Detecting Deceptive URLs: Exploring Logistic Regression and Decision Tree Models. In Proceedings of the 2024 IEEE Students Conference on Engineering and Systems: Interdisciplinary Technologies for Sustainable Future, SCES 2024, Prayagraj, India, 21–23 June 2024; Institute of Electrical and Electronics Engineers Inc.: New York, NY, USA, 2024. [Google Scholar] [CrossRef] [Scilit]
- Rahman, F.; Prakash, V.V. Adaptive Cybersecurity Framework Utilizing Random Forest and SVM for Real-Time Threat Detection in Cloud Environments. In Proceedings of the 2025 International Conference on Automation and Computation, AUTOCOM 2025, Dehradun, India, 4–6 March 2025; Institute of Electrical and Electronics Engineers Inc.: New York, NY, USA, 2025; pp. 241–246. [Google Scholar] [CrossRef] [Scilit]
- Hossain, A.; Islam, S. Enhancing DDoS attack detection with hybrid feature selection and ensemble-based classifier: A promising solution for robust cybersecurity. Meas. Sens. 2024, 32, 101037. [Google Scholar] [CrossRef] [Scilit]
- Rahman, S.; Islam, W.T.; Khan, R.A. Enhancing Cybersecurity with an Investigation into Network Intrusion Detection System Using Machine Learning. In Proceedings of the 2024 IEEE 3rd International Conference on Robotics, Automation, Artificial-Intelligence and Internet-of-Things, RAAICON 2024-Proceedings, Dhaka, Bangladesh, 29–30 November 2024; Institute of Electrical and Electronics Engineers Inc.: New York, NY, USA, 2024; pp. 107–110. [Google Scholar] [CrossRef] [Scilit]
- Ashraf, M.W.A.; Singh, A.R.; Pandian, A.; Rathore, R.S.; Bajaj, M.; Zaitsev, I. A hybrid approach using support vector machine rule-based system: Detecting cyber threats in internet of things. Sci. Rep. 2024, 14, 27058. [Google Scholar] [CrossRef] [Scilit]
- Subramaniam, R.; Sheela, A.J.; Alwabli, A. Enhanced cybersecurity and cyber-attack detection in smart DC micro grids using blockchain technology and SVM technique. Ain Shams Eng. J. 2025, 16, 103400. [Google Scholar] [CrossRef] [Scilit]
- PTeppap, P.; Ponglangka, W.; Luekhong, P. Decision Tree for Boosting Firewall Accuracy: Optimizing Action Classification for Enhanced Cybersecurity. In Proceedings of the ICBIR 2024—2024 9th International Conference on Business and Industrial Research, Proceedings, Bangkok, Thailand, 23–24 May 2024; Institute of Electrical and Electronics Engineers Inc.: New York, NY, USA, 2024; pp. 263–268. [Google Scholar] [CrossRef] [Scilit]
- Polat, O.; Türkoğlu, M.; Polat, H.; Oyucu, S.; Üzen, H.; Yardımcı, F.; Aksöz, A. Multi-Stage Learning Framework Using Convolutional Neural Network and Decision Tree-Based Classification for Detection of DDoS Pandemic Attacks in SDN-Based SCADA Systems. Sensors 2024, 24, 1040. [Google Scholar] [CrossRef] [Scilit]
- Mohandas, R.; Pavithra, A.; Vinothkumar, E.S.; Amarnath, A.; Prabhakaran, A.; Gupta, S.K.; Malik, N. Enhanced Cyberattack Detection in Wireless Sensor Networks Using Gradient Boosting Decision Tree. In Proceedings of the 4th IEEE International Conference on Mobile Networks and Wireless Communications, ICMNWC 2024, Karnataka, India, 4–5 December 2024; Institute of Electrical and Electronics Engineers Inc.: New York, NY, USA, 2024. [Google Scholar] [CrossRef] [Scilit]
- Bognár, L. Predicting Cybersecurity Incidents via Self-Reported Behavioral and Psychological Indicators: A Stratified Logistic Regression Approach. J. Cybersecur. Priv. 2025, 5, 67. [Google Scholar] [CrossRef] [Scilit]
- Leevy, J.L.; Hancock, J.; Zuech, R.; Khoshgoftaar, T.M. Detecting cybersecurity attacks across different network features and learners. J. Big Data 2021, 8, 38. [Google Scholar] [CrossRef] [Scilit]
- Zamrai, M.A.H.; Yusof, K.M.; Azizan, M.A. Random Forest Stratified K-Fold Cross Validation on SYN DoS Attack SD-IoV. In Proceedings of the 2024 7th International Conference on Communication Engineering and Technology, ICCET 2024, Tokyo, Japan, 22–24 February 2024; Institute of Electrical and Electronics Engineers Inc.: New York, NY, USA, 2024; pp. 7–12. [Google Scholar] [CrossRef] [Scilit]
- Wazirali, R. An Improved Intrusion Detection System Based on KNN Hyperparameter Tuning and Cross-Validation. Arab. J. Sci. Eng. 2020, 45, 10859–10873. [Google Scholar] [CrossRef] [Scilit]

Disclaimer/Publisher’s Note: The statements, opinions and data contained in all publications are solely those of the individual author(s) and contributor(s) and not of MDPI and/or the editor(s). MDPI and/or the editor(s) disclaim responsibility for any injury to people or property resulting from any ideas, methods, instructions or products referred to in the content. |
© 2026 by the authors. Licensee MDPI, Basel, Switzerland. This article is an open access article distributed under the terms and conditions of the Creative Commons Attribution (CC BY) license.