


Abstract
This study applies a modality-bridging framework to automatically construct Chain-of-Thought (CoT) reasoning from meteorological images, reducing the need for expert annotation. The proposed pipeline integrates semantic extraction, Pseudo-CoT generation, and logical fusion to produce structured reasoning chains. Using the WeatherQA benchmark, we build datasets under single-image, 3-image, and 20-image settings—with automated and Expert-Guided variants—and evaluate performance on Areas Affected and Conditional Concern tasks. The results show near-expert spatial reasoning and more compact, well-aligned CoTs with reduced-image inputs. Multi-image settings reveal challenges in integrating dense visual cues, while semantic classification remains difficult due to label ambiguity. Overall, modality-bridging offers a scalable, interpretable, and low-cost approach for multimodal meteorological reasoning.
1. Introduction
Severe weather forecasting and warning issuance require reasoning over multiple meteorological diagnostics (e.g., radar echoes, thermodynamic instability, wind shear, and storm environment parameters) and translating them into actionable judgments such as affected areas and potential hazards [1,2]. In real workflows, this process is inherently multimodal: the evidence is primarily visual and spatially structured, whereas the final decision and its justification are typically communicated in natural language. Bridging this gap in a reliable and interpretable manner is central to building trustworthy meteorological question answering and decision-support systems.
Recent advances in large language models have popularized Chain-of-Thought (CoT)-style reasoning as a way to improve performance on multi-step problems and to provide intermediate rationales [3,4]. However, extending CoT supervision to meteorology faces a key bottleneck: high-quality rationales must align specific visual cues (often distributed across multiple parameter maps) with domain-consistent causal logic, which is expensive to annotate and difficult to scale [5,6]. As a result, meteorological benchmarks often provide labels or answers without providing the intermediate reasoning traces needed for training or diagnosing multimodal reasoning behaviors.
To address this gap, a practical direction is automated CoT construction, where intermediate reasoning traces are generated without expert-written annotations [7,8]. In this paper, we focus on a data construction view of this problem and adopt a modality-bridging paradigm: systematically transforming meteorological images into structured textual evidence and then synthesizing that evidence into a coherent reasoning trace.
Importantly, we do not propose a new reasoning mechanism. Instead, our goal is to validate the feasibility and characterize the limitations of applying modality-bridging-based automated CoT construction to meteorological reasoning in a standardized benchmark setting. Concretely, we instantiate a three-stage pipeline that (i) elicits a preliminary pseudo reasoning trace from a vision–language model, (ii) enriches it with image-aware descriptions to improve grounding to meteorological evidence, and (iii) synthesizes a final CoT using a text-based reasoner. The contribution of this study lies in systematic validation, controlled comparisons across input visual density, and analysis of failure modes in a domain where semantics are tightly coupled with physical patterns and multi-map evidence integration.
We conduct our validation on WeatherQA, which serves as a standardized platform for meteorological reasoning with image inputs and expert-curated labels [9]. WeatherQA provides two complementary tasks: Areas Affected, which requires spatially grounded multiple-choice reasoning, and Conditional Concern, which requires semantic classification under a fine-grained taxonomy that is often label-imbalanced. This setting allows us to evaluate modality-bridging under both spatial inference and taxonomy-sensitive semantic reasoning using a unified protocol. Beyond the full multi-parameter setting (20 image channels), we additionally evaluate reduced-image settings (single-image and three-image) to quantify how the density and diversity of visual evidence influence the quality of constructed CoT traces and downstream task performance. This design makes it possible to identify when automated CoT is sufficiently informative to act as a useful supervision or analysis signal, and when ambiguity, multi-image fusion, or label granularity becomes the dominant limitation.
The current version of this manuscript extends our prior conference paper by providing a more systematic validation and analysis of modality-bridging for meteorological CoT construction on WeatherQA [10]. The key contributions are as follows:
- Validated application of modality-bridging in a meteorological reasoning benchmark. We formulate the study as an empirical validation of an existing modality-bridging data construction paradigm in a domain with dense visual cues, and evaluate it under the standardized WeatherQA protocol across spatial (Areas Affected) and semantic (Conditional Concern) tasks.
- Expanded evaluation under reduced-image settings (single-image and three-image). In addition to the full 20-parameter setting, we introduce single-image and three-image configurations and conduct controlled comparisons to quantify how visual density affects CoT compactness, image–text alignment, and downstream task performance.
- Pipeline refinement informed by full-setting observations, with additional ablations. Based on findings from the 20-image setting, we refine the construction workflow for reduced-image settings (including parallel description/pseudo reasoning generation and “no-pseudo” variants) and provide ablation analyses to isolate the role of intermediate stages.
- Deeper empirical analysis of performance and failure modes. We add expanded evaluations and analyses (e.g., macro/weighted metrics for imbalanced labels, coarse-grained label mapping for the Conditional Concern task, and structural/alignment analyses of CoT text) to clarify where modality-bridging succeeds and where domain-specific ambiguity and multi-image fusion remain challenging.
This paper is organized as follows: Section 2 reviews related work on meteorological reasoning, multimodal large language models, and automated CoT construction. Section 3 details the proposed modality-bridging framework, including the three-stage pipeline and image input settings. Section 4 presents the experimental setup and results, covering dataset preparation, model settings, evaluation metrics, and comprehensive analyses across tasks. Section 5 concludes and discusses the limitations. Section 6 outlines future research directions.
2. Related Work
2.1. Chain-of-Thought and Automated Rationale Construction
Chain-of-Thought (CoT) prompting and supervision have been widely studied as a means to improve multi-step reasoning performance and to expose intermediate rationale-like traces in language models [3,11,12]. Beyond prompting, recent work has explored automated rationale construction, where models generate intermediate reasoning traces that can be used as scaffolding for downstream learning or analysis without requiring costly human annotations [6,7]. This line of research is particularly relevant when expert rationales are expensive, inconsistent, or difficult to scale—conditions that frequently hold in scientific and decision-making domains. Various CoT reasoning strategies have been proposed [13,14,15,16,17].
Chain-of-Thought (CoT) prompting [3] and supervision have been widely studied as a means to improve multi-step reasoning performance and to expose intermediate rationale-like traces in language models. Beyond prompting, recent work has explored automated rationale construction [6,7,8], where models generate intermediate reasoning traces that can be used as scaffolding for downstream learning or analysis without requiring costly human annotations. Various CoT variants have been proposed, including self-consistency methods [11], tree-based exploration [13], least-to-most decomposition [12], reasoning–acting integration [14], program-aided reasoning [15], self-asking strategies [16], and analogical reasoning [17].
At the same time, there is growing awareness that model-generated rationales may not be fully faithful to the underlying decision process, and may contain omissions or post hoc justifications [18]. Consequently, many studies emphasize the evaluation of not only the accuracy of the end-task but also the properties of the rationales generated, such as grounding, consistency, and alignment with evidence. These considerations are essential when CoT is treated as an intermediate representation rather than as a guaranteed causal explanation.
Our paper follows this “data construction and analysis” perspective: we do not propose a new reasoning algorithm, but instead investigate whether automatically constructed CoT traces can serve as useful intermediate representations for meteorological reasoning, and we evaluate both downstream performance and trace quality/alignment.
2.2. Modality-Bridging for Multimodal Reasoning Traces
A practical challenge in multimodal reasoning is that critical evidence is often encoded in visual or spatially structured signals, while reasoning models operate most effectively over text [19]. A growing body of work therefore studies modality-bridging strategies that convert visual evidence into text-like representations (e.g., image-grounded descriptions, extracted attributes, or structured summaries), enabling language-based reasoning modules to operate on a representation that is more compatible with their inductive biases [20,21]. Within this paradigm, multi-stage pipelines are commonly used: an initial step produces a draft reasoning trace or a coarse interpretation, subsequent steps enrich grounding to visual evidence, and a final step synthesizes a coherent explanation-style output.
Previous studies typically frame modality-bridging as an engineering and data construction approach rather than as a fundamentally new reasoning mechanism. Its value lies in improving evidence accessibility, reducing annotation burdens, and enabling systematic ablation of intermediate representations under controlled evaluations. The effectiveness of such pipelines can also be domain-dependent, because the required visual abstractions and the semantics–evidence mapping differ substantially across tasks [22].
In our work, we adopt modality-bridging as a staged data construction template and evaluate its feasibility and limitations in meteorological reasoning, where evidence is dense, multi-mapped, and tightly coupled with domain semantics. Our contribution is empirical validation and analysis in this setting, not a new reasoning paradigm.
2.3. Scaling Visual Inputs in Multimodal Reasoning Systems
Vision language models and multimodal QA systems have made rapid progress in tasks requiring image foundation, instruction follow-up, and basic visual reasoning [23,24]. A related challenge, especially relevant to scientific images and diagnostic maps, is multi-image reasoning: combining evidence across multiple views or channels while maintaining consistency and avoiding spurious correlations [25]. Previous work highlights that performance can degrade when the number of visual inputs increases, due to attention dilution, conflicting cues, or insufficient mechanisms for cross-image aggregation. Consequently, reduced-input settings are often used to probe how visual density affects reasoning behavior, robustness, and interpretability.
Our evaluation explicitly includes full and reduced-image settings (20-image, 3-image, and single-image) to quantify how visual density influences modality-bridging quality and downstream performance, and to expose failure modes in multi-image fusion for meteorological reasoning.
2.4. Meteorological Benchmarks for Visual Reasoning and Question Answering
Meteorological machine learning spans diverse tasks, including forecasting-oriented modeling, climate re-analysis, nowcasting [26,27,28], and event detection [29,30,31]. Recent advances include hybrid approaches [32,33] and domain-specific applications [34]. However, many forecasting benchmarks primarily evaluate predictive accuracy on continuous fields, and do not directly test image-grounded reasoning with explicit question–answer formats [35,36]. WeatherQA provides a complementary evaluation regime by framing meteorological understanding as structured reasoning over diagnostic images and expert-curated labels under a standardized protocol [9]. Its two tasks—Areas Affected (spatial multiple-choice) and Conditional Concern (taxonomy-sensitive classification)—jointly cover spatial inference and semantic reasoning, making it suitable for analyzing how evidence is translated from images into textual reasoning traces.
WeatherQA also exposes domain-specific challenges that are central to our study. It requires multi-parameter evidence integration, where cues are distributed across multiple diagnostic maps, and it includes taxonomy-sensitive semantic labels (especially for the Conditional Concern task), which can make evaluation sensitive to class distribution and label boundary ambiguity. These properties make WeatherQA a practical testbed for validating whether modality-bridging-based automated CoT construction can provide useful intermediate traces, and for identifying the limitations that remain.
We treat WeatherQA as a standardized validation platform for modality-bridging in meteorological reasoning, and design our experiments to probe both spatial inference and taxonomy-sensitive semantics under full and reduced-image settings.
3. Methods
3.1. Research Positioning and Objectives
This study does not propose a novel reasoning mechanism; rather, it adapts and validates the modality-bridging paradigm—originally introduced in Vision-R1 for meteorological reasoning tasks [20]. Our primary objective is to assess whether automated Chain-of-Thought (CoT) construction via cross-modal transformation can produce training data that approach expert-level quality in the specialized domain of severe weather forecasting.
We position WeatherQA as a standardized evaluation platform that enables systematic comparison across multiple CoT construction strategies [9]. Specifically, we investigate (i) whether visually grounded reasoning chains can be generated without manual annotation, (ii) how image density (single, 3, or 20 meteorological parameters) affects reasoning quality and alignment, and (iii) where domain-specific challenges—such as semantic ambiguity and label imbalance—limit current approaches.
The resulting CoT data serve primarily as training signals to improve model performance on spatial reasoning and semantic classification. Interpretability, while a desirable byproduct, is secondary to the goal of producing effective supervision at scale. This work thus evaluates the practical viability of modality-bridging in a high-stakes scientific domain, rather than advancing the underlying reasoning formalism itself.
3.2. Image Selection Strategies for CoT Construction
We design three image input configurations to systematically evaluate the trade-off between visual information density and reasoning quality:
- Full-parameter setting (20 images). Both Rule-Based (RB) and Expert-Guided (EG) datasets utilize the complete set of 20 meteorological parameter maps provided in WeatherQA. This setting maintains comparability with the original benchmark and represents the information-rich regime typical of operational forecasting workflows.
- Reduced-parameter settings (single and three images). The WeatherQA benchmark demonstrates that subsets of meteorological parameters can achieve competitive prediction accuracy. We therefore construct two streamlined configurations:
- –
- Single-image: Base Reflectivity Mosaic (rgnlrad), chosen as the most visually salient indicator of convective structure.
- –
- Three-image: rgnlrad, 0–6 km wind shear magnitude (shr6), and surface-based CAPE with convective inhibition (sbcp). These parameters jointly capture convective organization (radar), kinematic environment (shear), and thermodynamic instability (CAPE/CIN).
The meteorological rationale for these selections follows established forecasting principles: reflectivity reveals storm morphology; shear governs supercell potential and tornado risk; CAPE/CIN controls updraft strength and convective initiation likelihood. By isolating these core ingredients, we test whether compact visual inputs can yield CoTs that are both accurate and closely aligned with task-relevant features.
3.3. Three-Stage Modality-Bridging Pipeline
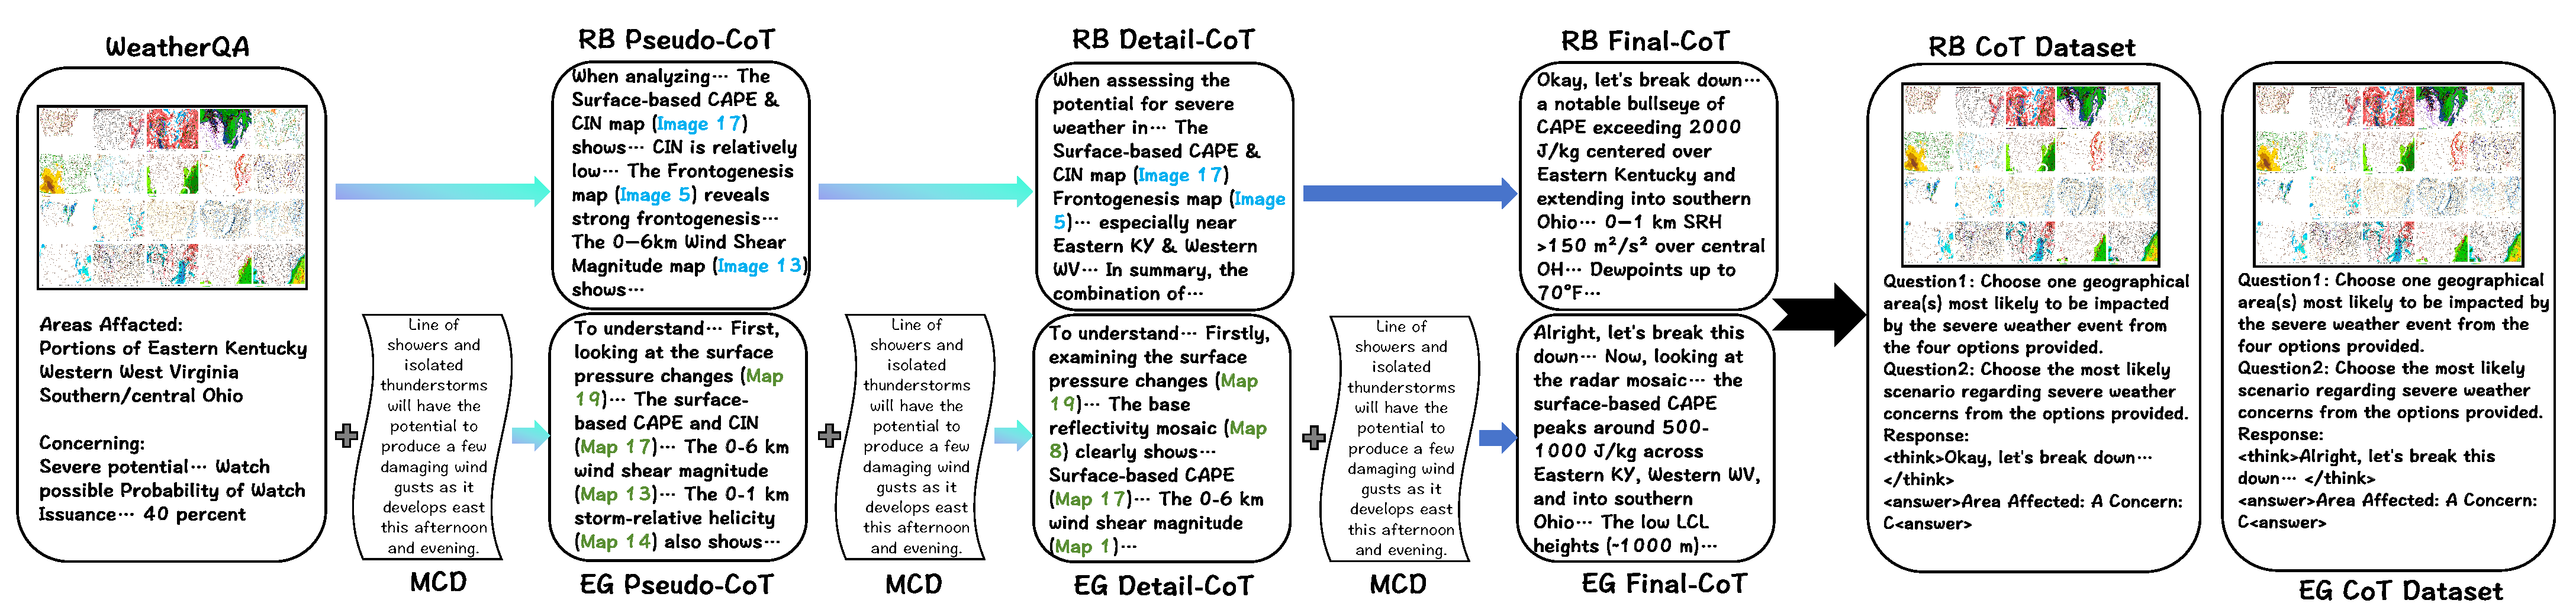
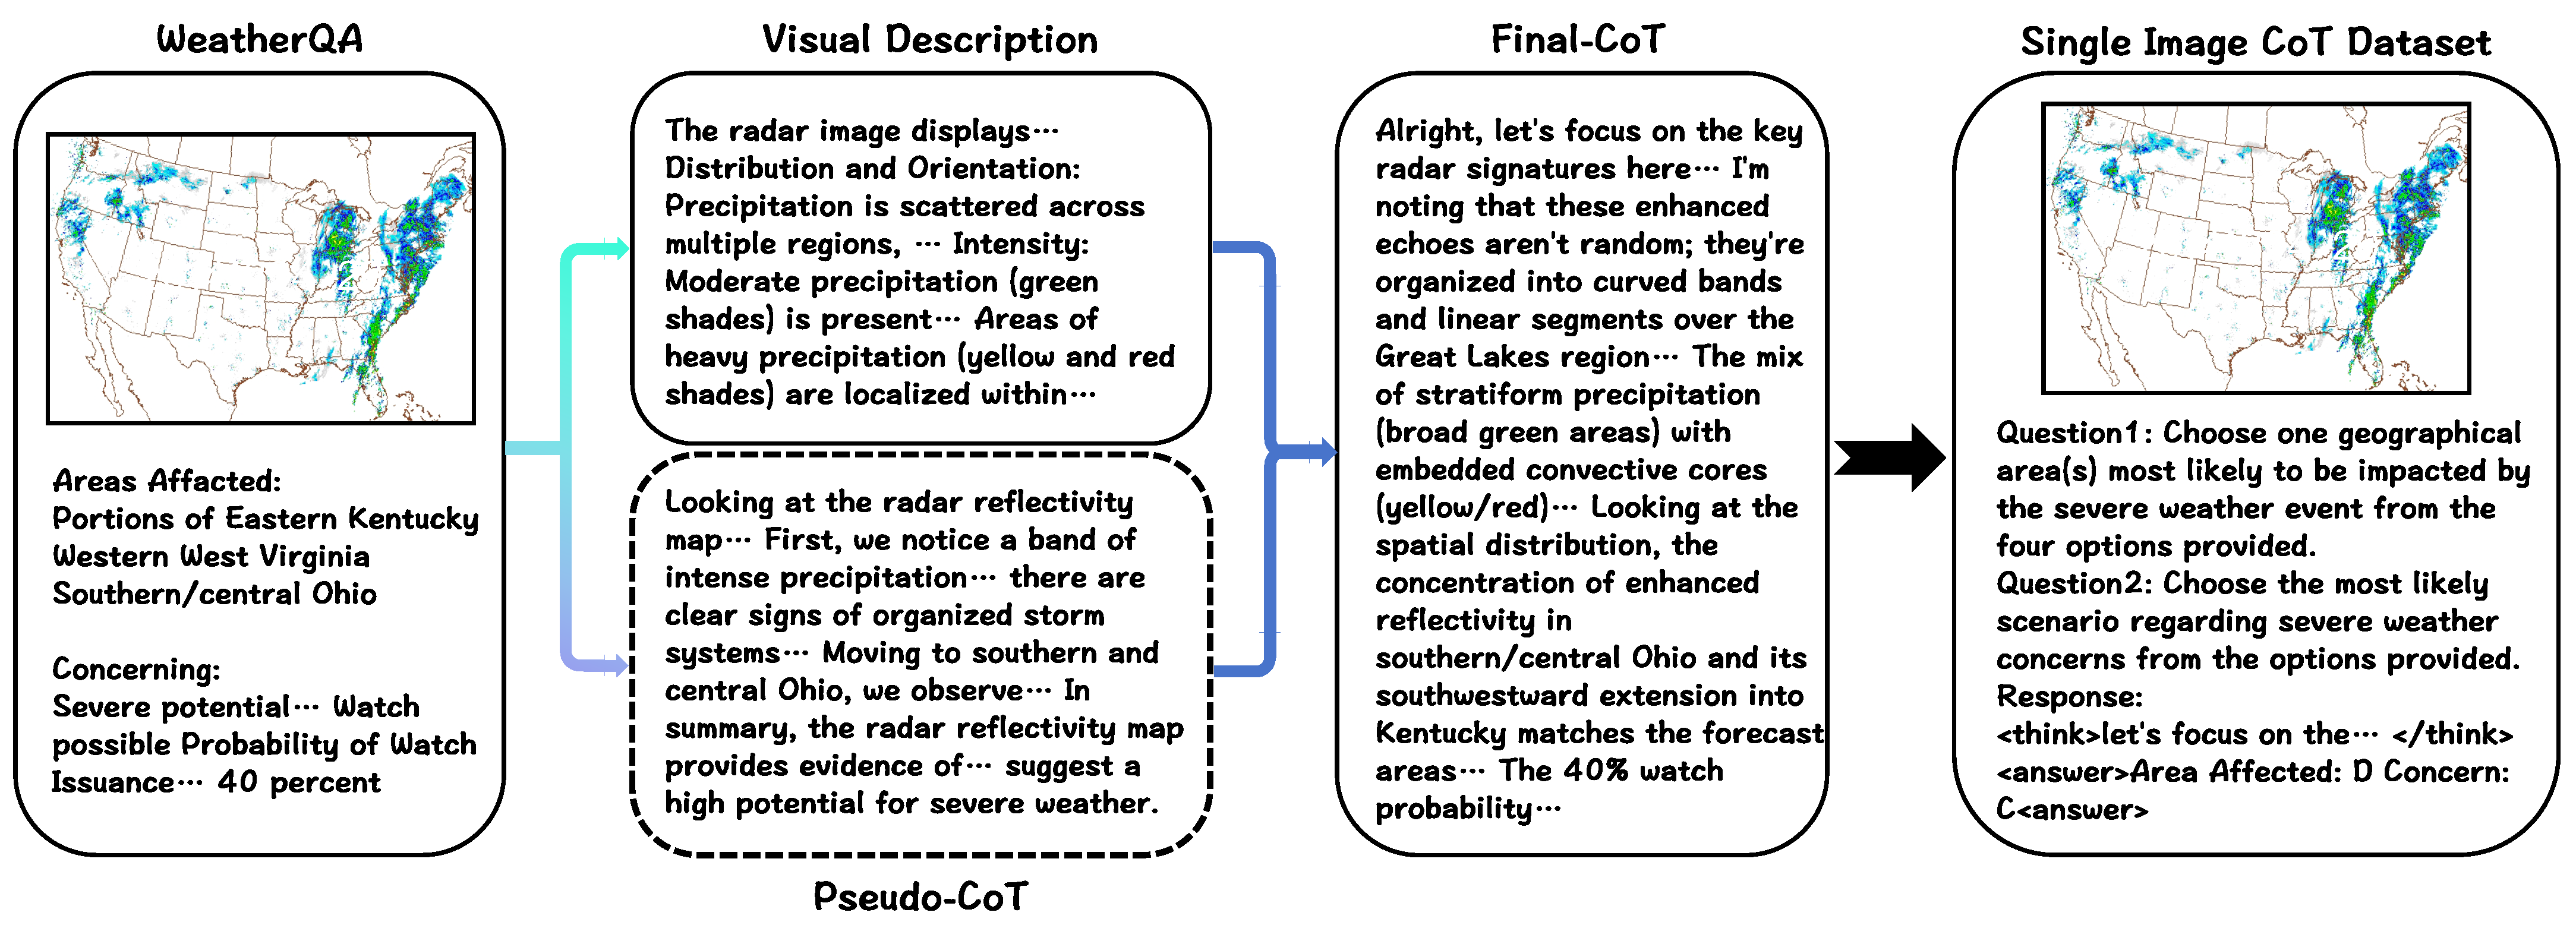
Our pipeline transforms meteorological images into structured CoT reasoning through three sequential stages, adapted from Vision-R1. Each stage performs a specific cross-modal transformation, with outputs serving as inputs to subsequent stages. Figure 1 illustrates the full pipeline under the 20-image setting, while Figure 2 shows the streamlined variant for reduced-image configurations.
Figure 1.
Overview of the modality-bridging pipeline under the full-image setting, illustrating the three-stage automated Chain-of-Thought (CoT) generation process: (1) Pseudo-CoT generation, (2) Detail-CoT enrichment, and (3) Final-CoT synthesis. Expert guidance is incorporated throughout the pipeline in the Expert-Guided (EG) variant. Highlighted passages indicate where the model cites image-derived evidence while generating the CoT; the numbered image references (e.g., “image 3”, “image 5”, “image 17”) within the text boxes are automatically generated by the model to reference input meteorological parameter maps, not citations to figures in this paper. Gradient arrows trace the processing pipeline within the multimodal model, plain blue arrows delineate the reasoning trajectory executed by the text-based DeepSeek model, and black arrows signify the production of the final outputs.
Figure 2.
Modality-bridging pipeline for the single-image setting, showing independent generation of image descriptions and Pseudo-CoT, which are subsequently integrated by the textual reasoning model to produce the final CoT. Gradient arrows indicate processing within the multimodal model, blue arrows denote the text-based reasoning process, and black arrows represent the generation of final outputs. The pipeline for the three-image setting follows an identical process, differing only in the number of images processed. The dashed-line box denotes the streamlined “no-pseudo” variant, in which the “Pseudo-CoT” branch is omitted and the final CoT is derived directly from the image description(s) and task labels.
3.3.1. Terminology and Definitions
Before detailing each stage, we define key terms used throughout:
- Pseudo-CoT: An initial reasoning chain generated by a multimodal large language model (MLLM) that captures preliminary visual semantics and task-relevant patterns, but may lack meteorological specificity or structural coherence.
- Detail-CoT: An enriched reasoning chain produced by prompting the MLLM to incorporate explicit meteorological observations (e.g., CAPE values, shear orientation, reflectivity patterns) into the Pseudo-CoT framework.
- Final-CoT: The synthesized reasoning chain output by a text-based reasoning model (e.g., DeepSeek-R1 [37]) that integrates information from earlier stages into a logically coherent, causally structured explanation.
- Modality-bridging: The systematic process of converting visual perceptual information (meteorological imagery) into textual logical reasoning (CoT chains) through staged transformation, without requiring direct human annotation of reasoning steps.
3.3.2. Stage 1: Pseudo-CoT Generation
This stage extracts preliminary visual semantics and establishes a baseline reasoning structure. The input consists of meteorological images (single, 3, or all 20 parameter maps), the task question, and ground-truth labels indicating affected regions and weather concern type. We employ Qwen-VL-Max as the multimodal large language model for this stage [38].
The model is prompted to simulate expert reasoning by connecting visual observations to the provided task outcomes. The system prompt (detailed in Appendix A) instructs the model to ground all reasoning in visually interpretable meteorological evidence, avoid speculation beyond observable patterns, and emulate the analytical style of a trained forecaster. The output is a preliminary reasoning chain, typically 300–500 words, that articulates how atmospheric conditions visible in the imagery relate to the forecast concern and affected areas.
This stage leverages the multimodal model’s capacity to jointly process visual and linguistic information. The inclusion of ground-truth labels anchors the reasoning to task-relevant outcomes, though this design choice introduces the risk of reverse-engineering explanations from answers rather than deriving them from observations alone. We explicitly evaluate this trade-off through ablation studies in Section 4.2.3.
3.3.3. Stage 2: Detail-CoT Enrichment
The second stage refines the preliminary reasoning chain by injecting domain-specific meteorological details and explicit quantitative observations. Using the same multimodal model, we process the original images, task question, labels, and the Pseudo-CoT from Stage 1 to generate an enriched reasoning chain.
The prompt template for this stage (Appendix A.2) explicitly requests three types of refinement: replacing vague descriptors with specific meteorological terms (e.g., transforming “strong instability” into “SBCAPE exceeding 2000 J/kg”), elaborating spatial patterns such as reflectivity gradients and shear vector orientation, and strengthening causal connections between observed atmospheric conditions and severe weather outcomes.
The output is an enriched reasoning chain, typically 500–700 words, that retains the logical structure established in Stage 1 while adding meteorological precision. This stage addresses a documented limitation of multimodal models: when processing specialized scientific imagery, they tend toward generic descriptions lacking domain-specific detail. By conditioning on the Pseudo-CoT and explicitly prompting for elaboration, we guide the model toward more informative, domain-aligned explanations without requiring human annotation of reasoning steps.
3.3.4. Stage 3: Final-CoT Synthesis
The final stage generates a logically coherent, causally structured reasoning chain using a text-based reasoning model. We employ DeepSeek-R1 for this synthesis, taking as input the enriched Detail-CoT from Stage 2, the task labels, and—in the Expert-Guided variant—expert-authored mesoscale discussions.
The model is prompted to produce step-by-step reasoning with explicit causal interpretation, integrating information from the Detail-CoT while maintaining logical consistency throughout the chain. In the Expert-Guided configuration, the expert discussions serve as additional context to inform both the reasoning style and the level of meteorological specificity. The output is a polished reasoning chain suitable for model fine-tuning, typically 400–700 words depending on the image configuration.
This architectural choice reflects complementary model strengths: text-based reasoning models excel at structured logical inference but lack direct visual grounding, while multimodal models can interpret imagery but may struggle with complex multi-step reasoning. By delegating visual understanding to Stages 1–2 and logical synthesis to Stage 3, we instantiate the core modality-bridging principle: systematic transformation of perceptual information into textual form, followed by text-based reasoning [39].
3.4. Pipeline Summary
The complete transformation progresses through three sequential stages: visual inputs are first converted into preliminary reasoning chains (Pseudo-CoT), which are then enriched with meteorological details (Detail-CoT), and finally synthesized into logically coherent explanations (Final-CoT). This process can be formalized as
At each stage, information flows from visual modality toward textual reasoning, with progressive refinement of semantic precision and logical structure. The pipeline operates without human annotation in the Rule-Based (RB) variant and incorporates expert guidance at all three stages in the Expert-Guided (EG) variant.
Construction Modes: Rule-Based and Expert-Guided Datasets
We construct two parallel datasets to evaluate the impact of expert involvement:
- Rule-Based (RB) dataset. Implements the three-stage pipeline exactly as described in Section 3.2, with no human annotation. All prompts rely on Rule-Based instructions derived from meteorological forecasting principles (Appendix A).
- Expert-Guided (EG) dataset. Augments the RB pipeline by incorporating expert-authored Mesoscale Convective Discussions (MCDs) from WeatherQA at all three stages. Specifically, the following occurs:
- –
- Stage 1: The MCD is included as additional context when generating Pseudo-CoT.
- –
- Stage 2: The MCD informs Detail-CoT enrichment, providing domain-specific language and reasoning patterns.
- –
- Stage 3: The MCD serves as a reference for logical structure during Final-CoT synthesis.
The EG variant does not require experts to write new reasoning chains; it leverages existing expert text to guide automated generation. This approach tests whether expert knowledge, when systematically injected into the pipeline, yields measurably better CoT quality. By training models on RB versus EG datasets and comparing performance (Section 4.2.1), we assess whether the additional cost of expert guidance justifies its inclusion, or whether Rule-Based automation suffices.
3.5. Streamlined Pipeline for Reduced-Image Settings
For single-image and three-image configurations, we adopt a streamlined two-branch pipeline (Figure 2) to avoid redundancy. Rather than sequentially refining a single chain, we generate two complementary text representations in parallel and combine them during synthesis. We independently produce the following:
- Image description branch: The MLLM generates a detailed meteorological description of the input images without reference to task labels, focusing on observable atmospheric features.
- Pseudo-CoT branch: The MLLM generates a preliminary reasoning chain as in Stage 1 (Section 3.3.1), conditioned on both images and labels.
Both outputs are concatenated and passed to the text-based reasoning model, which synthesizes a final CoT that integrates descriptive observations with task-oriented logic.
We also evaluate a variant where the Pseudo-CoT branch is omitted entirely, and the final reasoning chain is derived solely from image descriptions and task labels. This ablation tests whether the Pseudo-CoT stage provides essential task-relevant structure, or whether image descriptions alone suffice when visual information is limited.
3.6. Design Considerations and Limitations
Why no self-verification? Unlike some CoT frameworks (e.g., self-reflection mechanisms), we deliberately omit explicit verification stages. Research has shown that self-verifying prompts often induce hallucinations in complex reasoning tasks because models struggle to reliably distinguish between reasonable and correct reasoning [40]. We prioritize producing accurate base-level chains that can be reliably learned during fine-tuning.
Model dependency. The pipeline’s performance depends on the specific MLLM (Qwen-VL-Max) and text reasoner (DeepSeek-R1) used. We expect qualitatively similar trends with other capable models, but absolute performance may vary. Future work should systematically evaluate pipeline behavior across multiple model architectures.
Label leakage concern. By providing ground-truth labels L during CoT generation, we risk producing reasoning chains that rationalize answers rather than derive them. This design choice prioritizes data construction efficiency over strict faithfulness. We partially address this concern through (i) ablation studies that evaluate intermediate outputs (Section 4.2.2), and (ii) structural analysis of CoT–image alignment (Section 4.5).
Prompt engineering. All prompts are provided in full in Appendix A. While we follow established prompting best practices, alternative prompt formulations may yield different results. The current templates reflect iterative refinement based on domain expertise and pilot experiments.
3.7. Summary
This section has detailed a three-stage modality-bridging pipeline adapted from Vision-R1 for meteorological CoT construction. The pipeline systematically transforms visual meteorological data into textual reasoning chains through Pseudo-CoT generation, Detail-CoT enrichment, and Final-CoT synthesis. We construct datasets under multiple image-density settings (single, 3, 20 parameters) and two modes (Rule-Based and Expert-Guided) to enable comprehensive evaluation. The resulting CoT data serve as training signals for downstream models, with interpretability as a secondary benefit. Section 4 presents experimental validation of this approach across WeatherQA’s spatial reasoning and semantic classification tasks.
4. Results
4.1. Experimental Setup and Evaluation Metrics
We evaluate through two WeatherQA tasks:
- Areas Affected (Multiple-choice): For identifying geographic regions affected by mesoscale weather systems. Options are filtered for Jaccard similarity <50% to ensure diversity.
- Conditional Concern (Multi-class Classification): For predicting severe weather concern type, including warning type and urgency. Label taxonomy is in the Appendix C.
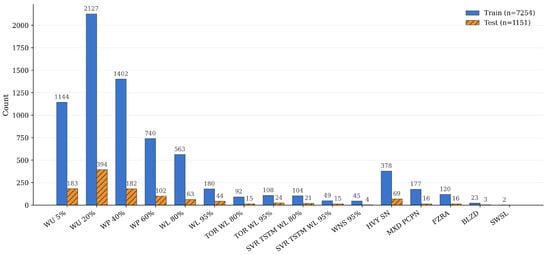
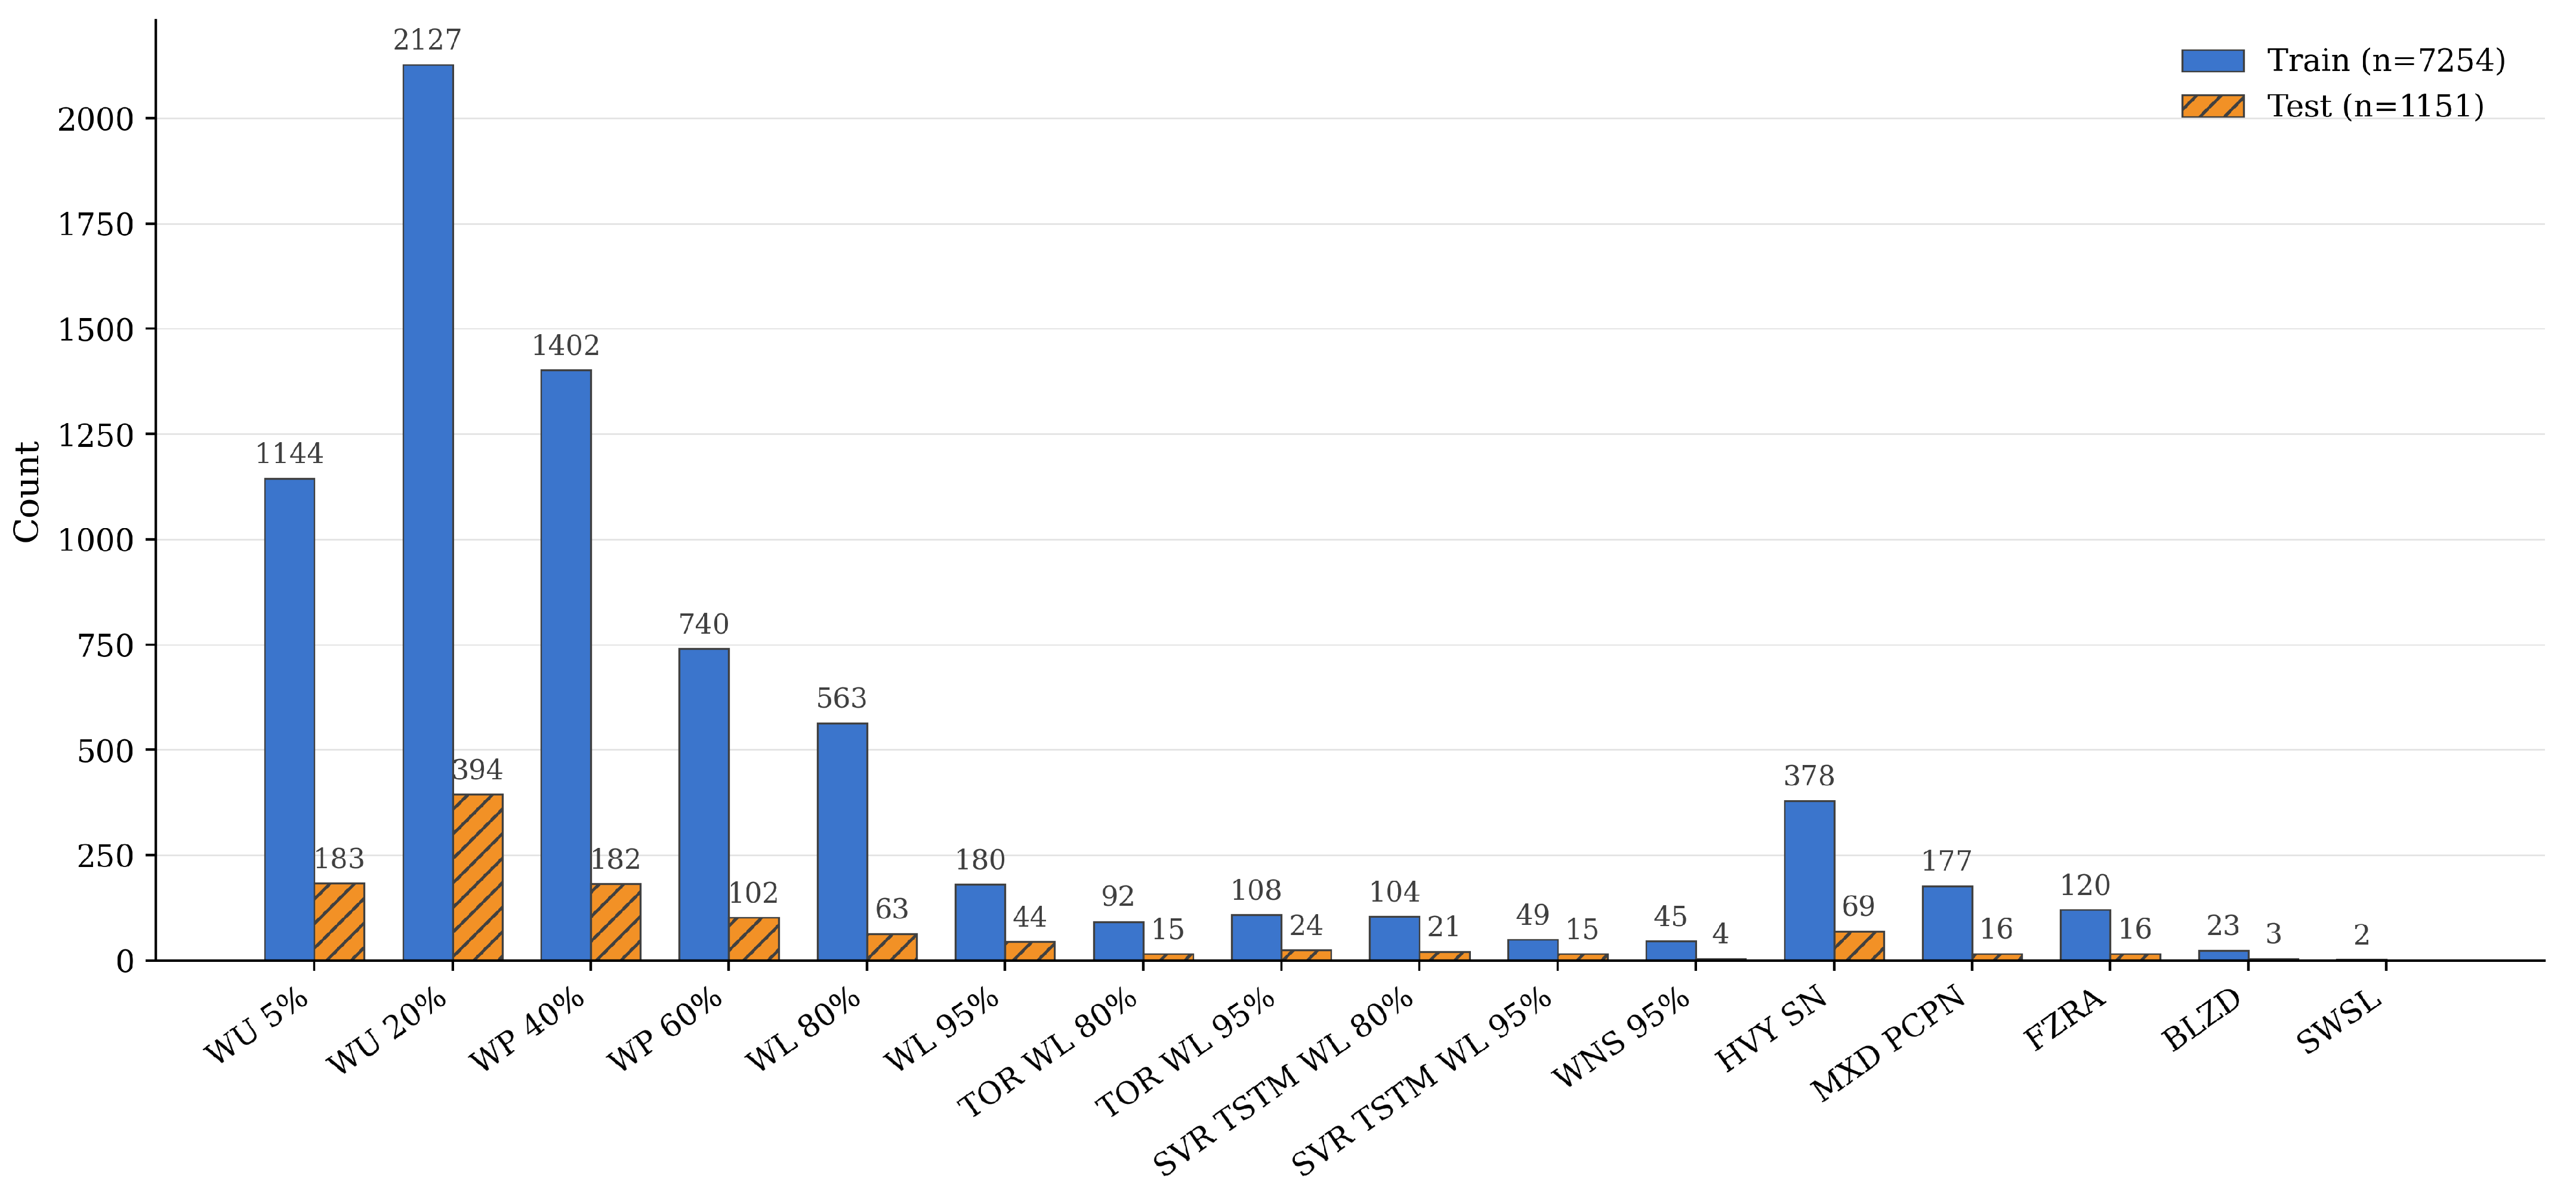
For both tasks, we report accuracy as the primary metric. However, given the severe class imbalance in the Conditional Concern task (Figure 3), accuracy alone is insufficient to capture model performance. A model that simply predicts the most frequent class can achieve misleadingly high accuracy while failing to recognize minority weather types. We therefore place equal emphasis on Macro-F1 scores, which treat all classes equally regardless of frequency and thus provide a more faithful assessment of semantic discrimination capability.
Figure 3.
Category distribution of the 16 Conditional Concern labels in the train and test splits. The label space is highly imbalanced: the top three categories dominate, whereas multiple tail classes have fewer than 20 instances in the test set. Such a skewed distribution poses challenges for reliable per-class performance. For brevity and visual consistency, we standardize category names using abbreviations; see Appendix C for the full names.
We also report the precision, recall, and weighted F1 for comprehensive per-class analysis. Weighted metrics account for class frequency and reflect overall prediction quality, while macro-averaged metrics reveal whether the model generalizes across the full label space or merely exploits the majority classes.
For data partitioning, we follow the time-based split strategy used in the WeatherQA dataset. Specifically, we use 7257 samples from 2014 to 2019 as the training set. Due to the built-in content moderation mechanism in the Qwen interface, a few inputs in the RB and EG datasets were flagged during processing and thus excluded, despite manual inspection finding no significant issues. As a result, the final effective training set contains 7254 samples. The 2020 samples (1151 entries) are used as the test set. This setup effectively prevents data leakage and overfitting, ensuring fair and reproducible evaluations. The detailed distribution of the original 16 Conditional Concern labels are shown in Figure 3.
We employ efficient parameter adaptation through LoRA [41] for model fine-tuning. All experiments use a unified high-performance computing environment with multi-GPU distributed training and efficient fine-tuning strategies (Appendix B).
4.2. Performance on the Core Tasks
4.2.1. Main Results Across Data Sources
Table 1 summarizes model performance across all CoT construction strategies and image configurations. We organize our analysis around three key comparisons. First, the base model performs poorly (28.93% on Areas Affected), confirming that domain-specific training is essential. The OR model with expert-written explanations establishes the performance ceiling at 64.29% and 30.84% for the two tasks, respectively.
Table 1.
Model performance across all CoT construction settings.
Second, automated CoT construction (RB and EG) achieves 90–92% of expert performance on Areas Affected task but remains at 25% on Conditional Concern task. Notably, EG does not consistently outperform RB, suggesting expert guidance provides limited benefit when domain-appropriate prompting is already incorporated. This validates the scalability of fully automated approaches.
Third, reduced-image settings often outperform the full 20-image configuration. Single-image Pseudo-CoT reaches 70.46% on Areas Affected task—the highest across all variants—while three-image Pseudo-CoT achieves 69.50%. This indicates that visual redundancy degrades reasoning quality and that focusing on core parameters yields tighter, more coherent chains. On the Conditional Concern task, all configurations perform comparably (25–32%), revealing fundamental limitations, which we analyze in Section 4.3.
4.2.2. Effect of Intermediate Reasoning Stages
We evaluate Pseudo-CoT and Detail-CoT as standalone training data to understand stage-specific contributions. In full-image settings, Detail-CoT benefits from expert guidance (EG: 62.81% vs. 57.04%) but not from Rule-Based prompting (RB: 62.81% vs. 64.99%), suggesting Stage 2 elaboration can introduce noise without expert context. In reduced-image settings, Pseudo-CoT consistently outperforms (70.46% and 69.50% for single and three images), indicating that compact early-stage chains are more learnable when visual information is focused. This reveals opportunities for pipeline streamlining and confirms that visual relevance outweighs visual quantity.
4.2.3. Ablation Study on the Pseudo Stage
Removing the Pseudo-CoT branch (“no-pseudo” variants) consistently reduces the Conditional Concern accuracy (single: 23.63% vs. 25.28%; three: 26.32% vs. 27.63%), indicating that this stage provides an essential structure for semantic understanding. On the Areas Affected task, the impact varies by configuration (single: 61.51% vs. 64.21%; three: 63.08% vs. 61.60%), suggesting that the Pseudo stage is less critical for spatial reasoning. The Pseudo-CoT stage thus serves different roles depending on the task type: essential for semantic classification, optional for spatial pattern recognition.
4.3. Conditional Concern Classification Task: Challenges and Reformulation
Model accuracies on the Conditional Concern task remain at 25–32% across all configurations—far below the 60–70% achieved on the Areas Affected task. Even with label merging, macro-F1 scores stay between 0.06 and 0.16 (Table 2 and Table 3), indicating fundamental challenges beyond simple performance gaps. We analyze three primary factors.
Table 2.
Macro and weighted average metrics (Precision, Recall, F1) for each model on the Conditional Concern classification task.
Table 3.
Macro and weighted average metrics for each model on the Conditional Concern (Merged) classification task.
The 16-category scheme conflates meteorological phenomena with probabilistic confidence levels (e.g., “Watch unlikely 5%” vs. “Watch unlikely 20%”). These distinctions represent forecaster uncertainty rather than different weather types, yet are treated as separate classes. Merging to 11 categories improves accuracy to 40–51% but macro-F1 remains low, demonstrating that models can distinguish coarse weather types (severe vs. winter weather) but struggle with probabilistic gradations.
Figure 3 shows extreme imbalance: three categories dominate while multiple classes have <20 test instances. This creates prediction bias toward majority classes, evident in the gap between the weighted and macro metrics. The OR model achieves 0.31 weighted recall but only 0.10 macro recall (Table 2)—a 3× difference indicating near-chance performance on minority classes.
Table 4 reveals bimodal per-class performance: high-frequency labels like “WU 20%” reach 67–78% accuracy, while low-frequency categories (TOR WL, SVR TSTM WL) achieve 0–6%. This pattern suggests that the challenge is not merely sample size but the fundamental difficulty of learning stable visual–semantic mappings when labels involve abstract probabilistic judgments rather than directly observable patterns. No CoT construction strategy consistently outperforms across categories, confirming that performance is determined by label characteristics rather than pipeline design.
Table 4.
Conditional Concern accuracy across models and weather concern types.
4.4. Generalization Across Specific Weather Scenarios
To investigate the adaptability of models across different meteorological semantic scenarios, we further analyzed the classification accuracy for each label category within the Conditional Concern task. Since each test instance has a single ground-truth label, we use accuracy as the primary evaluation metric in this section to assess performance disparities across multi-class conditions. The results are shown in Table 4 and Table 5.
Table 5.
Areas Affected task accuracy across models and weather concern types.
The overall results show that the models’ performance on the Conditional Concern task varies greatly by label, indicating strong category dependency. For labels with sufficient sample size and well-defined semantic boundaries, the models tend to maintain high accuracy. However, for low-frequency categories, or those with overlapping semantics or ambiguous definitions, performance drops sharply—indicating high uncertainty and evident training bias. In fact, for several extreme or edge-case semantic labels, most models achieved near-zero accuracy, highlighting a significant shortfall of the current construction strategy in covering the long-tail semantic space.
From a broader comparison across different CoT construction strategies, we find that the inclusion of “Pseudo-CoT” stages, image input settings, and reasoning chain styles all exert some influence on performance for individual categories. However, none of these design choices consistently produce superior results across all Concern labels. The observed performance variance across models is better explained by the alignment (or misalignment) between the semantic structure of labels and the distribution of training samples, rather than any one strategy being categorically better. As a result, single-point performance metrics are insufficient to infer the global effectiveness of a particular construction method for multi-class Conditional Concern tasks.
Overall, the Conditional Concern task places significantly higher demands on the models’ semantic discrimination capabilities. Performance is largely contingent upon the presence of semantically relevant training samples and is highly sensitive to the style and structure of the reasoning chains used. In contrast, the Areas Affected task exhibits more consistent results across models, with smaller variations in accuracy between categories. This suggests that Areas Affected relies more heavily on spatial image information, whereas Concern depends more on precise semantic reasoning.
In summary, models continue to face significant performance bottlenecks in the multi-class Conditional Concern classification task. The variations observed primarily reflect models’ inherent biases toward certain semantic categories and the imbalance in training sample distributions. Moving forward, improving semantic discrimination and enhancing generalization in low-resource, long-tail categories will be critical for advancing performance in this task.
4.5. Analysis of Linguistic and Semantic Structure in CoT Data
To understand how each dataset influences model behavior, we analyze two dimensions of the generated CoT: (1) linguistic structure (length, sentence count, lexical diversity) and (2) visual alignment with key meteorological fields. This section focuses on structural patterns rather than task accuracy.
4.5.1. Structural Complexity of CoT Text
Table 6 shows clear structural differences across the strategies. The detail-stage texts have higher word and sentence counts due to prompt design encouraging elaboration. The expert-written OR texts have higher lexical diversity. The model outputs inherit training data structural properties, confirming style reproduction.
Table 6.
Comparison of structural metrics between training set and model outputs.
4.5.2. Semantic Alignment Between CoT Text and Visual Content
Table 7 shows higher semantic similarity in single-image settings than three-image, indicating better focus on core visual information. Three-image CoTs tend to distribute attention across more parameters, reducing the depth of reasoning tied to any single field. This dispersion lowers the semantic coverage and emphasizes the need for relevance-driven image selection.
Table 7.
Visual similarity (Sim) and coverage (Covg) metrics across training set and model outputs.
CoT data retain image information consistently, but alignment is influenced by image count, task orientation, and construction strategy.
4.5.3. Impact of CoT Structure on Model Behavior
The linguistic structure and image–text alignment differences are preserved in model outputs. Stylistic features are shaped by prompting and task orientation; the image count affects information filtering and integration. These observations highlight the impact of training data design on reasoning performance.
4.6. Summary of Key Findings
The experimental results validate modality-bridging for automated meteorological CoT construction while revealing clear performance boundaries. On the Areas Affected task, the automatically generated CoT data achieve 90–92% of the expert performance, with the reduced-image settings often outperforming the full 20-parameter configuration. Pseudo-CoT data frequently match or exceed more elaborated variants, indicating that compact reasoning chains are more learnable. Image quantity does not guarantee quality: visual relevance and reasoning focus matter more than comprehensive parameter coverage.
On the Conditional Concern task, performance plateaus at 25–32% (macro-F1: 0.06–0.16) due to label ambiguity, severe class imbalance, and weak visual–semantic correspondence for probabilistically defined categories. Label merging improves accuracy but not generalization. Expert guidance (EG) provides limited benefit over Rule-Based approaches (RB), validating scalable automation. The models faithfully inherit the structural and semantic properties of training data, making pipeline design choices directly consequential for reasoning behavior.
5. Conclusions
This study validates modality-bridging as a scalable approach for automated Chain-of-Thought construction in meteorological reasoning, addressing the challenge of generating training supervision without expensive expert annotation in severe weather forecasting. We adapt a three-stage pipeline to systematically transform meteorological images into textual reasoning chains and evaluate it on the WeatherQA benchmark across spatial reasoning and semantic classification tasks. The approach proves effective for visually grounded spatial reasoning, achieving near-expert performance with reduced annotation costs. Reduced-image configurations often outperform dense multi-parameter inputs, demonstrating that visual relevance matters more than visual quantity. However, fundamental limitations emerge in semantic classification tasks involving abstract probabilistic judgments, label ambiguity, and severe class imbalance. These challenges reveal the boundaries of current modality-bridging approaches: success depends critically on whether reasoning aligns with observable visual patterns versus requiring integration of distributed cues and domain-specific uncertainty reasoning.
This work advances meteorological machine learning by demonstrating that automated reasoning chain construction can reduce reliance on expert annotation while maintaining competitive performance for visually grounded tasks. The systematic evaluation across multiple image configurations and task types provides empirical foundations for future research in cross-modal scientific reasoning, highlighting both the practical viability and inherent limitations of modality-bridging in specialized domains.
6. Future Work
Future work will focus on addressing current limitations and extending the modality-bridging framework along three complementary directions: technical enhancement, methodological validation, and task-specific optimization.
We will enhance cross-image context modeling to better align multi-view radar and satellite cues across heterogeneous meteorological fields. The current results indicate that 20-parameter inputs do not outperform focused subsets, suggesting that models struggle to filter relevant information from dense visual contexts. Future work should develop attention mechanisms or learned relevance scoring that prioritize task-relevant parameters while suppressing redundant or weakly predictive fields.
Building on these architectural improvements, we will incorporate self-verification mechanisms (e.g., self-reflection) to stabilize reasoning chains and reduce contradictions or hallucinations under dense meteorological signals. While the current study does not systematically evaluate CoT logical consistency—a limitation noted in Section 5—preliminary observations suggest that multi-step verification could improve chain coherence. This addresses the need for quantitative consistency assessment raised during the review and represents a natural extension of the modality-bridging framework.
For the Areas Affected task, we will transition from closed-set multiple choice to open-set generation, paired with structured CoT consistency checks that mirror operational forecasting workflows. This evolution addresses concerns about whether reasoning chains are internally coherent and factually grounded. In parallel, we will develop complementary evaluation settings inspired by the Conditional Concern task: a clearer, hierarchical label taxonomy to remove semantic overlap (separating phenomenon type from urgency and confidence), and rebalanced data splits to mitigate long-tail skew. These improvements respond directly to the fundamental challenges identified in Section 4.3.
The current pipeline relies on specific model implementations (Qwen-VL-Max, DeepSeek-R1), and results may vary with alternative architectures. While this study focuses on validating the modality-bridging paradigm rather than optimizing specific models, future work should systematically evaluate performance across multiple foundation models to identify which findings represent robust pipeline behaviors versus model-specific artifacts. This investigation will clarify the extent to which our conclusions generalize and guide practitioners in selecting appropriate models for meteorological reasoning applications.
These directions collectively aim to evolve modality-bridging from a validated proof-of-concept into a robust, operationally viable framework while addressing the methodological questions and limitations identified through empirical evaluation and peer review.
Author Contributions
Conceptualization, J.G.; methodology, H.C.; software, H.C.; validation, J.P. and T.W.; formal analysis, T.W.; investigation, H.C.; resources, T.W.; data curation, X.W.; writing—original draft preparation, H.C.; writing—review and editing, J.G., J.P. and T.W.; visualization, J.P.; supervision, J.G.; project administration, J.G. and X.W.; funding acquisition, X.W. All authors have read and agreed to the published version of the manuscript.
Funding
This work is supported by Sichuan Science and Technology Program No. 2024NSFTD0043.
Institutional Review Board Statement
Not applicable.
Informed Consent Statement
Not applicable.
Data Availability Statement
The data presented in this study are openly available in https://huggingface.co/datasets/SparkingStar/WeatherQA-CoT (accessed on 26 August 2025).
Conflicts of Interest
The authors declare no conflicts of interest.
Appendix A. Prompt Templates for Multimodal Chain-of-Thought Construction
This appendix presents all prompting strategies used to generate structured meteorological Chain-of-Thought (CoT) reasoning. We design a three-stage prompting framework applied to two input types:
- Full-parameter maps (EG and RB datasets), with 20 mesoscale weather fields;
- Radar-based reflectivity image (single or multiple), simulating forecaster analysis of radar alone.
Appendix A.1. System Prompts
We define two distinct System Prompts depending on the reasoning stage:
- System Prompt for Pseudo Stage (Used in both RB/EG Pseudo)You are a professional meteorologist with domain expertise in mesoscale weather forecasting. Your role is to simulate expert-level reasoning based on visual interpretation of 20 mesoscale weather parameter maps. These maps include key atmospheric ingredients such as CAPE, lapse rates, wind shear, helicity, and surface observations that forecasters use to assess severe weather potential.You must:
- –
- Ground all reasoning in visually interpretable meteorological evidence.
- –
- Avoid speculative content or assumptions beyond what the maps (and expert summaries, if available) provide.
- –
- Emulate the observational and analytical style of a trained forecaster.
- System Prompt for Detail Stage (Used in RB/EG Detail)You are a professional meteorologist with expertise in mesoscale weather analysis.Your task is to refine preliminary Chain-of-Thought (CoT) reasoning written by a prior assistant, and produce an expert-level explanation of severe weather potential based on mesoscale weather parameter maps.You should:
- –
- Interpret key meteorological ingredients—such as CAPE, CIN, lapse rates, wind shear, helicity, and radar reflectivity.
- –
- Explain how these parameters interact to support or inhibit severe weather development.
- –
- Preserve the original CoT’s intent while improving its specificity, logical structure, and scientific accuracy.
Appendix A.2. RB Dataset Prompt Templates
- RB-Pseudo PromptA human meteorologist has identified the following region(s) as potentially affected by severe weather:
- –
- Affected Area(s): [List of Affected Regions]
- –
- Concerning: [Conditional Concern Category]
Your task: You are provided with 20 mesoscale weather parameter maps that represent key environmental conditions. Carefully analyze the weather conditions near the affected region(s) and simulate the reasoning process a professional forecaster might go through to assess the potential for severe weather development. - Output Instructions
- –
- Use natural English—avoid overly rigid structure or bullet points.
- –
- Base all reasoning strictly on observable features from the maps.
- –
- Wrap your reasoning in a <CoT>...</CoT> block.
- –
- Do not repeat the affected area(s) or Concerning category in your output.
- RB-Detail PromptYou are given:
- –
- Affected Area(s): [List of Affected Regions]
- –
- Concerning: [Conditional Concern Category]
- –
- First-pass CoT: [RB Pseudo-CoT]
Your task: Re-analyze the 20 parameter maps and generate an improved version of the reasoning.Focus on:- –
- Replacing vague phrases with specific meteorological observations (e.g., CAPE values, shear orientation).
- –
- Strengthening the links between weather patterns and severe weather risks.
- –
- Improving logical coherence and scientific rigor.
Appendix A.3. Radar-Based Prompt Templates
You are given a radar-based forecasting task with the following information:
- Affected Area(s): [List of Affected Regions]
- Concerning: [Conditional Concern Category]
- Initial CoT: [Single Image Pseudo-CoT]
- Radar Description: [Structured radar description]
Your task: As a meteorologist, revise and refine the reasoning based on the above radar input and initial CoT. Your goal is to logically explain how the observed radar features support the given forecast outcome—without directly copying the answer.
Focus on:
- What radar patterns are present and what they suggest (e.g., bowing line → damaging winds);
- How reflectivity intensity, shape, and spatial distribution relate to mesoscale dynamics;
- The step-by-step logic that links visual evidence to the correct Area and Concern.
Respond in the tone of a forecaster talking through an assessment. Wrap the output in a <CoT>...</CoT> block.
Appendix B. Training Setting
This appendix details the hardware environment and fine-tuning parameters employed in this study.
Appendix B.1. Hardware and Runtime Environment
- GPU devices: 4×NVIDIA H20-3e
- GPU driver version: 535.230.02
- CUDA version: 12.2
- Operating System: Ubuntu 20.04.3 LTS
- PyTorch version: 2.6.0
- Transformers version: 4.52.0.dev0
- Distributed training: torchrun with DeepSpeed (single node, multi-GPU)
Appendix B.2. Model Settings
- Base model: Qwen2.5-VL-7B-Instruct
- Vision encoder: enabled for training
- Vision projector: fully trainable
- Language model adaptation: LoRA [41] (low-rank adaptation)
Appendix B.3. Key Fine-Tuning Hyper-Parameters
Table A1 summarizes the key hyper-parameters used for fine-tuning our model. These settings were chosen based on common practice in large-scale language model training and preliminary experiments to balance efficiency and performance.
Table A1.
Key fine-tuning hyper-parameters.
Appendix C. Mapping of Conditional Concern Labels
Appendix C.1. Sixteen Original Concern Labels
- Severe potential—Watch unlikely (5%)
- Severe potential—Watch unlikely (20%)
- Severe potential—Watch possible (40%)
- Severe potential—Watch possible (60%)
- Severe potential—Watch likely (80%)
- Severe potential—Watch likely (95%)
- Severe potential—Tornado watch likely (80%)
- Severe potential—Tornado watch likely (95%)
- Severe potential—Severe thunderstorm watch likely (80%)
- Severe potential—Severe thunderstorm watch likely (95%)
- Severe potential—Watch needed soon (95%)
- Heavy snow
- Winter mixed precipitation
- Freezing rain
- Snow squall
- Blizzard
Appendix C.2. Coarse-Grained Reformulation (11 Categories)
Table A2 summarizes an evaluation-time grouping that collapses semantically equivalent labels—which differ only by the stated “Probability of Watch Issuance”—into broader categories. Each coarse label is assigned an identifier C1–C11 for reference in the Section 4. This grouping is used for reporting and analysis only, while the original 16-label taxonomy is retained during dataset construction and training.
Table A2.
Mapping from the 16 original Concern labels to the 11 coarse-grained categories used in our analysis.
Appendix C.3. Rationale for the Merge
The WeatherQA dataset, as publicly released, already consolidates certain semantically overlapping Concern labels in practice. In line with that practice, our study adopts an 11-class grouping only at evaluation time to facilitate coarse-grained analysis and improve the readability of the results. Specifically, we treat pairs of labels that differ only in probabilistic qualifiers (e.g., 5% vs. 20% for “Watch unlikely”, 40% vs. 60% for “Watch possible”) as semantically equivalent with respect to the underlying meteorological threat. During dataset construction and training, we retain the original 16-label taxonomy to assess fine-grained recognition, and in reporting, we present metrics under both the 16-class and 11-class schemes; the evaluation-time consolidation reduces class sparsity and de-emphasizes minor probabilistic gradations without altering the underlying semantics.
References
- Chen, L.; Han, B.; Wang, X.; Zhao, J.; Yang, W.; Yang, Z. Machine learning methods in weather and climate applications: A survey. Appl. Sci. 2023, 13, 12019. [Google Scholar] [CrossRef] [Scilit]
- Nardi, E.; Cohen, O.; Pinhasi, Y.; Haridim, M.; Gavan, J. Weather Forecasting Satellites—Past, Present, & Future. Information 2025, 16, 677. [Google Scholar] [CrossRef] [Scilit]
- Wei, J.; Wang, X.; Schuurmans, D.; Bosma, M.; Ichter, B.; Xia, F.; Chi, E.H.; Le, Q.V.; Zhou, D. Chain-of-Thought Prompting Elicits Reasoning in Large Language Models. In Proceedings of the Advances in Neural Information Processing Systems (NeurIPS), New Orleans, LA, USA, 28 November–9 December 2022. [Google Scholar]
- Jaech, A.; Kalai, A.; Lerer, A.; Richardson, A.; El-Kishky, A.; Low, A.; Helyar, A.; Madry, A.; Beutel, A.; Carney, A.; et al. Openai o1 system card. arXiv 2024, arXiv:2412.16720. [Google Scholar] [CrossRef] [Scilit]
- Kojima, T.; Gu, S.S.; Reid, M.; Matsuo, Y.; Iwasawa, Y. Large language models are zero-shot reasoners. Adv. Neural Inf. Process. Syst. 2022, 35, 22199–22213. [Google Scholar]
- Zelikman, E.; Wu, Y.; Mu, J.; Goodman, N. Star: Bootstrapping reasoning with reasoning. Adv. Neural Inf. Process. Syst. 2022, 35, 15476–15488. [Google Scholar]
- Zhang, Z.; Zhang, A.; Li, M.; Smola, A. Automatic chain of thought prompting in large language models. arXiv 2022, arXiv:2210.03493. [Google Scholar] [CrossRef] [Scilit]
- Diao, S.; Sun, R.; Xu, Z.; Zhang, C.; Wang, H.; Zhang, Y.; Zhang, T.; Zhang, J. Active Prompting with Chain-of-Thought for Large Language Models. In Proceedings of the International Conference on Learning Representations (ICLR), Vienna, Austria, 7–11 May 2024. [Google Scholar]
- Ma, C.; Hua, Z.; Anderson-Frey, A.; Iyer, V.; Liu, X.; Qin, L. WeatherQA: Can Multimodal Language Models Reason about Severe Weather? arXiv 2024, arXiv:2406.11217. [Google Scholar] [CrossRef] [Scilit]
- Cui, H.; Gu, J.; Peng, J.; Wang, T.; Wu, X. Automated Chain-of-Thought Data Generation for Meteorological Reasoning: A Study Based on WeatherQA. In Proceedings of the 2025 International Conference on Information Management and Computing Technology (ICIMCT), Chengdu, China, 9–11 May 2025; pp. 71–76. [Google Scholar] [CrossRef] [Scilit]
- Wang, X.; Wei, J.; Schuurmans, D.; Le, Q.; Chi, E.H.; Narang, S.; Chowdhery, A.; Zhou, D. Self-Consistency Improves Chain of Thought Reasoning in Language Models. In Proceedings of the International Conference on Learning Representations (ICLR), Kigali, Rwanda, 1–5 May 2023. [Google Scholar]
- Zhou, D.; Schärli, N.; Hou, L.; Wei, J.; Scales, N.; Wang, X.; Schuurmans, D.; Cui, C.; Bousquet, O.; Le, Q.; et al. Least-to-Most Prompting Enables Complex Reasoning in Large Language Models. In Proceedings of the International Conference on Learning Representations (ICLR), Kigali, Rwanda, 1–5 May 2023. [Google Scholar]
- Yao, S.; Yu, D.; Zhao, J.; Shafran, I.; Griffiths, T.; Cao, Y.; Narasimhan, K. Tree of thoughts: Deliberate problem solving with large language models. Adv. Neural Inf. Process. Syst. 2023, 36, 11809–11822. [Google Scholar]
- Yao, S.; Zhao, J.; Yu, D.; Du, N.; Shafran, I.; Narasimhan, K.; Cao, Y. ReAct: Synergizing Reasoning and Acting in Language Models. In Proceedings of the International Conference on Learning Representations (ICLR), Kigali, Rwanda, 1–5 May 2023. [Google Scholar]
- Chen, W.; Muresanu, A.; Paster, K.; Pitis, S.; Jojic, N.; Ba, J. Program of Thoughts Prompting: Disentangling Computation from Reasoning for Numerical Reasoning Tasks. Trans. Mach. Learn. Res. (TMLR) 2023. Available online: https://openreview.net/forum?id=YfZ4ZPt8zd (accessed on 26 August 2025).
- Press, O.; Zhang, M.; Min, S.; Schmidt, L.; Smith, N.A.; Lewis, M. Measuring and Narrowing the Compositionality Gap in Language Models. In Proceedings of the Findings of EMNLP, Singapore, 6–10 December 2023. [Google Scholar]
- Yasunaga, M.; Zhang, A.; Karalus, S.; Leskovec, J.; Liang, P.; Yang, J. Large Language Models as Analogical Reasoners. arXiv 2023, arXiv:2310.01714. [Google Scholar]
- Lyu, Q.; Havaldar, S.; Stein, A.; Zhang, L.; Rao, D.; Wong, E.; Apidianaki, M.; Callison-Burch, C. Faithful Chain-of-Thought Reasoning. In Proceedings of the Proceedings of IJCNLP-AACL; Association for Computational Linguistics: Stroudsburg, PA, USA, 2023. [Google Scholar]
- Zhang, Z.; Zhang, A.; Rao, J.; Li, M.; Smola, A. Multimodal Chain-of-Thought Reasoning in Language Models. arXiv 2023, arXiv:2302.00923. [Google Scholar]
- Huang, W.; Jia, B.; Zhai, Z.; Cao, S.; Ye, Z.; Zhao, F.; Xu, Z.; Hu, Y.; Lin, S. Vision-r1: Incentivizing reasoning capability in multimodal large language models. arXiv 2025, arXiv:2503.06749. [Google Scholar] [CrossRef] [Scilit]
- Lu, P.; Mishra, S.; Xia, T.; Qiu, L.; Chang, K.W.; Zhu, S.C.; Tafjord, O.; Clark, P.; Kalyan, A. Learn to Explain: Multimodal Reasoning via Thought Chains for Science Question Answering. In Proceedings of the Advances in Neural Information Processing Systems (NeurIPS), New Orleans, LA, USA, 28 November–9 December 2022. [Google Scholar]
- Xu, G.; Jin, P.; Hao, L.; Song, Y.; Sun, L.; Yuan, L. Llava-o1: Let vision language models reason step-by-step. arXiv 2024, arXiv:2411.10440. [Google Scholar]
- Liu, H.; Li, C.; Wu, Q.; Lee, Y.J. Visual Instruction Tuning. arXiv 2023, arXiv:2304.08485. [Google Scholar] [PubMed]
- Radford, A.; Kim, J.W.; Hallacy, C.; Ramesh, A.; Goh, G.; Agarwal, S.; Sastry, G.; Askell, A.; Mishkin, P.; Clark, J.; et al. Learning Transferable Visual Models From Natural Language Supervision. In Proceedings of the International Conference on Machine Learning (ICML), Virtual, 18–24 July 2021. [Google Scholar]
- Li, F.; Zhang, R.; Zhang, H.; Zhang, Y.; Li, B.; Li, W.; Ma, Z.; Li, C. LLaVA-NeXT-Interleave: Tackling Multi-image, Video, and 3D in Large Multimodal Models. arXiv 2024, arXiv:2407.07895. [Google Scholar]
- Ravuri, S.; Lenc, K.; Willson, M.; Kangin, D.; Lam, R.; Mirowski, P.; Fitzsimons, M.; Athanassiadou, M.; Kashem, S.; Madge, S.; et al. Skilful precipitation nowcasting using deep generative models of radar. Nature 2021, 597, 672–677. [Google Scholar] [CrossRef] [Scilit]
- Küçük, Ç.; Giannakos, A.; Schneider, S.; Jann, A. Transformer-based nowcasting of radar composites from satellite images for severe weather. J. AI Earth Syst. (AIES) 2024, 3, e230048. [Google Scholar] [CrossRef] [Scilit]
- Song, G.; Li, S.; Xing, J. Lightning nowcasting with aerosol-informed machine learning and a satellite-enriched dataset. npj Clim. Atmos. Sci. 2023, 6, 126. [Google Scholar] [CrossRef] [Scilit]
- Lam, R.; Sánchez-González, Á.; Willson, M.; Wirnsberger, P.; Fortunato, M.; Alet, F.; Ravuri, S.; Ewalds, T.; Eaton-Rosen, Z.; Hu, W.; et al. Learning skillful medium-range global weather forecasting. Science 2023, 382, 1416–1421. [Google Scholar] [CrossRef] [Scilit]
- Bi, K.; Xie, L.; Zhang, H.; Chen, X.; Gu, X.; Tian, Q. Accurate medium-range global weather forecasting with 3D neural networks. Nature 2023, 619, 533–538. [Google Scholar] [CrossRef] [Scilit]
- Pathak, J.; Subramanian, S.; Harrington, P.; Raja, S.; Chattopadhyay, A.; Mardani, M.; Kurth, T.; Hall, D.; Li, Z.; Azizzadenesheli, K.; et al. FourCastNet: A Global Data-driven High-resolution Weather Model using Adaptive Fourier Neural Operators. arXiv 2022, arXiv:2202.11214. [Google Scholar]
- Brewer, M.J. Hybrid Numerical Weather Prediction. Weather. Forecast. 2025, 40, 187–206. [Google Scholar] [CrossRef] [Scilit]
- Hakim, G.J.; Masanam, S. Dynamical Tests of a Deep Learning Weather Prediction Model. J. AI Earth Syst. (AIES) 2024, 3, e230090. [Google Scholar] [CrossRef] [Scilit]
- Thulke, D.; Gao, Y.; Pelser, P.; Brune, R.; Jalota, R.; Fok, F.; Ramos, M.; van Wyk, I.; Nasir, A.; Goldstein, H.; et al. Climategpt: Towards ai synthesizing interdisciplinary research on climate change. arXiv 2024, arXiv:2401.09646. [Google Scholar] [CrossRef] [Scilit]
- Rasp, S.; Pritchard, M.; Gentine, P. WeatherBench: A Benchmark Data Set for Data-Driven Weather Forecasting. J. Adv. Model. Earth Syst. (JAMES) 2020, 12, e2020MS002203. [Google Scholar] [CrossRef] [Scilit]
- Rasp, S.; Ben Bouallegue, Z.; Dueben, P.; Bromberg, C.; Sisk, J.; Barrington, L.; Bell, A.; Sha, F. WeatherBench 2: A Benchmark for the Next Generation of Data-Driven Global Weather Models. J. Adv. Model. Earth Syst. (JAMES) 2024, 16, e2023MS004019. [Google Scholar] [CrossRef] [Scilit]
- Guo, D.; Yang, D.; Zhang, H.; Song, J.; Zhang, R.; Xu, R.; Zhu, Q.; Ma, S.; Wang, P.; Bi, X.; et al. Deepseek-r1: Incentivizing reasoning capability in llms via reinforcement learning. arXiv 2025, arXiv:2501.12948. [Google Scholar]
- Bai, S.; Chen, K.; Liu, X.; Wang, J.; Ge, W.; Song, S.; Dang, K.; Wang, P.; Wang, S.; Tang, J.; et al. Qwen2. 5-vl technical report. arXiv 2025, arXiv:2502.13923. [Google Scholar]
- Yang, Y.; He, X.; Pan, H.; Jiang, X.; Deng, Y.; Yang, X.; Lu, H.; Yin, D.; Rao, F.; Zhu, M.; et al. R1-Onevision: Advancing Generalized Multimodal Reasoning through Cross-Modal Formalization. arXiv 2025, arXiv:2503.10615. [Google Scholar]
- Hong, R.; Zhang, H.; Pang, X.; Yu, D.; Zhang, C. A Closer Look at the Self-Verification Abilities of Large Language Models in Logical Reasoning. In Proceedings of the 2024 Conference of the North American Chapter of the Association for Computational Linguistics: Human Language Technologies (Volume 1: Long Papers); Duh, K., Gomez, H., Bethard, S., Eds.; Association for Computational Linguistics: Mexico City, Mexico, 2024; pp. 900–925. [Google Scholar] [CrossRef] [Scilit]
- Hu, E.J.; Shen, Y.; Wallis, P.; Allen-Zhu, Z.; Li, Y.; Wang, S.; Wang, L.; Chen, W. Lora: Low-rank adaptation of large language models. ICLR 2022, 1, 3. [Google Scholar]

Disclaimer/Publisher’s Note: The statements, opinions and data contained in all publications are solely those of the individual author(s) and contributor(s) and not of MDPI and/or the editor(s). MDPI and/or the editor(s) disclaim responsibility for any injury to people or property resulting from any ideas, methods, instructions or products referred to in the content. |
© 2026 by the authors. Licensee MDPI, Basel, Switzerland. This article is an open access article distributed under the terms and conditions of the Creative Commons Attribution (CC BY) license.