


Abstract
Rapid urbanization and continuous population growth have made waste management a critical global challenge. In this study, we construct the Waste4 dataset and propose a lightweight waste detection framework, FLEX-YOLO, to improve detection accuracy and computational efficiency in complex environments. Specifically, an Efficient Multi-Scale Feature Fusion Network (EMBSFPN) is developed to enhance multi-scale feature representation for waste objects with varying scales. The backbone is further enhanced by incorporating MogaBlock into the C3k2 component to improve local–global feature modeling. Moreover, a Dynamic Task-Aligned Detection Head (DTADH) is introduced to strengthen the interaction between classification and localization through shared feature learning and dynamic alignment strategies. An Efficient Multi-Scale Attention (EMA) mechanism is incorporated before the detection head to suppress background interference and improve target feature discrimination. Experimental results on the Waste4 dataset demonstrate that FLEX-YOLO achieves 97.0% mean Average Precision (mAP) at an Intersection over Union (IoU) threshold of 0.50 (mAP@50) and 74.0% mAP@50–95. Compared with YOLOv11 and the Real-Time Detection Transformer (RT-DETR), FLEX-YOLO improves mAP@50 by 3.5 and 4.0 percentage points, respectively, and mAP@50–95 by 3.8 and 3.0 percentage points, respectively. Additional experiments on the Trash Detection Dataset (TDD) show that FLEX-YOLO improves mAP@50 and mAP@50–95 by 2.2 and 1.9 percentage points, respectively, compared with YOLOv11. Furthermore, deployment on Jetson Orin Nano and Android platforms demonstrates its real-time inference capability and practical applicability. The proposed framework provides an efficient approach for real-world waste detection under resource-constrained edge deployment scenarios.
1. Introduction
With the rapid acceleration of global urbanization and continuous population growth, waste management has become an increasingly critical global challenge. Global waste generation has reached approximately 2.12 billion tonnes annually [1], and it is expected to increase substantially in the coming decades [2]. The rapid expansion of urban areas and industrial activities has further increased waste production, creating significant challenges for environmental protection, resource recovery, and public health [3]. Moreover, the expansion of landfill sites consumes substantial land resources and increases the risk of secondary pollution, posing potential threats to ecological safety [4].
Waste sorting is considered an effective approach for sustainable waste management because it reduces landfill pressure and improves resource recycling efficiency [5,6]. Effective waste classification can facilitate recycling processes, reduce energy consumption, and contribute to greenhouse gas emission reduction, thereby supporting circular economy development [7,8]. However, achieving efficient waste sorting in practical environments remains challenging due to the diversity of waste categories, complex visual conditions, and the limitations of manual recognition [9].
Traditional waste treatment approaches, including composting, landfilling, and incineration, are still widely adopted in many regions [10]. Nevertheless, these methods face limitations in terms of sustainability and resource utilization. Composting is unsuitable for large-scale processing of non-degradable waste, while landfill disposal may generate greenhouse gases and cause secondary environmental pollution [11]. Although incineration can effectively reduce waste volume, it may introduce additional environmental risks [12]. Therefore, intelligent and automated waste recognition technologies are urgently required to improve sorting efficiency and promote sustainable waste management.
The rapid advancement of artificial intelligence, particularly computer vision and deep learning techniques, has provided new opportunities for intelligent waste detection. Deep learning-based methods can automatically extract discriminative features and achieve accurate object recognition, demonstrating significant potential for practical waste management applications [13]. Recent studies have explored various deep learning models for waste detection; however, existing approaches still face several challenges, including large variations in object scales, complex background interference, and limited computational resources for edge deployment [14]. Therefore, developing lightweight and efficient detection frameworks with high accuracy and real-time inference capability remains an important research direction [15,16,17].
To address these challenges, this study proposes a lightweight and efficient object detection framework, FLEX-YOLO, for accurate waste detection in complex scenarios. The main contributions of this work are summarized as follows:
- (1)
- A Waste4 dataset is constructed to provide a challenging benchmark for waste detection under diverse environmental conditions. Based on this dataset, a lightweight detection framework, FLEX-YOLO, is developed to achieve high accuracy with reduced computational complexity, enabling deployment on resource-constrained devices.
- (2)
- EMBSFPN is proposed to enhance cross-scale feature aggregation and improve the detection capability of waste objects with significant variations in size. Meanwhile, the C3k2 backbone component is redesigned with MogaBlock to strengthen local–global feature representation.
- (3)
- DTADH is developed to improve the interaction between classification and localization through shared feature learning and dynamic alignment strategies. In addition, EMA is introduced before the detection head to suppress background interference and enhance discriminative feature representation.
- (4)
- The proposed framework is deployed on Jetson Orin Nano and Android platforms to validate its real-time inference capability and practical deployment potential in edge computing scenarios.
2. Related Work
2.1. Deep Learning-Based Waste Recognition
Deep learning-based methods have been widely applied to waste recognition due to their powerful feature extraction and representation capabilities. Early studies mainly focused on waste classification using convolutional neural networks (CNNs). Chhabra et al. [18] proposed a multi-layer CNN-based classification framework and achieved 93.28% accuracy on a dataset containing 25,077 images. Ahmed et al. [19] evaluated several pre-trained CNN architectures for recyclable waste classification, where ResNet50V2 achieved an accuracy of 98.95%. Although these methods achieved promising classification performance, they mainly focused on single-object recognition and were insufficient for practical scenarios containing multiple objects, complex backgrounds, and varying object scales.
To improve feature representation capability, researchers have explored hybrid architectures and lightweight CNN models. Arayakandy et al. [20] combined Scale-Invariant Feature Transform (SIFT) features with Support Vector Machine (SVM) and CNN classifiers for waste recognition. Yaqing and Ge [21] proposed a lightweight waste classification network based on MobileNet, integrating depthwise separable convolutions and attention mechanisms to improve computational efficiency. However, classification-based approaches cannot provide accurate object localization, which limits their application in intelligent waste management systems.
2.2. Object Detection for Waste Recognition
Object detection methods have been introduced to overcome the limitations of image classification by simultaneously performing object localization and category prediction. Traditional two-stage detectors, such as Fast R-CNN and Mask R-CNN, generally achieve high localization accuracy but suffer from considerable computational overhead, making them difficult to deploy in real-time waste detection scenarios [22]. With the development of one-stage detectors, the You Only Look Once (YOLO) series has become widely adopted for real-time waste detection due to its favorable balance between accuracy and efficiency. Dipo et al. [23] applied YOLO-based models for real-time waste detection and demonstrated their effectiveness in practical environments. Abo-Zahhad et al. [24] developed an intelligent garbage monitoring system using YOLOv5 and YOLOv8, achieving reliable detection performance for waste monitoring and collection applications.
More recently, Wang et al. [25] proposed YOLO-WasNet for intelligent waste sorting by combining a lightweight backbone, attention-enhanced feature extraction, and an efficient detection architecture. The model was further integrated with a robotic gripping system and evaluated on a Raspberry Pi platform, demonstrating the practical potential of lightweight detectors for resource-constrained waste-sorting applications.
These studies demonstrate the effectiveness of one-stage detectors in improving the accuracy and efficiency of waste recognition. Nevertheless, their improvements are often designed for specific datasets or application scenarios, while practical waste detection still involves substantial variations in object scale, cluttered backgrounds, occlusion, and strict computational constraints. Therefore, simultaneously maintaining reliable feature representation and efficient inference remains challenging for real-world edge deployment.
2.3. Lightweight Detection Models
To address the increasing demand for real-time and edge-based applications, lightweight detection networks have become an important research direction [26]. Recent studies have focused on reducing model parameters and computational complexity while maintaining detection accuracy. Zheng et al. [27] proposed Focus-RCNet, which integrates lightweight convolution operations and knowledge distillation strategies to achieve efficient recyclable waste classification. Li et al. [28] improved YOLOv8 using lightweight convolutional modules, achieving a better balance between detection accuracy and computational efficiency. Cai et al. [29] proposed YOLOG, a lightweight garbage detection framework that achieves competitive performance with only 6.05 giga floating-point operations (GFLOPs).
More recent studies have continued to improve lightweight waste detectors by enhancing feature extraction, multi-scale representation, and detection efficiency. Xia et al. [30] proposed YOLO-MTG for multi-target garbage detection, achieving improved detection performance with a compact model. Sun and Zhang [31] developed DRSE-YOLO to improve the detection of small and multi-scale waste objects while reducing computational complexity. Sun et al. [32] proposed GD-YOLO for complex household waste scenes, achieving a favorable balance between detection accuracy and model complexity. These studies show that lightweight design can effectively reduce computational cost while maintaining competitive detection performance.
Despite these advances, several challenges remain in practical waste detection. Large variations in object scale require effective cross-scale feature interaction, while model lightweighting may weaken the representation of fine-grained details and contextual information. In addition, limited interaction between classification and localization and interference from complex backgrounds can further affect detection performance. These issues become more critical in resource-constrained deployment scenarios, where both accuracy and inference efficiency must be considered. Motivated by these limitations, FLEX-YOLO is designed to improve multi-scale feature fusion, feature representation, task interaction, and background suppression while maintaining a lightweight structure suitable for edge deployment.
3. Materials and Methods
3.1. Overall Framework
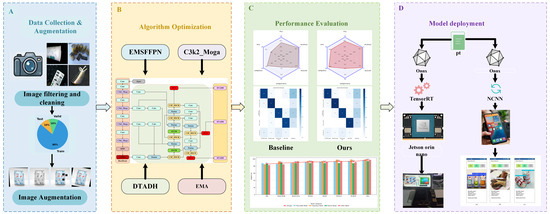
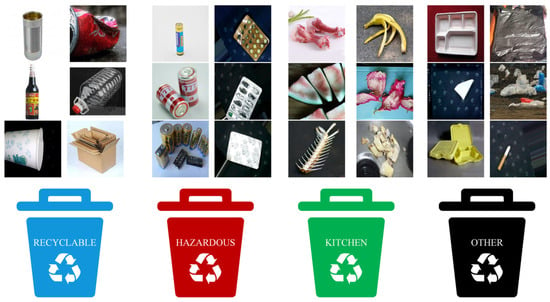
The overall framework of the proposed waste detection system is illustrated in Figure 1. The framework consists of four stages: dataset construction and augmentation, model enhancement, performance evaluation, and edge deployment. First, a diverse waste dataset is constructed through image collection, preprocessing, and augmentation strategies to improve sample diversity and model robustness. Subsequently, lightweight architectural improvements are introduced to enhance feature representation and detection efficiency while reducing computational complexity. The effectiveness of the proposed approach is evaluated through comprehensive experiments and comparisons with representative object detection methods. Finally, the optimized model is deployed on edge computing platforms and mobile devices to validate its real-time inference capability and practical applicability in real-world waste detection scenarios.
Figure 1.
Overall framework of the proposed waste detection system. (A) Data collection and augmentation; (B) algorithm optimization; (C) performance evaluation; (D) model deployment.
3.2. Dataset and Preprocessing
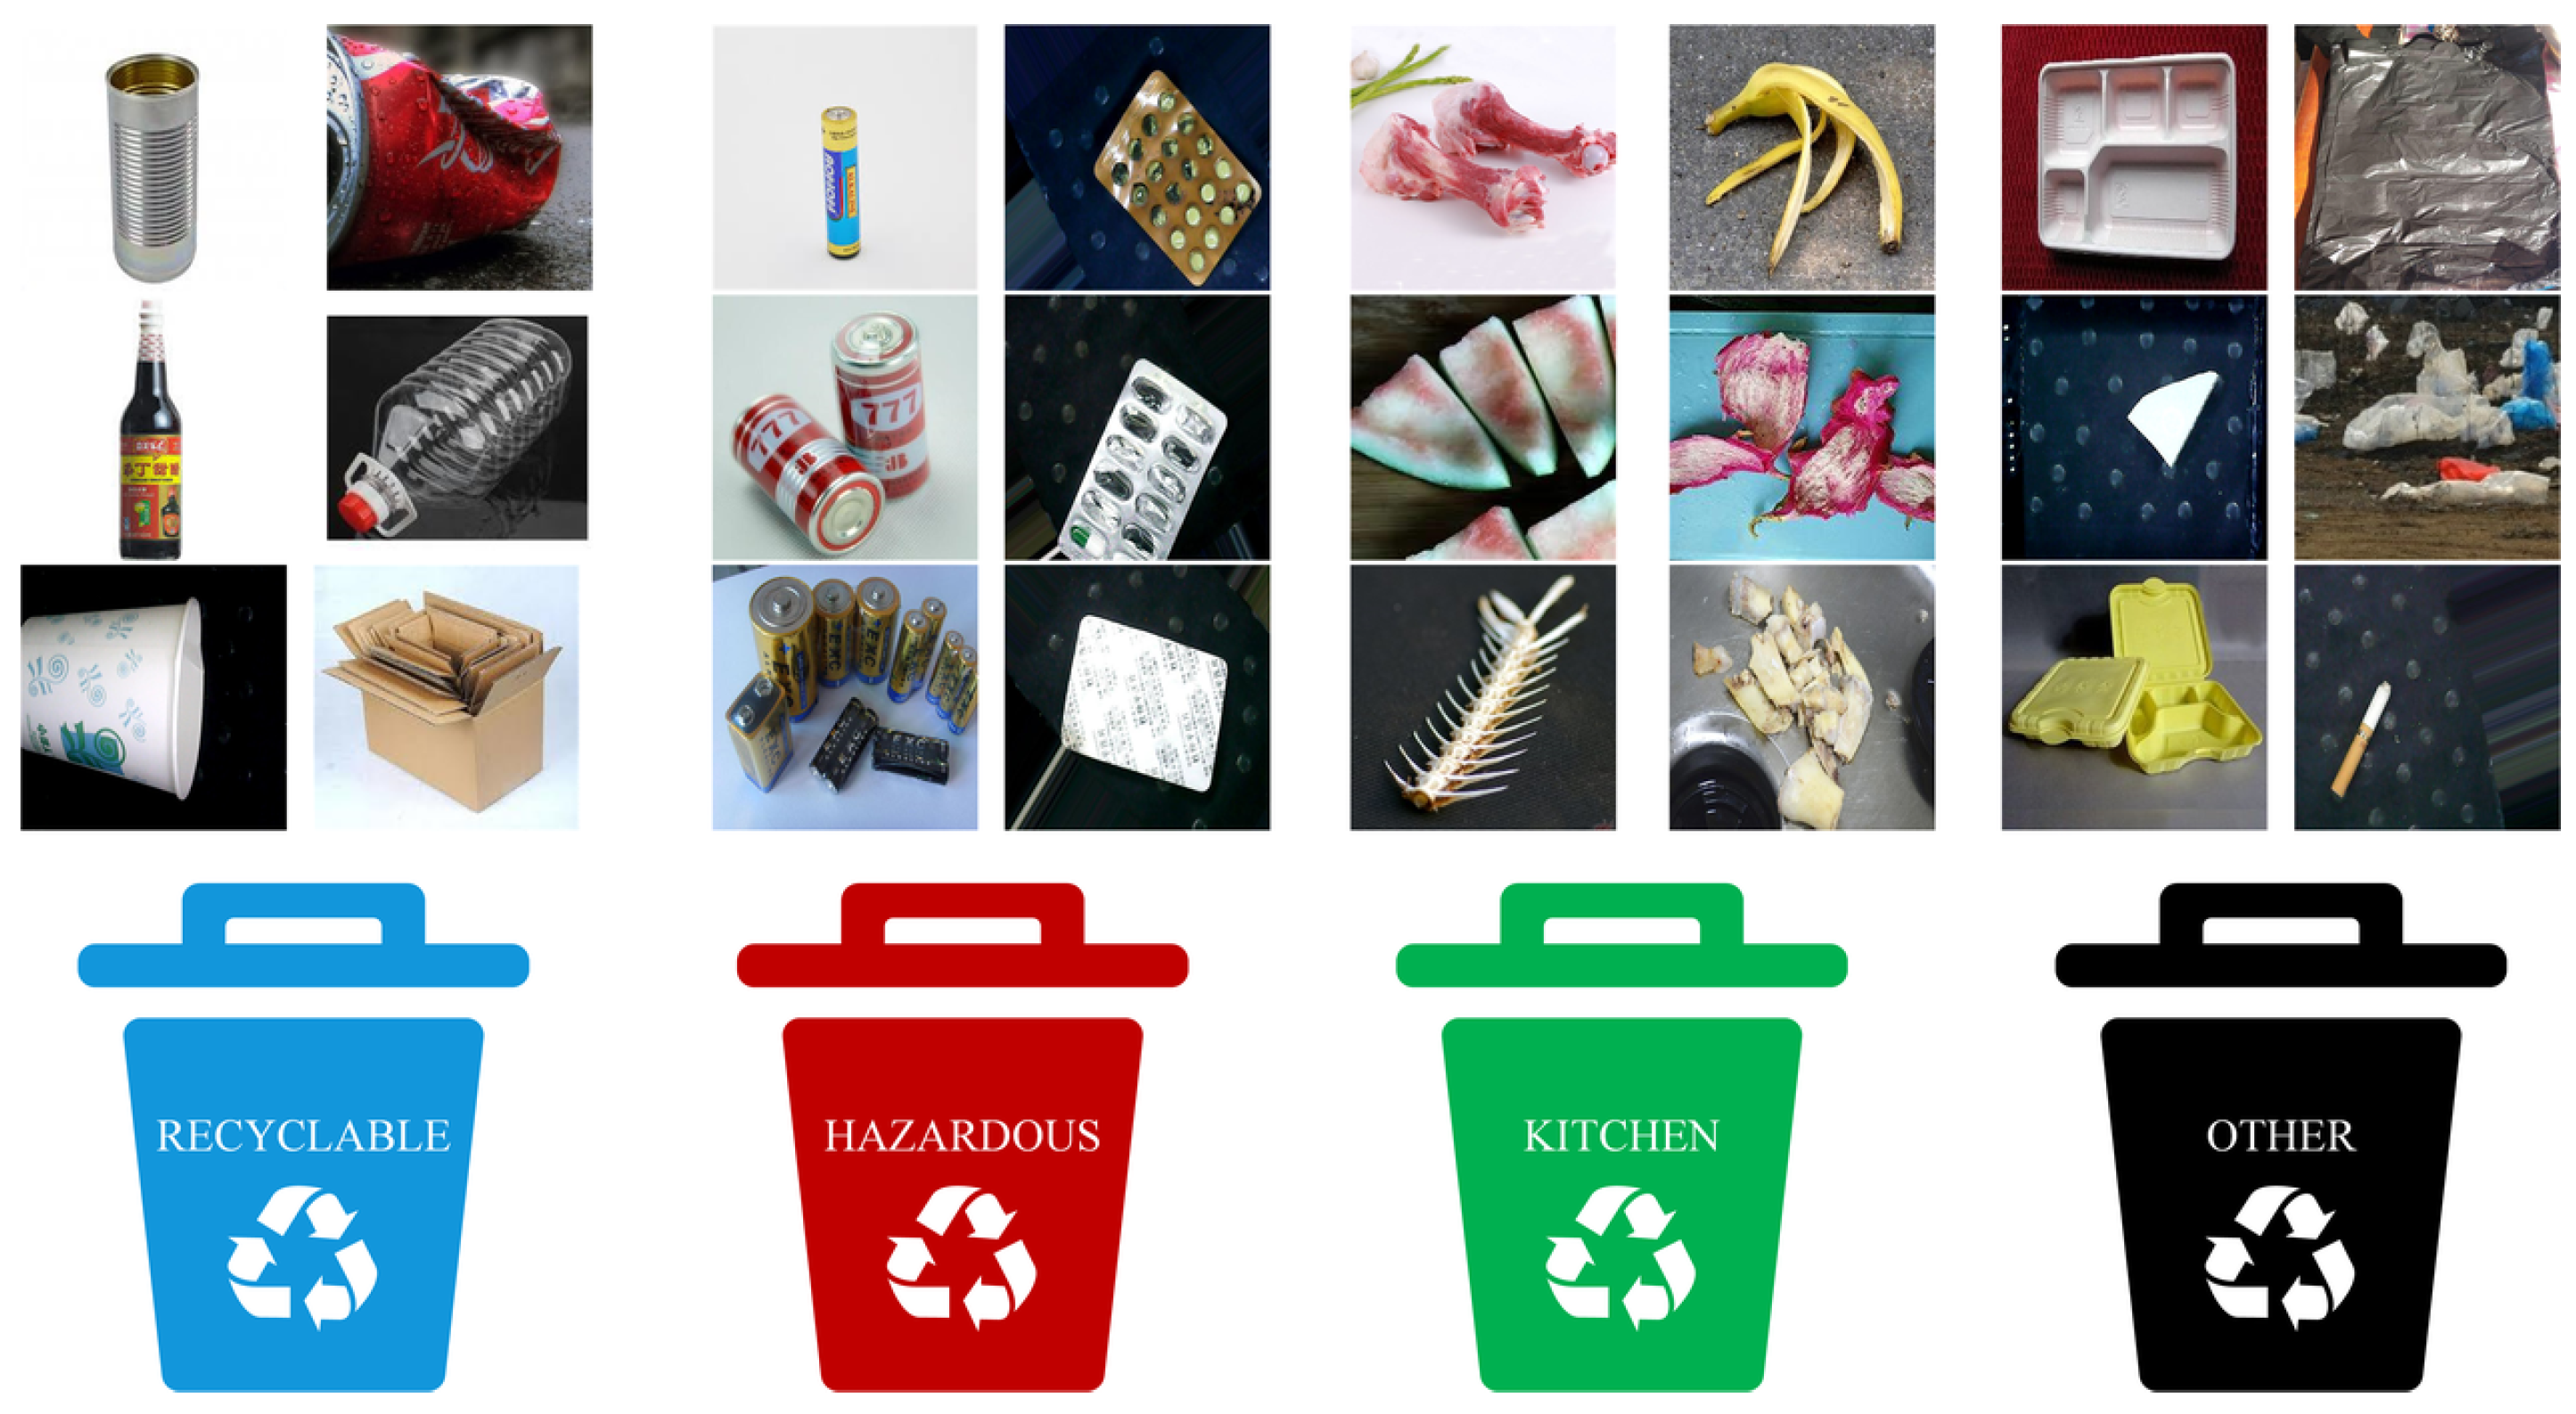
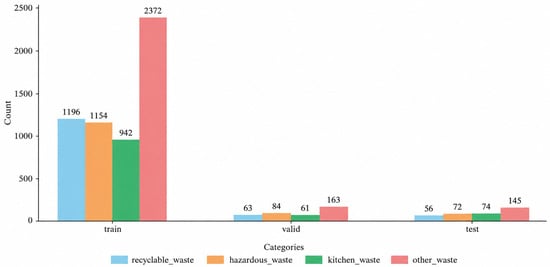
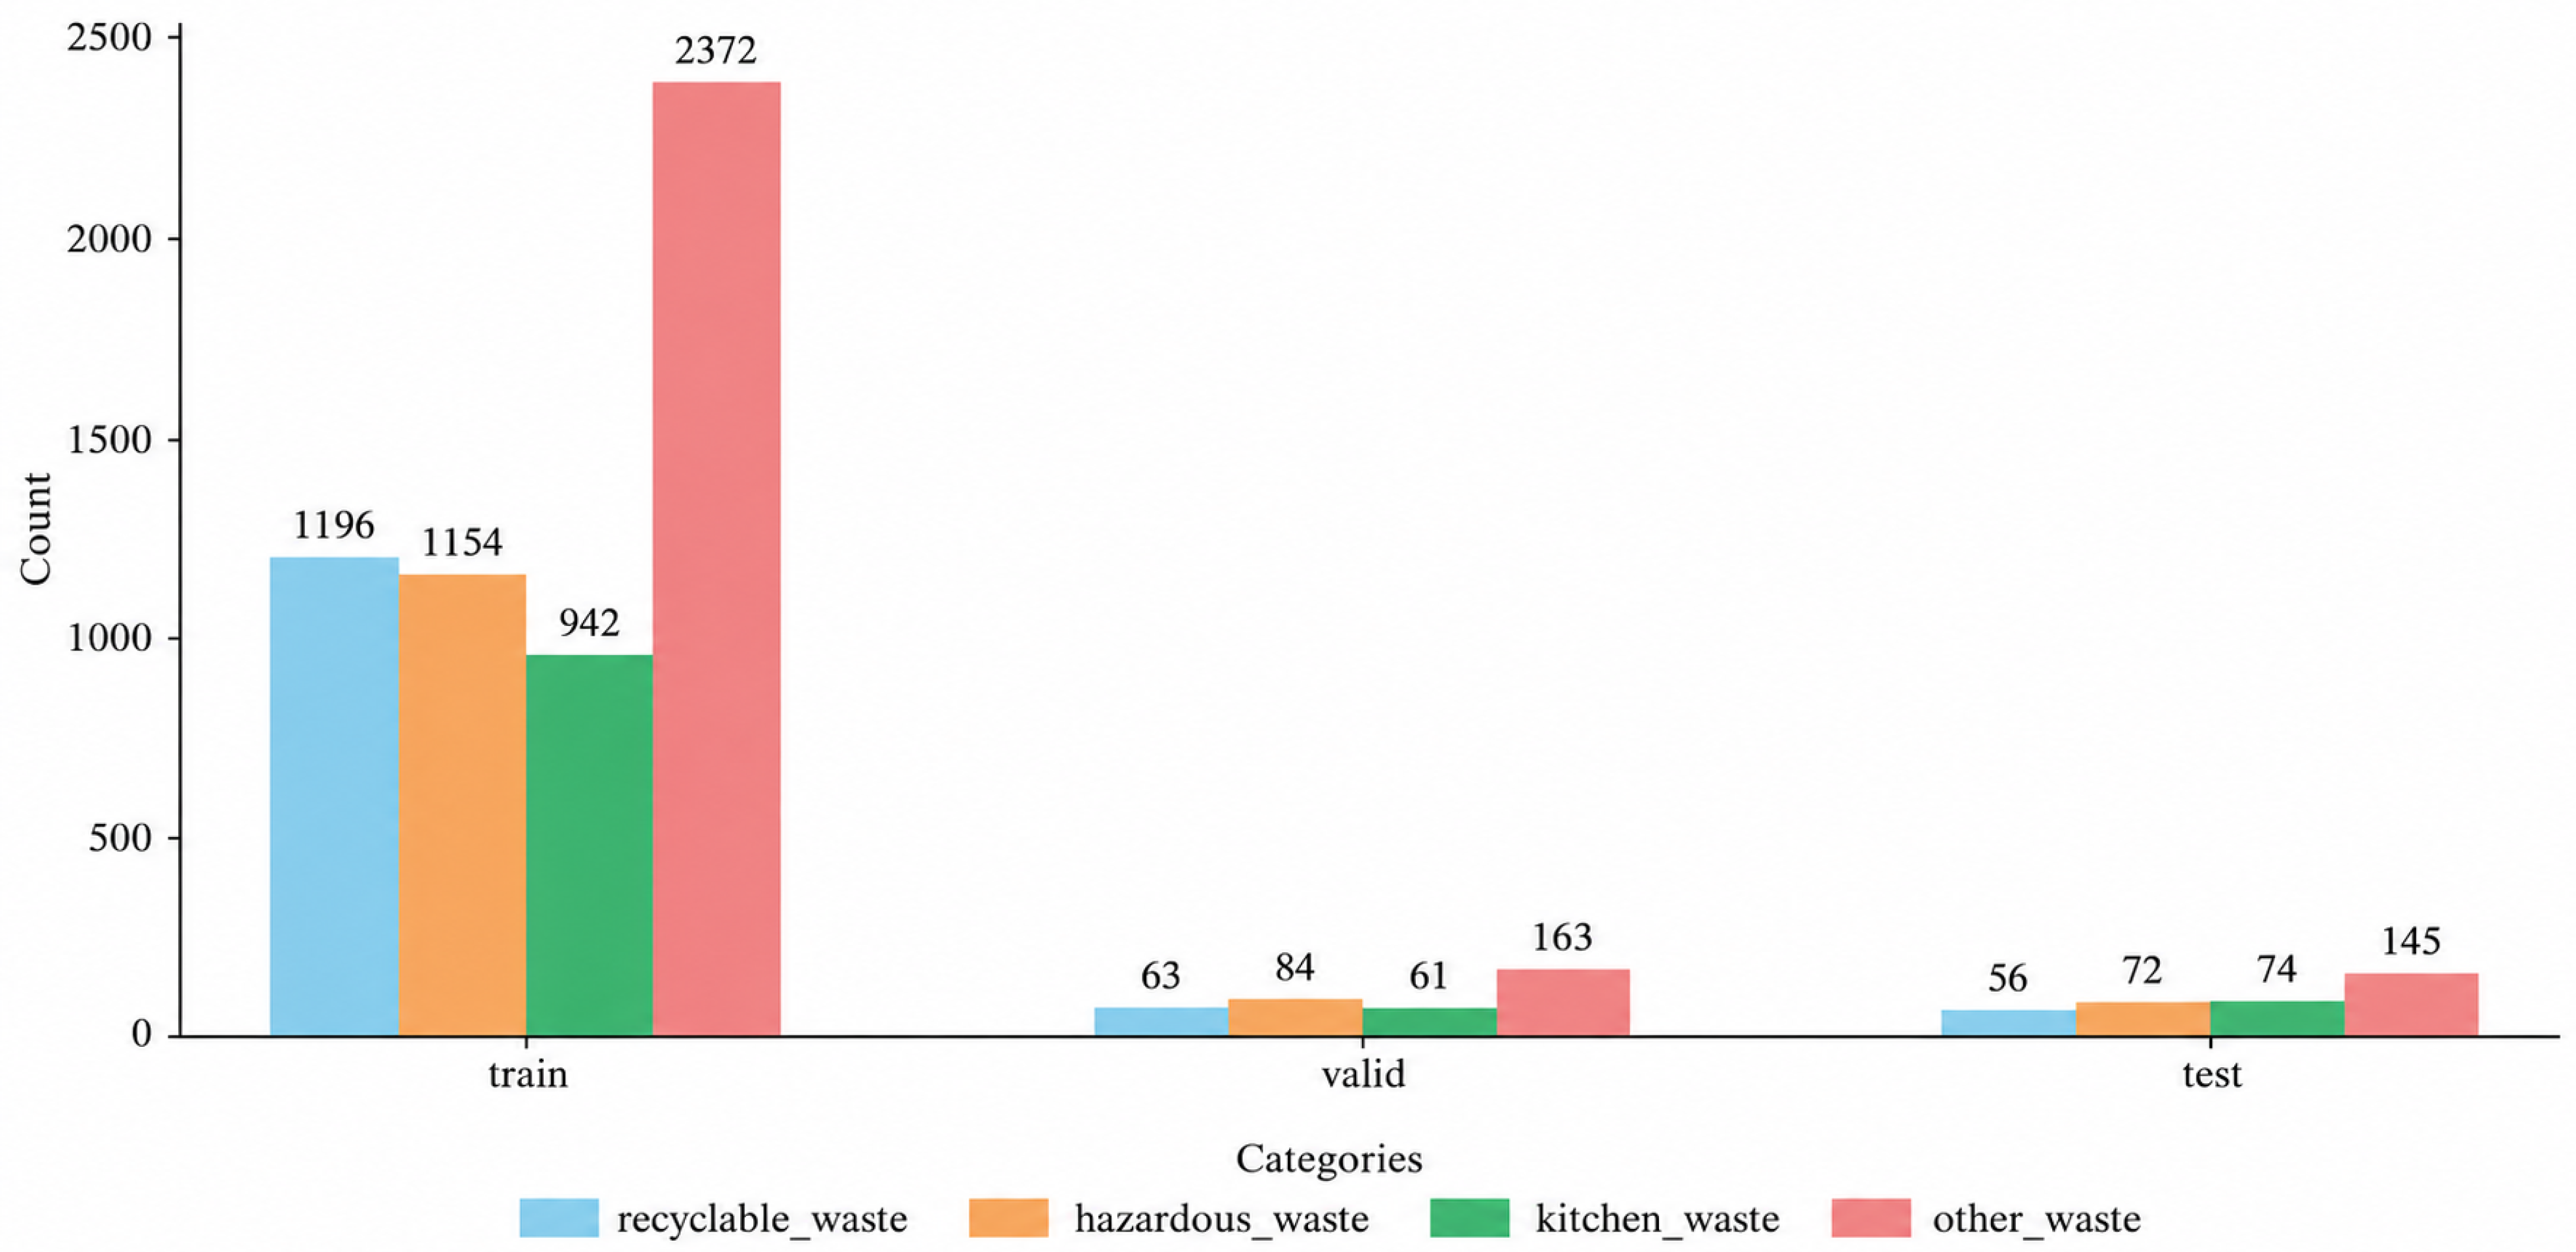
The Waste4 dataset was constructed by integrating field-collected images with publicly available waste images to provide a dataset for intelligent waste detection evaluation. The field images were collected by the research team at Wuhan Qingchuan University in 2025, while additional publicly accessible images were obtained through web crawling. The collected images were manually screened for image quality and category consistency, and the retained images were manually annotated with bounding boxes using LabelImg. It contains 2700 images from four waste categories, including recyclable waste, hazardous waste, kitchen waste, and other waste. These categories were selected to represent the major waste types commonly encountered in campus and municipal waste-sorting scenarios while covering substantial variations in appearance, material, shape, and scale. Since a single image may contain objects from more than one category, the category distribution is reported based on annotated object instances rather than assigning each image to a single category.
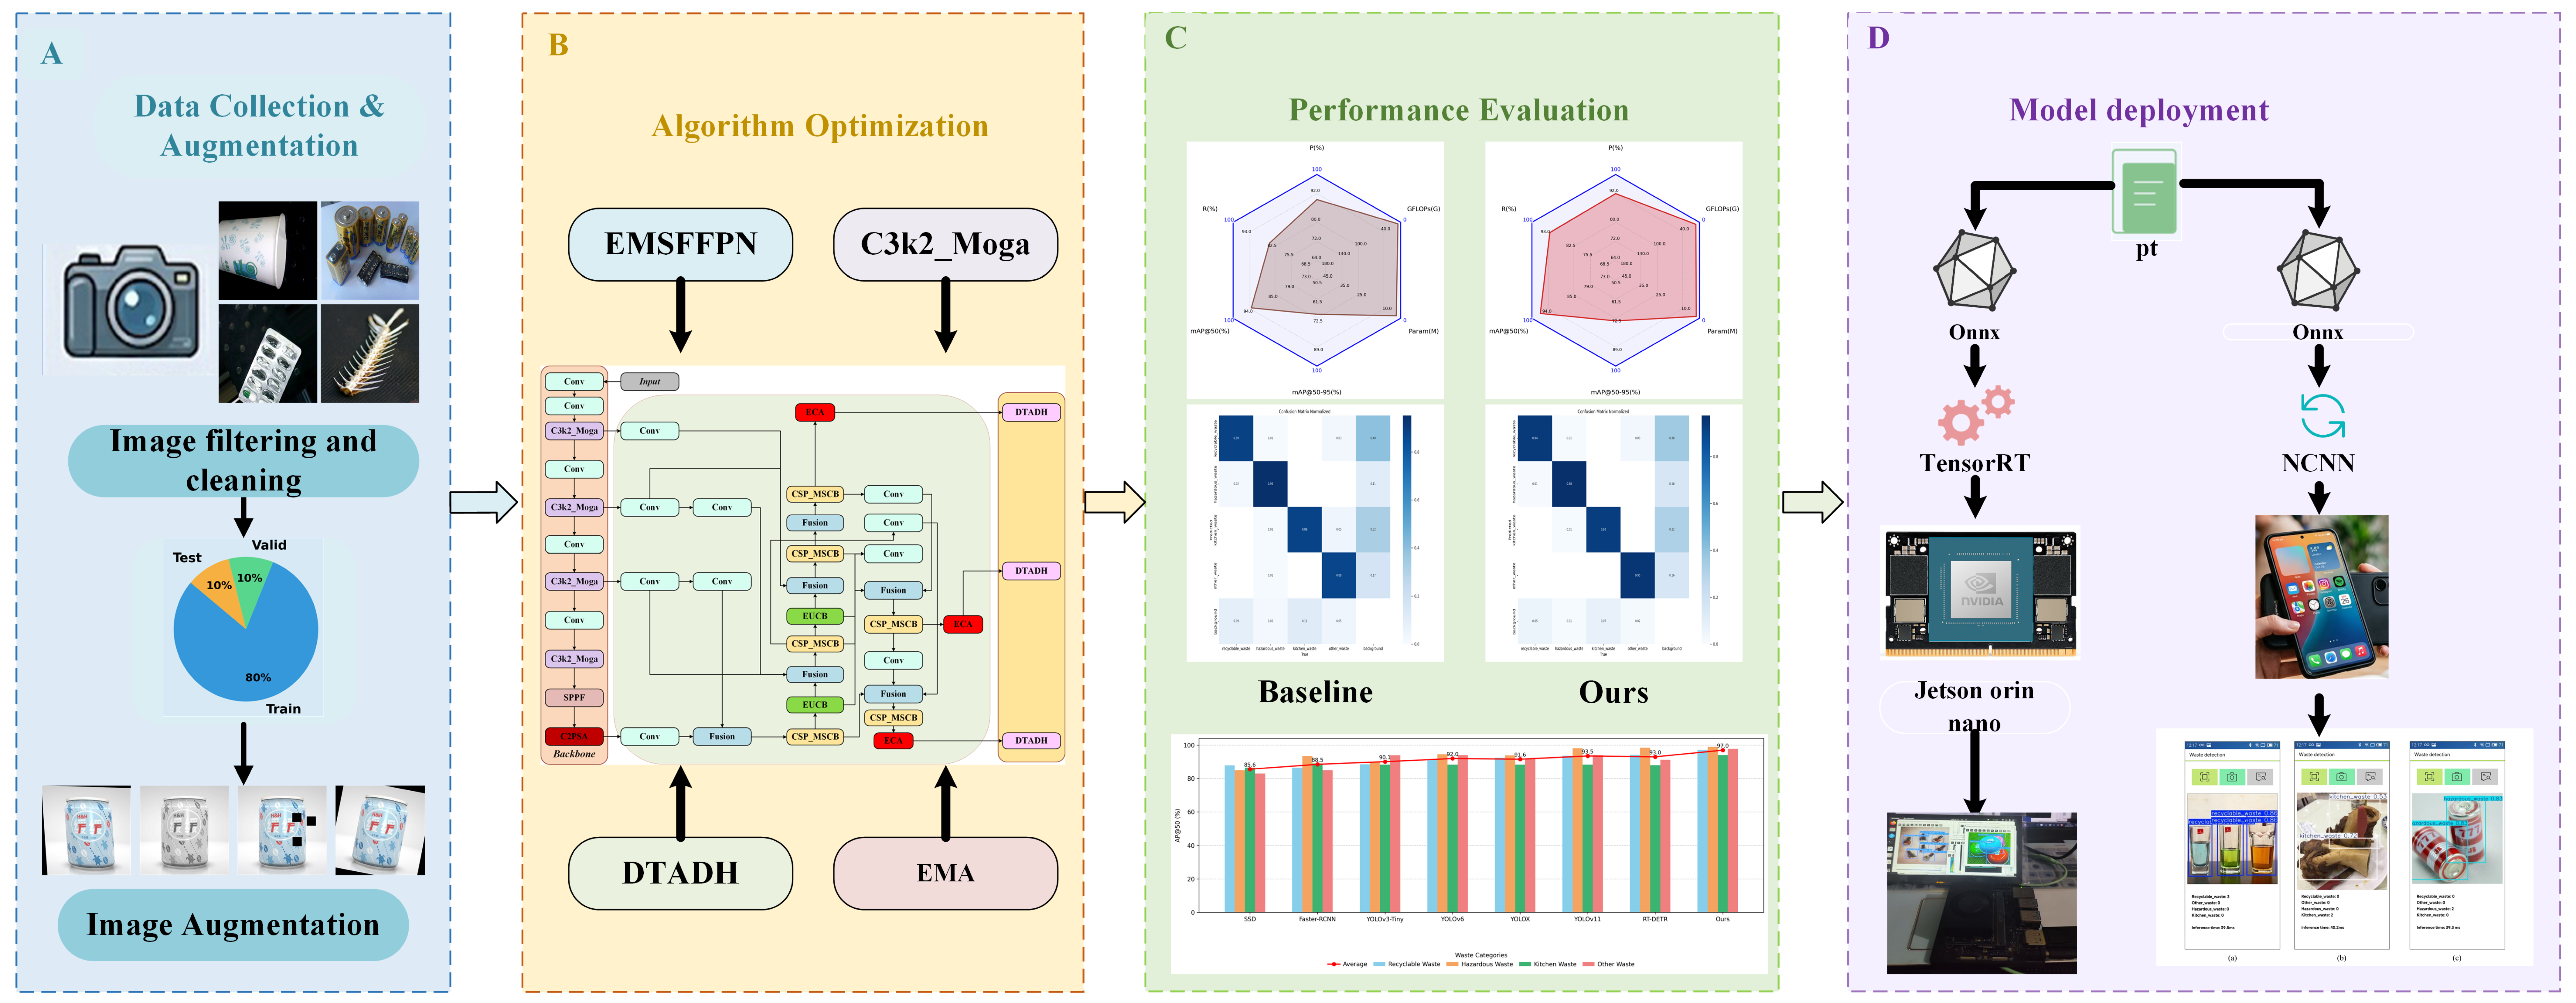
The collected images cover diverse conditions, such as illumination variations, object scale differences, viewpoint changes, and complex backgrounds, providing a comprehensive evaluation scenario for waste detection. Representative samples from the Waste4 dataset are presented in Figure 2.
Figure 2.
Representative samples from the Waste4 dataset.
To improve model generalization capability, several data augmentation strategies are applied during training, including random flipping, rotation, scaling, shearing, grayscale transformation, and random occlusion. These operations simulate variations in object appearance and environmental conditions, thereby increasing sample diversity and enhancing the feature learning capability of the model. Examples of the adopted augmentation strategies are shown in Figure 3.
Figure 3.
Examples of data augmentation strategies applied to the Waste4 dataset. (a) Original image; (b) random flipping; (c) rotation; (d) scaling; (e) shearing; (f) grayscale transformation; (g) random occlusion.
After preprocessing, the dataset is randomly divided at the image level into training, validation, and testing subsets with a ratio of 8:1:1. Since Waste4 has no predefined official split, random partitioning was adopted to reduce potential subjective bias in sample selection, and the same partition was used for all compared models. The category distributions of the three subsets are illustrated in Figure 4.
Figure 4.
Distribution of waste categories in the training, validation, and testing sets.
3.3. Proposed FLEX-YOLO Network
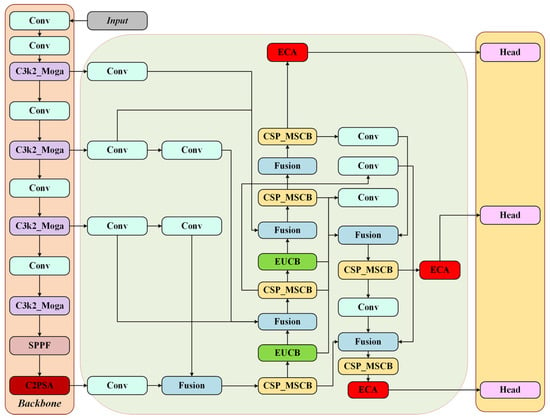
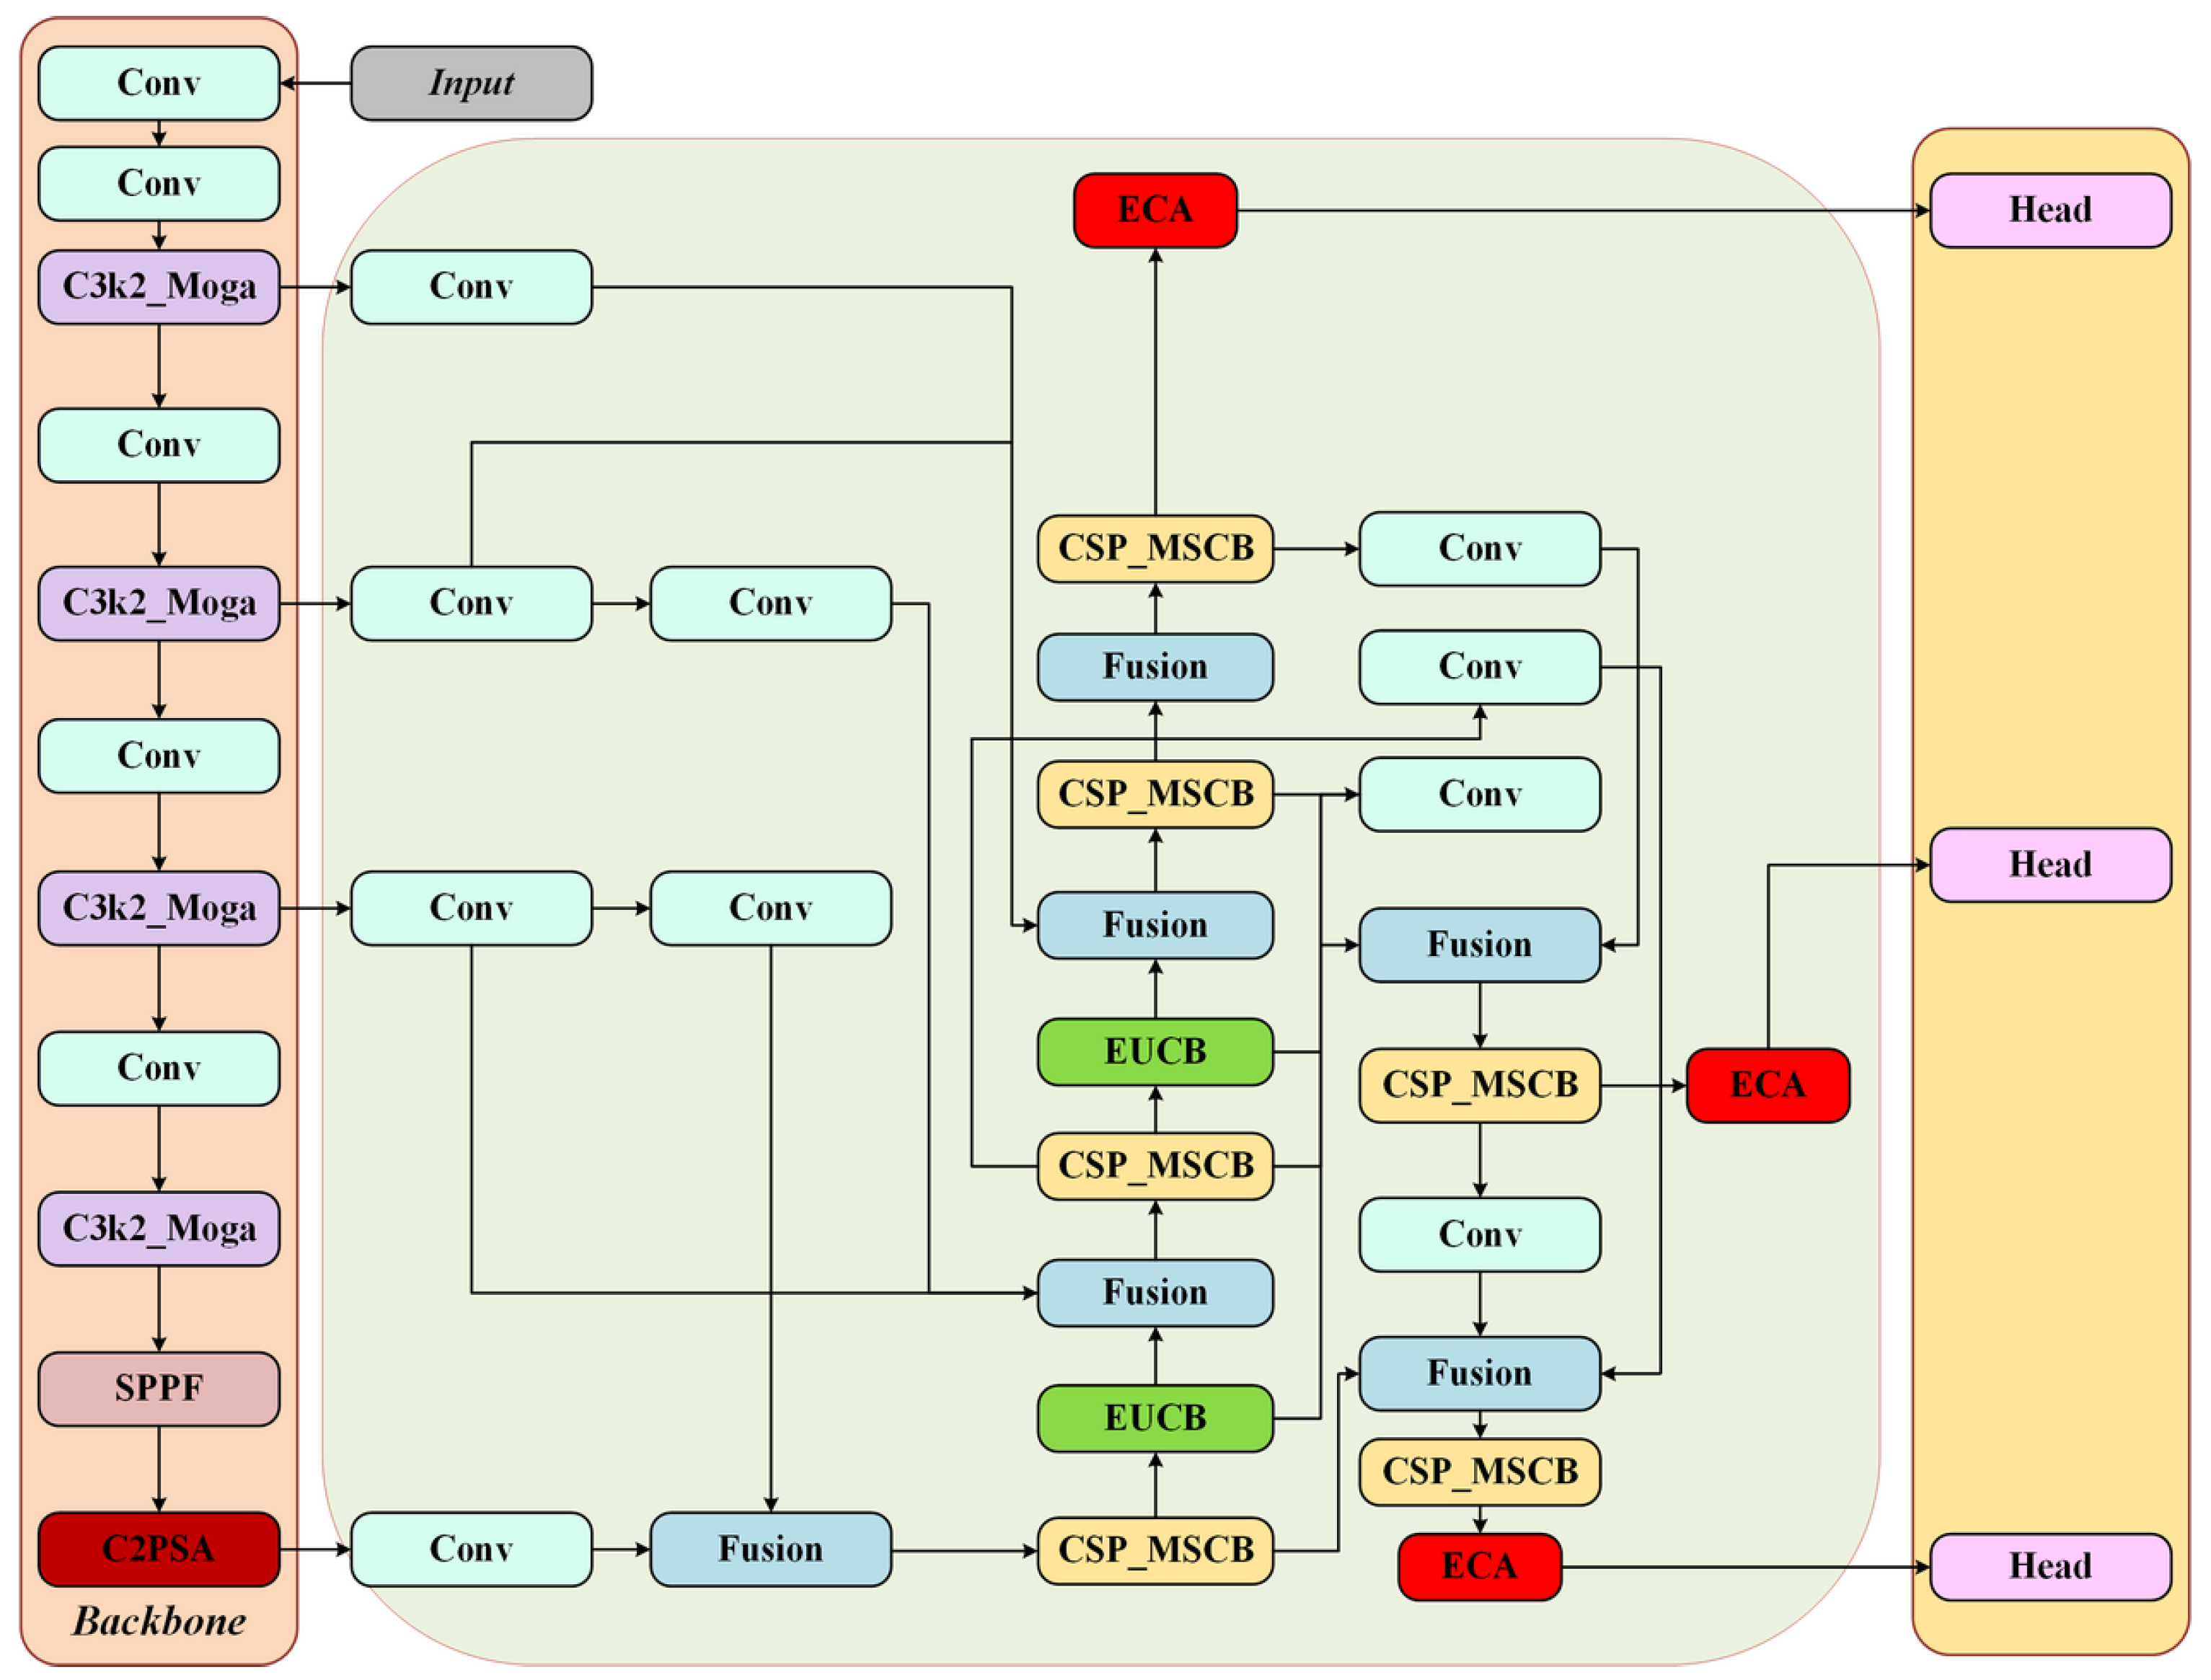
The detailed architecture of the proposed FLEX-YOLO network is illustrated in Figure 5. The proposed network incorporates lightweight structural improvements into the backbone, neck, and detection head to enhance feature representation capability while reducing computational complexity. Specifically, C3k2-MogaBlock is introduced into the backbone to improve the extraction of local details and global contextual information. EMBSFPN is designed in the neck to strengthen multi-scale feature aggregation for waste objects with different scales. Meanwhile, the fused multi-scale features are refined by EMA to suppress background interference and are subsequently fed into DTADH at the P3, P4, and P5 detection scales for category prediction and bounding-box regression, while enhancing the interaction between classification and localization through dynamic task alignment. Through the integration of these components, FLEX-YOLO achieves an effective balance between detection accuracy and computational efficiency, making it suitable for real-time deployment on resource-constrained edge devices.
Figure 5.
Architecture of the proposed FLEX-YOLO network.
3.3.1. EMBSFPN Module
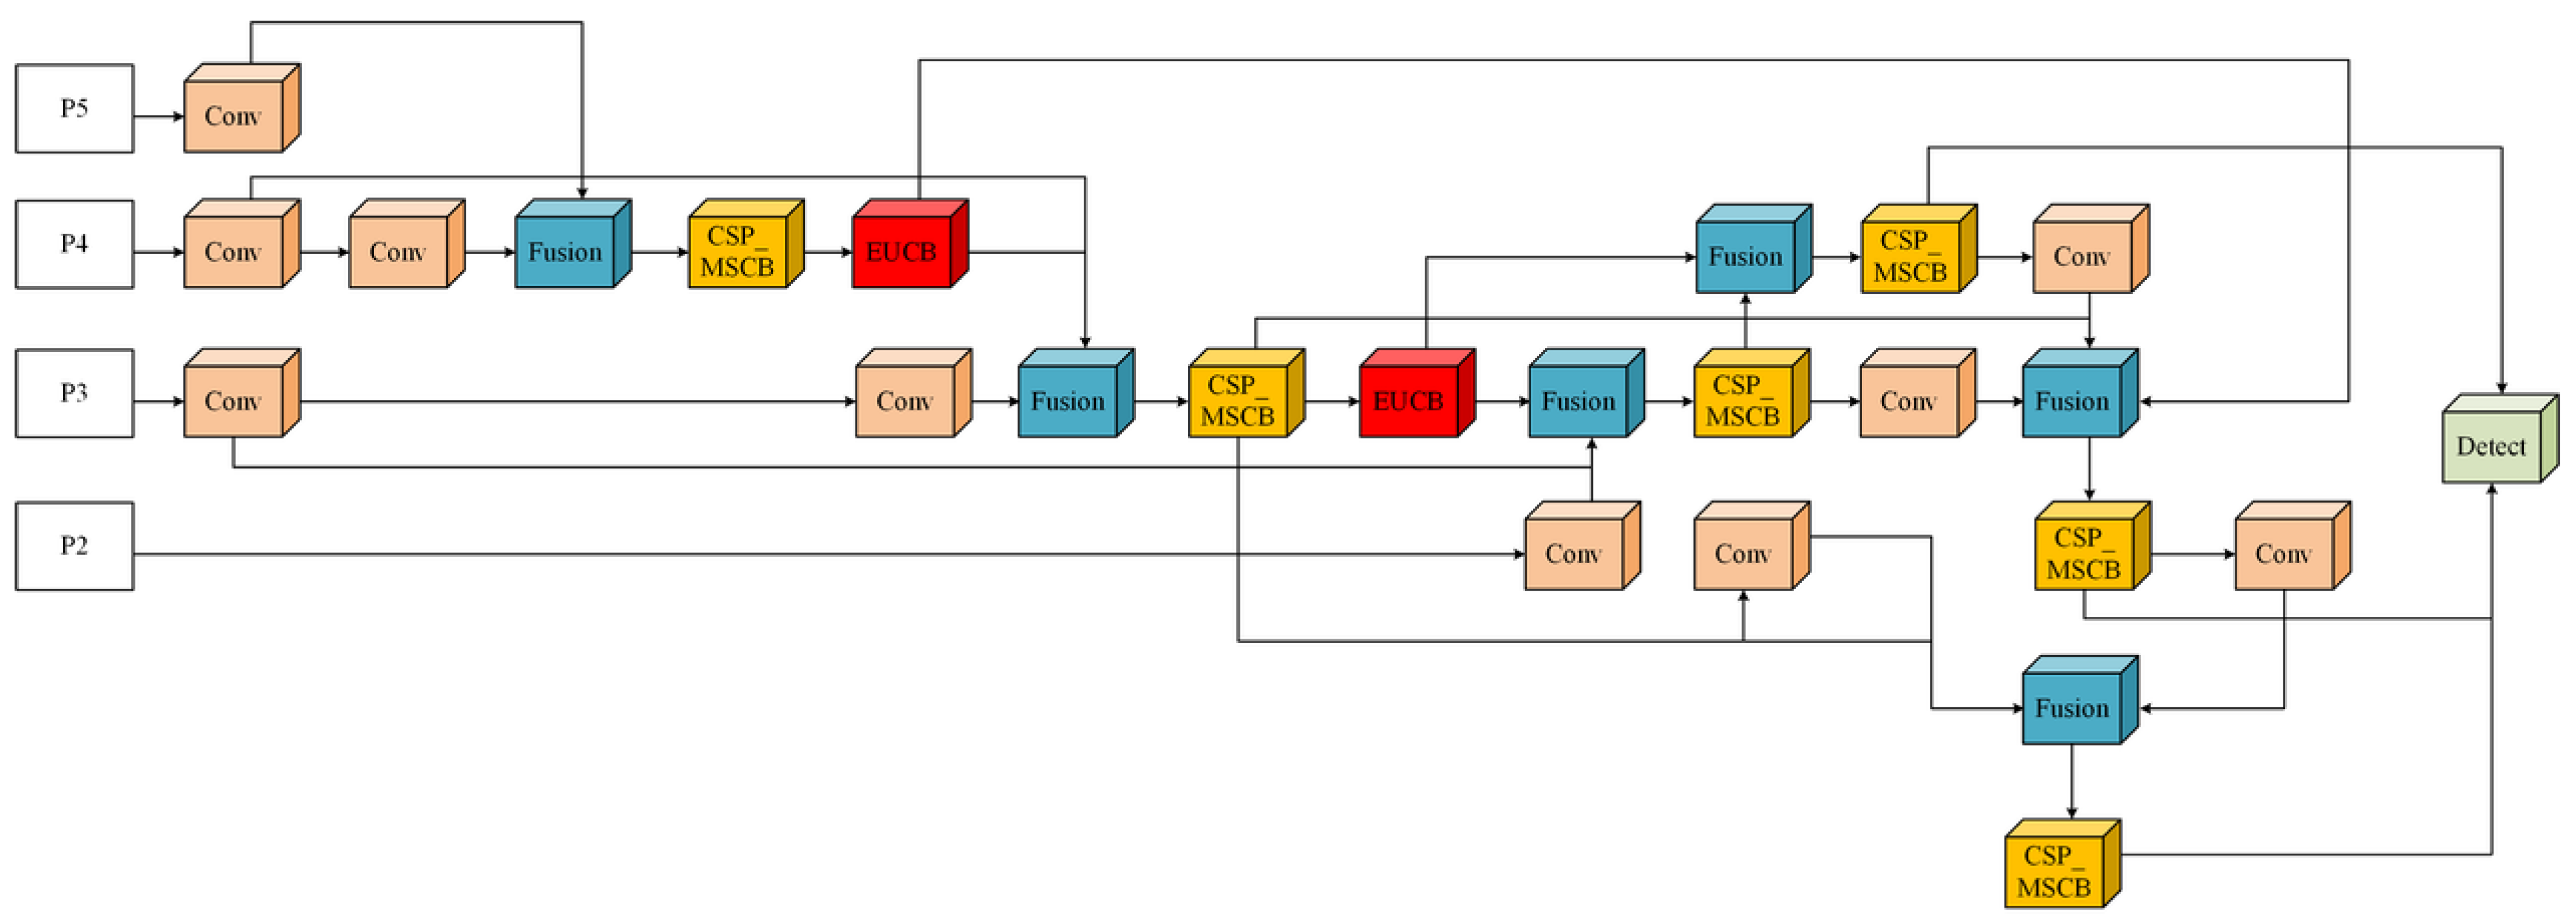
Waste objects usually exhibit large variations in scale and are often captured under complex background conditions, making effective multi-scale feature aggregation essential for accurate detection. However, conventional Path Aggregation Network–Feature Pyramid Network (PAN-FPN) structures mainly rely on adjacent-scale feature interaction, which may limit feature reuse and increase computational redundancy. To address these issues, EMBSFPN is proposed, as illustrated in Figure 6. The proposed module combines Multi-Scale Convolution Blocks (MSCB) and Efficient Up-Convolution Blocks (EUCB) to achieve enhanced feature aggregation with low computational complexity.
Figure 6.
Schematic diagram of the EMBSFPN architecture.
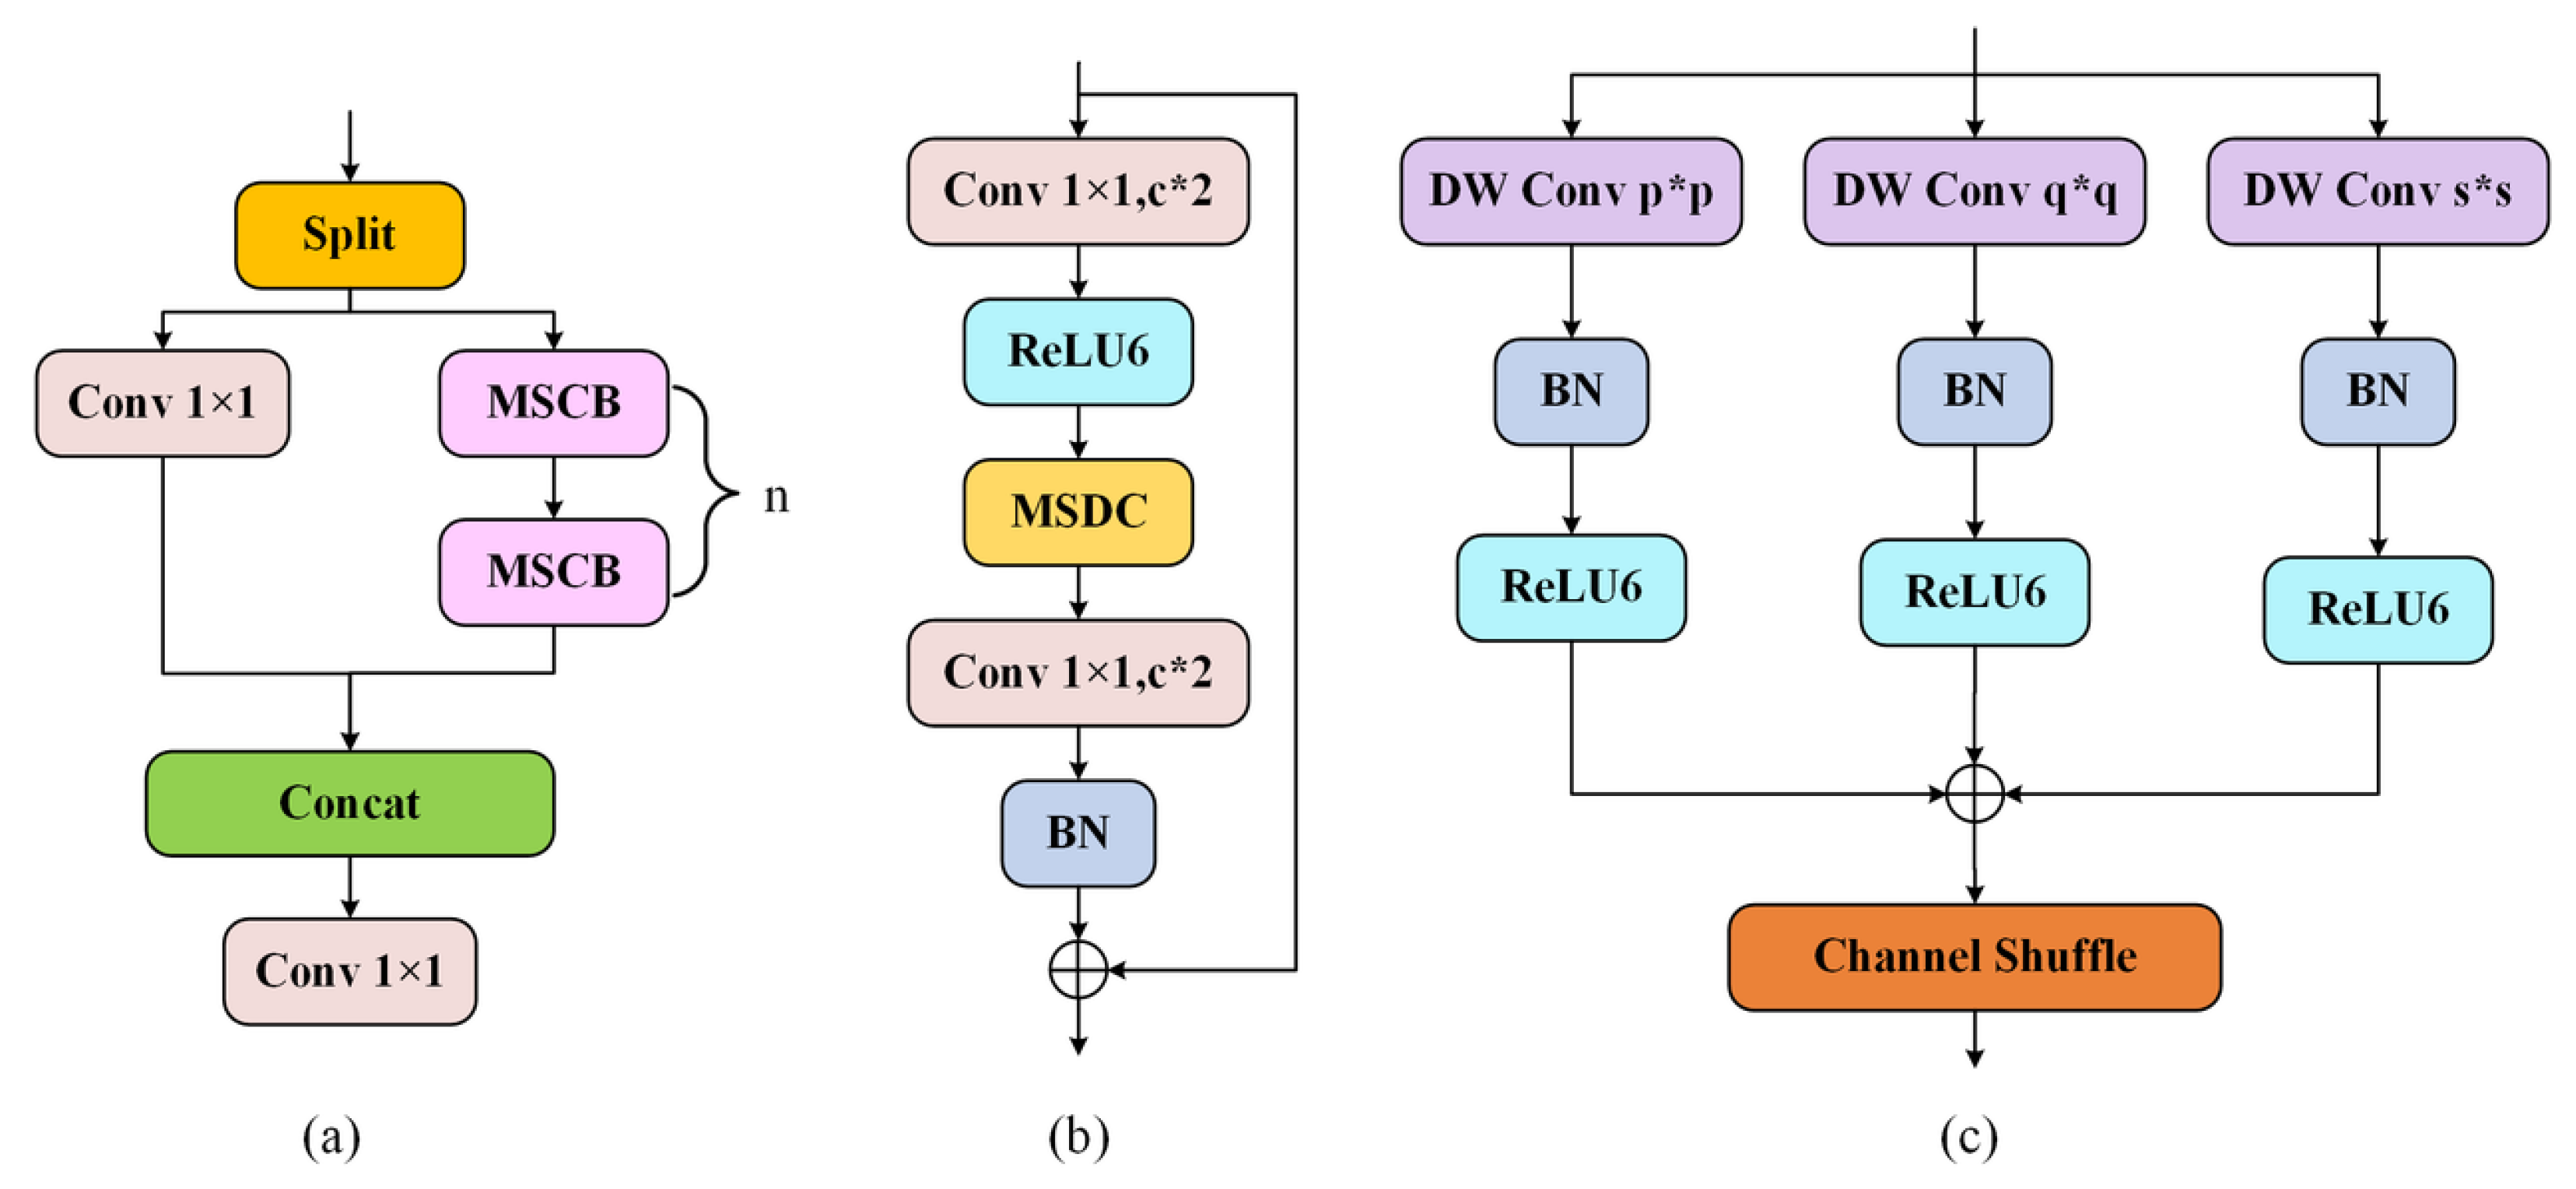
Inspired by Bidirectional Feature Pyramid Network (BiFPN) [33], EMBSFPN introduces cross-scale connections to improve feature reuse and adopts element-wise addition instead of feature concatenation to reduce redundant feature representations. Meanwhile, channel shuffle is employed to enhance information exchange between channels. The Cross Stage Partial Multi-Scale Convolution Block (CSP-MSCB) structure is designed to extract multi-scale contextual features, where the input feature map X is divided into two branches and processed independently. The detailed architectures of CSP-MSCB, MSCB, and Multi-Scale Depthwise Convolution (MSDC) are illustrated in Figure 7.
where and denote the two feature branches obtained from the input feature map X, while and denote the corresponding features processed by MSCB.
Figure 7.
Schematic diagram of (a) CSP-MSCB architecture, (b) MSCB architecture, and (c) MSDC architecture. Here, * denotes multiplication.
The extracted features are subsequently aggregated through a convolution:
where y denotes the fused output feature map.
Within MSCB, depthwise separable convolution is utilized to capture contextual information with different receptive fields, while pointwise convolution and channel shuffle improve feature interaction. The operation of MSCB is formulated as:
where PWC1 and PWC2 denote the first and second pointwise convolutions, respectively, CS represents channel shuffle, BN denotes batch normalization, and ReLU6 denotes the Rectified Linear Unit activation with an upper bound of 6. The variables – represent the intermediate feature maps generated by the successive operations. The MSDC component employs depthwise convolutions with different kernel sizes to capture multi-scale contextual information:
where denotes the output of MSDC, denotes the set of convolution kernel sizes, k denotes a kernel size in , and denotes the depthwise convolution block with kernel size k.
To recover spatial resolution efficiently, EUCB performs upsampling followed by lightweight convolution operations, as shown in Figure 8. Its formulation is defined as:
where denotes the upsampling operation, denotes depthwise convolution, denotes the Rectified Linear Unit activation function, and denotes a convolution.
Figure 8.
Schematic diagram of the EUCB architecture.
By integrating CSP-MSCB for multi-scale feature extraction and EUCB for efficient feature reconstruction, EMBSFPN improves cross-scale feature fusion while maintaining a lightweight architecture, providing an effective solution for real-time waste detection.
3.3.2. C3k2-MogaBlock Module
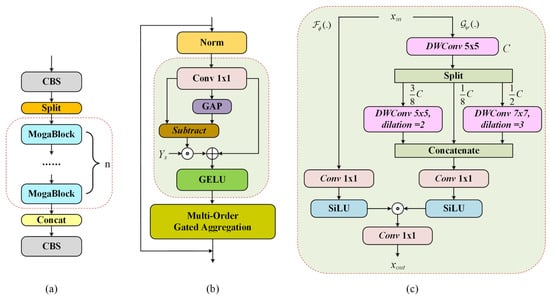
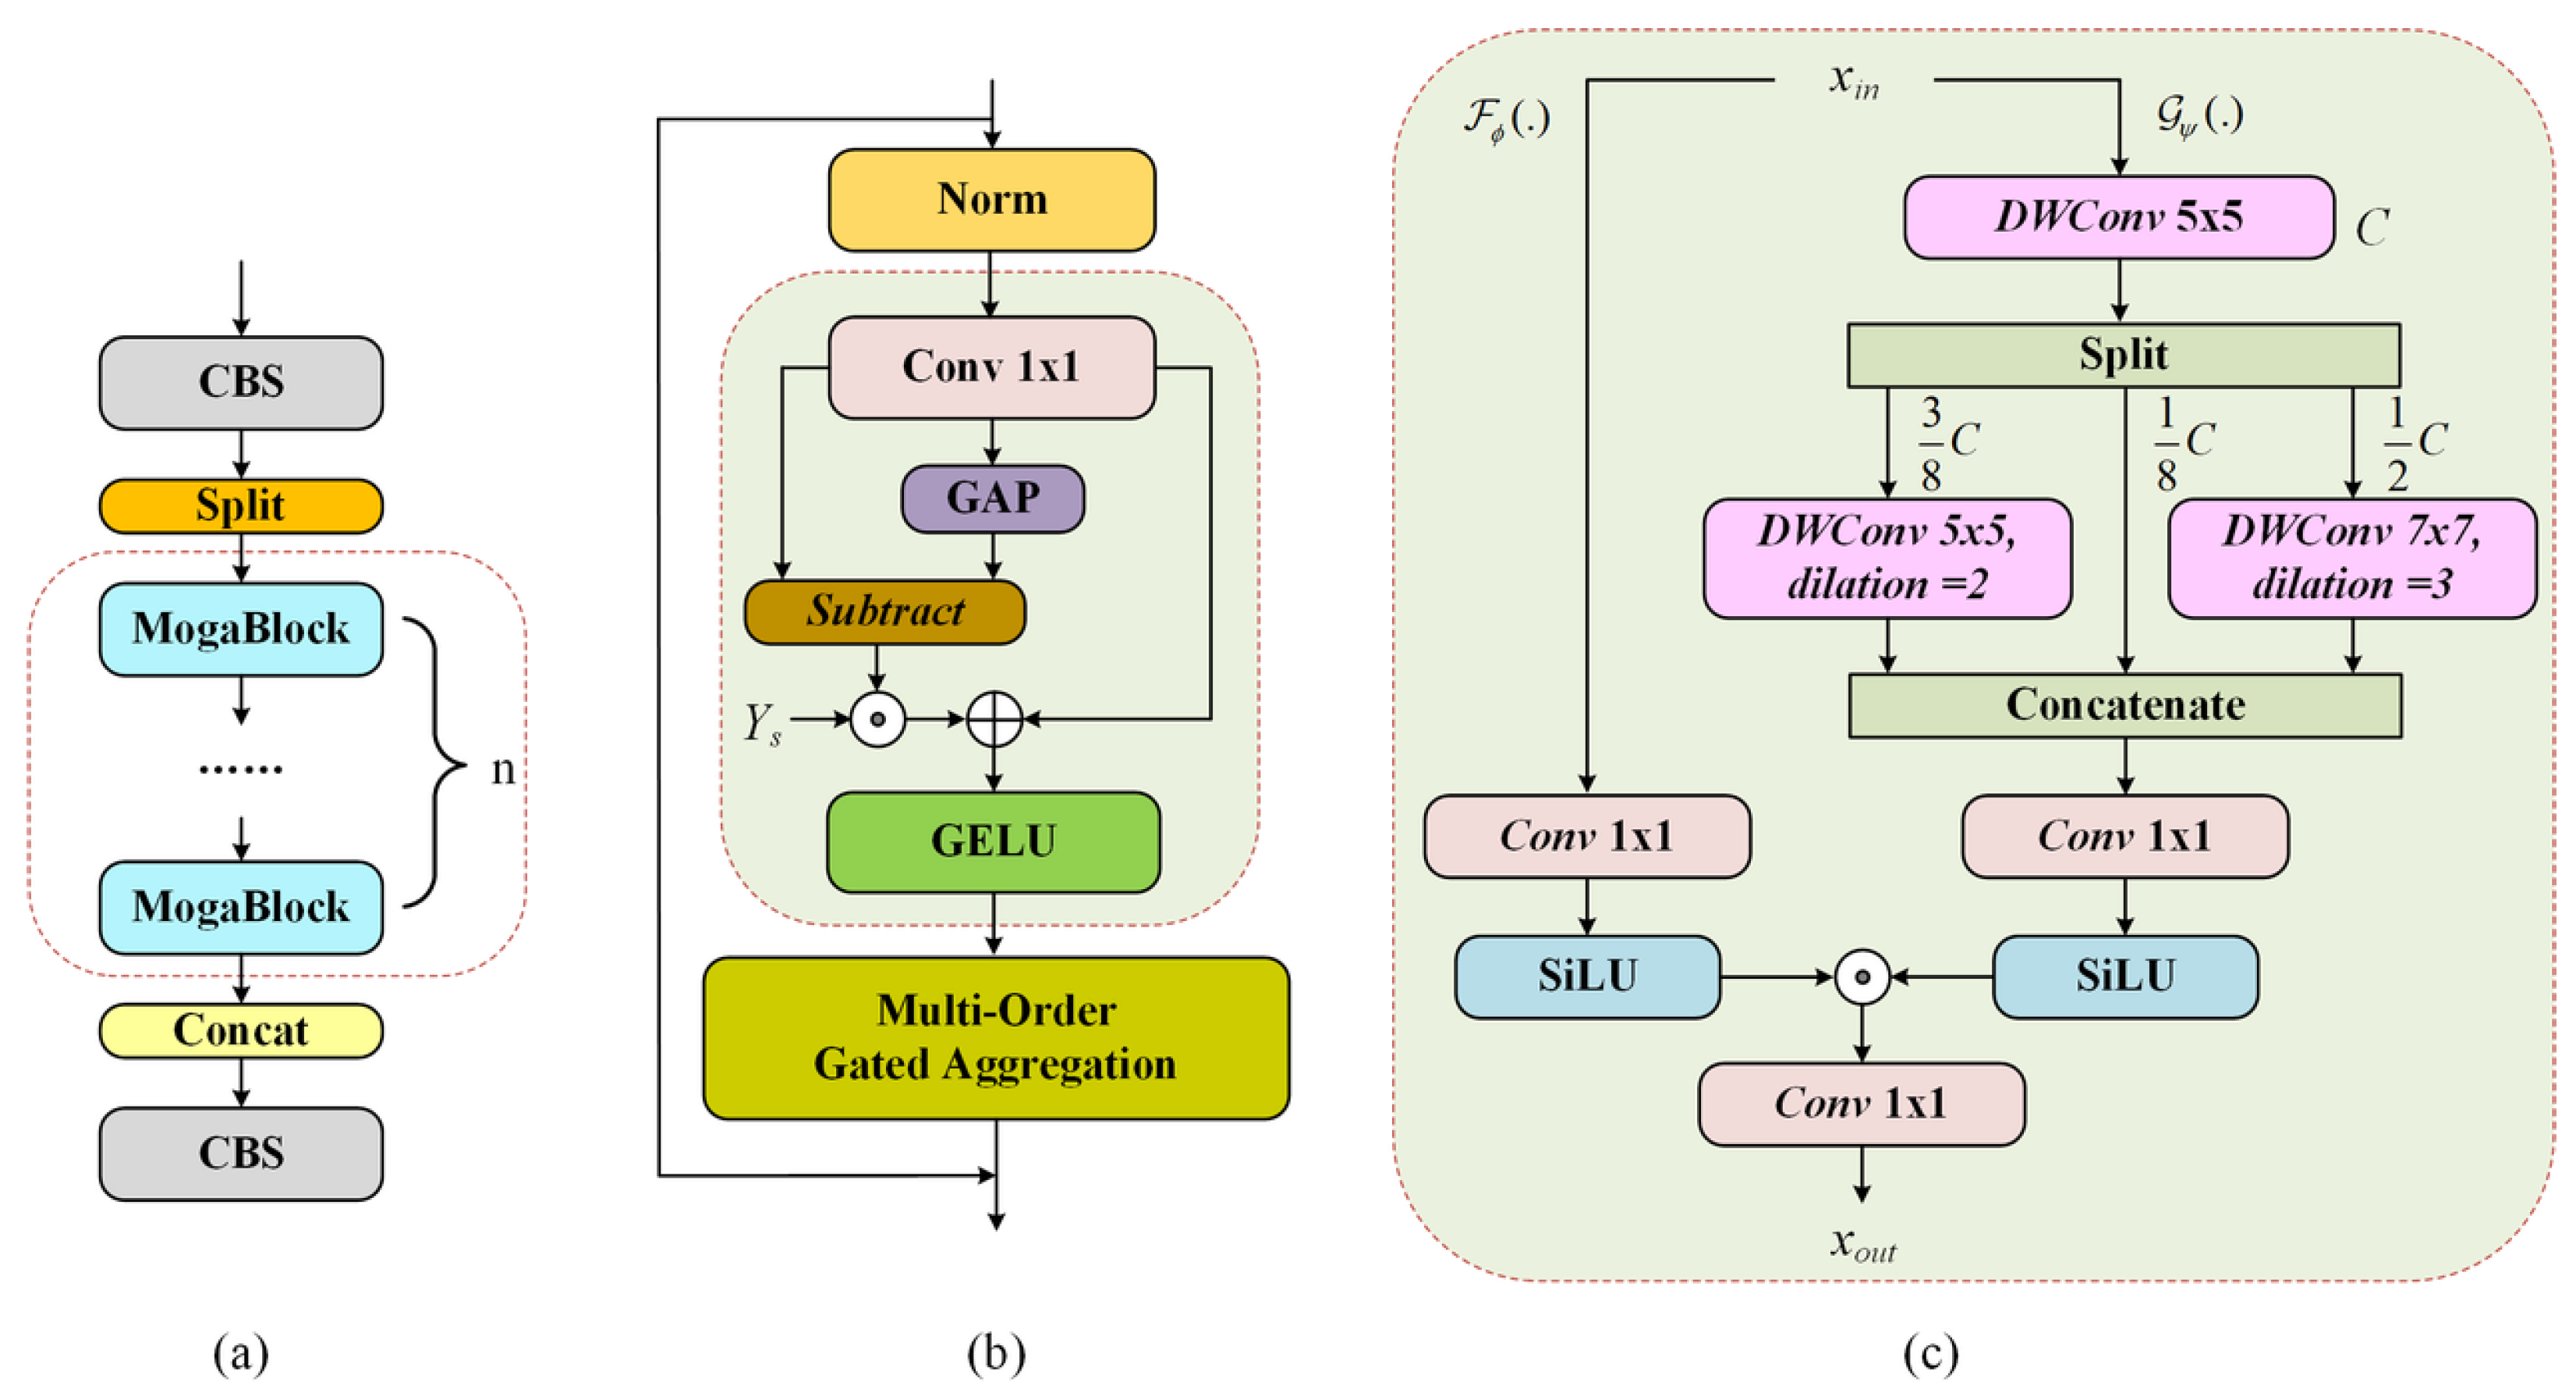
To enhance feature representation capability in complex waste detection scenarios, the C3k2 module is redesigned by incorporating the Multi-Order Gated Aggregation (MogaBlock) structure [34], as illustrated in Figure 9. The proposed C3k2-MogaBlock captures local details and global contextual information through multi-order convolution and adaptive gated aggregation. Here, local details mainly refer to fine-grained visual cues such as object edges, contours, textures, and small structural patterns, which are important for distinguishing visually similar waste categories and locating small targets. Global contextual information refers to broader structural and spatial information captured over larger receptive fields, including overall object shape and its relation to the surrounding background. By modeling features at different receptive-field ranges and adaptively aggregating them, MogaBlock is better suited to waste objects with substantial variations in appearance, scale, and background complexity.
Figure 9.
Schematic diagram of (a) C3k2-MogaBlock architecture, (b) MogaBlock architecture, and (c) Multi-Order Gated Aggregation mechanism.
Given an input feature map X, multiple depthwise convolution branches with different receptive fields are employed to extract hierarchical features:
where , , and denote low-order, middle-order, and high-order feature representations generated by different convolution configurations. Here, i denotes the feature-order index, where l, m, and h correspond to the low-, middle-, and high-order branches, respectively.
The extracted multi-order features are adaptively aggregated through a gated mechanism:
where and represent learnable transformation functions parameterized by and , respectively, ⊙ denotes element-wise multiplication, and denotes the aggregated gated feature representation. Finally, a convolution is applied to obtain the output feature representation:
where denotes the output feature map of the C3k2-MogaBlock.
By combining multi-order feature extraction with gated aggregation, C3k2-MogaBlock improves the modeling capability of the backbone network for waste objects with diverse structures and scale variations while maintaining computational efficiency.
3.3.3. Dynamic Task-Aligned Detection Head
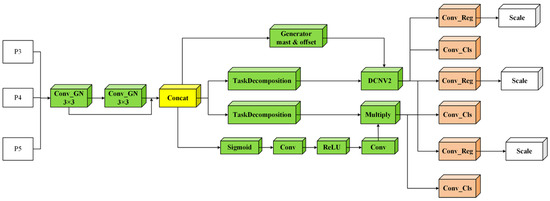
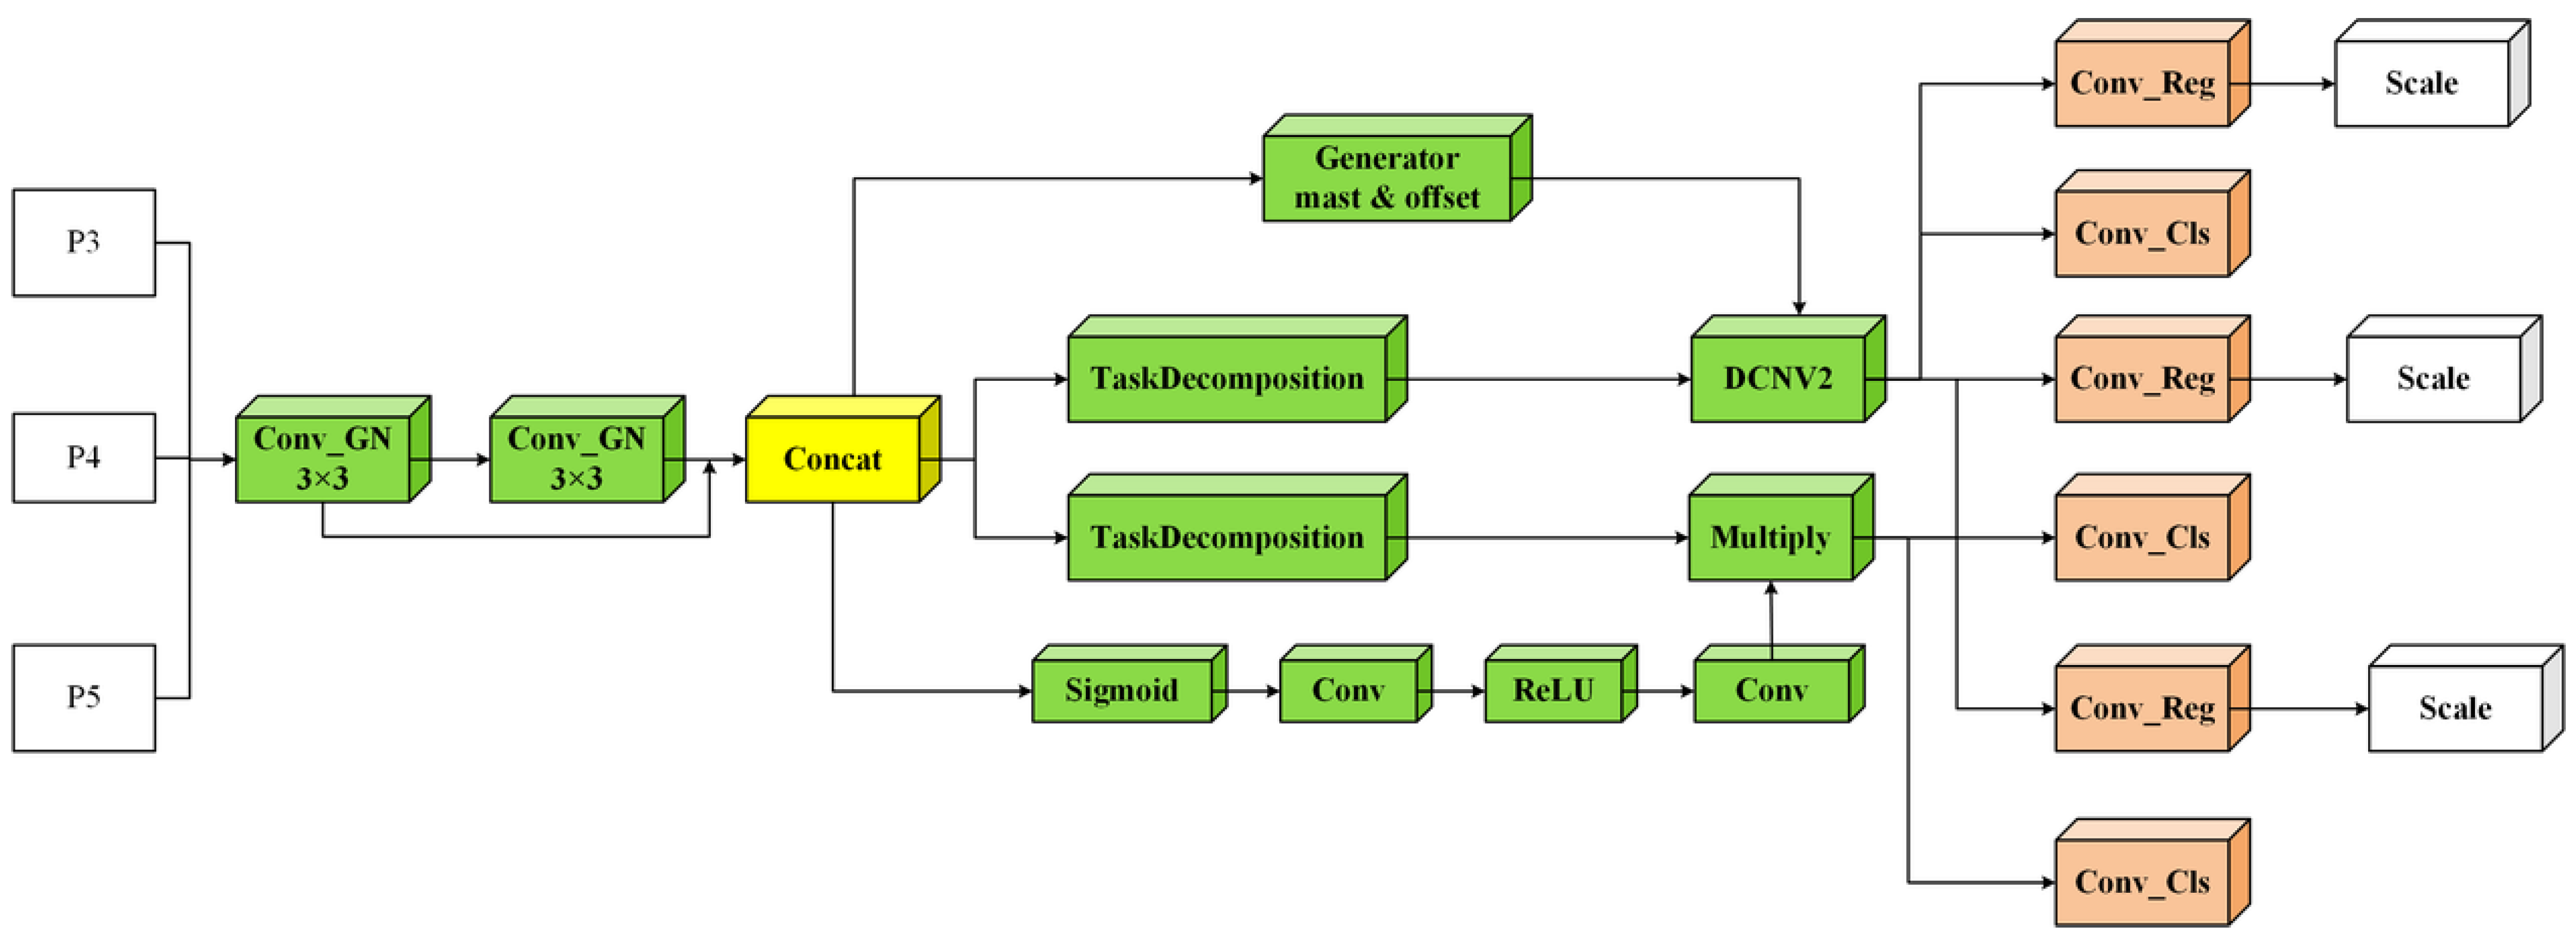
Existing detection heads typically separate classification and regression branches, which may weaken the interaction between semantic recognition and localization features. To enhance task collaboration while maintaining computational efficiency, a Dynamic Task-Aligned Detection Head (DTADH) is proposed, as illustrated in Figure 10. DTADH integrates shared feature learning, task decomposition, and dynamic task alignment between classification and localization to generate more discriminative detection representations. At the P3, P4, and P5 detection scales, the classification branch predicts the four waste categories, while the regression branch estimates the corresponding bounding boxes.
Figure 10.
Schematic diagram of the DTADH architecture.
Given an input feature map X, a shared convolution is first applied to obtain a unified feature representation:
The shared representation is subsequently decomposed into classification and regression features:
where and denote task-specific features. For localization enhancement, DCNv2 is introduced into the regression branch to generate adaptive offsets and modulation masks:
Meanwhile, a dynamic feature selection strategy is employed on the classification branch to strengthen category-related representations. The final detection feature is obtained by fusing the classification and aligned regression information:
By jointly modeling shared representations and task-specific alignment, DTADH improves the coordination between classification and localization, thereby enhancing detection accuracy in complex waste scenarios.
3.3.4. EMA Attention Mechanism
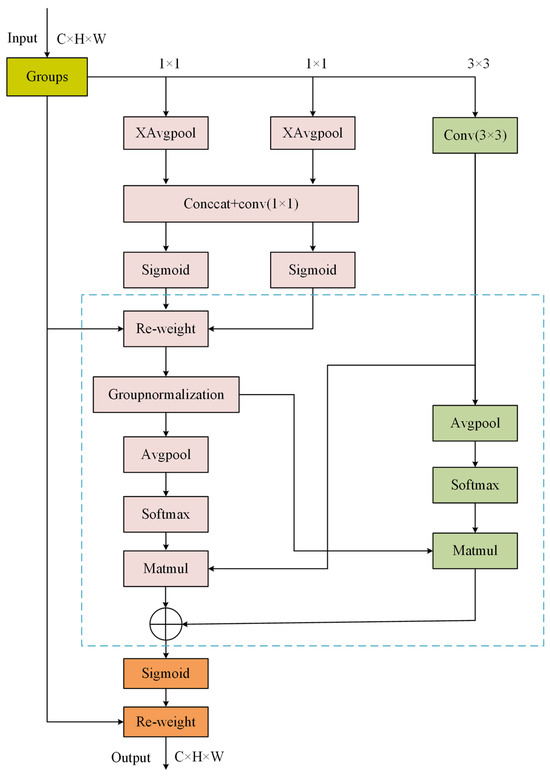
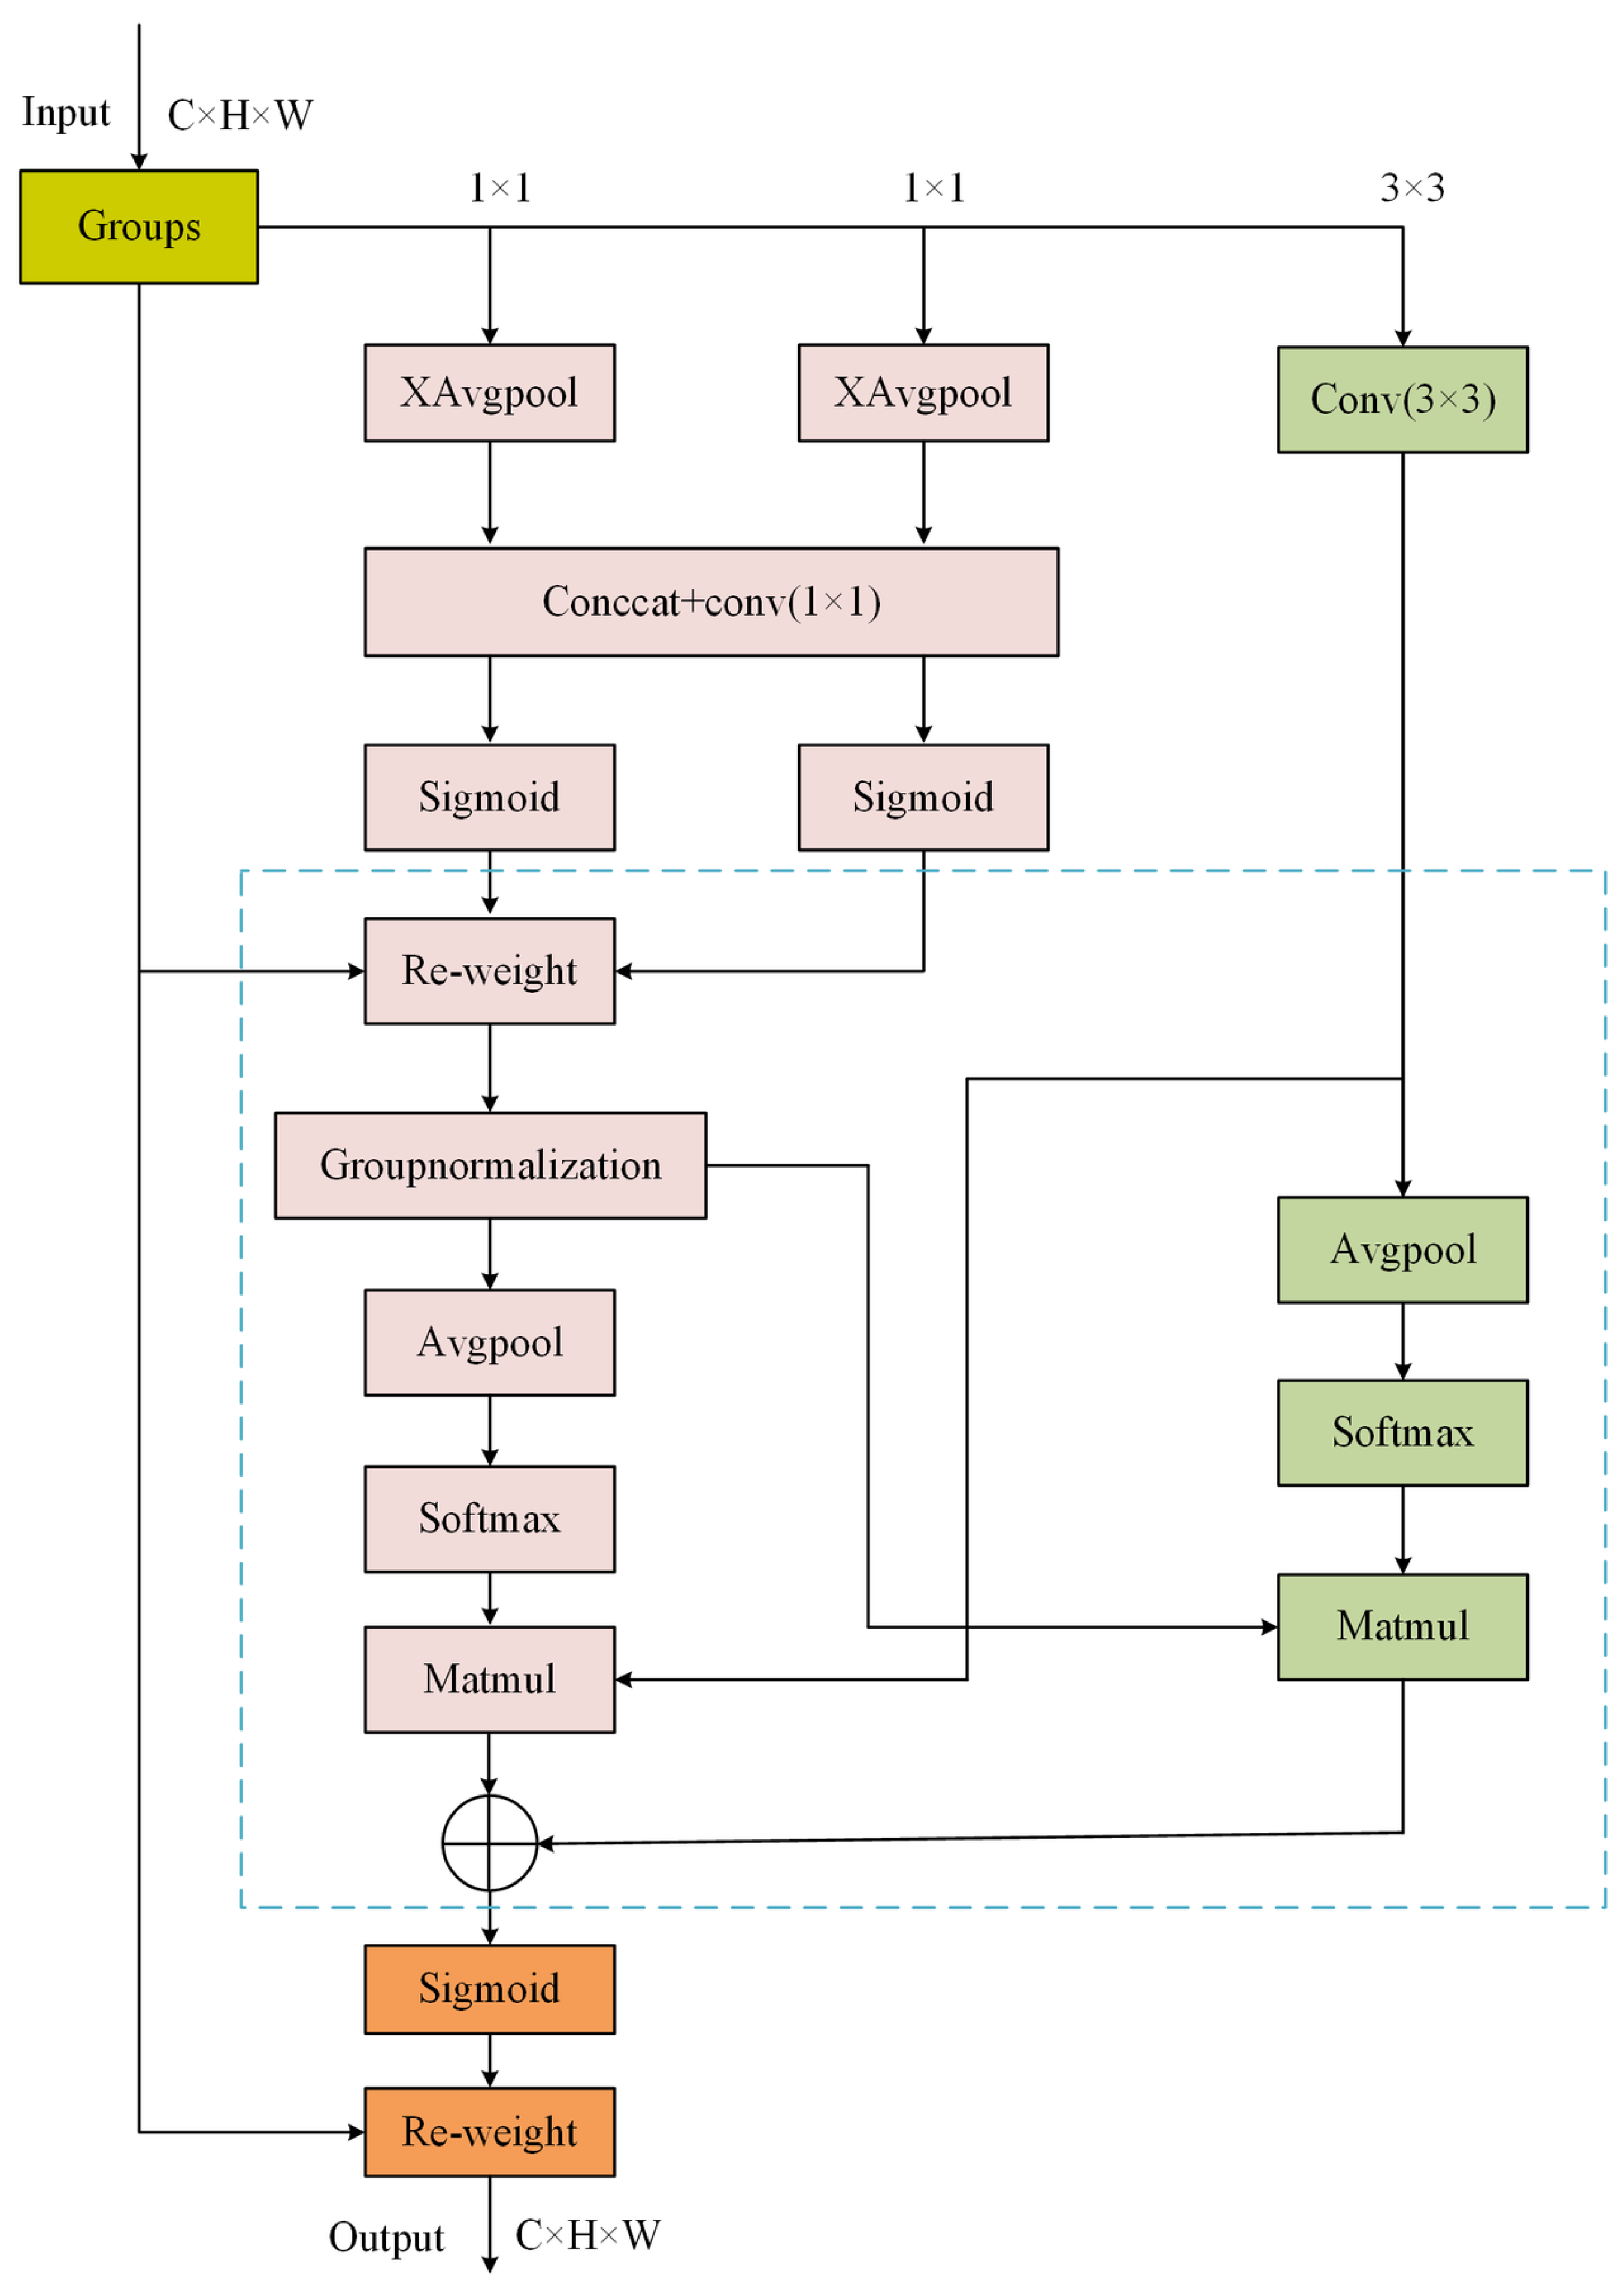
Complex backgrounds and irrelevant visual information remain major challenges in practical waste detection scenarios. To suppress background interference and enhance target-related features, EMA [35] is introduced before the detection head, as shown in Figure 11.
Figure 11.
Schematic diagram of the EMA attention mechanism architecture.
The EMA module divides the input feature map into multiple channel groups, enabling different groups to capture complementary semantic information. Subsequently, parallel and convolution branches are utilized to model channel dependencies and multi-scale spatial information. The generated attention weights are then applied to recalibrate feature responses, enhancing important target regions while suppressing irrelevant background information.
For an input feature map , where B, C, H, and W denote the batch size, number of channels, feature-map height, and feature-map width, respectively, the channel dimension is divided into G groups, where G denotes the number of channel groups and each group contains channels. After the group-wise attention operations, the features are recombined to recover the original dimension . Therefore, EMA preserves the channel dimensionality of the input feature map and can be directly connected to the subsequent detection head without channel mismatch.
Given an input feature map X, global average pooling is first applied to encode spatial information:
where denotes the pooled response at width position w, H denotes the height of the feature map, j denotes the index along the height dimension, w denotes a position along the width dimension, c denotes the channel index, and represents the feature value at channel c and spatial position .
The obtained attention weights are subsequently used to recalibrate feature responses, generating enhanced feature representations for subsequent detection tasks.
By combining channel grouping, multi-scale feature extraction, and adaptive feature weighting, EMA enhances feature representation for subsequent detection tasks.
4. Experimental Results and Analysis
4.1. Experimental Settings and Model Training
The experimental environment is summarized in Table 1. All experiments are conducted on a workstation equipped with an NVIDIA RTX 3090 graphics processing unit (GPU) and an x86_64 central processing unit (CPU). The operating system is Ubuntu 22.04.3 Long-Term Support (LTS). The proposed model is implemented using Python 3.10.12 and PyTorch 2.3.1 with Compute Unified Device Architecture (CUDA) 12.8.
Table 1.
Experimental environment configuration.
The training hyperparameters are listed in Table 2. The model is trained for 100 epochs with an input resolution of 640 × 640 pixels. Both the number of training epochs and the optimizer follow the default settings of the Ultralytics framework [36], with the optimizer configured as “auto”. Under the “auto” strategy used in our experiments, the optimizer and initial learning rate are automatically determined according to the estimated number of optimizer updates. For the present training configuration, the estimated number of optimizer updates is approximately 3400, which is below the 10,000-update threshold. Therefore, AdamW is automatically selected, with an initial learning rate of 0.00125. Since hyperparameter optimization is not the focus of this study, the 100-epoch training schedule and the “auto” optimizer configuration, which automatically selects AdamW under the present training setting, are consistently adopted for FLEX-YOLO and the YOLOv11-based experiments to ensure a consistent evaluation setting. The weight decay is set to 0.0005.
Table 2.
Model training hyperparameter configuration.
4.2. Evaluation Indicators
The performance of the proposed FLEX-YOLO model is evaluated using Precision (P), Recall (R), Average Precision (AP), and mAP metrics [37]. Precision and Recall are defined as follows:
where , , and represent true positives, false positives, and false negatives, respectively.
Average Precision (AP) is calculated as the area under the precision–recall curve:
where denotes precision as a function of recall r, r denotes recall, i denotes the category index, and N denotes the number of waste categories.
The mean Average Precision (mAP) is defined as:
In addition, mAP@50 and mAP@50–95 are adopted as the main evaluation metrics. The mAP@50–95 metric calculates the average AP under IoU thresholds ranging from 0.50 to 0.95 with an interval of 0.05. Model complexity is further evaluated using the number of parameters (Params) and GFLOPs.
4.3. Attention Contrast Experiment
To investigate the effectiveness of different attention mechanisms for waste detection, several representative attention modules are inserted before the detection head of YOLOv11n under identical training strategies and dataset settings. As summarized in Table 3, EMA achieves the best trade-off between detection accuracy and computational efficiency. Compared with YOLOv11n, EMA improves mAP@50 and mAP@50–95 by 1.5% and 2.1%, respectively, while maintaining the same parameter size (2.6 M) and introducing only a slight increase in computational cost from 6.4 to 6.6 GFLOPs. Although LSKA and ELA also improve detection performance, their additional computational overhead is relatively higher. Therefore, EMA is selected as the attention module in the final FLEX-YOLO framework.
Table 3.
Comparison of different attention mechanisms.
4.4. Detection Head Comparison Experiment
To evaluate the effectiveness of different detection heads, several representative lightweight and task-aligned detection heads are integrated into YOLOv11 under identical training configurations. As summarized in Table 4, different detection heads show varying effects on detection accuracy and computational efficiency. Lightweight detection heads, including LSCD, LADH, and RSCD, reduce computational complexity but lead to performance degradation, indicating that excessive simplification may weaken feature representation capability. In contrast, DTADH achieves the best overall performance, improving mAP@50 and mAP@50–95 from 93.5% and 70.2% to 94.5% and 72.2%, respectively, while reducing the number of parameters from 2.6 M to 2.2 M. Although EfficientHead and SEAMHead provide moderate improvements with relatively low computational costs, DTADH achieves a better balance between localization accuracy and model efficiency. Therefore, DTADH is selected as the final detection head of FLEX-YOLO.
Table 4.
Comparison of different detection heads.
4.5. Ablation Studies
To investigate the contribution of each proposed component, ablation experiments are conducted by progressively integrating EMBSFPN, C3k2-MogaBlock, DTADH, and EMA into the baseline YOLOv11 model. The results are summarized in Table 5. The individual ablation results reveal different effects of the four components. EMBSFPN improves mAP@50 and mAP@50–95 by 0.5 and 0.8 percentage points, respectively, while reducing the parameter count from 2.6 M to 2.1 M. This result is consistent with its design objective of reorganizing multi-scale feature fusion with a more compact structure, indicating that the improvement is achieved without increasing model size. C3k2-MogaBlock yields gains of 0.8 and 1.6 percentage points in mAP@50 and mAP@50–95, respectively. The relatively larger improvement under the stricter IoU range suggests that combining local-detail modeling with broader contextual information is beneficial for more precise object representation and localization. DTADH improves mAP@50–95 by 2.0 percentage points while reducing the parameter count to 2.2 M. Since DTADH is designed to better coordinate classification and regression features, the larger gain in mAP@50–95 is consistent with improved localization quality rather than only easier object recognition. EMA produces the largest individual accuracy improvement, increasing mAP@50 and mAP@50–95 by 1.5 and 2.1 percentage points, respectively, with almost no change in the parameter count. This observation suggests that adaptive feature reweighting mainly improves the utilization of informative responses under complex backgrounds rather than relying on additional model capacity.
Table 5.
Comparison of ablation experiment results.
The progressive combination experiments provide further evidence that these components play different but complementary roles. Combining EMBSFPN and C3k2-MogaBlock increases mAP@50/mAP@50–95 to 95.1%/72.5%, showing that the feature-fusion and feature-extraction modifications can be jointly retained. After introducing DTADH, the two metrics further increase to 96.2%/73.3%, while the parameter count decreases to 1.9 M, indicating that the redesigned detection head provides additional gains beyond the backbone and neck modifications. Finally, adding EMA increases the performance to 97.0%/74.0%. Compared with the baseline YOLOv11, the complete model improves mAP@50 and mAP@50–95 by 3.5 and 3.8 percentage points, respectively, while reducing the parameter count from 2.6 M to 1.9 M. The continued improvement after each successive integration suggests that the final performance is not dominated by a single component; instead, the four components contribute at different stages of feature extraction, feature fusion, task interaction, and feature refinement.
4.6. Performance Comparison
To comprehensively evaluate the effectiveness of FLEX-YOLO, the proposed model is compared with representative object detection algorithms, including SSD, Faster-RCNN, YOLOv3-Tiny, YOLOv6, YOLOX, yolov9, YOLOv10, YOLOv11, YOLOv12, and RT-DETR. To provide comparisons with more recent lightweight detectors, yolov9, YOLOv10, and YOLOv12 are additionally included in the evaluation. The comparison results are summarized in Table 6. FLEX-YOLO achieves the best overall detection performance, obtaining 92.0% precision, 92.5% recall, 97.0% mAP@50, and 74.0% mAP@50–95. Compared with YOLOv11, the proposed model improves mAP@50 and mAP@50–95 by 3.5 and 3.8 percentage points, respectively, while reducing the number of parameters from 2.6 M to 1.9 M. Compared with the newly included lightweight detectors, FLEX-YOLO improves mAP@50/mAP@50–95 by 10.2/8.1, 3.5/3.7, and 3.2/3.4 percentage points over yolov9, YOLOv10, and YOLOv12, respectively. Its parameter count is lower than those of YOLOv10 and YOLOv12, although slightly higher than that of yolov9. The computational cost of FLEX-YOLO is 8.5 GFLOPs, which is higher than that of the recent lightweight YOLO variants. Overall, the results show that FLEX-YOLO achieves higher detection accuracy while retaining a relatively small parameter count, although at a higher computational cost.
Table 6.
Comparison of detection results across different models.
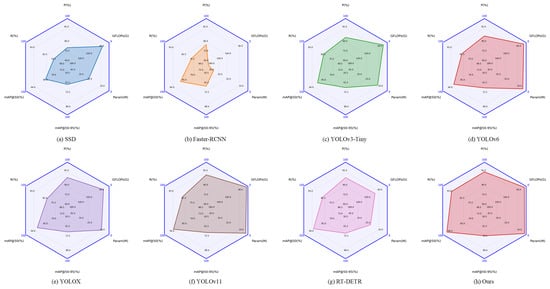
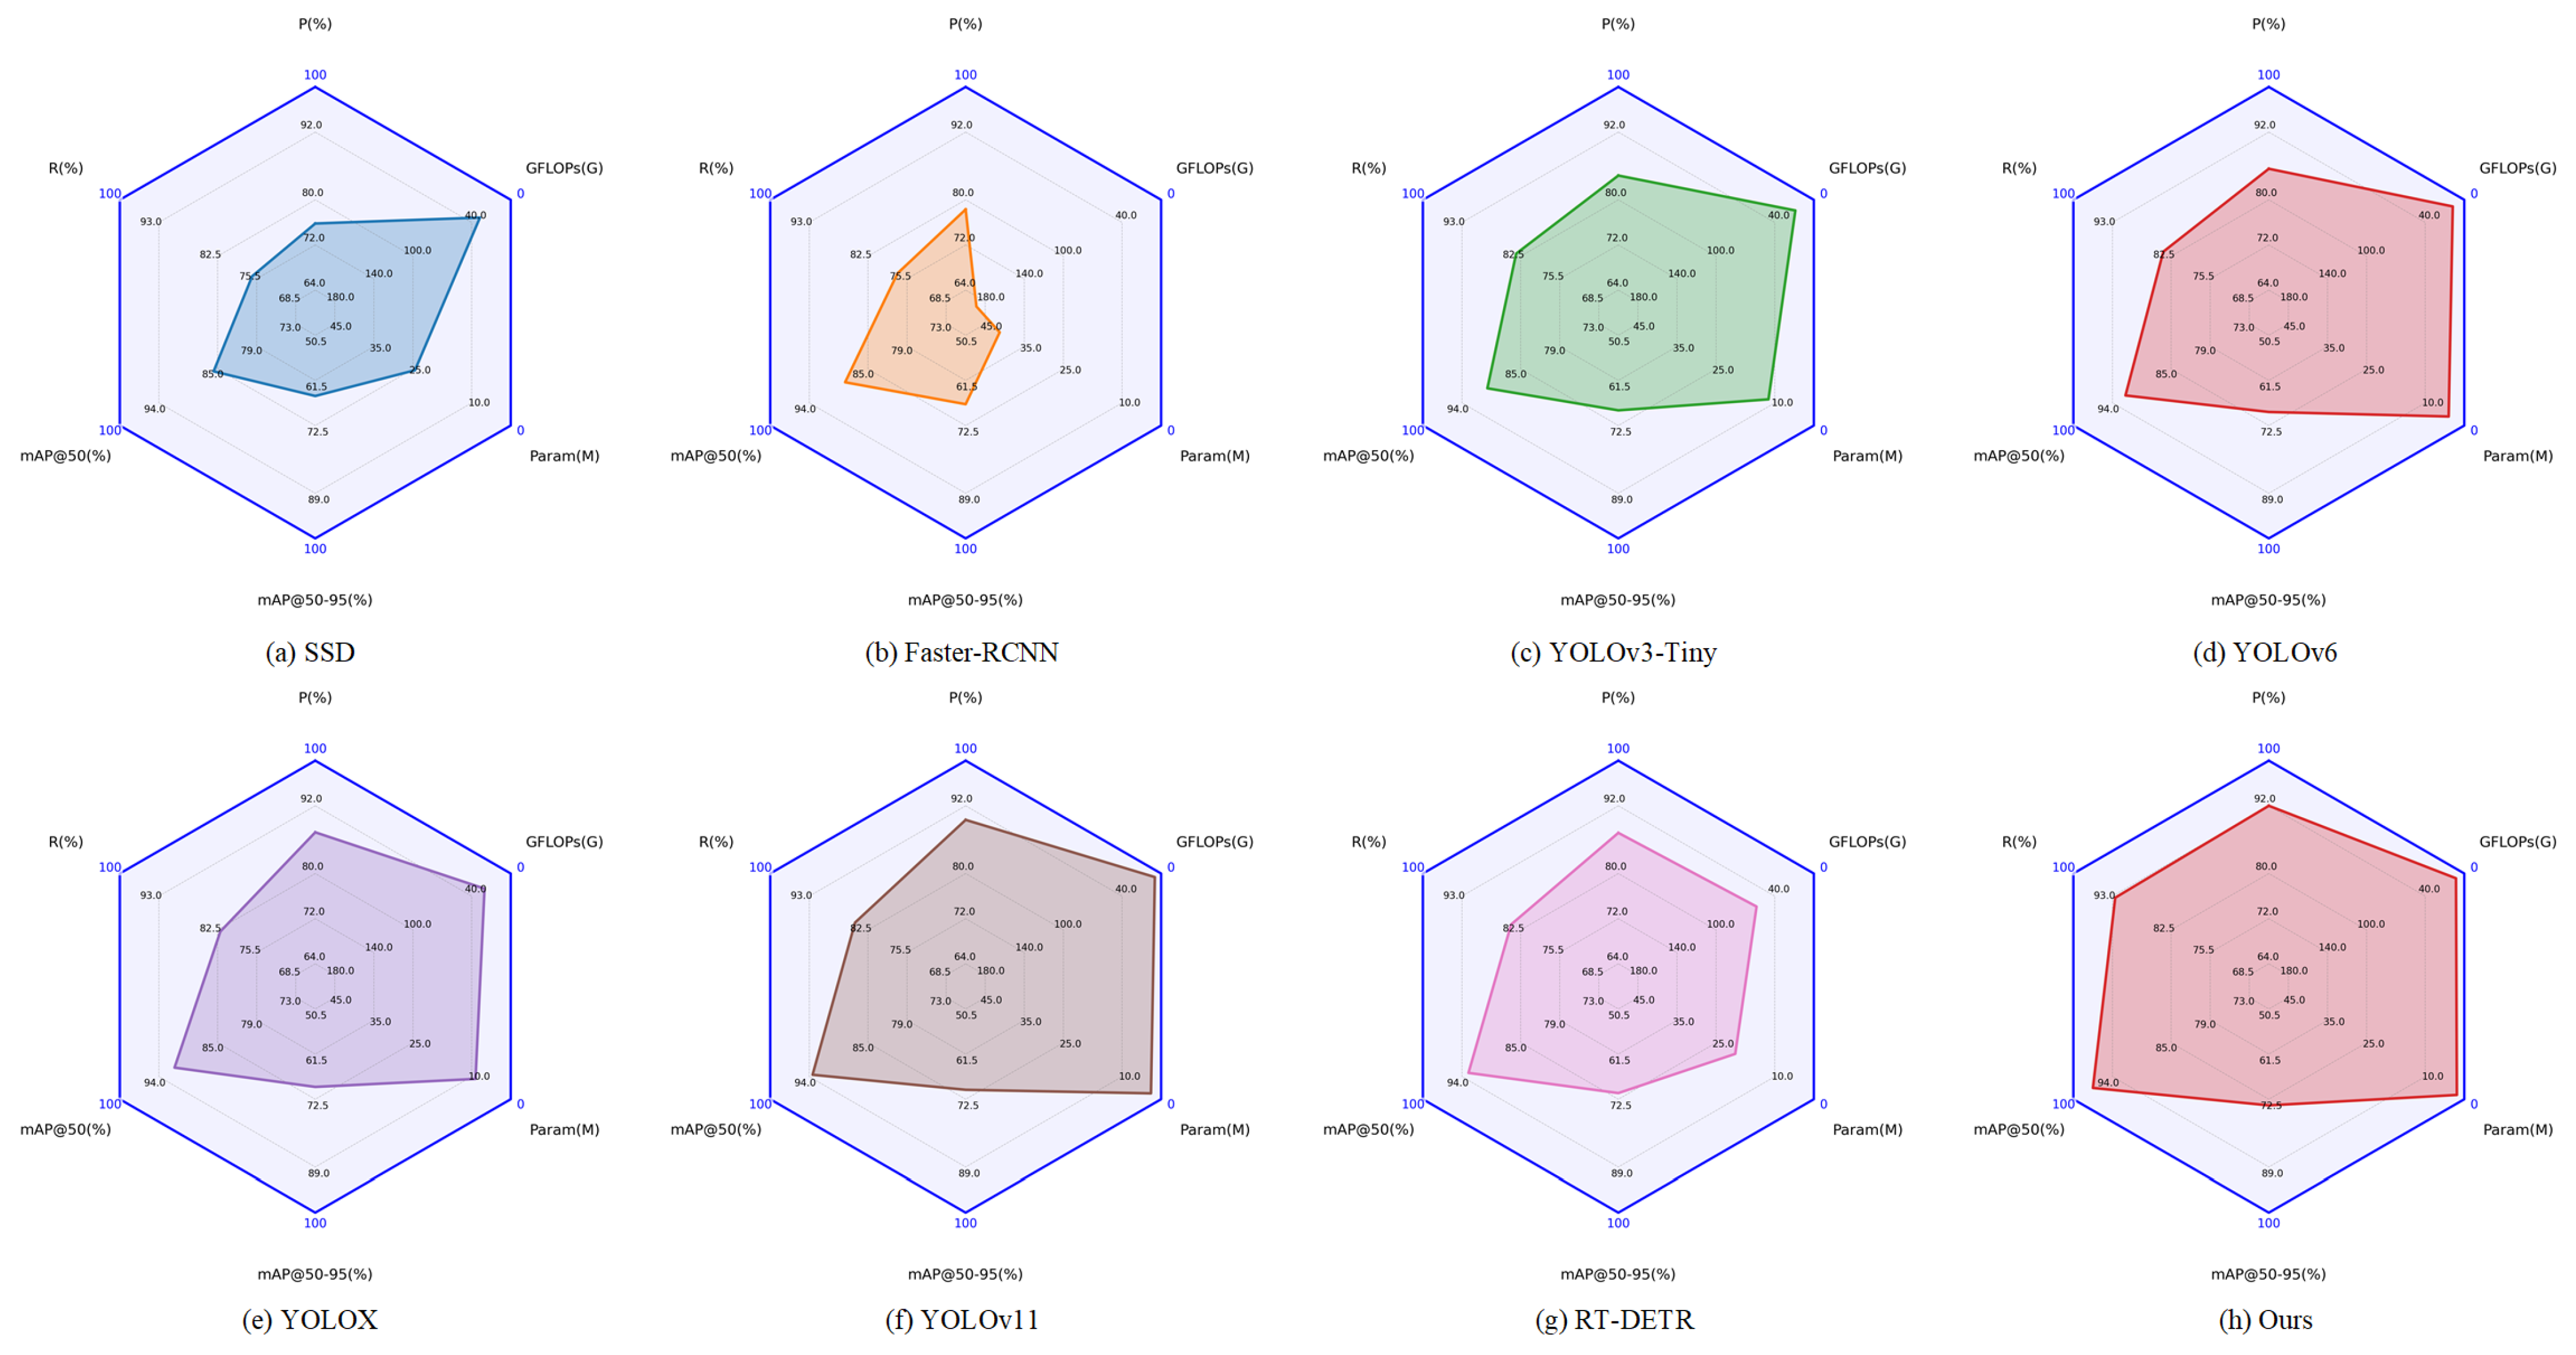
The radar chart in Figure 12 provides a visual comparison of selected representative models in terms of detection accuracy and model compactness.
Figure 12.
Radar plot comparing the performance of selected representative detection models across multiple evaluation dimensions.
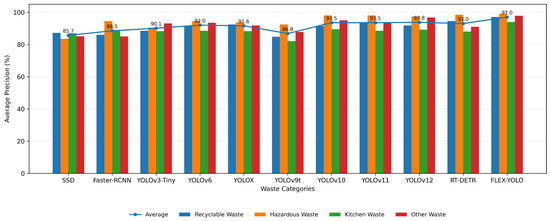
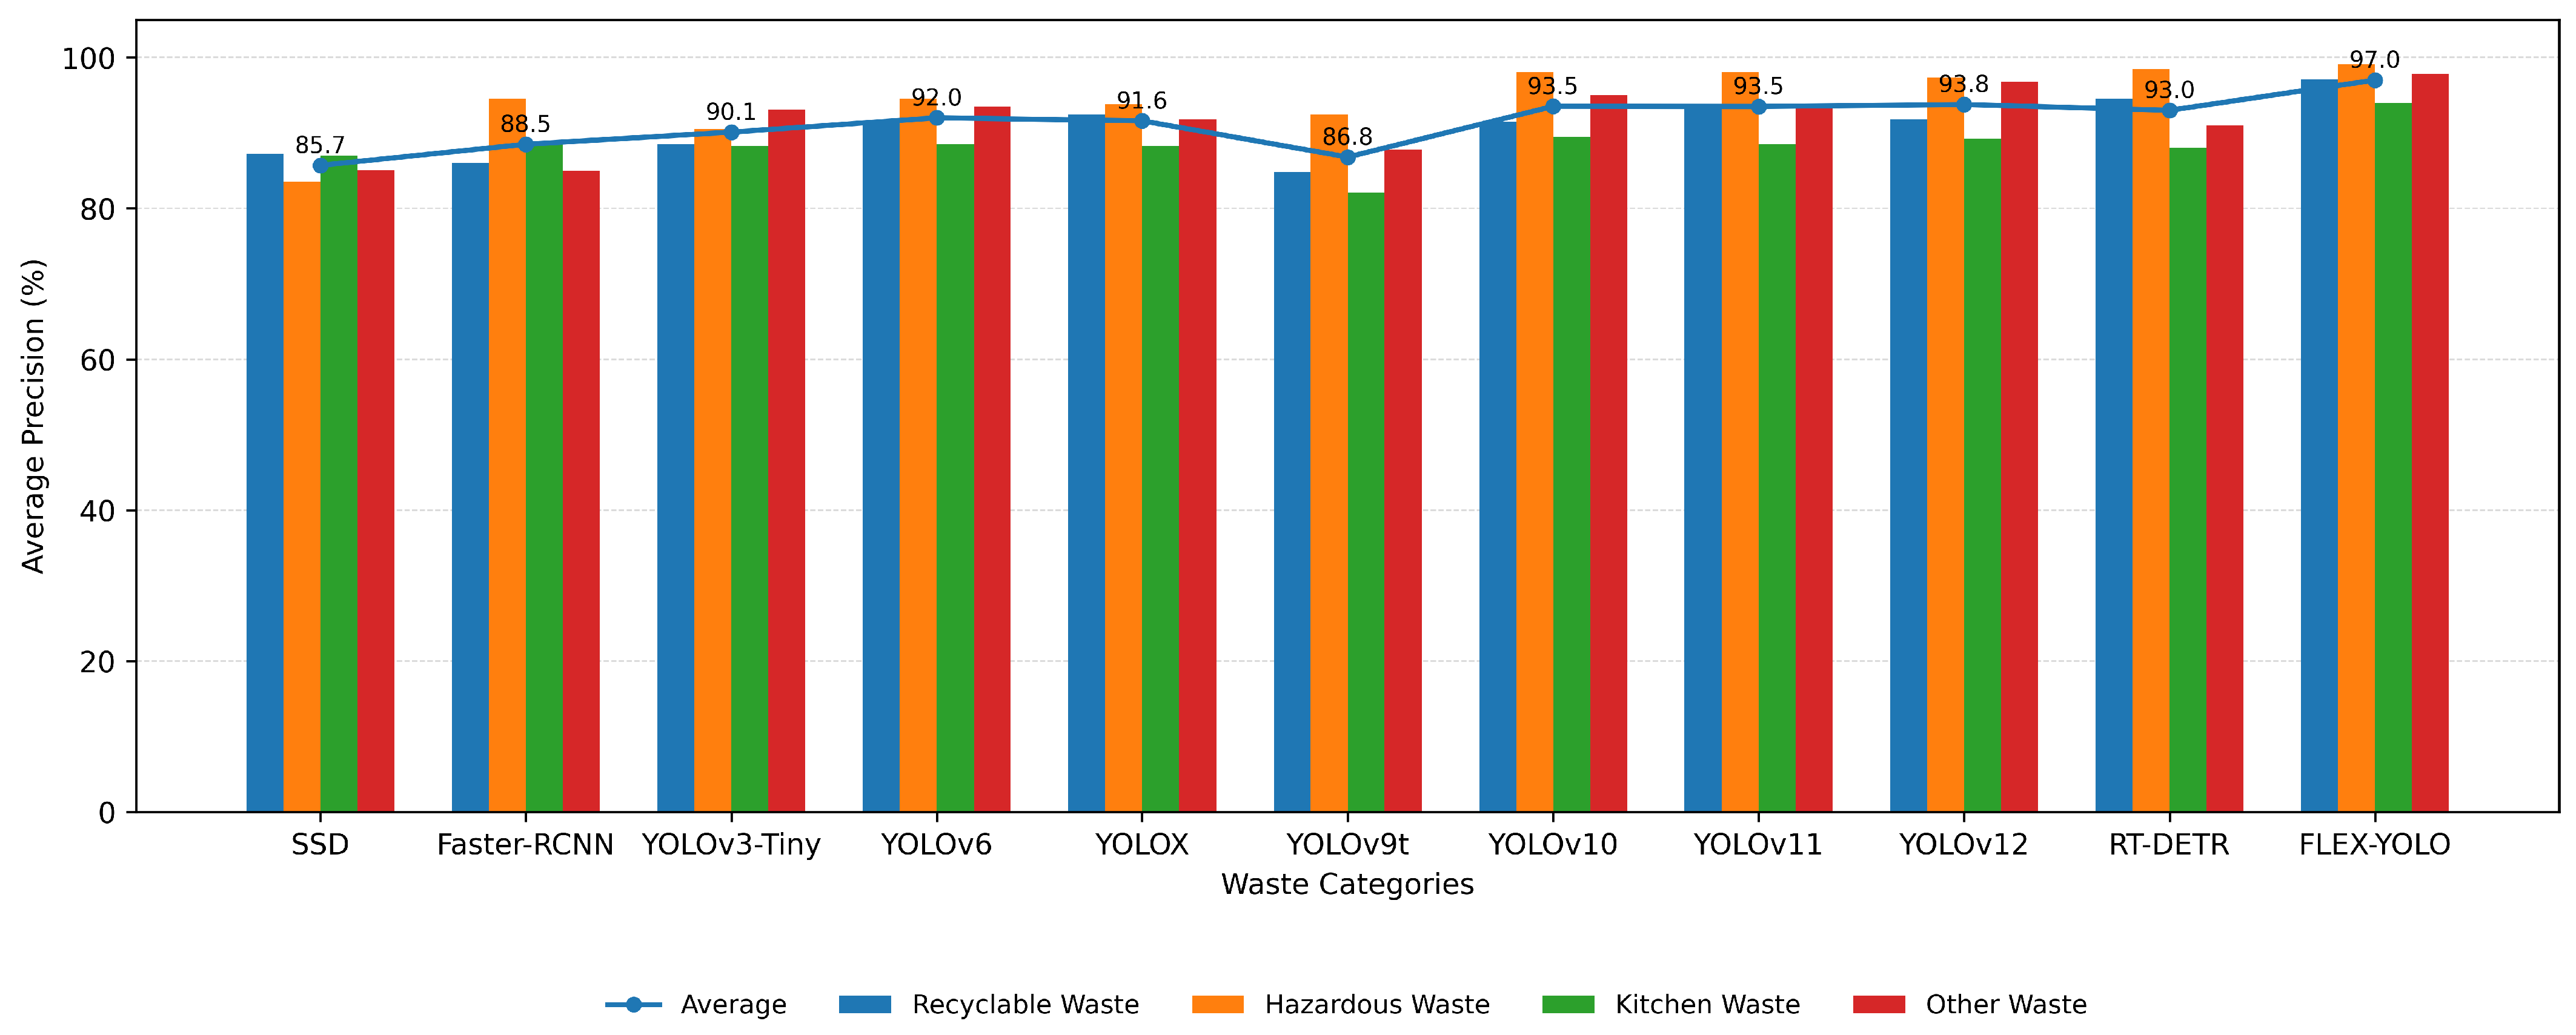
The category-wise detection performance is further evaluated to analyze the recognition capability of different models for various waste categories. The AP results for four waste categories are presented in Table 7. FLEX-YOLO achieves the highest AP values across all categories, reaching 97.1%, 99.1%, 94.0%, and 97.8% for recyclable, hazardous, kitchen, and other waste, respectively. Compared with YOLOv11, the proposed model improves AP by 3.6, 1.0, 5.5, and 3.9 percentage points, respectively. The comparisons with yolov9, YOLOv10, and YOLOv12 further show that FLEX-YOLO maintains the highest AP across all four waste categories among the evaluated recent lightweight YOLO models. The relatively larger improvement for kitchen waste suggests that the proposed modifications are beneficial for this more challenging category.
Table 7.
Average precision of different models for four waste categories.
The category-wise detection comparison among different models is visualized in Figure 13, providing a more intuitive comparison of their performance across the four waste categories.
Figure 13.
Detection performance comparison across four waste categories for different detection models.
4.7. Model Performance Analysis
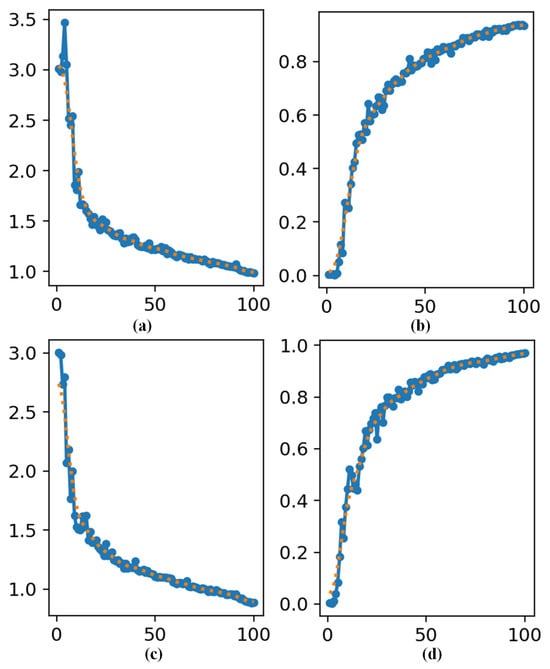
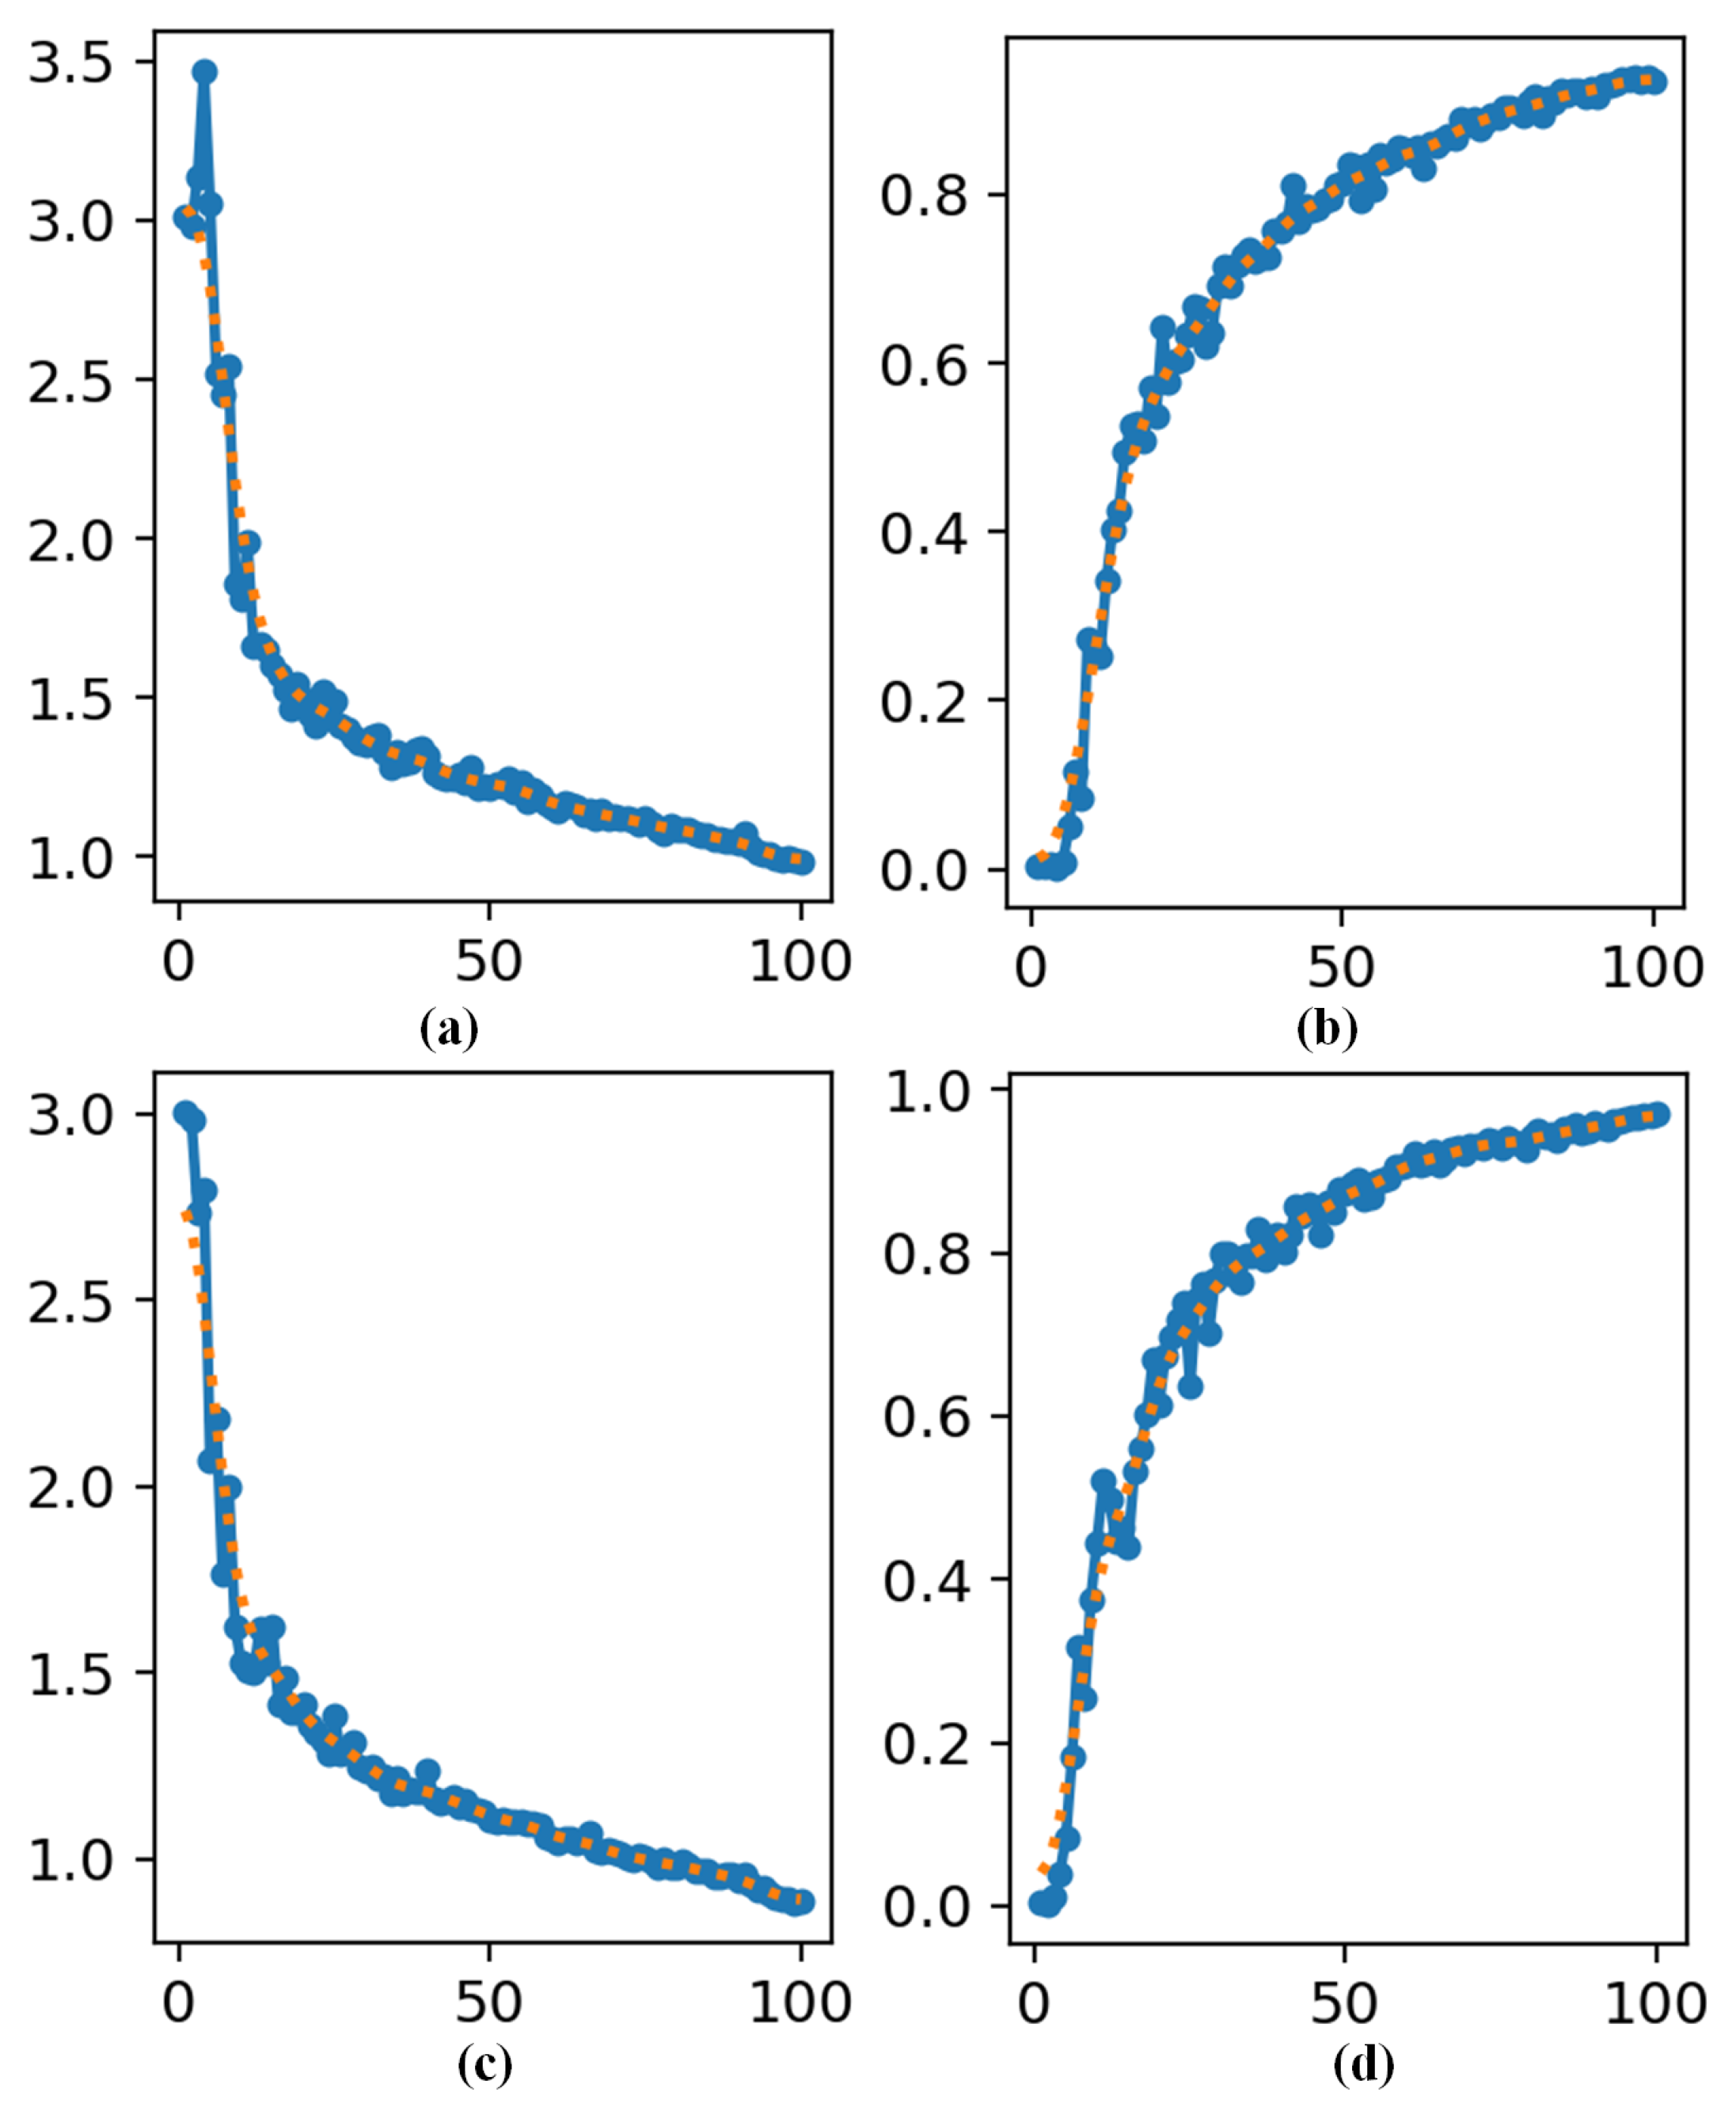
To further examine the training process of the models, Figure 14 presents the validation box loss and mAP@50 curves of YOLOv11 and FLEX-YOLO over 100 training epochs. For both models, the validation box loss generally decreases as training proceeds, while the mAP@50 increases rapidly in the early stage and gradually becomes flatter in the later stage. These results indicate that the training process of both models enters a relatively stable stage within the adopted 100-epoch schedule.
Figure 14.
Training curves of YOLOv11 and FLEX-YOLO over 100 epochs: (a) validation box loss of YOLOv11; (b) mAP@50 of YOLOv11; (c) validation box loss of FLEX-YOLO; (d) mAP@50 of FLEX-YOLO.
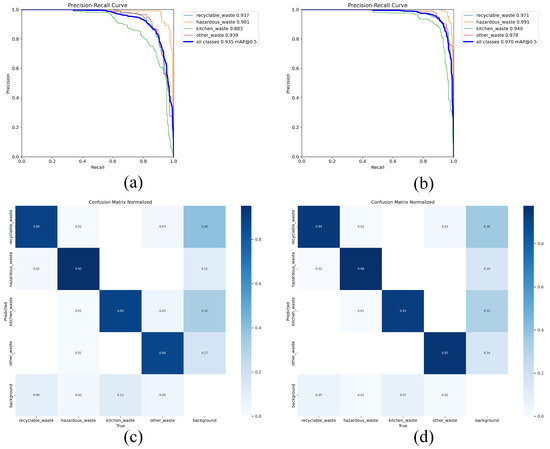
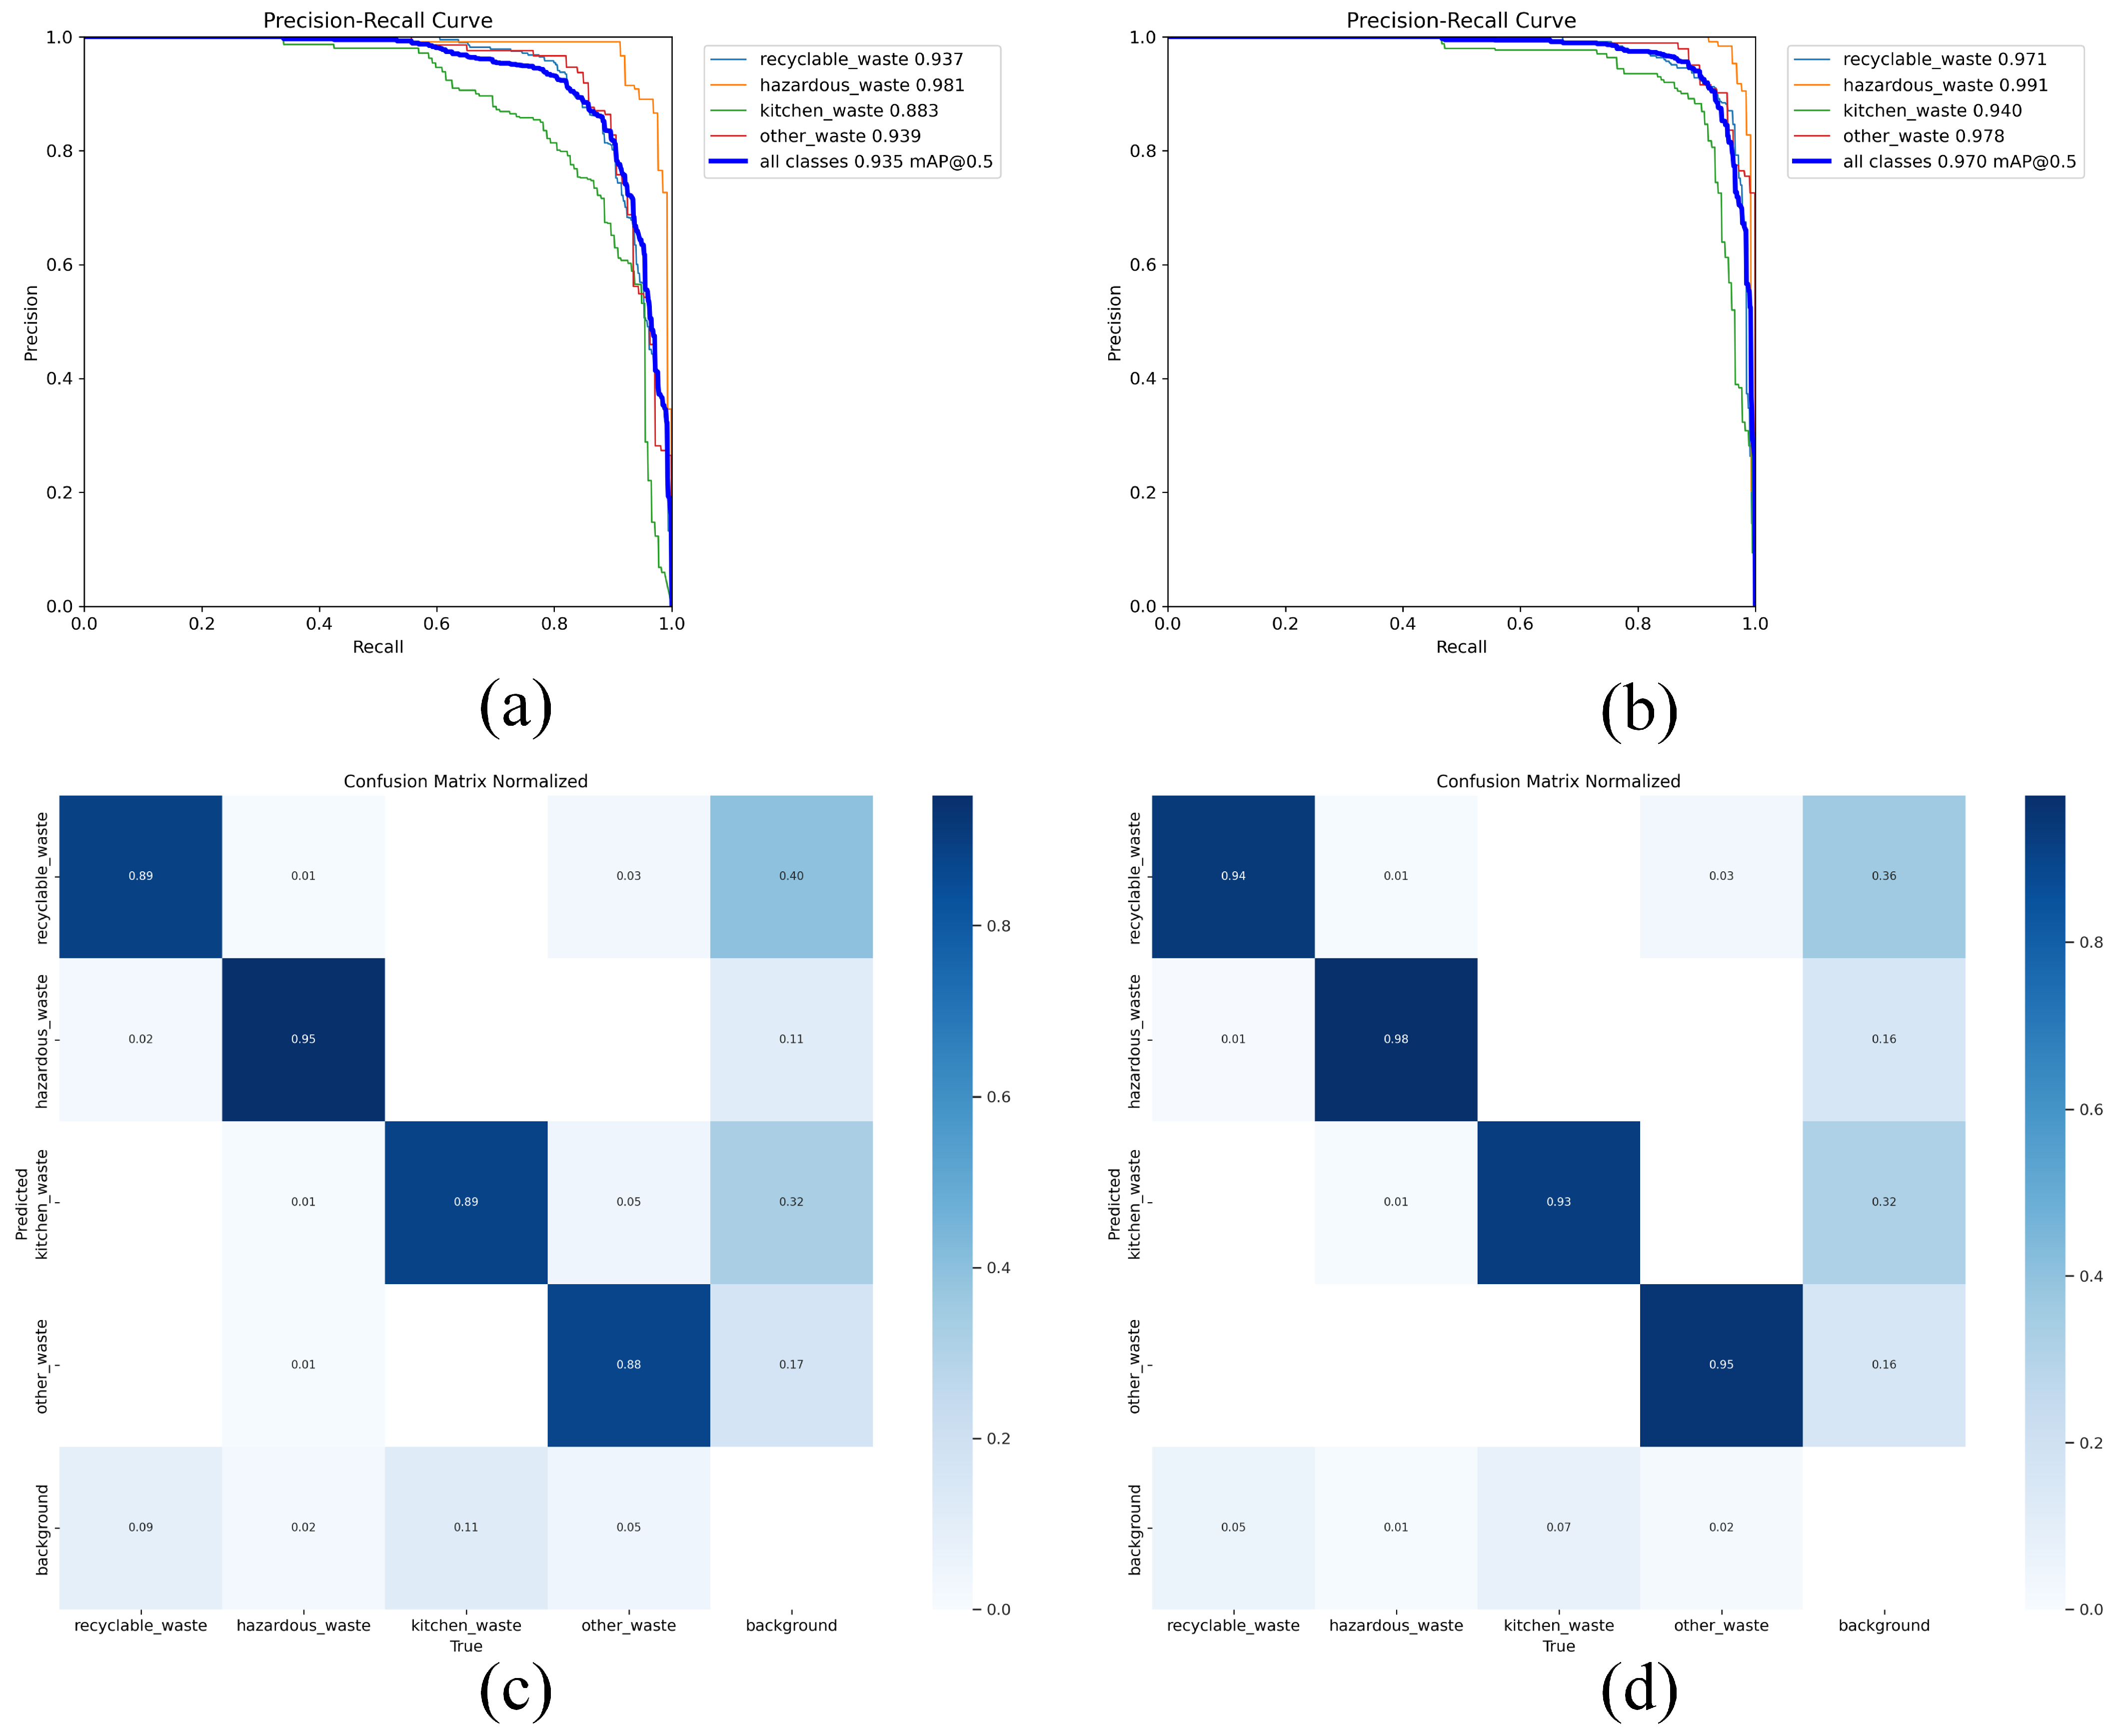
To further analyze the detection performance of FLEX-YOLO, the Precision–Recall curves and normalized confusion matrices of YOLOv11 and FLEX-YOLO are compared in Figure 15. FLEX-YOLO shows improved Precision–Recall performance and fewer classification errors compared with YOLOv11. The normalized confusion matrices further illustrate the differences in category prediction between the two models.
Figure 15.
Performance comparison between YOLOv11 and FLEX-YOLO: (a,b) Precision–Recall curves; (c,d) normalized confusion matrices.
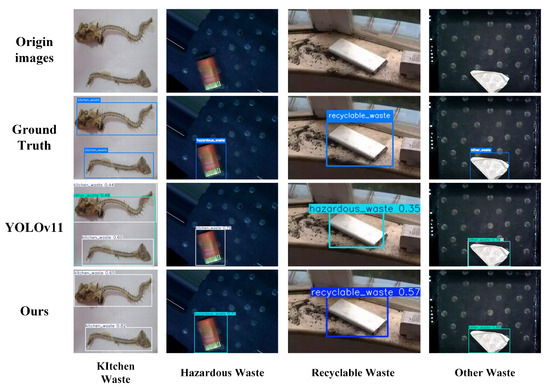
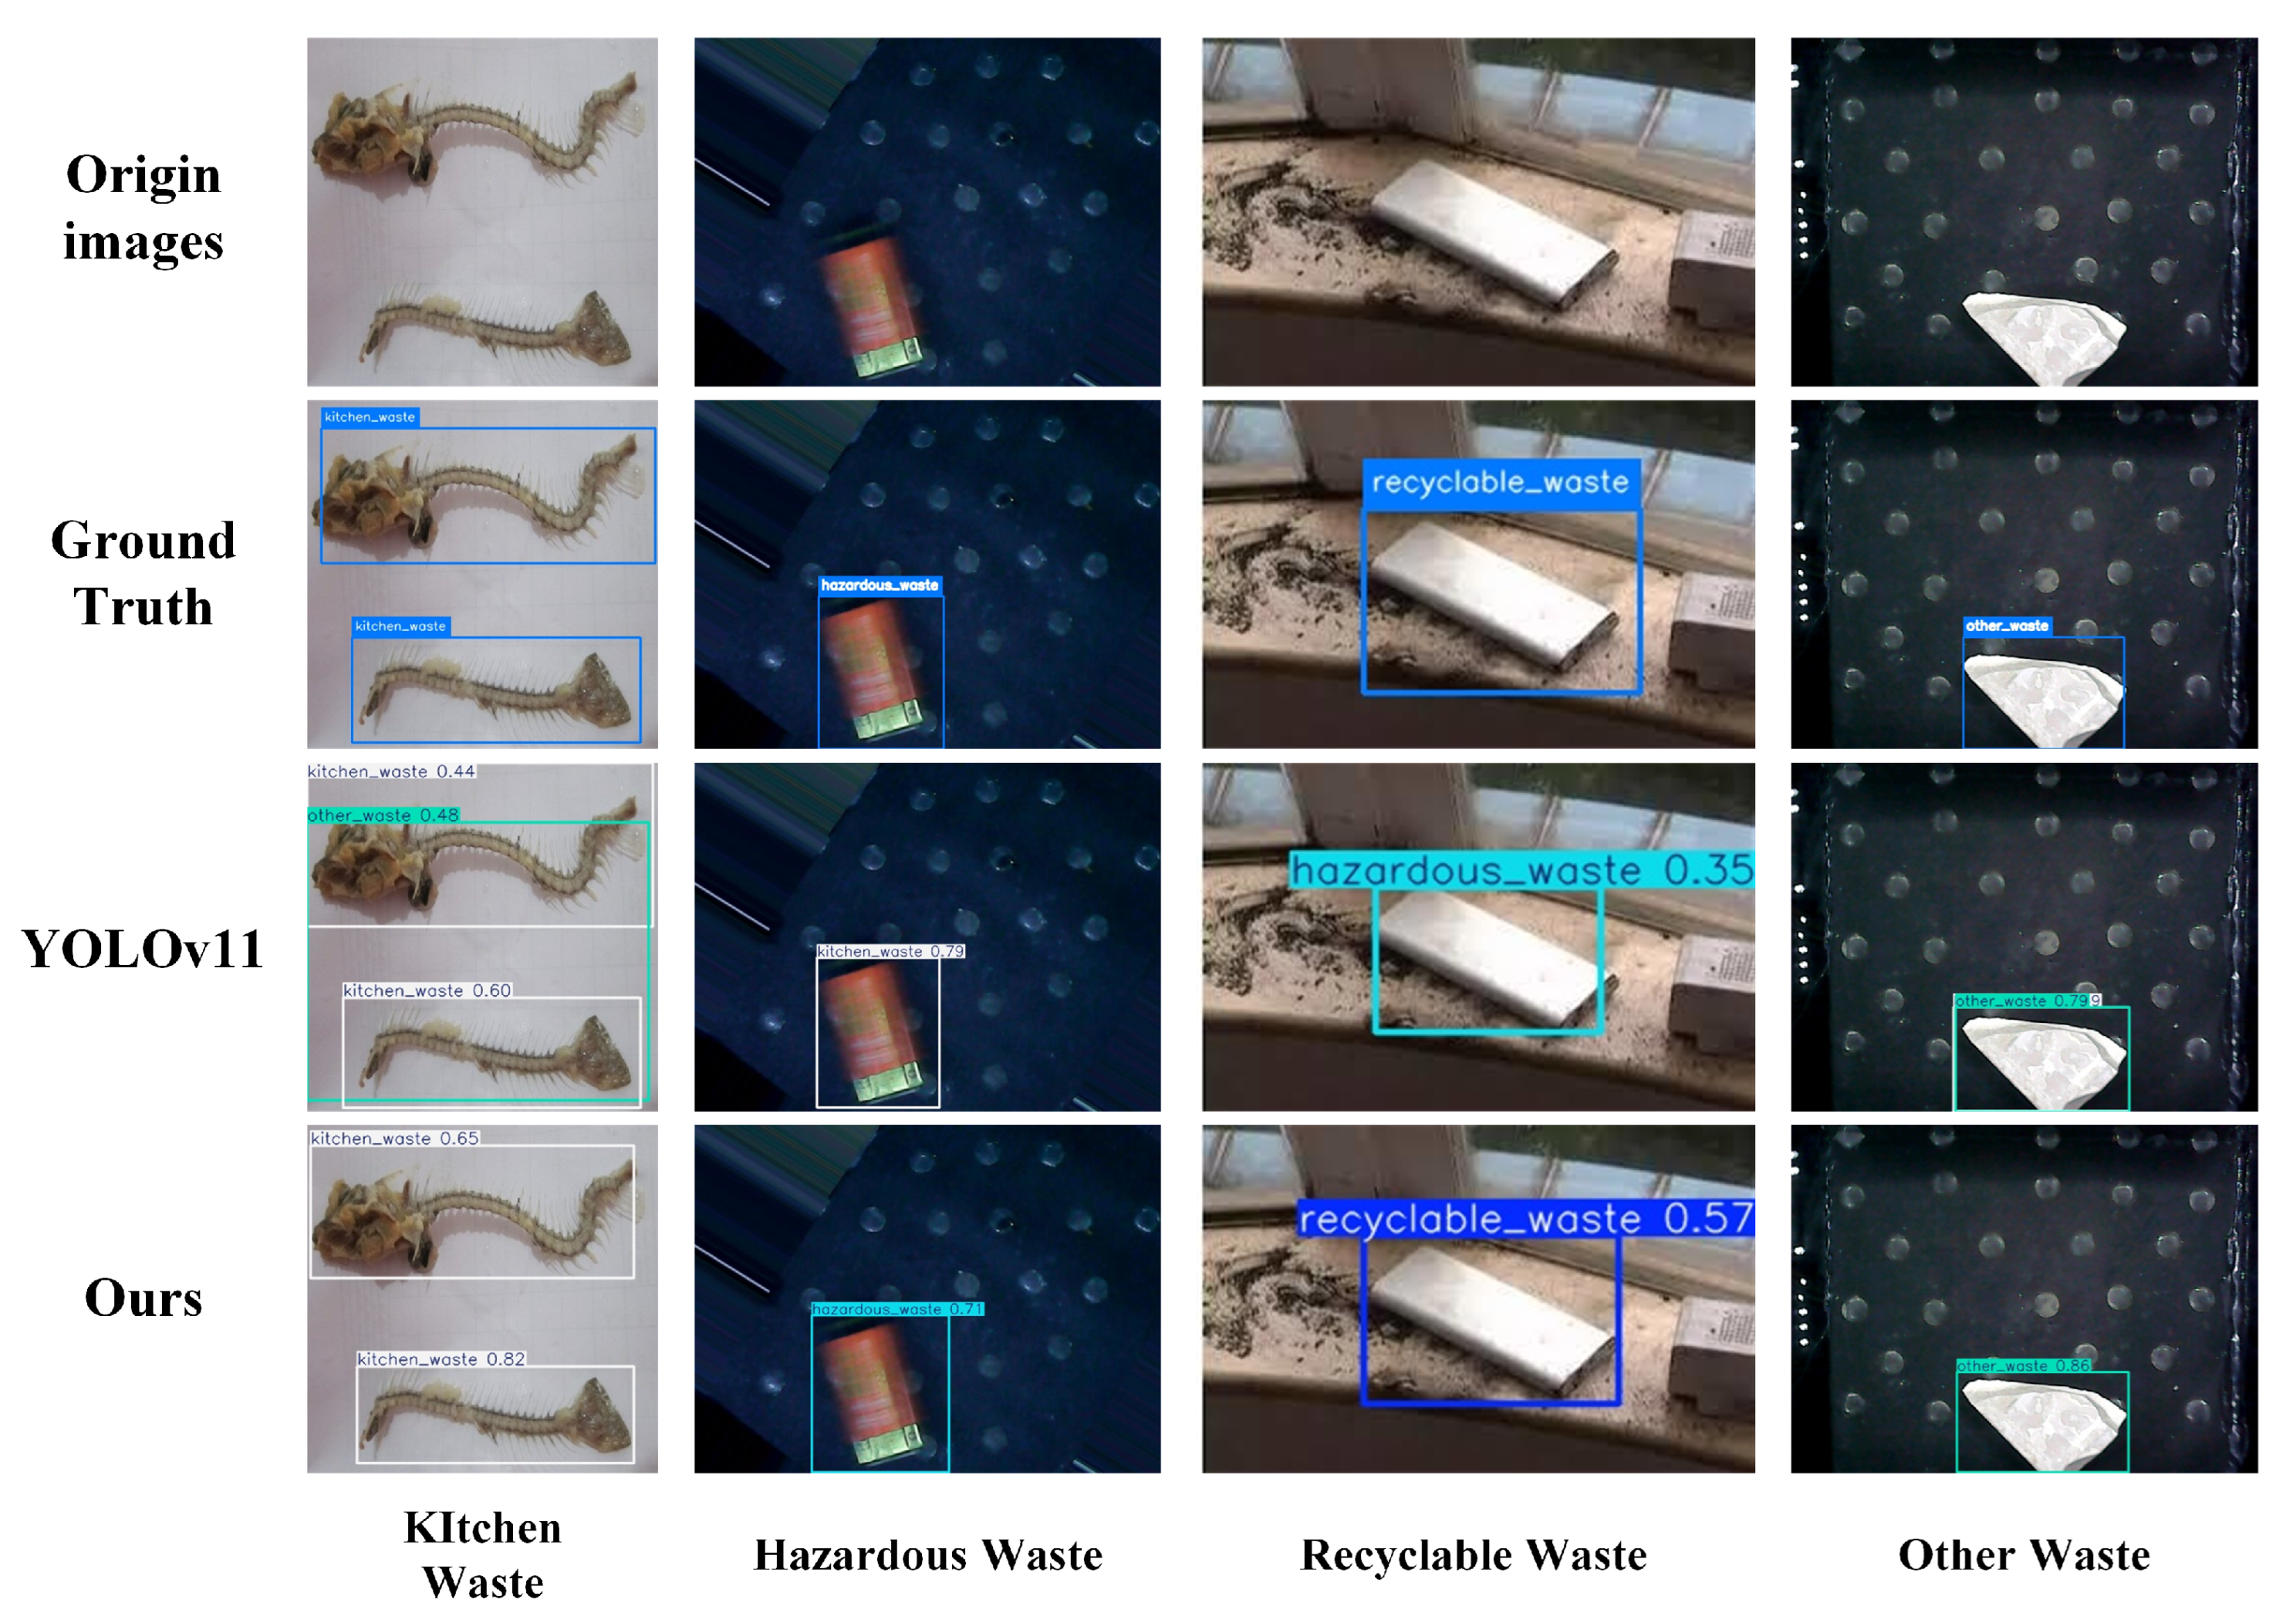
The qualitative detection results of YOLOv11 and FLEX-YOLO are presented in Figure 16. In addition to successful detection examples, representative failure cases of YOLOv11 are included to provide a more comprehensive comparison. As shown in the figure, YOLOv11 produces several incorrect or redundant predictions and misclassifies some waste objects, such as confusing hazardous waste with kitchen waste and recyclable waste with hazardous waste. In comparison, FLEX-YOLO correctly identifies these objects in the corresponding examples and provides more consistent detection results.
Figure 16.
Comparison of detection results between YOLOv11 and FLEX-YOLO on the Waste4 dataset.
4.8. Experiments on the TDD Dataset
To further evaluate the performance of FLEX-YOLO on a different waste detection dataset, additional experiments were conducted on the publicly available Trash Detection Dataset (TDD) provided by Kan et al. [38]. The dataset contains six waste categories, including biodegradable waste, cardboard, glass, metal, paper, and plastic. Compared with the dataset used in the main experiments, TDD contains different waste categories and image characteristics, providing an additional evaluation setting for the proposed model.
The experimental results are presented in Table 8. YOLOv11 achieves a Precision of 68.2%, Recall of 51.6%, mAP@50 of 57.1%, and mAP@50–95 of 38.4%, whereas FLEX-YOLO achieves 69.7%, 54.4%, 59.3%, and 40.3%, respectively, corresponding to improvements of 1.5, 2.8, 2.2, and 1.9 percentage points. Meanwhile, FLEX-YOLO reduces the parameter count from 2.6 M to 1.9 M, although the computational cost increases from 6.4 to 8.5 GFLOPs. These results indicate that the proposed modifications can also provide performance improvements on the TDD dataset, with higher detection accuracy and a reduced parameter count, although at a higher computational cost.
Table 8.
Detection performance on the TDD dataset.
4.9. Deployment
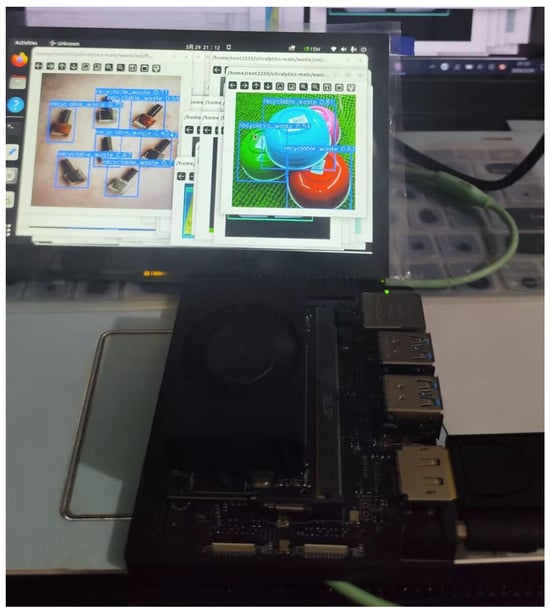
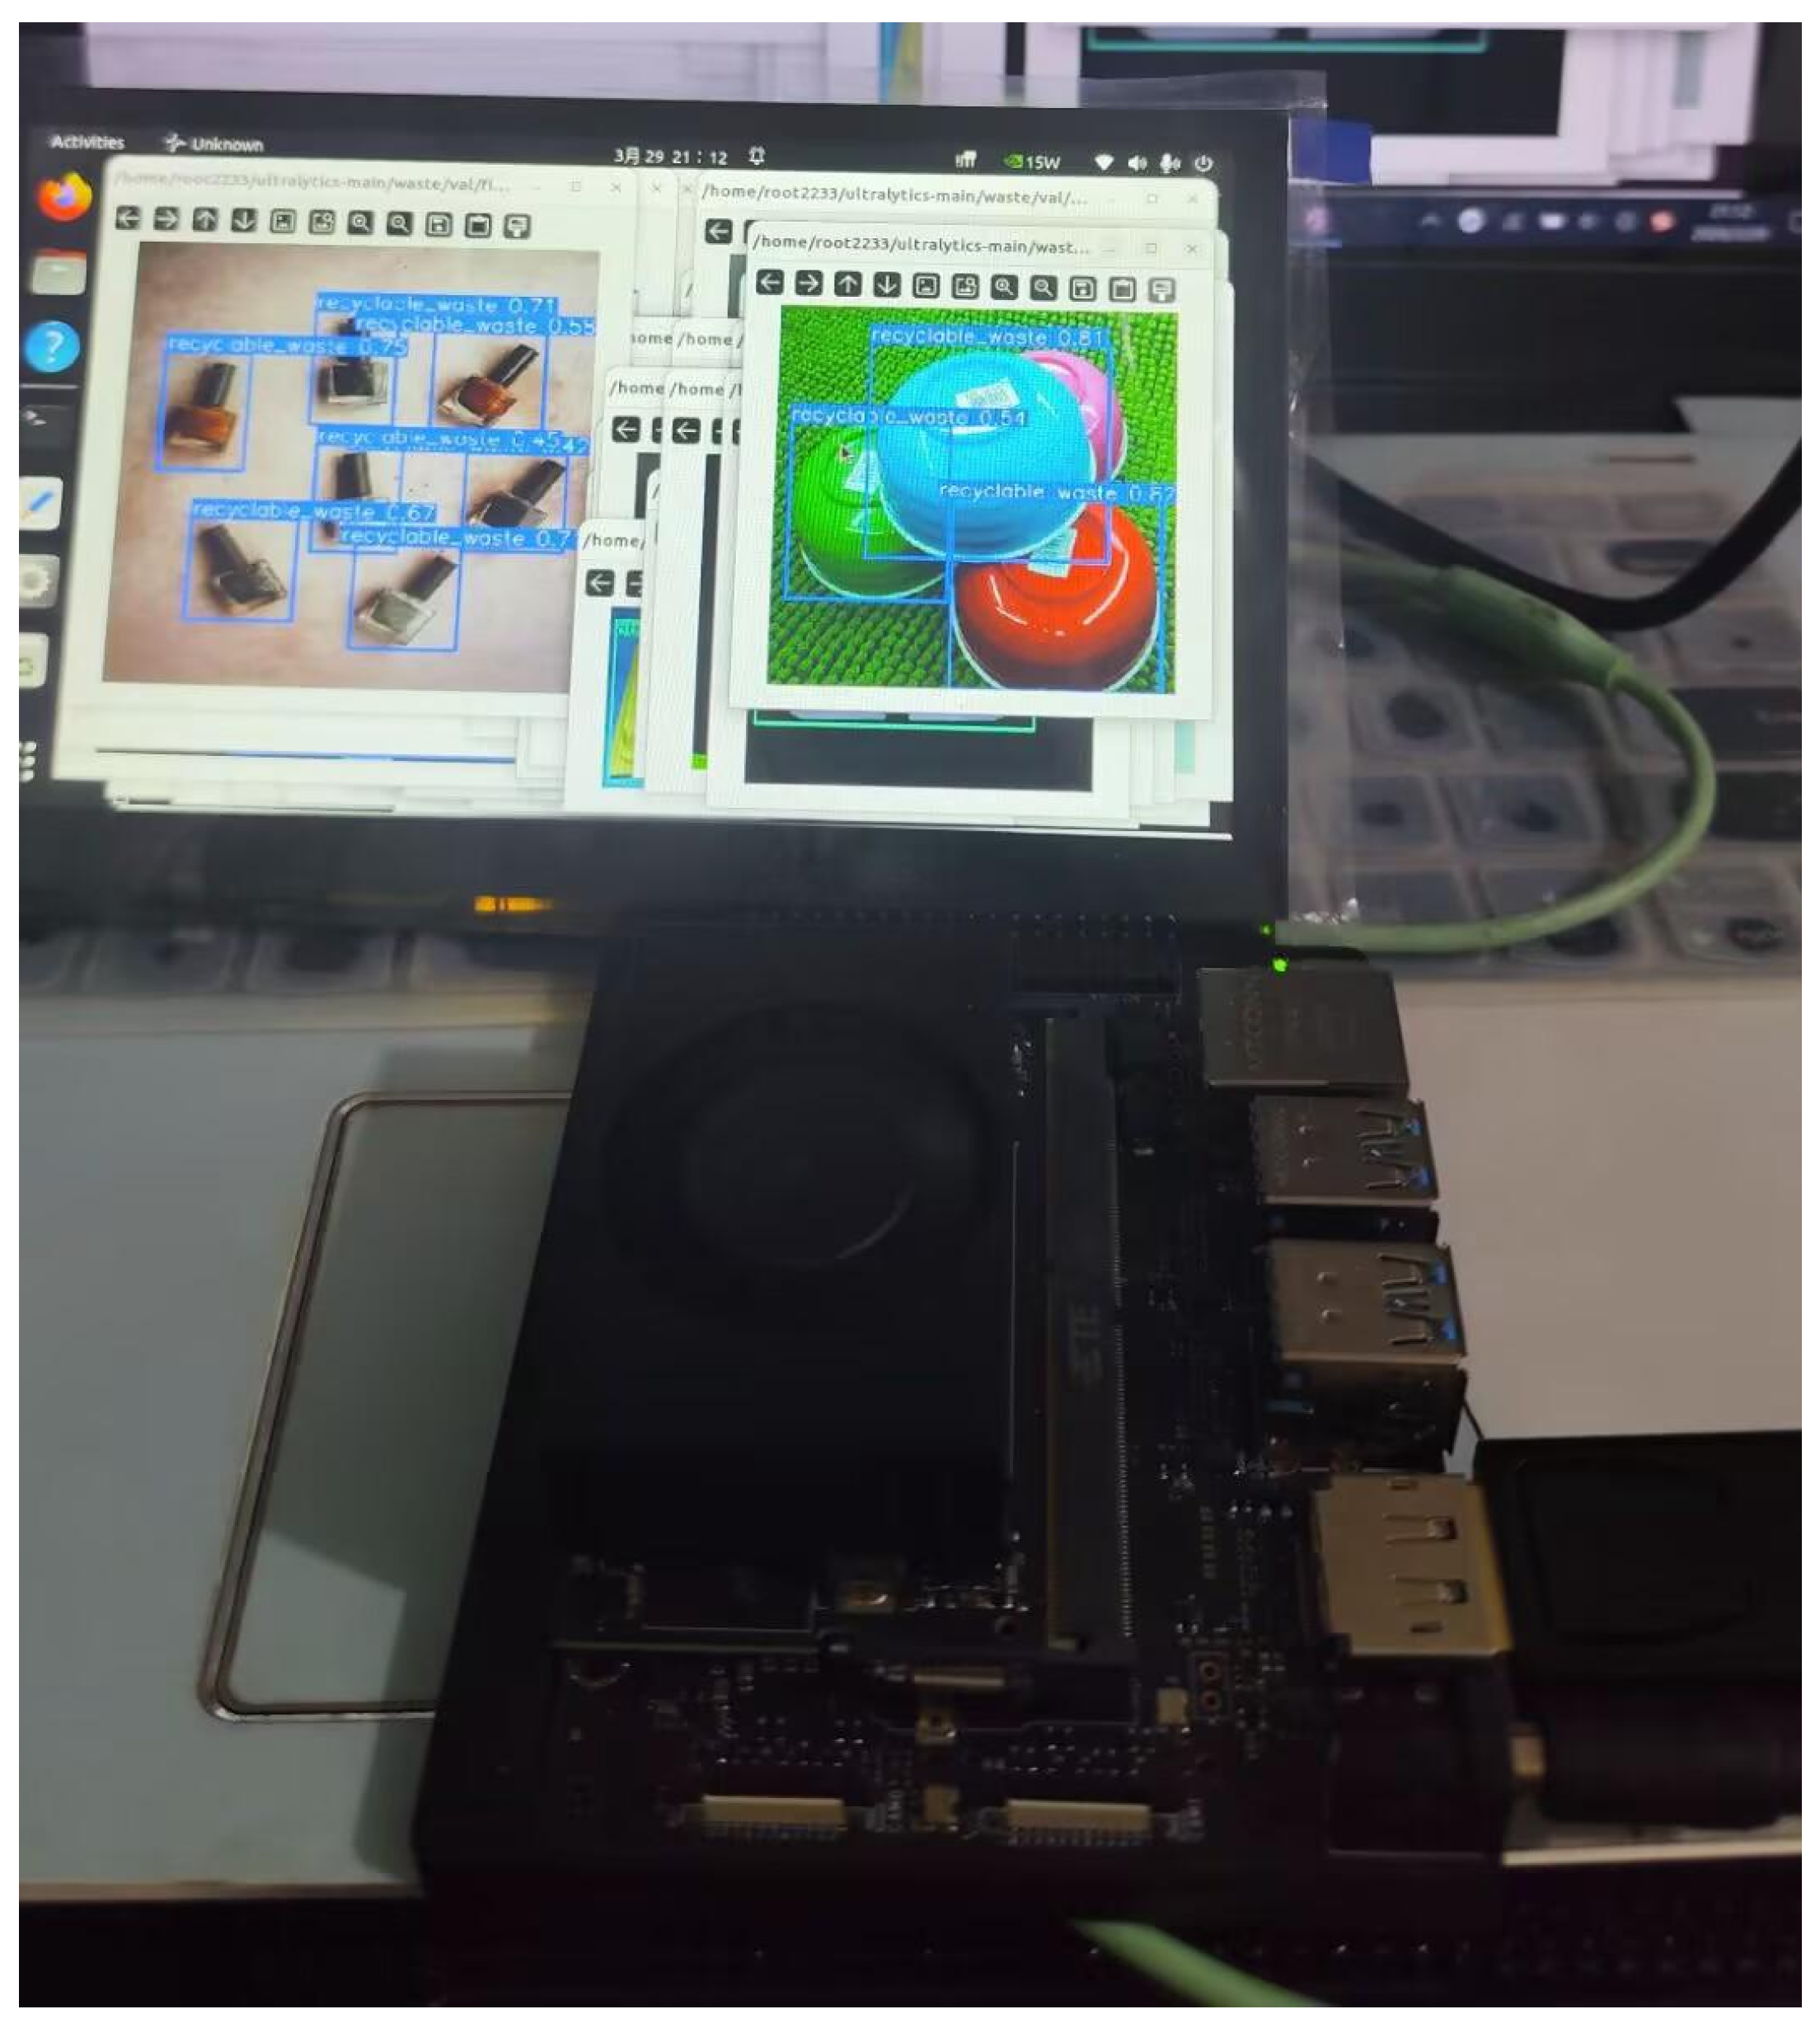
To validate the practical applicability of FLEX-YOLO in resource-constrained environments, the proposed model is deployed on the NVIDIA Jetson Orin Nano platform and Android devices. For edge deployment, the trained FLEX-YOLO model is first converted into the ONNX format and subsequently optimized using TensorRT with FP16 precision. After acceleration, the model achieves an inference speed of 86 FPS on the Jetson Orin Nano platform, demonstrating its real-time inference capability for waste detection applications, as shown in Figure 17.
Figure 17.
Real-time deployment results of FLEX-YOLO on the NVIDIA Jetson Orin Nano platform.
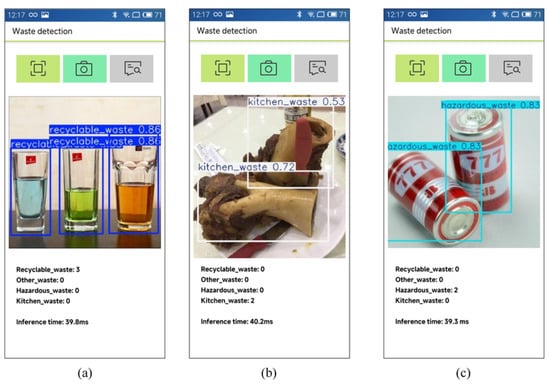
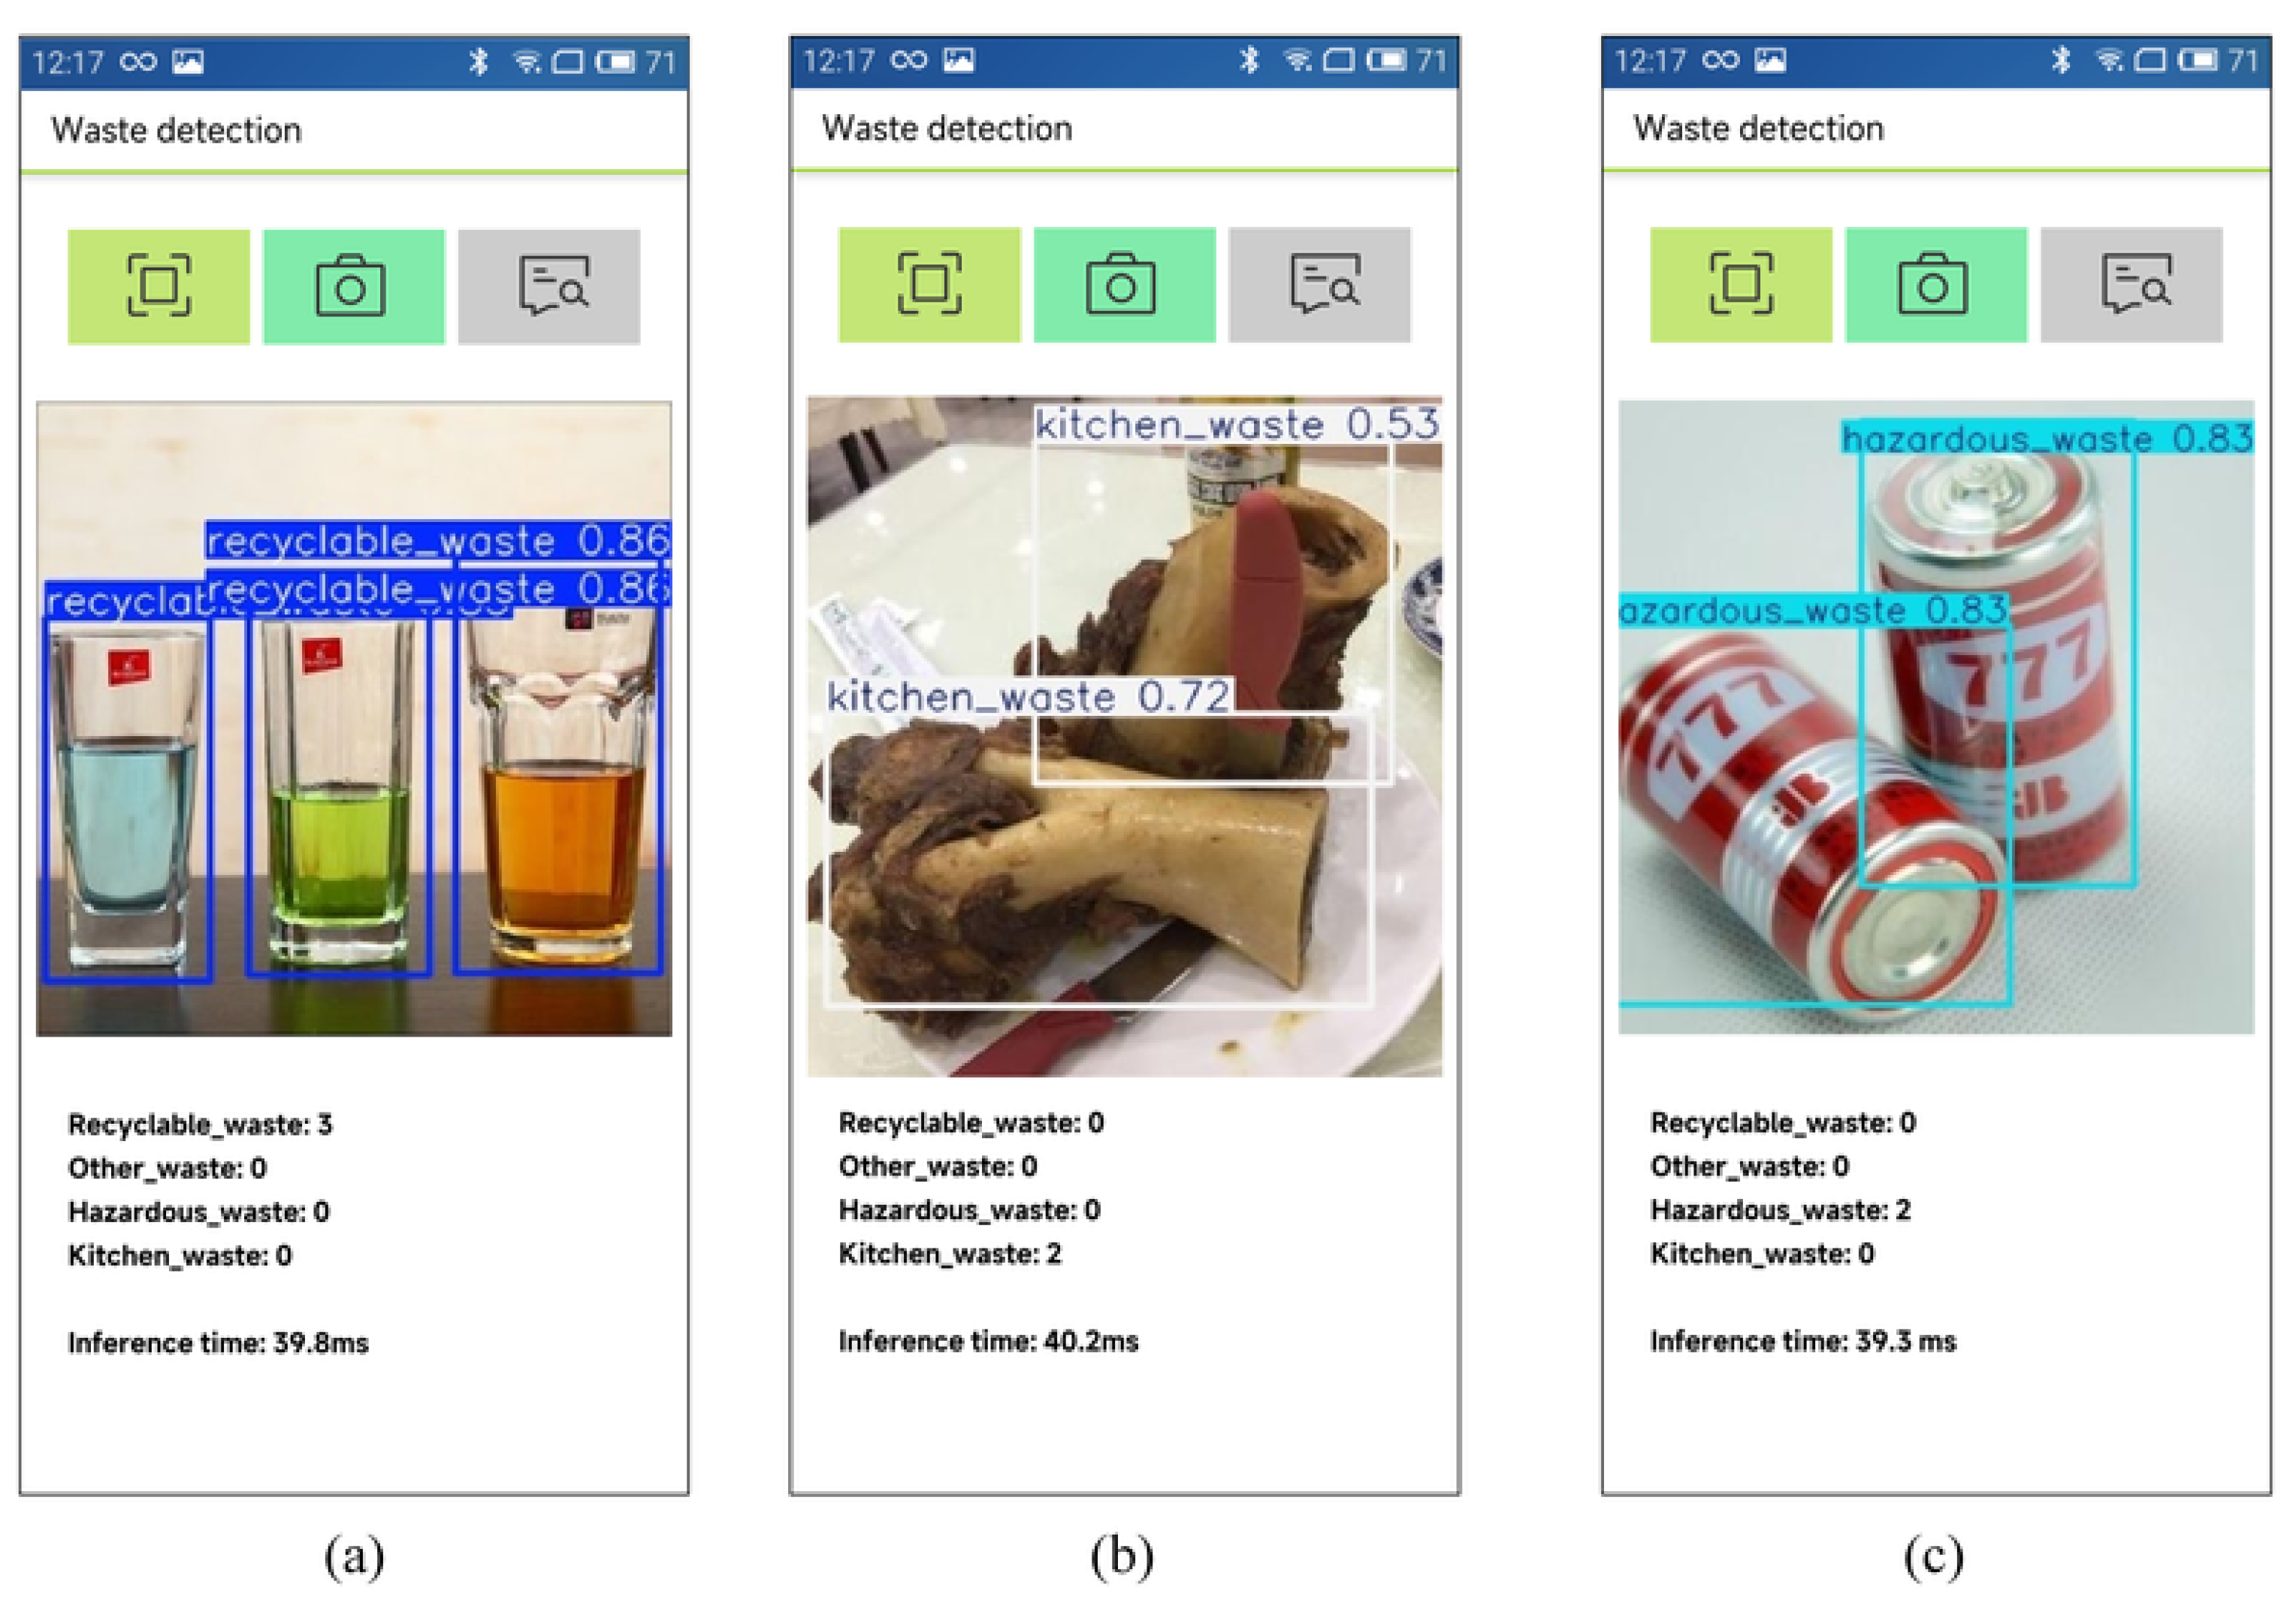
To further evaluate the portability of the proposed model, FLEX-YOLO is deployed on Android devices using the ncnn inference framework with FP32 precision. The optimized model achieves a stable inference speed of approximately 25 FPS on mobile devices. The Android deployment interface and representative detection results are presented in Figure 18, further confirming the cross-platform applicability of the proposed framework.
Figure 18.
Android application interface based on ncnn for FLEX-YOLO waste detection: (a) recyclable waste detection, (b) kitchen waste detection, and (c) hazardous waste detection.
4.10. Discussion
The experimental results demonstrate that FLEX-YOLO achieves a favorable balance between detection accuracy and computational efficiency. The improvements mainly benefit from the collaborative design of multi-scale feature fusion, enhanced feature representation, task-aligned detection, and attention optimization. The proposed modules effectively improve the model’s ability to detect waste objects with different scales and complex backgrounds while maintaining a lightweight architecture, which is important for practical edge deployment scenarios.
Although FLEX-YOLO achieves promising performance, some limitations remain. First, Waste4 is divided into training, validation, and testing subsets using image-level random partitioning. Although the same split is used for all compared models to ensure a consistent evaluation setting, this strategy may place images with similar scene or acquisition characteristics in different subsets and therefore may not fully reflect generalization to unseen scenarios. The additional evaluation on the TDD dataset provides complementary evidence of cross-dataset performance, but does not eliminate this limitation. Although FLEX-YOLO has been evaluated on both the Waste4 and TDD datasets, the scale and diversity of the current datasets remain limited. Further validation on larger-scale datasets with more diverse environmental conditions and using scene-disjoint or source-aware data splits is still required to provide a more comprehensive evaluation of the proposed method. Future research will explore more efficient model compression strategies and multimodal information fusion to further enhance deployment efficiency and robustness in real-world waste detection applications.
5. Conclusions
This study proposed FLEX-YOLO, a lightweight waste detection framework designed for accurate and efficient detection in complex environments. By integrating multi-scale feature fusion, local–global feature modeling, task-aligned detection, and attention refinement, FLEX-YOLO improves feature representation while maintaining a compact model structure. Experimental results on the Waste4 dataset show that FLEX-YOLO achieves 97.0% mAP@50 and 74.0% mAP@50–95, improving the baseline YOLOv11 by 3.5 and 3.8 percentage points, respectively, while reducing the number of parameters from 2.6 M to 1.9 M. Additional experiments on the TDD dataset show that FLEX-YOLO achieves 59.3% mAP@50 and 40.3% mAP@50–95, exceeding YOLOv11 by 2.2 and 1.9 percentage points, respectively. Deployment on NVIDIA Jetson Orin Nano and Android platforms further demonstrates its real-time inference capability and practical applicability in resource-constrained environments. Nevertheless, although FLEX-YOLO has been evaluated on two waste detection datasets, the scale and diversity of the current evaluation remain limited. Future work will therefore consider broader validation scenarios and further investigate model optimization techniques, including pruning, quantization, and knowledge distillation, to reduce computational overhead and improve deployment efficiency across different edge devices.
Author Contributions
Conceptualization, S.T.; methodology, J.W.; software, J.W. and S.L.; validation, G.L.; investigation, G.L.; resources, G.L.; data curation, J.W. and S.L.; writing—original draft preparation, J.W.; writing—review and editing, S.T.; visualization, S.L.; supervision, S.T.; project administration, S.T.; funding acquisition, J.W. All authors have read and agreed to the published version of the manuscript.
Funding
This research was funded by the Scientific Research Program of Hubei Provincial Department of Education (grant number B2023417), and the Hubei Province First-Class Undergraduate Course Construction Project.
Institutional Review Board Statement
Not applicable.
Informed Consent Statement
Not applicable.
Data Availability Statement
The data presented in this study are available on request from the corresponding author.
Conflicts of Interest
The authors declare no conflict of interest.
References
- The World Counts. World Waste Facts. 2025. Available online: https://www.theworldcounts.com/challenges/planet-earth/state-of-the-planet/world-waste-facts (accessed on 20 June 2026).
- Landfill Solutions. Did You Know? In 2050, the World Will Generate 3.4 Billion Tonnes of Waste per Year. 2021. Available online: https://landfillsolutions.eu/did-you-know-the-world-will-generate-3-4-billion-tonnes-of-waste-per-year-in-2050/ (accessed on 20 June 2026).
- Lu, M.; Zhou, C.; Wang, C.; Jackson, R.B.; Kempes, C.P. Worldwide scaling of waste generation in urban systems. Nat. Cities 2024, 1, 126–135. [Google Scholar] [CrossRef] [Scilit]
- Gautam, K.; Pandey, N.; Yadav, D.; Parthasarathi, R.; Turner, A.; Anbumani, S.; Jha, A.N. Ecotoxicological impacts of landfill sites: Towards risk assessment, mitigation policies and the role of artificial intelligence. Sci. Total Environ. 2024, 927, 171804. [Google Scholar] [CrossRef] [Scilit]
- Abubakar, I.R.; Maniruzzaman, K.M.; Dano, U.L.; AlShihri, F.S.; AlShammari, M.S.; Ahmed, S.M.S.; Al-Gehlani, W.A.G.; Alrawaf, T.I. Environmental sustainability impacts of solid waste management practices in the global South. Int. J. Environ. Res. Public Health 2022, 19, 12717. [Google Scholar] [CrossRef] [Scilit]
- Wang, J.; Qiao, Z. A comprehensive review of landfill leachate treatment technologies. Front. Environ. Sci. 2024, 12, 1439128. [Google Scholar] [CrossRef] [Scilit]
- Nallapaneni, M.K.; Hait, S.; Priya, A.; Bohra, V. From trash to treasure: Unlocking the power of resource conservation, recycling, and waste management practices. Sustainability 2023, 15, 13863. [Google Scholar] [CrossRef] [Scilit]
- Chen, H.; Zhao, G.; Ramzan, M. The path to environmental sustainability: How circular economy, natural capital, and structural economic changes shape greenhouse gas emissions in Germany. Sustainability 2025, 17, 5982. [Google Scholar] [CrossRef] [Scilit]
- Moshkal, M.; Akhapov, Y.; Ogihara, A. Sustainable waste management in Japan: Challenges, achievements, and future prospects: A review. Sustainability 2024, 16, 7347. [Google Scholar] [CrossRef] [Scilit]
- Awino, F.B.; Apitz, S.E. Solid waste management in the context of the waste hierarchy and circular economy frameworks: An international critical review. Integr. Environ. Assess. Manag. 2024, 20, 9–35. [Google Scholar] [CrossRef] [Scilit]
- Kong, Y.; Zhang, J.; Zhang, X.; Gao, X.; Yin, J.; Wang, G.; Li, J.; Li, G.; Cui, Z.; Yuan, J. Applicability and limitation of compost maturity evaluation indicators: A review. Chem. Eng. J. 2024, 489, 151386. [Google Scholar] [CrossRef] [Scilit]
- Hamidinasab, B.; Nabavi-Pelesaraei, A. Systematic review on environmental impact assessment of incineration technologies. Energy Convers. Manag. X 2025, 101039. [Google Scholar] [CrossRef] [Scilit]
- Fang, B.; Yu, J.; Chen, Z.; Osman, A.I.; Farghali, M.; Ihara, I.; Hamza, E.H.; Rooney, D.W.; Yap, P.-S. Artificial intelligence for waste management in smart cities: A review. Environ. Chem. Lett. 2023, 21, 1959–1989. [Google Scholar] [CrossRef] [Scilit]
- Lu, W.; Chen, J. Computer vision for solid waste sorting: A critical review of academic research. Waste Manag. 2022, 142, 29–43. [Google Scholar] [CrossRef] [Scilit]
- Tie, J.; Zhu, C.; Zheng, L.; Wang, H.; Ruan, C.; Wu, M.; Xu, K.; Liu, J. LSKA-YOLOv8: A lightweight steel surface defect detection algorithm based on YOLOv8 improvement. Alex. Eng. J. 2024, 109, 201–212. [Google Scholar] [CrossRef] [Scilit]
- Fotovvatikhah, F.; Ahmedy, I.; Noor, R.M.; Munir, M.U. A systematic review of AI-based techniques for automated waste classification. Sensors 2025, 25, 3181. [Google Scholar] [CrossRef] [Scilit]
- Lu, Z.; Zhu, C.; Liu, L.; Yang, Y.; Wang, J.; Xia, W.; Xu, K.; Tie, J. Star-YOLO: A lightweight and efficient model for weed detection in cotton fields using advanced YOLOv8 improvements. Comput. Electron. Agric. 2025, 235, 110306. [Google Scholar] [CrossRef] [Scilit]
- Chhabra, M.; Sharan, B.; Elbarachi, M.; Kumar, M. Intelligent waste classification approach based on improved multi-layered convolutional neural network. Multimed. Tools Appl. 2024, 83, 84095–84120. [Google Scholar] [CrossRef] [Scilit]
- Ahmed, M.I.B.; Alotaibi, R.B.; Al-Qahtani, R.A.; Al-Qahtani, R.S.; Al-Hetela, S.S.; Al-Matar, K.A.; Al-Saqer, N.K.; Rahman, A.; Saraireh, L.; Youldash, M.; et al. Deep learning approach to recyclable products classification: Towards sustainable waste management. Sustainability 2023, 15, 11138. [Google Scholar] [CrossRef] [Scilit]
- Arayakandy, A.; Gupta, A.; Thakur, R. Design and development of classification model for recyclability status of trash using SVM. Int. J. Res. Appl. Sci. Eng. Technol. 2019, 7, 2146–2150. [Google Scholar] [CrossRef] [Scilit]
- Yaqing, G.; Ge, B. Research on lightweight convolutional neural network in garbage classification. IOP Conf. Ser. Earth Environ. Sci. 2021, 781, 032011. [Google Scholar] [CrossRef] [Scilit]
- Li, S.; Yan, M.; Xu, J. Garbage object recognition and classification based on Mask Scoring RCNN. In Proceedings of the 2020 International Conference on Culture-Oriented Science & Technology (ICCST), Beijing, China, 28–31 October 2020; pp. 54–58. [Google Scholar]
- Dipo, M.H.; Farid, F.A.; Mahmud, M.S.A.; Momtaz, M.; Rahman, S.; Uddin, J.; Karim, H.A. Real-time waste detection and classification using YOLOv12-based deep learning model. Digital 2025, 5, 19. [Google Scholar] [CrossRef] [Scilit]
- Abo-Zahhad, M.M.; Abo-Zahhad, M. Real-time intelligent garbage monitoring and efficient collection using YOLOv8 and YOLOv5 deep learning models for environmental sustainability. Sci. Rep. 2025, 15, 16024. [Google Scholar] [CrossRef] [Scilit]
- Wang, A.; Jiao, H.; Chen, Z.; Yang, J. An improved YOLO-based waste detection model and its integration to robotic gripping systems. Comput. Mater. Contin. 2025, 84, 5773–5790. [Google Scholar] [CrossRef] [Scilit]
- Zheng, L.; Zhu, C.; Li, Y.; Xu, L.; Ruan, M.; Wu, M.; Ruan, C.; Tie, J. A lightweight steel surface defect detection model for automotive manufacturing production lines. Eng. Appl. Artif. Intell. 2026, 175, 114601. [Google Scholar] [CrossRef] [Scilit]
- Zheng, D.; Wang, R.; Duan, Y.; Pang, P.C.-I.; Tan, T. Focus-RCNet: A lightweight recyclable waste classification algorithm based on focus and knowledge distillation. Vis. Comput. Ind. Biomed. Art 2023, 6, 19. [Google Scholar] [CrossRef] [Scilit]
- Li, P.; Xu, J.; Liu, S. Solid waste detection using enhanced YOLOv8 lightweight convolutional neural networks. Mathematics 2024, 12, 2185. [Google Scholar] [CrossRef] [Scilit]
- Cai, X.; Shuang, F.; Sun, X.; Duan, Y.; Cheng, G. Towards lightweight neural networks for garbage object detection. Sensors 2022, 22, 7455. [Google Scholar] [CrossRef] [Scilit]
- Xia, Z.; Zhou, H.; Yu, H.; Hu, H.; Zhang, G.; Hu, J.; He, T. YOLO-MTG: A lightweight YOLO model for multi-target garbage detection. Signal Image Video Process. 2024, 18, 5121–5136. [Google Scholar] [CrossRef] [Scilit]
- Sun, G.; Zhang, F. DRSE-YOLO: Efficient and lightweight architecture for accurate waste detection. IET Image Process. 2025, 19, e70022. [Google Scholar] [CrossRef] [Scilit]
- Sun, S.; Zheng, S.; Xu, X.; He, Z. GD-YOLO: A lightweight model for household waste image detection. Expert Syst. Appl. 2025, 279, 127525. [Google Scholar] [CrossRef] [Scilit]
- Tan, M.; Pang, R.; Le, Q.V. EfficientDet: Scalable and efficient object detection. In Proceedings of the IEEE/CVF Conference on Computer Vision and Pattern Recognition, Seattle, WA, USA, 13–19 June 2020; pp. 10781–10790. [Google Scholar]
- Li, S.; Wang, Z.; Liu, Z.; Tan, C.; Lin, H.; Wu, D.; Chen, Z.; Zheng, J.; Li, S.Z. MogaNet: Multi-order Gated Aggregation Network. In Proceedings of the Twelfth International Conference on Learning Representations (ICLR), Vienna, Austria, 7–11 May 2024. [Google Scholar]
- Ouyang, D.; He, S.; Zhang, G.; Luo, M.; Guo, H.; Zhan, J.; Huang, Z. Efficient Multi-Scale Attention Module with Cross-Spatial Learning. In Proceedings of the IEEE International Conference on Acoustics, Speech and Signal Processing (ICASSP), Rhodes, Greece, 4–10 June 2023; pp. 1–5. [Google Scholar]
- Ultralytics. Model Training with Ultralytics YOLO. Available online: https://docs.ultralytics.com/modes/train/ (accessed on 20 June 2026).
- Padilla, R.; Netto, S.L.; Da Silva, E.A.B. A survey on performance metrics for object-detection algorithms. In Proceedings of the 2020 International Conference on Systems, Signals and Image Processing (IWSSIP), Bratislava, Slovakia, 2–4 June 2020; pp. 237–242. [Google Scholar]
- Kan, P. Trash Detection Dataset, V1; Mendeley Data. 2025. Available online: https://data.mendeley.com/datasets/z732f9pwxt/1 (accessed on 18 September 2026). [CrossRef]





Disclaimer/Publisher’s Note: The statements, opinions and data contained in all publications are solely those of the individual author(s) and contributor(s) and not of MDPI and/or the editor(s). MDPI and/or the editor(s) disclaim responsibility for any injury to people or property resulting from any ideas, methods, instructions or products referred to in the content. |
© 2026 by the authors. Licensee MDPI, Basel, Switzerland. This article is an open access article distributed under the terms and conditions of the Creative Commons Attribution (CC BY) license.