


Abstract
Designers may use learner personas to plan different content, feedback, or support for groups of students, but a clustering result alone does not establish that these groups represent distinct learner types. Whether such a categorical structure exists in the data deriving those personas is rarely tested. This paper therefore proposes an uncertainty-aware fuzzy learner-modeling framework in which fuzzy partitioning serves as a diagnostic instrument rather than as a means of generating learner types. The study applies the framework to six learning-attitude constructs measured in three undergraduate cohorts taking AI-supported courses at a Taiwanese university of technology (N = 107; 90 retained after response-quality screening). It estimates fuzzy c-means partitions for two to five clusters at the primary fuzzifier value m = 2.0, with the two- and three-cluster solutions re-estimated at m = 1.5 and m = 2.5 as sensitivity checks. The two-cluster solution is stable (adjusted Rand index = 0.891) and reasonably crisp, yet all centroids differ only in overall level. Elevation accounts for 71.0% of the standardized variance, clustering the shape component alone is uninformative, and the structural criterion consequently fails. The construct with the lowest within-person centered standardized score relates to cohort (Monte Carlo p = 0.009), but no statistically significant association with modal cluster membership is detected (Monte Carlo p = 0.240). These findings insufficiently support distinct configural learner personas in this sample, using this instrument and these six constructs. The paper contributes to debates on person-centered learner modeling by specifying a diagnostic sequence that examines profile shape before interpreting stable, concentrated fuzzy partitions as learner personas. The support-priority vector remains an exploratory description of within-person score contrasts; its instructional value has not been tested.
1. Introduction
Artificial intelligence (AI)-supported higher education refers to many different instructional settings. This research appraises three undergraduate cohorts at one Taiwanese university of technology whose regular courses include AI-supported learning activities. We examine their self-reported learning-attitude scores to see whether the observed patterns warrant representing learners as distinct personas. AI-tool use, interaction, and usage intensity are not measured, and so, the analysis does not evaluate a particular platform or the effects of AI use. Research on AI in higher education includes learner profiling and adaptive systems, but the evidence used to justify learner representations remains an important question [1]. Reviews document the breadth of AI applications in higher education and the growing evidence in ChatGPT-supported learning [2,3]. These findings provide context for the present study, which does not measure AI-tool use or learning outcomes.
The terms in this paper require distinction. Personalized learning refers to the broad tailoring of instruction or support to learner characteristics, whereas adaptive learning refers to adjustments in content, sequence, or feedback made in response to a learner model [4,5]. Person-centered learner modeling examines learners’ joint patterns across several indicators [6,7]. A learner profile is a person’s score pattern, or a group prototype, across those indicators; it is descriptive and does not by itself establish a category. We use learner type for a proposed group with a substantively distinct configuration and persona for a named representation of such a group used in instructional design. Data-driven persona research often constructs these representations through clustering [8]. These working definitions separate an algorithm’s descriptive output from the claim that distinct learner types have been identified, which is the claim this study examines.
A common representation in person-centered learner modeling is learner type. Students are often sorted into a small number of named groups—for example, self-regulated and strategic, motivated yet disorganized, or disengaged. Instructional support is then attached to each label. The appeal is obvious. Types are communicable, fit the vocabulary of user-centered design, and translate directly into interface logic and branching rules. Methodologically, they are usually produced by person-centered techniques such as latent profile analysis or k-means clustering, which are designed to locate subpopulations that differ in their configurations across a set of indicators [6,7]. Person-centered research has also identified self-regulated learning profiles among university students in online courses [9]. Whether an estimated profile solution reflects distinct configurations, however, remains a question that must be examined in the data at hand.
The literature recognizes two concerns about learner types. The first one is overlapping membership: assigning a learner one label can conceal graded affiliation. Educational studies have used fuzzy clustering to retain membership degrees when grouping students by preferences and academic potential [10] and examining profiles in project-based learning [11]. The second concern is the distinction between overall profile level and profile shape. Morin and Marsh [12] and Morin et al. [13] examined this distinction directly in model-based, person-centered analyses, while guidance on person-centered analysis cautions that extracted groups require substantive interpretation and further validation [7]. Research on data-driven personas also has documented the use of clustering to construct user archetypes [8]. These studies provide the foundations for the present analysis; neither fuzzy membership nor the level-shape distinction are claimed as novel in this paper.
The present study addresses a practical diagnostic question: whether the partitions recovered from a given learner dataset support a persona-based interpretation. It integrates an examination of profile shape, membership concentration, and resampling stability in one workflow. This distinguishes the proposed application from using fuzzy clustering primarily to generate and describe learner groups. A stable partition with concentrated memberships may still reflect differences in overall level rather than distinct configurations across constructs. The rationale for combining these checks is that each one addresses a different requirement for interpreting a partition as learner personas. Shape analysis asks whether the groups differ in their configurations rather than only in overall score level. The degrees of membership indicate whether a learner is strongly associated with one cluster or has substantial membership in several clusters, while bootstrap resampling assesses the partition’s stability within the observed sample. A partition may appear stable and have concentrated memberships while showing no meaningful shape differences. Examining all three therefore helps determine when a persona interpretation should be withheld. It does not establish that the resulting representation improves adaptive support.
The present study takes up both concerns in a single design. AI-supported learning denotes the course context in this study. The analysis does not include AI-tool use, interaction patterns, usage intensity, and behavior. The findings therefore concern self-reported learning-attitude profiles in these courses and do not establish AI-specific learner types or effects of AI use. The study collects survey data on six learning-attitude constructs (academic self-concept, learning desire, learning strategies, learning planning, habitual regulation, and learning-process engagement) from three undergraduate cohorts taking AI-supported courses at a Taiwanese university of technology. Fuzzy c-means partitions are estimated for two to five clusters at the primary fuzzifier value m = 2.0, with the two- and three-cluster solutions re-estimated at m = 1.5 and m = 2.5 as sensitivity checks. Partition stability is assessed by bootstrap resampling. The elevation and shape components of each learner’s profile are separated and clustered independently, and a person-level representation of relative strengths and weaknesses is derived and tested against profile membership.
This study illustrates a diagnostic sequence for evaluating learner-persona claims using established methods. In this sample, the sequence shows that a stable fuzzy partition can fail to reveal distinct profile configurations. It does not demonstrate an advantage over simpler overall-score analyses; the usefulness of the sequence across other datasets requires further testing.
The rest of the paper runs as follows. Section 2 develops the theoretical background and states the proposed framework. Section 3 describes the participants, measures, screening procedure, and analytical strategy. Section 4 reports the results. Section 5 discusses their implications for learner modeling and adaptive system design. Section 6 concludes the paper.
2. Theoretical Background
2.1. Learning Attitudes in AI-Supported Course Contexts
The self-regulated learning literature has established accounts of learners’ monitoring, planning, and strategy use [14]. The six constructs examined in this paper describe students’ reported perceptions, motivation, strategies, planning, habits, and engagement. They conceptually relate to self-regulated learning, but this relationship does not establish that the instrument comprehensively measures self-regulation or AI-specific learning behavior. Their role in this study is to provide a multidimensional set of self-reported indicators for examining learner-profile structure.
The analysis asks whether differences across these indicators primarily reflect overall level or distinct configurations. The constructs are sufficient to define this descriptive question, provided that their measurement properties and limitations are considered. They cannot establish how students interact with AI tools, how intensively they use them, or whether AI changes their regulation or engagement.
AI-supported learning therefore identifies the instructional setting rather than an explanatory variable. The framework is illustrated using learning-attitude data from that setting. Its relevance to AI-based adaptation is a proposed application requiring behavioral evidence and independent evaluation.
2.2. User-Centered Learner Modeling
In adaptive systems, the learner model is the object on which adaptation operates. A systematic review of learner modeling has identified six broad categories of modeled characteristics and catalogued the techniques used to infer them. It notes that the field has grown substantially while remaining fragmented in what it chooses to represent [15]. Representation is a design decision, not a neutral summary of data, and constrains what an adaptive system can subsequently do.
Within human–computer interaction, the dominant representation of user differences is persona. One review of fifteen years of data-driven persona development traced how personas moved from qualitative craft to algorithmic generation, with clustering methods remaining the most common analytical basis throughout that period [8]. The same review noted a difficulty that carries directly into education: because the number of personas is chosen by the analyst, the segmentation presented to a decision maker is partly an artifact of that choice rather than a property of the user population. In an instructional setting, the analyst’s choice becomes the set of learner types that teachers and systems are asked to treat as real. That literature motivates in this study an empirical check of whether groups extracted from the six scores warrant a learner-persona interpretation.
2.3. Adaptive Computer-Assisted Education
Adaptive systems act on learner models at several levels. A systematic review covering a decade of adaptive learning literature distinguished among adaptation of navigation, presentation, and content and reported that most studies are on higher education, with Taiwan and the United States accounting for the largest share [16]. A parallel review of technology-enhanced adaptive and personalized learning documented the range of learner parameters that drive these adaptations [4]. For the present study, the question is whether the observed learner scores support distinct persona-based groups before such groups are proposed as a basis for adaptation. No adaptive decision is evaluated in this paper.
2.4. From Hard Segmentation to Graded Learner Representation
The question of whether groups are real has a long methodological history outside education. Meehl distinguished a taxon, a non-arbitrary class whose existence is an empirical conjecture, and a continuous dimension that analysts may cut into segments for convenience and argued that the two must be distinguished by evidence rather than by assumption [17]. The accumulated evidence has not favored categories. A quantitative review of 177 taxometric articles found that categorical results became markedly less common in methodologically stronger studies, with the corrected prevalence of genuinely taxonic findings estimated at roughly one in seven [18]. Most latent structures of individual differences appear to be dimensional.
Within profile analysis, the same question takes a specific form. Cronbach and Gleser separated a profile’s elevation, its overall level across indicators, from its shape and the configuration of relative highs and lows that remain once level is removed [19]. Morin and Marsh [12] and Morin et al. [13] examined how level and shape can be distinguished in person-centered analyses. The present study applies this established distinction to the interpretation of fuzzy learner partitions. Only shape distinguishes learners qualitatively. Clusters that differ in elevation alone are segments of one ordered continuum, and naming them as types asserts a structure that has not been demonstrated. Methodological guidance for latent profile analysis warns of related hazards, including solutions that reflect sample-specific variation and classifications that fail to replicate [7]. Cluster-wise stability assessment based on the bootstrap distribution of the Jaccard coefficient provides a means of detecting groups that dissolve under resampling [20]. The present study applies these established level-shape and stability checks to six provisional questionnaire scores, but does not introduce either check as a new method.
2.5. Proposed Uncertainty-Aware Fuzzy Learner-Modeling Framework
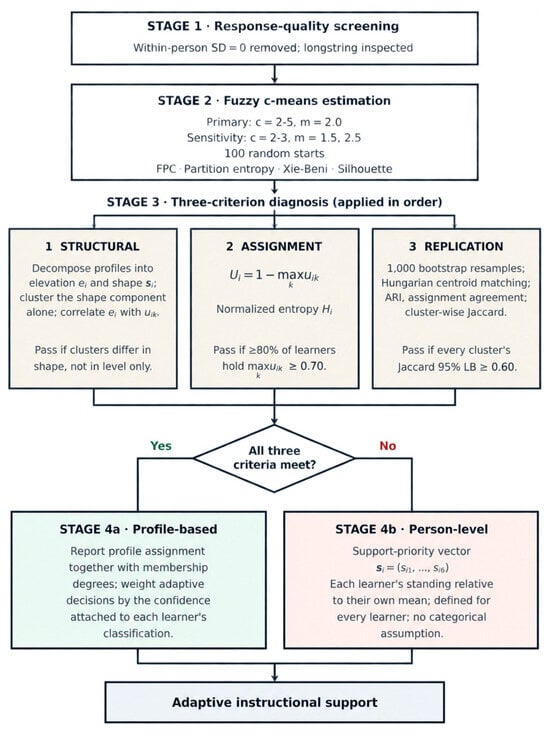
The proposed framework integrates established methods into an exploratory diagnostic workflow (Figure 1). The proposed contribution is the ordered interpretation of structural, assignment, and replication evidence when assessing a learner-persona claim. Component methods are also established.
Figure 1.
The uncertainty-aware fuzzy learner-modeling framework.
After response-quality screening and FCM estimation, three complementary criteria are examined. Structural diagnosis asks whether clusters differ in configuration beyond overall level. Membership concentration describes each learner’s position relative to the estimated prototypes. Resampling assesses the stability of the recovered partition. Within this proposed workflow, stability and concentrated membership cannot compensate for an absence of configural differentiation. Meeting all three criteria supports further consideration of persona-based representation, but does not establish external validity or instructional effectiveness.
When these criteria are not met, the support-priority vector retains each learner’s deviations from one’s own mean across the standardized construct scores. A negative component indicates a relative weakness within that standardized profile. It does not establish an absolute deficit or a need for intervention.
The proposed instructional rationale draws on self-regulated learning models that emphasize monitoring, reflection, and goal setting [14]. We hypothesize that such a representation could inform discussion of possible support goals alongside overall scores, task demands, and learner judgment. This conceptual connection does not validate the vector or its minimum component as an instructional decision rule. Reliability of the relative scores, stability of the selected priority, and effects of using them to guide support require further evaluation.
3. Materials and Methods
3.1. Participants and AI-Supported Learning Context
The data collected in June 2026 come from three undergraduate cohorts enrolled in AI-supported courses at a university of technology in central Taiwan. The cohorts are from information engineering (n = 50), leisure services management (n = 30), and a cross-departmental teacher-education program (n = 27), yielding a total of 107 respondents. The teacher-education cohort is not a single department; its members were enrolled in programs, including early childhood care, architecture and construction, visual communication design, and applied English, and took the AI course as part of their teacher-preparation coursework. In this study, AI-supported courses refer to regular courses attended by these cohorts in which AI-supported learning formed part of course activities. The term identifies the setting in which the questionnaire was administered and not a common platform or a standardized intervention. The survey did not record the specific tools used, students’ frequency of use, task-level interactions, or instructors’ use of AI in teaching. These aspects of course implementation therefore cannot be compared across cohorts. The analysis concerns the structure of self-reported learning-attitude scores in this setting. Course-level records specifying the AI tools, learning activities, and the survey’s position within each course are not available for this analysis. Response timestamps identify completion windows, but cannot establish when the survey occurred relative to instruction or which AI activities students experienced.
The questionnaire was administered online. Response timestamps indicate that the information engineering cohort completed the survey within a single 31-minute window, whereas responses from the other two cohorts were distributed across several hours on their respective administration days. This pattern is consistent with in-class administration for the first cohort and out-of-class completion for the other two. The difference is reported in this section, because it bears on the screening results in Section 4.1 rather than as an incidental detail.
Gender was self-reported as male or female but was not included as an analytic variable. Its distribution is almost entirely confounded with cohort—47 of 50 respondents in information engineering are male, whereas 24 of 30 in leisure services management are female. Thus, any apparent association with gender would be indistinguishable from a cohort effect. The free-text field recording department of study is not used either, since responses were entered inconsistently and in one case contained a personal name rather than a department. Cohort membership serves as the grouping variable throughout.
3.2. Measures and Corrected Constructs
The questionnaire was administered in Chinese and contained 30 items across six domains: A (Self-Perception, five items), B (Learning Desire, five), C (Learning Methods, seven), D (Learning Planning, five), E (Learning Habits, four), and F (Learning Process, four). This domain structure corresponds to the AI-Enhanced Learning Attitude Scale (AILAS) reported by Huang and Wang [21], although the item descriptions in that article and the wording administered in this paper are not identical in all cases. The earlier study analyzed social-work surveys collected in 2024; the present study uses 107 responses collected in June 2026 from information engineering, leisure services management, and teacher-education cohorts. No earlier response records were reused, although individual participation overlap cannot be verified, because the earlier surveys were anonymous. Appendix A contains English translations prepared for reporting, but have not been independently validated. Responses were coded from 1 (strongly disagree) to 5 (strongly agree), and no item responses were missing. A total of 10 of the 30 items explicitly refer to AI coursework or learning about AI; 8 of these items are retained in the 26-item scoring. The other items concern broader learning attitudes and practices. These responses do not measure AI-tool use or its effects. The six-domain structure and the revised scores described below are provisional. Reliability evidence reported for an earlier study does not establish its validity in this sample.
The primary analysis excludes A5 and C7, which are negatively worded, and E4 and F3, which have identical wording. A5 and C7 are therefore excluded rather than reverse-scored in this analysis. Construct scores are unweighted means of the retained items: A′ = A1–A4; B = B1–B5; C′ = C1–C6; D = D1–D5; E′ = E1–E3; and F′ = F1, F2, and F4. These 26 retained items define the six composite scores used in the subsequent analyses. Reliability of the corrected constructs is assessed using coefficient alpha and coefficient omega—the latter because alpha rests on assumptions seldom satisfied in practice [22]. Coefficient omega was estimated from a one-factor minimum residual (MINRES) model fitted to the item correlation matrix with uncorrelated residuals. Section 4.1 reports changes in reliability associated with the item corrections.
These exclusions were made after inspection of item wording and empirical behavior and therefore constitute post hoc modifications to four construct operationalizations. The shortened composites are treated as provisional measures whose content and construct validity require independent evaluation. Reliability estimates alone do not establish that validity.
3.3. Response-Quality Screening
Responses with no variation across the 30 items yield identical raw-scale scores on the six constructs. After construct-wise standardization, however, their profiles need not be flat, because the construct means and standard deviations differ. These records are excluded, because they contain no item-level evidence of differentiated construct responses. Their inclusion is examined in the unscreened sensitivity analysis. Screening therefore precedes the primary structural analysis. Following established guidance on the detection of careless and insufficient-effort responding [23,24], two indices are computed for each respondent: the within-person standard deviation across all 30 items, and the longstring index, defined as the maximum run of consecutive identical responses.
The primary screening rule removes respondents displaying a within-person standard deviation of zero. This rule is deliberately conservative: it excludes only those cases for which no within-person variation exists at all and does not require a judgement about how much variation is enough. Respondents with small yet non-zero variation are retained in the primary analysis and examined separately as a sensitivity check, so that the effect of the screening decision itself could be observed rather than assumed. Screening rates are compared across cohorts using a chi-squared test of independence. Within-person variability and longstring are established response-pattern checks [23,24]. Excluding records with zero variation across all 30 items is a study-specific decision: these records do not differentiate the six raw-scale construct scores, although construct-wise standardization can produce non-flat profiles. This rule is not a general cutoff for careless responding and does not establish why a respondent selected the same response throughout.
3.4. Data Preprocessing
Construct scores are unweighted means of their retained items on the original one-to-five scale. Standardizing inputs is a common precaution in Euclidean-distance clustering when variables have different dispersions. Each of the six scores is standardized using the mean and sample standard deviation calculated from the 90 screened respondents. The same constants are applied to all 107 respondents in the unscreened sensitivity analysis to keep the scores on a common scale. Retaining those constants is a comparison choice made for this study and not a requirement of fuzzy c-means.
Standardization equalizes the contribution of the six constructs, but does not remove the component of variance that they share. If the constructs strongly intercorrelate, then the standardized data will still be dominated by a single direction of common variation, and any partition obtained from them will tend to order cases along that direction. This is a property of the data rather than an artifact of preprocessing. Section 3.6 describes how it is diagnosed rather than left implicit.
3.5. Fuzzy C-Means Clustering
Fuzzy c-means partitions n cases into c clusters by minimizing:
subject to uik ∈ [0, 1] and for every case i, where vk is the centroid of cluster k and m > 1 is the fuzzifier [25]. Alternating optimization updates memberships and centroids according to:
until the largest change in any membership falls below 10−10 or 1000 iterations are reached.
Because the objective function is not convex, alternating optimization converges to local minima whose identity depends on initialization. Each configuration is therefore estimated from 100 random starts drawn from a fixed-seed generator, and the solution with the lowest objective value is retained. Clusters within each retained solution are relabeled in descending order of their centroid means. This provides a consistent reporting order for clusters across configurations. These computational settings alone do not establish independent reproducibility, which also requires access to the instrument, data, and analysis code.
The documented implementation uses Python 3.12.14, NumPy 2.3.5, SciPy 1.17.0, and scikit-learn 1.8.0. Random number generation uses PCG64 with a base seed of 20260910. Independent streams are derived through SeedSequence.
3.6. Cluster-Number Selection and Elevation-Shape Diagnosis
Solutions are estimated for c = 2, 3, 4, and 5 and evaluated with four validity criteria: the fuzzy partition coefficient and partition entropy [25], the Xie–Beni index [26], and the average silhouette width computed on modal assignments [27]. The partition coefficient and entropy summarize how sharply memberships are concentrated; the Xie–Beni index balances within-cluster compactness against between-centroid separation; the silhouette width evaluates the geometric separation of the resulting groups. No single index is authoritative, and agreement across the four is treated as the basis for selection. The primary analysis estimates solutions for c = 2, 3, 4, and 5 at m = 2.0. To assess sensitivity to the fuzzifier, the two- and three-cluster solutions (the solutions carried forward for substantive diagnosis) are re-estimated at m = 1.5 and m = 2.5 [28].
Following the distinction between profile level and configuration [19], each standardized profile zi is decomposed into elevation ei and shape sij.
Three quantities are then computed: the proportion of total standardized variance attributable to elevation; the eigenvalues of the shape covariance matrix, which indicate whether shape variation is concentrated in interpretable directions or spread evenly; and the validity indices for fuzzy partitions of the shape component alone. Clusters that are differentiated by shape should remain recoverable when elevation is removed. Clusters that dissolve under this operation are segments of a single-ordered dimension, and the structural criterion is not met.
As a further check on whether the partition is tracking level rather than configuration, the study computes the correlation between each learner’s elevation and membership degree in each cluster. Correlations approaching unity in absolute value indicate that membership is a monotone function of overall level.
3.7. Membership Uncertainty
For each learner, two indices are computed from the membership vector. The first one is the ambiguity index:
which is zero when a learner belongs unambiguously to one cluster and approaches 1-1/c when memberships are evenly divided. The second one is the normalized membership entropy:
which is bounded between zero and one and is comparable across solutions with different numbers of clusters.
The proposed assignment check provisionally requires at least 80% of learners to have a maximum membership of 0.70 or above. For learners meeting the 0.70 cutoff, total membership in other clusters is at most 0.30; the 80% rule allows one in five learners to fall below that cutoff. Neither threshold is an established standard. We therefore compare membership cutoffs of 0.60, 0.70, and 0.80 with coverage requirements of 70%, 80%, and 90%. Secondary memberships are also reported.
3.8. Bootstrap Stability and Sensitivity Analysis
This study assesses stability with 1000 non-parametric bootstrap resamples drawn with replacement from the screened sample. Fuzzy c-means is refitted within each resample, and the resulting centroids are matched to the reference solution by solving the linear assignment problem on the matrix of pairwise Euclidean distances. This removes label-switching that would otherwise contaminate the comparisons. Each bootstrap solution then assigns memberships to the full screened sample, so that agreement is evaluated on a common set of cases. Bootstrap stability is conditional on the observed sample and should not be interpreted as external validation. Resampling does not increase the number of independent participants or compensate for a limited sample size. With 90 retained participants from a single institution, the present analysis provides an exploratory demonstration of the framework. Its performance and generalizability require evaluation through independent replication with larger samples across multiple institutions.
Three quantities are recorded across resamples: the adjusted Rand index between bootstrap and reference modal assignments [29,30]; the proportion of learners assigned to the matched cluster; and the Jaccard coefficient computed separately for each cluster, following the cluster-wise approach to stability assessment [20]. Intervals are formed at the 2.5th and 97.5th percentiles. The replication criterion requires that the lower bound of the cluster-wise Jaccard interval reaches 0.60 for every cluster in the solution, so that a partition is not credited as stable when one of its clusters dissolves under resampling.
Two sensitivity analyses accompany the primary results. The first one refits the entire procedure to the full unscreened sample of 107 respondents, which quantifies how much the screening decision changes the recovered structure. The second one re-estimates the primary solution at the alternative fuzzifier values described in Section 3.6. Both are reported in full rather than summarized as confirmations.
3.9. Support-Priority Vector Construction
For each learner, the support-priority vector is the shape component defined in Equation (3), expressing each standardized construct score as a deviation from that learner’s mean standardized score across the six constructs. Its interpretation is deliberately intrapersonal: a negative entry identifies a construct on which the learner is relatively weaker than on their other constructs, irrespective of where they stand relative to the cohort. For descriptive analysis, we record the construct with the lowest centered score and the size of that deviation. We conduct three exploratory measurement-error checks. Approximate reliability of each centered score is calculated from its observed variance and the composite omega estimates, assuming uncorrelated errors across standardized constructs. We then resample the retained items within each construct 10,000 times, keep the original standardization constants, and record how often each learner’s initially lowest construct remains lowest. Finally, we compare the observed mean maximum relative deficit with 100,000 simulated samples of 90 flat true profiles affected by independent normally-distributed errors with variances of 1-ω. These checks are conditional on the reliability estimates and error assumptions. Item resampling is not a test–retest assessment.
Two exploratory tests examine whether the selected lowest-scoring construct is associated with modal cluster membership or cohort. For each comparison, the selected construct is cross-tabulated with the grouping variable. These tests describe associations in this sample. A non-significant result does not establish independence or demonstrate that the vector provides information beyond cluster membership.
The vector can be calculated for every learner without assuming that distinct groups exist. This study examines it as a descriptive summary of within-person score contrasts. Its use to select instructional support requires separate validation. Because several expected cell counts in the 3 × 6 contingency tables are below five, statistical significance for these associations is evaluated using Monte Carlo exact tests based on fixed marginal totals, while the Pearson χ2 statistic and Cramér’s V are retained as descriptive measures of association.
3.10. Reproducibility Limitations
The original analysis script was unavailable. A reconstructed implementation was used to rerun the analyses. The 110 checked summary quantities agree with the revised manuscript at reported precision, and two rounding errors were corrected. The reconstructed analysis code is provided with this submission. Because the item-level data are not included, readers cannot independently reproduce the empirical results from the published materials.
4. Results
The results below concern six provisional composite scores from the 90 retained respondents. Because the measurement structure has not been independently established, the results are interpreted as patterns in these observed scores rather than evidence for six validated latent dimensions. Section 4.1 reports response screening and properties of the six provisional scores. Section 4.2 and Section 4.3 examine candidate partitions and whether their differences involve profile shape rather than only overall level (structural criterion). Section 4.4 reports membership concentration (assignment criterion), while Section 4.5 describes exploratory support-priority patterns. Section 4.6 evaluates bootstrap stability and the effect of retaining the screened-out responses. Together, these results address whether the observed partitions warrant a persona-based interpretation in this sample.
4.1. Response Screening and Construct Properties
Of the 107 respondents, 17 produced within-person standard deviations of zero and were removed by the primary screening rule, leaving 90 cases for analysis. Nine of these respondents selected the midpoint for all 30 items, seven selected the highest category throughout, and one selected the fourth category throughout. Their mean overall score is 3.88 (SD = 0.99), which is close to that of the retained sample (M = 3.83, SD = 0.51). The two groups differ in dispersion rather than in level, and so, mean-based screening would not have identified them. Two further respondents showed runs of 25 or more identical consecutive responses with non-zero variance and were retained in the primary analysis, as specified in Section 3.3.
Screening rates differ markedly across cohorts (Table 1). Invariant responding appears in 28.0% of the information engineering cohort, but in only 6.7% and 3.7% of the leisure services management and teacher-education cohorts, respectively, χ2(2) = 10.40, p = 0.006, Cramér’s V = 0.312. Read alongside the timestamp pattern described in Section 3.1, this result is consistent with a possible administration-setting explanation. However, administration mode and cohort are confounded in the present data. The observed difference thus cannot be attributed uniquely to the administration setting, discipline, or cohort composition.
Table 1.
Sample composition and response-quality screening by cohort.
The four flagged items behave as anticipated in Section 3.2. In the screened sample, corrected item-total correlations are 0.093 for A5 and 0.051 for C7, both negatively worded and not reverse-scored, and 0.206 for E4. Items E4 and F3, which share identical wording, correlate at r = 0.641 with 81.1% exactly matching responses. In the unscreened sample these values are r = 0.778 and 84.1%, indicating that invariant responding inflates the apparent redundancy of the two items. Removing the four items raises alpha from 0.681 to 0.810 for academic self-concept, from 0.723 to 0.807 for learning strategies, and from 0.830 to 0.929 for habitual regulation, while reducing it slightly from 0.812 to 0.788 for learning-process engagement, where the item count falls from four to three.
The six constructs strongly intercorrelate, with coefficients ranging from 0.553 to 0.824 and a mean absolute correlation of 0.652. The eigenvalues of their correlation matrix are 4.273, 0.500, 0.460, 0.376, 0.244, and 0.146, and so, the first principal direction accounts for 71.2% of the total standardized variance across the six constructs. This property of the input data is reported before the clustering results, because it constrains what any partition of these data can represent. These results indicate substantial shared variance among the composite scores. However, this composite-level analysis neither establishes a six-factor measurement model nor confirms that the items measure a single latent factor. The measurement structure therefore remains unresolved. Subsequent clustering and elevation-shape analyses describe patterns in these provisional composite scores. Similarly, support-priority vectors represent within-person score contrasts and should not be interpreted as validated differences in instructional need. Item-level evaluation of competing measurement models is required to support stronger interpretations.
Table 2 reports descriptive statistics and internal consistency for six provisional composite scores based on the questionnaire’s proposed domains. Alpha and omega do not establish their factorial structure or discriminant validity, and the present analysis does not confirm that they represent six distinct latent dimensions. The clustering and elevation-shape findings are therefore conditional on this scoring specification and should not be generalized to the dimensional structure of learner characteristics beyond these measures.
Table 2.
Descriptive statistics and reliability of the six corrected constructs (N = 90).
4.2. Optimal Fuzzy Partition
Table 3 lists validity indices for two- to five-cluster solutions. At m = 2.0, the two-cluster solution is preferred by all four criteria simultaneously: it has the highest partition coefficient (0.725), the lowest partition entropy (0.434), the lowest Xie–Beni index (0.206), and the highest average silhouette width (0.384). Every index deteriorates monotonically as clusters are added. The two-cluster solution also outperforms the three-cluster solution at both m = 1.5 and m = 2.5, meaning that the preference for two clusters is not specific to the primary fuzzifier value.
Table 3.
Fuzzy partition validity indices across alternative cluster numbers and fuzzifier values.
The three-cluster solution is retained alongside the two-cluster solution in what follows. It is not because any index favors it, but because it is the smallest solution at which a middle group can appear. That middle group’s behavior is diagnostically informative.
4.3. Level Dominance and the Absence of Shape Differentiation
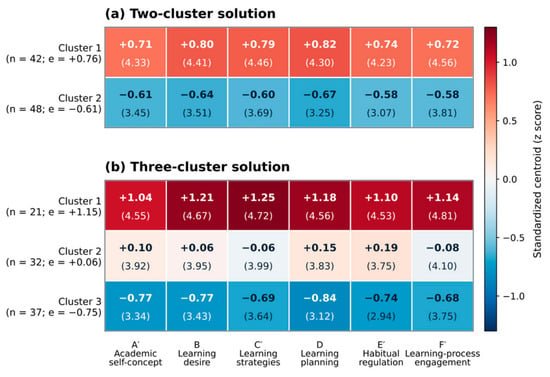
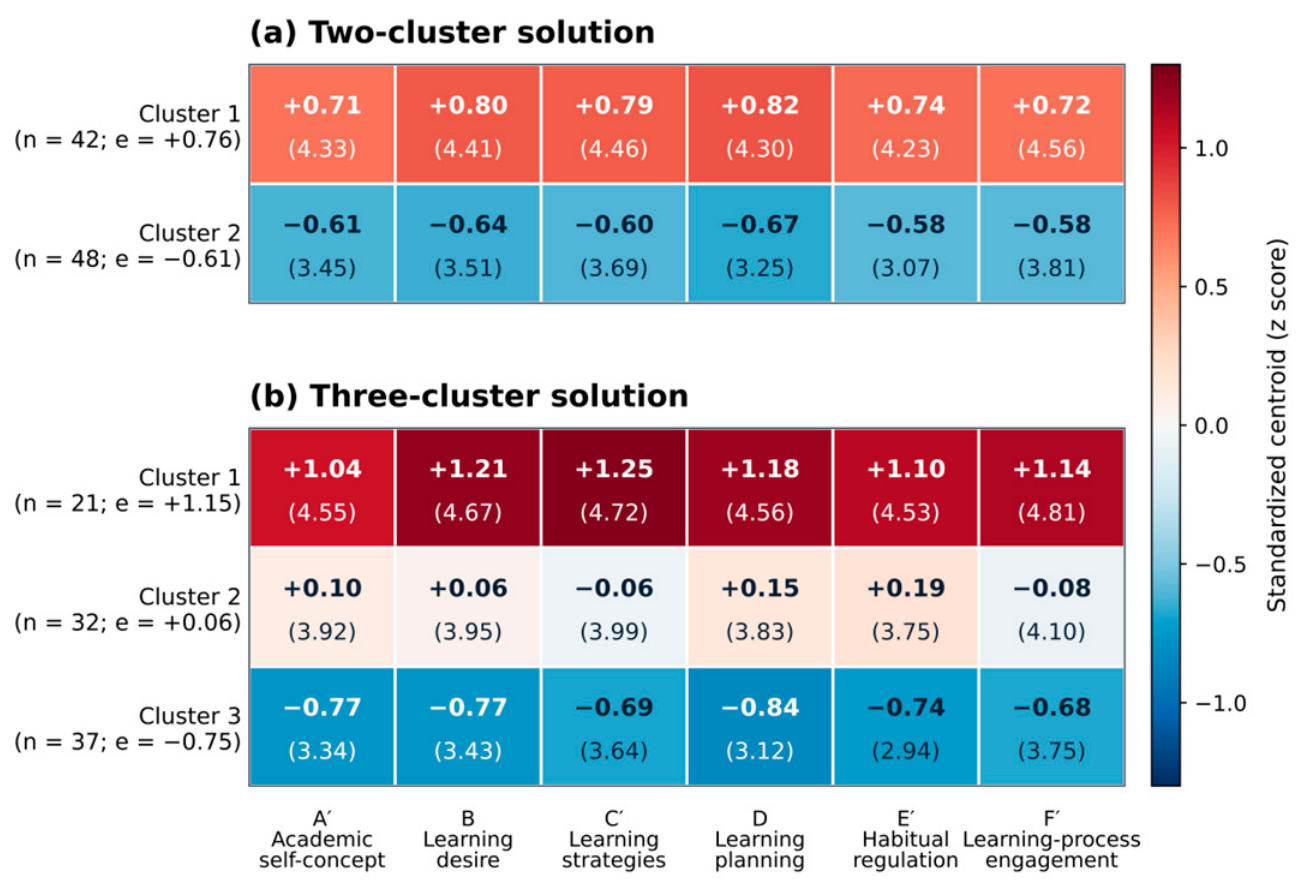
Cluster centroids appear in Table 4 and in Figure 2. In the two-cluster solution, the first centroid is positive on all six constructs (+0.71 to +0.82 in standardized units), and the second is negative on all six (−0.58 to −0.67). In the three-cluster solution, the first centroid is positive throughout (+1.04 to +1.25), the third is negative throughout (−0.68 to −0.84), and the second lies close to zero on every construct (−0.08 to +0.19). No centroid in any solution is high on one construct and low on another. The clusters are ordered and not configured.
Table 4.
Cluster centroids in standardized units with the corresponding raw-scale values in parentheses.
Figure 2.
Fuzzy c-means centroids for two and three clusters. Cells show standardized values (raw values in parentheses); n is modal cluster size and e is mean elevation.
Membership degrees largely track overall score level. In the two-cluster solution, membership in the first cluster correlates 0.882 with elevation (−0.882 for the second). Thus, FCM does not establish substantive learner types beyond an overall-score representation in this dataset. Its diagnostic value in this paper is showing why an apparently clear partition should not be interpreted as distinct personas.
Decomposing the standardized profiles directly confirms this. Elevation, defined as the equally-weighted mean of the six standardized scores, accounts for 71.0% of the total standardized variance. This differs from the 71.2% accounted for by the first principal component reported in Section 4.1: elevation uses fixed equal weights, whereas the principal component uses weights estimated to maximize explained variance. The eigenvalues of the shape covariance matrix are 0.502, 0.460, 0.387, 0.244, 0.147, and 0.000. The zero eigenvalue is expected, because within-person centering constrains the six shape scores to sum to zero. The remaining five eigenvalues form a relatively flat spectrum, indicating that shape variation does not concentrate in a single interpretable direction. Shape standard deviations are modest and similar across constructs, ranging from 0.44 for learning strategies to 0.62 for academic self-concept. When fuzzy c-means is applied to the shape component alone, the partitions are poor: FPC = 0.544 and silhouette = 0.208 at two clusters; FPC = 0.425 and silhouette = 0.182 at three. Clusters that are sharply separated in the full standardized space dissolve once elevation is removed.
The structural criterion specified in Section 2.5 is therefore not met. Whatever the two- and three-cluster solutions describe, it is not a set of qualitatively distinct learner configurations.
4.4. Membership Ambiguity
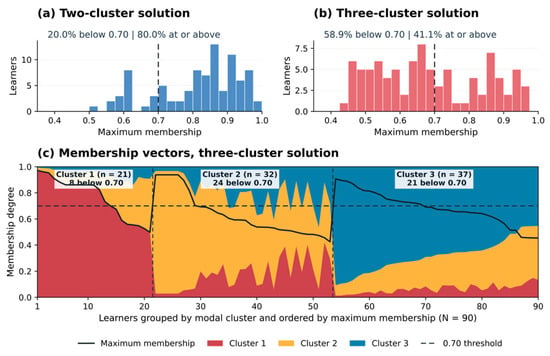
Ambiguity statistics are in the lower panel of Table 5 and appear in Figure 3. In the two-cluster solution, the mean ambiguity index is 0.187, and the mean normalized entropy is 0.626. Exactly 80.0% of learners hold a maximum membership of 0.70 or above, which meets the pre-specified assignment threshold at its boundary rather than comfortably; 34.4% fall below 0.80, and 20.0% have a second membership of 0.30 or more. In the three-cluster solution, ambiguity rises substantially: the mean ambiguity index is 0.315, 58.9% of learners fall below a maximum membership of 0.70, 35.6% below 0.60, and 13.3% below 0.50. One-third of learners have a second-highest membership of at least 0.30.
Table 5.
Bootstrap stability (B = 1000) and membership ambiguity for the two- and three-cluster solutions.
Figure 3.
Maximum membership and three-cluster membership vectors (N = 90). Dashed lines mark 0.70; the black line in (c) shows maximum membership.
For two clusters, 93.3%, 80.0%, and 65.6% of learners reach maximum memberships of 0.60, 0.70, and 0.80, respectively; for three clusters, the corresponding figures are 64.4%, 41.1%, and 30.0%. The two-cluster assignment check passes at 0.60 under all three coverage rules, at 0.70 under the 70% and 80% rules, and at 0.80 under none. The three-cluster check fails throughout. Both solutions fail the structural criterion regardless of these assignment choices.
The contrast between the clearest and the most ambiguous cases illustrates what a modal assignment conceals. The three least ambiguous learners in the three-cluster solution hold membership vectors of (0.972, 0.021, 0.007), (0.961, 0.028, 0.011), and (0.953, 0.034, 0.013). The three most ambiguous hold (0.148, 0.397, 0.455), (0.134, 0.412, 0.454), and (0.294, 0.425, 0.281). A hard assignment reduces each membership vector to a single-modal label and therefore discards substantial differences in assignment certainty. Learners with highly concentrated and highly ambiguous membership vectors can consequently receive equally categorical labels even though the evidential strength of those assignments differs markedly.
4.5. Cohort Distribution and Support Priorities
Cluster membership only weakly relates to cohort. The two-cluster solution shows a marginal association, χ2(2) = 5.77, p = 0.056, V = 0.253, and the three-cluster solution a modest one, χ2(4) = 10.47, p = 0.033, V = 0.241. Comparing construct means across cohorts with Kruskal–Wallis tests and Holm correction, only learning planning survives adjustment (adjusted p = 0.043, η2 = 0.116), with the leisure services management cohort scoring lower (M = 3.36) than the information engineering (M = 3.90) and teacher-education (M = 3.85) cohorts. Learning desire is significant before correction (p = 0.033), but not after (adjusted p = 0.163).
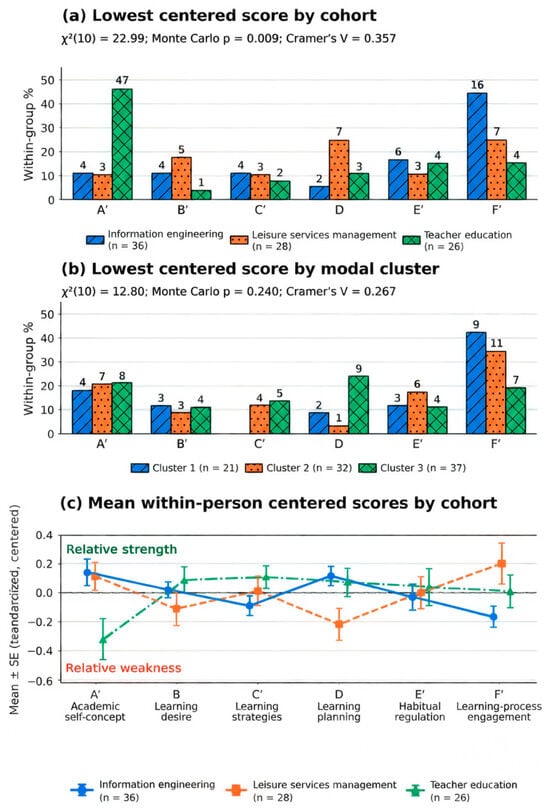
Support-priority vectors present a different picture (Figure 4). Each learner’s primary support priority, the construct with the learner’s lowest within-person centered score, is distributed across all six constructs: learning-process engagement for 27 learners, academic self-concept for 19, habitual regulation for 13, learning planning for 12, learning desire for 10, and learning strategies for 9. The mean magnitude of the largest relative deficit is 0.75 standardized units (SD = 0.39, median = 0.66)—a descriptive contrast whose interpretation depends on measurement error. Under the independent-error approximation, estimated reliabilities of the centered scores are 0.648, 0.507, 0.262, 0.532, 0.784, and 0.542 for A–F, respectively. Across 10,000 item-resampling replicates, the original lowest construct is reselected in a median of 67.1% of replicates; 43 of 90 learners reach 70%. Under the specified flat-profile error simulation, the mean maximum deficit is 0.488 (simulated 95% interval for the 90-person mean: [0.448, 0.530]) versus the observed 0.746. None of 100,000 simulated samples reach the observed mean. These results do not establish that each learner’s selected minimum is stable or reflects an instructional need.
Figure 4.
The lowest centered scores by cohort (a) and modal cluster (b), and cohort means ± SE (c). Bars show within-group percentages; labels show counts. In (c), solid, dashed, and dash-dotted lines denote information engineering, leisure services management, and teacher education, respectively; the horizontal dashed line marks zero.
The primary relative score relates to cohort (χ2(10) = 22.99, Monte Carlo p = 0.009). Its association with modal cluster membership is not statistically significant (χ2(10) = 12.80, Monte Carlo p = 0.240). These results describe associations in this sample. The non-significant test does not establish independence or show that cluster membership contains no relevant information. Neither association identifies an effective form of instructional support.
The same pattern is visible when support-priority vectors are averaged within cohort (Figure 4c). The teacher-education cohort stands the lowest on academic self-concept relative to its own mean (M = −0.32, SE = 0.14), the leisure services management cohort stands the lowest on learning planning (M = −0.22, SE = 0.11), and the information engineering cohort stands the lowest on learning-process engagement (M = −0.16, SE = 0.07). Because these values are centered within a person, they describe where each cohort’s profile dips rather than how the cohorts compare in absolute standing. They are not equivalent to the cohort mean differences reported in the preceding paragraph.
4.6. Stability and Robustness
The upper panel of Table 5 presents bootstrap results. The two-cluster solution is stable: the adjusted Rand index averages 0.891 with a 95% percentile interval of [0.566, 1.000], modal assignments agree with the reference solution for 97.1% of learners on average, and cluster-wise Jaccard coefficients are 0.938 [0.738, 1.000] and 0.951 [0.814, 1.000]. Both lower bounds exceed the pre-specified replication threshold of 0.60, and so, the replication criterion is met at c = 2.
The three-cluster solution does not meet pre-specified replication criterion. The adjusted Rand index averages 0.746 [0.327, 0.962], and cluster-wise Jaccard coefficients are 0.865 [0.656, 1.000] for the high cluster, 0.778 [0.392, 0.969] for the middle cluster, and 0.842 [0.378, 0.974] for the low cluster. The lower bounds for the middle and low clusters fall below 0.60, and the middle cluster is the least stable of the three. This is the signature expected when a continuum is cut into segments: the interior segment has no natural boundaries, and its membership shifts with the sample.
Refitting the full procedure to the unscreened sample of 107 respondents reproduces the same structure in a stronger form. The first eigenvalue of the construct correlation matrix rises from 71.2% to 78.5% of the total standardized variance, and the two-cluster solution again dominates on every index (FPC = 0.754, PE = 0.397, XB = 0.146, silhouette = 0.432). The 17 invariant responders do not form a cluster of their own; they are divided into 8 and 9 between the two clusters according to whether their constant response is above or below the sample mean. Retaining them therefore does not create a spurious group, but does strengthen the appearance of one-dimensionality, which is the more consequential distortion for the question at issue in this paper.
The three criteria taken together return a clear verdict. The replication criterion is met at two clusters and fails at three. Under the primary 0.70 membership cutoff and 80% coverage rule, the assignment criterion is met at two clusters, but this judgment changes under alternative thresholds; the three-cluster solution fails under all examined thresholds. The structural criterion is not met for either solution. Because the structural criterion is prior to the others, a stable and crisply-assigned partition of a single dimension remains a partition of a single dimension. A profile-based learner model is therefore not warranted for the data.
5. Discussion
5.1. Principal Findings
First, among the 90 retained participants at this institution, the six provisional self-report composite scores vary predominantly in overall level and show little evidence of distinct profile configurations. This finding is specific to the measures and sample examined and does not establish that learner heterogeneity across AI-supported higher education is generally graded. The first principal component accounts for 71.2% of the total standardized variance among the six constructs, every cluster centroid is uniformly positive or uniformly negative, membership degrees correlate 0.882 with a learner’s overall level, and partitions estimated on the shape component alone are poor by every criterion applied. No evidence of qualitatively distinct learner types appears in the data (Figure 2).
Second, the two-cluster solution is both stable and reasonably crisp and is still not a typology. Its adjusted Rand index across 1000 resamples averages 0.891, its cluster-wise Jaccard coefficients are 0.938 and 0.951 with lower bounds well above the replication threshold, and 80.0% of learners hold a maximum membership of 0.70 or above. A researcher who reported only these figures would have a defensible-looking case for two learner types. The structural diagnosis shows that the stable and crisply-assigned clusters reflect segmentation along an underlying continuum rather than distinct learner types. Stability and assignment certainty are properties of a partition. They say nothing about whether the partition corresponds to a categorical structure in the population.
Third, the lowest within-person score falls in different constructs across learners (Figure 4a), but the selected minimum changes under item resampling for many individuals. Although the average contrast exceeds the specified error-only benchmark, that comparison rests on assumptions about measurement error and does not establish reliable individual configurations or validated support priorities. This information shows no statistically significant association with profile membership, χ2 (10) = 12.80, Monte Carlo p = 0.240. In this sample, modal cluster membership does not statistically predict which composite score is the lowest relative to a learner’s own mean. That score has not been validated as a measure of instructional need.
5.2. Relationship to the Literature
Educational applications of fuzzy clustering use partial memberships to represent overlapping student profiles [10,11]. The membership ambiguity observed in this paper is consistent with that rationale. Person-centered research has explicitly distinguished profile elevation from shape [12,13,19] and examined cluster stability separately [20]. In this sample, these checks lead to different judgments: the two-cluster partition is stable, but its centroids differ mainly in overall level. The findings therefore illustrate why stability alone does not establish distinct profile configurations.
Data-driven persona research has documented clustering as a common way to construct user archetypes [8], while methodological guidance calls for substantive evaluation of recovered groups [7]. The present study adds an application in which shape, membership concentration, and resampling stability are considered together before interpreting clusters as learner personas. The findings in this paper call into question a persona interpretation for these six provisional scores, but do not invalidate profiles found in other studies or establish the instructional value of the support-priority vector.
5.3. Implications for Learner Modeling
The finding that a clustering algorithm returned clean-looking groups from data in which this analysis found no clear configural cluster structure is not anomalous; it is what clustering algorithms do. Two decades ago, analytic work on mixture models established that latent classes can be estimated and can appear optimal in populations containing only one group, with the within-class parameters largely uninterpretable [31]. Fuzzy c-means makes no distributional claim at all and will partition any cloud of points it is assigned. The algorithm is not at fault, but rather the inferential step from a partition is that learner types exist.
The result above should not be read as a general verdict against person-centered work in education. A study’s latent profile analysis of multidimensional academic self-concept recovered groups that combine profile level with genuine profile shape, distinguishing learners with mathematical strengths from those with verbal self-concept strengths [32]. That study succeeded in finding shape, because its indicators refer to substantively distinct domains that are known to be weakly or even negatively related. The six constructs analyzed in this paper are facets of a single evaluative orientation toward a course, intercorrelated at a mean of 0.652. The lesson is about matching the method to the indicator set and not about abandoning the method.
Methodological guidance already asks researchers to attend to replication, class size, and interpretability [7,33]. The proposed diagnostic sequence places the established level-shape question alongside membership concentration and resampling stability when evaluating fuzzy learner partitions. These checks may help researchers examine whether a recovered partition reflects profile level or shape. Their performance with other measures, samples, and estimation methods requires independent evaluation.
5.4. Potential Implications for Adaptive Systems
Participants were enrolled in AI-supported courses, but the analysis uses self-report scores and does not measure AI-tool use or interactions with an adaptive system. In the two-cluster solution, 20.0% of learners have a second membership of at least 0.30; in the three-cluster solution, the proportion is 33.3% (Figure 3). These values describe ambiguity in the fitted partitions. They do not measure errors or consequences of assigning learners to a single profile.
Displaying membership strength to learners or instructors is a possible design response and consistent with calls for more understandable algorithmic decisions in education [34]. Research has also raised concerns about unequal errors in educational algorithms [35]. The present study does not test an interface, adaptive routing, instructional decisions, or equity outcomes. Future studies must evaluate whether communicating membership uncertainty improves decisions and whether any resulting system affects learner groups differently.
5.5. User-Centered Instructional Implications
The support-priority vector summarizes within-person contrasts among six provisional scores. Estimated centered-score reliability falls to 0.262, and the selected minimum is recovered in a median of 67.1% of item-resampling replicates; only 43 of 90 learners reach a 70% reselection rate. These results do not support its use as an individual instructional decision rule. In this paper, the vector is only a descriptive summary. Whether it can guide effective support requires prospective testing.
Figure 4a,c show the cohort pattern. Learning-process engagement has the lowest relative score for 16 of 36 information engineering learners, whereas academic self-concept is lowest for 12 of 26 teacher-education learners (χ2(10) = 22.99, Monte Carlo p = 0.009). The association with modal cluster membership is not statistically significant (χ2(10) = 12.80, Monte Carlo p = 0.240). These cohort differences are exploratory. The cohort samples are small, response timing and screening rates differ, and self-reported gender is strongly confounded with cohort. This design cannot separate disciplinary or instructional-context effects from those other differences. The observed association therefore does not justify cohort-specific support recommendations. Meta-analytic evidence indicates that extended self-regulated learning training in higher education can improve outcomes (g = 0.38), particularly for metacognitive and resource-management strategies, with feedback moderating its effectiveness [36]. That evidence does not establish that this vector can identify which support will benefit an individual learner. Whether vector-based support improves learning requires a prospective comparison with uniform and persona-based support.
One caution accompanies this recommendation. The vector is intrapersonal by construction, and so, a negative entry marks a relative weakness and not necessarily an absolute one. A learner scoring high on all six constructs still has a lowest construct. If this vector is evaluated for instructional use in future work, then overall score level should be considered alongside it: even a learner who scores highly on every construct will have a lowest centered score.
5.6. Limitations
First, the analysis includes 90 students from three cohorts at one institution. Bootstrap resampling assesses the stability of the fitted partition within this sample; it does not provide external validation or offset the limited sample size. The proposed diagnostic sequence requires replication in larger, independent samples. Self-reported gender is almost perfectly confounded with cohort and was therefore excluded from the analysis.
Second, administration mode is confounded with the cohort. Invariant responding appears in 28.0% of the cohort whose responses fell within a single 31-minute window and in under 7% of the cohorts that responded over several hours, χ2(2) = 10.40, p = 0.006. Screening is therefore not random with respect to instructional context, and the analytic sample under-represents whichever learners in the first cohort responded without engaging. The direction of any resulting bias cannot be determined from the data.
Third, all constructs are measured by self-report at a single time point. Reviews of self-report instruments for self-regulated learning in higher education have noted that such measures capture learners’ beliefs about their own regulation rather than the regulation itself, and that their psychometric documentation is frequently incomplete [37]. Four of the thirty items are excluded for the reasons explained in Section 3.2, leaving learning-process engagement with only three indicators and a slightly-reduced alpha. The cross-sectional design also cannot determine whether the dimensional structure observed at the end of a course would also be observed at its start, or whether course experience itself compresses initially distinct constructs into a common evaluative judgment.
Fourth, the AI-supported context itself is not modeled directly. No measures of AI-tool usage intensity, prompting behavior, interface interaction, task design, or instructor scaffolding enter the clustering analysis. The findings therefore concern representation of learner heterogeneity within AI-supported course contexts rather than the effects of any particular AI system or implementation.
Finally, the three criteria and their thresholds are proposals rather than established standards. The 80% and 0.70 values used for the assignment criterion and the 0.60 lower bound used for the replication criterion were fixed before examination of results, but they do not derive from any distributional theory, and different fields may reasonably set them elsewhere. What the framework contributes is the requirement that such thresholds be stated in advance and reported against and not the particular values chosen in this paper. The present study provides an exploratory application of the framework. The revised measures, the generalizability of the findings, and the instructional value of the support-priority vector require independent validation. No independent dataset or controlled simulation was used to test whether this sequence separates profile shape from overall level across different sample sizes, variable correlations, and cluster configurations. Its performance under those conditions remains to be evaluated.
6. Conclusions
Among the 90 analyzed participants at one institution, the six provisional scores derived from this self-report questionnaire vary predominantly in overall level, with little evidence of distinct profile configurations. A persona-based interpretation of the observed partitions is therefore not supported for such data. This application illustrates the proposed diagnostic sequence, but it does not establish that learner heterogeneity in AI-supported higher education is generally graded or that persona-based models are unsuitable for other instruments, learners, or settings.
The two-cluster FCM partition is stable but primarily separates overall score levels. In this sample, it provides no evidence of distinct multidimensional learner types beyond an overall-score summary. Its assignment judgment changes under stricter thresholds, while the structural criterion fails throughout. This example shows why partition stability alone cannot justify persona labels; it does not establish an advantage over simpler score summaries.
The framework proposed in this paper contributes a decision procedure rather than a taxonomy. Its three criteria (structural, assignment, and replication) are applied in that order, and the structural criterion takes priority, because a stable, crisply-assigned partition of a single dimension remains a partition of a single dimension. When all three criteria are met, reporting membership degrees alongside assignments is one proposed way to represent uncertainty. Its value for adaptive decisions remains untested. When they are not met, the support-priority vector can be reported as an exploratory summary of the observed scores, pending external validation and intervention studies.
Several research directions follow. A replication with substantively distinct indicators could test whether profile shape becomes more apparent, as reported in analyses of multidimensional academic self-concept [32]. Longitudinal designs would establish whether the dimensional structure observed at one point in a course is present at its start or emerges through shared course experience. Combining self-reports with behavioral trace data could help assess whether reported attitudes correspond to observed learning behavior. Most directly, the value of the support-priority vector is an empirical claim that has not yet been tested: whether adaptive support targeted at a learner’s own relative weakness outperforms both uniform support and persona-based routing is a question for controlled comparison, but not for argument.
The framework’s applicability beyond this dataset remains to be established. Further research should evaluate the measurement structure, replicate the analyses in larger independent samples across institutions, and directly compare instructional outcomes under support-priority-based, persona-based, and uniform support.
Supplementary Materials
The following supporting information can be downloaded at: https://www.mdpi.com/article/10.3390/info17101046/s1.
Author Contributions
Conceptualization, Y.-C.W.; methodology, Y.-C.W. and K.-Y.C.; formal analysis, Y.-C.W. and K.-Y.C.; writing—original draft preparation, Y.-C.W.; writing—review and editing, Y.-C.W.; supervision, Y.-C.W. All authors have read and agreed to the published version of the manuscript.
Funding
This research received no external funding.
Institutional Review Board Statement
Ethical review and approval were waived for this study, because it involved anonymous questionnaire data collected as part of routine educational activities and posed minimal risk to participants. The questionnaire did not request names; however, one respondent entered a personal name in the free-text department field. This field was excluded from the analysis and omitted from the de-identified dataset. According to the Human Subjects Research Act of Taiwan, studies that do not involve intervention, interaction, or the collection of identifiable personal data may be exempt from review or approval by an Ethics Committee or Institutional Review Board.
Informed Consent Statement
Informed consent was obtained from all subjects involved in the study.
Data Availability Statement
English translations of the questionnaire items are provided in Appendix A. The reconstructed analysis code is provided with Supplementary Material. The administered-language questionnaire and item-level data are not included with this article.
Conflicts of Interest
The authors declare no conflicts of interest.
Appendix A. Questionnaire Items
| A1 | I am good at learning in AI courses. |
| A2 | My computational ability is good. |
| A3 | I understand the content of AI courses well. |
| A4 | My ability to learn in AI courses is better than that of others. |
| A5 | AI courses are difficult for me. |
| B1 | I take the initiative to learn without being prompted by others. |
| B2 | I am willing to make an effort even when AI courses are difficult. |
| B3 | I actively seek materials to support my learning. |
| B4 | I continue to work hard at learning despite difficulties. |
| B5 | I find AI assignments interesting. |
| C1 | I take the initiative to prepare for AI classes in advance. |
| C2 | I think about a problem first. |
| C3 | When I encounter something I do not understand, I try to find a way to resolve it. |
| C4 | I choose suitable methods for learning. |
| C5 | I learn about AI, because it interests me. |
| C6 | I seek help. |
| C7 | I often do not know how to learn about AI. |
| D1 | I consider AI courses important. |
| D2 | I make a study plan. |
| D3 | I schedule time for studying. |
| D4 | I schedule study time each week. |
| D5 | My learning goals are clear. |
| E1 | I review course content. |
| E2 | I prepare in advance. |
| E3 | I get ready ahead of time. |
| E4 | I complete assignments. |
| F1 | I listen attentively in class. |
| F2 | I participate actively. |
| F3 | I complete assignments. |
| F4 | I take the initiative to think about problems. |
References
- Zawacki-Richter, O.; Marín, V.I.; Bond, M.; Gouverneur, F. Systematic review of research on artificial intelligence applications in higher education—Where are the educators? Int. J. Educ. Technol. High. Educ. 2019, 16, 39. [Google Scholar] [CrossRef] [Scilit]
- Bond, M.; Khosravi, H.; De Laat, M.; Bergdahl, N.; Negrea, V.; Oxley, E.; Pham, P.; Chong, S.W.; Siemens, G. A meta systematic review of artificial intelligence in higher education: A call for increased ethics, collaboration, and rigour. Int. J. Educ. Technol. High. Educ. 2024, 21, 4. [Google Scholar] [CrossRef] [Scilit]
- Deng, R.; Jiang, M.; Yu, X.; Lu, Y.; Liu, S. Does ChatGPT enhance student learning? A systematic review and meta-analysis of experimental studies. Comput. Educ. 2025, 227, 105224. [Google Scholar] [CrossRef] [Scilit]
- Xie, H.; Chu, H.-C.; Hwang, G.-J.; Wang, C.-C. Trends and development in technology-enhanced adaptive/personalized learning: A systematic review of journal publications from 2007 to 2017. Comput. Educ. 2019, 140, 103599. [Google Scholar] [CrossRef] [Scilit]
- Bernacki, M.L.; Greene, M.J.; Lobczowski, N.G. A systematic review of research on personalized learning: Personalized by whom, to what, how, and for what purpose(s)? Educ. Psychol. Rev. 2021, 33, 1675–1715. [Google Scholar] [CrossRef] [Scilit]
- Howard, M.C.; Hoffman, M.E. Variable-centered, person-centered, and person-specific approaches: Where theory meets the method. Organ. Res. Methods 2018, 21, 846–876. [Google Scholar] [CrossRef] [Scilit]
- Spurk, D.; Hirschi, A.; Wang, M.; Valero, D.; Kauffeld, S. Latent profile analysis: A review and "how to" guide of its application within vocational behavior research. J. Vocat. Behav. 2020, 120, 103445. [Google Scholar] [CrossRef] [Scilit]
- Salminen, J.; Guan, K.; Jung, S.-G.; Jansen, B.J. A survey of 15 years of data-driven persona development. Int. J. Hum.–Comput. Interact. 2021, 37, 1685–1708. [Google Scholar] [CrossRef] [Scilit]
- Shi, Y.; Wu, M.; Wei, Y.; Chen, J.; Dong, Q.; Zhu, K. A person-centered perspective in assessing college students’ self-regulated learning in an online learning environment: Potential profiles, antecedents, and outcomes. Int. J. Educ. Technol. High. Educ. 2025, 22, 66. [Google Scholar] [CrossRef] [Scilit]
- Urva, G.; Desriyati, W. Fuzzy C-Means Algorithm for Grouping Students Based on Preferences and Academic Potential. Sinkron 2025, 9, 366–373. [Google Scholar] [CrossRef] [Scilit]
- Lin, Y.-H.; Chen, C.-C. Integrating Fuzzy Clustering and Profile Analysis on Retrospective Measurement for Project-Based Learning. J. Adv. Comput. Intell. Intell. Inform. 2025, 29, 968–976. [Google Scholar] [CrossRef] [Scilit]
- Morin, A.J.S.; Marsh, H.W. Disentangling Shape from Level Effects in Person-Centered Analyses: An Illustration Based on University Teachers’ Multidimensional Profiles of Effectiveness. Struct. Equ. Model. 2015, 22, 39–59. [Google Scholar] [CrossRef] [Scilit]
- Morin, A.J.S.; Boudrias, J.-S.; Marsh, H.W.; Madore, I.; Desrumaux, P. Further Reflections on Disentangling Shape and Level Effects in Person-Centered Analyses: An Illustration Exploring the Dimensionality of Psychological Health. Struct. Equ. Model. 2016, 23, 438–454. [Google Scholar] [CrossRef] [Scilit]
- Panadero, E. A review of self-regulated learning: Six models and four directions for research. Front. Psychol. 2017, 8, 422. [Google Scholar] [CrossRef] [Scilit] [PubMed]
- Abyaa, A.; Khalidi Idrissi, M.; Bennani, S. Learner modelling: Systematic review of the literature from the last 5 years. Educ. Technol. Res. Dev. 2019, 67, 1105–1143. [Google Scholar] [CrossRef] [Scilit]
- Martin, F.; Chen, Y.; Moore, R.L.; Westine, C.D. Systematic review of adaptive learning research designs, context, strategies, and technologies from 2009 to 2018. Educ. Technol. Res. Dev. 2020, 68, 1903–1929. [Google Scholar] [CrossRef] [Scilit]
- Meehl, P.E. Factors and taxa, traits and types, differences of degree and differences in kind. J. Pers. 1992, 60, 117–174. [Google Scholar] [CrossRef] [Scilit]
- Haslam, N.; Holland, E.; Kuppens, P. Categories versus dimensions in personality and psychopathology: A quantitative review of taxometric research. Psychol. Med. 2012, 42, 903–920. [Google Scholar] [CrossRef] [Scilit] [PubMed]
- Cronbach, L.J.; Gleser, G.C. Assessing similarity between profiles. Psychol. Bull. 1953, 50, 456–473. [Google Scholar] [CrossRef] [Scilit] [PubMed]
- Hennig, C. Cluster-wise assessment of cluster stability. Comput. Stat. Data Anal. 2007, 52, 258–271. [Google Scholar] [CrossRef] [Scilit]
- Huang, D.-H.; Wang, Y.-C. Bridging the Engagement–Regulation Gap: A Longitudinal Evaluation of AI-Enhanced Learning Attitudes in Social Work Education. Information 2026, 17, 107. [Google Scholar] [CrossRef] [Scilit]
- Dunn, T.J.; Baguley, T.; Brunsden, V. From alpha to omega: A practical solution to the pervasive problem of internal consistency estimation. Br. J. Psychol. 2014, 105, 399–412. [Google Scholar] [CrossRef] [Scilit] [PubMed]
- Meade, A.W.; Craig, S.B. Identifying careless responses in survey data. Psychol. Methods 2012, 17, 437–455. [Google Scholar] [CrossRef] [Scilit] [PubMed]
- Curran, P.G. Methods for the detection of carelessly invalid responses in survey data. J. Exp. Soc. Psychol. 2016, 66, 4–19. [Google Scholar] [CrossRef] [Scilit]
- Bezdek, J.C.; Ehrlich, R.; Full, W. FCM: The fuzzy c-means clustering algorithm. Comput. Geosci. 1984, 10, 191–203. [Google Scholar] [CrossRef] [Scilit]
- Xie, X.L.; Beni, G. A validity measure for fuzzy clustering. IEEE Trans. Pattern Anal. Mach. Intell. 1991, 13, 841–847. [Google Scholar] [CrossRef] [Scilit]
- Rousseeuw, P.J. Silhouettes: A graphical aid to the interpretation and validation of cluster analysis. J. Comput. Appl. Math. 1987, 20, 53–65. [Google Scholar] [CrossRef] [Scilit]
- Pal, N.R.; Bezdek, J.C. On cluster validity for the fuzzy c-means model. IEEE Trans. Fuzzy Syst. 1995, 3, 370–379. [Google Scholar] [CrossRef] [Scilit]
- Hubert, L.; Arabie, P. Comparing partitions. J. Classif. 1985, 2, 193–218. [Google Scholar] [CrossRef] [Scilit]
- Steinley, D. Properties of the Hubert-Arabie adjusted Rand index. Psychol. Methods 2004, 9, 386–396. [Google Scholar] [CrossRef] [Scilit] [PubMed]
- Bauer, D.J.; Curran, P.J. Distributional assumptions of growth mixture models: Implications for overextraction of latent trajectory classes. Psychol. Methods 2003, 8, 338–363. [Google Scholar] [CrossRef] [Scilit] [PubMed]
- Marsh, H.W.; Lüdtke, O.; Trautwein, U.; Morin, A.J.S. Classical latent profile analysis of academic self-concept dimensions: Synergy of person- and variable-centered approaches to theoretical models of self-concept. Struct. Equ. Model. 2009, 16, 191–225. [Google Scholar] [CrossRef] [Scilit]
- Ferguson, S.L.; Moore, E.W.G.; Hull, D.M. Finding latent groups in observed data: A primer on latent profile analysis in Mplus for applied researchers. Int. J. Behav. Dev. 2020, 44, 458–468. [Google Scholar] [CrossRef] [Scilit]
- Khosravi, H.; Buckingham Shum, S.; Chen, G.; Conati, C.; Tsai, Y.-S.; Kay, J.; Knight, S.; Martinez-Maldonado, R.; Sadiq, S.; Gašević, D. Explainable Artificial Intelligence in education. Comput. Educ. Artif. Intell. 2022, 3, 100074. [Google Scholar] [CrossRef] [Scilit]
- Baker, R.S.; Hawn, A. Algorithmic bias in education. Int. J. Artif. Intell. Educ. 2022, 32, 1052–1092. [Google Scholar] [CrossRef] [Scilit]
- Theobald, M. Self-regulated learning training programs enhance university students’ academic performance, self-regulated learning strategies, and motivation: A meta-analysis. Contemp. Educ. Psychol. 2021, 66, 101976. [Google Scholar] [CrossRef] [Scilit]
- Roth, A.; Ogrin, S.; Schmitz, B. Assessing self-regulated learning in higher education: A systematic literature review of self-report instruments. Educ. Assess. Eval. Account. 2016, 28, 225–250. [Google Scholar] [CrossRef] [Scilit]

Disclaimer/Publisher’s Note: The statements, opinions and data contained in all publications are solely those of the individual author(s) and contributor(s) and not of MDPI and/or the editor(s). MDPI and/or the editor(s) disclaim responsibility for any injury to people or property resulting from any ideas, methods, instructions or products referred to in the content. |
© 2026 by the authors. Licensee MDPI, Basel, Switzerland. This article is an open access article distributed under the terms and conditions of the Creative Commons Attribution (CC BY) license.