Skip to Content
InformationInformation
  • Article
  • Open Access

14 September 2022

Analysis of the Correlation between Mass-Media Publication Activity and COVID-19 Epidemiological Situation in Early 2022


,
,
,
,
,
,
,
,
1
Institute of Information and Computational Technologies, Almaty 050010, Kazakhstan
2
Institute of Automation and Information Technology, Satbayev University (KazNRTU), Almaty 050013, Kazakhstan
3
School of Engineering Management, Almaty Management University, Almaty 050060, Kazakhstan
4
Faculty of Management Science and Informatics, University of Zilina, 010 26 Žilina, Slovakia

Abstract

The paper presents the results of a correlation analysis between the information trends in the electronic media of Kazakhstan and indicators of the epidemiological situation of COVID-19 according to the World Health Organization (WHO). The developed method is based on topic modeling and some other methods of processing natural language texts. The method allows for calculating the correlations between media topics, moods, the results of full-text search queries, and objective WHO data. The analysis of the results shows how the attitudes of society towards the problems of COVID-19 changed from 2021–2022. Firstly, the results reflect a steady trend of decreasing interest of electronic media in the topic of the pandemic, although to an unequal extent for different thematic groups. Secondly, there has been a tendency to shift the focus of attention to more pragmatic issues, such as remote learning problems, remote work, the impact of quarantine restrictions on the economy, etc.

1. Introduction

The healthcare systems of almost all countries face numerous problems caused by increased demand for medical services and high expectations of the population in the periods of pandemic, and these factors entail higher costs [1]. It also should be noted that social and medical efficiency as well as economic one are important for the healthcare system since, as it was mentioned in [2], the medical activities of a therapeutic and preventive nature may be economically unprofitable, but the medical and social effect requires their implementation. This statement is especially true in the context of a pandemic. On the other hand, the COVID-19 pandemic is an appropriate example of how rumors and incomplete knowledge affect society. People rely on mass media as a source of information and feel uncertainty when threats arise in the environment [3]. According to the authors in [4], the pandemic provoked a surge of rumors and misinformation, which hindered the rational behavior of the population and, to some extent, facilitated the acceleration of the spread of the virus. The media reports significantly affected people’s emotions and psychological resilience in the course of the COVID-19 pandemic, [5]. More than 51% of news headlines in English-language media were negative in this period, and only about 30% of them were positive [6]. The information presented in such way can arouse negative emotions in a large number of people and can pose a threat to the human psyche [7]. As a result of the accompanying stress, the immunity suffers and people become more susceptible to infectious diseases. The population receives a significant portion of information through electronic media since most of the world’s population are Internet users. For example, in Kazakhstan, almost the entire adult population (14.73 million) use the Internet [8].
Therefore, an assessment of objectivity and quality of the presentation of materials by electronic media during the pandemic period allows for an understanding of how the media react to the current situation and to the necessary measures in the healthcare system. This assessment may reflect the quality of the presentation of materials and the “emotional overheating” of information; it can be used for the correction of published materials in order to increase the emotional and psychological stability of readers in the period of serious social shocks. Such estimation can be carried out using one of the subsections of artificial intelligence (AI): the methods of natural language processing (NLP) [9].
Firstly, the media influence public opinion, and therefore, the issues that are covered in the media contribute more to the worries of society. Secondly, the media, like any business, try to provide a product (publications) in accordance with the public demand, and cover those issues that concern society to a greater extent. Thirdly, the objectivity of the media can be assessed by comparing publications with the actual indicators of the pandemic. Therefore, in this work, the authors evaluated the results of the work of the media by comparative analysis of publication activity and objective WHO data exemplified by the media of Kazakhstan.
The goal of the work was to assess the dynamics of the correlation between the array of media publications of a particular country and the actual data of the COVID-19 pandemic. This research contributes to the development of a method, which makes it possible to evaluate the dynamic correlation between the materials published by the media and the objective data of the pandemic, and thereby to form an idea of their objectivity.
This paper consists of the following sections:
  • Section 2 is devoted to the review of the studies on media analysis in the COVID-19 pandemic period;
  • Section 3 contains a brief description of the applied method;
  • Section 4 reveals and discusses the results.
We conclude with a summary of the discussion and possible objectives for future research.

3. Methods

In order to solve this problem, three aspects of measuring the dynamics of media publication activity in numerical form were investigated: automatically generated topics, average tone, and dynamic indicators based on the search queries, which were selected in a manual way. The basic steps of the method are as follows (see Figure 1):
1.
Create a corpus of documents using an automatic data collection system;
2.
Make a hierarchical thematic model using the methods described in [27];
3.
Calculate correlations between groups of dynamic media indicators and objective epidemiological indicators.
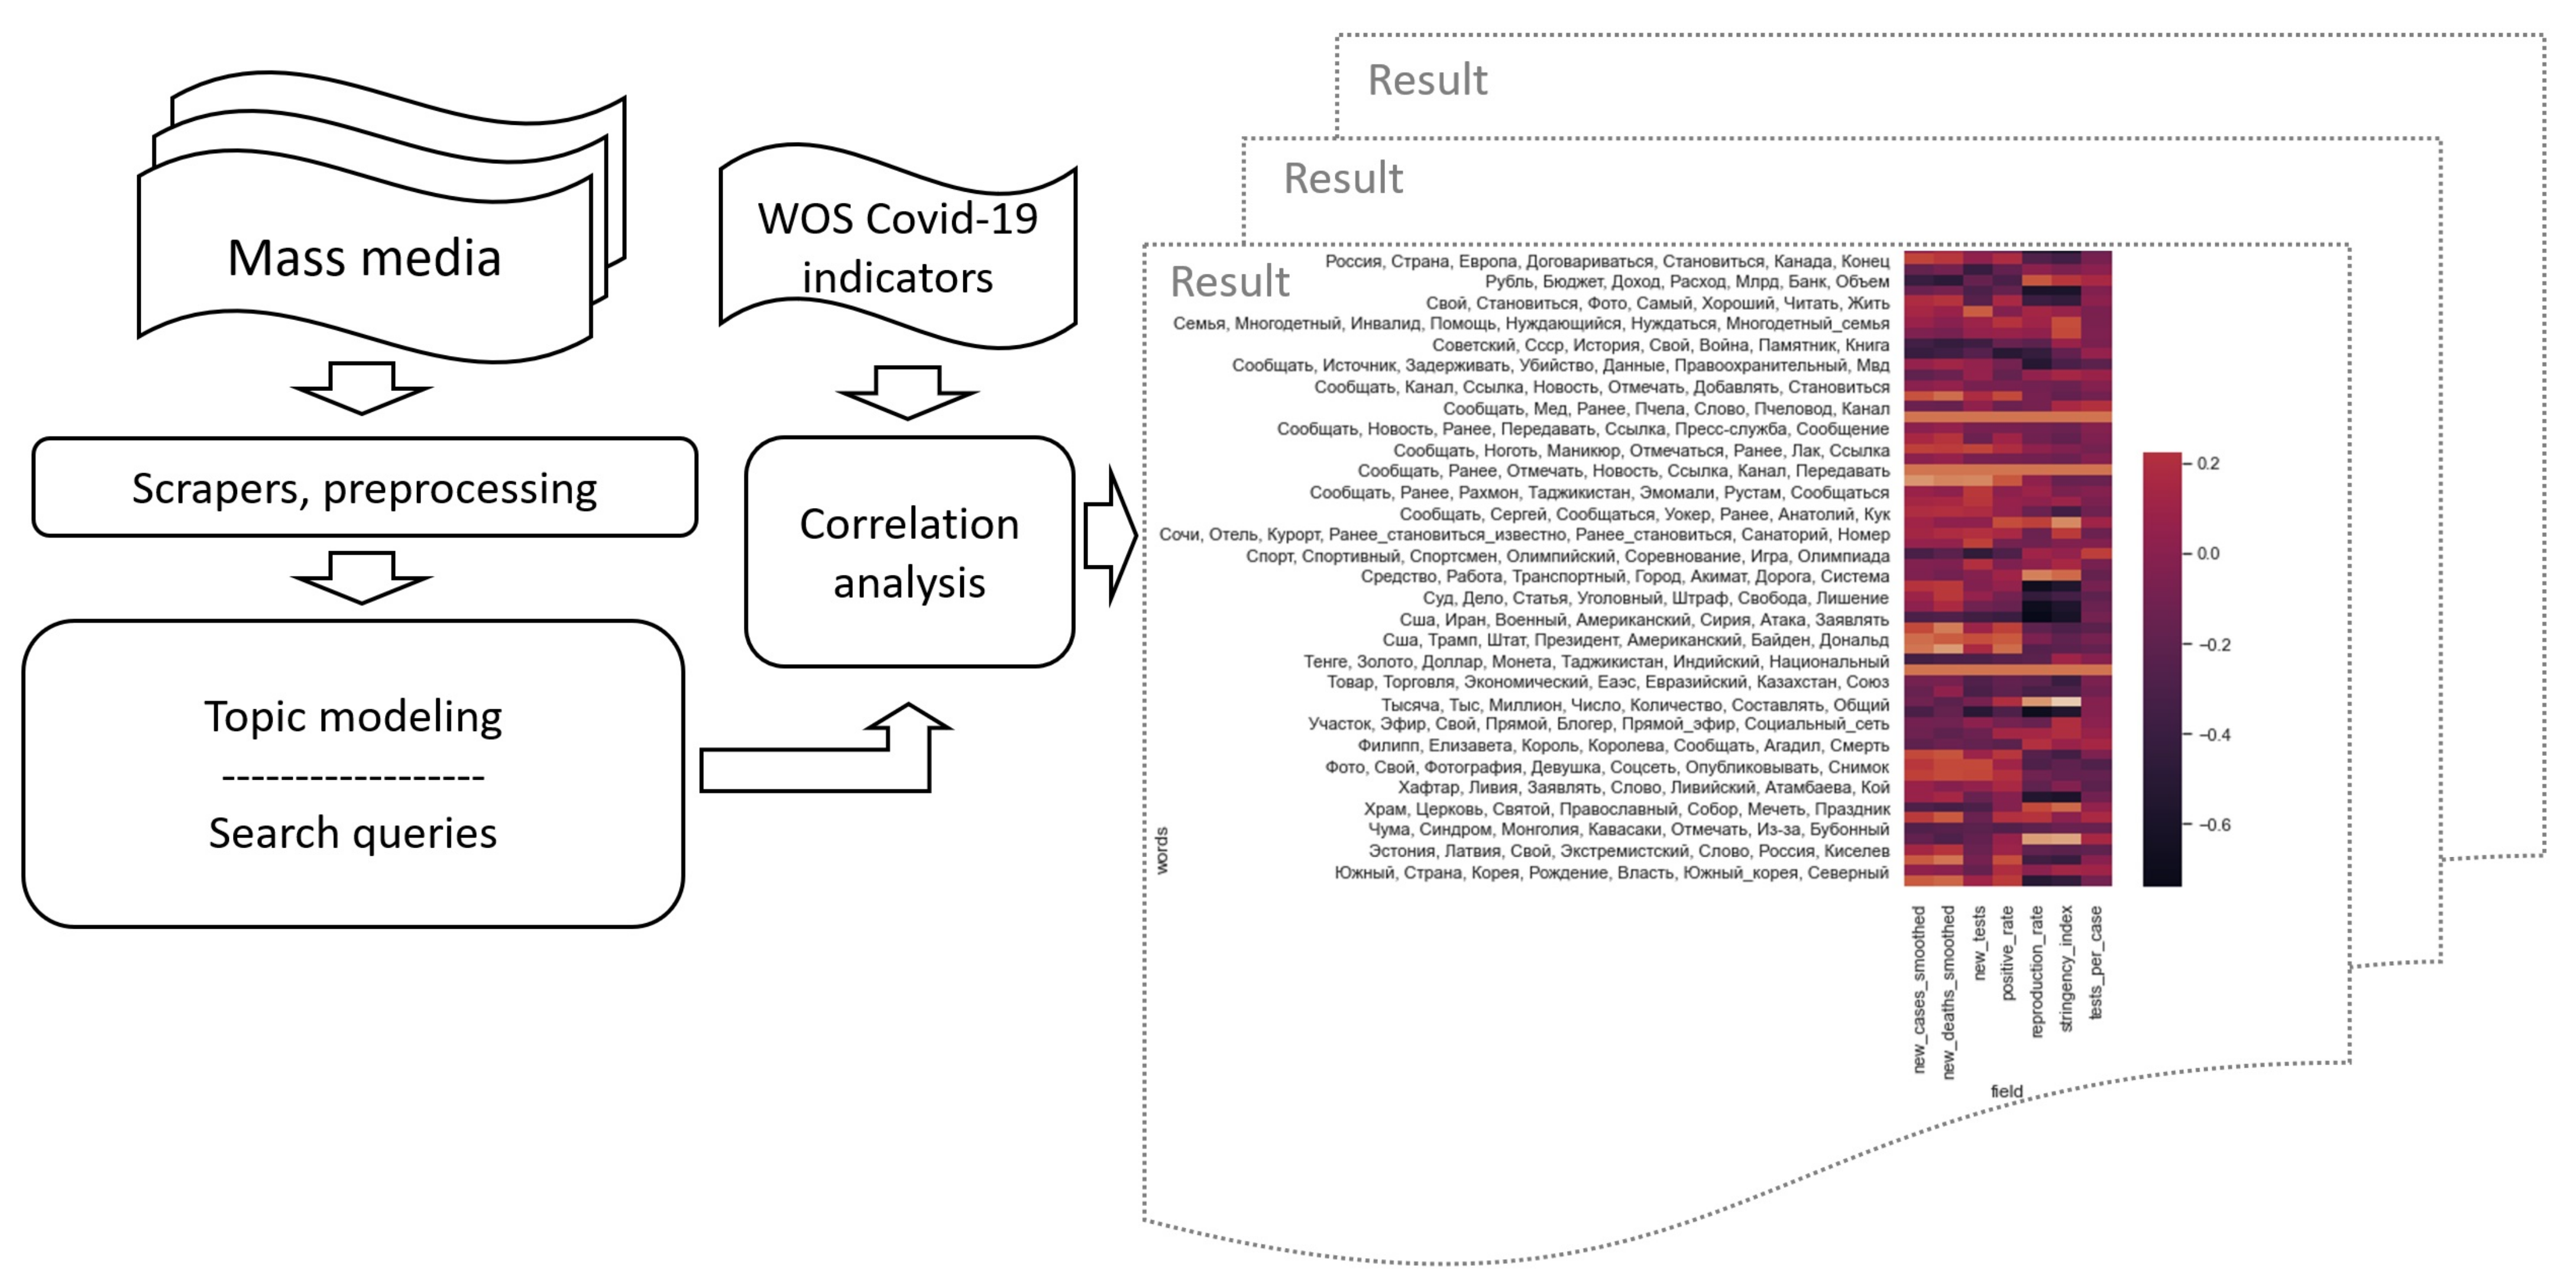
Figure 1. Method of assessing the mass media.
Further details on these steps are considered below.

3.1. Corpus of Documents

By scraping the Russian-language media of Kazakhstan, the corpus of documents was compiled [28]. The corpus comprises 761,831 documents related to the top news websites in the country published in the period from the start of 2020 to 23 February 2022. The corpus was collected using Scrapy Python library and contains news publications from over 20 major Russian-language news websites of Kazakhstan.

3.2. Preprocessing

Two preprocessing steps were applied to the corpus: lemmatization and creating n-grams.
Lemmatization was performed using PyMystem3 Python library, a wrapper for Yandex MyStem 3.1 morphological analyzer. No stop-word list or additional rules were applied, since ARTM regularizers can be tuned in such a way that common or utility words will be automatically excluded from analysis (as can be seen in the results section of the work).
N-grams were limited to bi- and trigrams. A frequency dictionary of all possible bigrams and trigrams of the corpus was built, and then only the n-grams between 90th and 60th percentiles (sorted by frequency) were included in the final dictionary.

3.3. The Creation of a Hierarchical Thematic Model

Thematic modeling is one of the very important methods of analyzing large bodies of texts. Researchers usually use LDA to construct a topic model [29]. In this study, the authors used ARTM, an extension of LDA, which differs in the use of configurable regularizers; these regularizers allow fine-tuning of the desired model output, including reducing or increasing the model’s propensity to include a word and/or document in multiple tops, changing the model’s propensity to have more or less non-zero weights in the resulting matrix, and so on.
Additive regularization, which restores the original distribution of words on documents D by maximizing the logarithm of plausibility, is combined with a weighted sum of regularizers (2), which is based on a wide variety of criteria:
d     D w     D n d w l n   t     T φ w t θ t d + R φ , θ m a x
R φ , θ = i = 1 τ i R i φ , θ
where “ n d w is the frequency of the appearance of word w in the document d, φ w t is the word w distribution in topic t, θ t d is the distribution of the topic t over the documents d, and i = 1 τ i R i φ , θ is a weighted linear combination of regularizers (R) with non-negative τ i weights” [30]. There are decreasing regularizers, smoothing regularizers, and de-corrective regularizers.
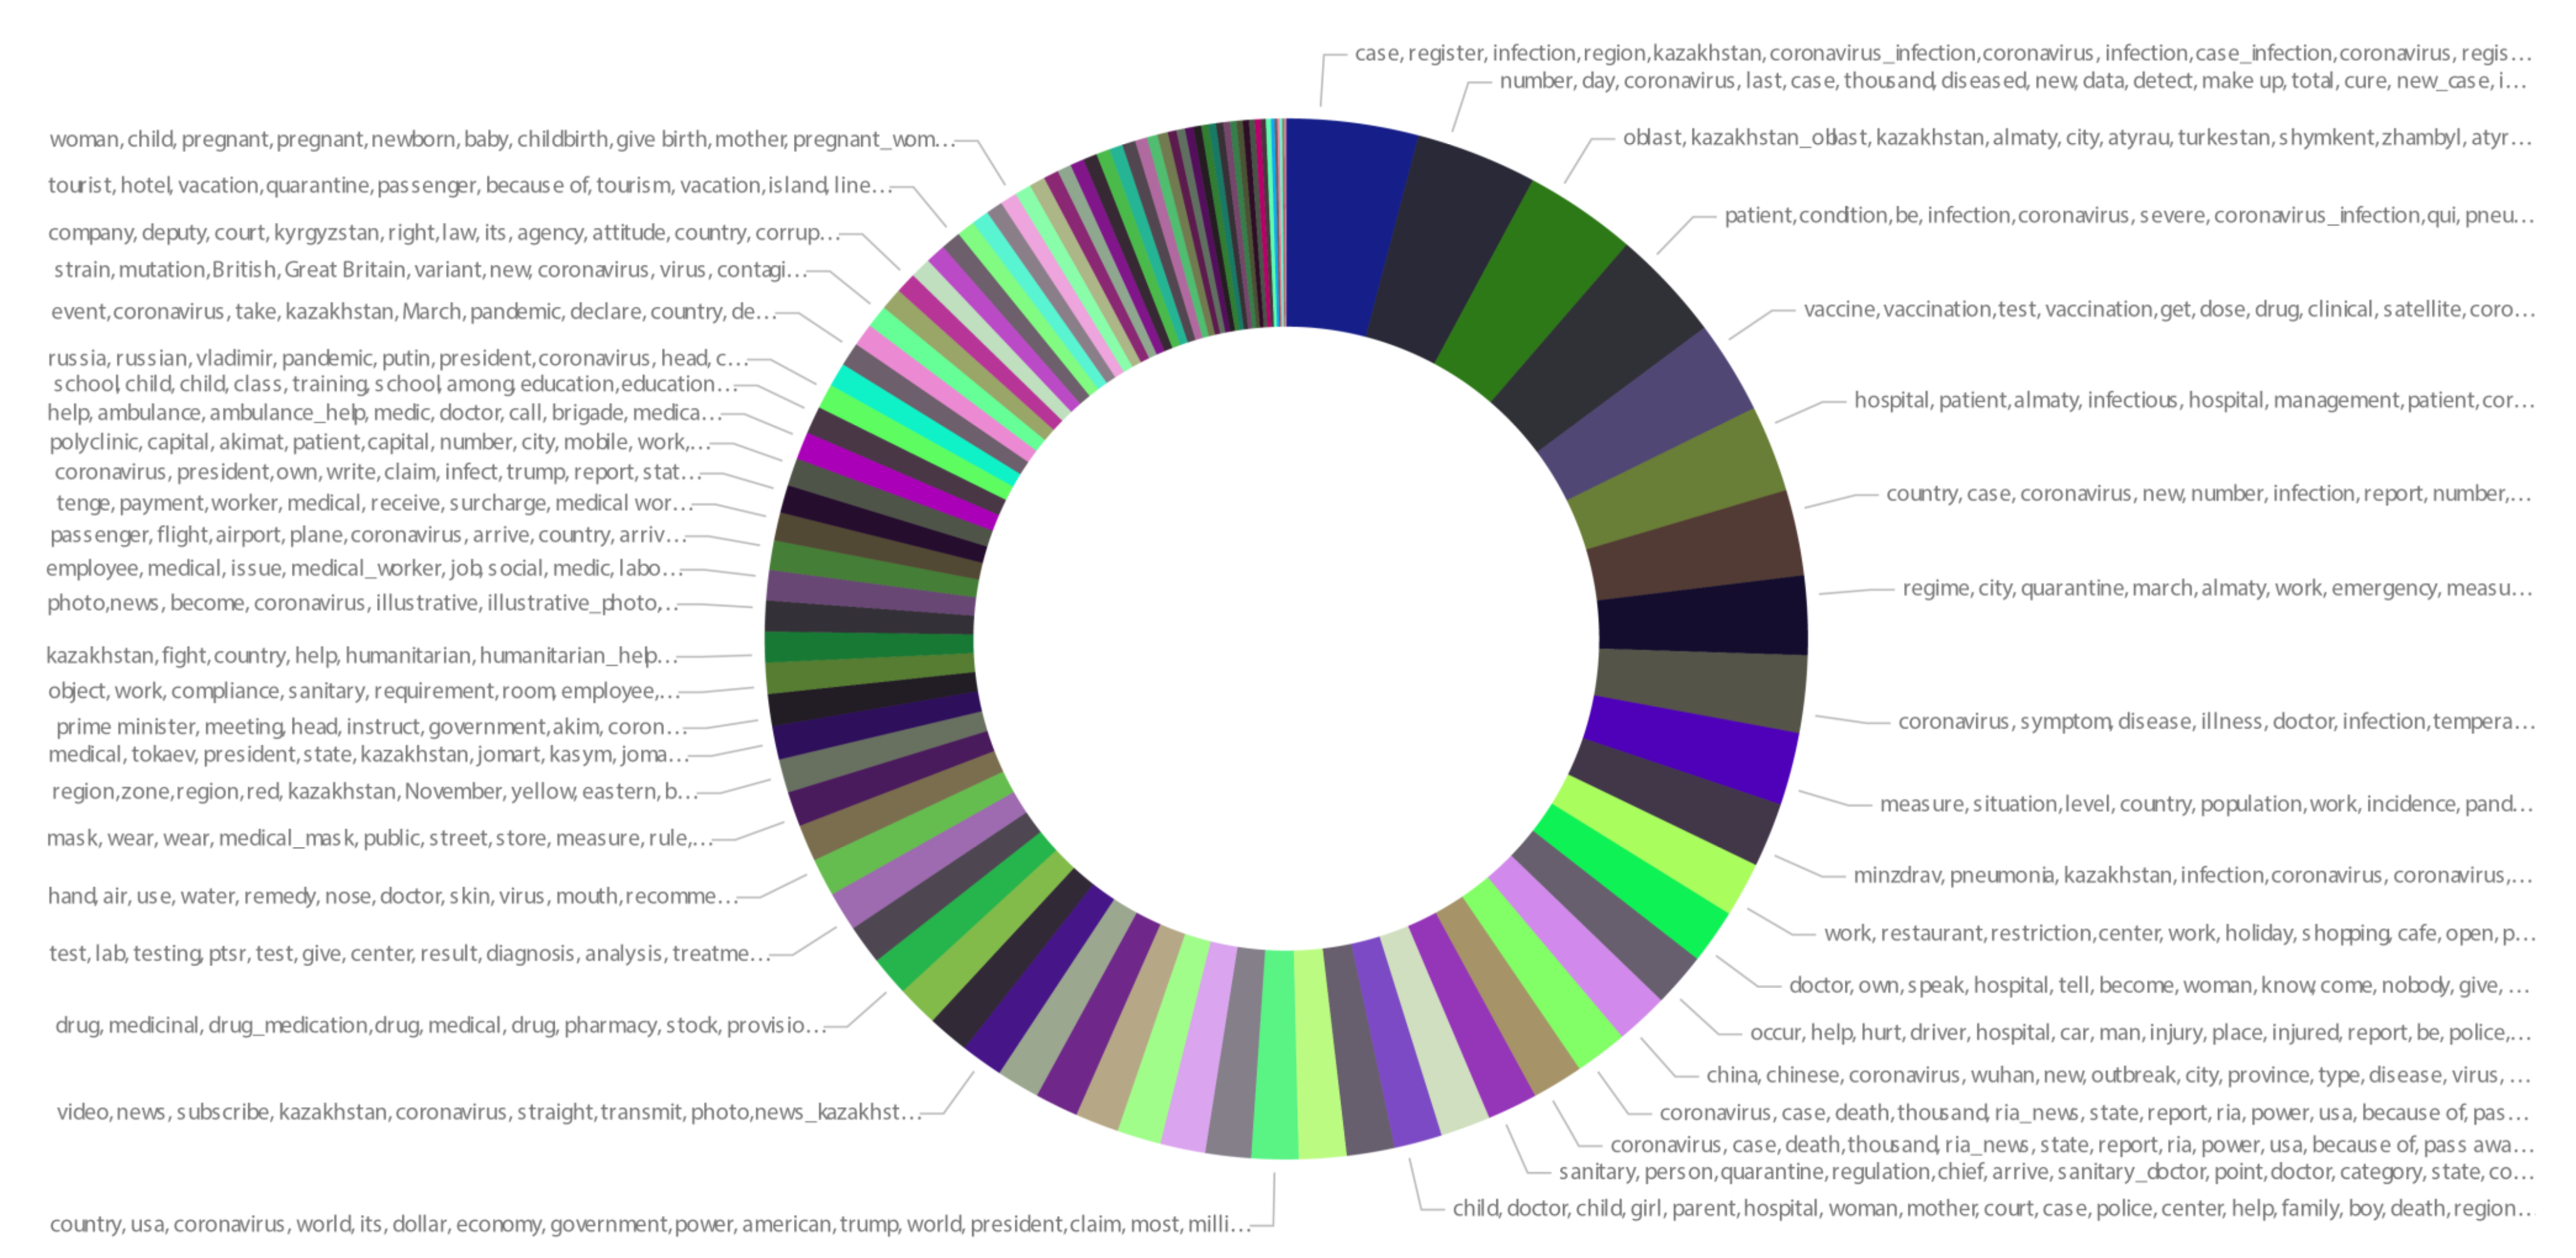
Using BigARTM library [26], we created a topic model that consists of 200 clusters of documents, from which experts chose 12 clusters relating to medicine. A sub-corpus of 119,956 documents was formed from these 12 clusters, on which thematic modeling was again performed with the formation of 150 thematic groups, from which the 47 most relevant thematic groups were selected (threshold exceeding 0.05). A sub-corpus of 100,481 documents was used to form the final model. Each resulting cluster contained texts with an affiliation greater than 0.1. Figure 2 shows the topic model with the most relevant words for each cluster.
Figure 2. Thematic groups of texts ranked by the number of documents.

3.4. Correlation Analysis

Objective indicators of the pandemic listed in [31] include the following indicators: the total of new tests for COVID-19, done on a daily basis; the share of positive results of tests as an average 7-day value (an inverse value of tests per case); the 7-day smoothed value of new proved cases of COVID-19; 7-day smoothed indicator of new deaths cases associated with COVID-19; 7-day average number of conductedtests per confirmed case of COVID-19, which is an inverse indicator for the positive rate; real-time evaluation of the productive reproduction rate (R) of COVID-19 virus; and Stringency index (Government Response Stringency Index: this indicator integrates 9 response indicators such as closed school and workplace, prohibited travel, etc.; the value is rescaled from 0 to 100 (100 is strictest response)). Each indicator was grouped into a thematic cluster with the highest correlation coefficient.

3.5. Source Code

Source code for the information system NLPMonitor, which supported the collection, processing, storage, and analysis of the data is available in [32].
Source code for the computational tasks is available in [33].

3.6. Threats to Validity

This research is based on the hypothesis that characteristics of relation between epidemiological, social, and economical issues and how they are being reflected in mass media is constant across the analyzed timeframe. However, over more than two years under analysis, some external factors affecting the relation could be subject to change. Some of the possible external factors include legislation changes (related to mass media), cultural or mentality shift, significant changes in economical well-being, etc. If such external factors changed significantly, interpretation of some of the results might be incorrect. We are not aware of any significant changes in important external factors during the analyzed period.

4. Results and Discussion

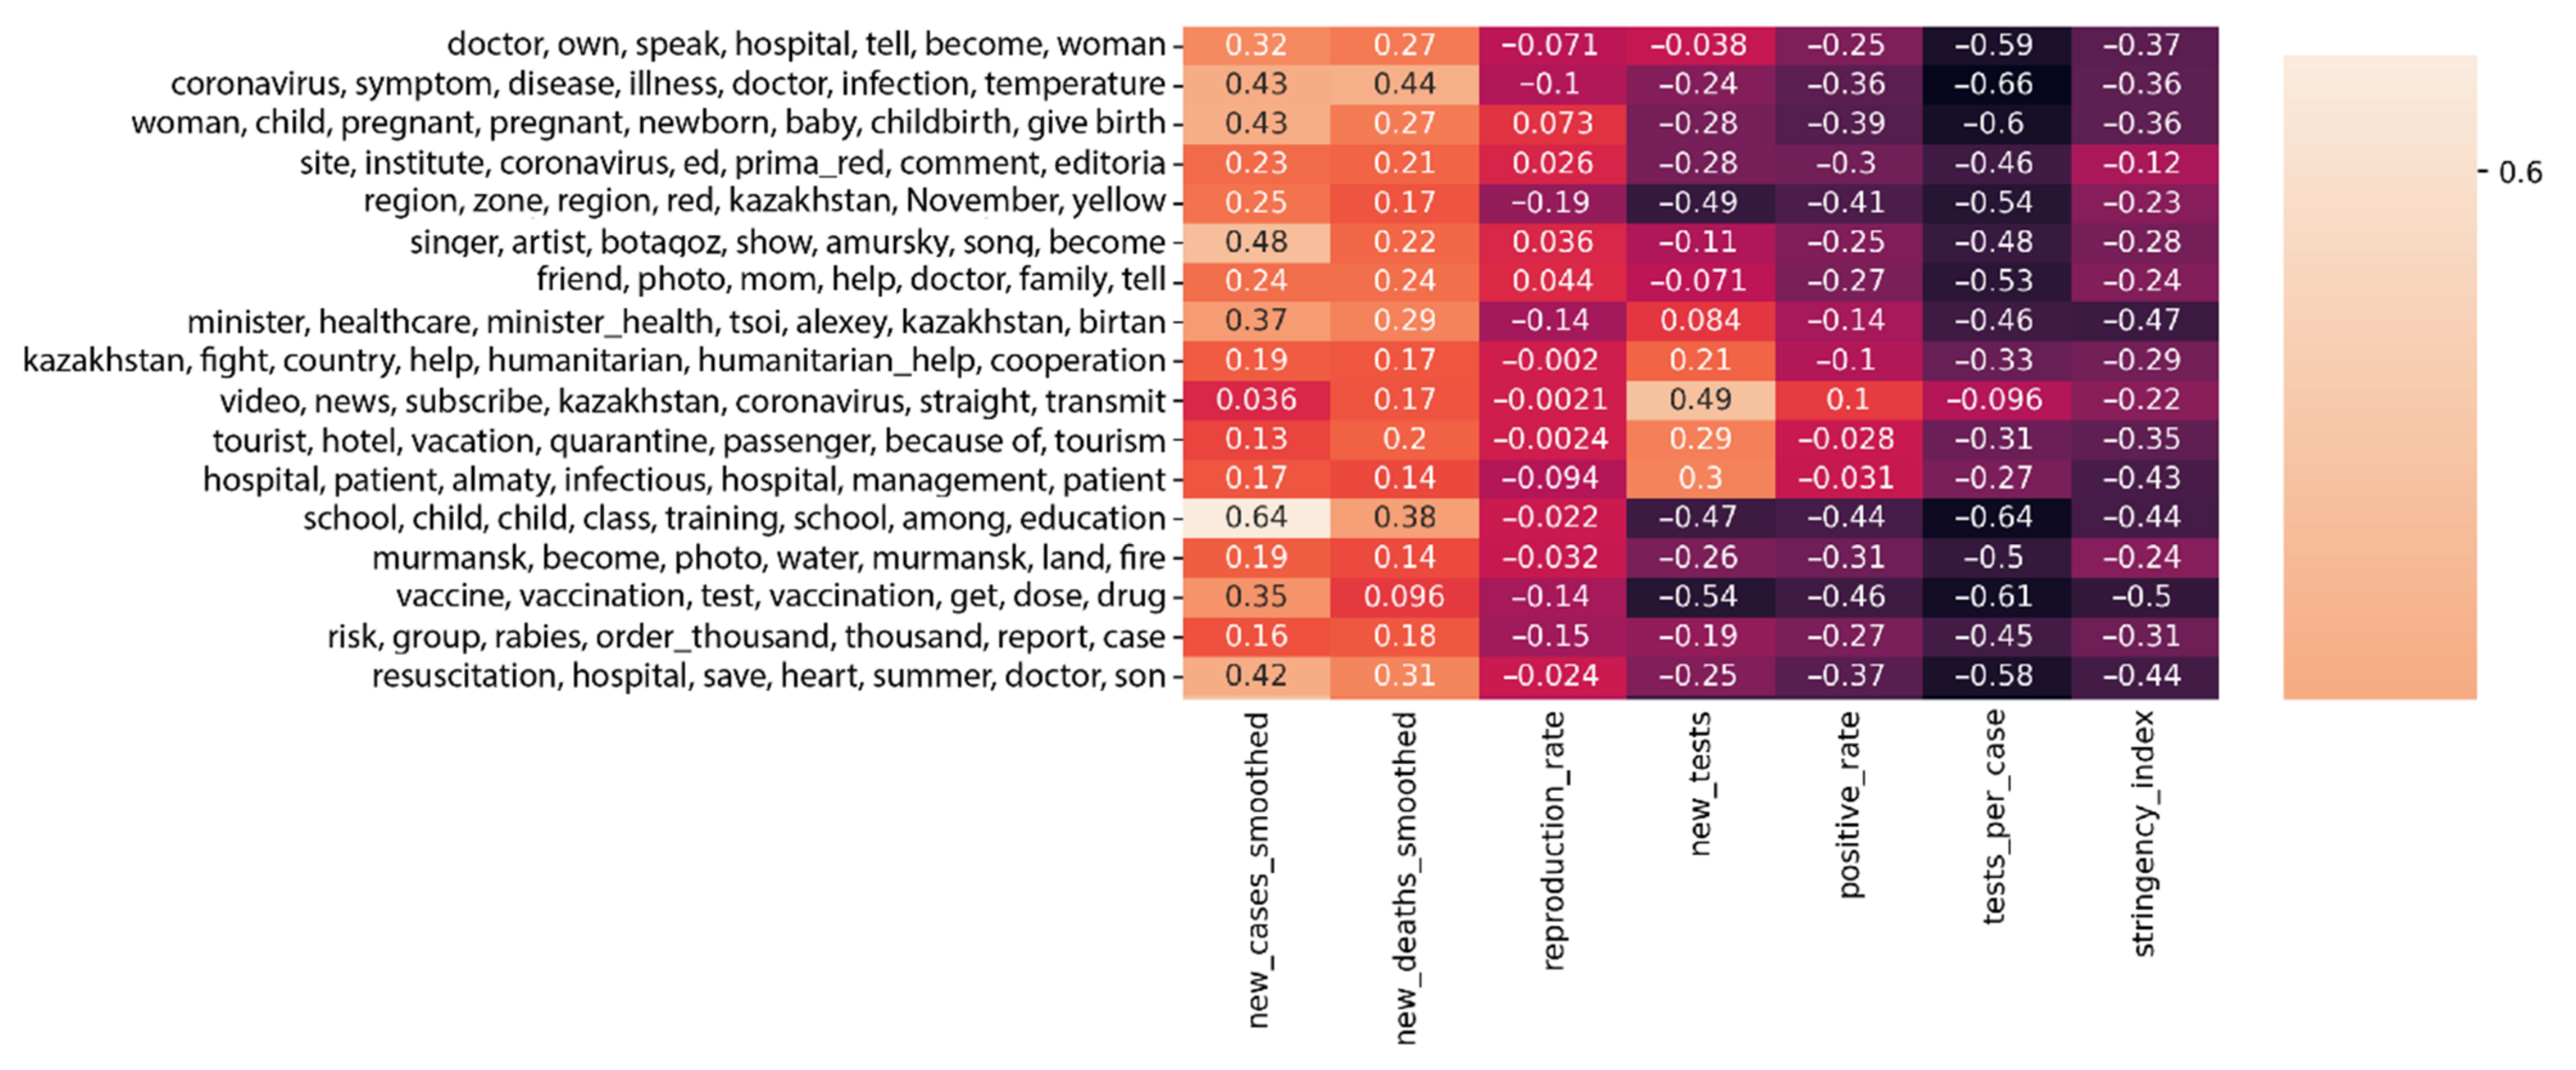
Using the method described above, a correlation matrix was constructed between thematic clusters of the corpus of texts reflecting information about the pandemic and the objective indicators listed above (see Figure 3). The full correlation matrix is shown in Appendix B.
Figure 3. Correlation between thematic clusters expressed as sets of the most relevant words (vertical) and pandemic indicators (bottom horizontal: variables new_cases_smoothed, new_deaths_smoothed, etc.).
With a thematic model, we can reduce the subjectivity inherent in expert analysis by correlating the dynamics of media activity. By doing so, a more objective picture of the correlation between significant information trends and the epidemiological situation can be formed. This approach, however, has its limitations. The number of topic clusters (topics), as well as other parameters of the topic model, are set manually, usually based on objective quality metrics (Perplexity, Sparsity Score [26], and the shoulder principle [34]). Accordingly, due to the limited number of topics, some subjectively important topics are not automatically generated.
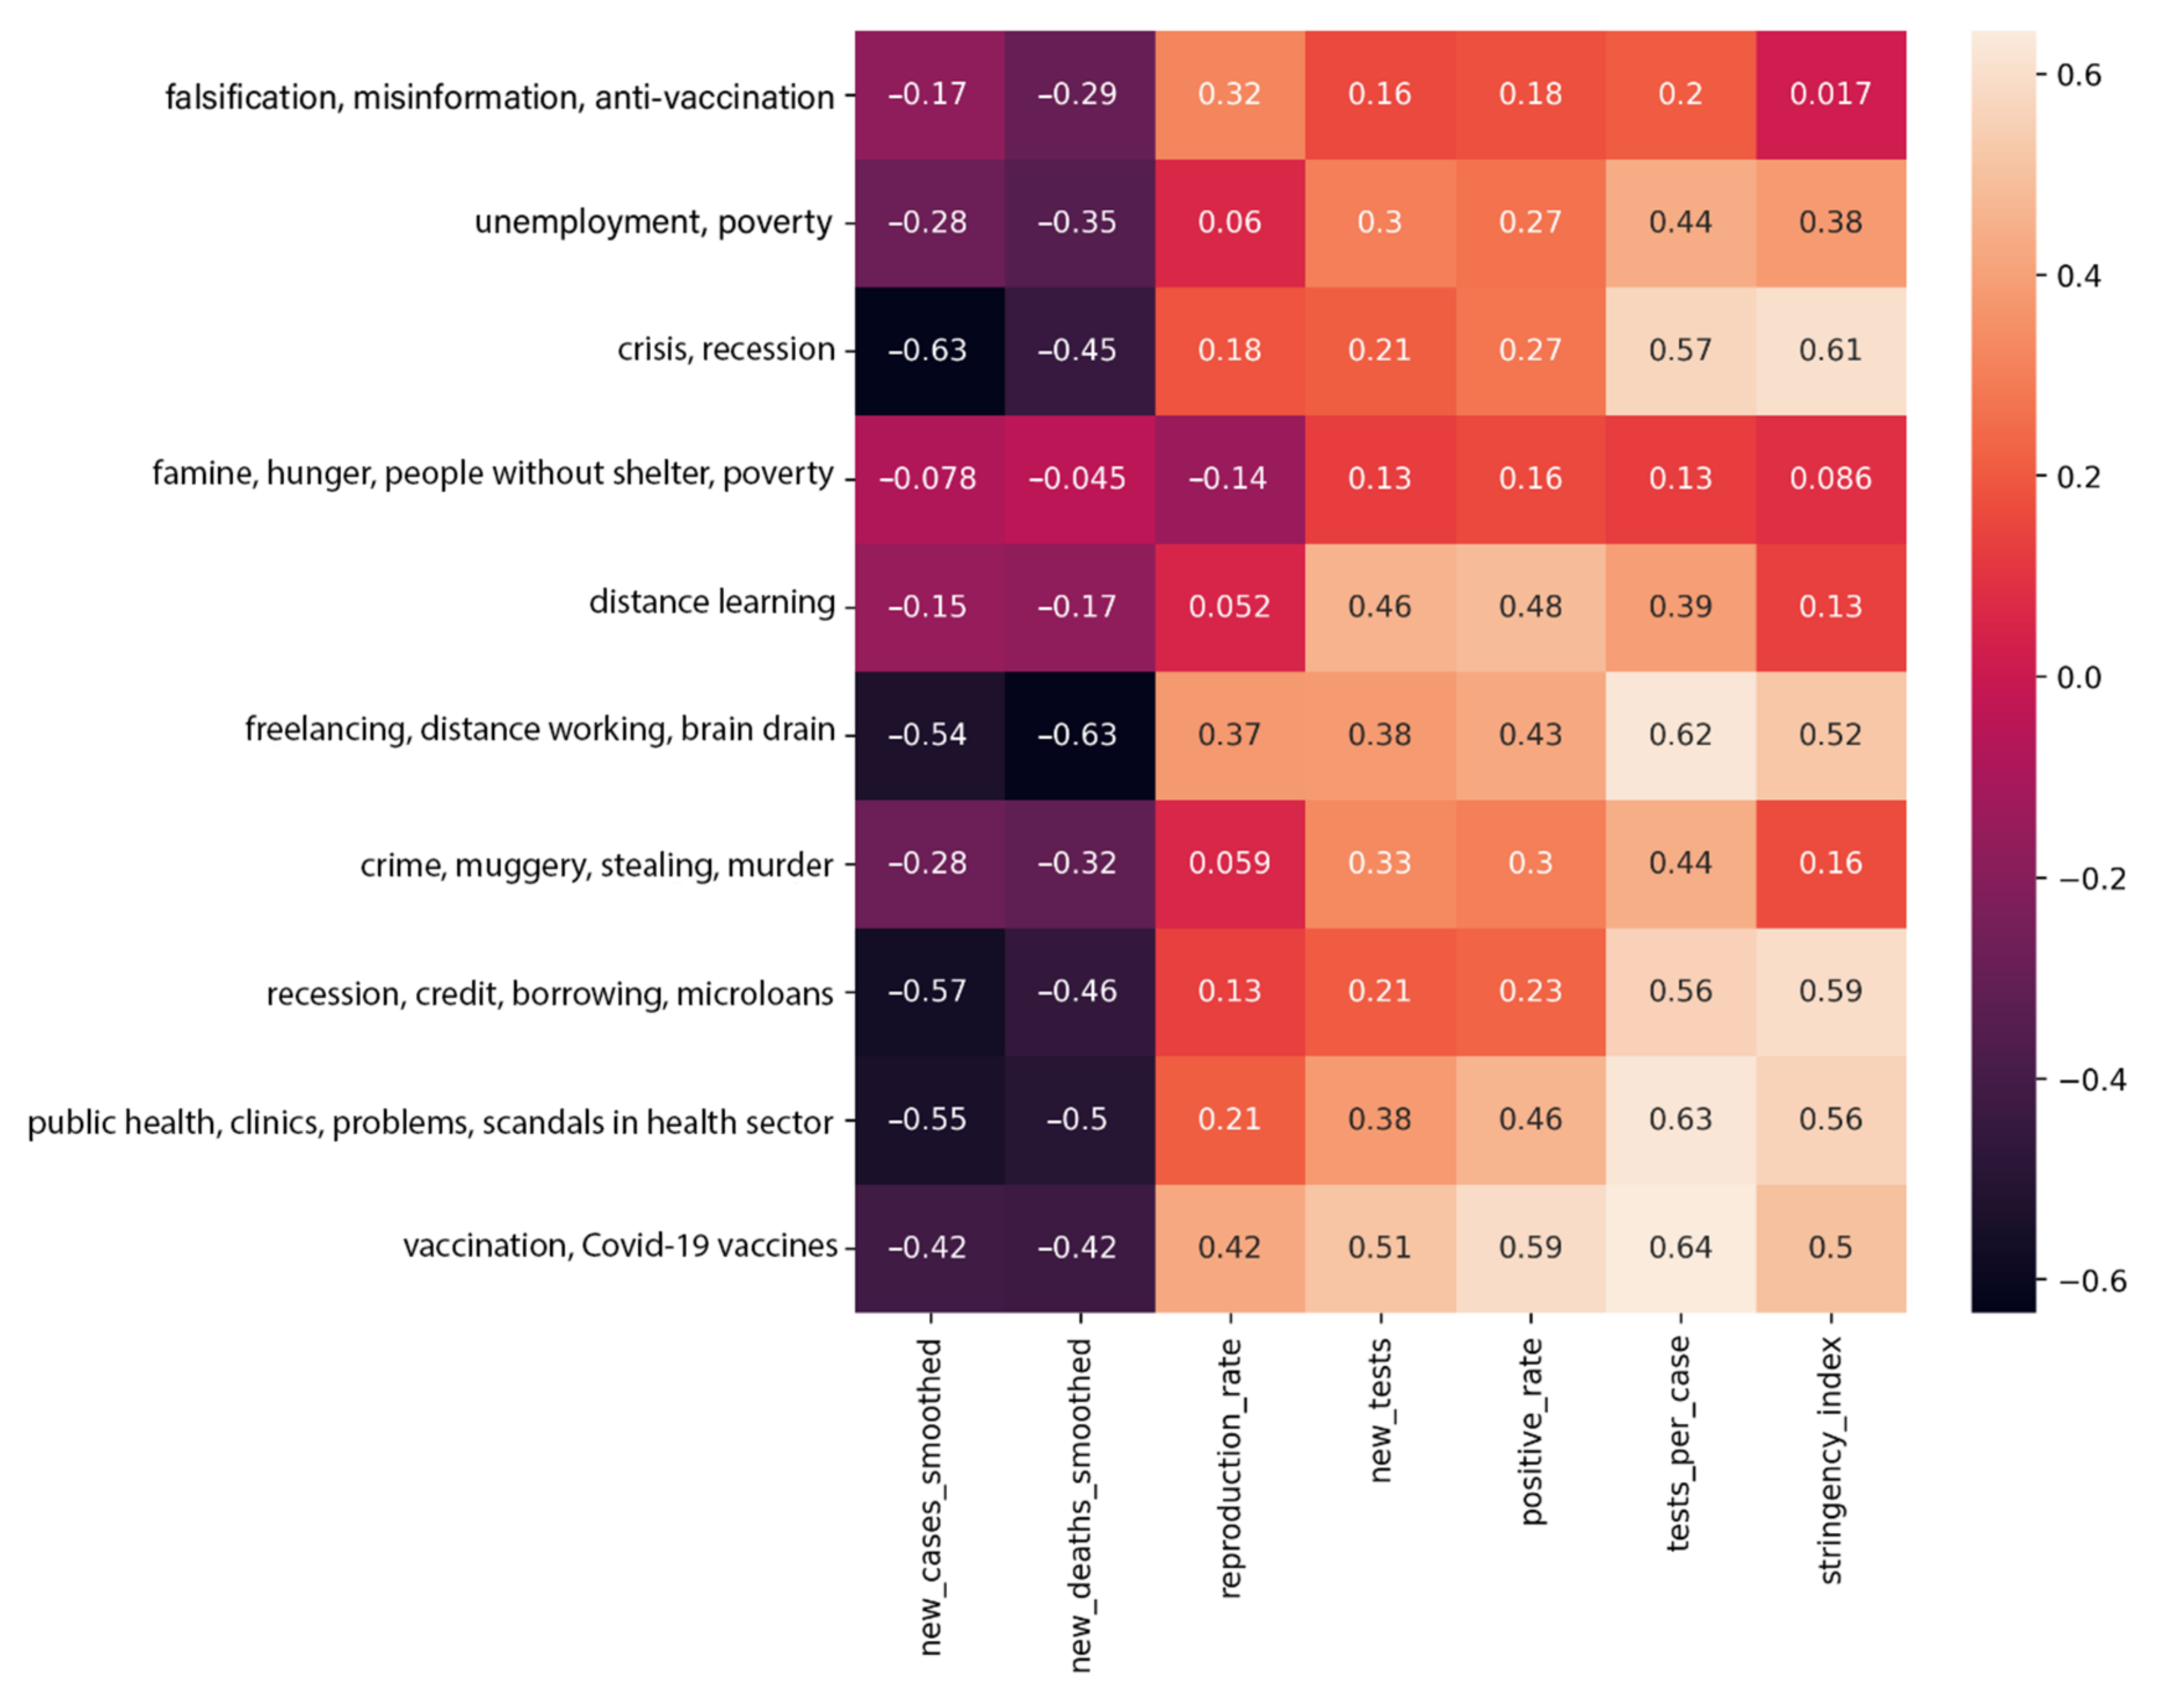
For this reason, it is proposed to additionally use a set of manually generated search queries, which allow for the testing of individual hypotheses about the connection between the publication activity of a certain topic and the epidemiological situation. The following inquiries were suggested in [34]:
  • Falsification, misinformation, anti-vaccination;
  • Unemployment, poverty;
  • Crisis, recession;
  • Famine, hunger, people without shelter, poverty;
  • Distance learning;
  • Freelancing, distance working, brain drain;
  • Crime, muggery, stealing, murder;
  • Recession, credit, borrowing, microloans;
  • Public health, clinics, problems, scandals in health sector;
  • Vaccination, COVID-19 vaccines.
The authors of this study analyzed the dynamics of publication activity applying the above list of queries, allowing a comparative analysis of correlations over a longer time span. The search for these queries (in Russian) was performed with ElasticSearch using the method of full text search, presented the list of matched entries with the relative weights. ElasticSearch is a distributed open-source search engine that allows efficient full-text searching through a standard HTTP API. It is able to provide relevance coefficients given a text and search query based on how many words or n-grams co-occur in both the text and the search query. The average daily values of these relative weights were then calculated for the analysis and used for the correlation analysis. The correlation matrix for the queries listed is shown in Figure 4.
Figure 4. Correlation between the dynamics of search query activity (vertical) and pandemic rates (bottom horizontal: variables new_cases_smoothed, new_deaths_smoothed, etc.).
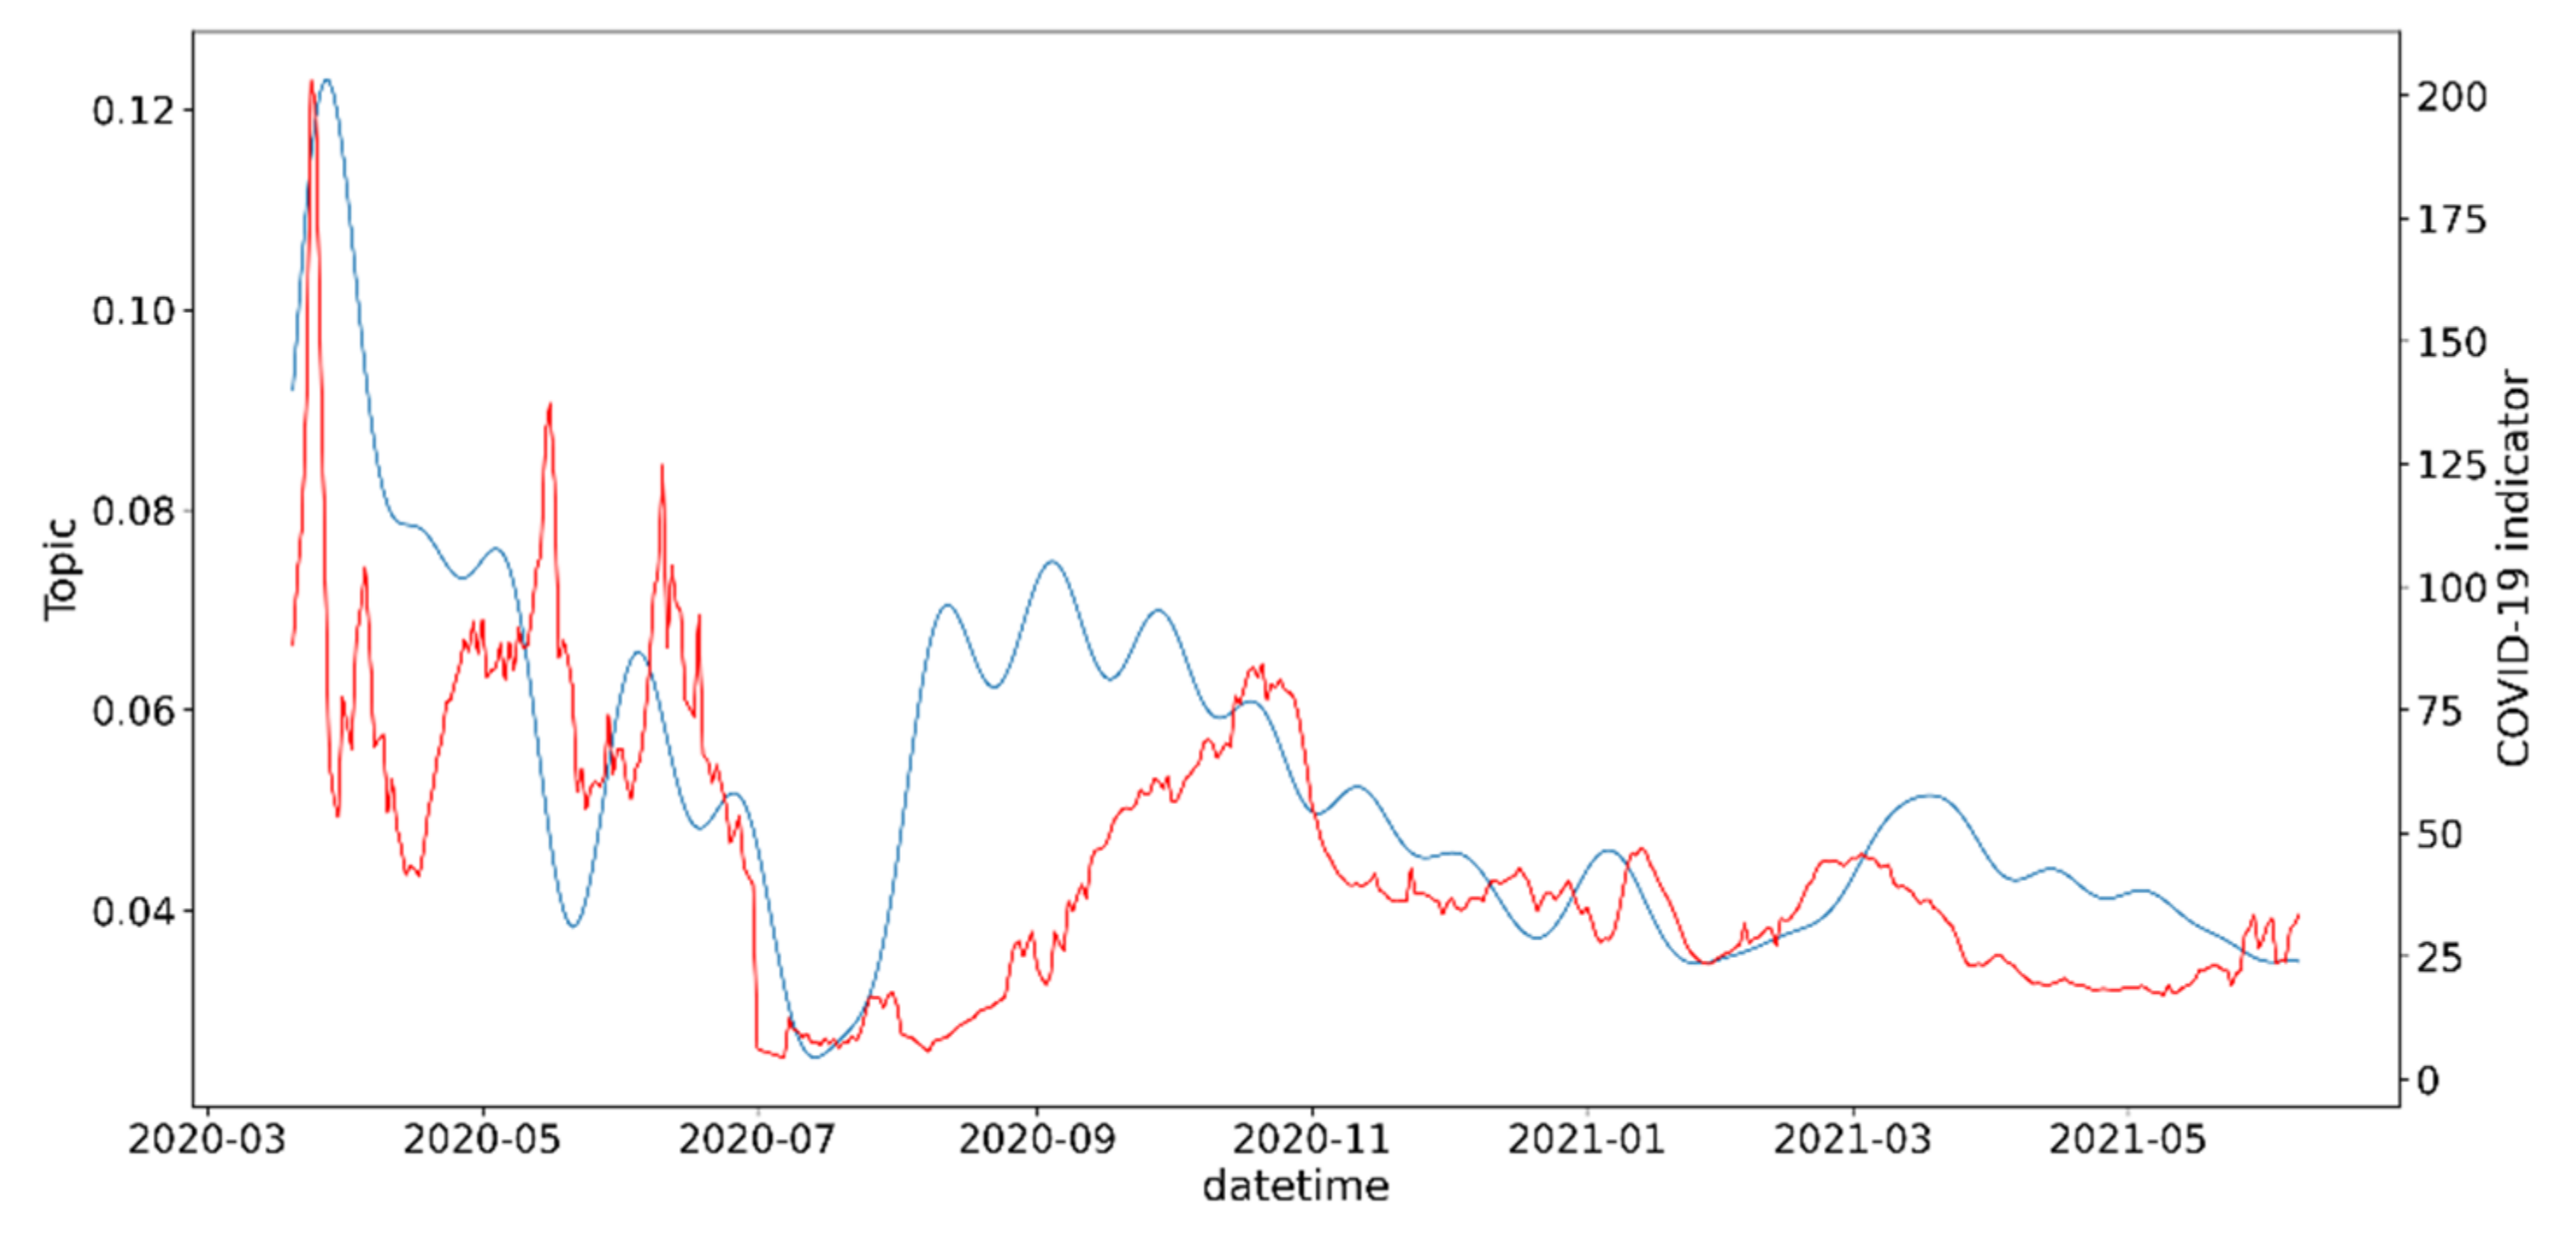
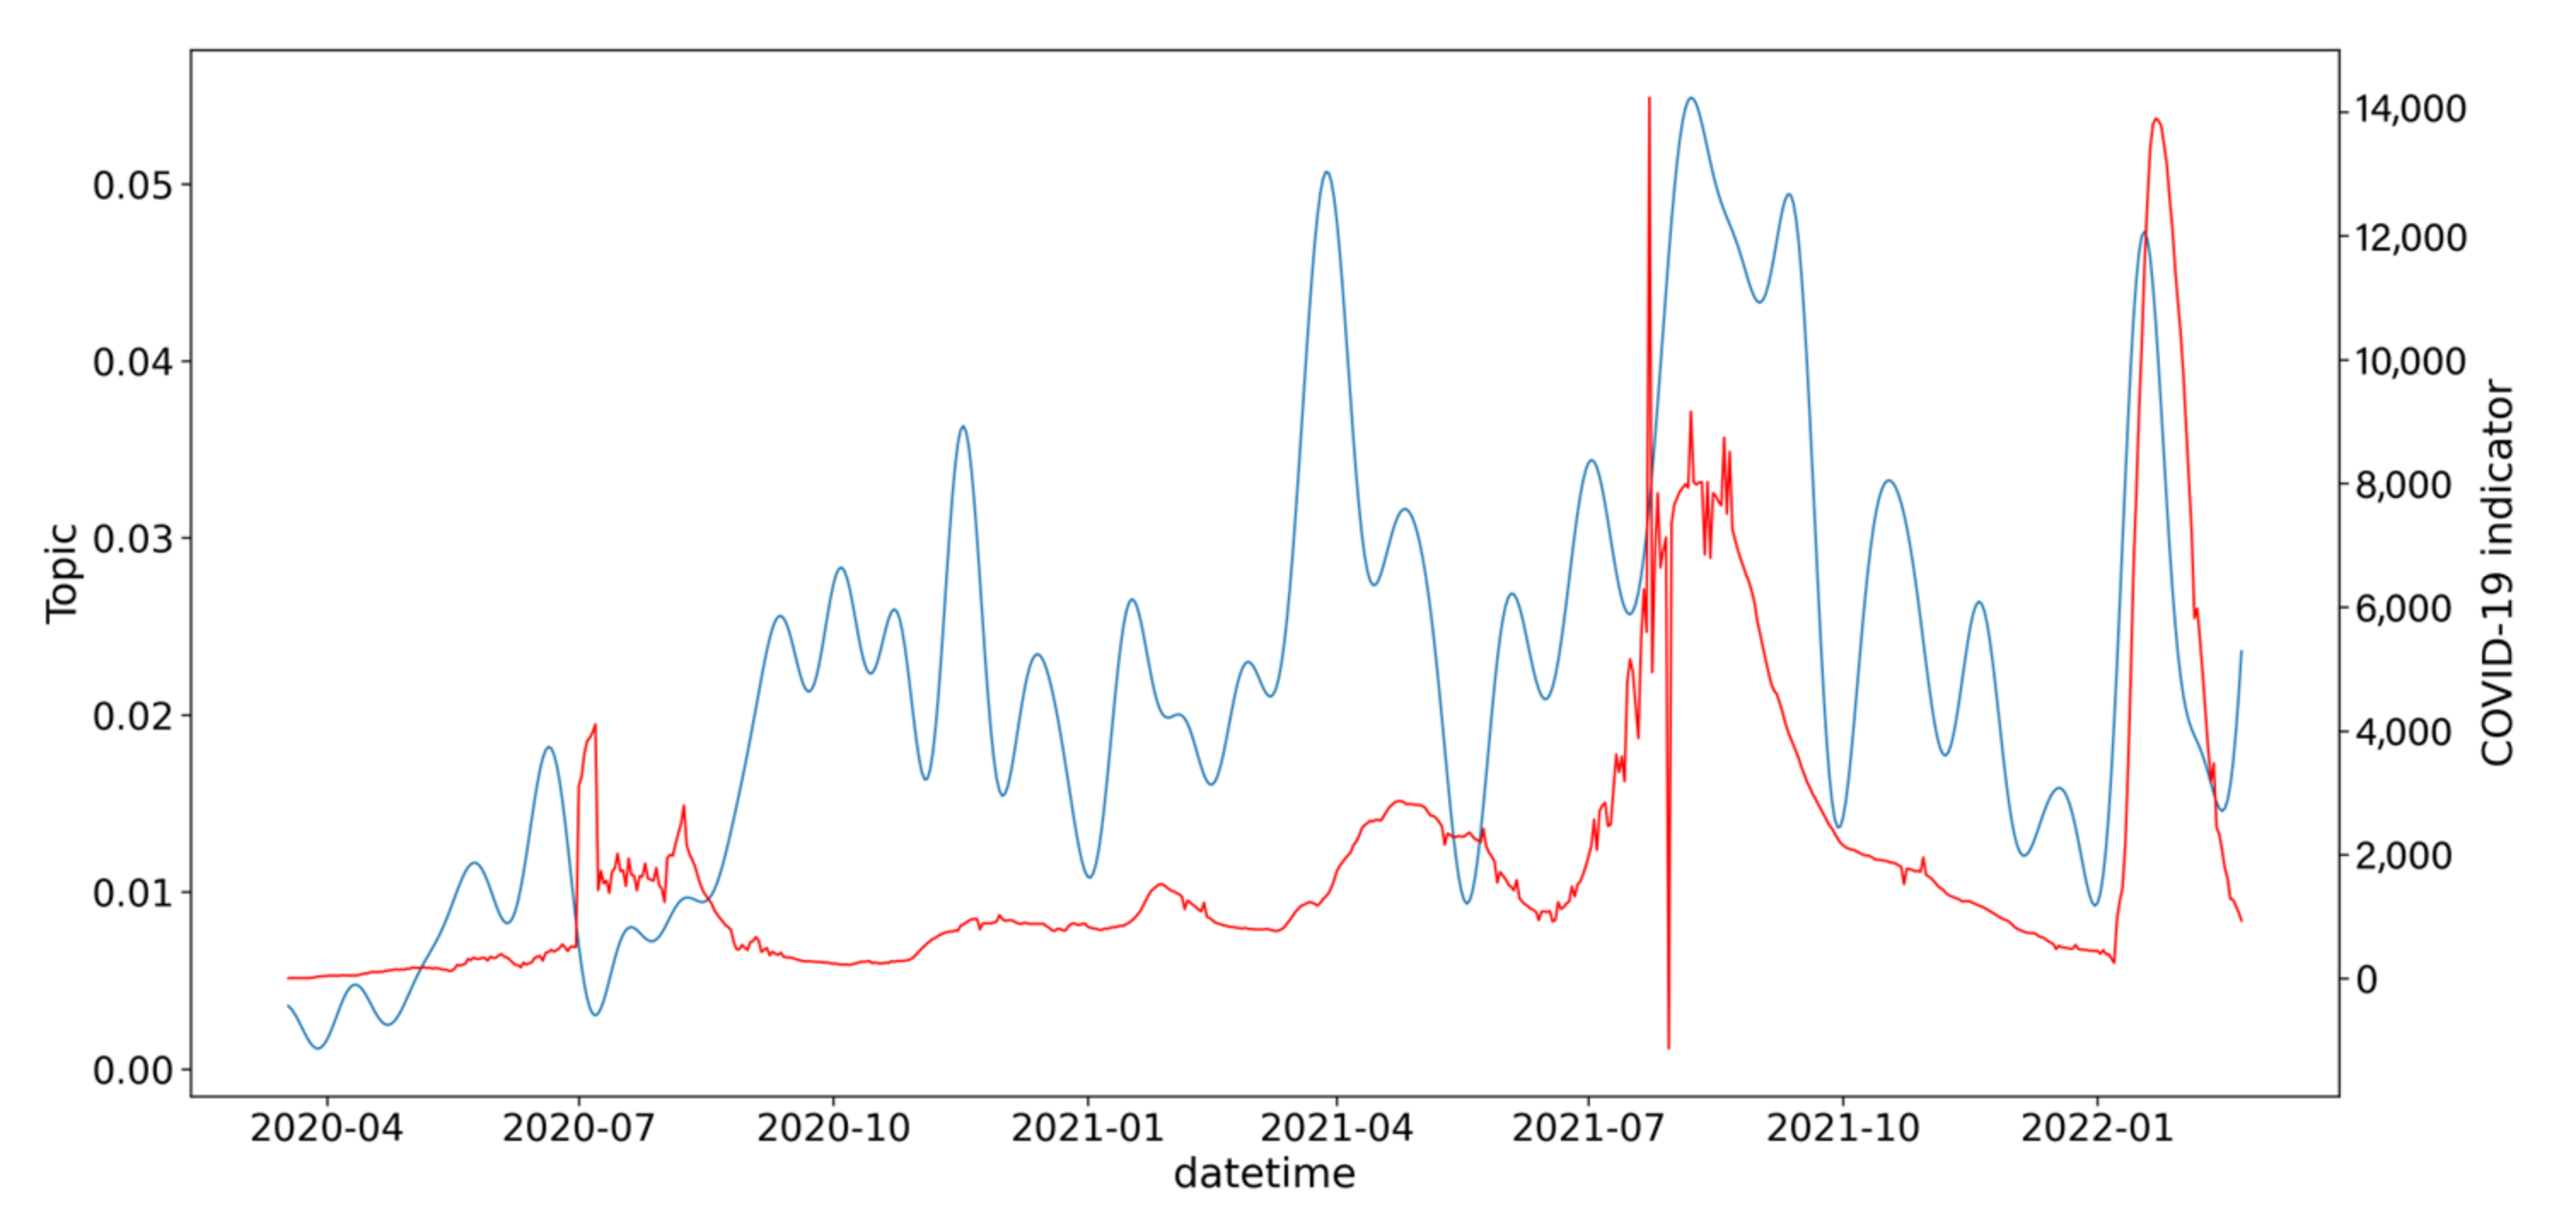
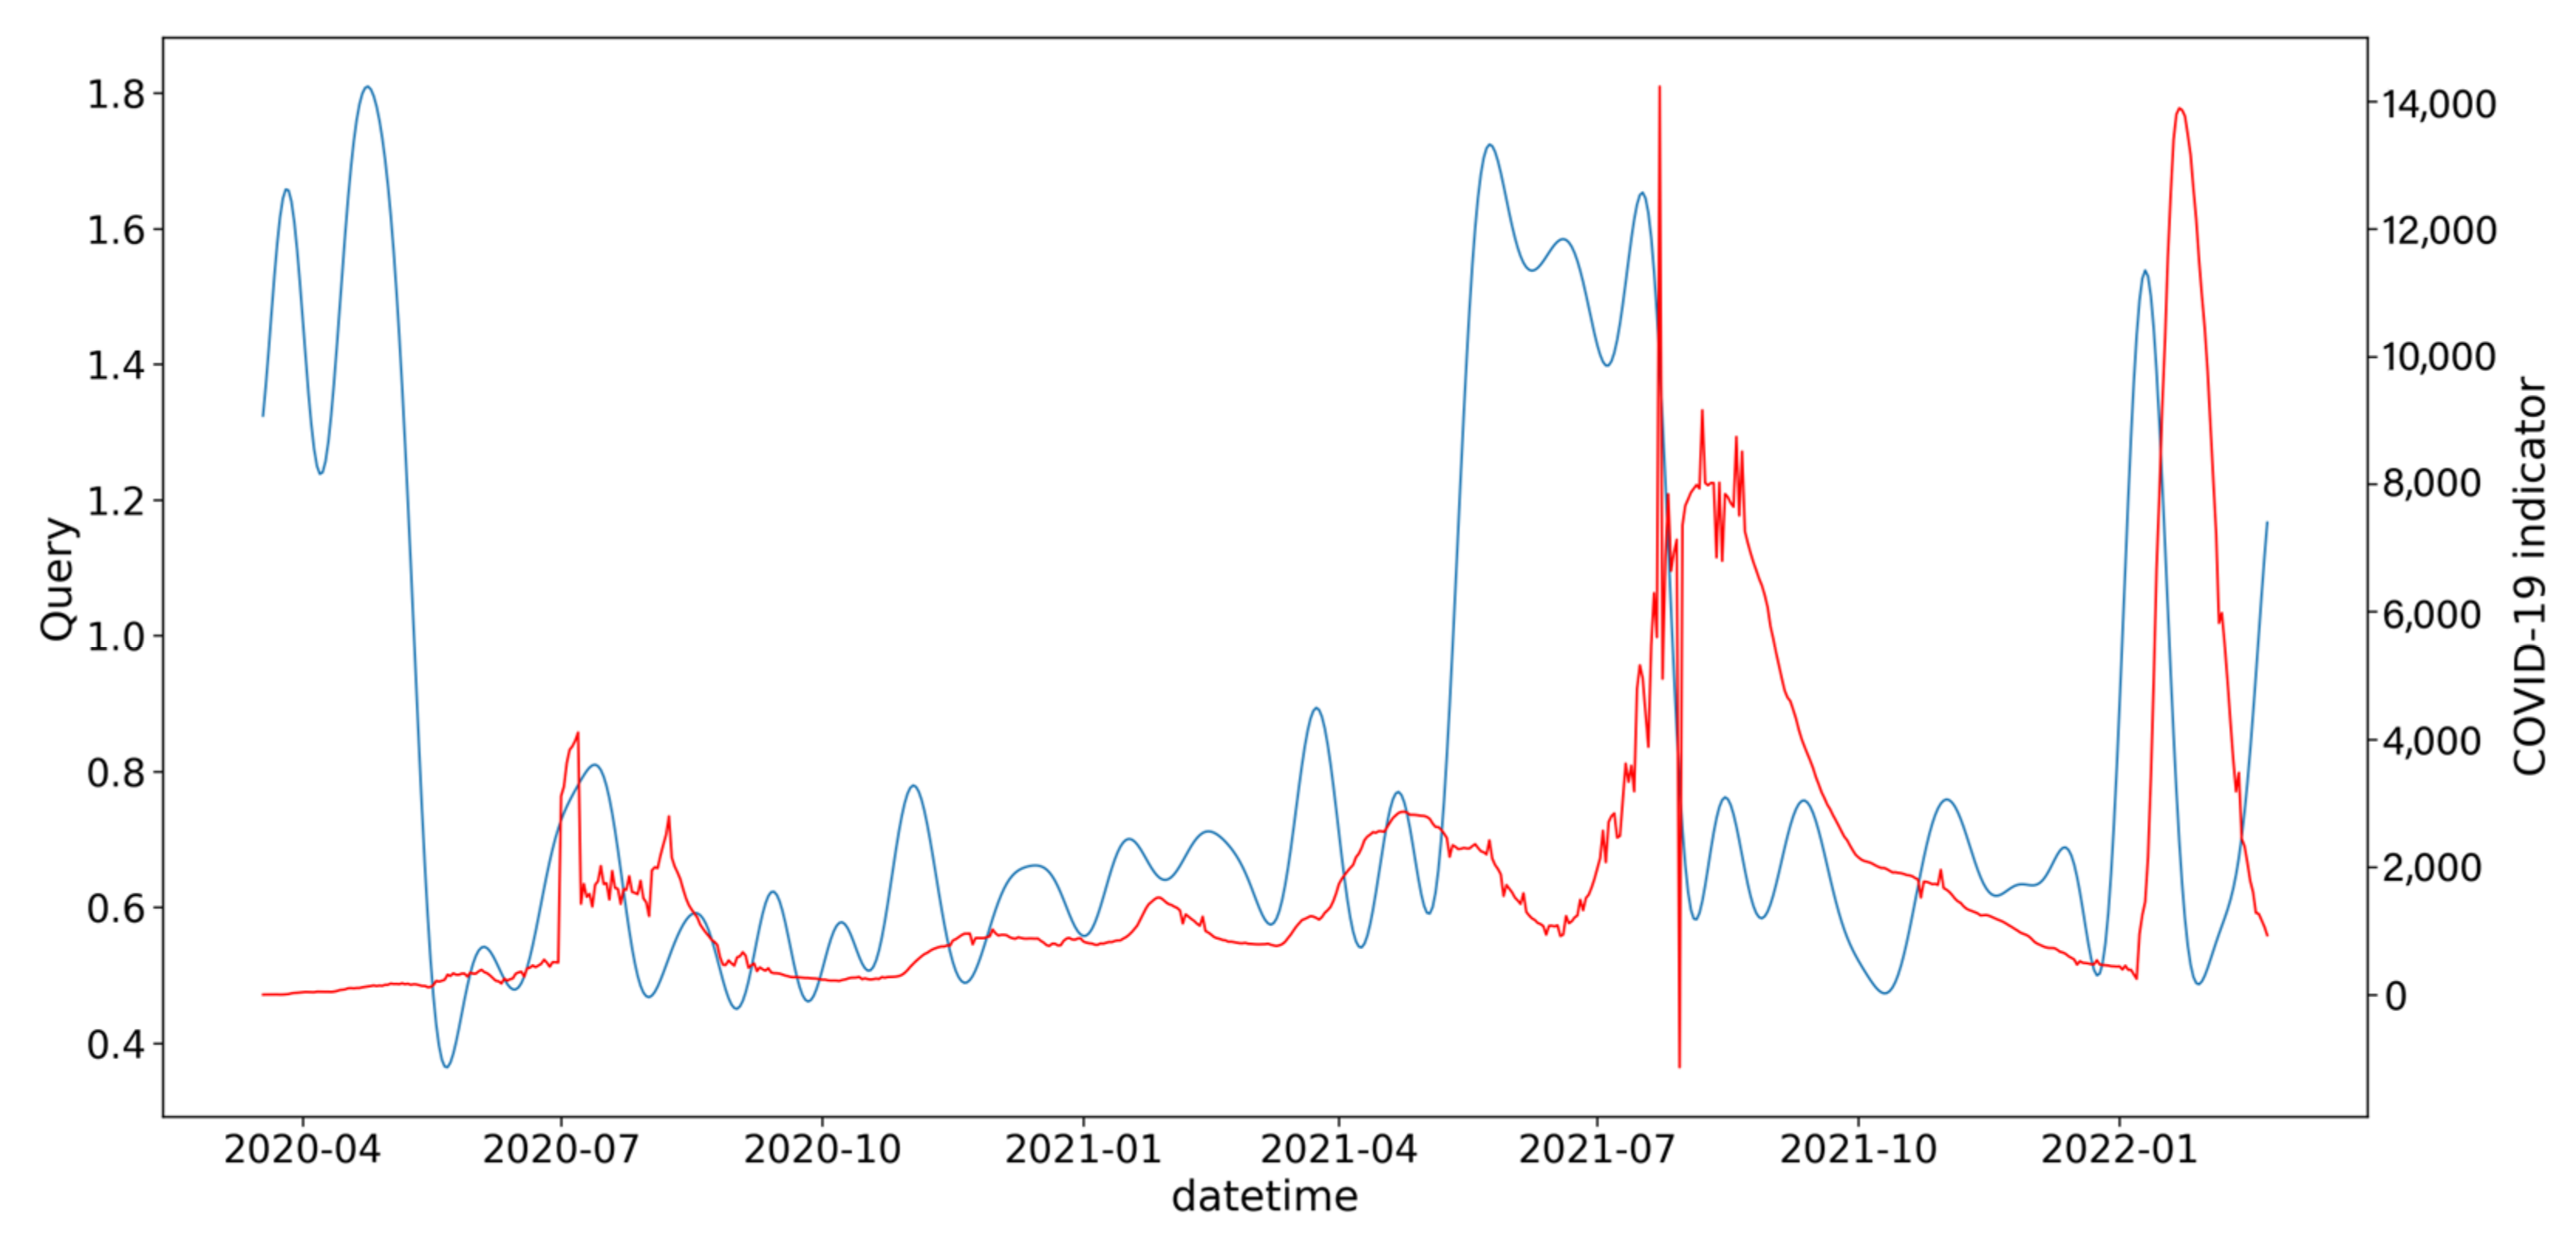
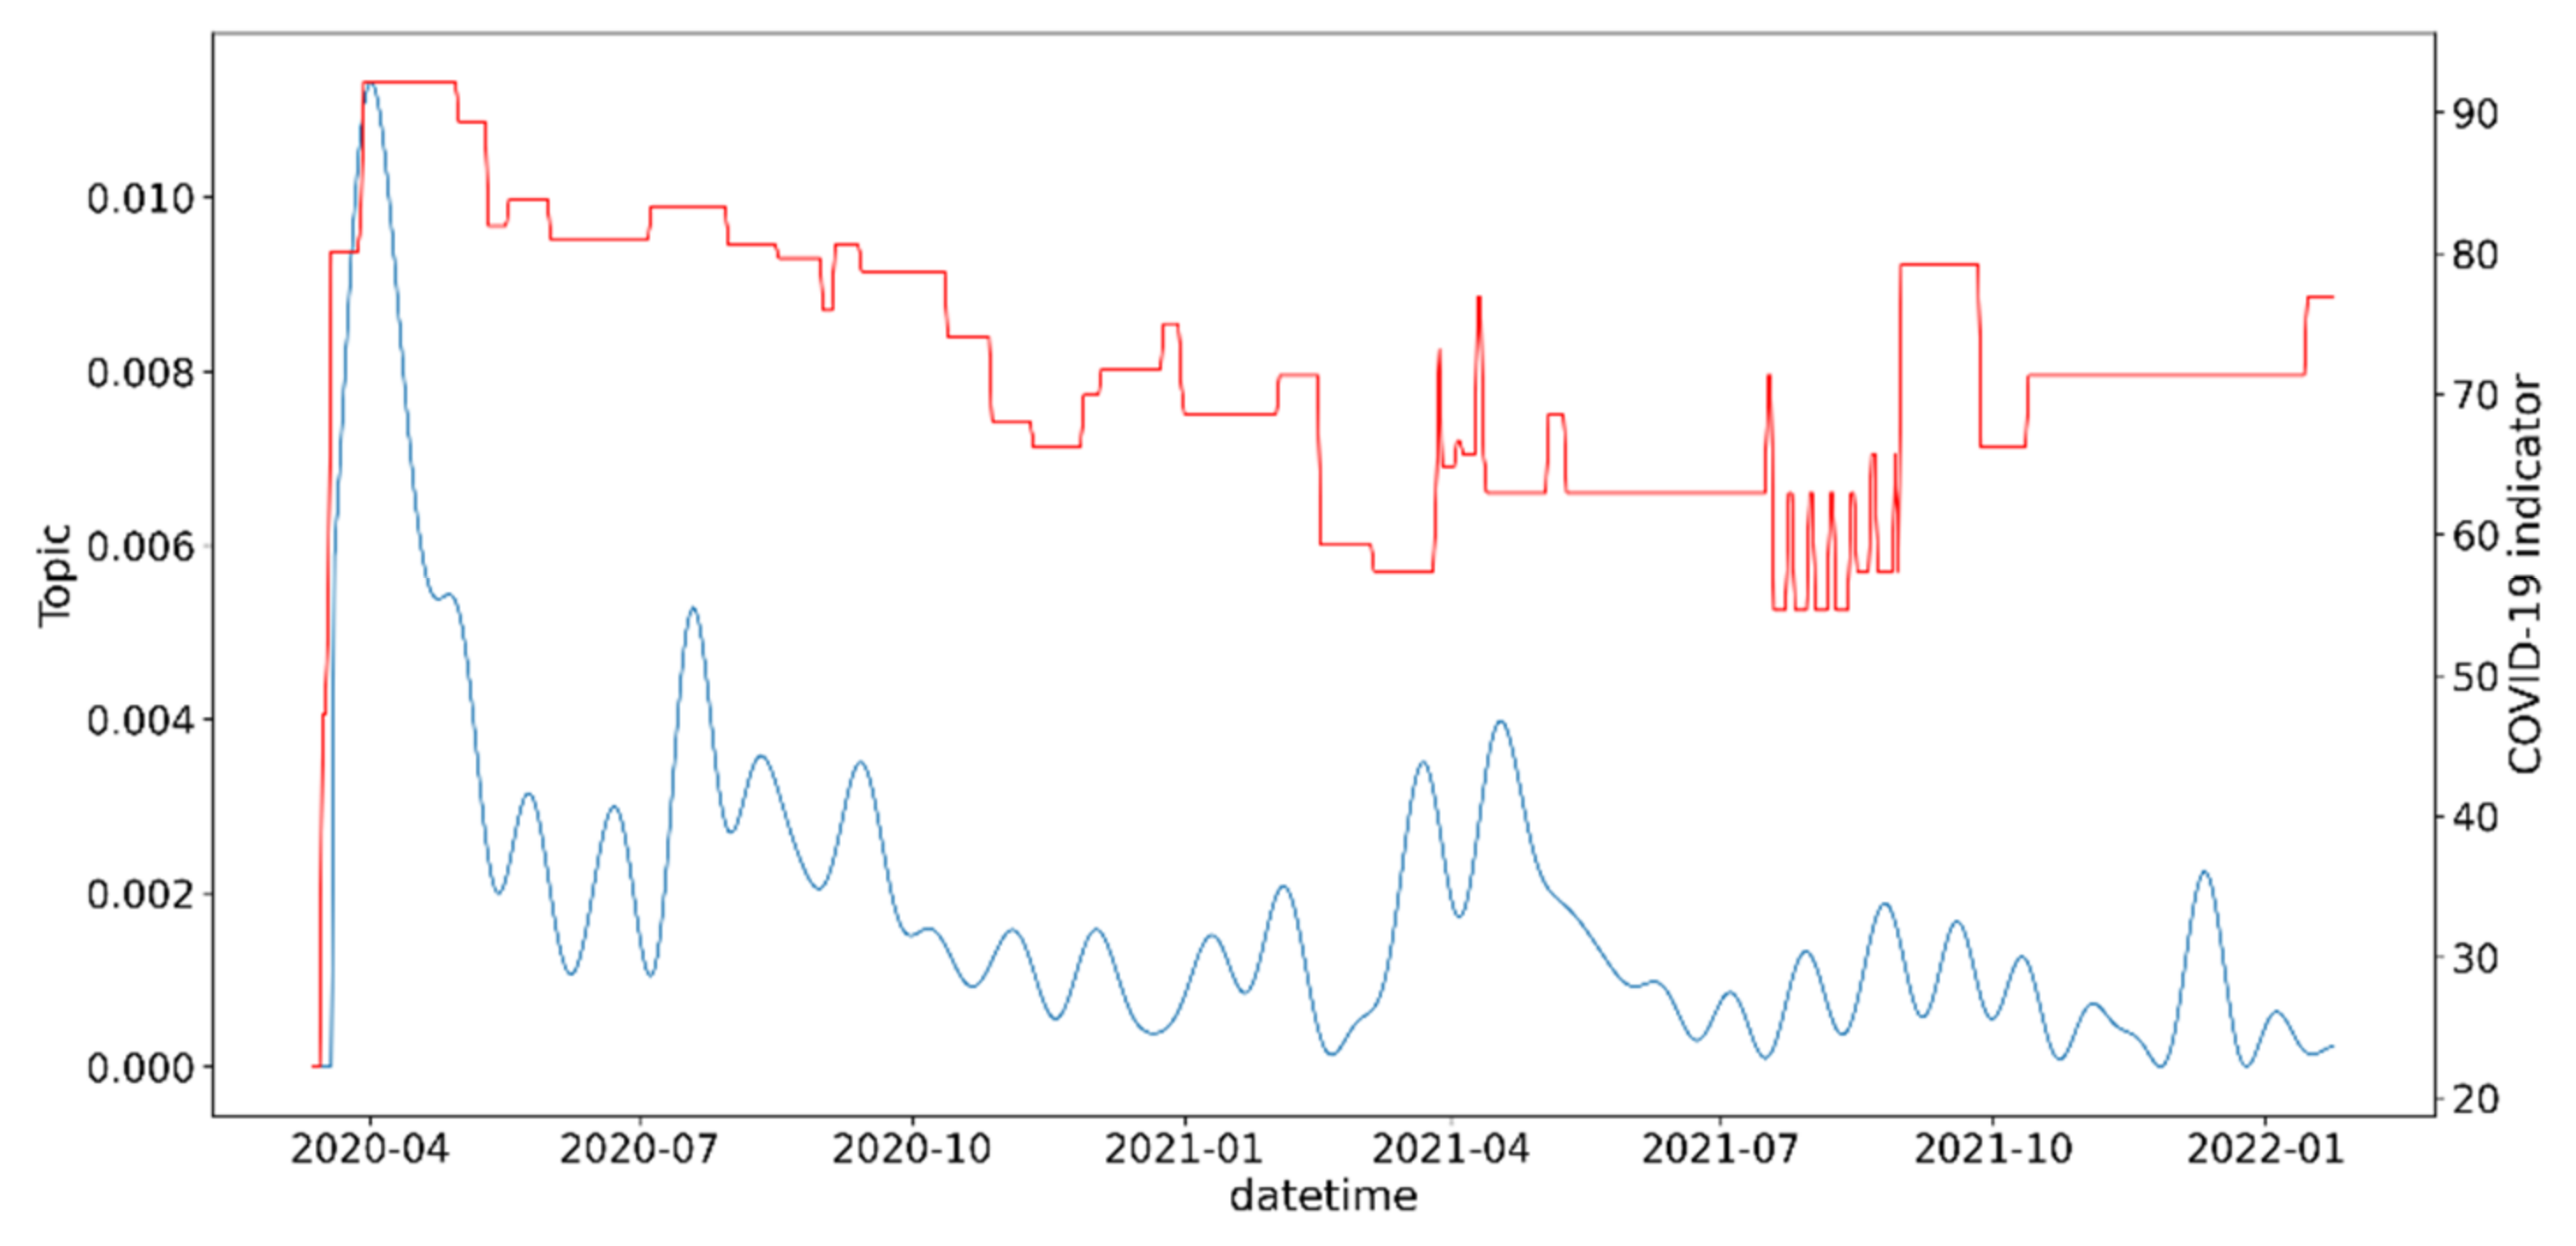
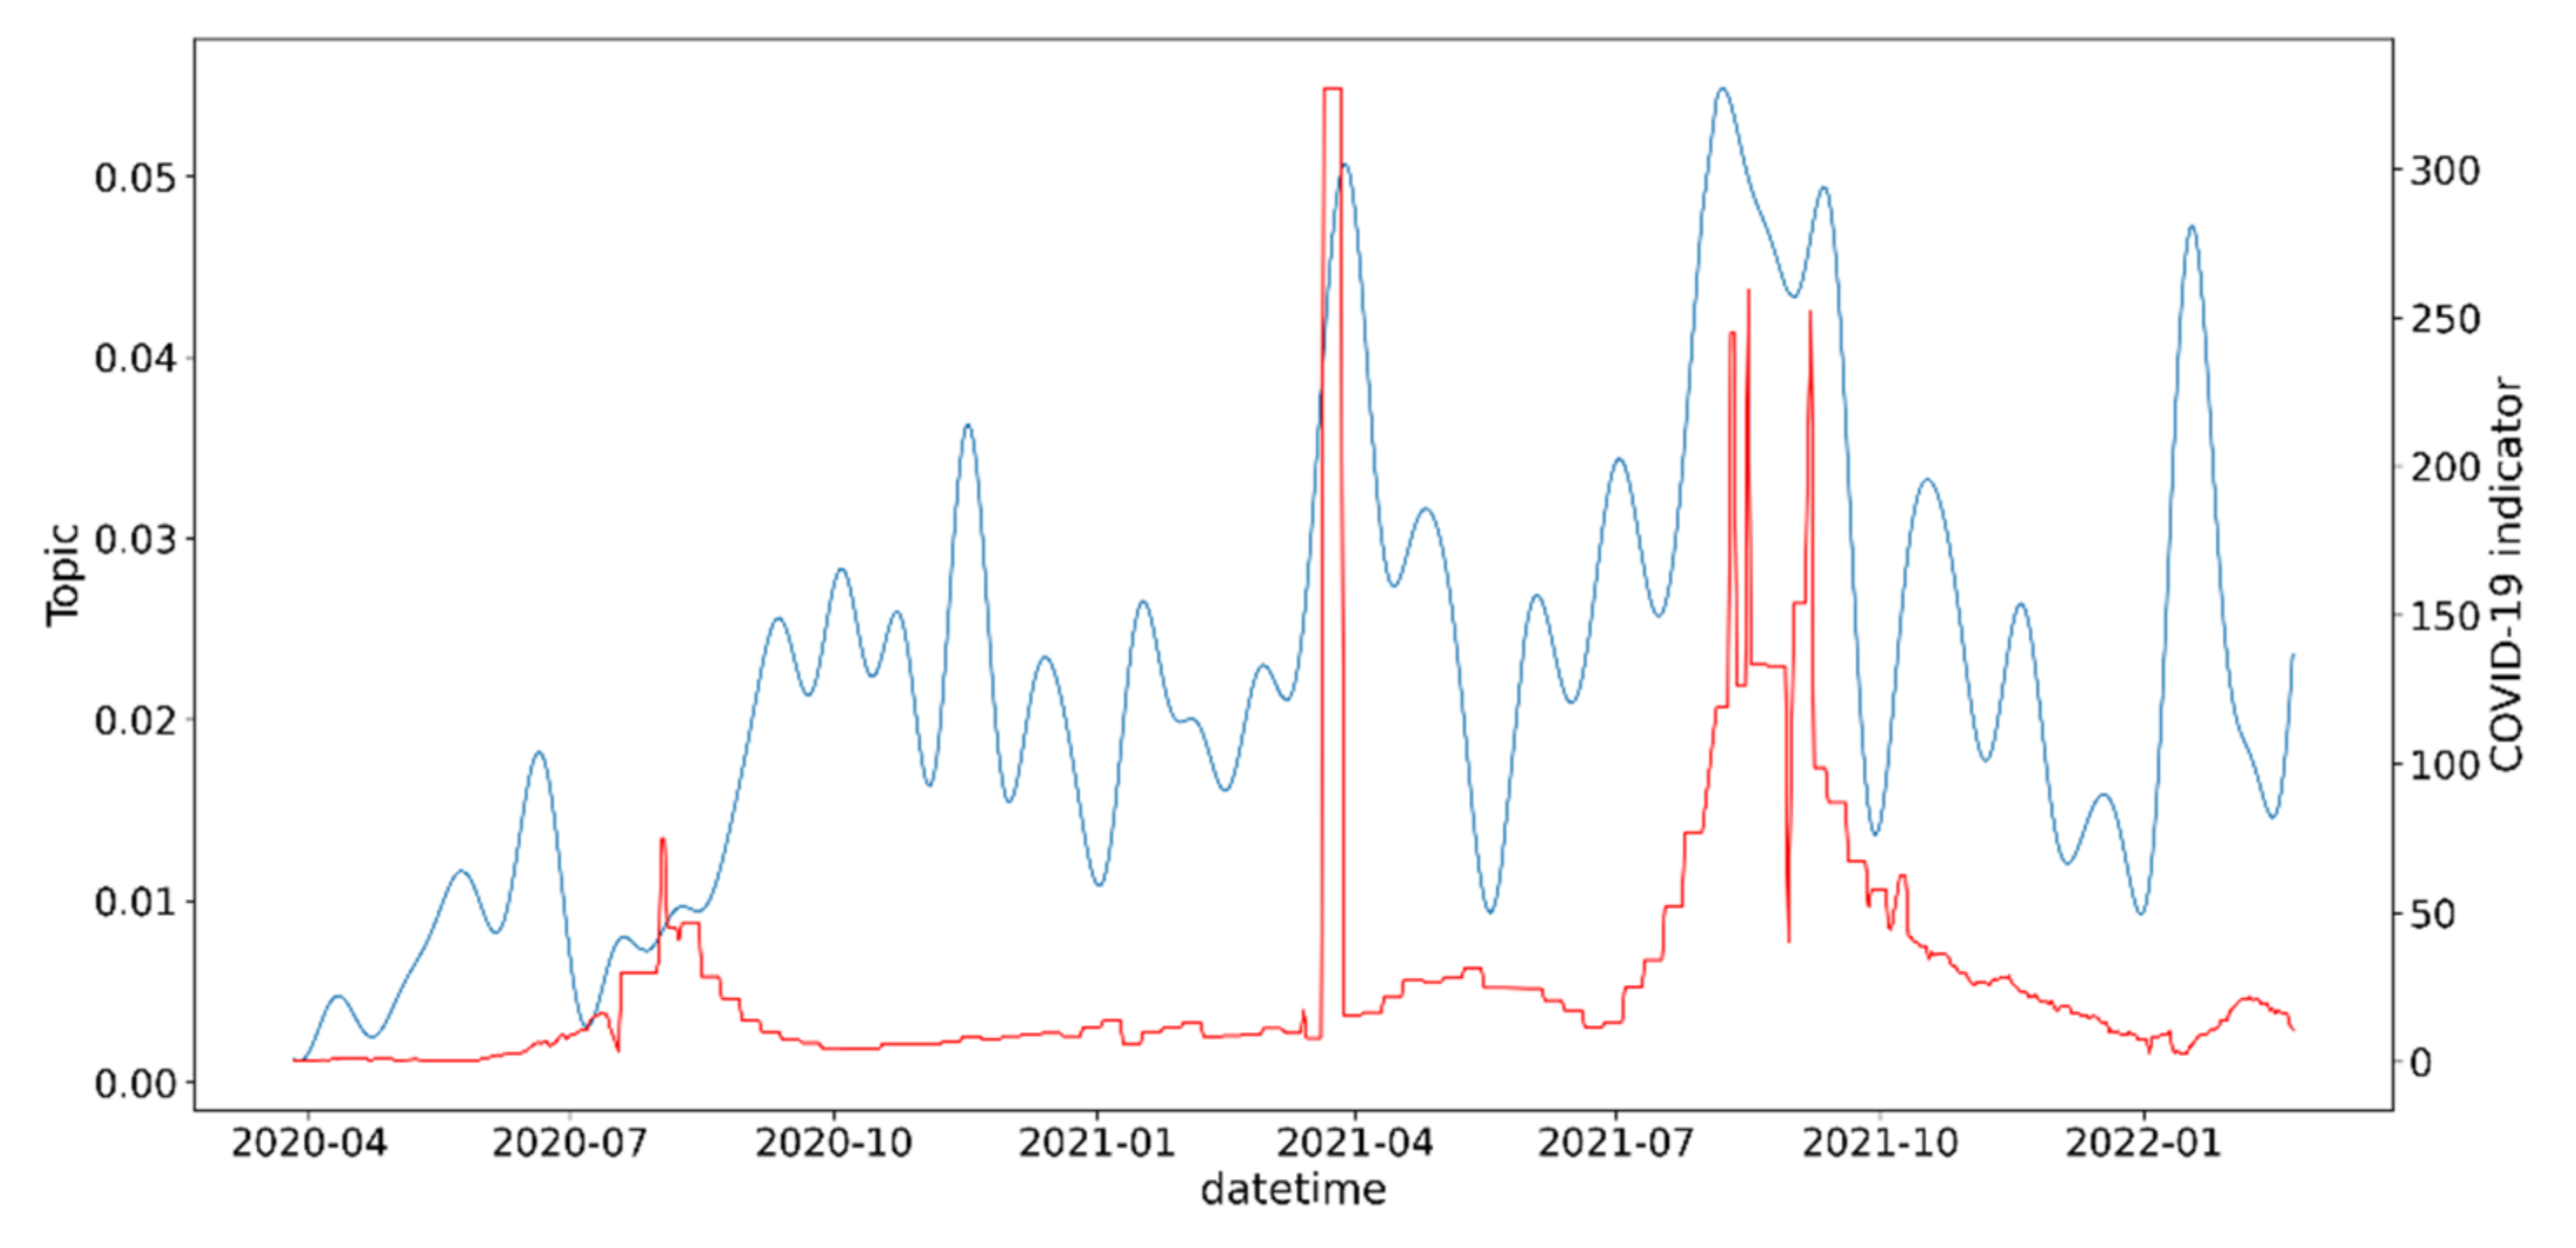
Figure 5 examines the thematic cluster “Incidence, School, Child, Growth, Epidemiological”, which has the maximum correlation with the indicator of new cases smoothed COVID-19 and is associated with the specified pandemic indicator over time. It can be seen that in 2020, the topic of distance learning for schoolchildren was actively raised only at the beginning of the school year (in September), and there is no direct correlation with the number of new cases smoothed. However, there is a strong correlation with the number of new cases smoothed out between 2021–2022. It can be assumed that the general population expected the relaxation of quarantine measures and the transition to full-time education, but the worsening of the epidemiological situation caused an increase in interest in this topic.
Figure 5. The red line is the dynamics of the number of new cases smoothed COVID-19, and the blue line is the dynamics of publication activity on the topic “Incidence, School, Child, Growth, Epidemiology”.
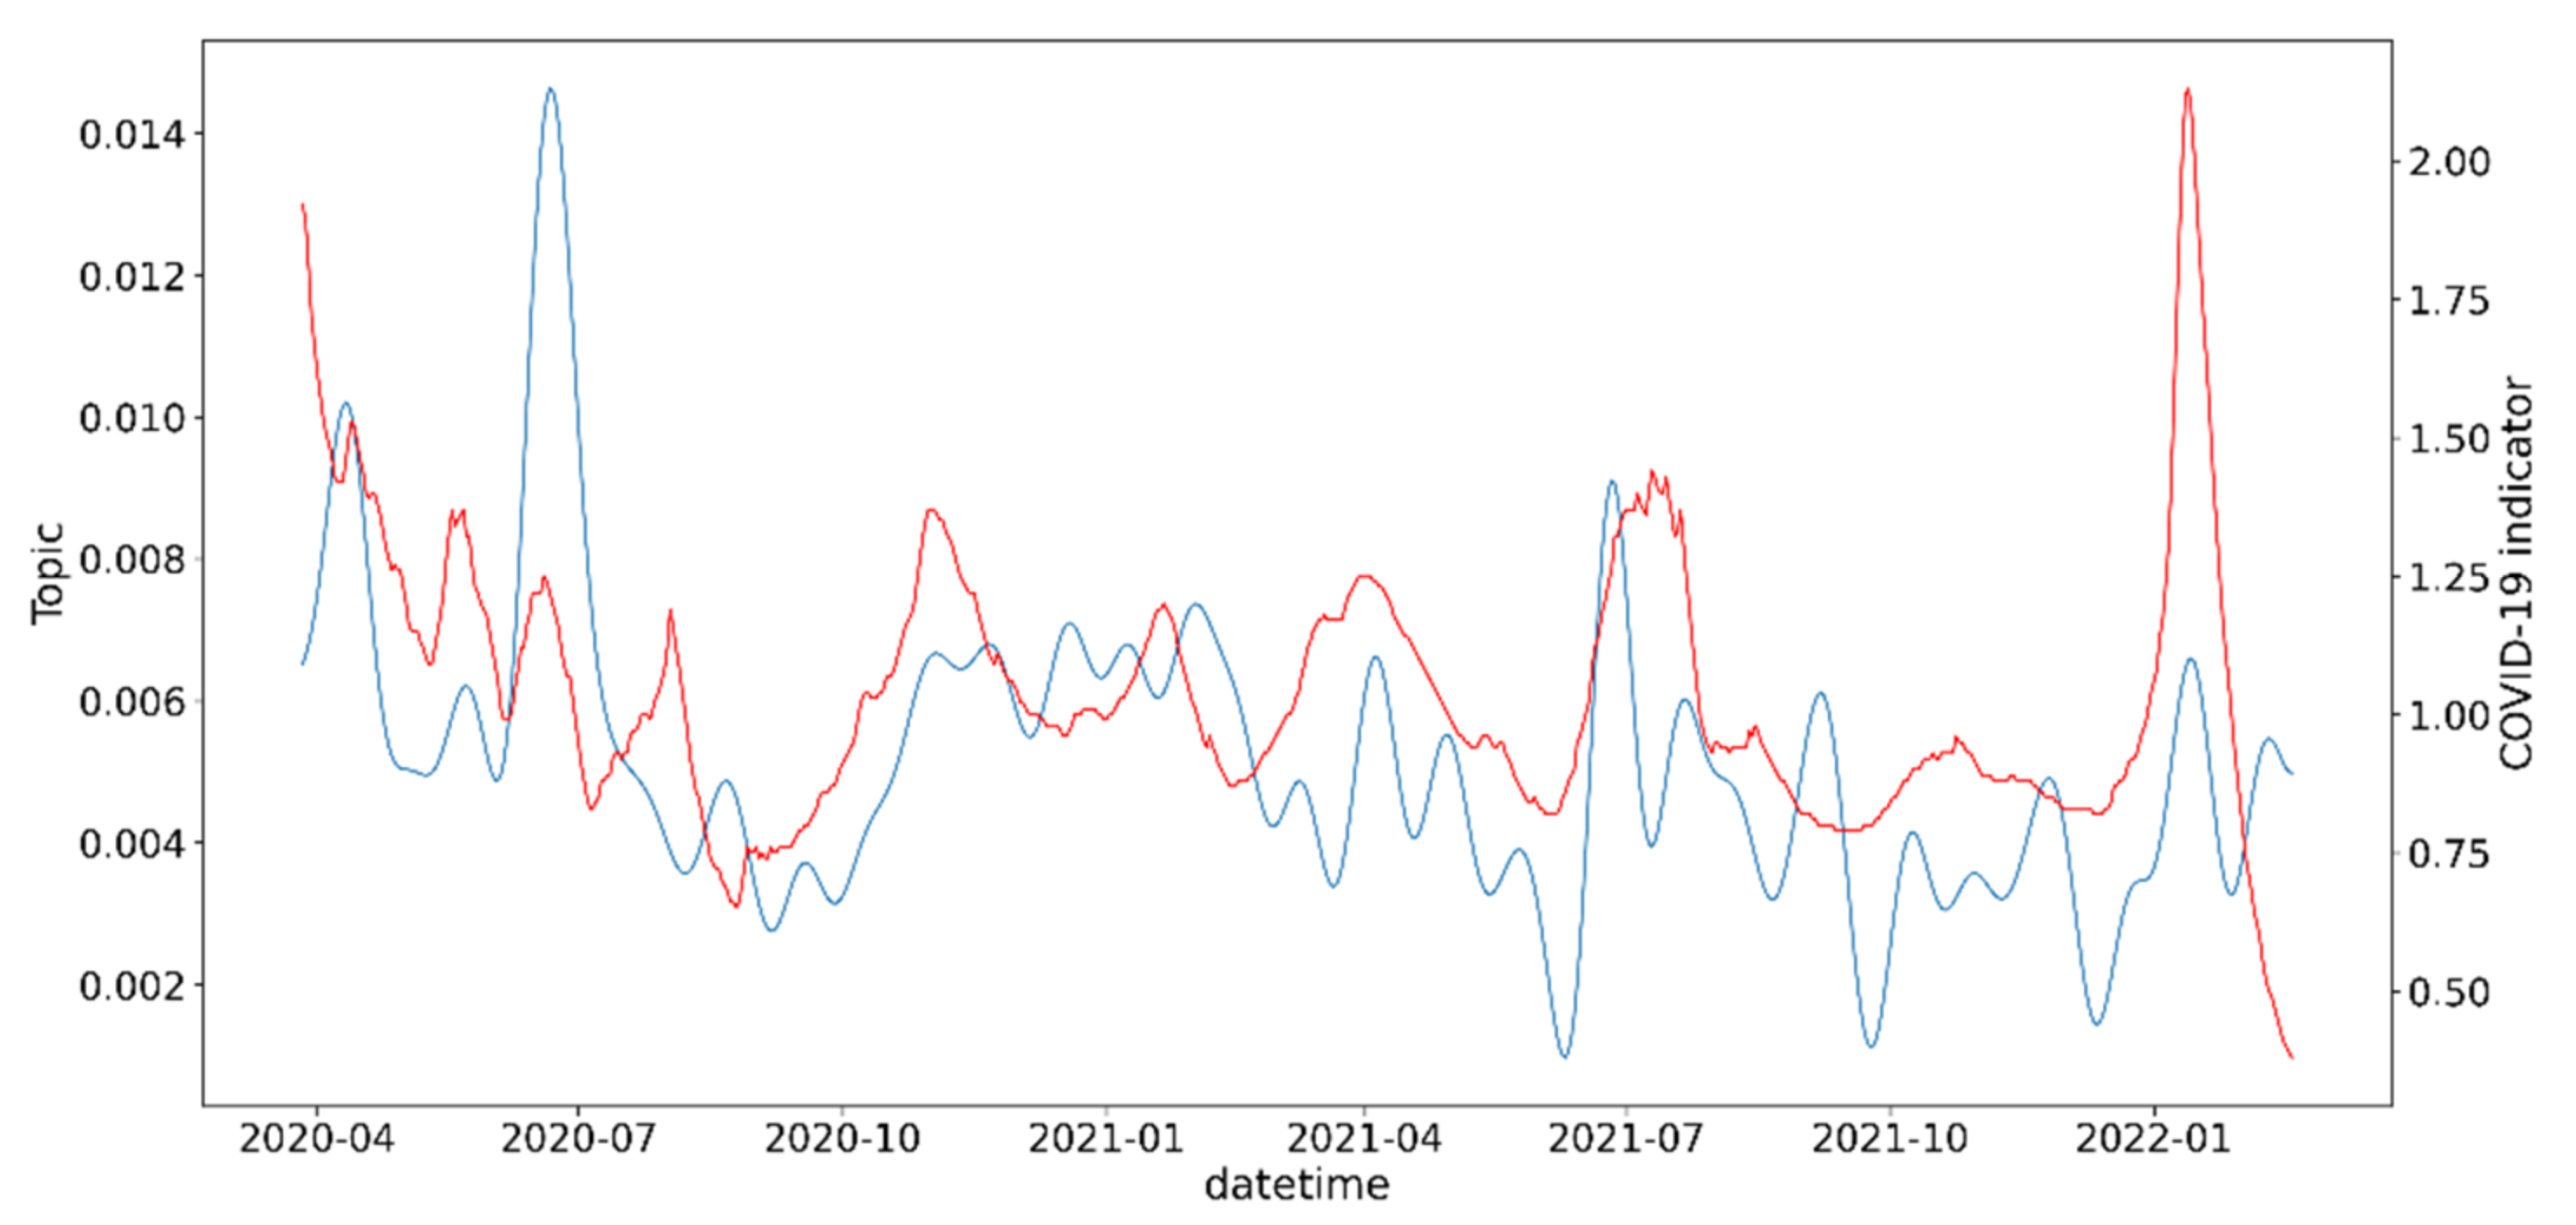
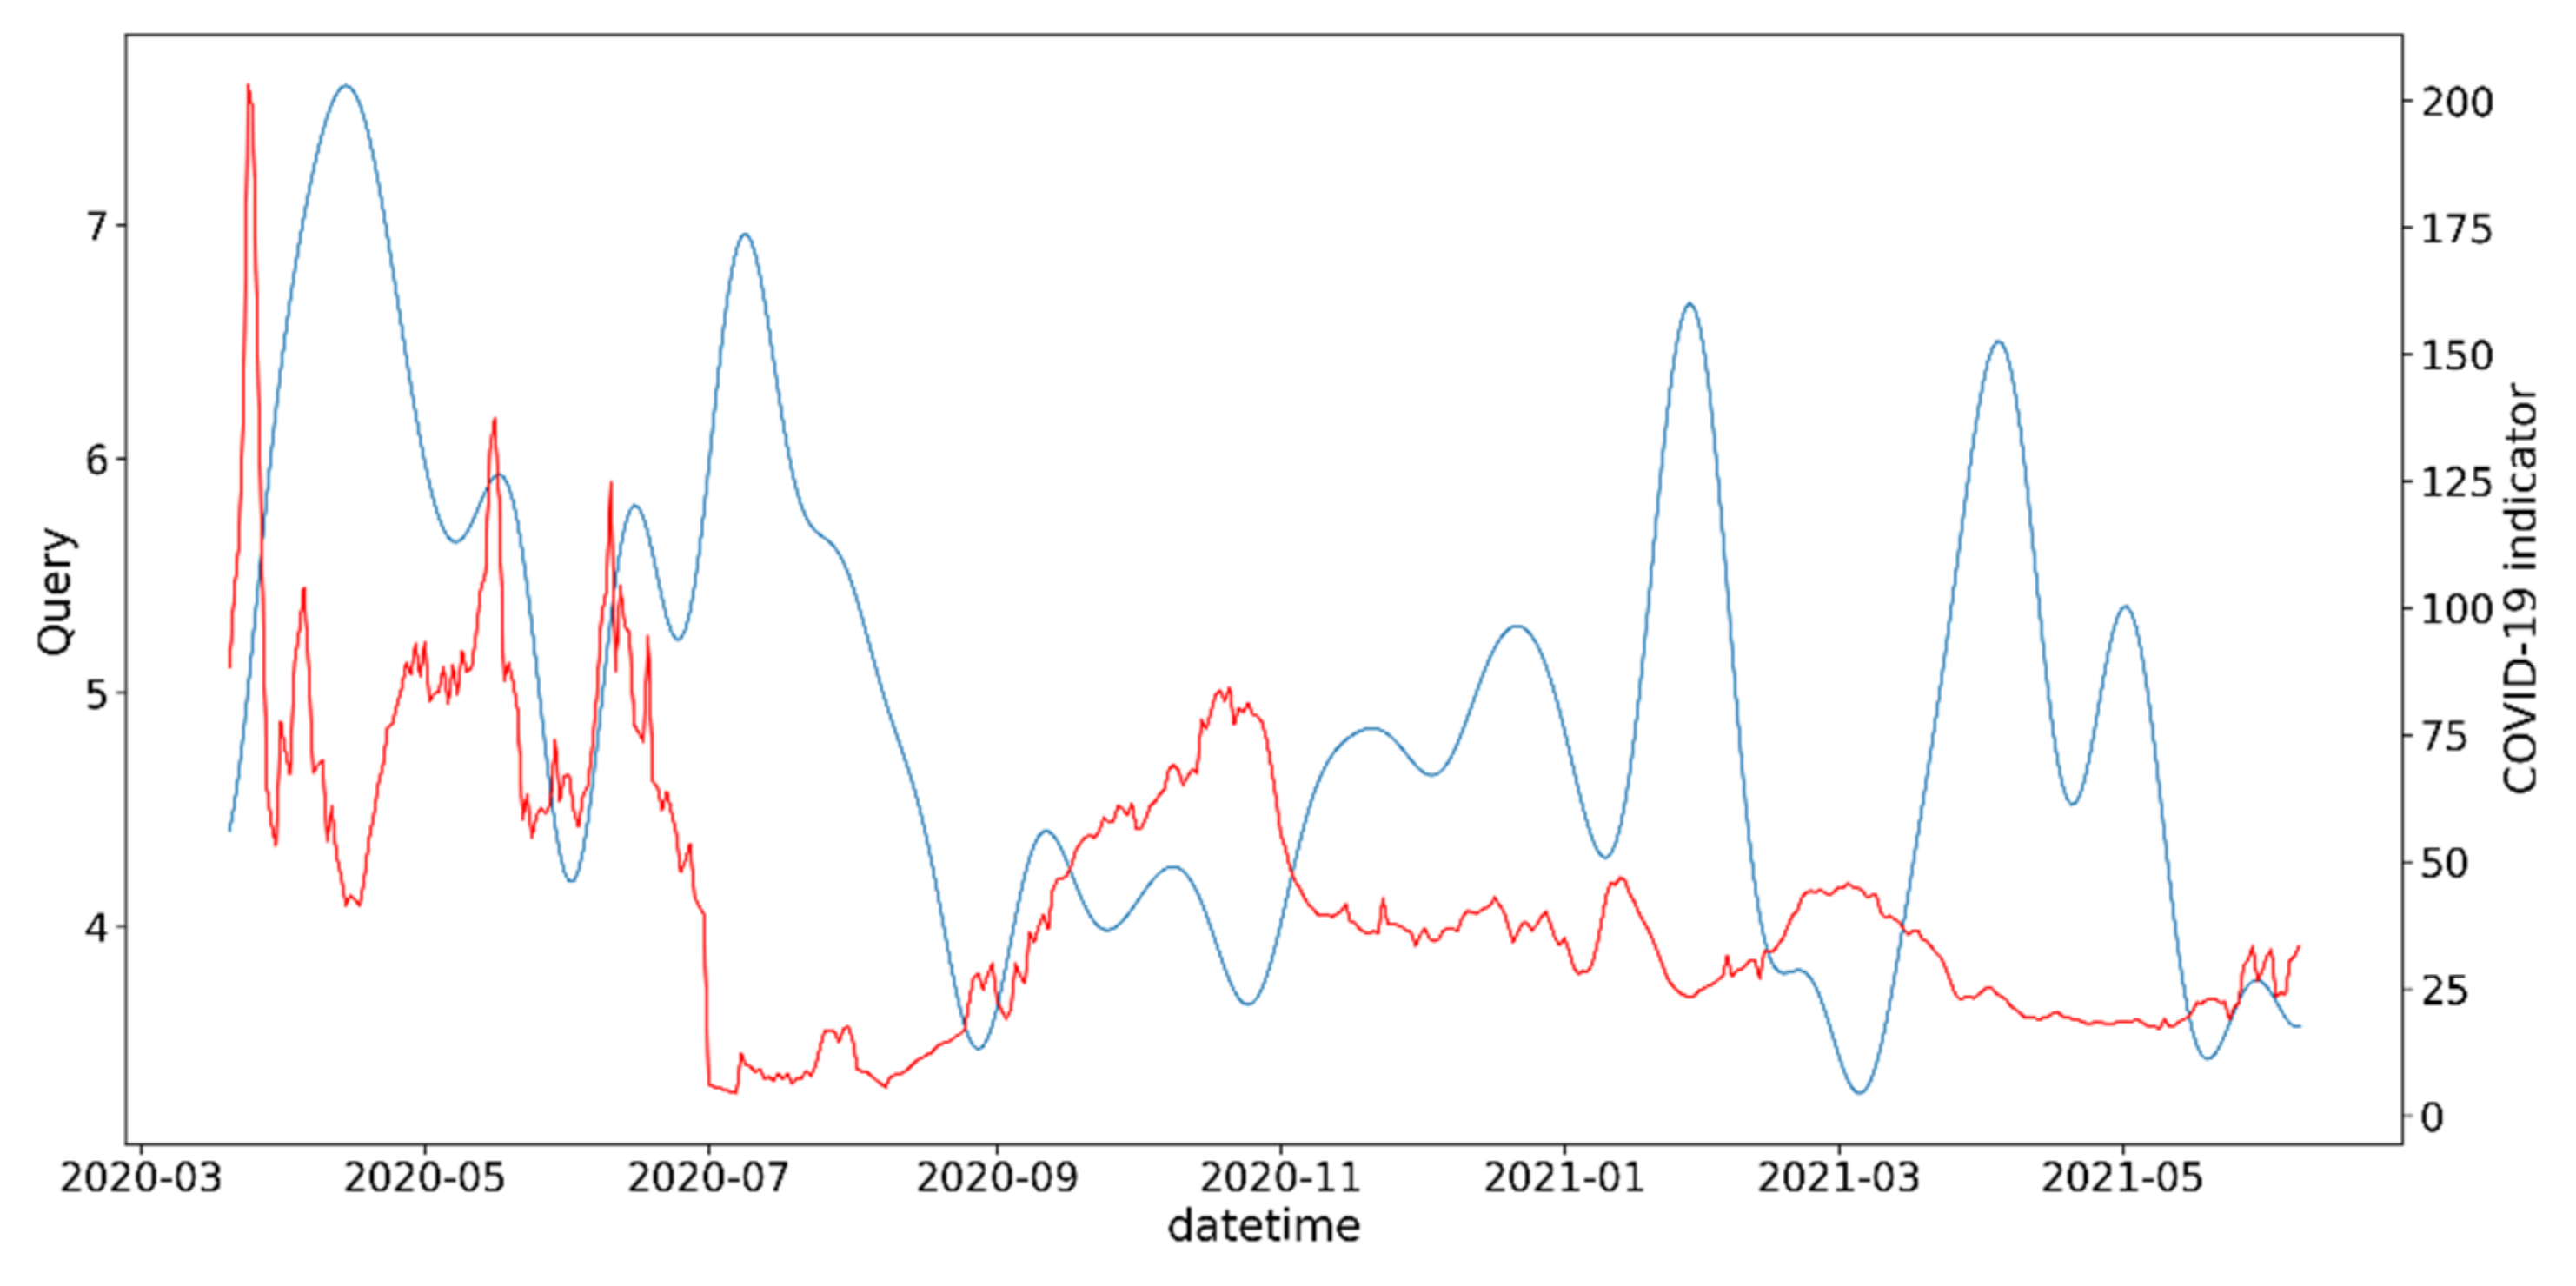
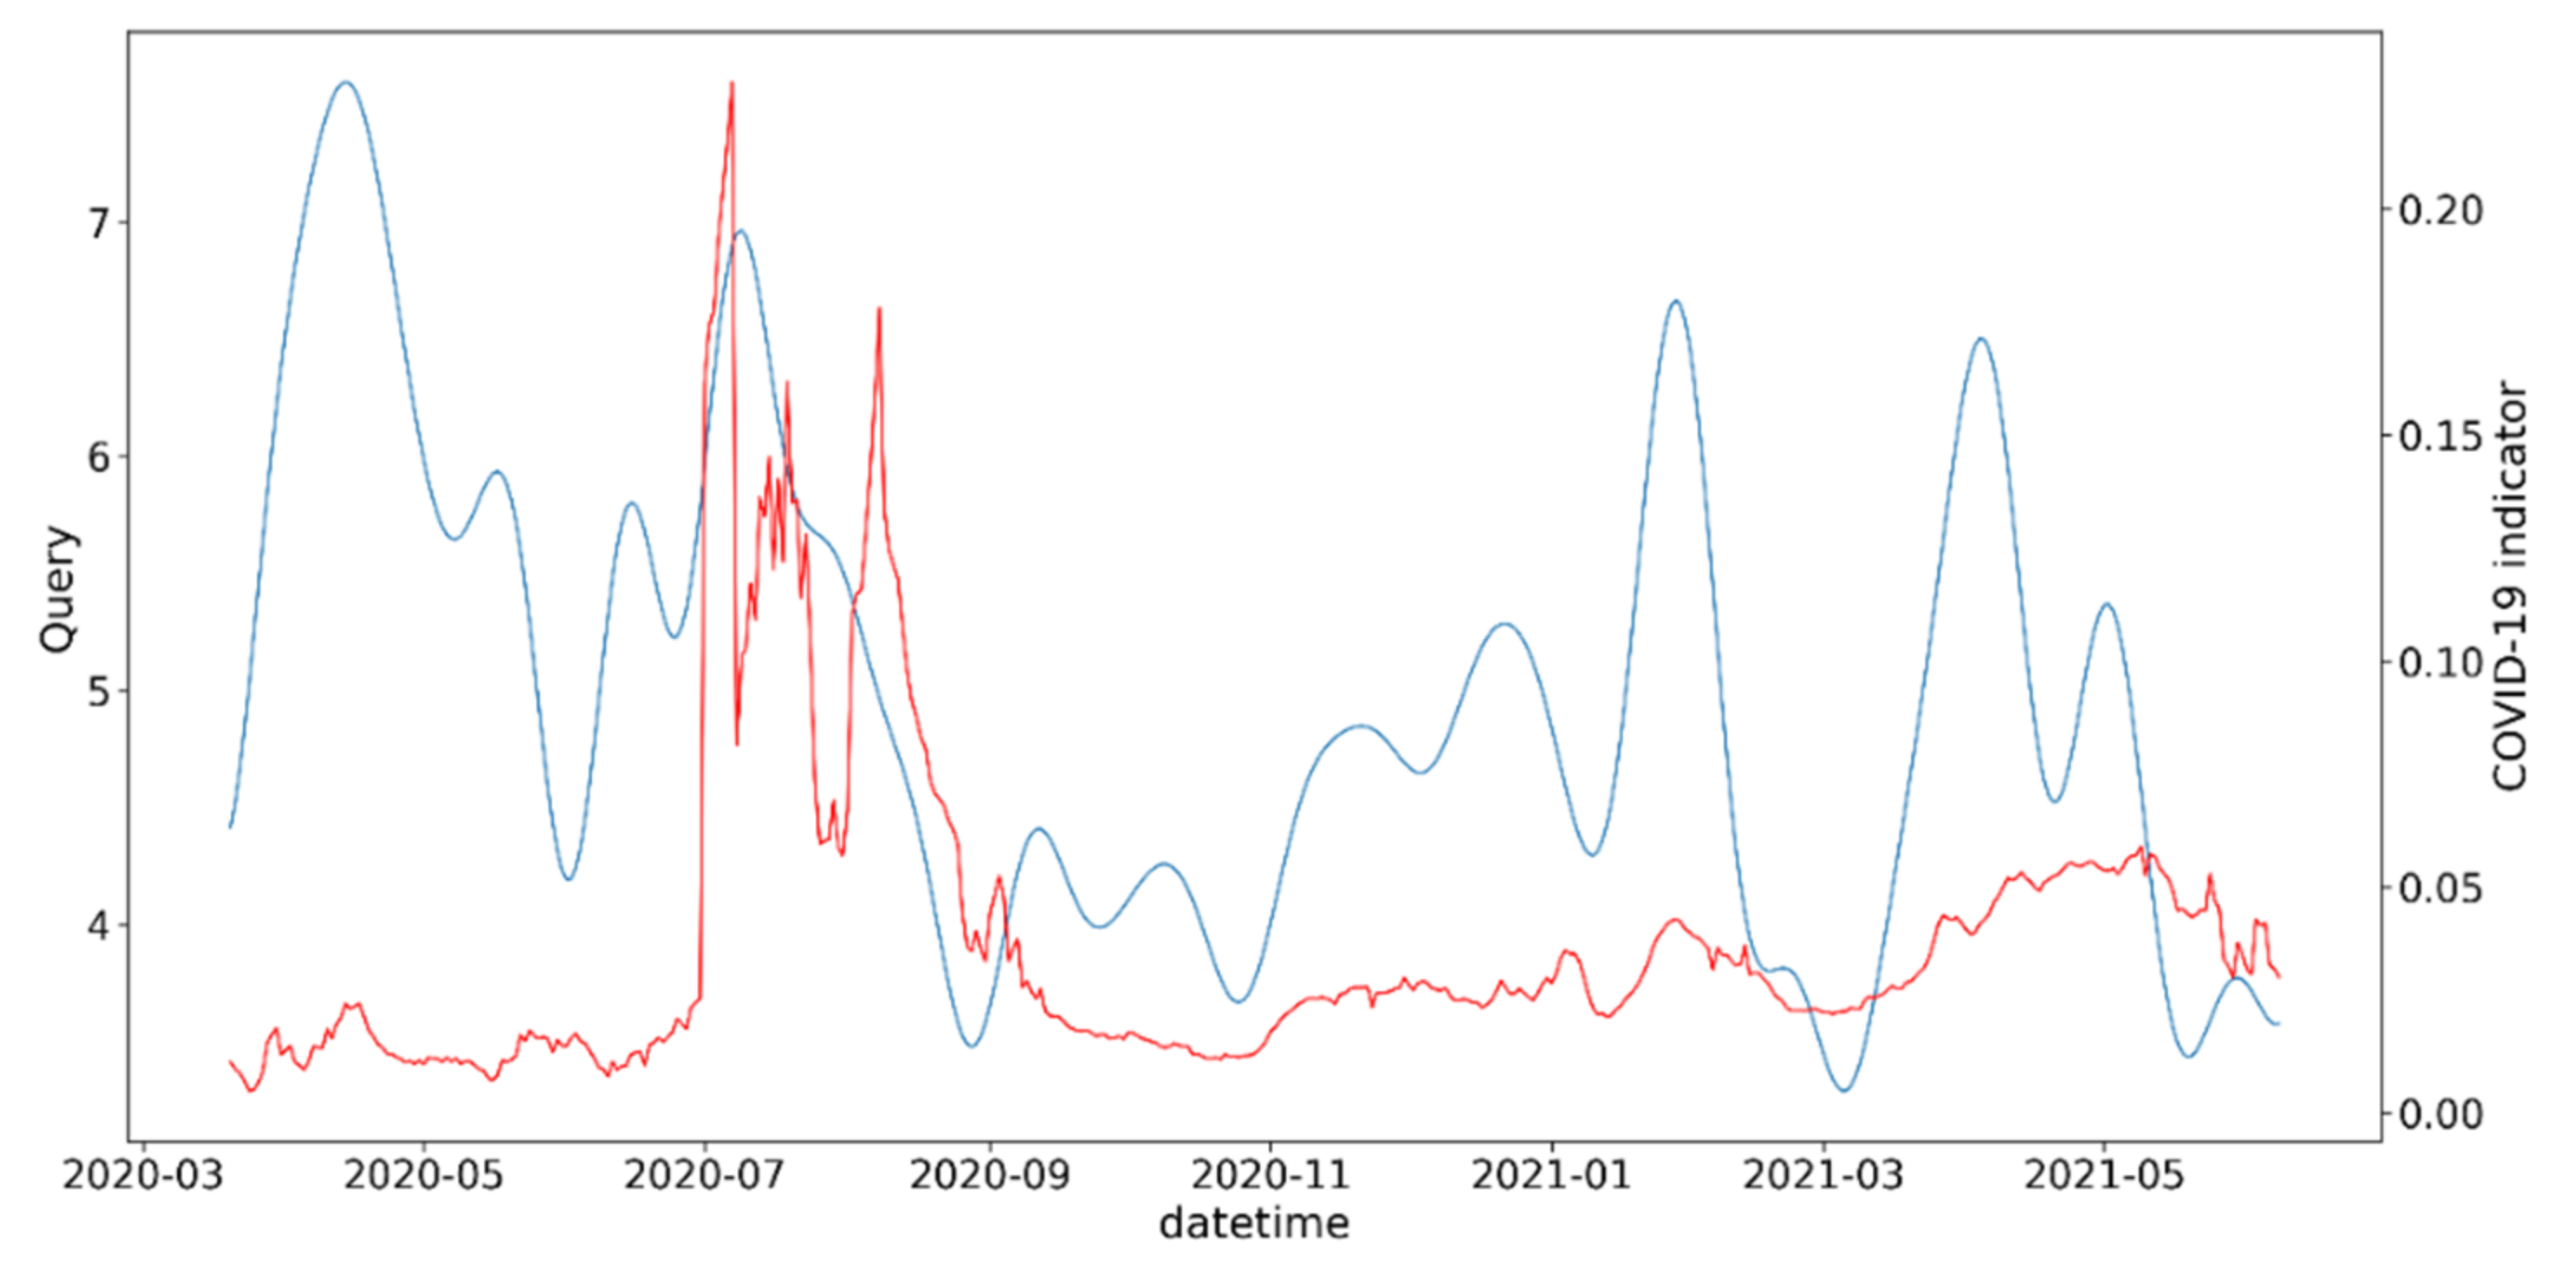
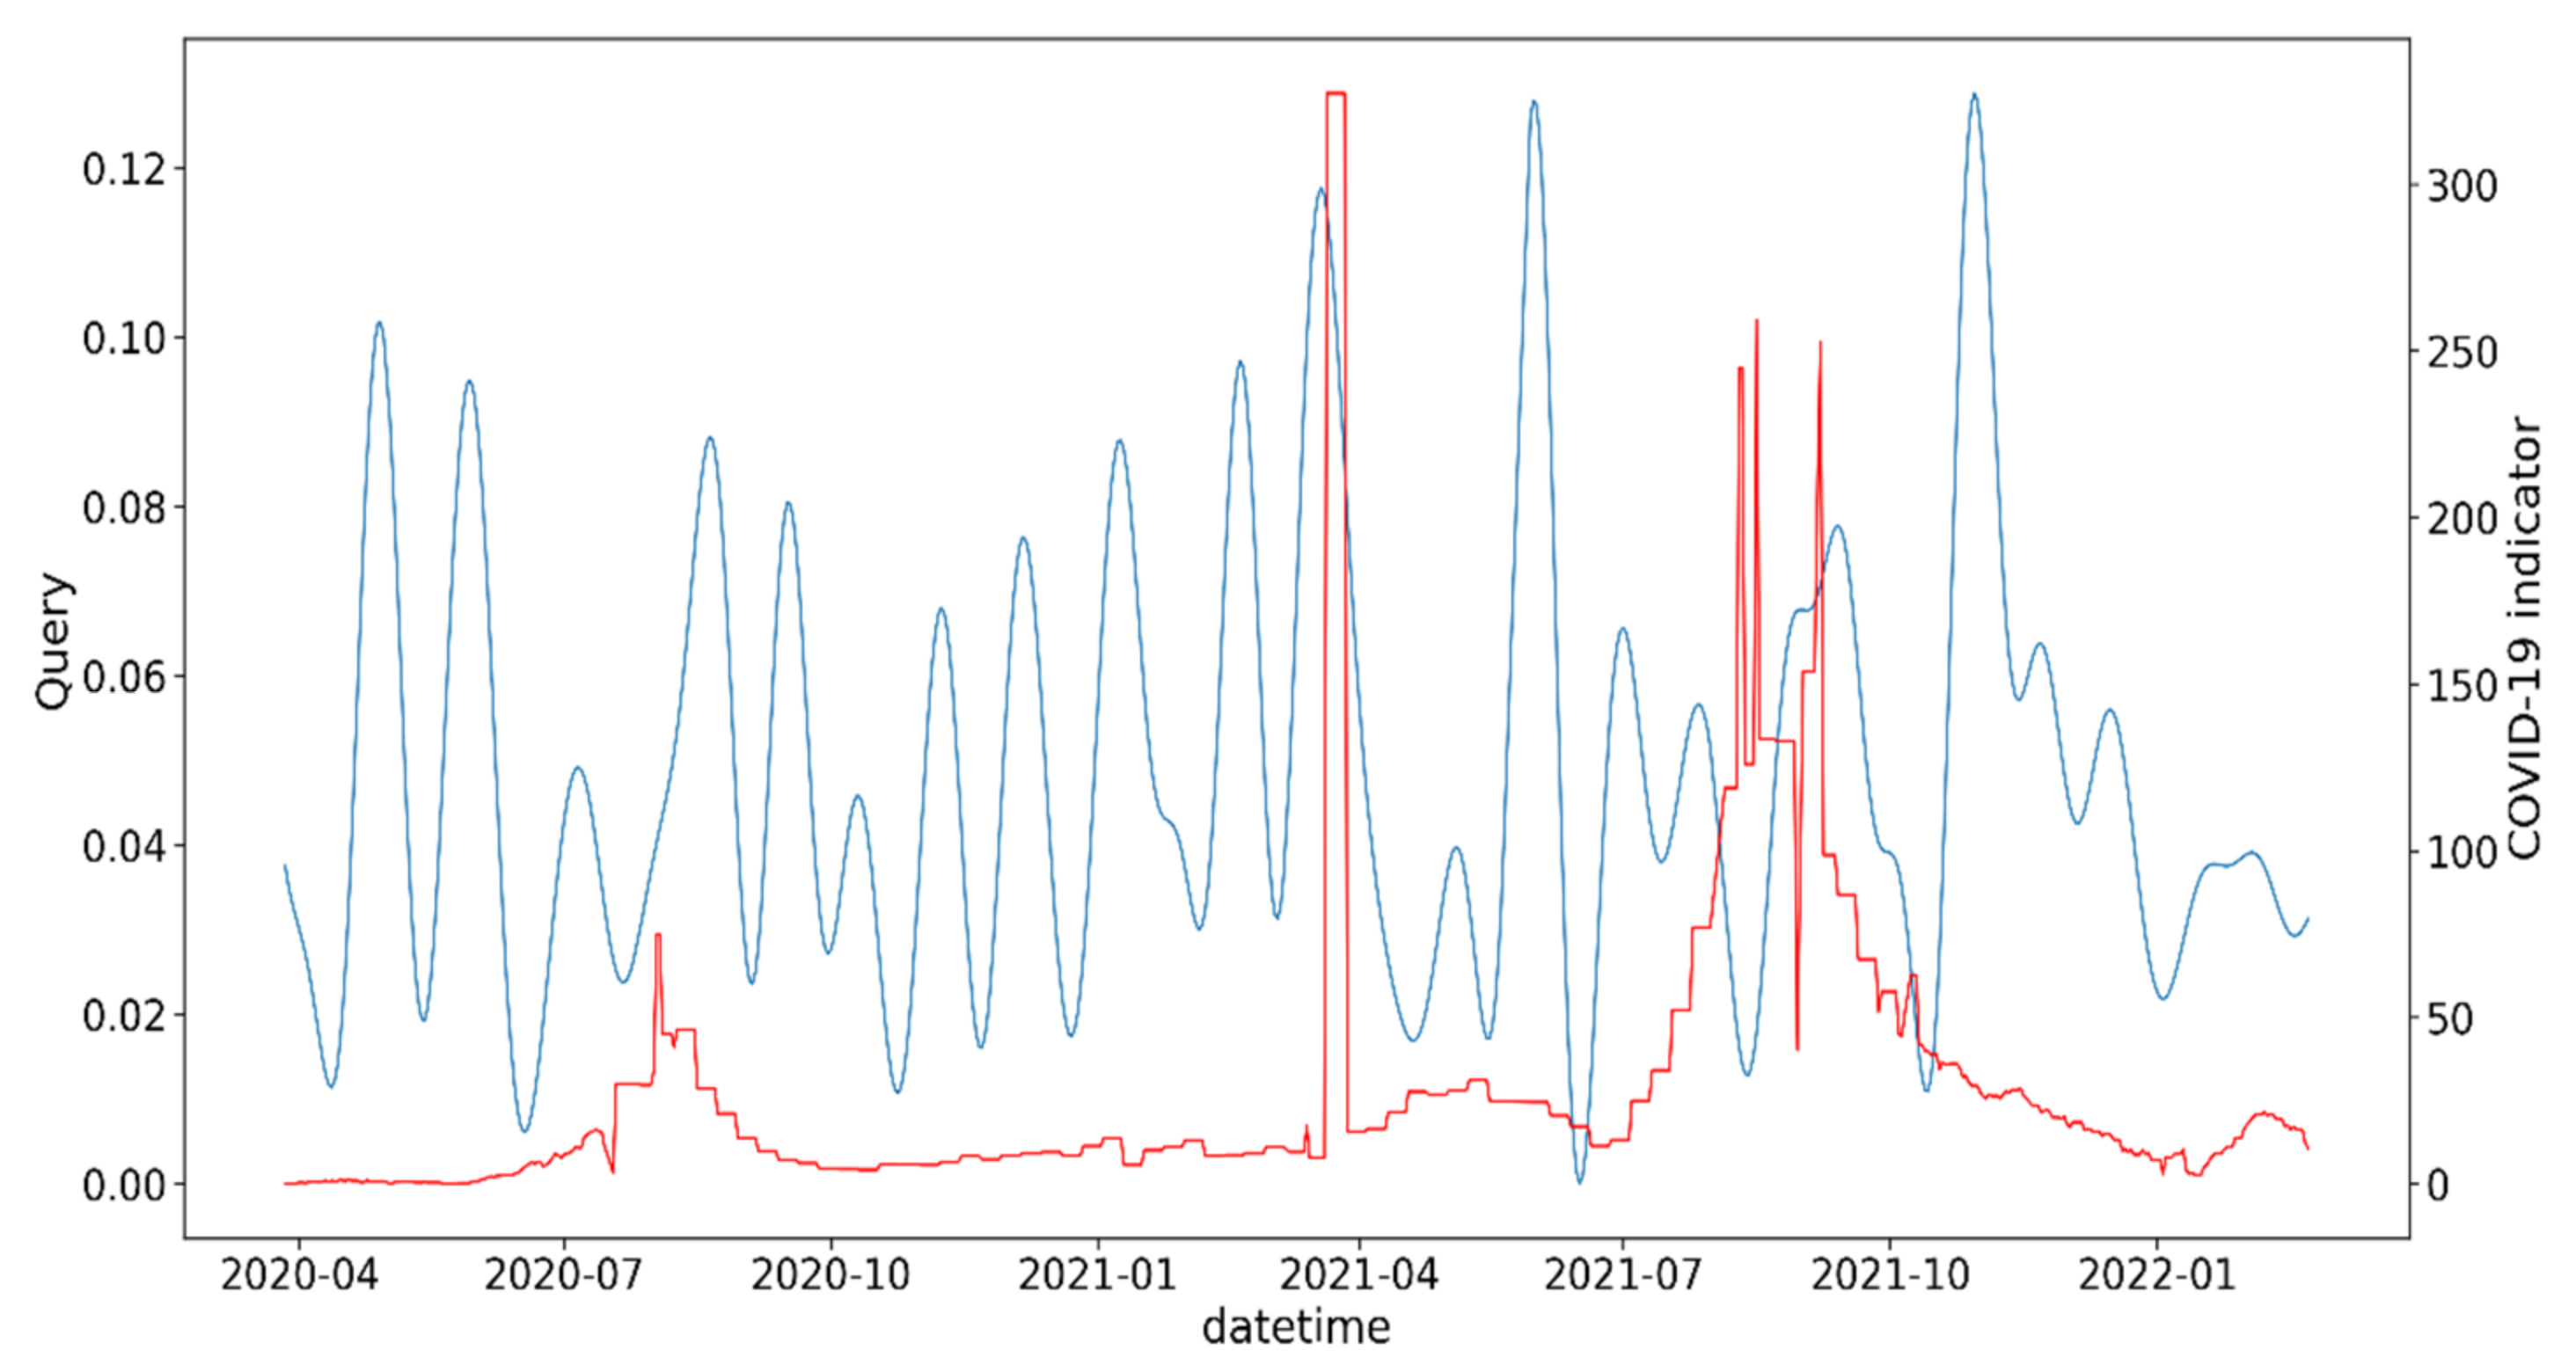
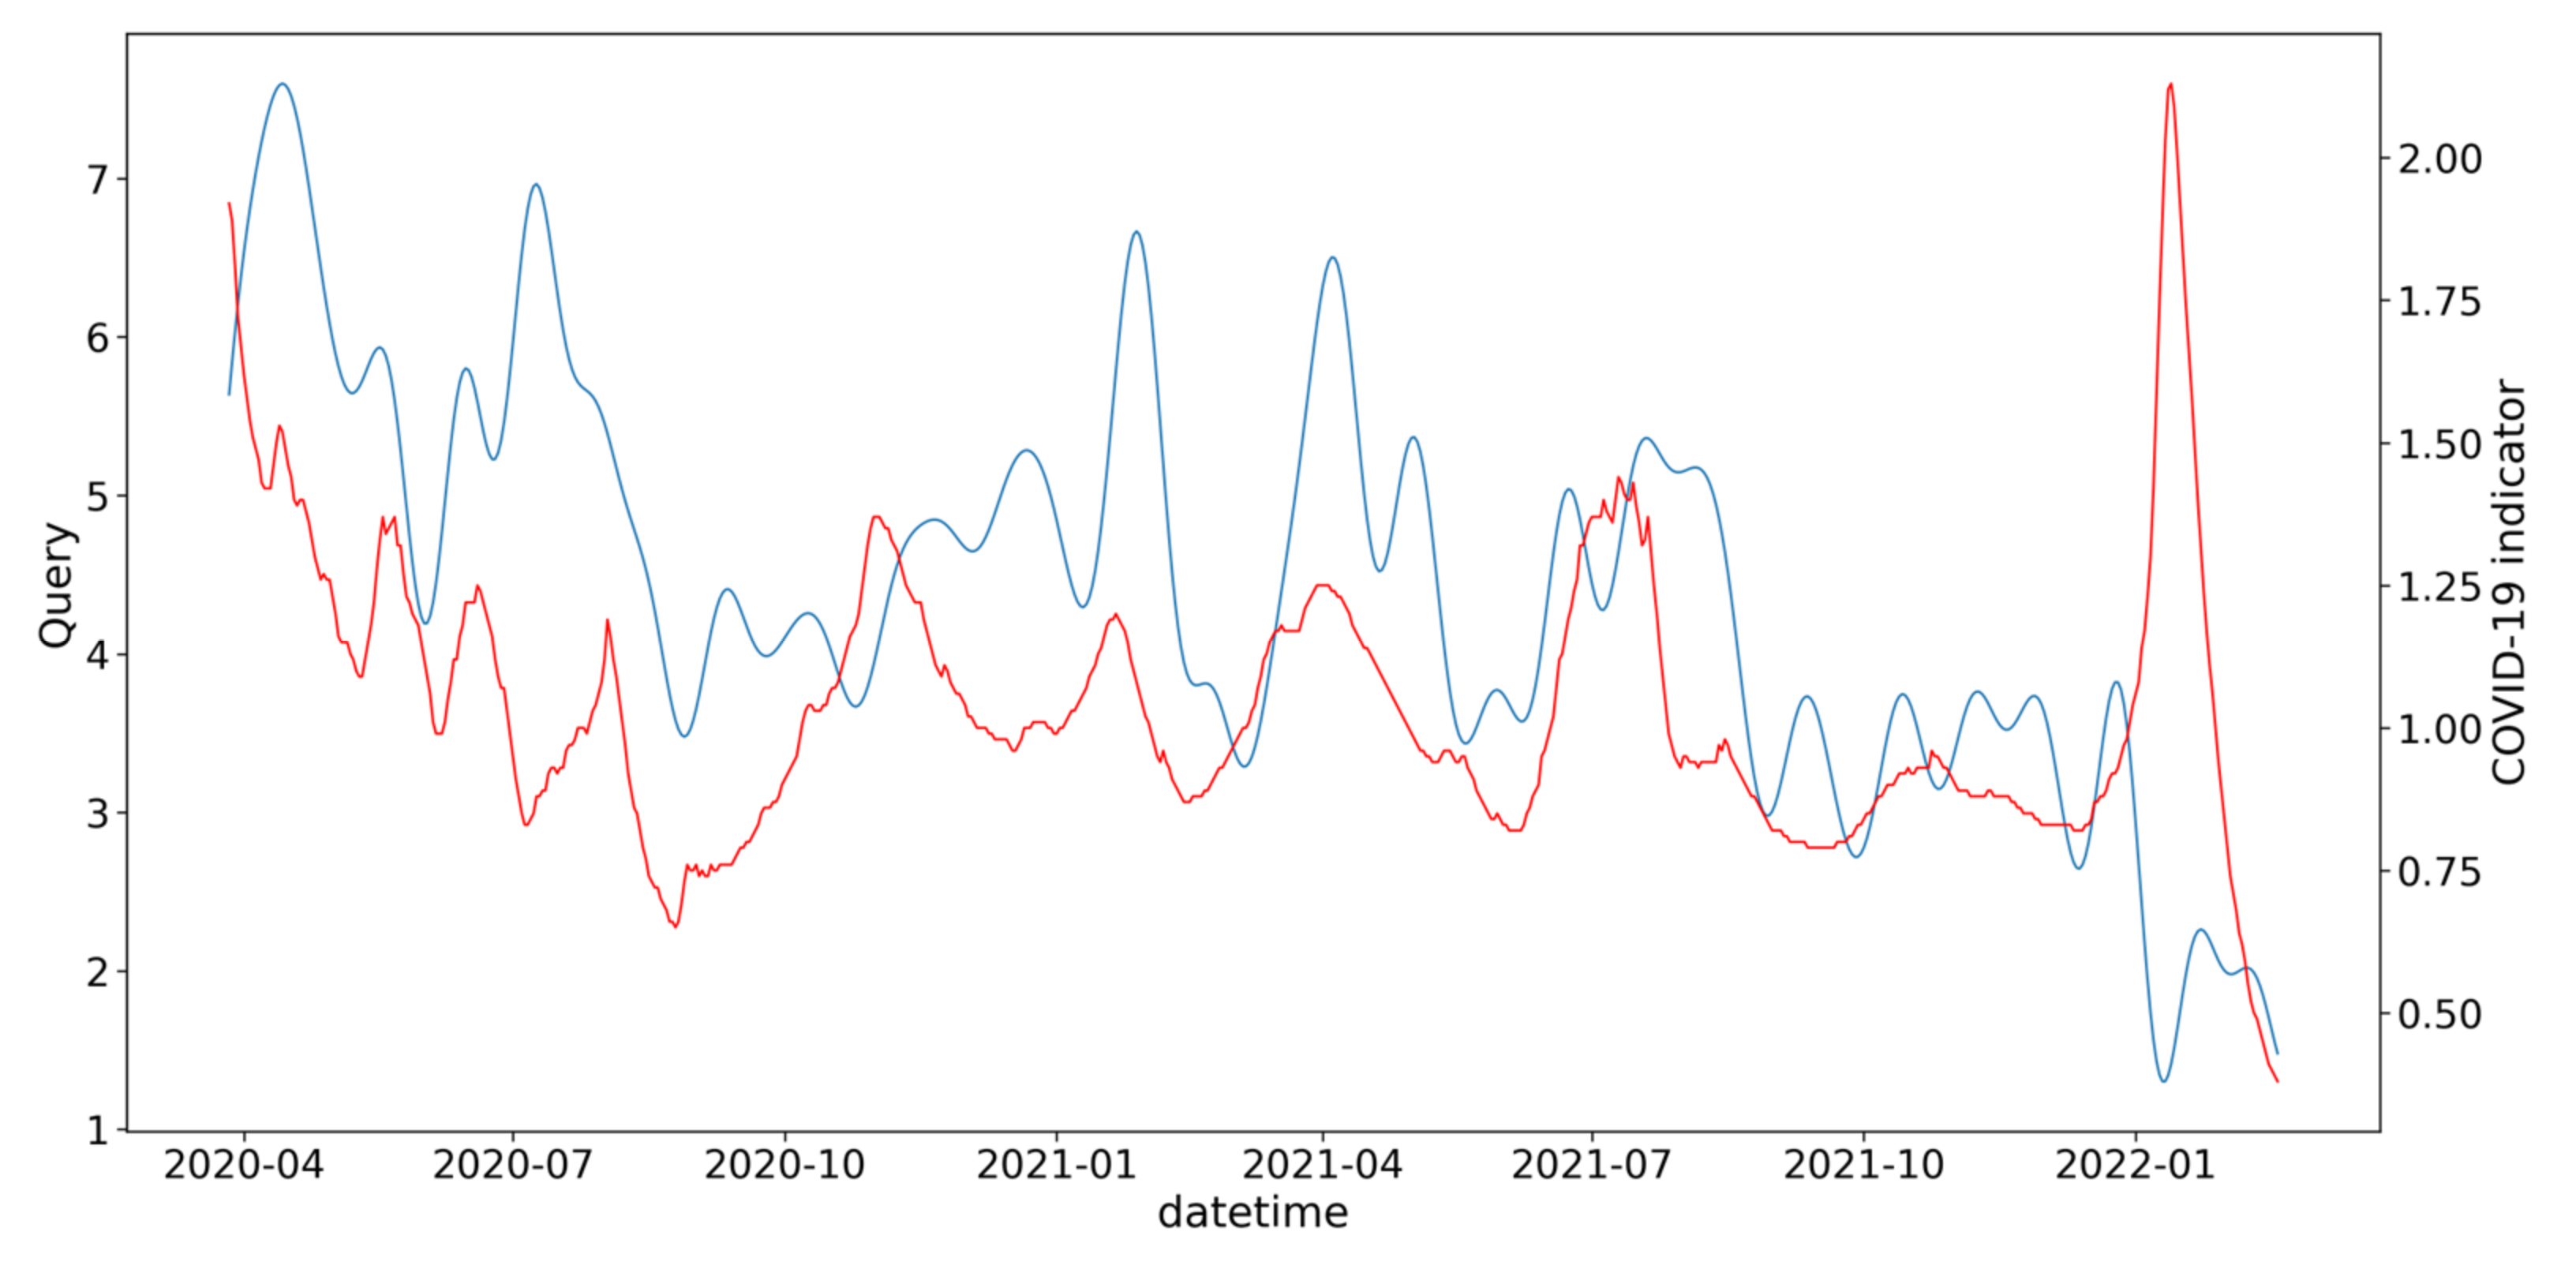
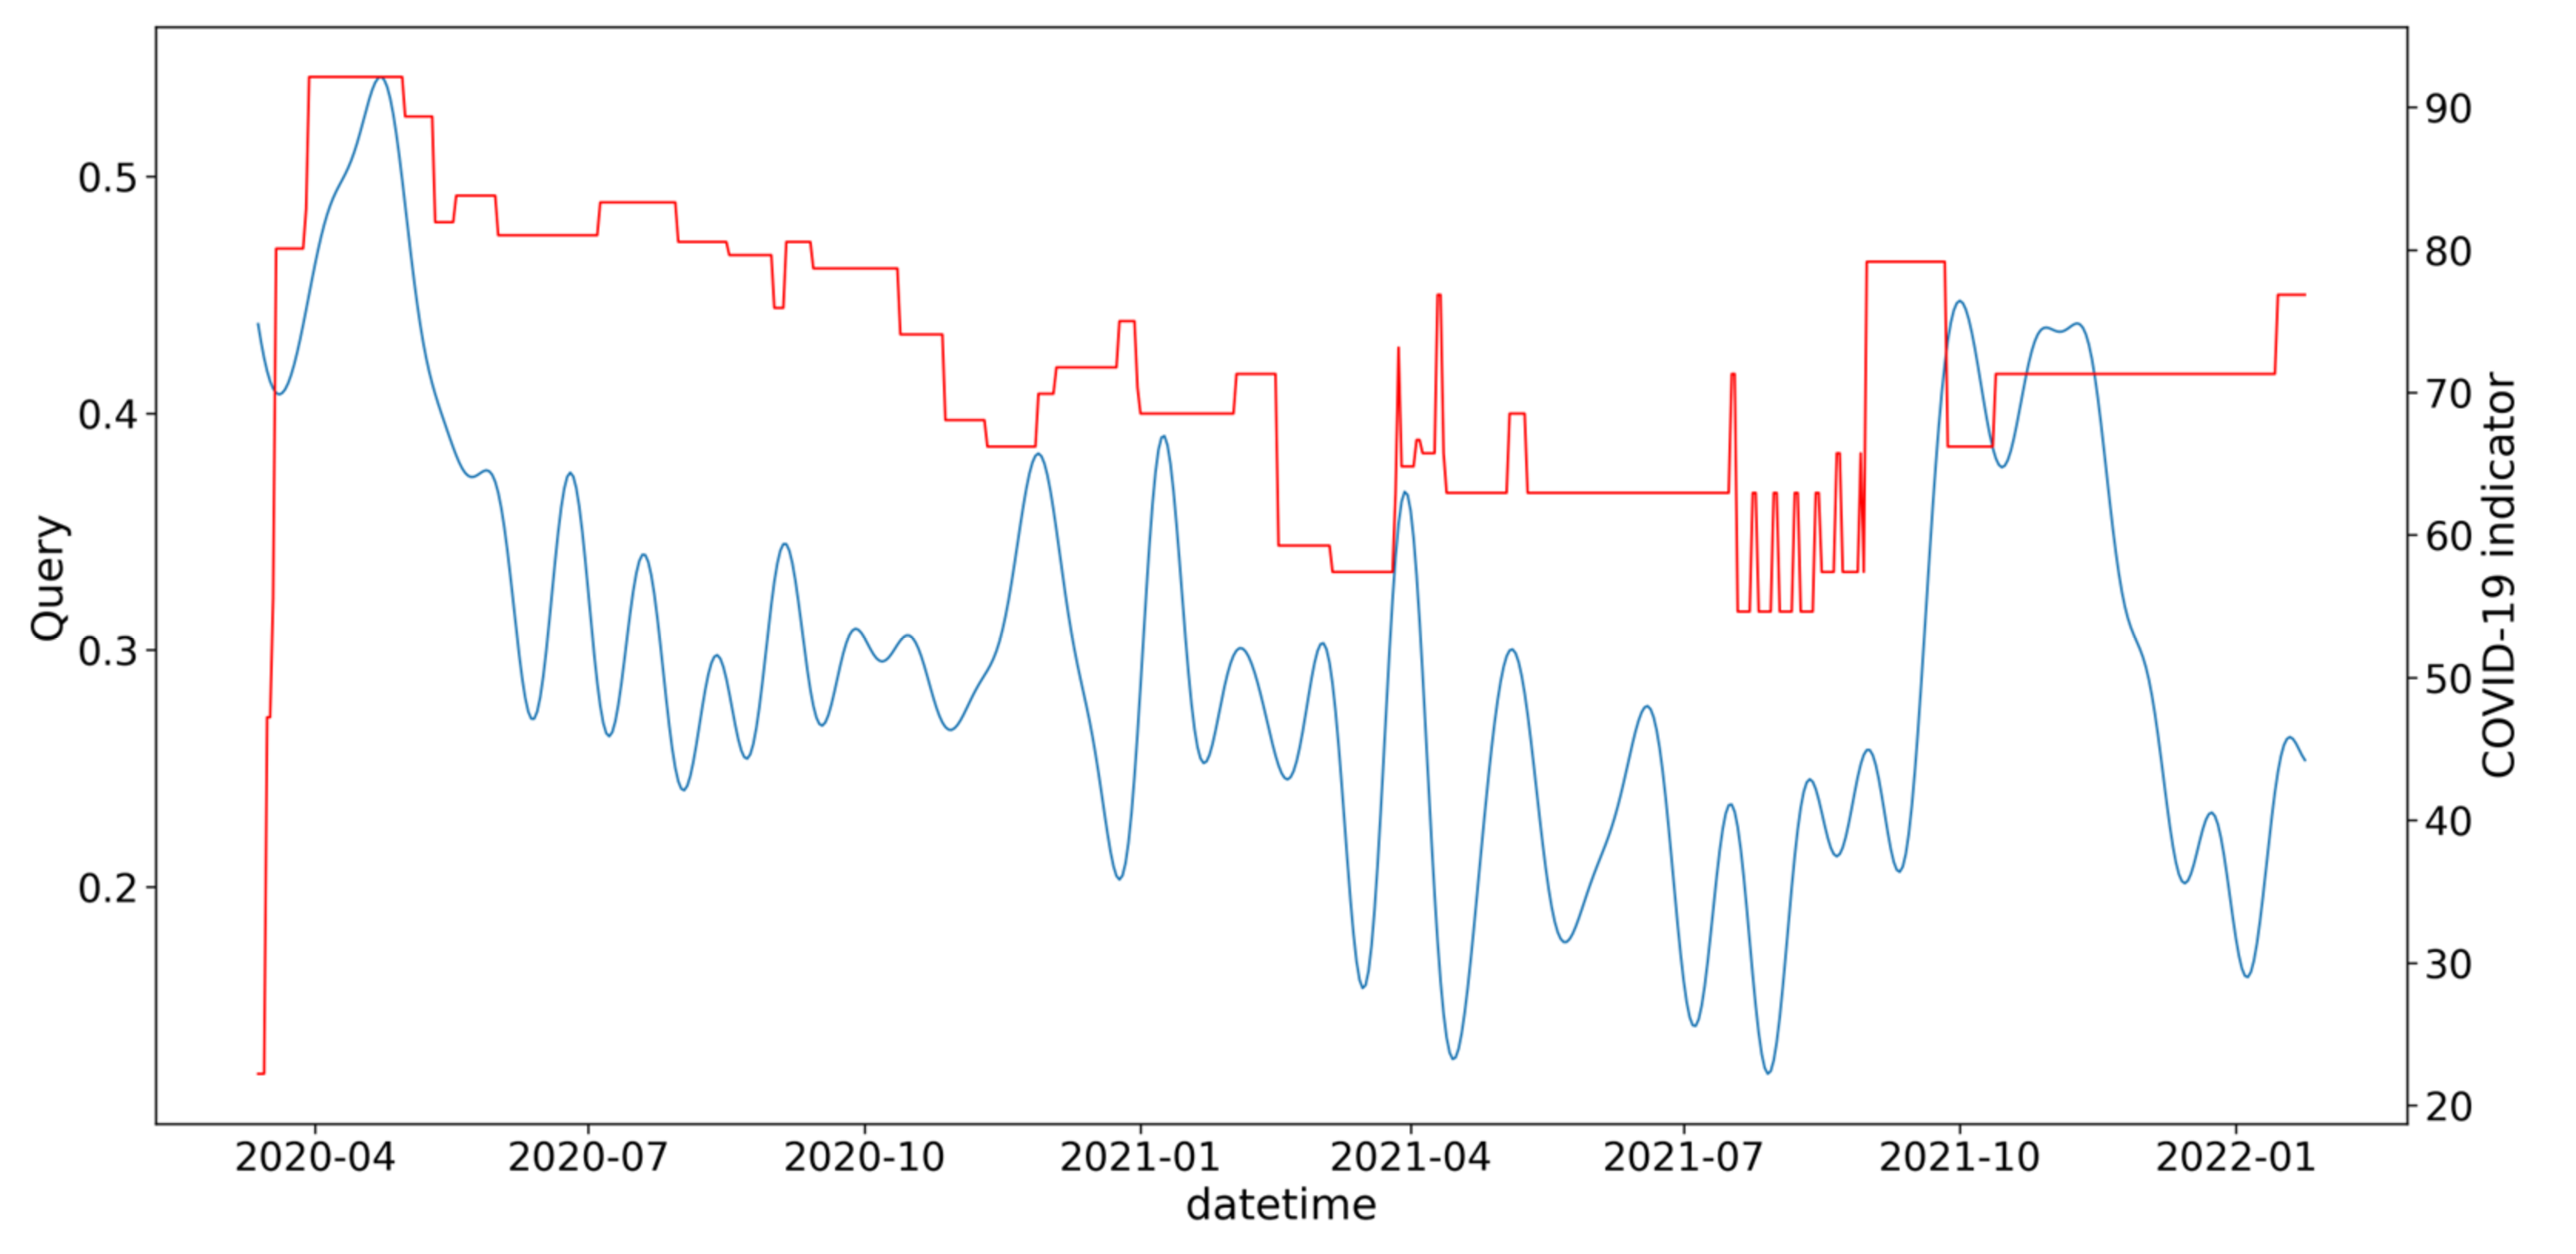
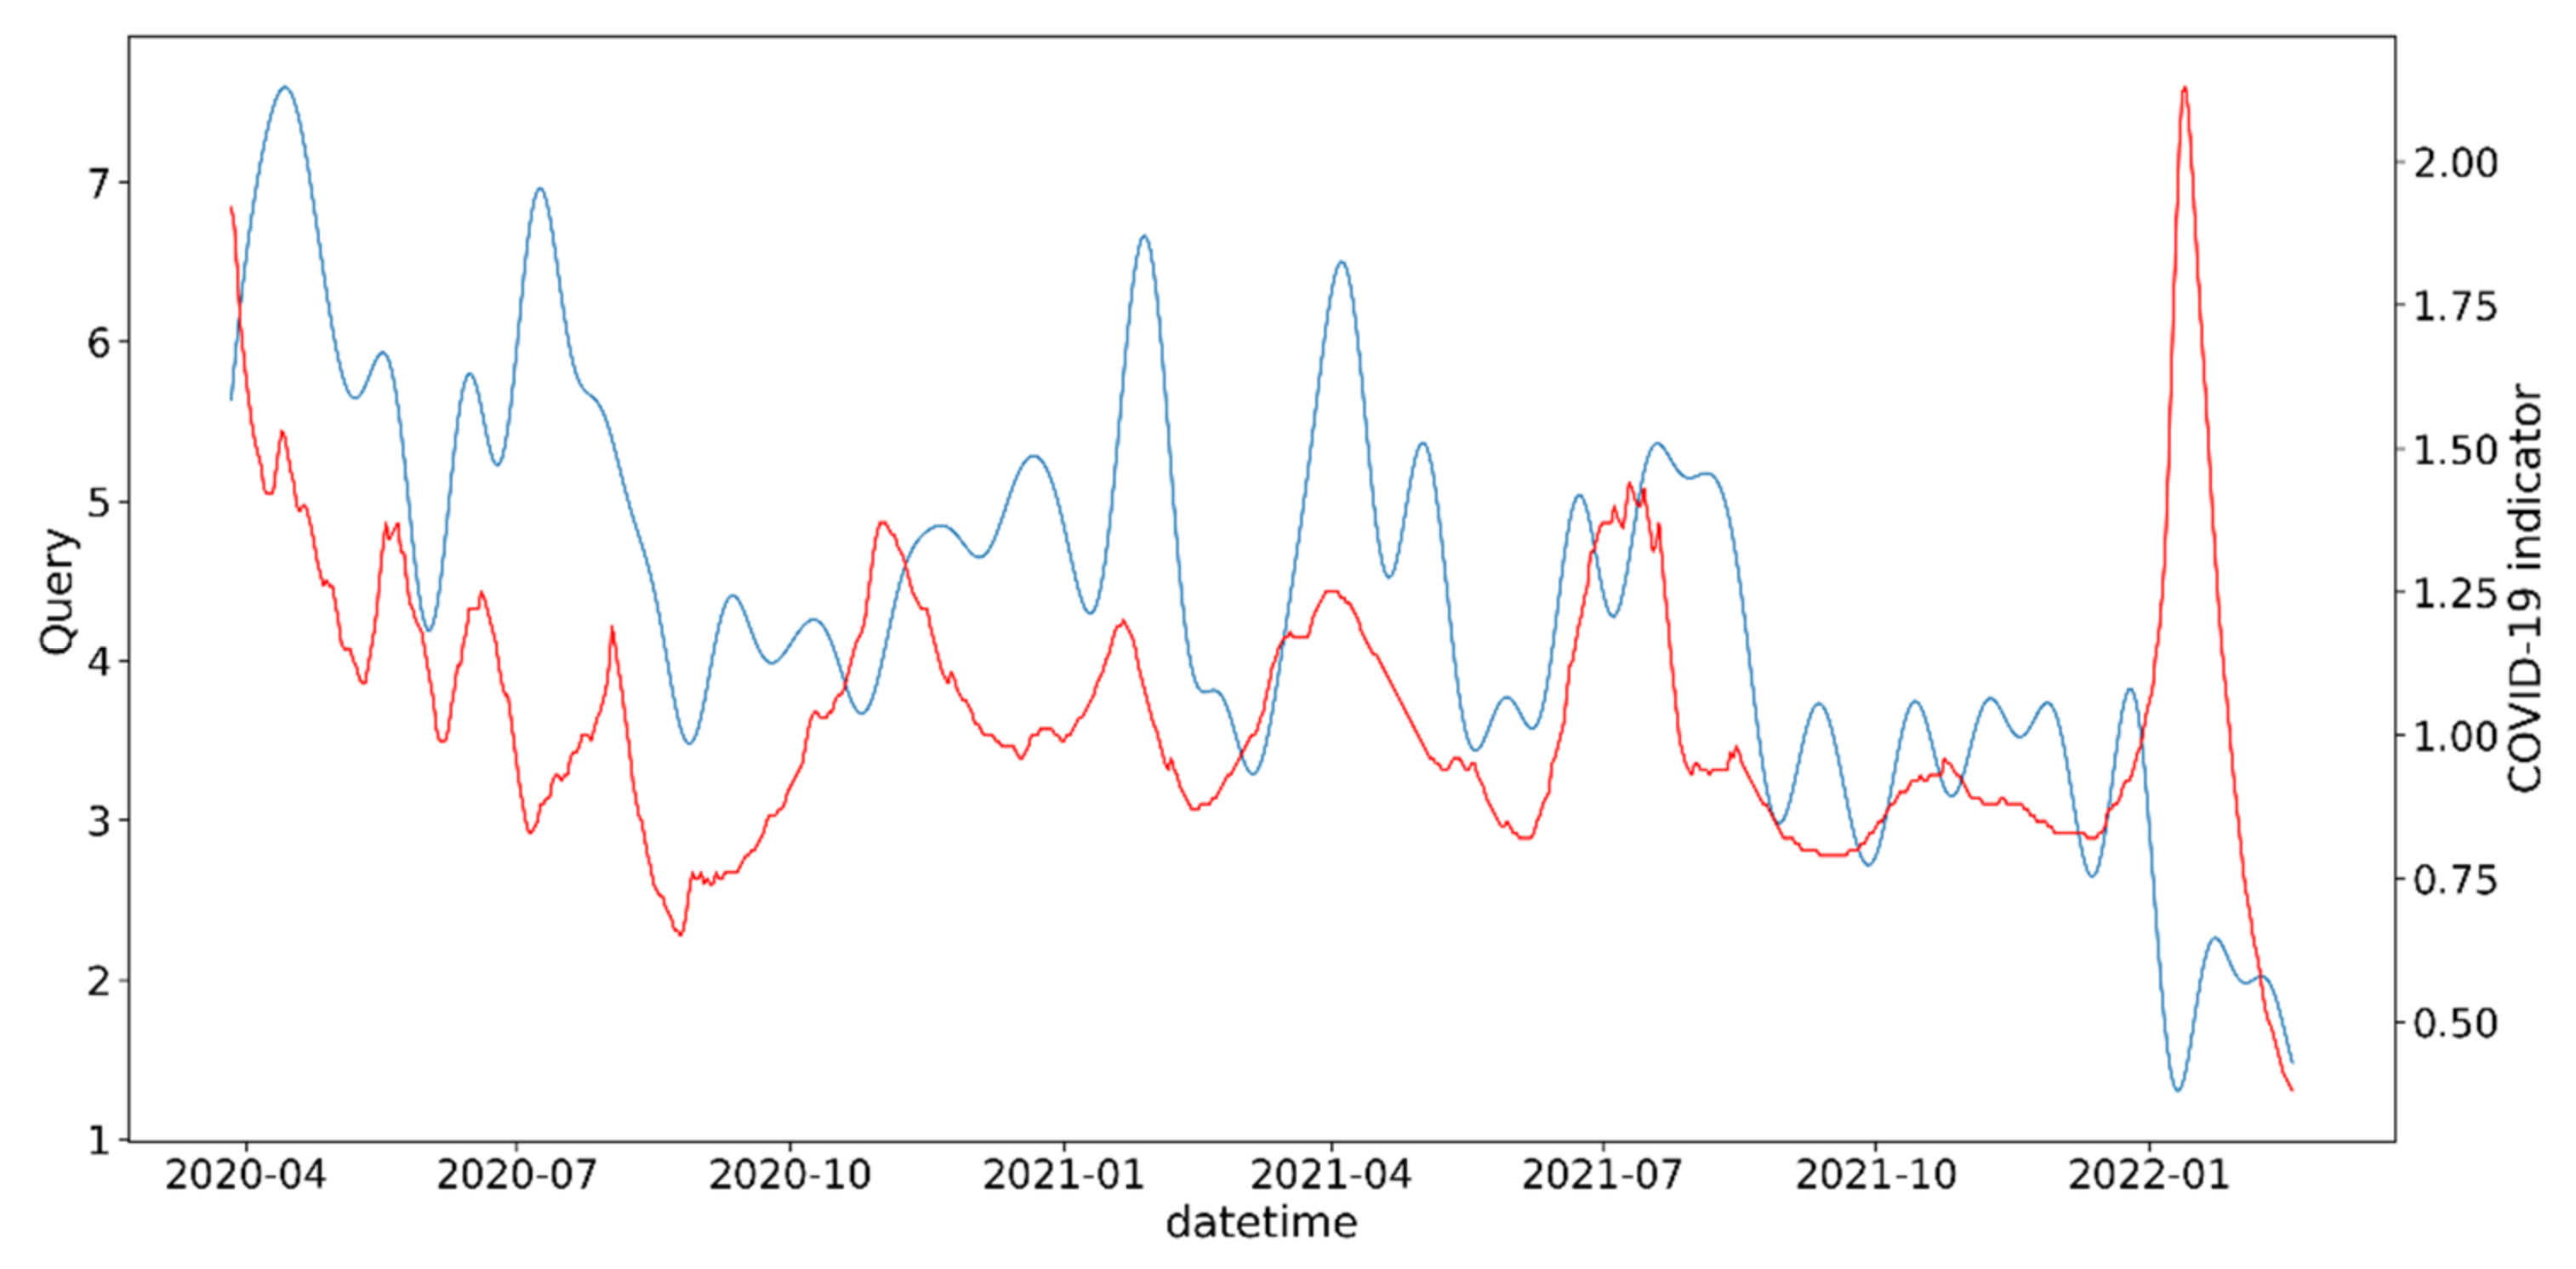
Figure 6 shows an example of dynamically analyzing search queries. The dynamics of the reproduction rate and the publication activity for the query “Vaccination, Vaccines, COVID” are highly correlated. On the other hand, the sharp increase in reproduction rate at the beginning of 2022 (probably due to the spread of the Omicron coronavirus strain) did not provoke great media reaction, and publication activity continued to decline, in line with the general trend of decreasing interest in COVID-19 (see Figure 7).
Figure 6. COVID-19 reproduction rate value (red line) and dynamics of publication activity on query “Vaccination, Vaccines, COVID” (blue line).
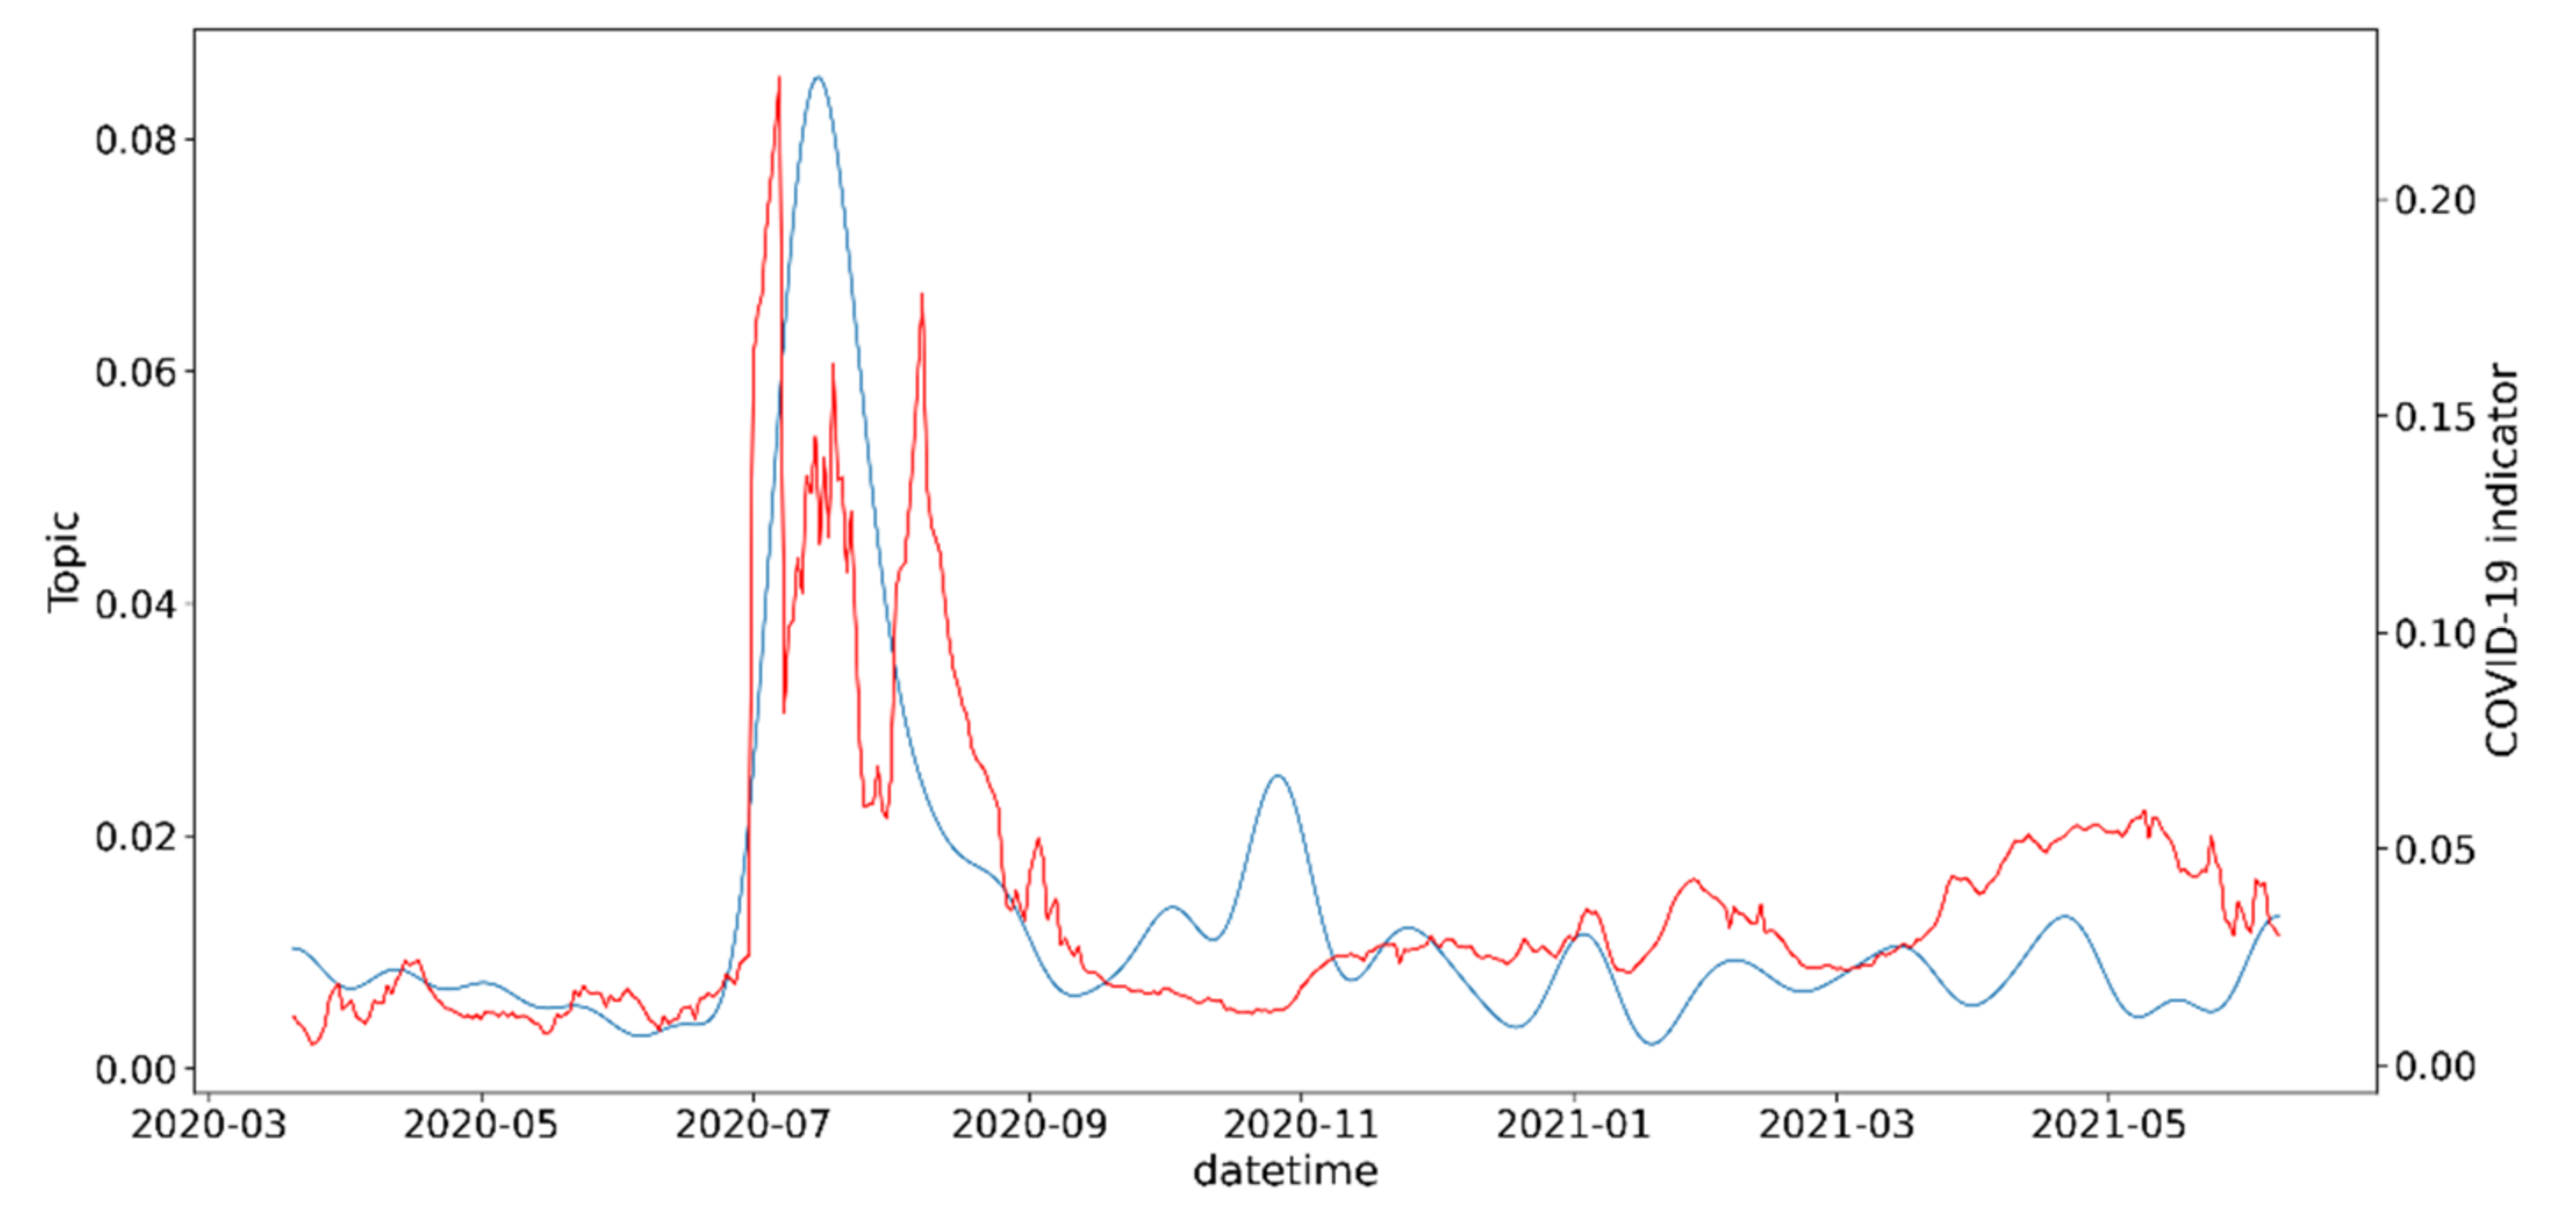
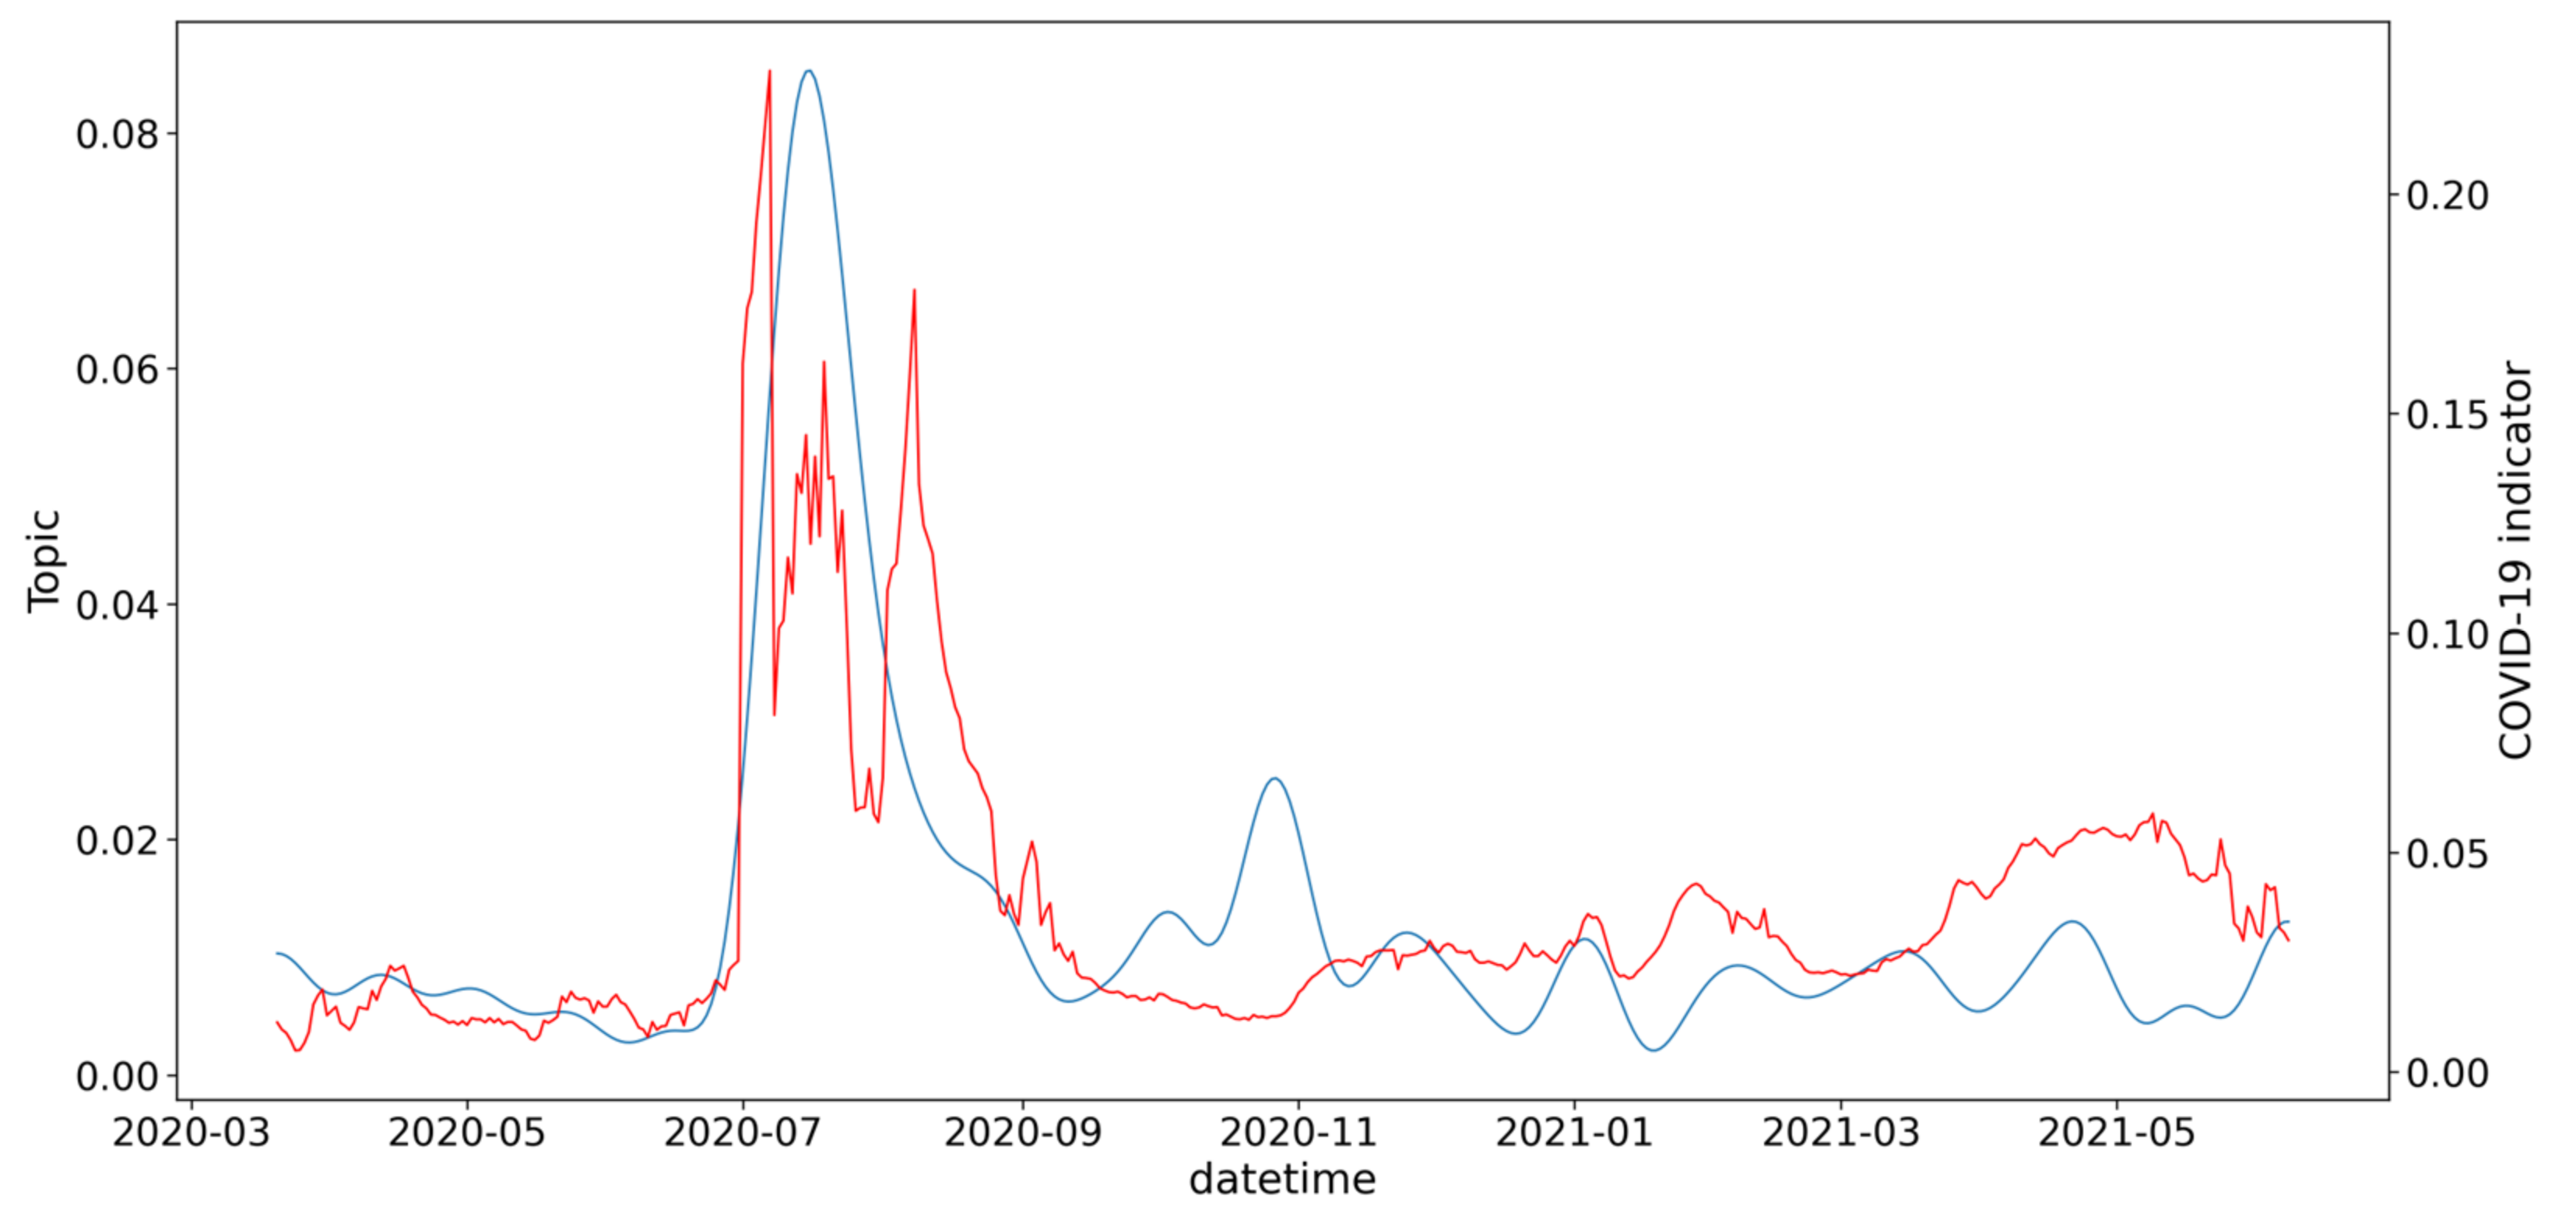
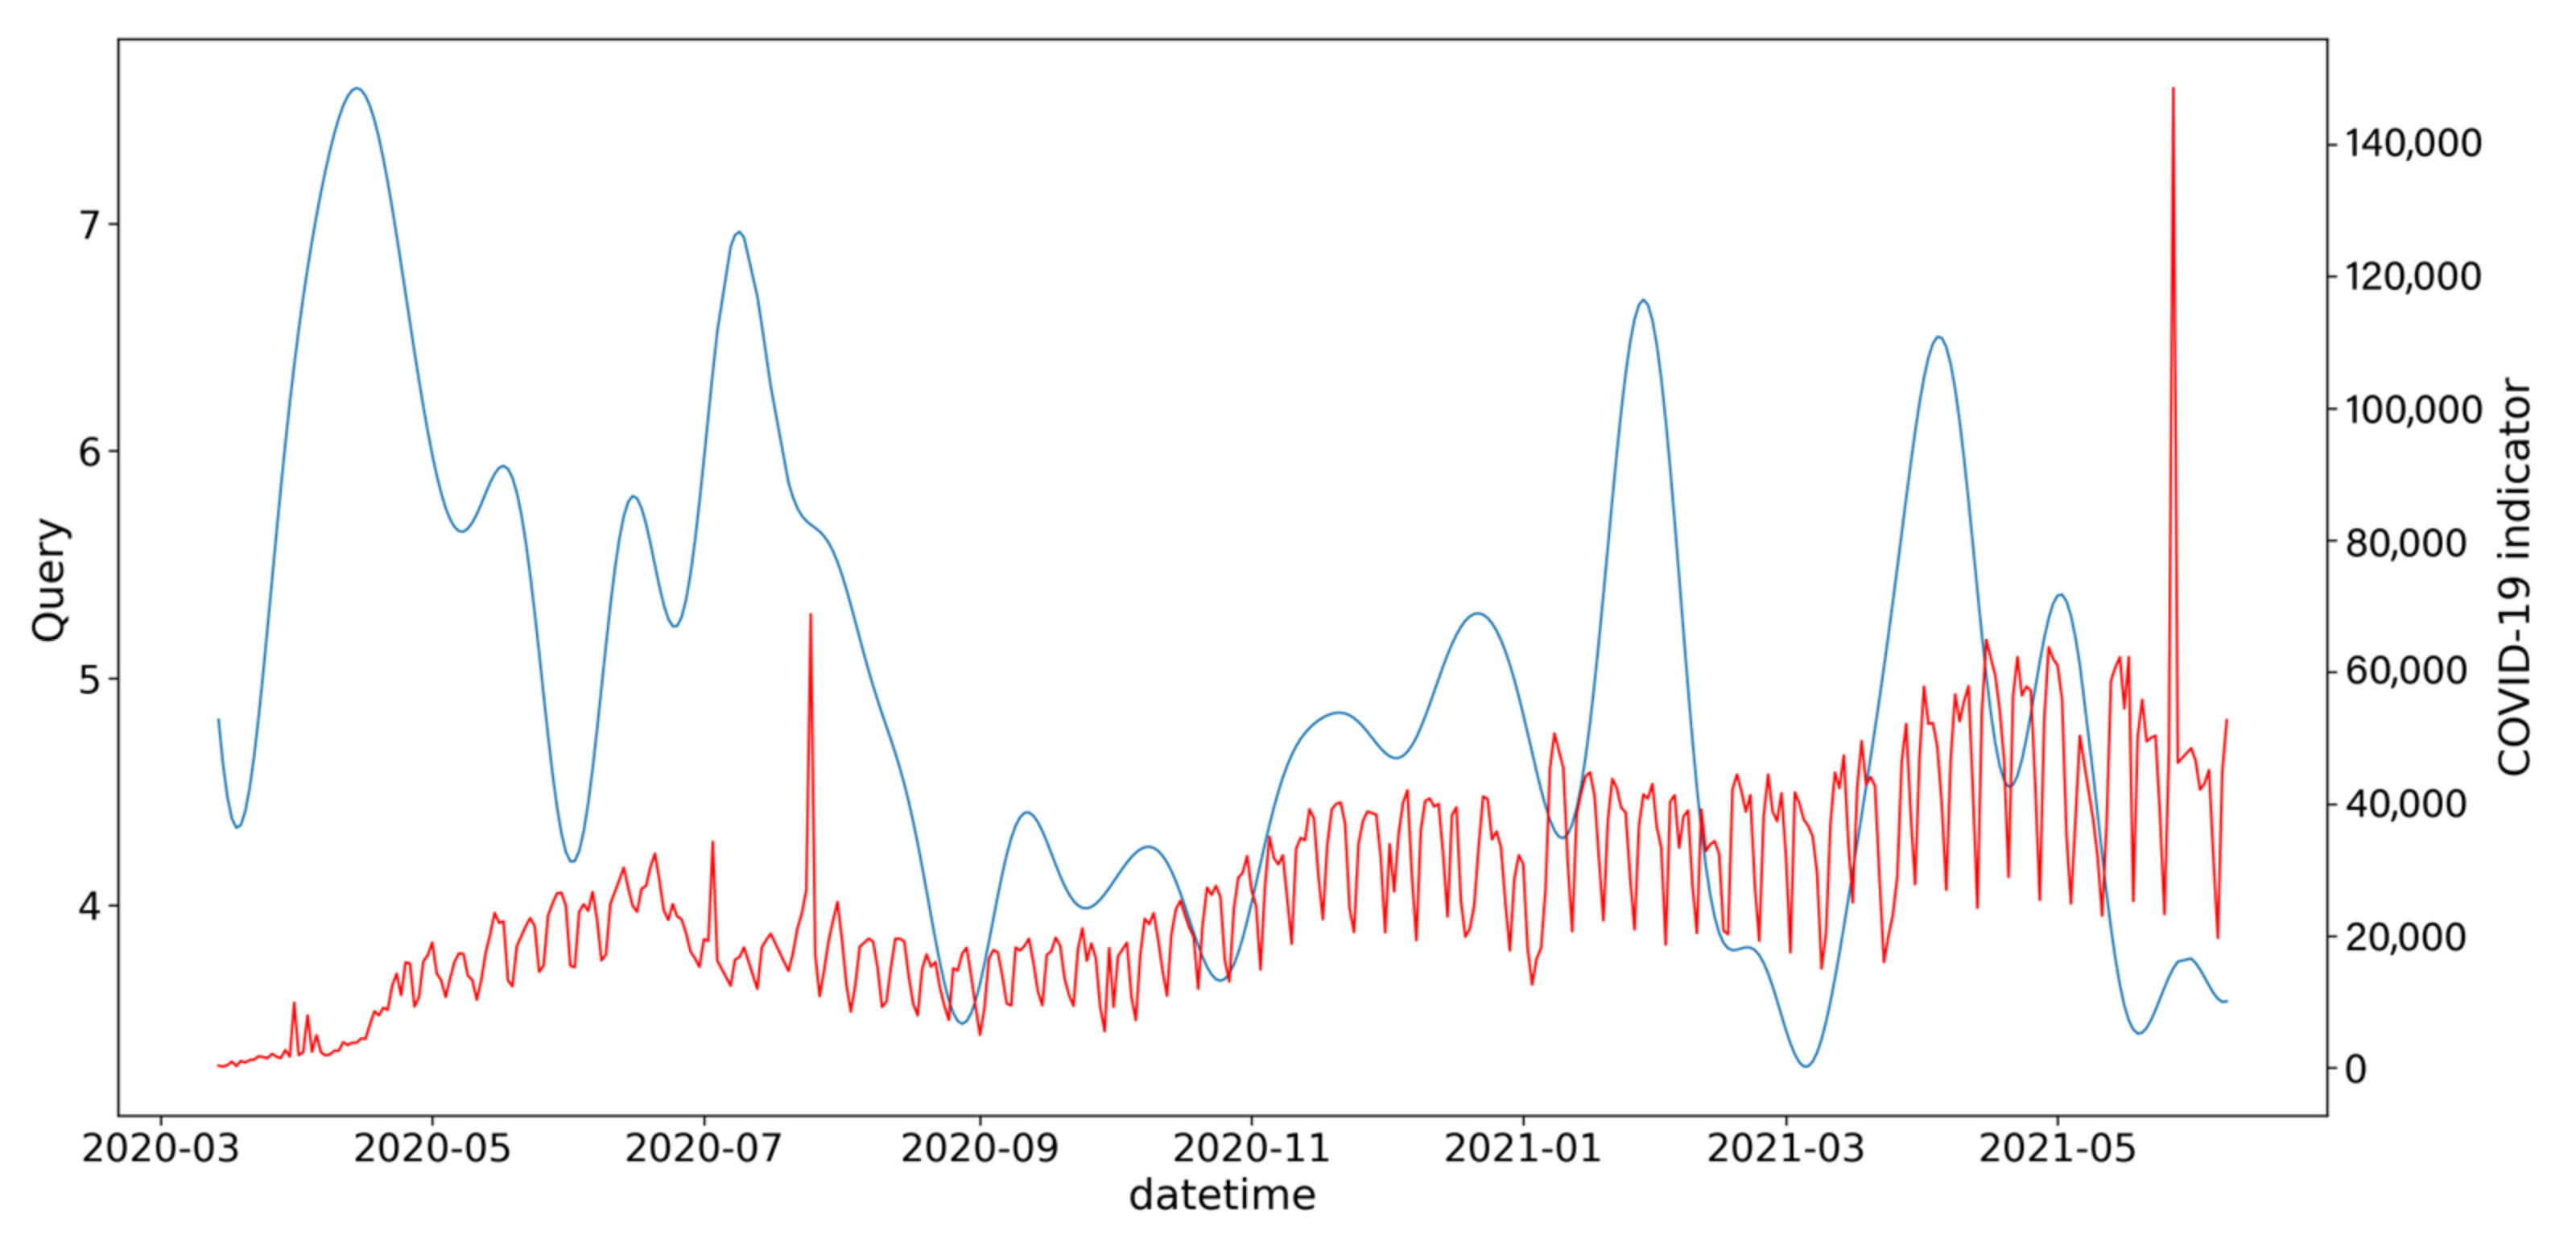
Figure 7. The red line represents the COVID-19 positive rate, and the blue line represents the dynamics of topic “Medication, Medicinal, Drug, Medication, Medicinal_medication, Medical, Pharmacy”.
Figure 7 shows the relationships between publication activity on the topic reflecting the availability and prices of medicines and the positive test rate indicator. We can see that especially in the summer of 2020, there was a strong correlation. However, already in spring of 2021, the growth of the positive rate does not cause such a response of publication activity on this topic; this fact may indicate both stabilization of the situation with the supply of drugs and reduction of tension in society regarding the supply of drugs during the pandemic.
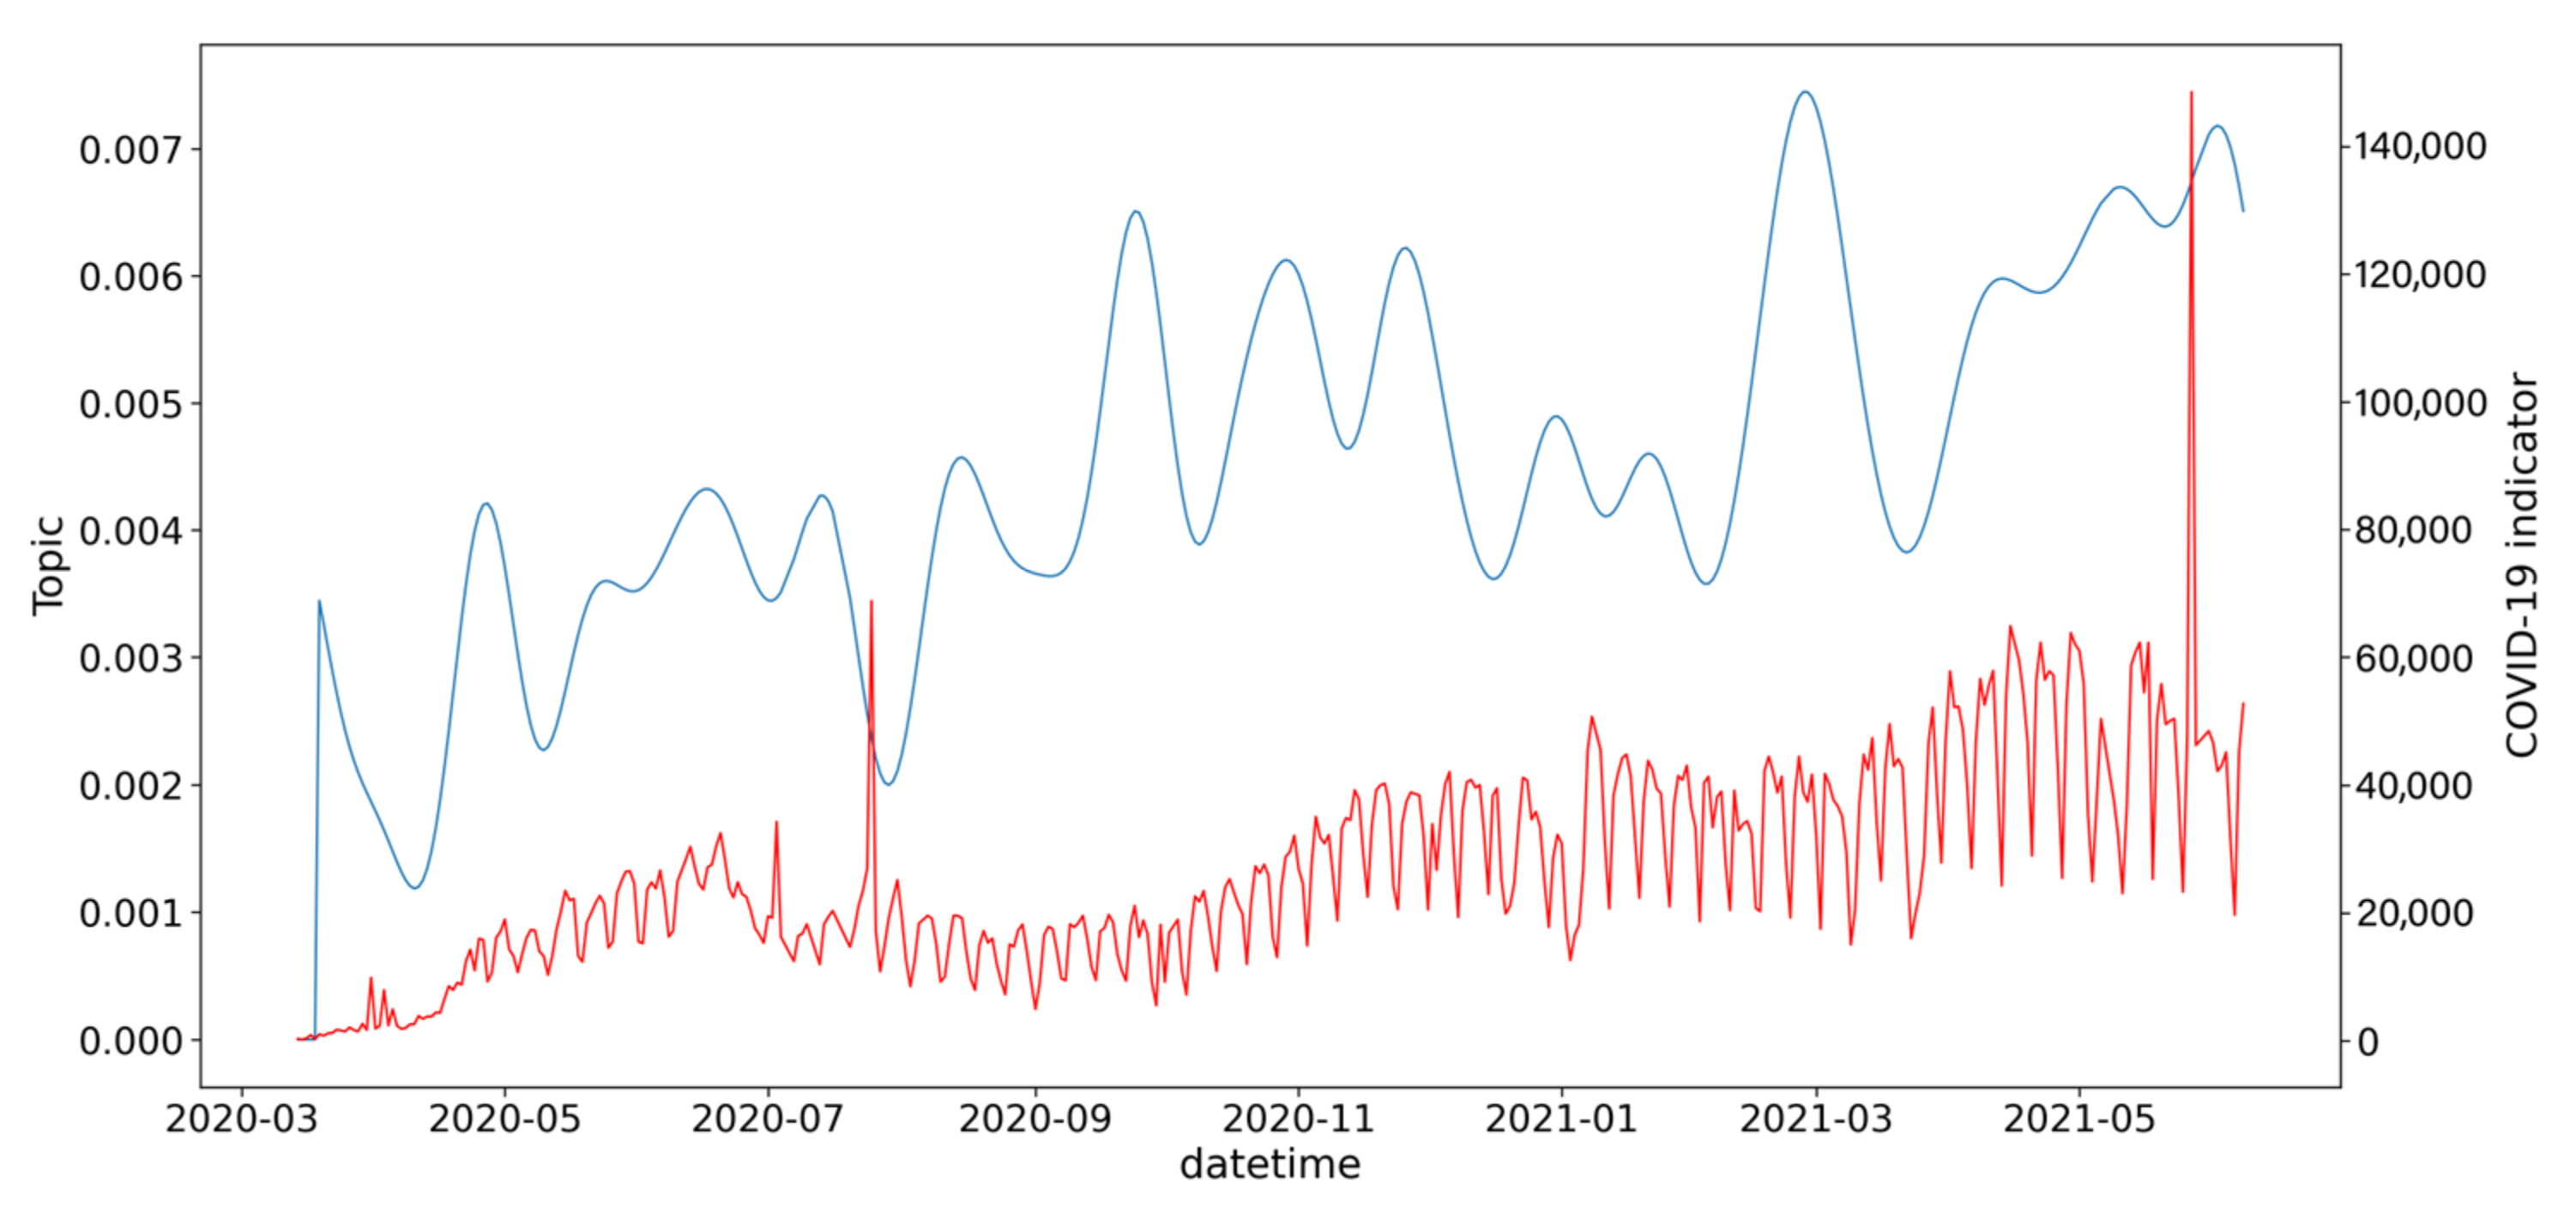
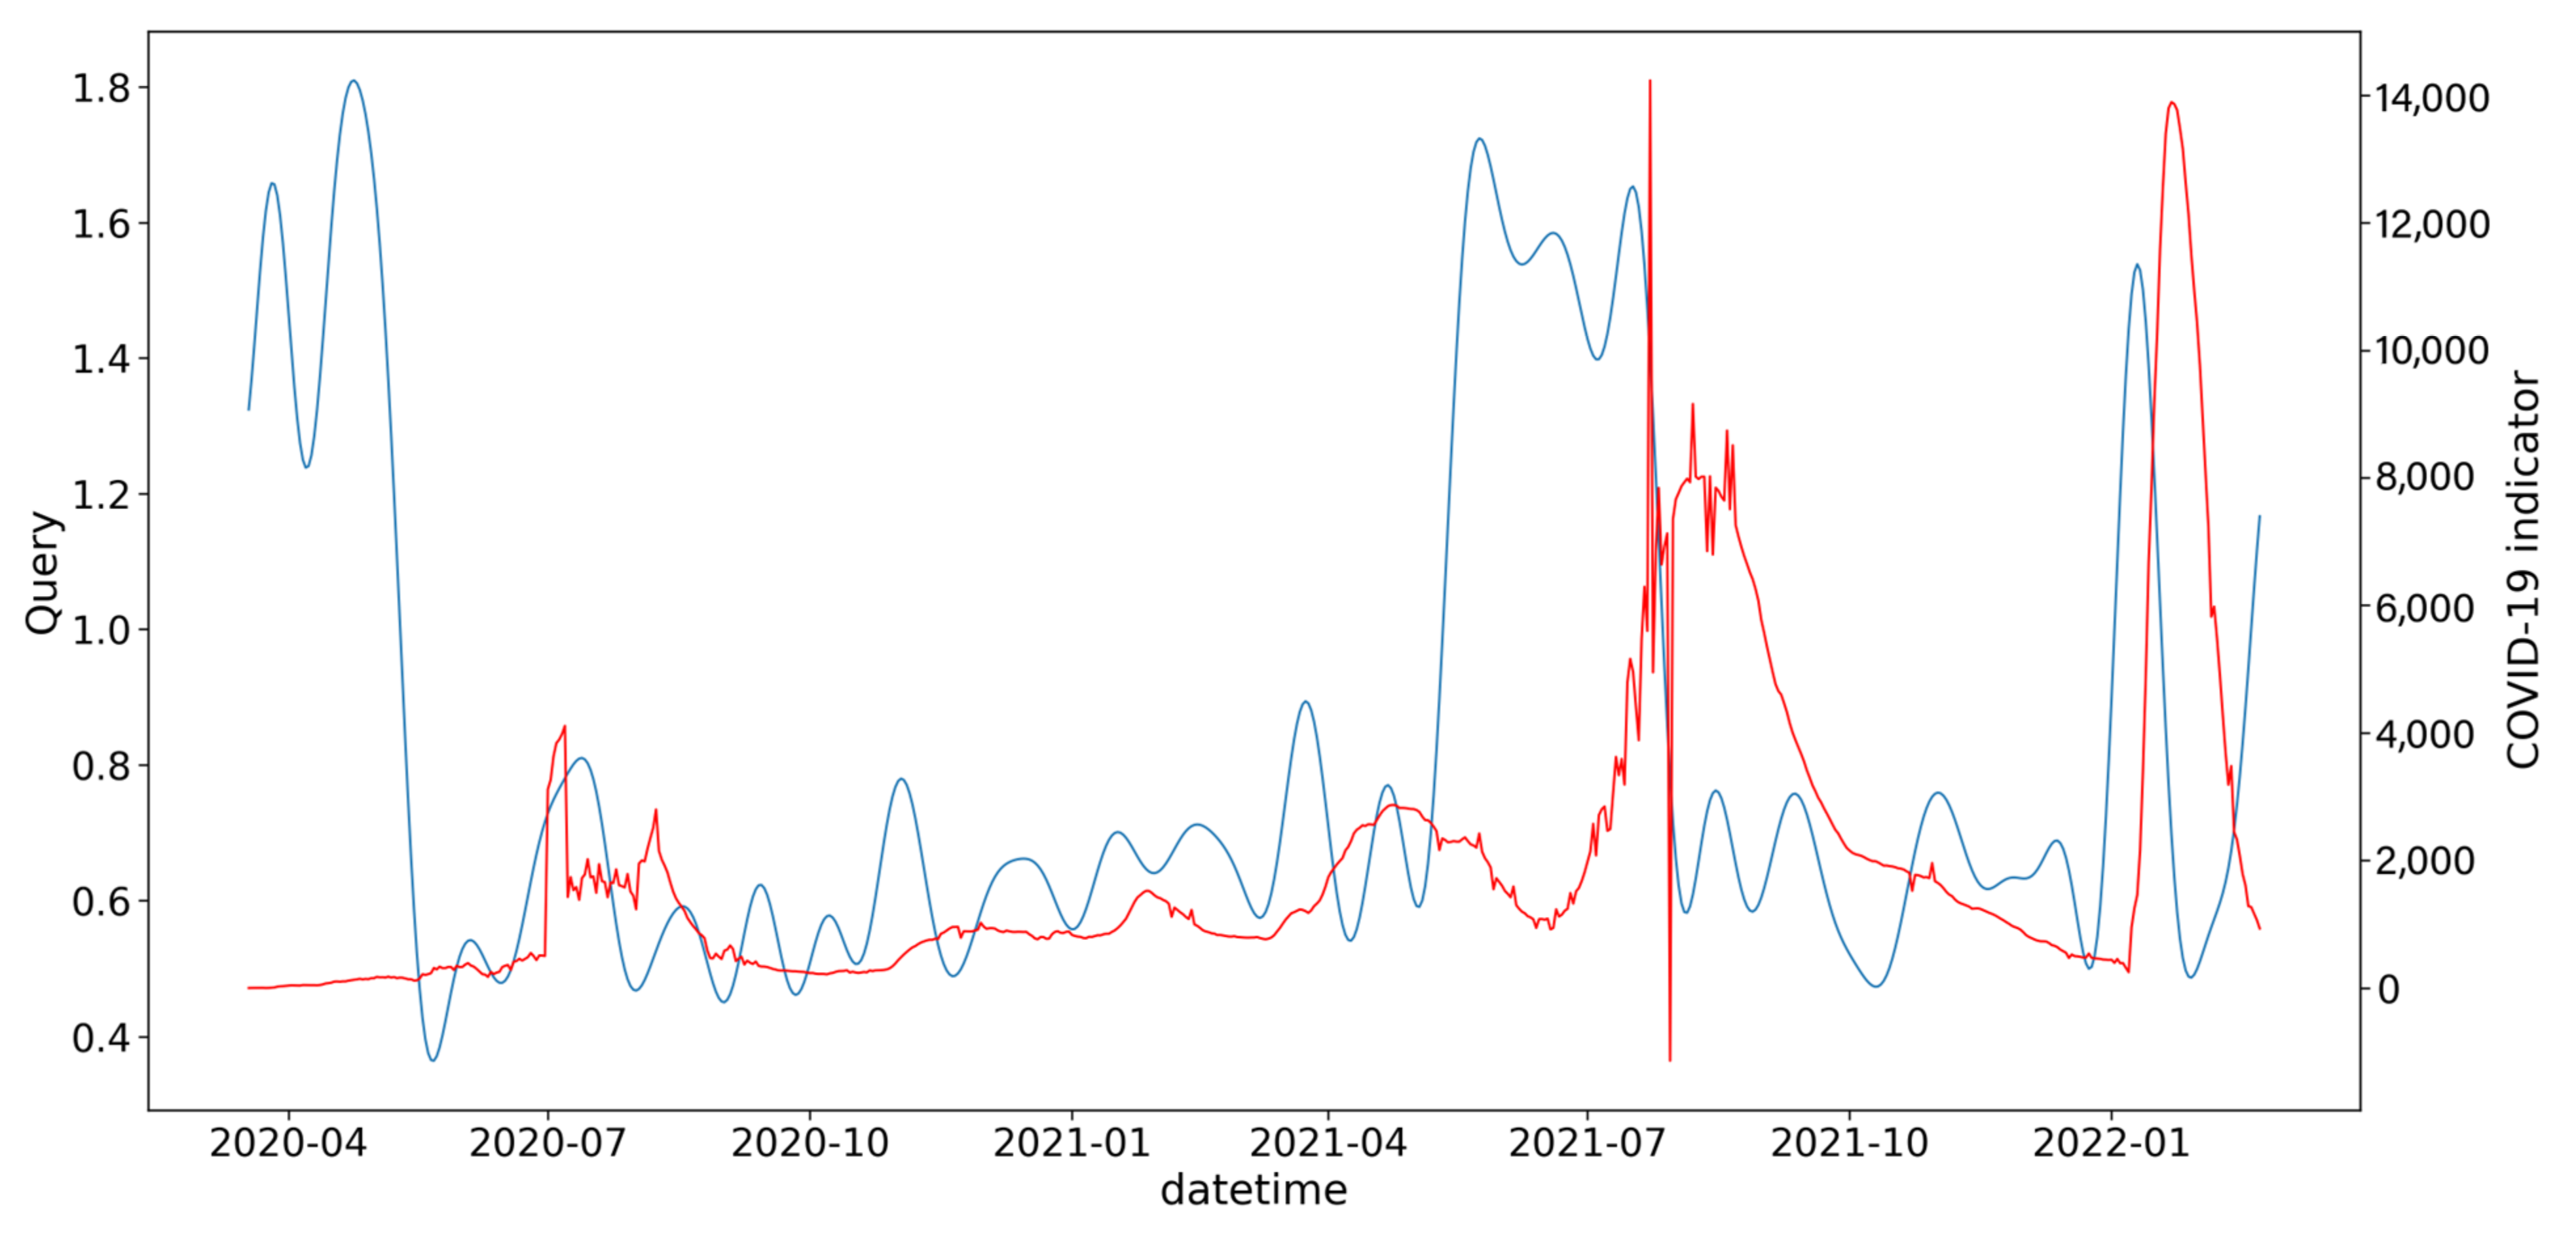
As shown in Figure 8, the topic of health fakes remains relevant, and publication activity has not waned, unlike vaccinations, medications, and the general epidemiological situation. However, since the summer of 2021, the correlation has become negative, in other words, waves of fakes have appeared when the epidemiological situation has improved.
Figure 8. The red line represents the new cases of COVID-19, and the blue line represents the dynamics of the publication activity on topic “Fake, false information, misinformation”.
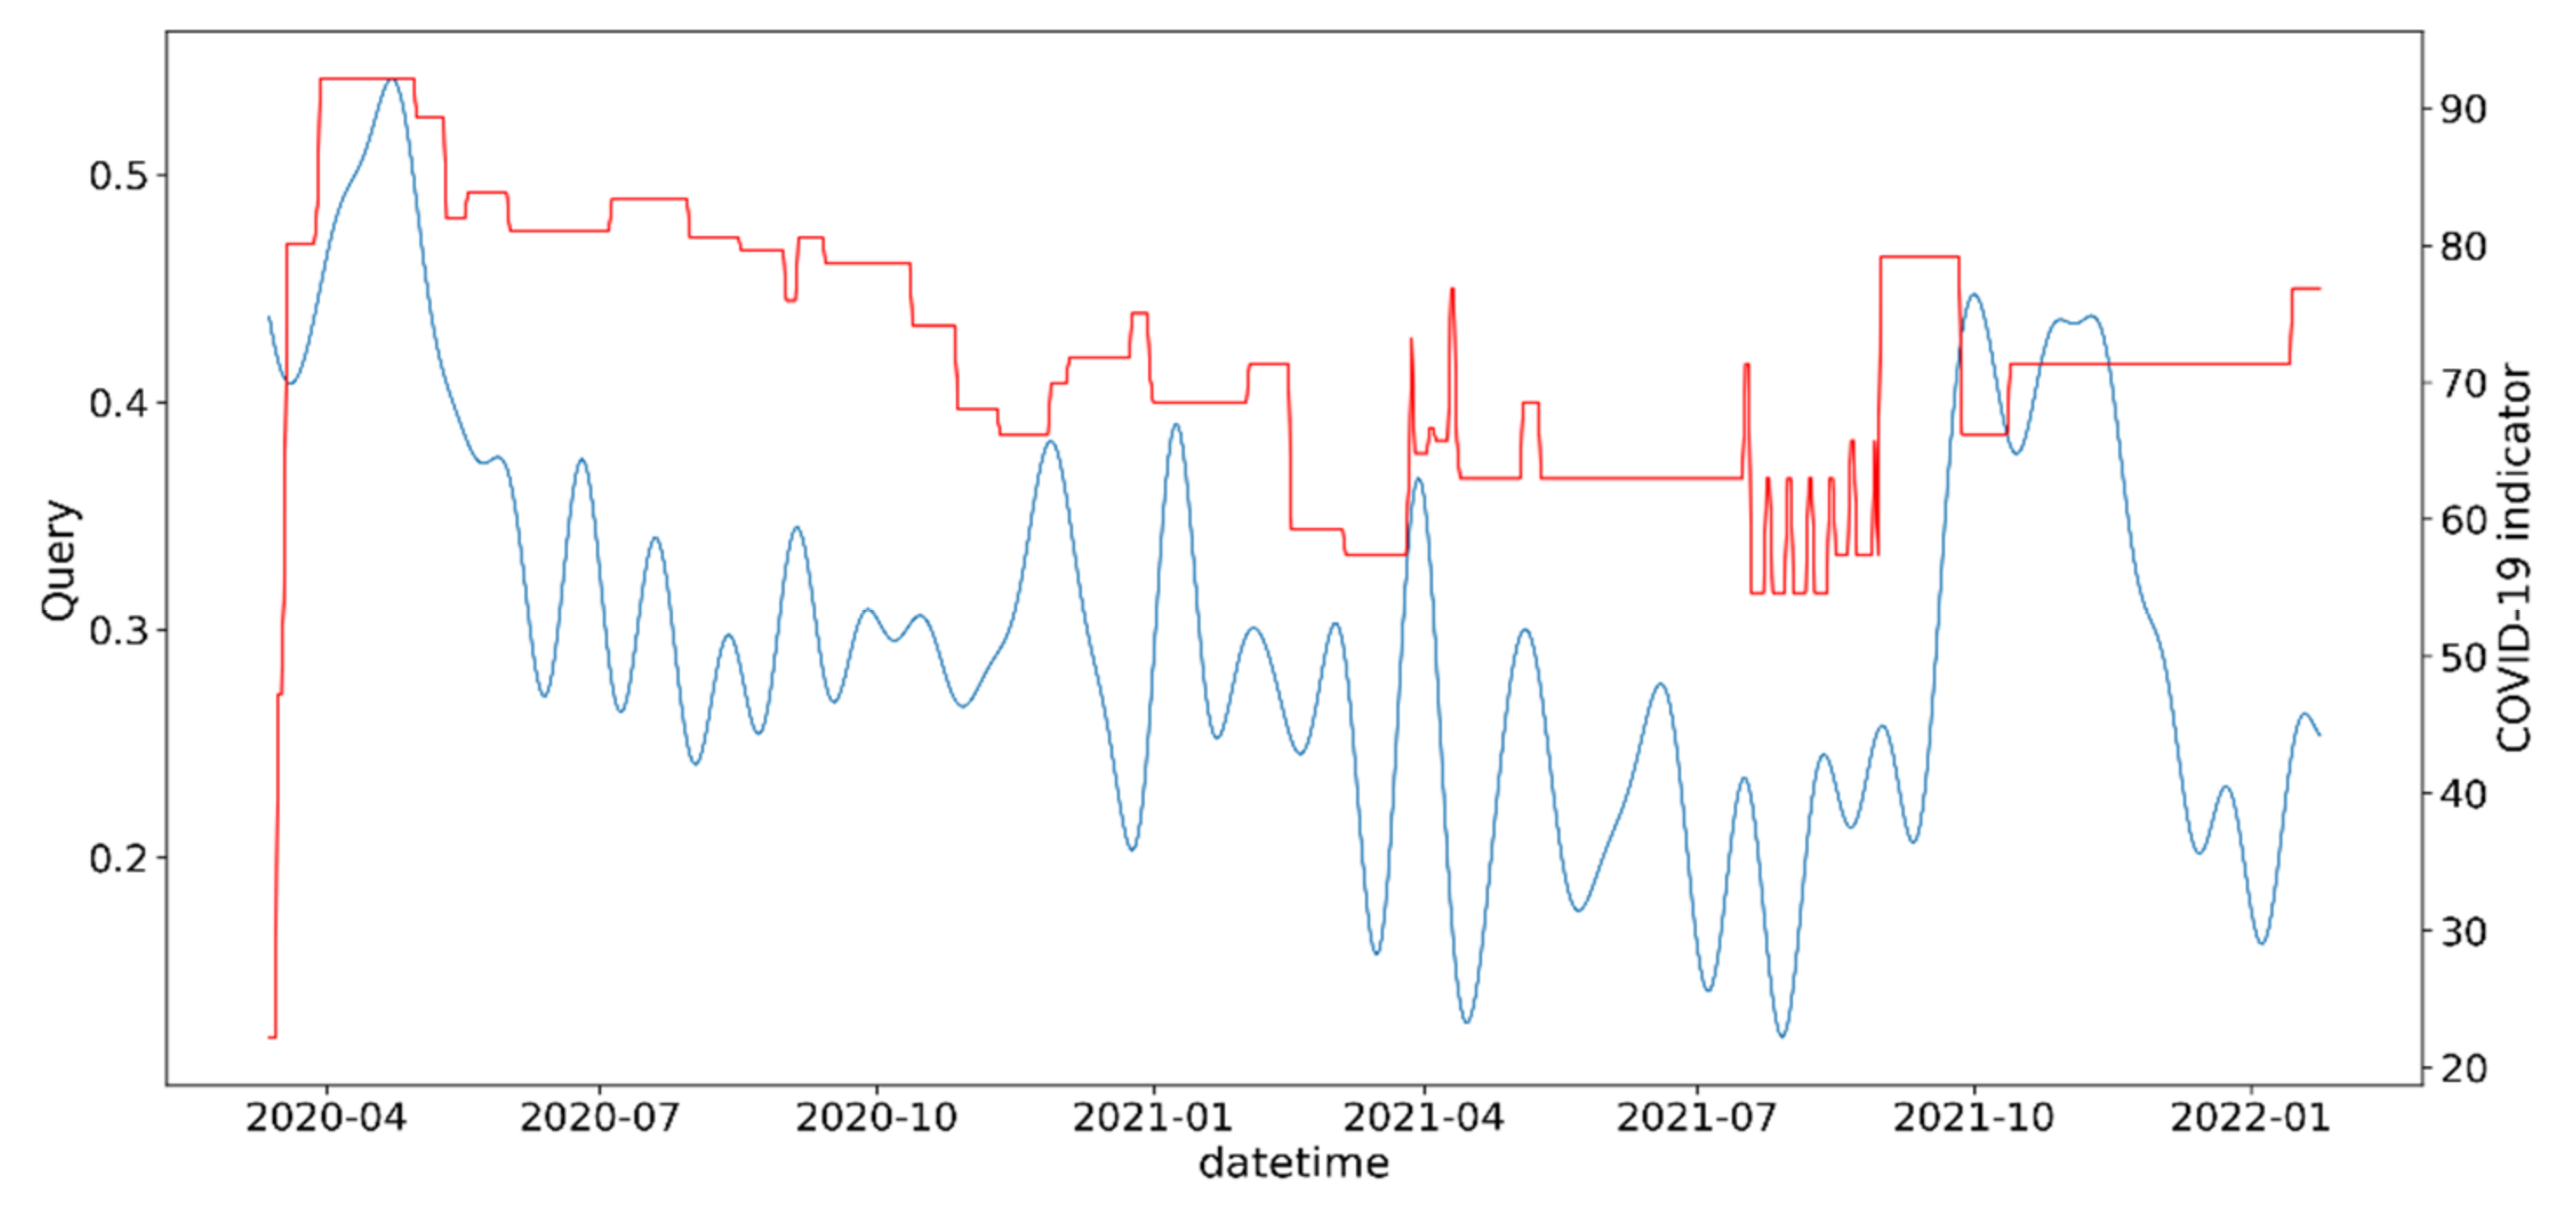
Figure 9 illustrates the relationship between quarantine restriction severity and the dynamics of publication activity on the query “crisis, credit, debt, microcredit”, which confirms the hypothesis that quarantine restrictions have a negative impact on living standards and financial stability.
Figure 9. The red line represents the Stringency index, and the blue line represents the dynamics of the publication activity on topic “crisis, credit, debt, microcredit”.
In Appendix A (Figure A1, Figure A2, Figure A3, Figure A4, Figure A5, Figure A6, Figure A7, Figure A8, Figure A9, Figure A10, Figure A11, Figure A12, Figure A13 and Figure A14), you can see additional graphic examples of topics and queries most strongly correlated with epidemiological indicators.
In order to analyze the dynamic of media interest in the pandemic as a whole, the largest topic directly related to COVID-19 was selected; the dynamics of changes was analyzed for the period from early 2020 to February 23, 2022. The top 25 words of the topic with relative importance weights include: Case (1.00); Infection (0.70); Coronavirus (0.65); Coronavirus_Infection (0.58); Coronavirus (0.42); Register (0.29); Kazakhstan (0.28); Patient (0.26); Infection (0.24); Pneumonia (0.22); Qui (0.22); Day (0.22); Illness (0.21); Identify (0.19); Illness (0.17); Find (0.16); Condition (0.15); Lethal (0.14); PCP (0.13); Register_Case (0.12); Almaty (0.12); March (0.12); Confirm (0.12); Illness (0.12); Get well (0.12). The weight of the most significant word is equal to 1, and the other weights are normalized relative to the maximum. Therefore, the weight of 0.5 can be interpreted as “two times less important than the maximum weight”.
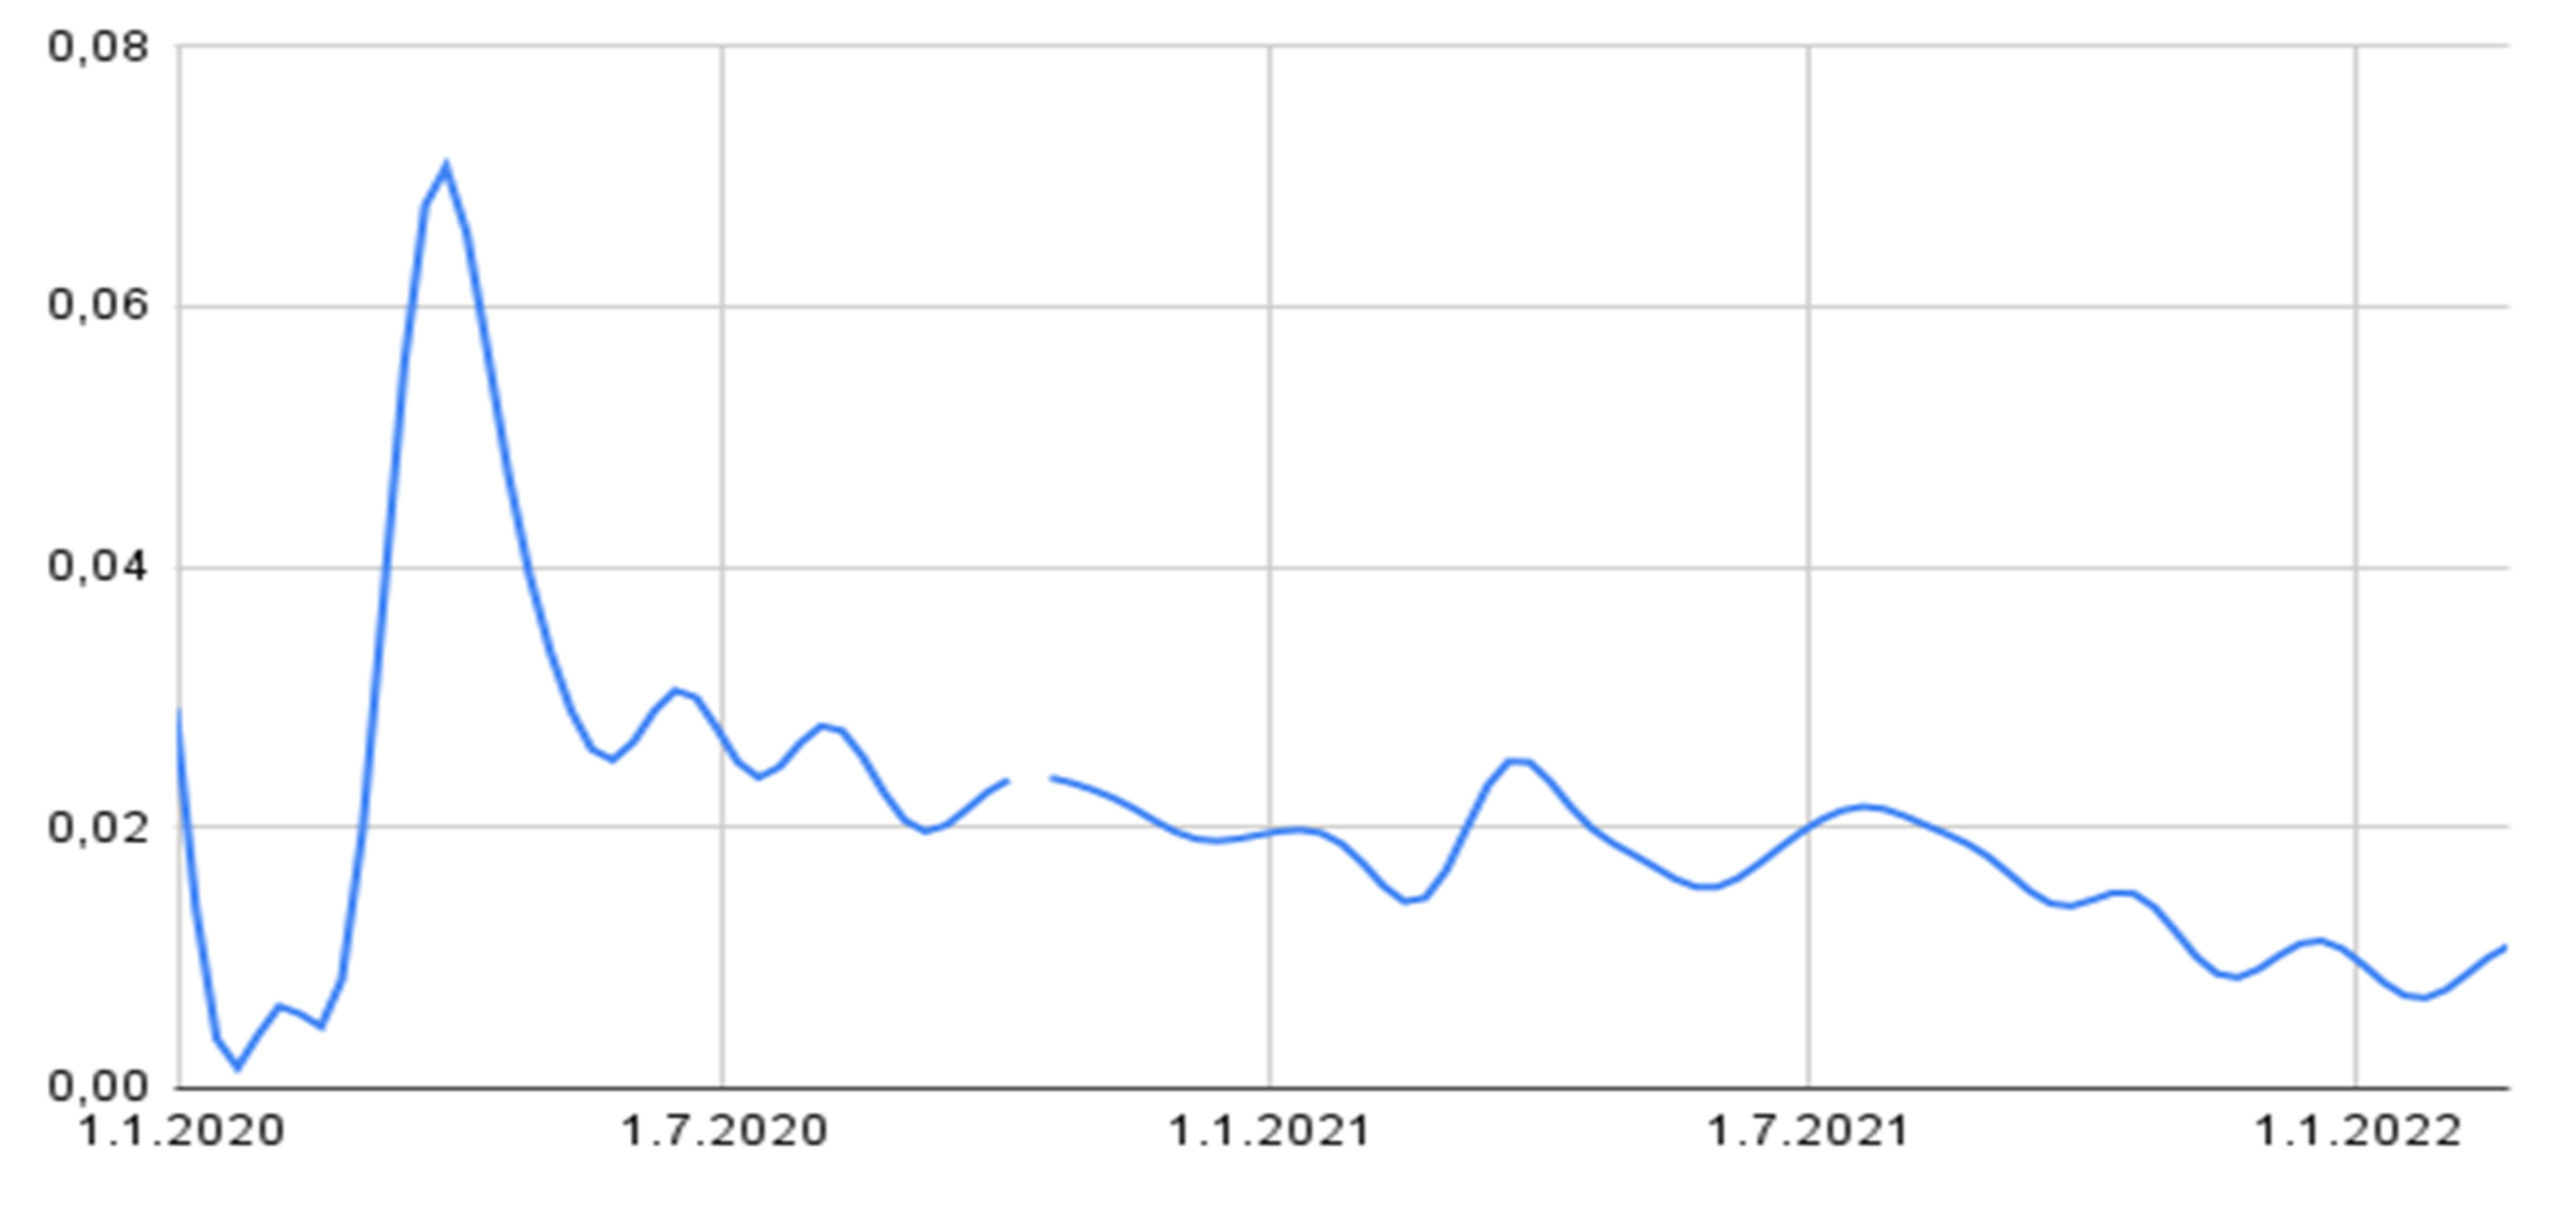
COVID-19 interest is steadily decreasing as shown in Figure 10. Comparing the periods of January 2021 and of January 2022, the interest in this topic fell by about half. The value on the ordinate axis represents the ratio of the sum of the weights of the documents on this topic to the sum of all weights for all topics appearing during this period.
Figure 10. The graph of normalized publication activity for the topic “Case, Infection, Coronavirus, Coronavirus_Infection, Coronavirus, Register”.
Therefore, the value might be understood as the topic’s proportion of the information flow. We can observe that in the beginning of 2020, when interest peaked, the only item related to COVID-19 made up roughly 8% of all news in the media; by the beginning of 2022, this percentage fell to 1%. One percent is a significant number, yet it is also relatively comparable to other topics. For instance, artificial intelligence, which is estimated similarly, represents between 1 and 5% of the market. If we take into account all of the COVID-19-related topics, the pandemic’s overall media share peaked between 10 and 15 percent.
The analysis of the correlation matrix by topic (see Figure 3) shows that, in addition to the obvious topics directly related to the epidemiological situation, topics related to school education (distance learning and quarantine restrictions) as well as the provision of medicines and their prices have the highest correlation with epidemiological indicators. The analysis of the correlation matrix by search queries (see Figure 4) revealed that the topics most related to the epidemiological situation are, on average, crisis, credit, remote work, and brain drain. At the moment, there is a correlation between vaccination and health issues, but it has decreased significantly. The relationships between fakes, poverty, people at risk of poverty, hunger, theft, and crime are weak or nonexistent. The comparison of the results presented in this research and the results presented in [32] allows us to make the following conclusions:
  • Overall, the correlation in early 2022 between publication activity and epidemiological indicators fell compared to the first half of 2021. The maximum correlation in 2021 was as high as 0.8, whereas in 2022, it did not exceed 0.6–0.65.
  • Compared to the previous study, the correlation with the search queries related to the coverage of the economic crisis, remote work, microcredit, etc., has increased. Particularly evident is the increase in the correlation with the Stringency index, especially in view of the recent abrupt changes in (removing of) quarantine restrictions. At the same time, the correlation with issues related to health care, vaccination, etc., has decreased. This may suggest that the public has become more concerned about pragmatic issues related to quarantine restrictions than health issues themselves.
  • In general, the correlation with relative indicators, such as reproduction rate and tests per case, has increased. These indicators more objectively reflect the epidemiological situation, compared to absolute indicators (for example, the number of new cases without the number of tests is essentially a useless indicator). This is a positive indicator that the media has become more reflective to the epidemiological situation in the country compared to the initial period of the pandemic.

5. Conclusions

The research presents a methodology for evaluating the relationships between the objective pandemic indicators presented by WHO, and media publishing activity. The proposed method permits to make such comparison promptly. The method is based on the thematic model of the media corpus. The change in the volume of COVID-19 topics over time is compared with the change in the pandemic indicators. A number of manually generated queries are additionally used to increase the objectivity of the analysis. The topics obtained through the use of queries are also compared with the specified pandemic indicators.
Overall, analysis of the corpus of texts showed a significant decrease in media interest in the topic of COVID-19 in 2022. Although publication activity on the topic of the pandemic correlated with the main epidemiological indicators, the maximum correlation decreased by 20 percent compared to the data from one year ago. At the same time, the correlation with relative indicators (positive rate, reproduction rate, tests per case) increased. The correlation of the pandemic topic with economic issues, employment, and standard of living increased. In our opinion, this fact reflects an increase in media objectivity compared to the initial stage of the pandemic. In future studies, the authors plan to assess the change in the tone of media publications on COVID-19 during different periods of the pandemic.

Author Contributions

Conceptualization, R.I.M., K.Y. and E.Z.; methodology, R.I.M. and K.Y.; validation, Y.K., E.Z., V.L., M.Y. and A.S.; formal analysis, R.I.M. and N.Y.; investigation, K.Y., M.Y., V.L., M.A., E.M., V.G. and Y.K.; resources, E.Z., R.I.M., M.A. and E.M.; data curation, K.Y., Y.P., A.S., V.L. and A.S.; writing—original draft preparation, R.I.M., Y.K., E.Z. and Y.P.; writing—review and editing, Y.P., Y.K., M.Y. and E.Z.; visualization, R.I.M. and K.Y.; supervision, R.I.M.; project administration, Y.K.; funding acquisition, E.Z., M.A. and R.I.M. All authors have read and agreed to the published version of the manuscript.

Funding

This research was funded by the Science Committee of the Ministry of Education and Science of the Republic of Kazakhstan, Grant No. AP09259587, “Developing of methods and algorithms of intelligent GIS for multi-criteria analysis of healthcare data”, and by the Ministry of Education, Science, Research and Sport of the Slovak Republic, Grant “Creation of methodological and learning materials for Biomedical Informatics—a new engineering program at the UNIZA” (reg. no. KEGA 009ŽU-4/2020). Additionally, this work continues investigations of the project no. APVV PP-COVID-20–0013, “Development of methods of healthcare system risk and reliability evaluation under coronavirus outbreak” (2020–2021).

Institutional Review Board Statement

Not applicable.

Data Availability Statement

Not applicable.

Conflicts of Interest

The authors declare no conflict of interest.

Appendix A

Examples of topics and queries with the highest correlation with epidemiological indicators.
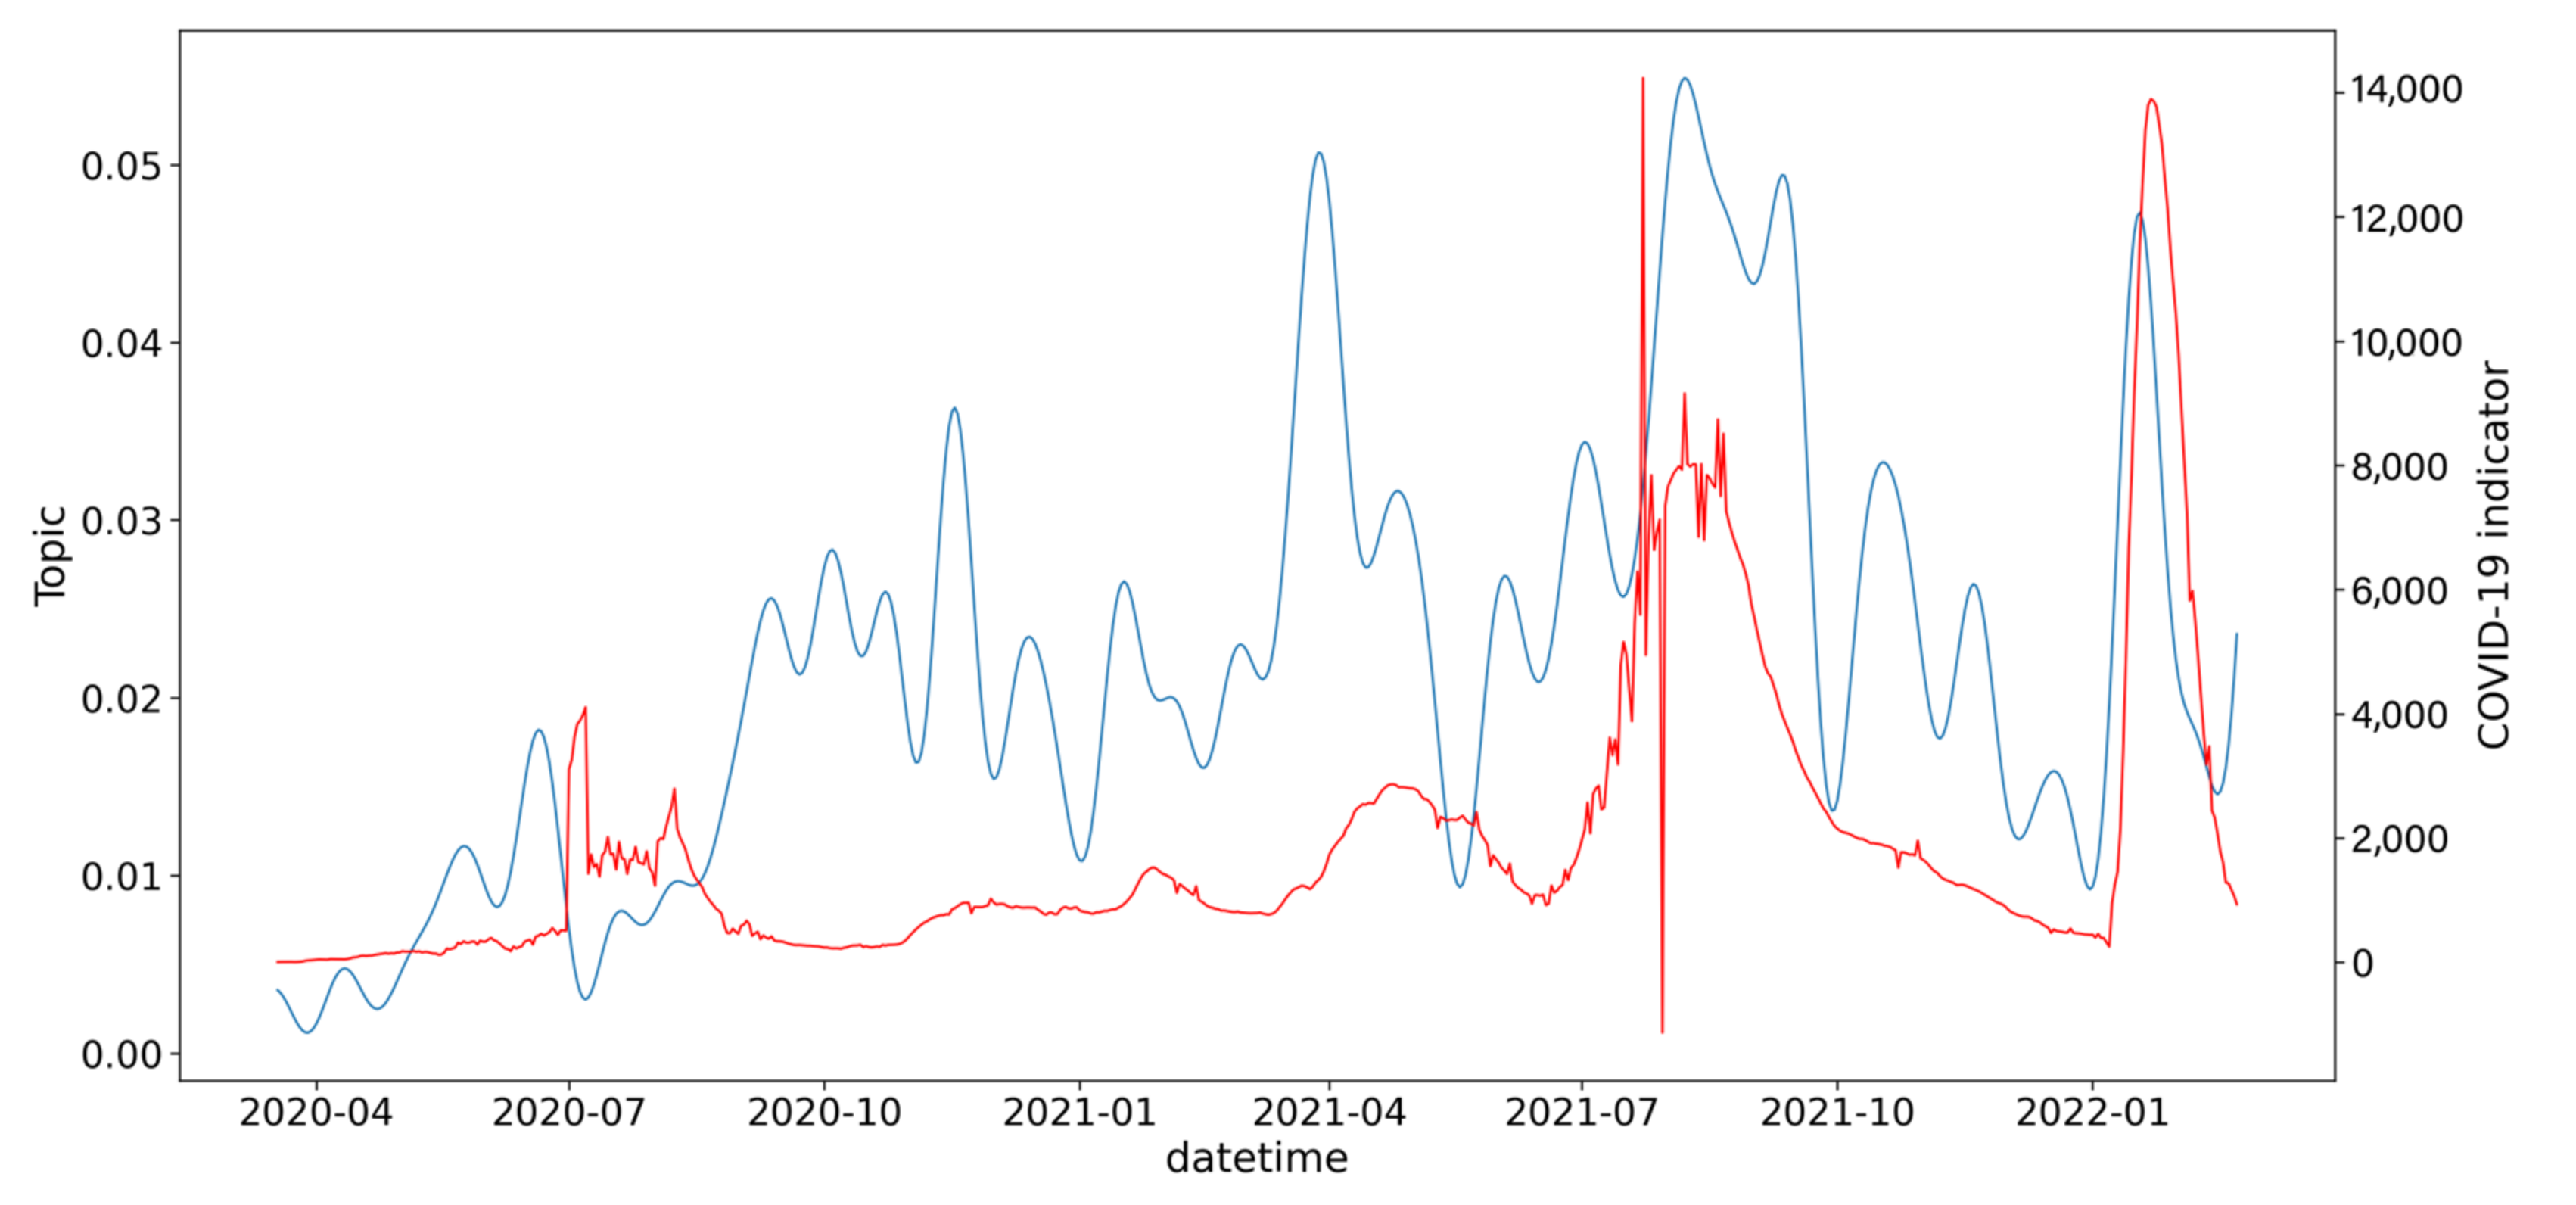
Hereinafter: The red line shows the dynamics of changes in the epidemiological indicator. The blue line shows the dynamics of changes in publication activity on the topic or query.
Since the summer of 2021, Kazakhstan stopped providing official statistics on tests. For this reason, the graphs for new tests, tests per case, and positive rate are only shown for the period for which there are data.
Figure A1. COVID-19 indicator—Tests per case. Topic—Case, Register, Coronavirus, Infection, Coronavirus_infection, Kazakhstan, Infection.
Figure A2. COVID-19—Stringency index. Topic—Protective, Suit, Institution, Medical, Address, Mask, District.
Figure A3. COVID-19 indicator—Reproduction rate. Topic—Test, Week, Talk, Due, Own, Thousand, Queue.
Figure A4. COVID-19 indicator—New tests. Topic—Kazinform, Interesting, Mia, Mia_kazinform, Correspondent_mia, Correspondent_mia_kazinform, Transmit.
Figure A5. COVID-19 indicator—Positive rate. Topic—Medication, Medication, Drug, Medication, Medication_medication, Medical, Pharmacy.
Figure A6. COVID-19 score—New deaths. Topic—Morbidity, School, Child, Growth, Epidemiological, Among, Week.
Figure A7. COVID-19 score—New cases. Topic—Incidence, School, Child, Growth, Epidemiological, Among, Week.
Figure A8. COVID-19 indicator—Tests per case. Query—vaccination COVID-19 vaccination.
Figure A9. COVID-19—Stringency index. Query—crisis lending debt microcredit.
Figure A10. COVID-19—Reproduction rate. Query—vaccination COVID-19 vaccination.
Figure A11. COVID-19 indicator—New tests. Query—vaccination COVID-19 vaccine.
Figure A12. COVID-19—Positive rate. Query—vaccination COVID-19 vaccination.
Figure A13. COVID-19 indicator—New deaths. Query—poverty hunger homeless.
Figure A14. COVID-19 indicator—New cases. Query—Fake false information misinformation.

Appendix B

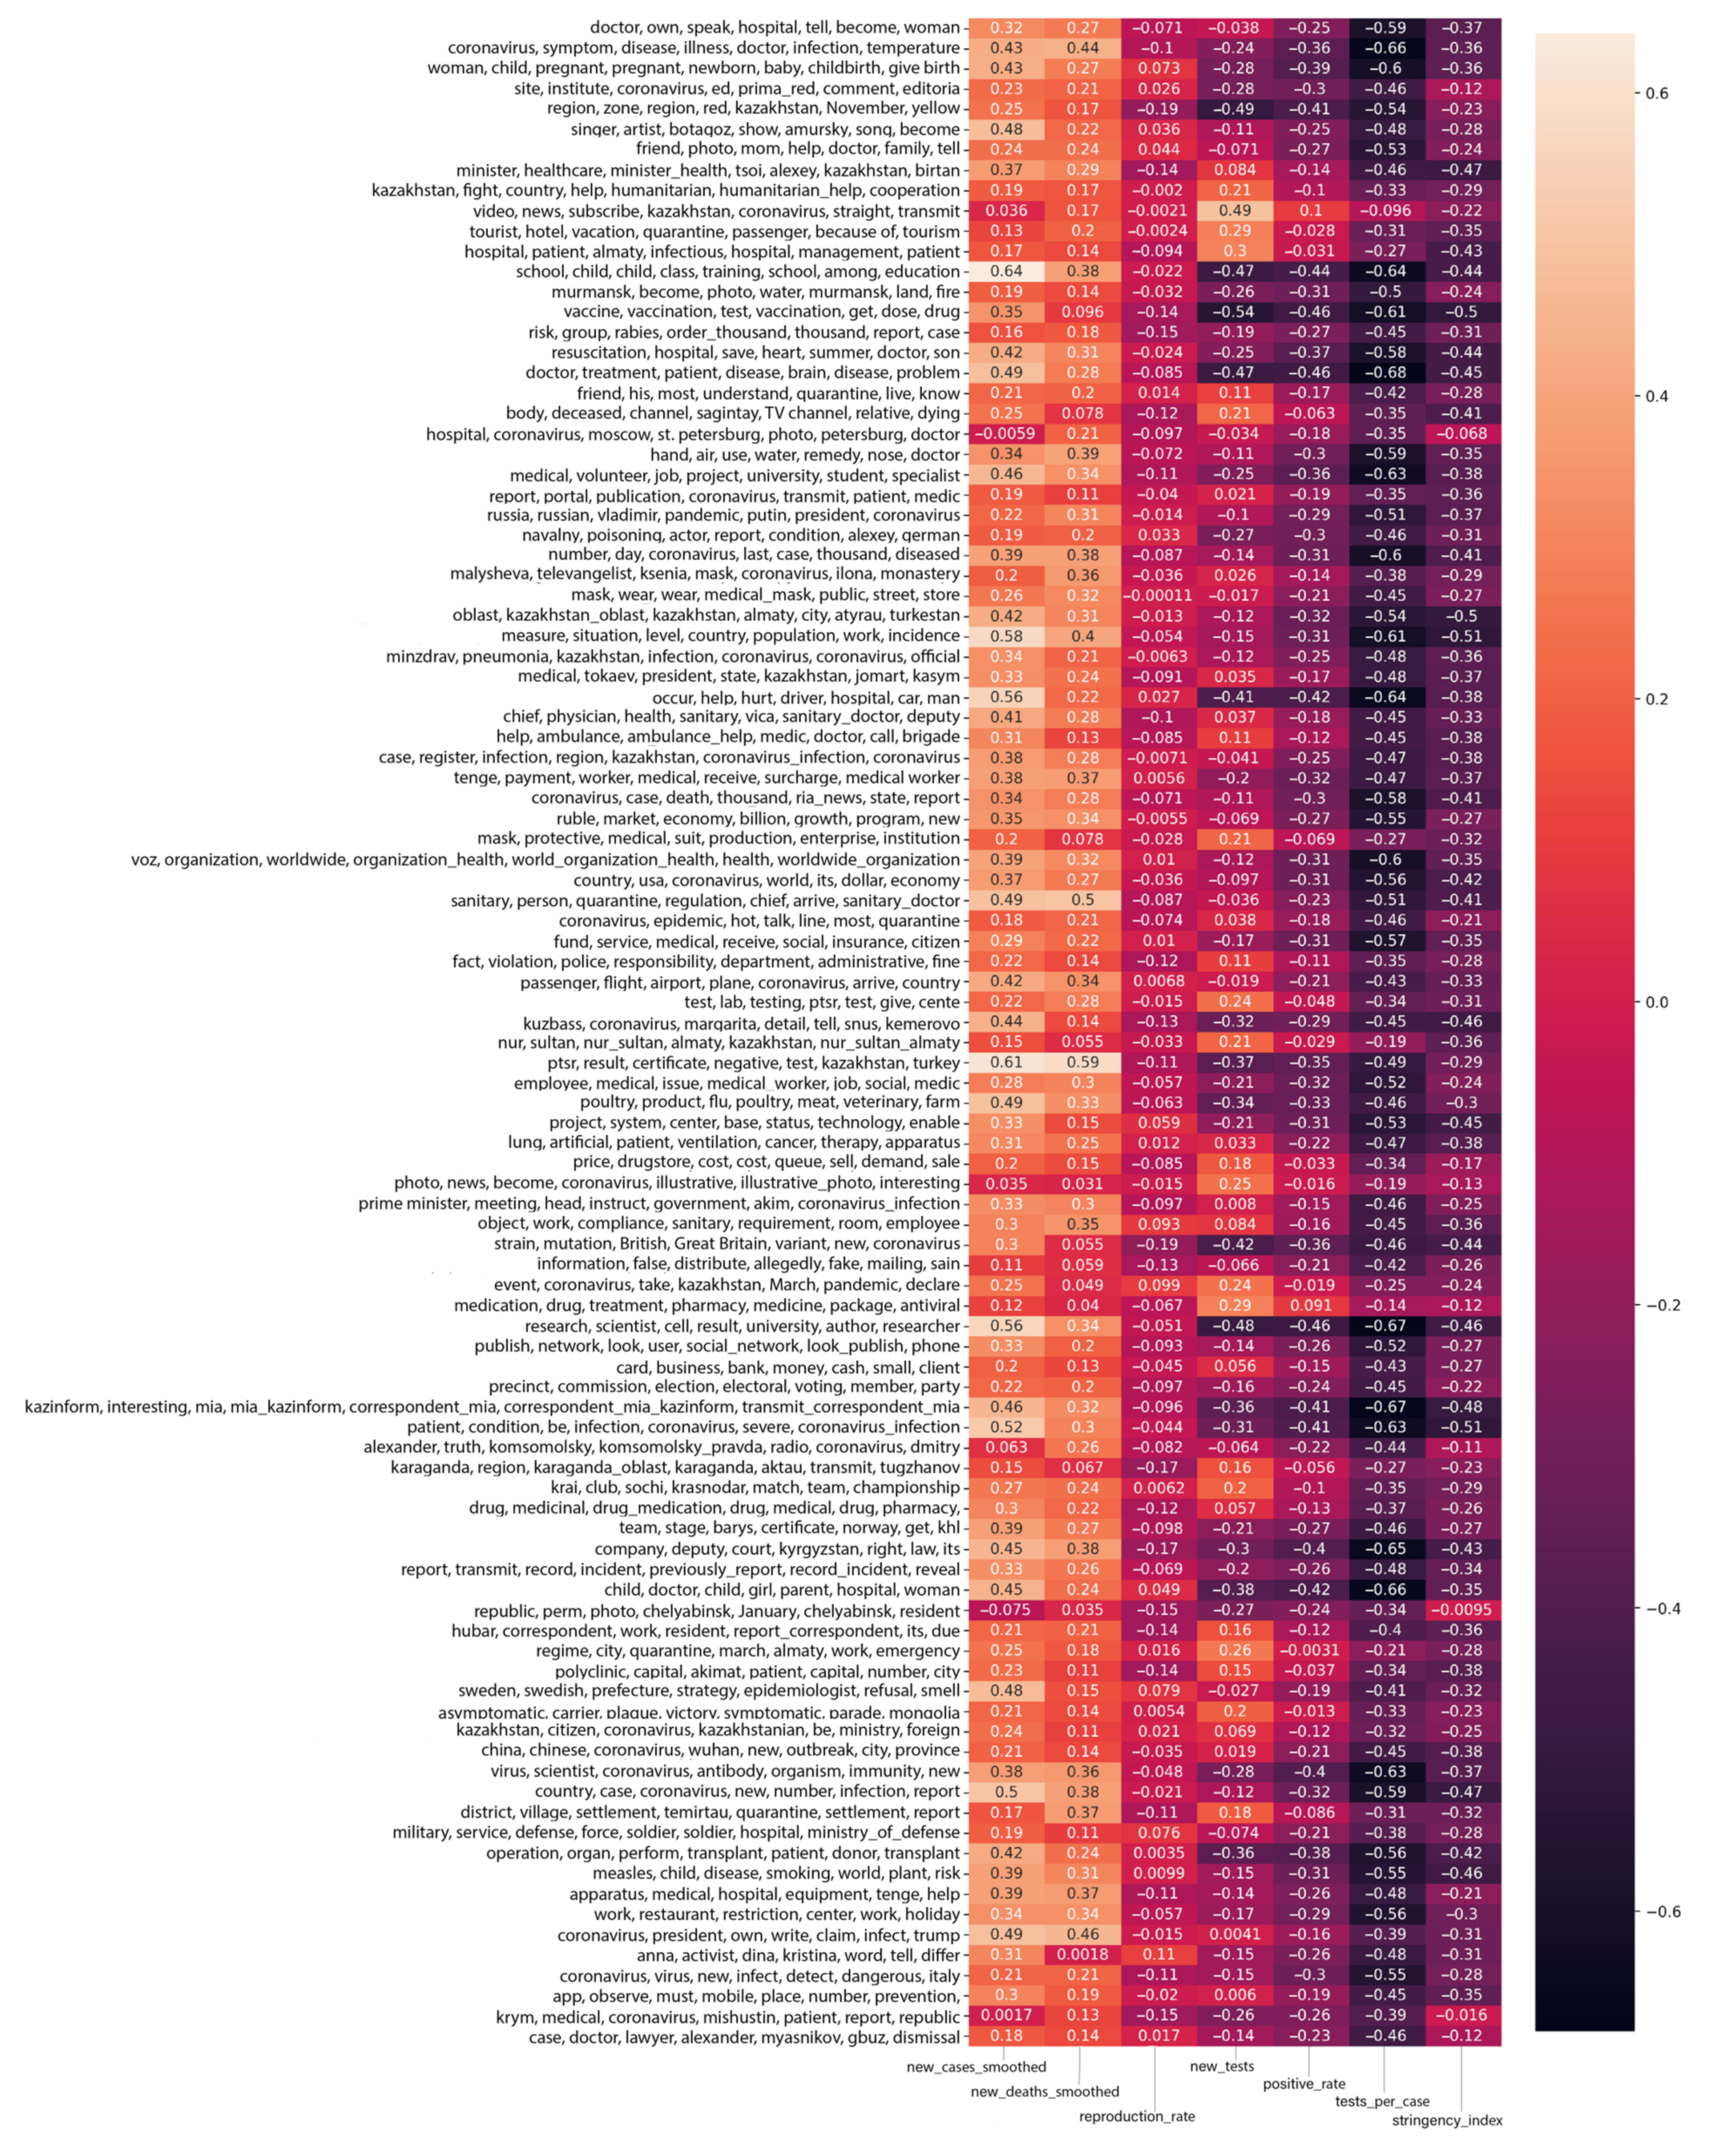
A correlation matrix reflecting information about the pandemic and objective indicators.
Figure A15. Correlation matrix between thematic clusters expressed as sets of the most relevant words (vertical) and pandemic indicators (bottom horizontal: variables new_cases_smoothed, new_deaths_smoothed, etc.).

References

  1. Atun, R. Transitioning Health Systems for multimorbidity. Lancet 2015, 386, 721–722. [Google Scholar] [CrossRef] [Scilit]
  2. Orlov, E.M.; Sokolova, O.N. The category of efficiency in the health care system. Fundam. Res. 2010, 4, 70–75. [Google Scholar]
  3. Ball-Rokeach, S.J.; DeFleur, M.L. A dependency model of mass-media effects. Commun. Res. 1976, 3, 3–21. [Google Scholar] [CrossRef] [Scilit]
  4. Zhanabekova, A.; Darzhanova, A.; Tleulesova, A.; Slamgazhy, A.; Toleu, A.; Kislova, A.; Urpekova, A.; Klimchenko, A.; Zhusipbek, G.; Urazova, D.; et al. Kazakhstan and COVID-19: Media, Culture, Politics. Representative Office Friedrich Ebert Foundation in Kazakhstan; DELUXE Printery: Almaty, Kazakhstan, 2021; ISBN 978-601-06-7442-4. [Google Scholar]
  5. Giri, S.P.; Maurya, A.K. A neglected reality of mass media during COVID-19: Effect of pandemic news on individual’s positive and negative emotion and psychological resilience. Personal. Individ. Differ. 2021, 180, 110962. [Google Scholar] [CrossRef] [Scilit] [PubMed]
  6. Aslam, F.; Awan, T.M.; Syed, J.H.; Kashif, A.; Parveen, M. Sentiments and emotions evoked by news headlines of coronavirus disease (COVID-19) outbreak. Humanit. Soc. Sci. Commun. 2020, 7, 23. [Google Scholar] [CrossRef] [Scilit]
  7. Hamidein, Z.; Hatami, J.; Rezapour, T. How people emotionally respond to the news on COVID-19: An online survey. Basic Clin. Neurosci. J. 2020, 11, 171–178. [Google Scholar] [CrossRef] [Scilit]
  8. Kemp, S. Global Digital Insights. Available online: http://www.datareportal.com/ (accessed on 16 October 2020).
  9. Mukhamediev, R.I.; Symagulov, A.; Kuchin, Y.; Yakunin, K.; Yelis, M. From classical machine learning to Deep Neural Networks: A simplified scientometric review. Appl. Sci. 2021, 11, 5541. [Google Scholar] [CrossRef] [Scilit]
  10. Miotto, R.; Wang, F.; Wang, S.; Jiang, X.; Dudley, J.T. Deep Learning for Healthcare: Review, opportunities and challenges. Brief. Bioinform. 2017, 19, 1236–1246. [Google Scholar] [CrossRef] [Scilit]
  11. Tizhoosh, H.R.; Pantanowitz, L. Artificial intelligence and digital pathology: Challenges and opportunities. J. Pathol. Inform. 2018, 9, 38. [Google Scholar] [CrossRef] [Scilit]
  12. Mukhamediev, R.I.; Popova, Y.; Kuchin, Y.; Zaitseva, E.; Kalimoldayev, A.; Symagulov, A.; Levashenko, V.; Abdoldina, F.; Gopejenko, V.; Yakunin, K.; et al. Review of Artificial Intelligence and Machine Learning Technologies: Classification, Restrictions, Opportunities and Challenges. Mathematics 2022, 10, 2552. [Google Scholar] [CrossRef] [Scilit]
  13. The Socio-Economic Impact of AI in Healthcare. October 2020. Available online: https://www.medtecheurope.org/wp-content/uploads/2020/10/mte-ai_impact-in-healthcare_oct2020_report.pdf (accessed on 10 September 2021).
  14. Pulido, C.M.; Villarejo-Carballido, B.; Redondo-Sama, G.; Gómez, A. COVID-19 infodemic: More retweets for science-based information on coronavirus than for false information. Int. Sociol. 2020, 35, 377–392. [Google Scholar] [CrossRef] [Scilit]
  15. Gao, J.; Zheng, P.; Jia, Y.; Chen, H.; Mao, Y.; Chen, S.; Wang, Y.; Fu, H.; Dai, J. Mental health problems and social media exposure during COVID-19 outbreak. PLoS ONE 2020, 15, e0231924. [Google Scholar]
  16. Li, S.; Wang, Y.; Xue, J.; Zhao, N.; Zhu, T. The impact of COVID-19 epidemic declaration on psychological consequences: A study on active weibo users. Int. J. Environ. Res. Public Heal. 2020, 17, 2032. [Google Scholar] [CrossRef] [Scilit]
  17. Tsao, S.-F.; Chen, H.; Tisseverasinghe, T.; Yang, Y.; Li, L.; Butt, Z.A. What social media told us in the time of COVID-19: A scoping review. Lancet Digit. Health 2021, 3, e175–e194. [Google Scholar] [CrossRef] [Scilit]
  18. Bou-Karroum, L.; El-Jardali, F.; Hemadi, N.; Faraj, Y.; Ojha, U.; Shahrour, M.; Darzi, A.; Ali, M.; Doumit, C.; Langlois, E.V.; et al. AbouHaidar, G.H.; Akl, E.A. Using media to impact health policy-making: An integrative systematic review. Implement. Sci. 2017, 12, 1–14. [Google Scholar] [CrossRef] [Scilit]
  19. Rosella, L.C.; Wilson, K.; Crowcroft, N.S.; Chu, A.; Upshur, R.; Willison, D.; Deeks, S.L.; Schwartz, B.; Tustin, J.; Sider, D.; et al. Pandemic H1N1 in Canada and the use of evidence in developing public health policies–A policy analysis. Soc. Sci. Med. 2013, 83, 1–9. [Google Scholar] [CrossRef] [Scilit]
  20. Bennett, W.L.; Lawrence, R.G.; Livingston, S. When the Press Fails; University of Chicago Press: Chicago, IL, USA, 2007. [Google Scholar]
  21. Al-Jefri, M.; Evans, R.; Lee, J.; Ghezzi, P. Automatic identification of information quality metrics in health news stories. Front. Public Health 2020, 8, 515347. [Google Scholar] [CrossRef] [Scilit]
  22. Mashechkin, I.; Petrovsky, M.; Tsarev, D. Methods for Calculating the Relevance of Text Fragments Based on Thematic Models in the Automatic Annotation Problem. Comput. Methods Program. 2013, 14, 91–102. [Google Scholar]
  23. Parhomenko, P.A.; Grigorev, A.A.; Astrakhantsev, N.A. A survey and an experimental comparison of methods for text clustering: Application to scientific articles. Proc. Inst. Syst. Program. RAS 2017, 29, 161–200. [Google Scholar] [CrossRef] [Scilit]
  24. Dieng, A.B.; Ruiz, F.J.; Blei, D.M. Topic modeling in embedding spaces. Trans. Assoc. Comput. Linguist. 2020, 8, 439–453. [Google Scholar] [CrossRef] [Scilit]
  25. Blei, D.; Ng, A.; Jordan, M. Latent Dirichlet Allocation. J. Mach. Learn. Res. 2003, 3, 993–1022. [Google Scholar]
  26. Vorontsov, K.; Frei, O.; Apishev, M.; Romov, P.; Dudarenko, M. BigARTM: Open Source Library for Regularized Multimodal Topic Modeling of Large Collections. In Proceedings of the International Conference on Analysis of Images, Social Networks and Texts, Yekaterinburg, Russia, 9–11 April 2015; pp. 370–381. [Google Scholar]
  27. Mukhamediev, R.I.; Yakunin, K.; Mussabayev, R.; Buldybayev, T.; Kuchin, Y.; Murzakhmetov, S.; Yelis, M. Classification of negative information on socially significant topics in mass media. Symmetry 2020, 12, 1945. [Google Scholar] [CrossRef] [Scilit]
  28. Yakunin, K.; Kalimoldayev, M.; Mukhamediev, R.I.; Mussabayev, R.; Barakhnin, V.; Kuchin, Y.; Murzakhmetov, S.; Buldybayev, T.; Ospanova, U.; Yelis, M.; et al. KazNewsDataset: Single Country Overall Digital Mass Media Publication Corpus. Data 2021, 6, 31. [Google Scholar] [CrossRef] [Scilit]
  29. Jelodar, H.; Wang, Y.; Yuan, C.; Feng, X.; Jiang, X.; Li, Y.; Zhao, L. Latent dirichlet allocation (LDA) and topic modeling: Models, applications, a survey. Multimed. Tools Appl. 2018, 78, 15169–15211. [Google Scholar] [CrossRef] [Scilit]
  30. Yakunin, K.; Mukhamediev, R.I.; Zaitseva, E.; Levashenko, V.; Yelis, M.; Symagulov, A.; Kuchin, Y.; Muhamedijeva, E.; Aubakirov, M.; Gopejenko, V. Mass media as a mirror of the COVID-19 pandemic. Computation 2021, 9, 140. [Google Scholar] [CrossRef] [Scilit]
  31. Dong, E.; Du, H.; Gardner, L. An interactive web-based dashboard to track COVID-19 in Real time. Lancet Infect. Dis. 2020, 20, 533–534. [Google Scholar] [CrossRef] [Scilit]
  32. Yakunin, K. Media Monitoring System. Available online: https://github.com/KindYAK/NLPMonitor (accessed on 8 August 2022).
  33. Yakunin, K. Airflow DAGs for NLPMonitor. Available online: https://github.com/kindyak/nlpmonitor-dags (accessed on 8 August 2022).
  34. Marutho, D.; Hendra Handaka, S.; Wijaya, E. Muljono The determination of cluster number at K-mean using elbow method and purity evaluation on Headline news. In Proceedings of the 2018 International Seminar on Application for Technology of Information and Communication, Semarang, Indonesia, 21–22 September 2018. [Google Scholar]
Publisher’s Note: MDPI stays neutral with regard to jurisdictional claims in published maps and institutional affiliations.

Article Metrics

Citations

Article Access Statistics

Multiple requests from the same IP address are counted as one view.