


Abstract
This study investigates the effect of ambient conditions, particularly the humidity of the intake air, on the operation of an ALCO V16 251F (USA) diesel engine. It evaluates the temperature at which air is delivered to the combustion chamber, after the cooling process is accomplished within the aftercooler heat exchanger. A theoretical analysis was conducted using AVL CRUISE software, a specialized computational tool developed by AVL that facilitates the simulation and virtual integration of engine subsystems. An experimental investigation on the operation of air coolers is difficult to perform on a test bench, due to the overall dimensions of heat exchangers used in large marine diesel engines. The simulation results show that the AVL CRUISE virtual cooler reproduces the temperature range of the ALCO aftercooler with small deviations of approximately 7% at the fluid outlets. In these conditions, simulation outcomes demonstrate that the engine’s original charge-air cooler can maintain a stable and controlled air temperature at the intake manifold inlet. For an absolute air humidity of 5%, only minor variations (less than 1%) were registered in the outlet air temperature from the aftercooler, accompanied by 0.7% decrease in cooling effectiveness and 0.6% decrease in heat-exchanger efficiency. These findings confirm that the charge-air cooler operates reliably under humid marine conditions and that the virtual model is suitable for further optimization studies.
1. Introduction
1.1. Related Works on the Operation of Charge-Air Coolers
The heat exchanger used for cooling the charge-air represents an auxiliary component with a decisive role in ensuring the reliable operation of marine diesel engines. This device separates and routes working fluid streams to achieve optimal thermal exchange between the charging air and the cooling fluid.
High-pressure charging (2–3.5 bar), typical in medium-speed marine diesel engines, introduces the challenge of dissipating heat accumulated during the compression of humid intake air. This necessitates enhancing the performance of the charge-air cooler [1]. Traditionally, improvements to air cooler performance have been approached primarily through experimental methods.
Dong et al. [2] investigated the heat dissipation performance of a wavy-fin radiator using wind tunnel experiments. Tests were performed under various operating conditions for 16 distinct geometric configurations of wavy fins. Using multiple regression analysis, the authors developed empirical correlation equations for both heat-transfer performance and pressure drop characteristics. Their results enabled the formulation of a relationship to predict thermal-transfer efficiency as a function of mass flow rate and pressure loss.
Jang et al. [3] conducted an experimental investigation into the relationship between the Reynolds number, heat-transfer performance, and air-side pressure drop in a primary surface heat exchanger (PSHE) featuring corrugated channels. By measuring heat-transfer rates and pressure drops across a range of Reynolds numbers on both the hot and cold sides of the exchanger, they determined heat-transfer coefficients using a modified Wilson plot method. The results demonstrate that the air-side mass flow rate is directly proportional to the heat-transfer rate, whereas the pressure drop decreases as the Reynolds number increases. These findings provide valuable insight into the thermo-hydraulic behavior of corrugated-surface PSHEs under varying flow conditions.
Wen [4] and Habib [5] experimentally investigated the influence of non-uniform airflow distribution on the heat dissipation performance of a plate-and-fin cooler.
Wen used Particle Image Velocimetry (PIV) to characterize the inlet flow field. These measurements revealed severe maldistribution in conventional configurations, including pronounced stagnation zones and uneven velocity profiles. By introducing a punched baffle with an optimized hole arrangement and variable porosity, Wen achieved a dramatic improvement in flow uniformity.
Habib’s study used three-dimensional numerical simulations to examine flow maldistribution in the headers of air-cooled heat exchangers. The analysis focused on how nozzle count, geometry, diameter, and inlet velocity affect mass flow and static pressure distribution among the tubes. The results show that smaller nozzle diameters worsen maldistribution, whereas increasing the number of nozzles or incorporating a secondary header significantly improves uniformity.
Together, these findings provide a strong foundation for optimizing plate-fin and air-cooled heat exchanger systems.
Kourosh et al. [6] conducted a comprehensive experimental investigation into how key geometric parameters influence the thermo-hydraulic performance of louvered-fin heat exchangers. Their analysis considered variations in louver angle, pitch, and count, as well as non-louvered inlet and outlet fin lengths and flow redirection features. The results indicate that increasing the louver count significantly enhances heat transfer, whereas the impact of louver pitch is comparatively minor.
Computational Fluid Dynamics simulations enable detailed analysis of flow behavior in intermediate heat exchangers, providing a reliable basis for structural optimization of charge-air coolers.
Djemel et al. [7] performed a numerical investigation to evaluate how the Reynolds number and heat transfer surface geometry influence airflow behavior within a heat exchanger. Their work led to an optimized virtual intercooler model achieving a thermal effectiveness of 97.66%, surpassing the baseline design. Using a biomimetic design inspired by the human bronchiolar structure of the respiratory system, the authors introduced Y-shaped bionic obstacles into the cooling channels and simulated turbulent flow using a standard k-ε model in ANSYS Fluent 2006. Validation confirmed that this bionic configuration significantly enhances thermal performance compared with the classical designs.
Huang et al. [8] employed a multi-scale thermal analysis to investigate an automotive charge-air cooler. Using mesh refinement and data interpolation, they analyzed the internal flow and heat-transfer mechanisms through CFD/CHT simulations. The model showed strong agreement with wind-tunnel measurements, demonstrating that multi-scale coupled simulations reliably capture the thermo-fluid behavior of compact heat exchangers.
Ali et al. [9] performed 3D turbulent-flow simulations to evaluate how structural parameters influence the thermo-hydraulic behavior of louvered fin-and-tube heat exchangers. Their sensitivity analysis examined the effects of Reynolds number, fin pitch, and tube spacing on the normalized Colburn and friction factors. They developed simplified correlations that correctly converge to unity as the louver angle approaches zero; this is consistent with flat-fin behavior, a feature absent in earlier models.
Huminic et al. [10] conducted a numerical study on how duct geometry and hybrid nanofluid concentration influence heat transfer and flow behavior. By testing nanofluids in flat, elliptical, and circular ducts of equal hydraulic diameter, they found that duct geometry has a significantly stronger impact on thermal and flow performance than nanoparticle concentration.
For tube-and-fin charge-air coolers, porous-media CFD models are preferred for their accuracy and lower computational cost. Xin et al. [11] applied this approach to an aero-engine intercooler. Their experimental validation, using PIV measurements and pressure data, confirmed that the porous-media model accurately captures flow distribution and topology within the tubular units and surrounding ducts.
Liu et al. [12] used a similar porous-media approach for a turbocharged diesel engine intercooler. Their results show that a central air-intake configuration with a baffle offered the best performance, improving engine behavior by reducing fuel consumption and shortening transient response time.
Masri et al. [13] used a porous-media model to obtain temperature distributions within a plate-and-fin cooler. In a related study, they developed a 3D CFD model to predict the transient temperature field in a full-scale SOFC stack. Their results confirm the model’s ability to capture critical thermal gradients near the inlet region during heating up.
Recent numerical investigations on marine charge-air coolers increasingly combine CFD simulations with experimental validation on operating diesel engines.
Türközü et al. [14] analyzed a fin-and-tube cooler installed on a 457 CP marine engine, showing that inlet-header optimization reduced flow recirculation from 36% to 13% and improved heat-transfer performance by approximately 13%.
Kuznetsov et al. [15] examined long-range heat-transfer surfaces using elliptical and flat-oval tubes with profiled fins; their RANS/RSM model was validated with a deviation below 8.3%, and the optimized geometries achieved up to 40% improvement in thermohydraulic performance. These studies highlight the growing interest in experimentally validated numerical approaches for marine charge-air coolers.
However, most existing research focuses on small-scale automotive or aviation coolers, while investigations dedicated to high-power marine diesel engines remain limited. In the case of the 3.900 HP engine considered in this work, only nominal operating parameters are available, and no experimental data exist for its charge-air cooler. Consequently, a simplified virtual model was developed to enable a first-order assessment of the cooler’s heat-dissipation capability, emphasizing that the simulation results cannot be interpreted for variable engine operating conditions.
Heat transfer and fluid behavior are analyzed using AVL CRUISE R2022.1 software [16]. This simulation tool reduces development time and costs by replacing physical prototypes with accurate numerical models, allowing for a more efficient design process despite the complexity of model construction.
1.2. Contributions
The novelty of this study lies in the development of a virtual charge-air cooler model specifically designed for large marine diesel engines. While previous research has provided valuable experimental and CFD-based insights, those efforts predominantly focused on automotive or small-scale systems. This leaves a significant gap regarding large-capacity marine coolers operating under variable environmental conditions. The present work introduces a numerical framework capable of accurately reproducing thermo-fluid behavior before a physical prototype is constructed.
This computational modeling approach extends existing studies by offering a cost-effective alternative to traditional test-bench development. Building a full-scale experimental setup for a marine intercooler is expensive, space-demanding, and requires specialized instrumentation. Furthermore, reproducing the variable humidity levels of marine environments is difficult in a laboratory. The proposed virtual model overcomes these limitations by enabling controlled investigation across a wide range of conditions, including humidity variations that are hard to replicate experimentally. Consequently, the model provides a robust foundation for design optimization and performance prediction, reducing the need for early-stage physical prototyping.
Building on the experimental and numerical findings reported in the literature, the present study applies these methodological principles to a large marine diesel engine equipped with a high-capacity tube-and-fin aftercooler. To evaluate the thermal behavior of this system under realistic operating conditions, a detailed numerical model was developed using AVL CRUISE, as described in the following section.
2. Materials and Methods
The study was conducted on the ALCO V16 251F (Schenectady, NY, USA), a heavy-duty, four-stroke, turbocharged marine diesel engine [17]. Due to its high boost pressure, elevated charge-air temperatures, and reliance on an integrated tube-and-fin aftercooler, the engine provides a suitable platform for assessing heat exchanger performance under varying ambient conditions. The main engine specifications are presented in Table 1.
Table 1.
Engine specifications.
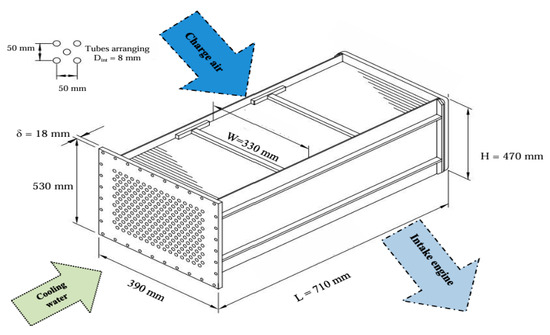
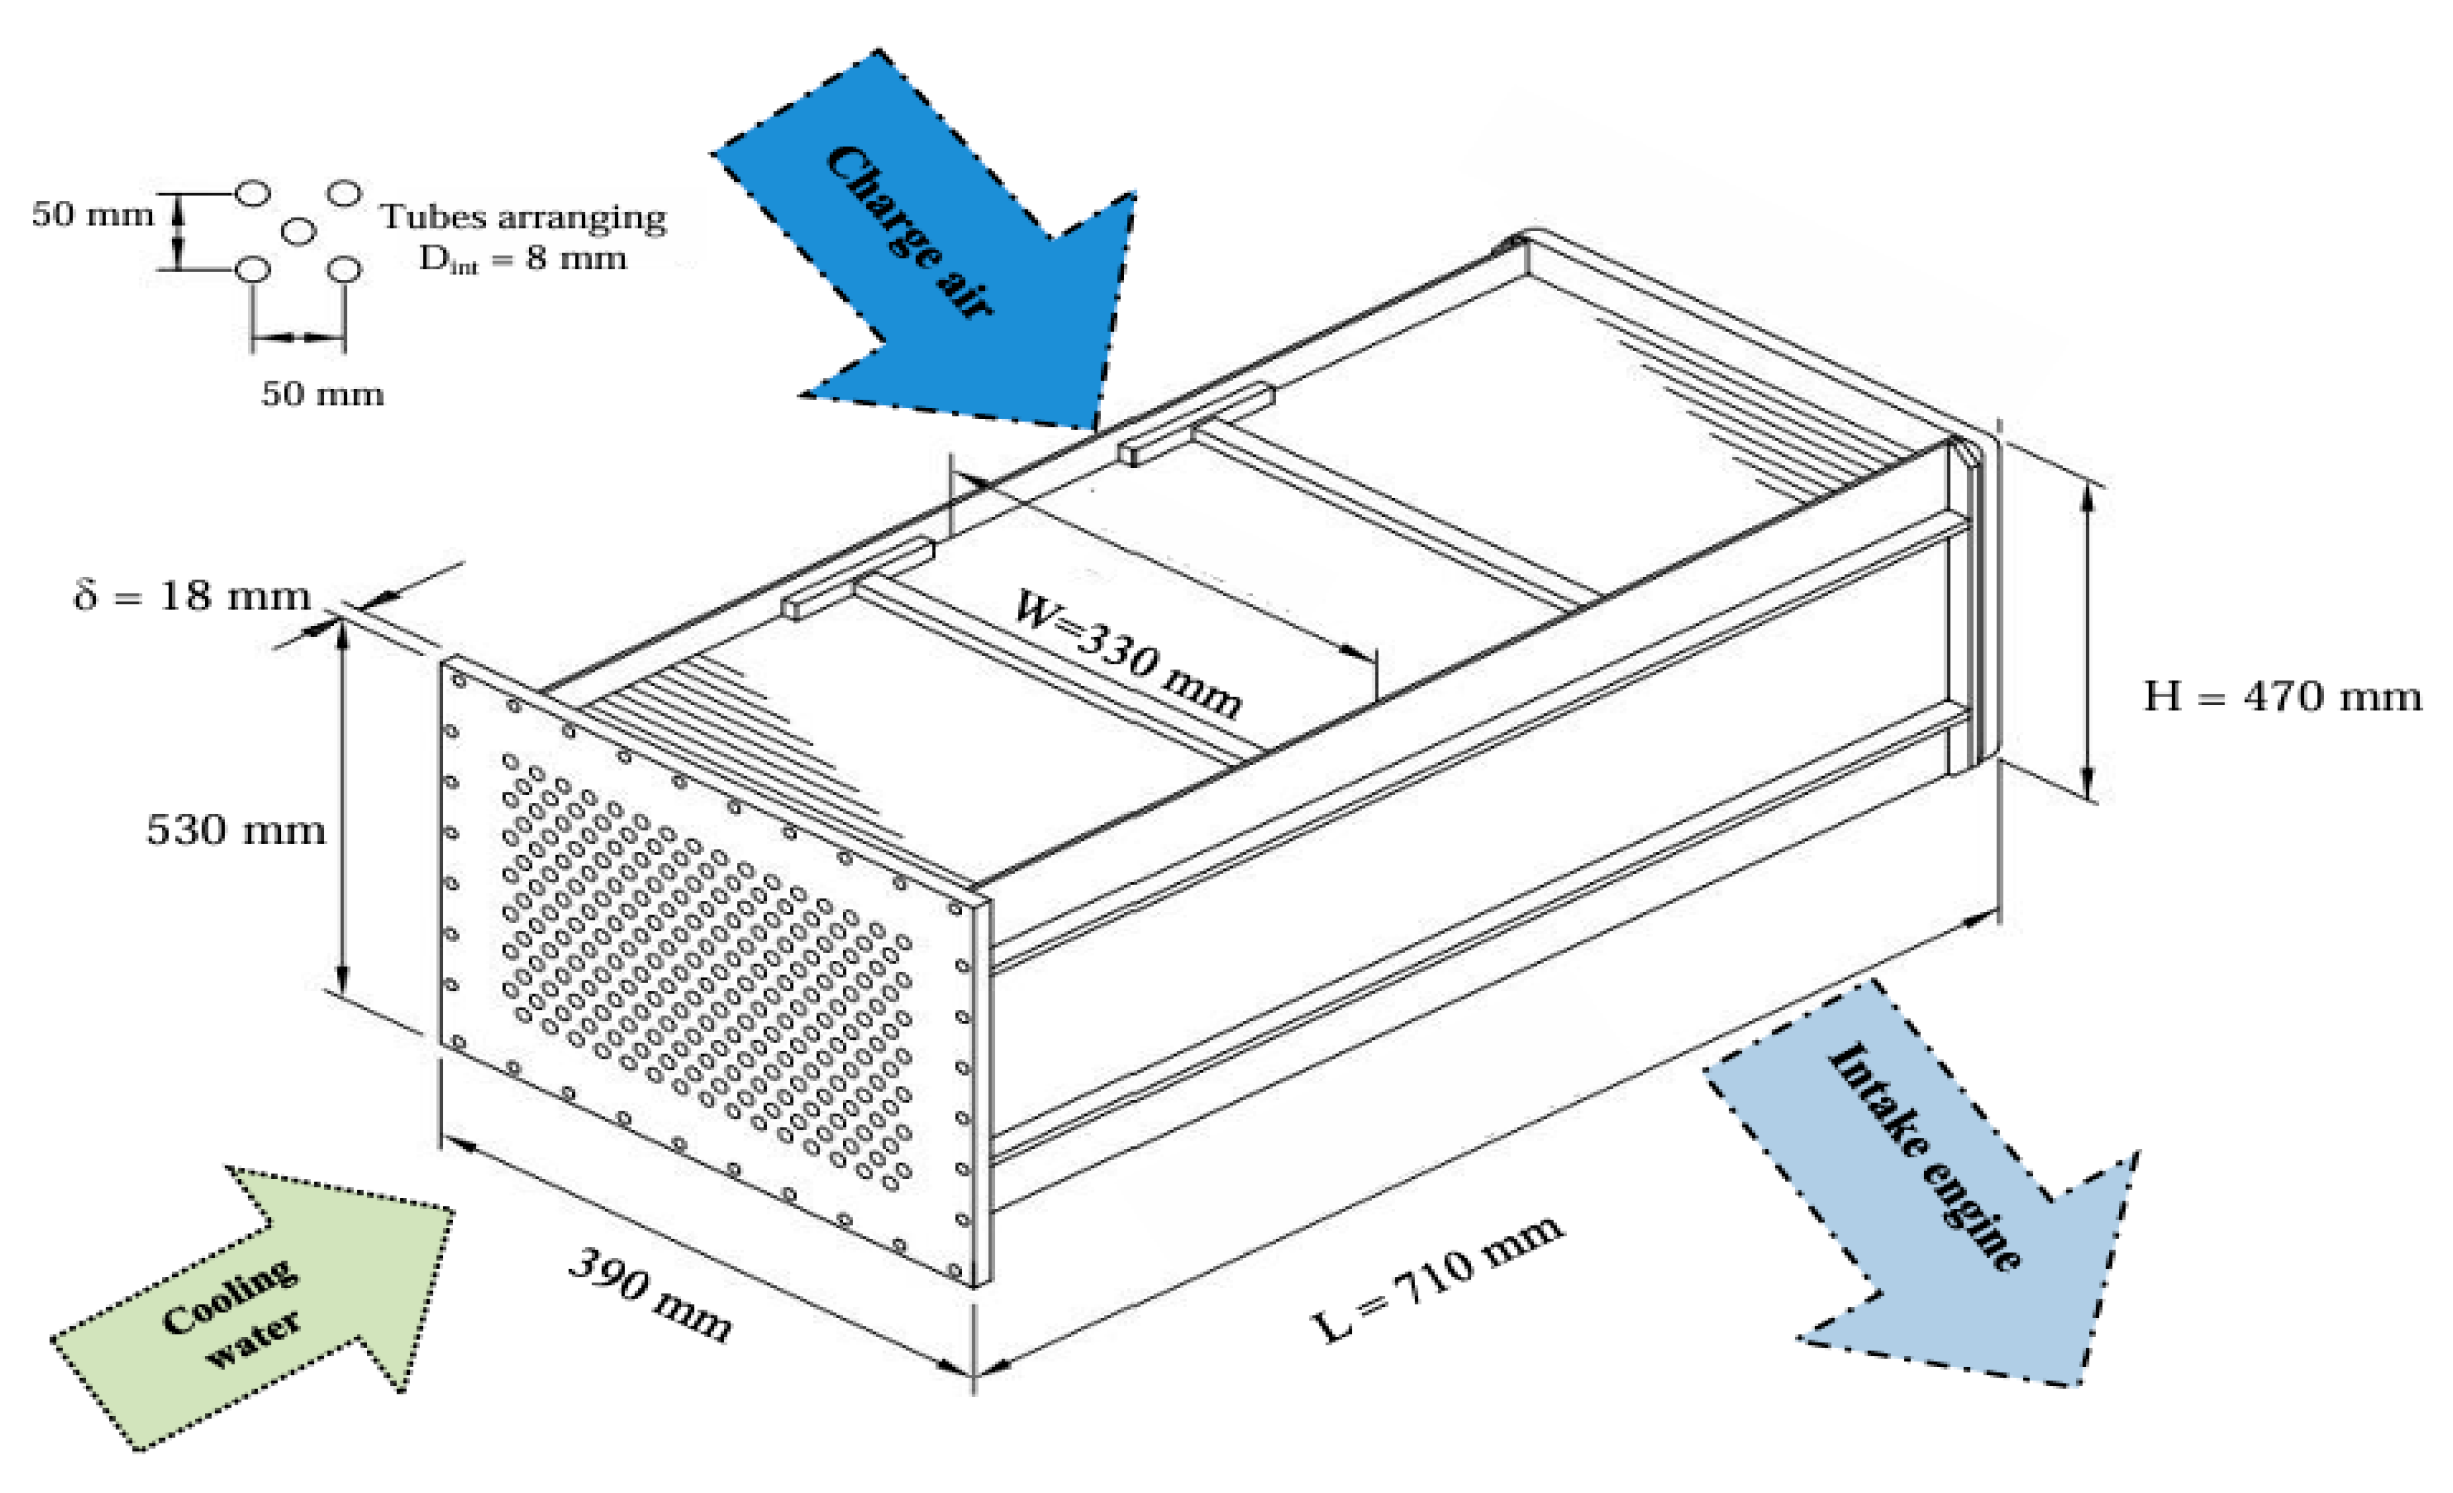
The engine is equipped with a tube-and-fin charge-air cooler integrated into the closed-loop water-cooling circuit (Figure 1).
Figure 1.
Charge-air cooler dimensions.
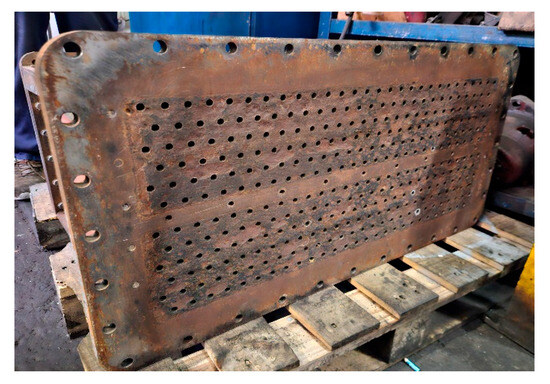
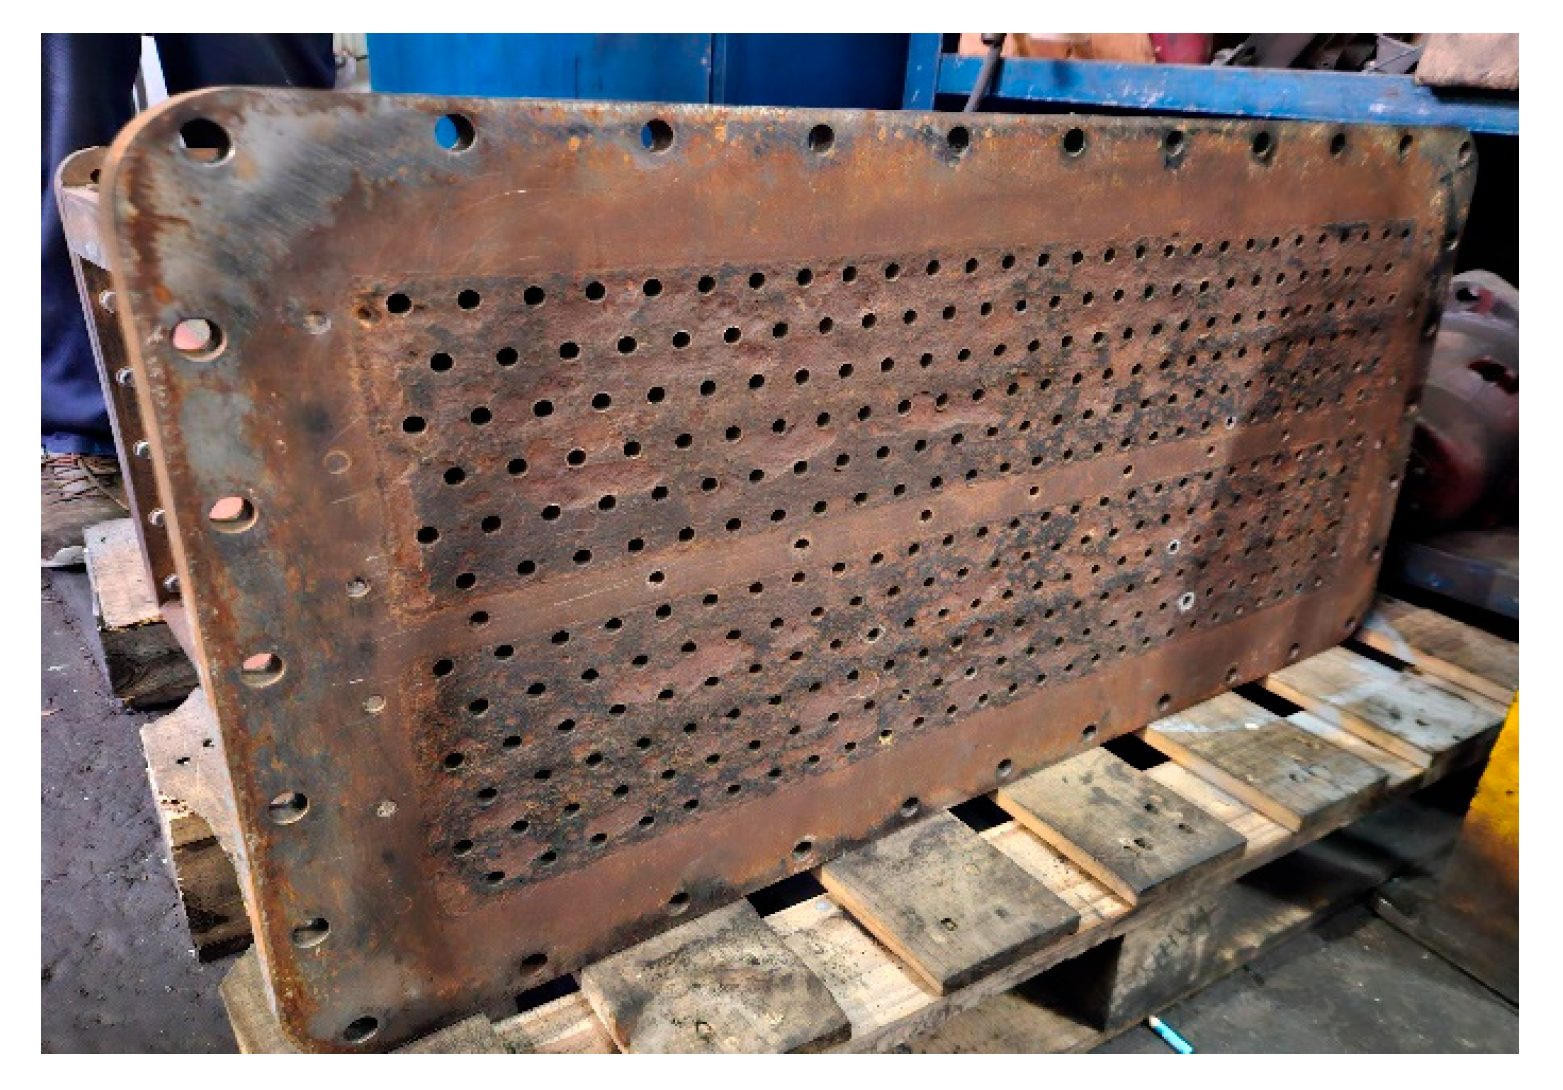
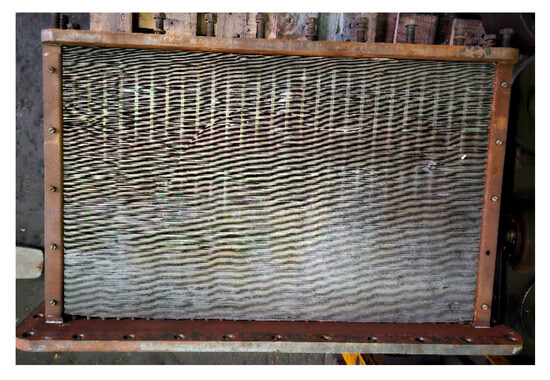
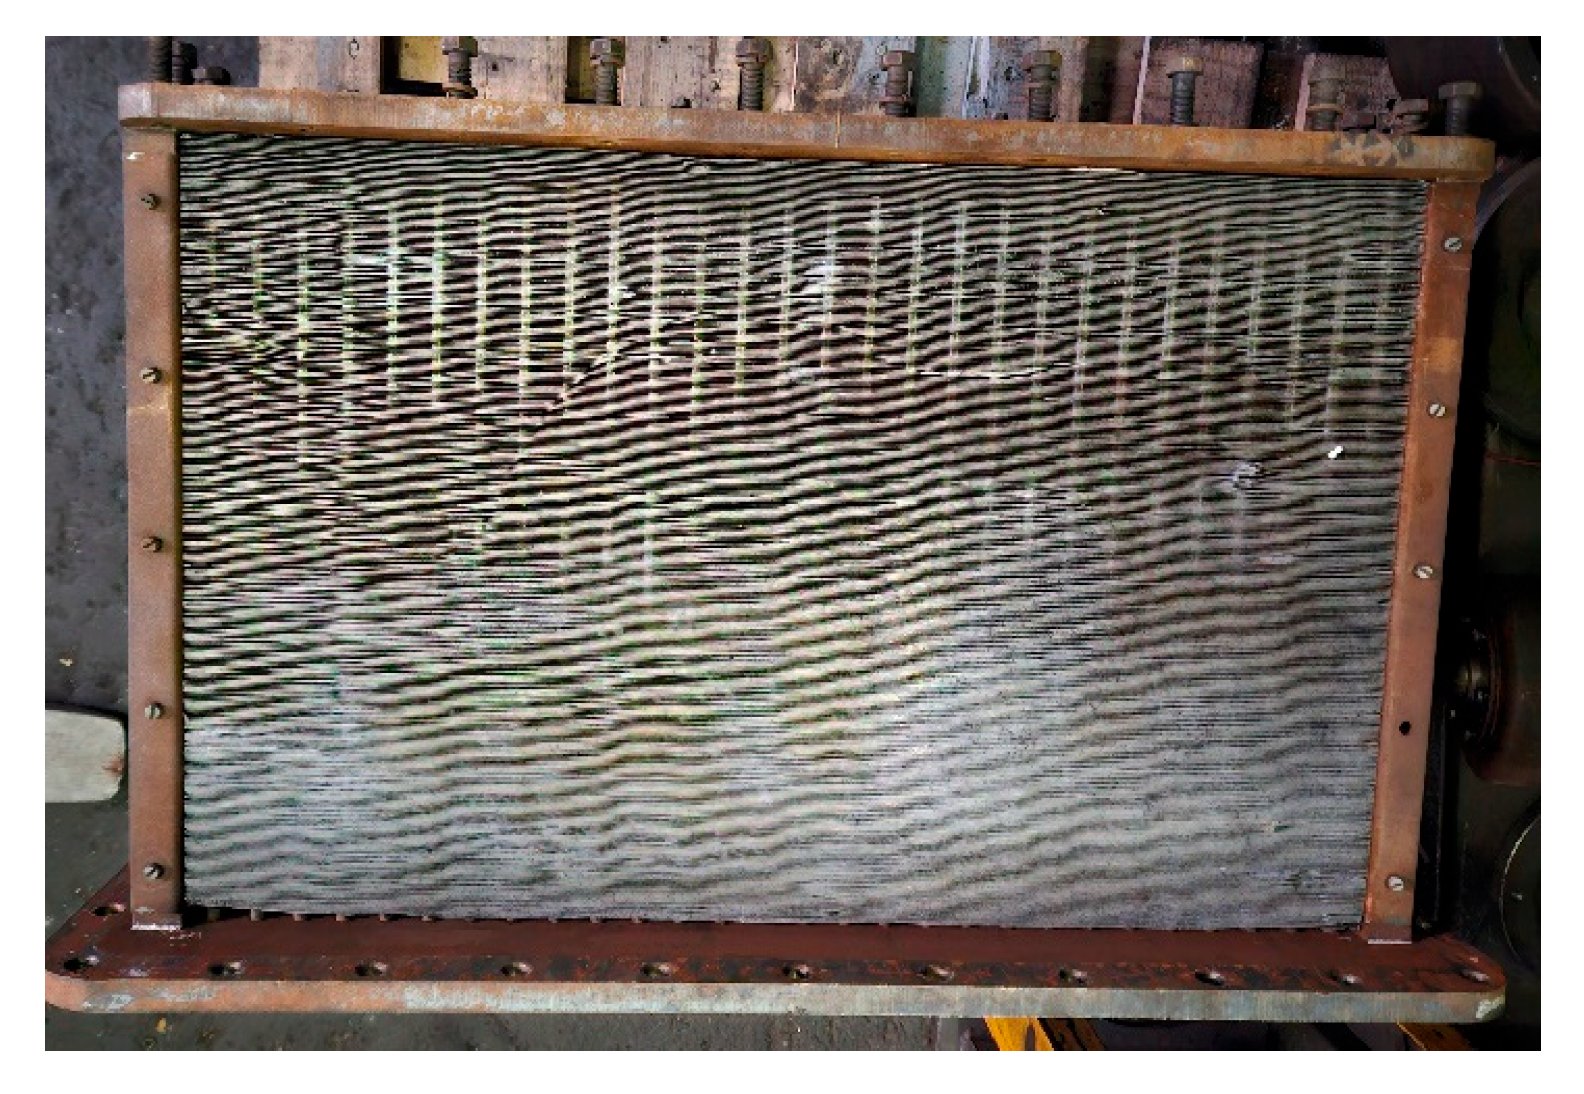
The cooling core consists of 330 steel tubes with an outer diameter of 10 mm and a wall thickness of 1 mm, arranged in six staggered rows to enhance air-side turbulence (Figure 2). The heat-transfer surface is extended by 300 aluminum fins (710 × 330 mm, 0.3 mm thickness), mounted along the 450 mm tube length at a spacing of 1.2 mm (Figure 3). This extended-surface configuration provides a large external area for convective heat transfer and is representative of high-capacity marine aftercoolers.
Figure 2.
Tube arrangement.
Figure 3.
Fins arranging.
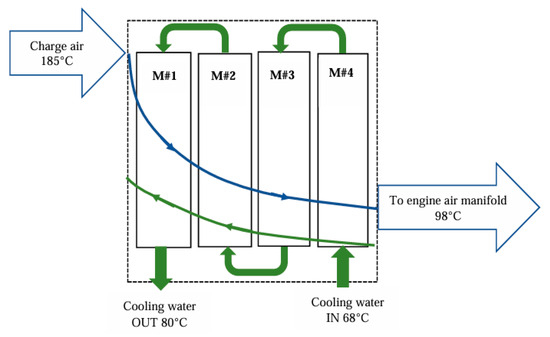
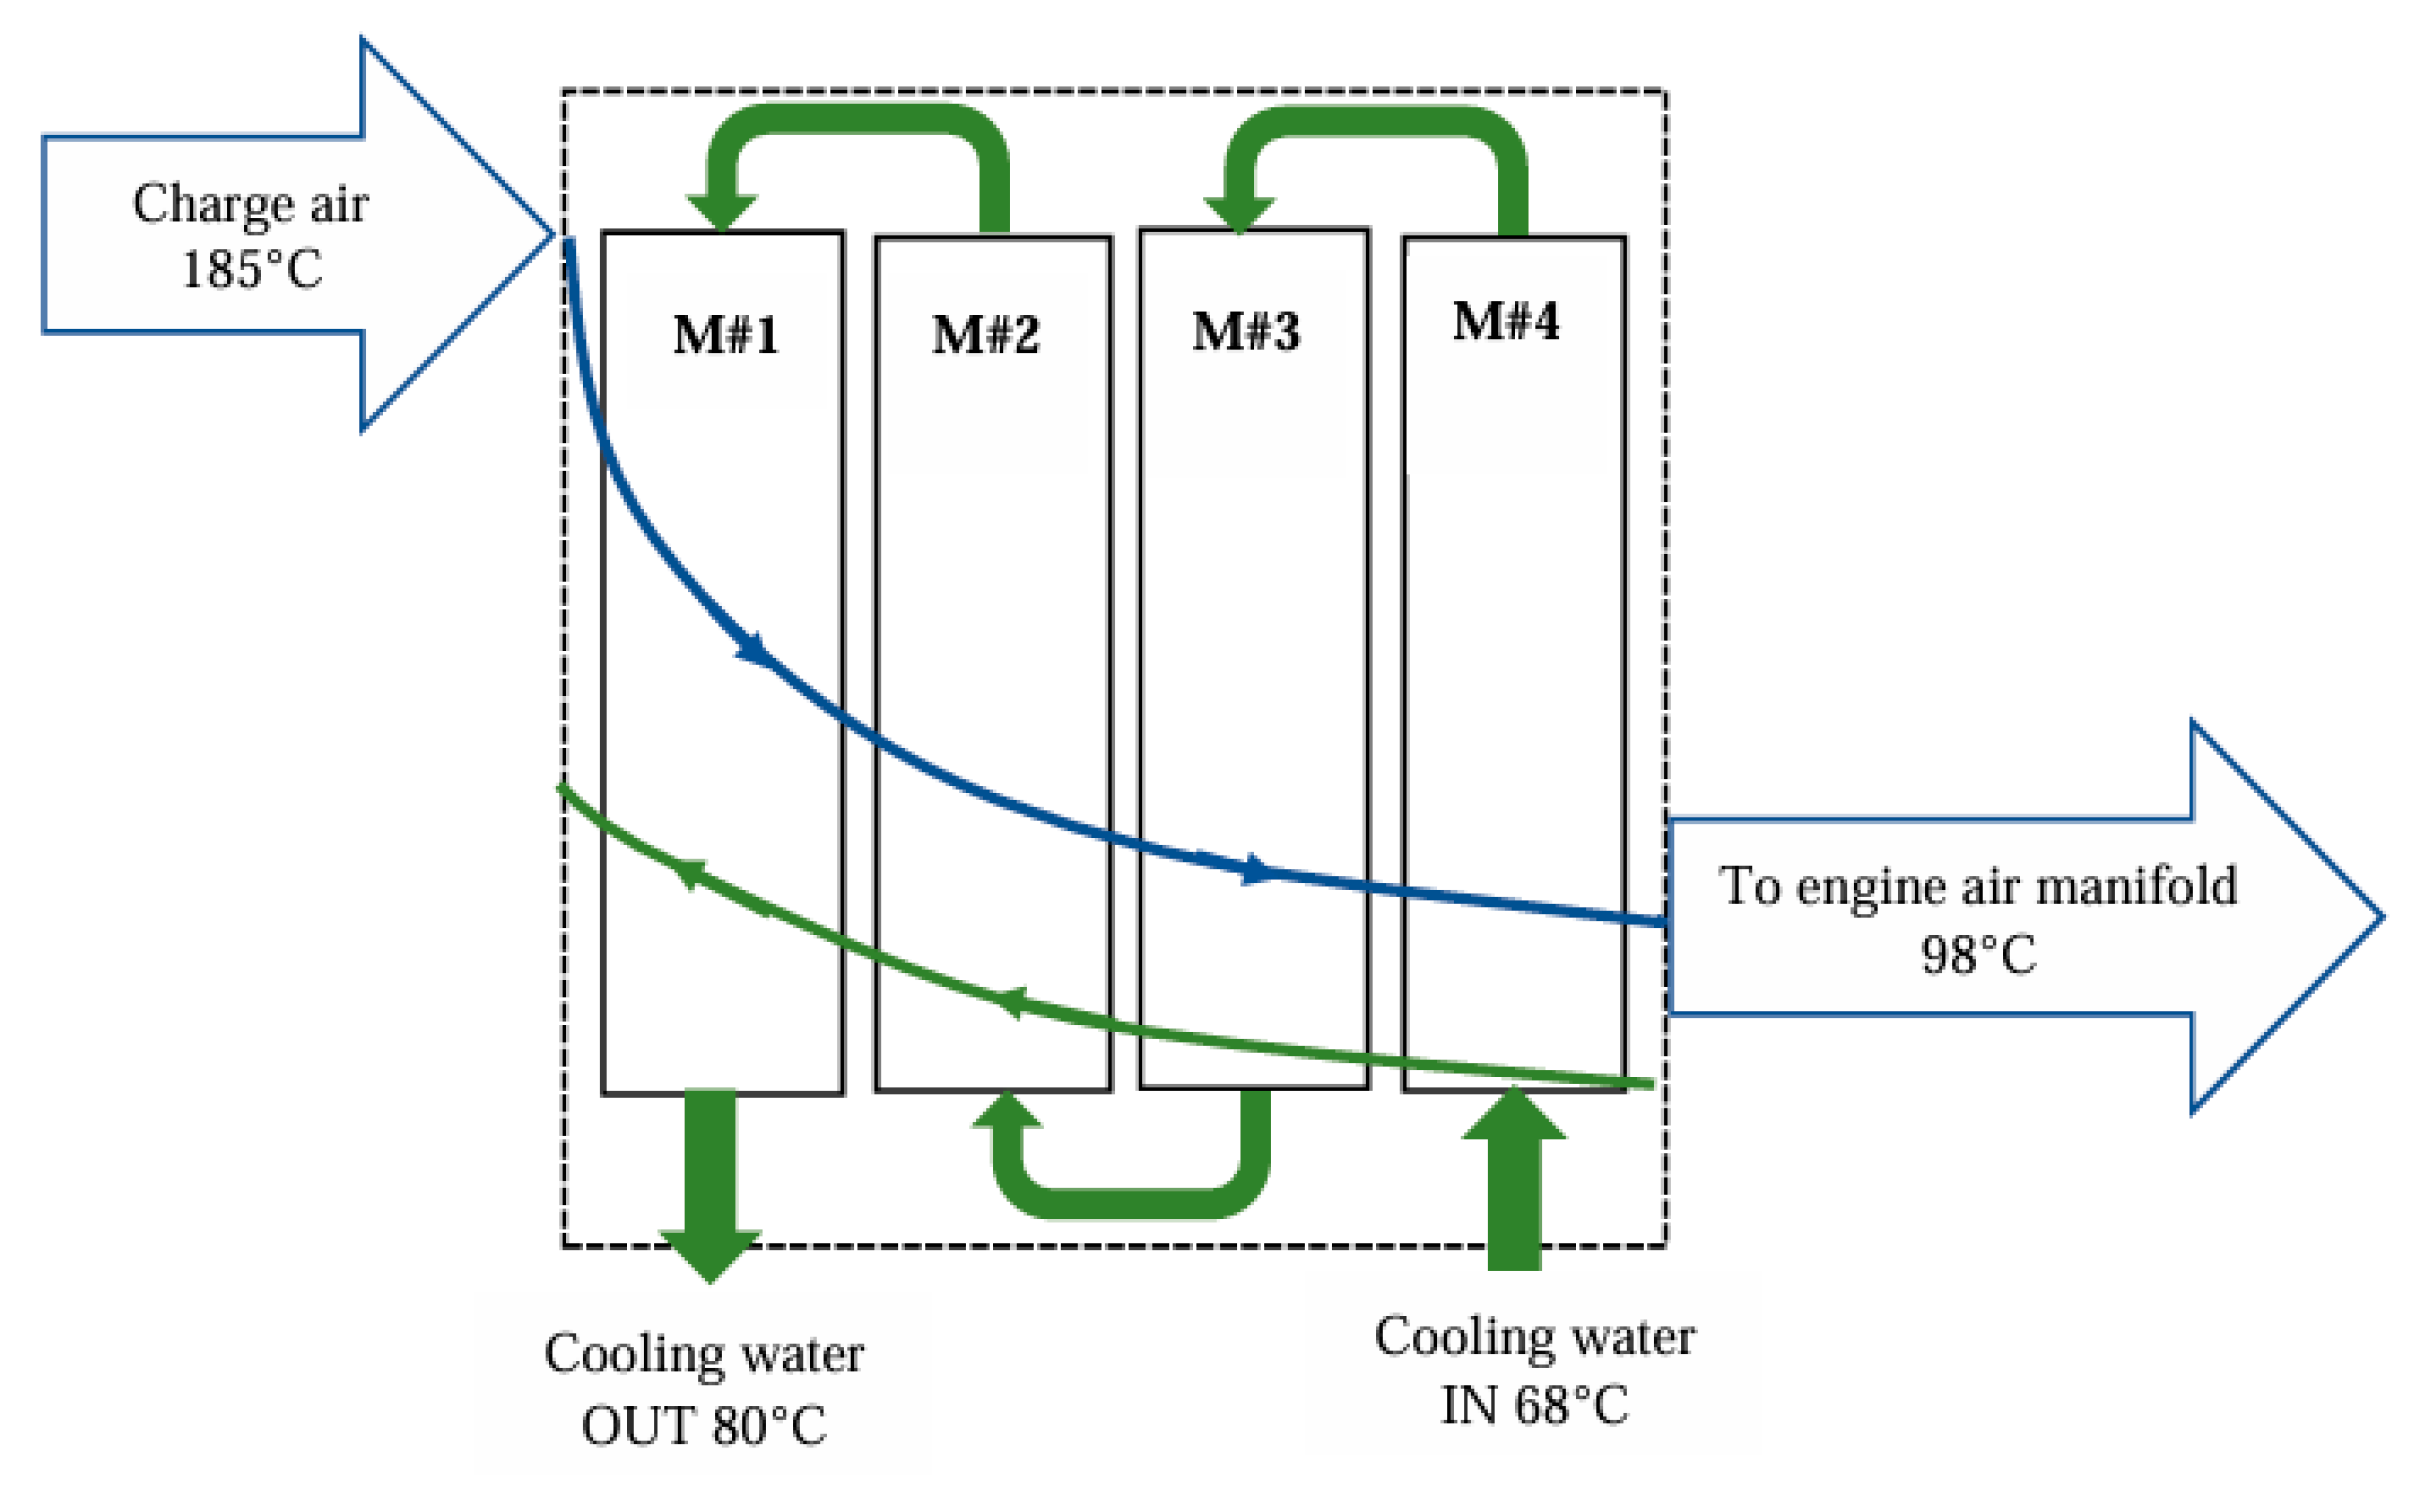
Compressed air from the turbocharger enters the cooler frontally and passes once across the finned surface, while cooling water flows through the tubes in a four-pass cross-flow arrangement defined by the internal baffles of the end covers (Figure 4). This configuration ensures a controlled temperature rise on the water side and a uniform temperature drop on the air side, both essential for maintaining engine performance under variable ambient conditions.
Figure 4.
Working fluids flow.
The model incorporates the cooler’s tube geometry, fin spacing, and flow arrangement to reproduce its thermofluidic behavior. The main geometric parameters are summarized in Table 2.
Table 2.
Heat exchanger constructive data.
Given the geometric complexity and operating constraints of the ALCO V16 251F (USA) aftercooler, an equivalent numerical model was constructed to reproduce its thermofluidic behavior. The following subsection details the discretization strategy and the implementation of the multi-pass crossflow configuration within AVL CRUISE.
An equivalent heat exchanger model was developed in AVL CRUISE to reproduce the thermal behavior of the physical charge-air cooler under engine operating conditions.
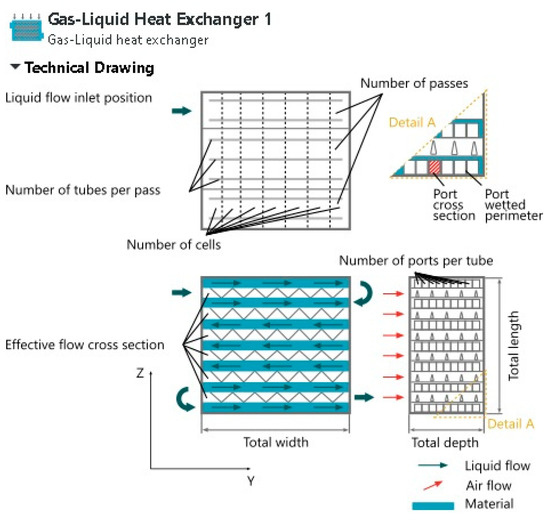
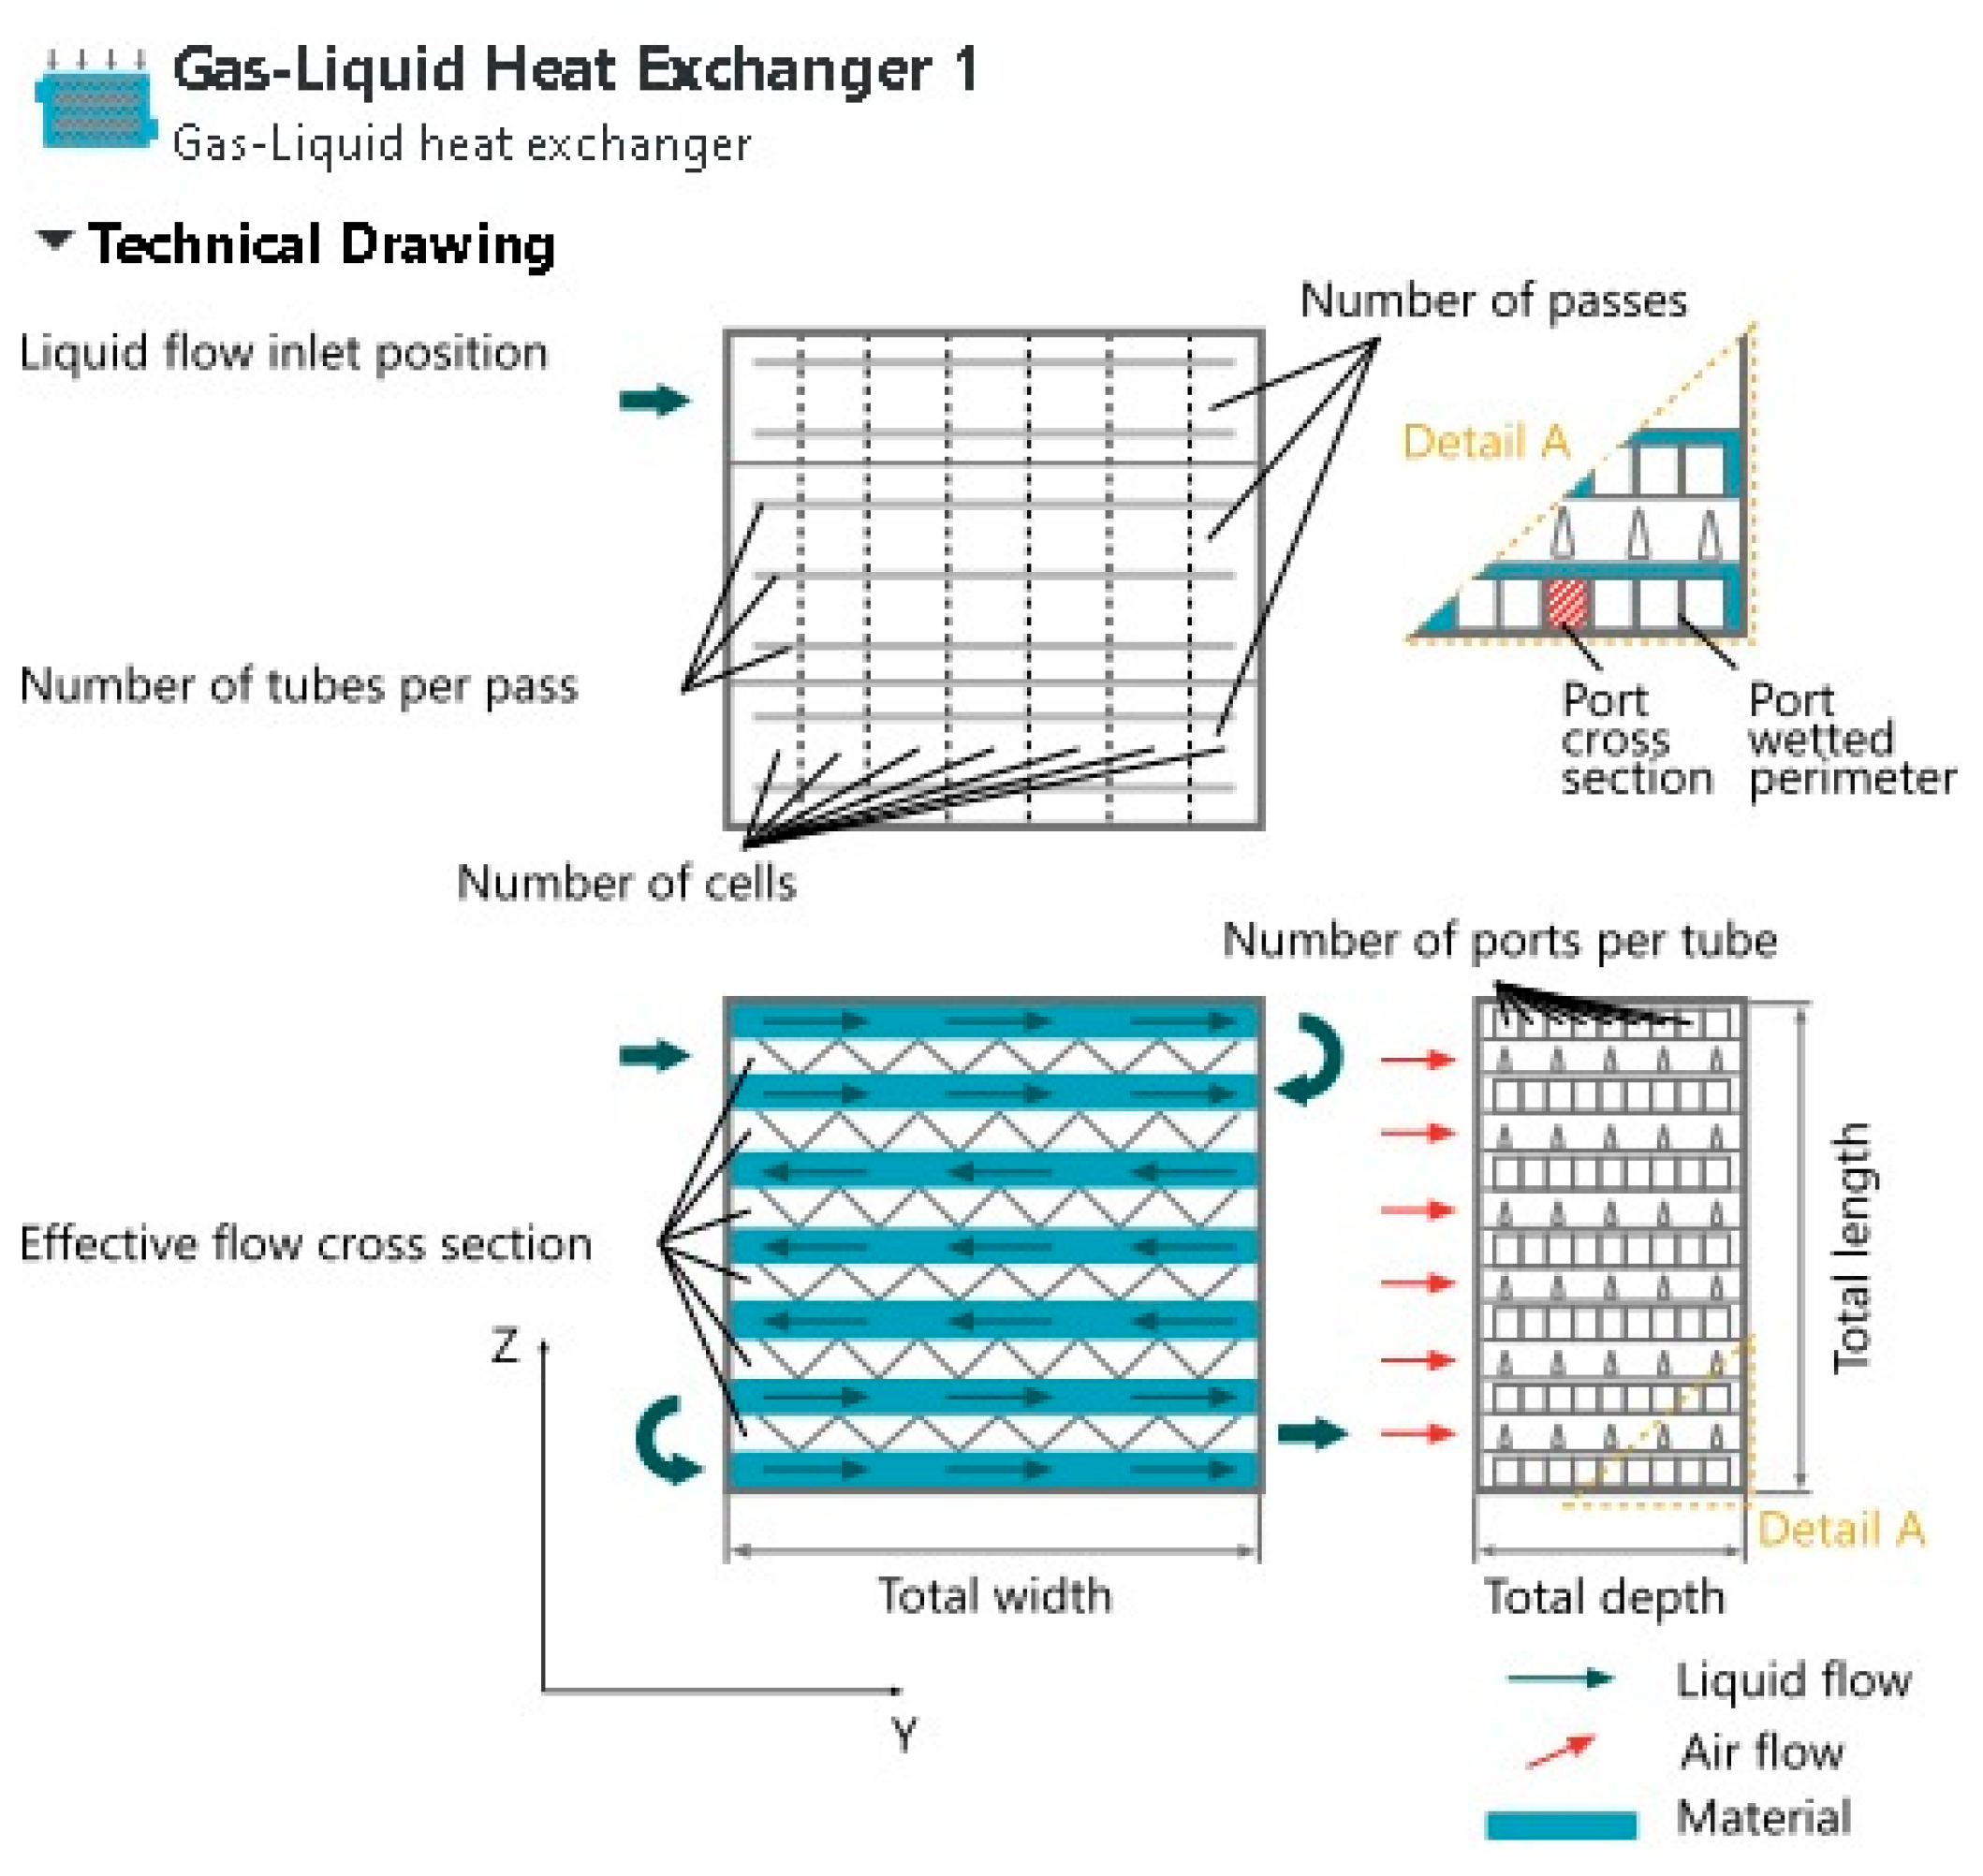
The model employs a multipass cross-flow configuration consistent with the geometry of the real unit, in which the cooling water performs four passes through the tube bundle while the compressed air flows once across the finned surface.
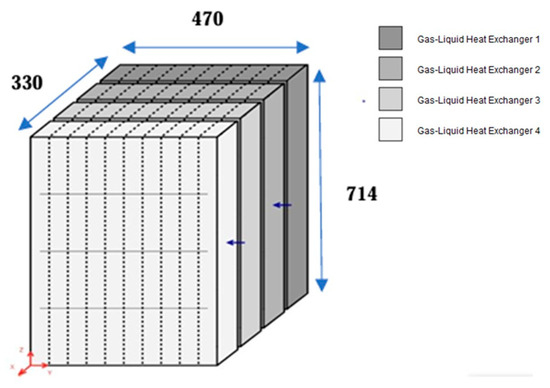
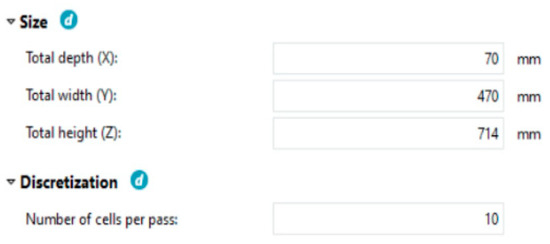
To capture the spatial variation in heat transfer and pressure loss, the virtual cooler was discretized into four cooling matrices connected in series, each measuring 70 × 470 × 714 mm. Their arrangement and geometric correspondence to the physical cooler are shown in Figure 5 and Figure 6.
Figure 5.
Cooling matrices arrangement.
Figure 6.
Dimensions of cooling matrices.
Every matrix contains ten cooling cells, and each cell incorporates 33 air channels externally cooled by water (Figure 7). This discretization strategy enables the numerical evaluation of local temperature gradients, air-side and water-side heat-transfer rates, and the evolution of thermodynamic properties along the flow path.
Figure 7.
Inner structure of cooling matrices.
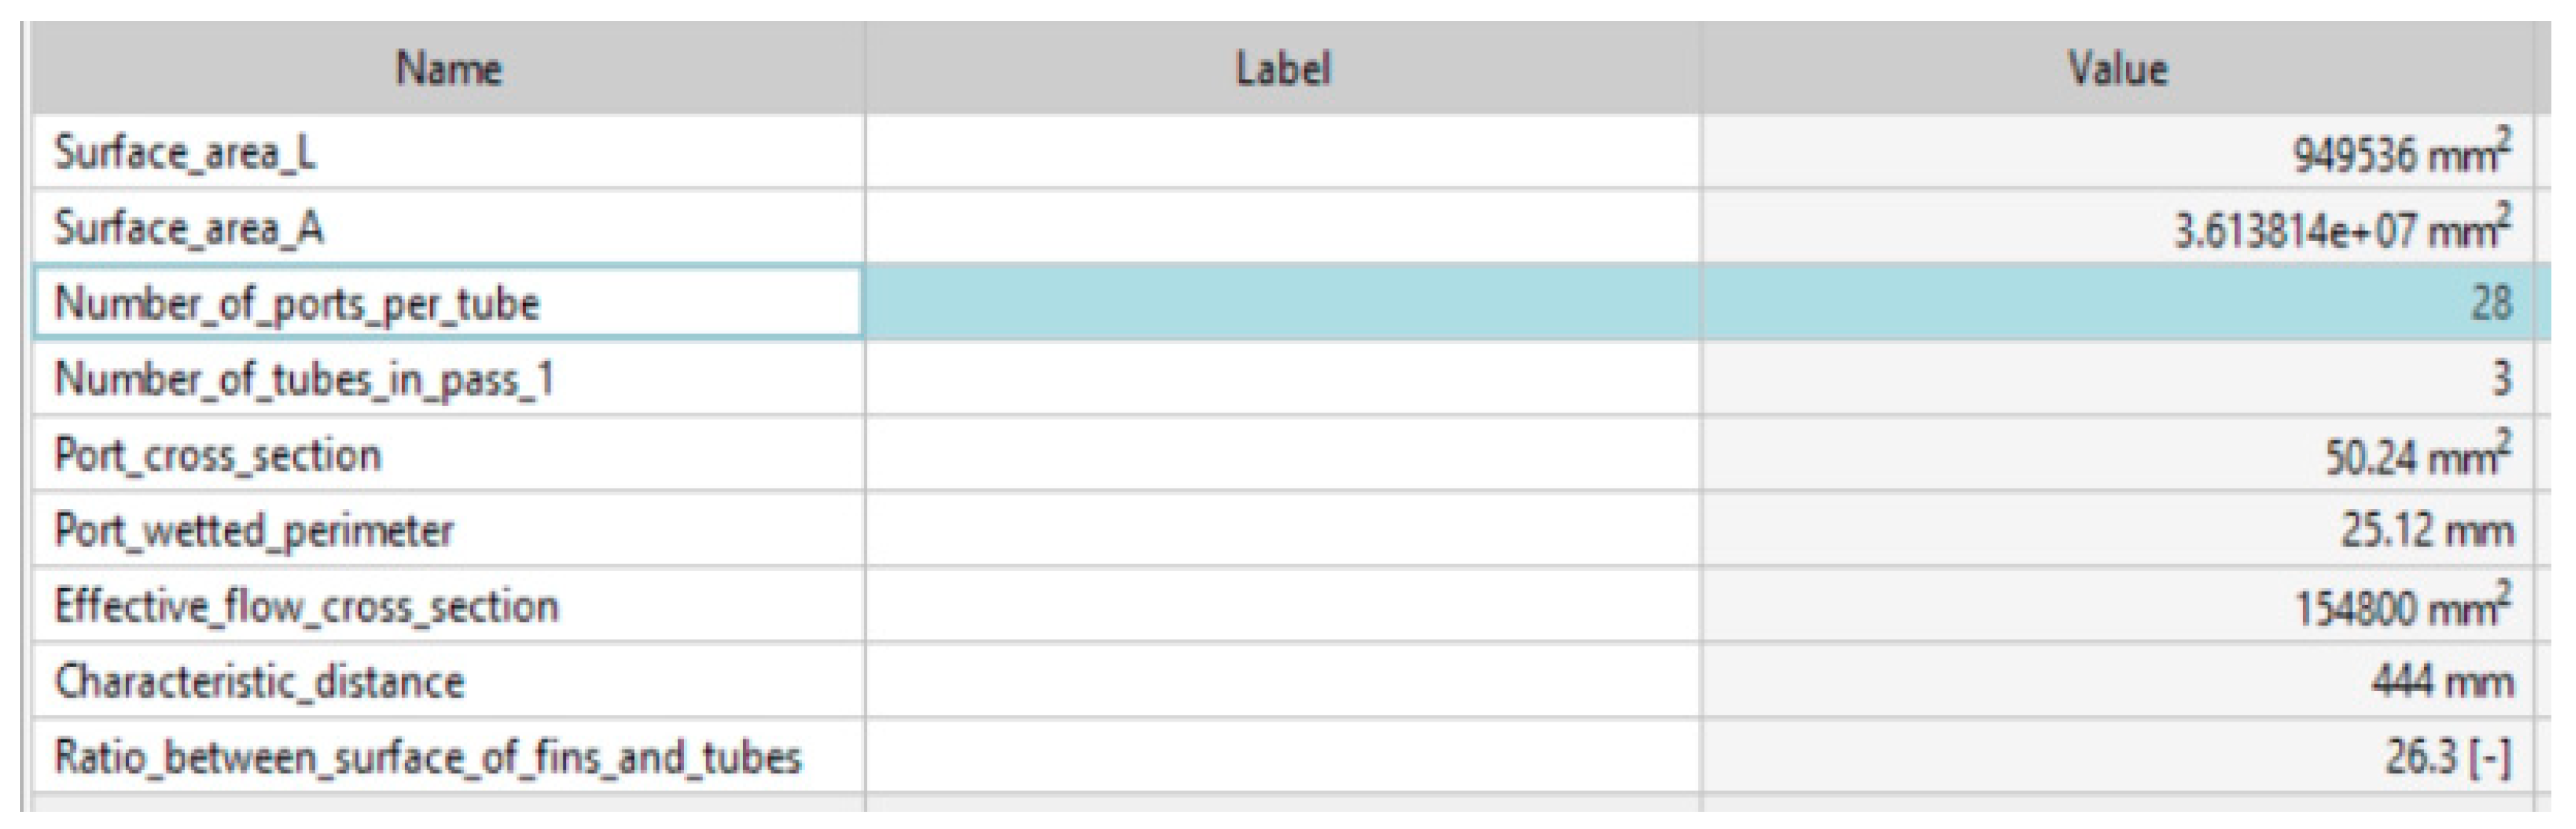
The model preserves the ratio between the air-side and water-side heat-transfer surface areas (3.61 m2 and 0.949 m2, respectively), ensuring that the virtual cooler maintains the same thermal conductance characteristics as the physical system (Figure 8). Boundary conditions for mass flow rate, pressure, and inlet temperature were imposed according to the engine’s technical specifications, allowing the virtual cooler to operate under realistic thermofluidic constraints.
Figure 8.
Heat exchanger characteristics.
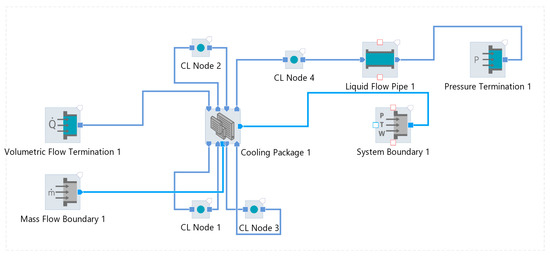
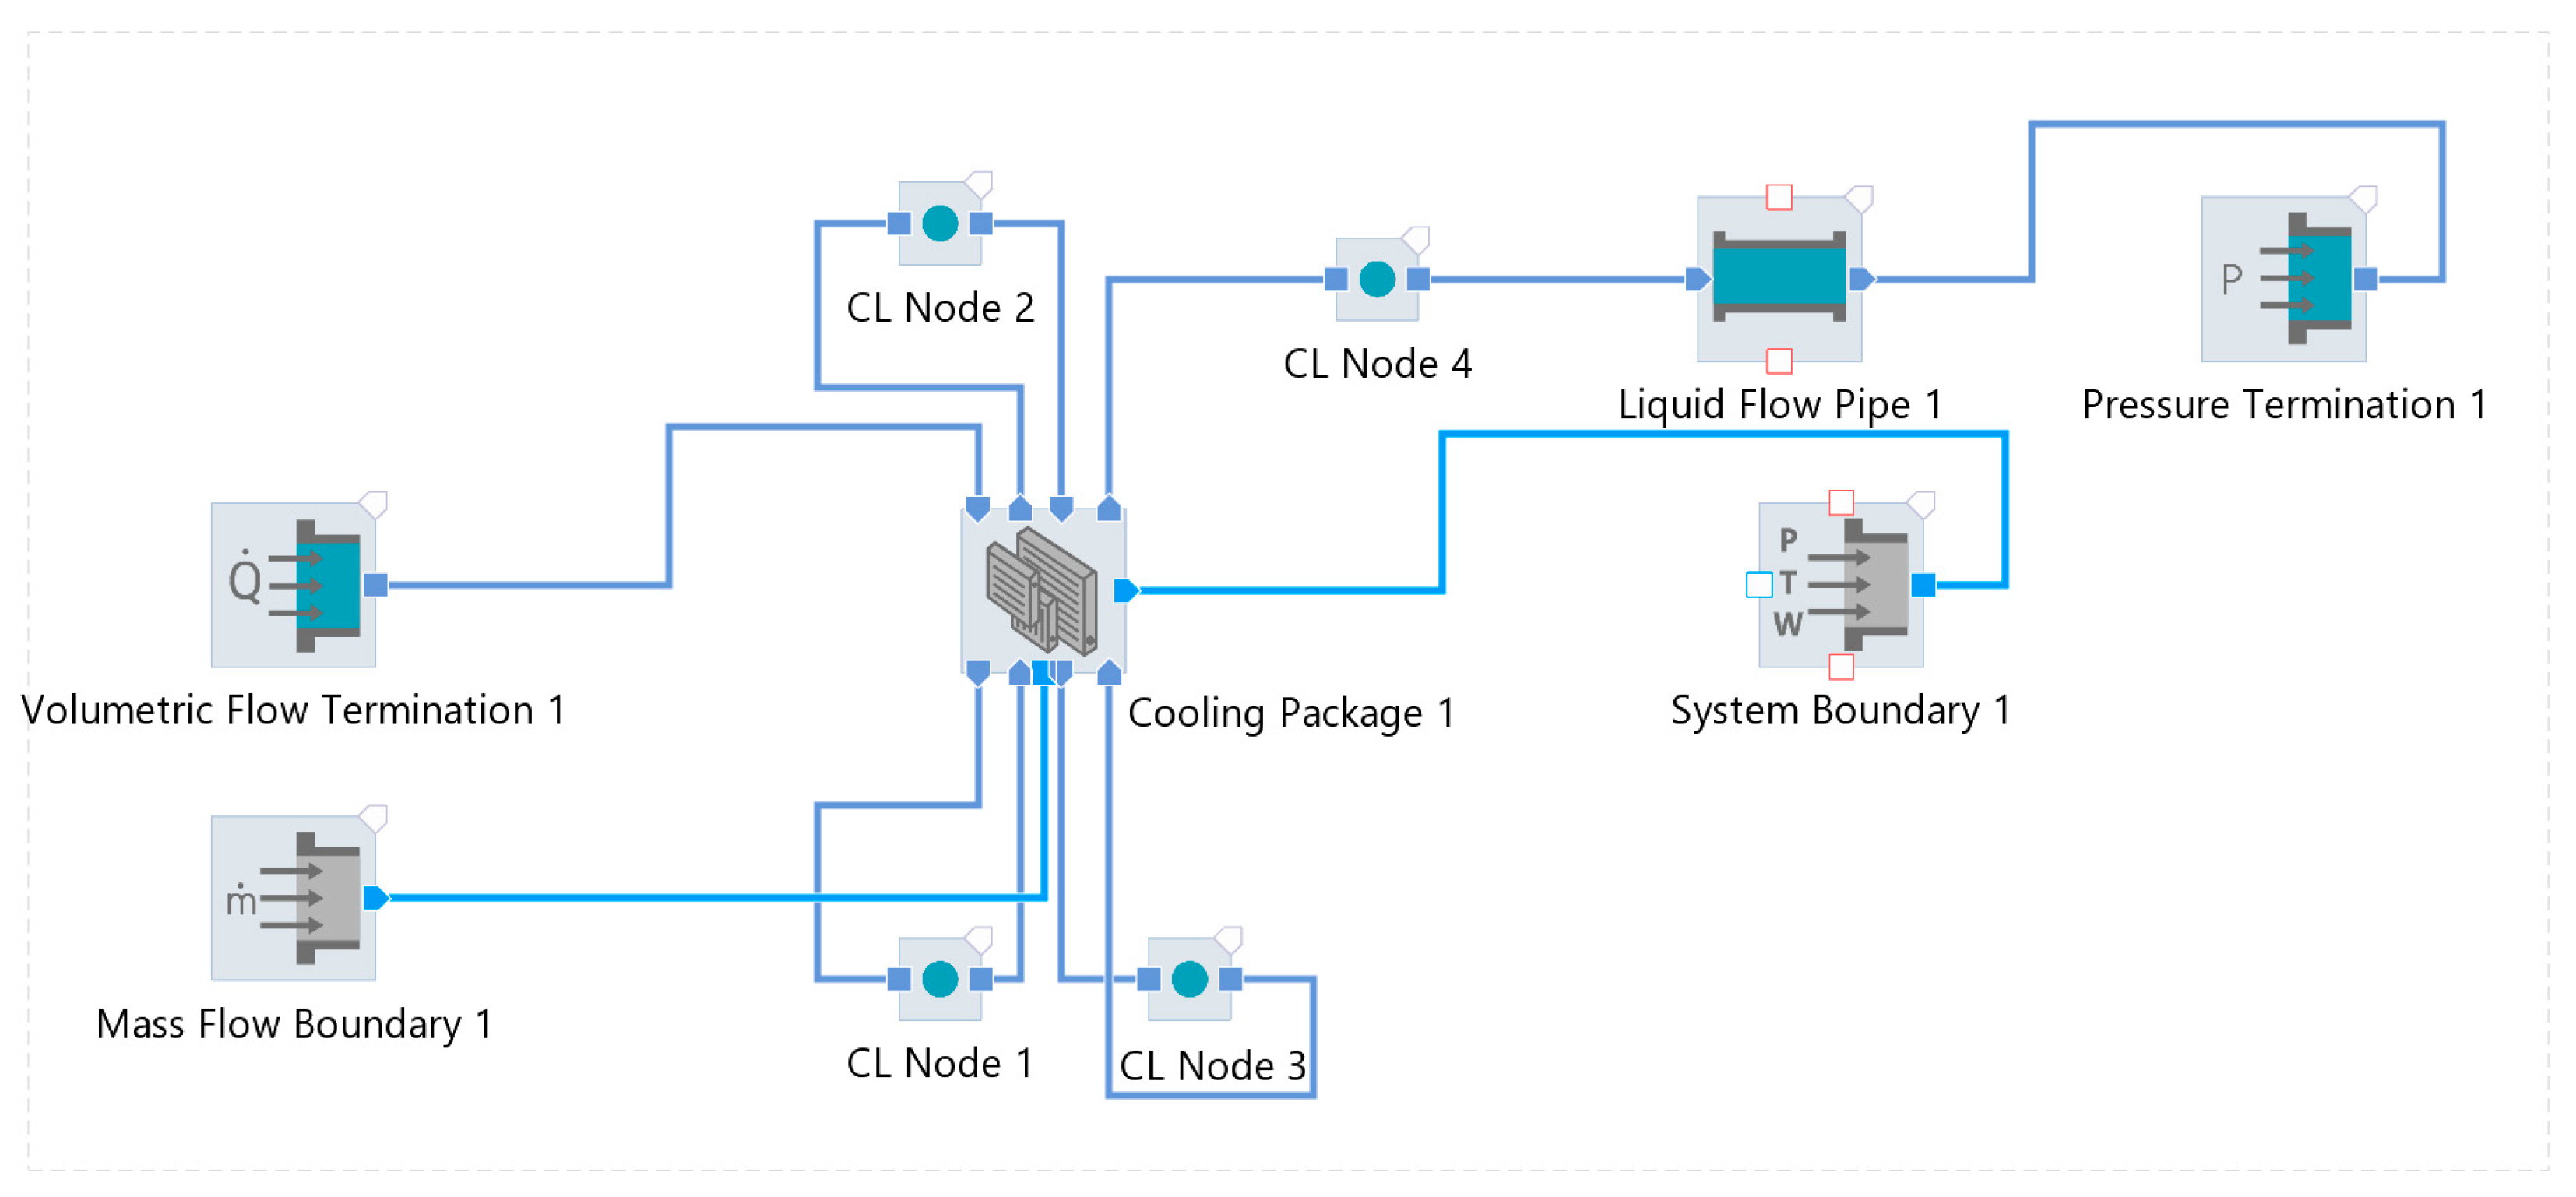
This configuration preserves the multi-pass behavior of the physical aftercooler and allows evaluation of local temperature gradients and heat-transfer rates (Figure 9).
Figure 9.
Configuration of the virtual air cooler.
The AVL CRUISE numerical model solves the conservation equations for mass, momentum, and energy under standard simplifying assumptions, including constant thermophysical properties, no-slip boundary conditions, steady-state flow, and the neglect of natural convection and radiative heat transfer. While constant thermophysical properties were used for the baseline validation, AVL CRUISE utilizes property tables that update fluid properties at each discretization node based on local temperature. These assumptions ensure numerical robustness while retaining the dominant mechanisms governing convective heat exchange in tube-and-fin configurations.
Following the development of the virtual model, the performance of the charge-air cooler was evaluated using the classical heat-exchanger theory. The analysis relies on the conservation of energy applied to both working fluids and on the standard thermal-engineering parameters—heat-transfer rate, overall heat-transfer coefficient, logarithmic mean temperature difference (LMTD), and effectiveness—allowing a quantitative assessment of the cooler’s thermodynamic behavior under the imposed operating conditions.
Once the virtual cooler architecture was established, its thermal performance was evaluated using classical heat-exchanger theory. The governing relations for heat-transfer rate, LMTD, overall conductance, and effectiveness are summarized below to provide the analytical basis for model validation.
The thermal performance of the charge-air cooler is assessed using classical heat-exchanger theory [18], which applies the first law of thermodynamics to the interacting fluid streams. In steady-state operation, the heat-transfer rate is governed by the enthalpy variation in each fluid, leading to the general energy-balance relation expressed in relation (1). This formulation constitutes the basis for quantifying the cooling capacity and for deriving the subsequent performance indicators of the system.
Equation (1) provides the thermal load exchanged between the fluids and enables the determination of the temperature driving potential across the heat-transfer surface. For a counter-flow configuration, the effective temperature difference is represented by the logarithmic mean temperature difference (LMTD), defined in relation (2).
The LMTD quantifies the average thermodynamic driving force and is essential for evaluating the global heat-transfer capability of the exchanger. Combined with the overall heat-transfer coefficient U and the effective heat-transfer area A, it yields the theoretical heat-transfer rate:
The parameter U⋅A encapsulates the combined effects of convection on both sides of the tubes, conduction through the tube walls, and fin efficiency. Its determination is central to characterizing the intrinsic thermal conductance of the cooler.
The overall heat-transfer coefficient U is determined by accounting for all thermal resistances involved in the heat exchange process. The global resistance includes the convective resistance on the air side, the conductive resistance of the tube wall, and the convective resistance on the water side. The corresponding relation is:
where hair and hwater represent the convective heat-transfer coefficients of the charge-air and cooling water, respectively, while Rwall denotes the thermal resistance of the tube.
The heat-transfer surface area A corresponds to the total external area of the finned tubes and is computed from the geometric characteristics of the cooler.
To complement the LMTD approach, the performance can also be expressed through the effectiveness–NTU (Number of Transfer Units) method [19], which provides a non-dimensional evaluation of the exchanger’s capability to transfer heat relative to its theoretical maximum. The effectiveness ε is defined as:
where Qmax corresponds to the maximum possible heat transfer for the given inlet conditions. The number of transfer units (NTU), defined as:
links the exchanger geometry to its thermal performance and enables the prediction of effectiveness independently of outlet temperatures. Together, these relations provide a rigorous theoretical framework for evaluating the cooling performance, enabling a consistent comparison between the virtual model and the physical heat exchanger under identical operating conditions.
While the NTU formulation provides a rigorous link between the heat-transfer capability of the exchanger and its geometry, the overall performance of a charge-air cooler must be assessed through two complementary indicators: the cooling effectiveness and the heat-exchanger efficiency [16]. The first depends exclusively on the temperature levels of the working fluids, whereas the second incorporates both the thermal conditions and the constructive characteristics of the exchanger. Together, these parameters offer a comprehensive evaluation of the cooling process and of the intrinsic capability of the device to transfer heat.
The cooling effectiveness expresses the relative temperature reduction achieved by the hot fluid and depends solely on the inlet and outlet temperatures of the two streams.
The heat-exchanger efficiency is related to the heat transfer effectiveness ɛ through the relation:
This is a general expression that can be used to determine the efficiency of any heat exchanger when its effectiveness ɛ is known, where is the heat capacity ratio.
These theoretical indicators enable a rigorous assessment of the cooler’s performance. To ensure that the numerical model accurately reproduces the physical behavior of the real aftercooler, a three-stage verification procedure was conducted, as outlined in the following section.
The operational verification of the virtual cooler was structured around three research-relevant criteria designed to confirm that the numerical model reproduces the fundamental thermodynamic mechanisms of an air–water heat exchanger. The cooling process was simulated in AVL CRUISE under the assumption of dry charged air, using the fluid properties listed in Table 3, as specified in the engine’s Technical Data Sheet [17].
Table 3.
Working fluids data.
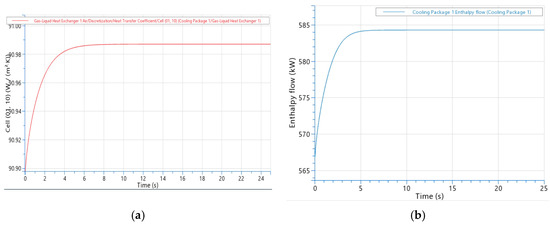
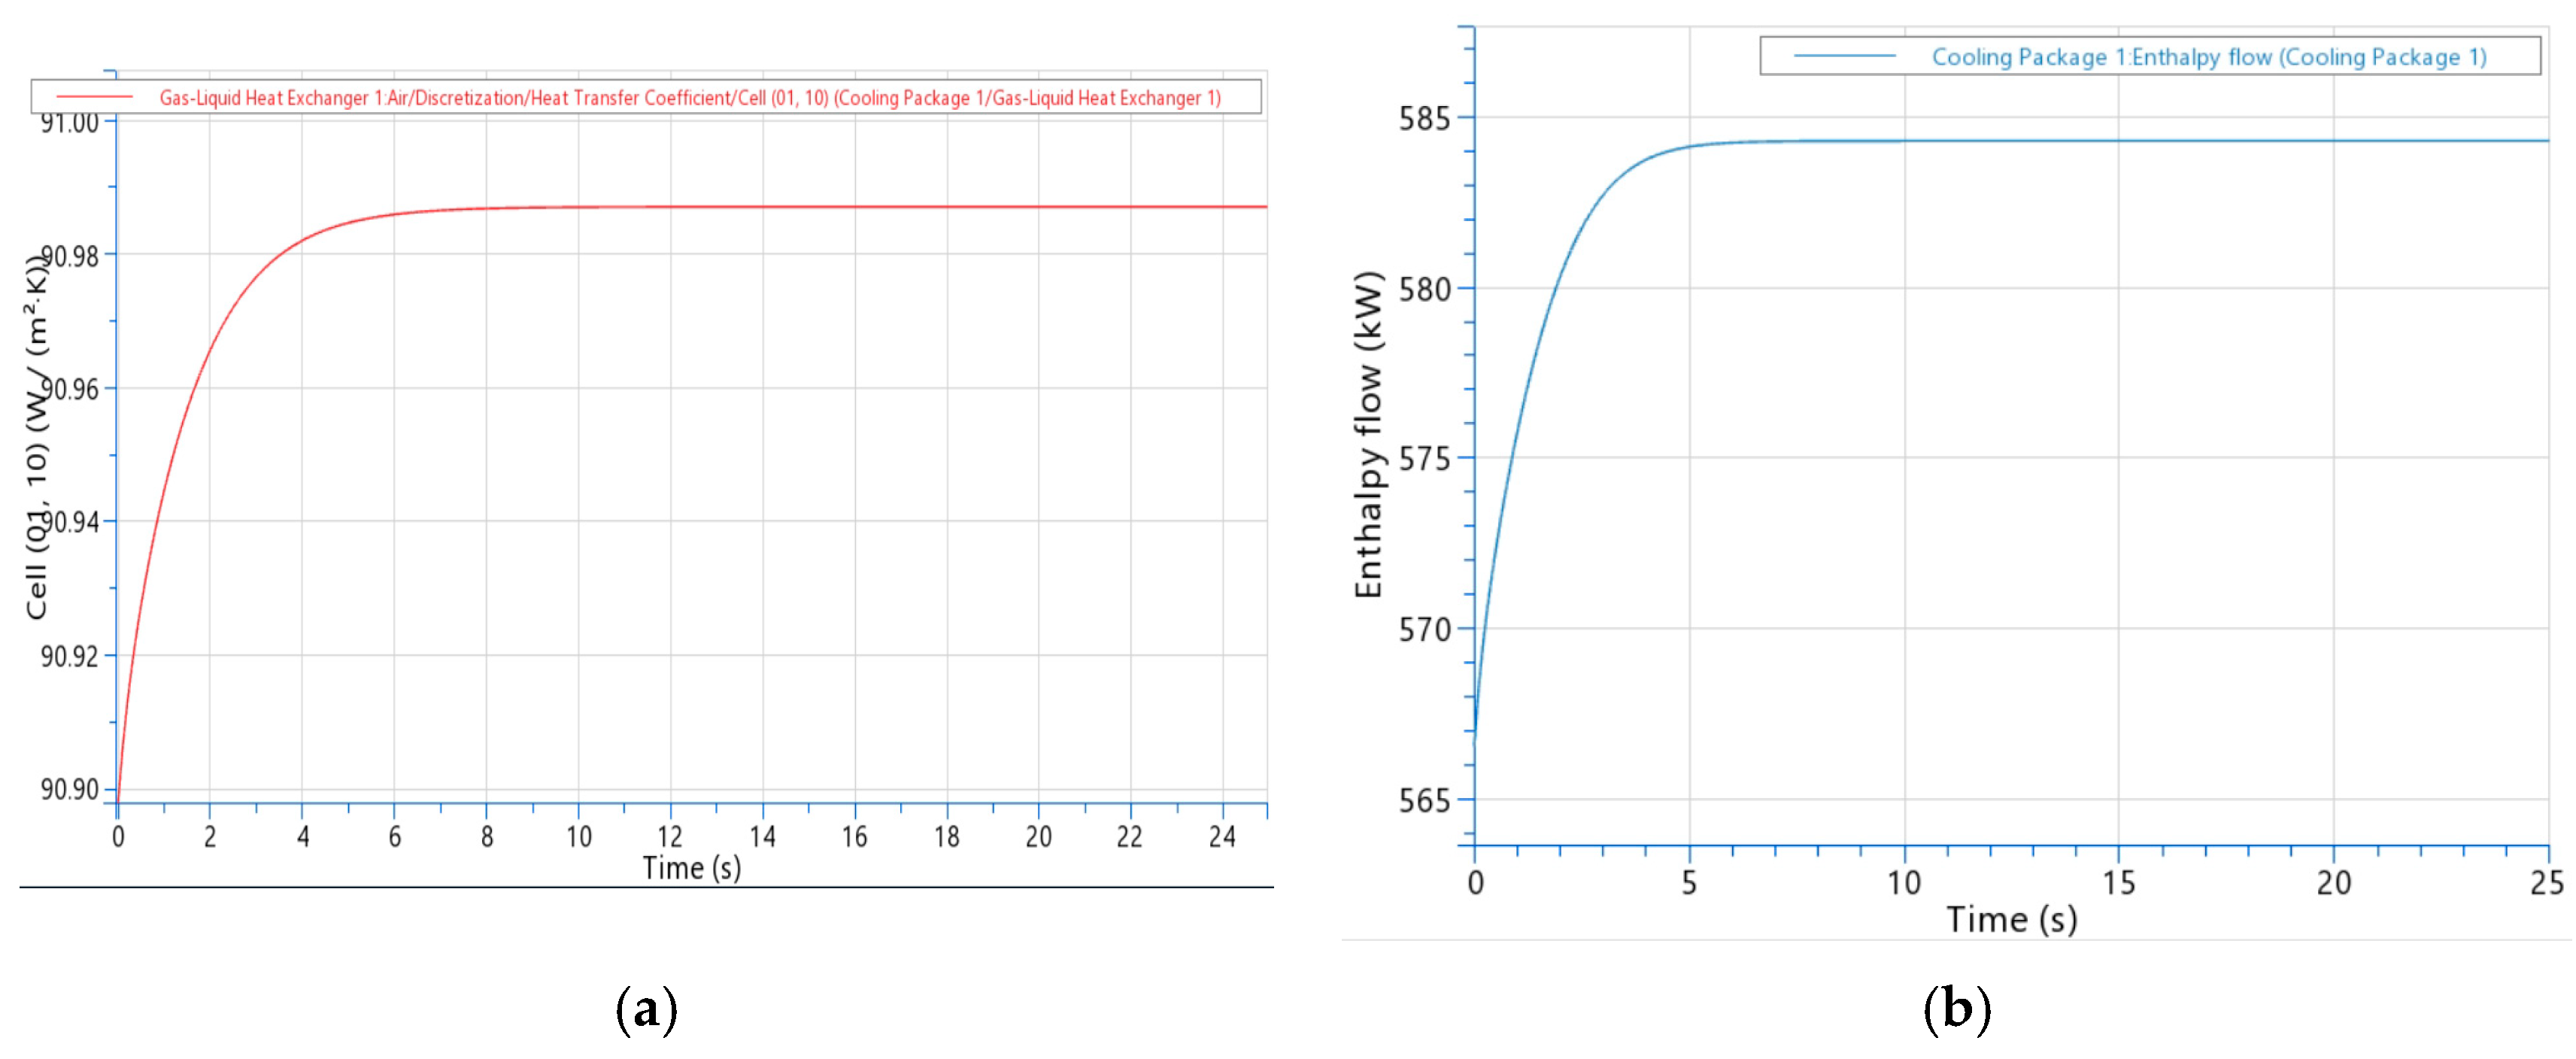
The first verification step consisted in monitoring the stabilization of the overall heat-transfer coefficient U and of the enthalpy variation in the working fluids. Figure 10 presents the temporal evolution of U and enthalpy used to assess the convergence of the numerical solution. The heat-transfer coefficient stabilizes near 91 W/(m2·K) after 25 s. The enthalpy exhibits the same monotonic progression, confirming a well-posed solution and the absence of non-physical oscillations.
Figure 10.
(a) Heat-transfer coefficient. (b) Enthalpy.
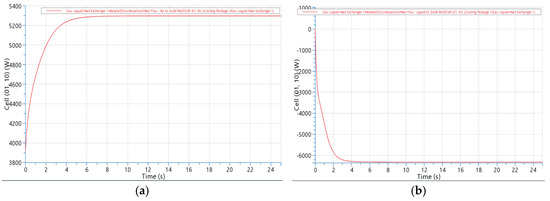
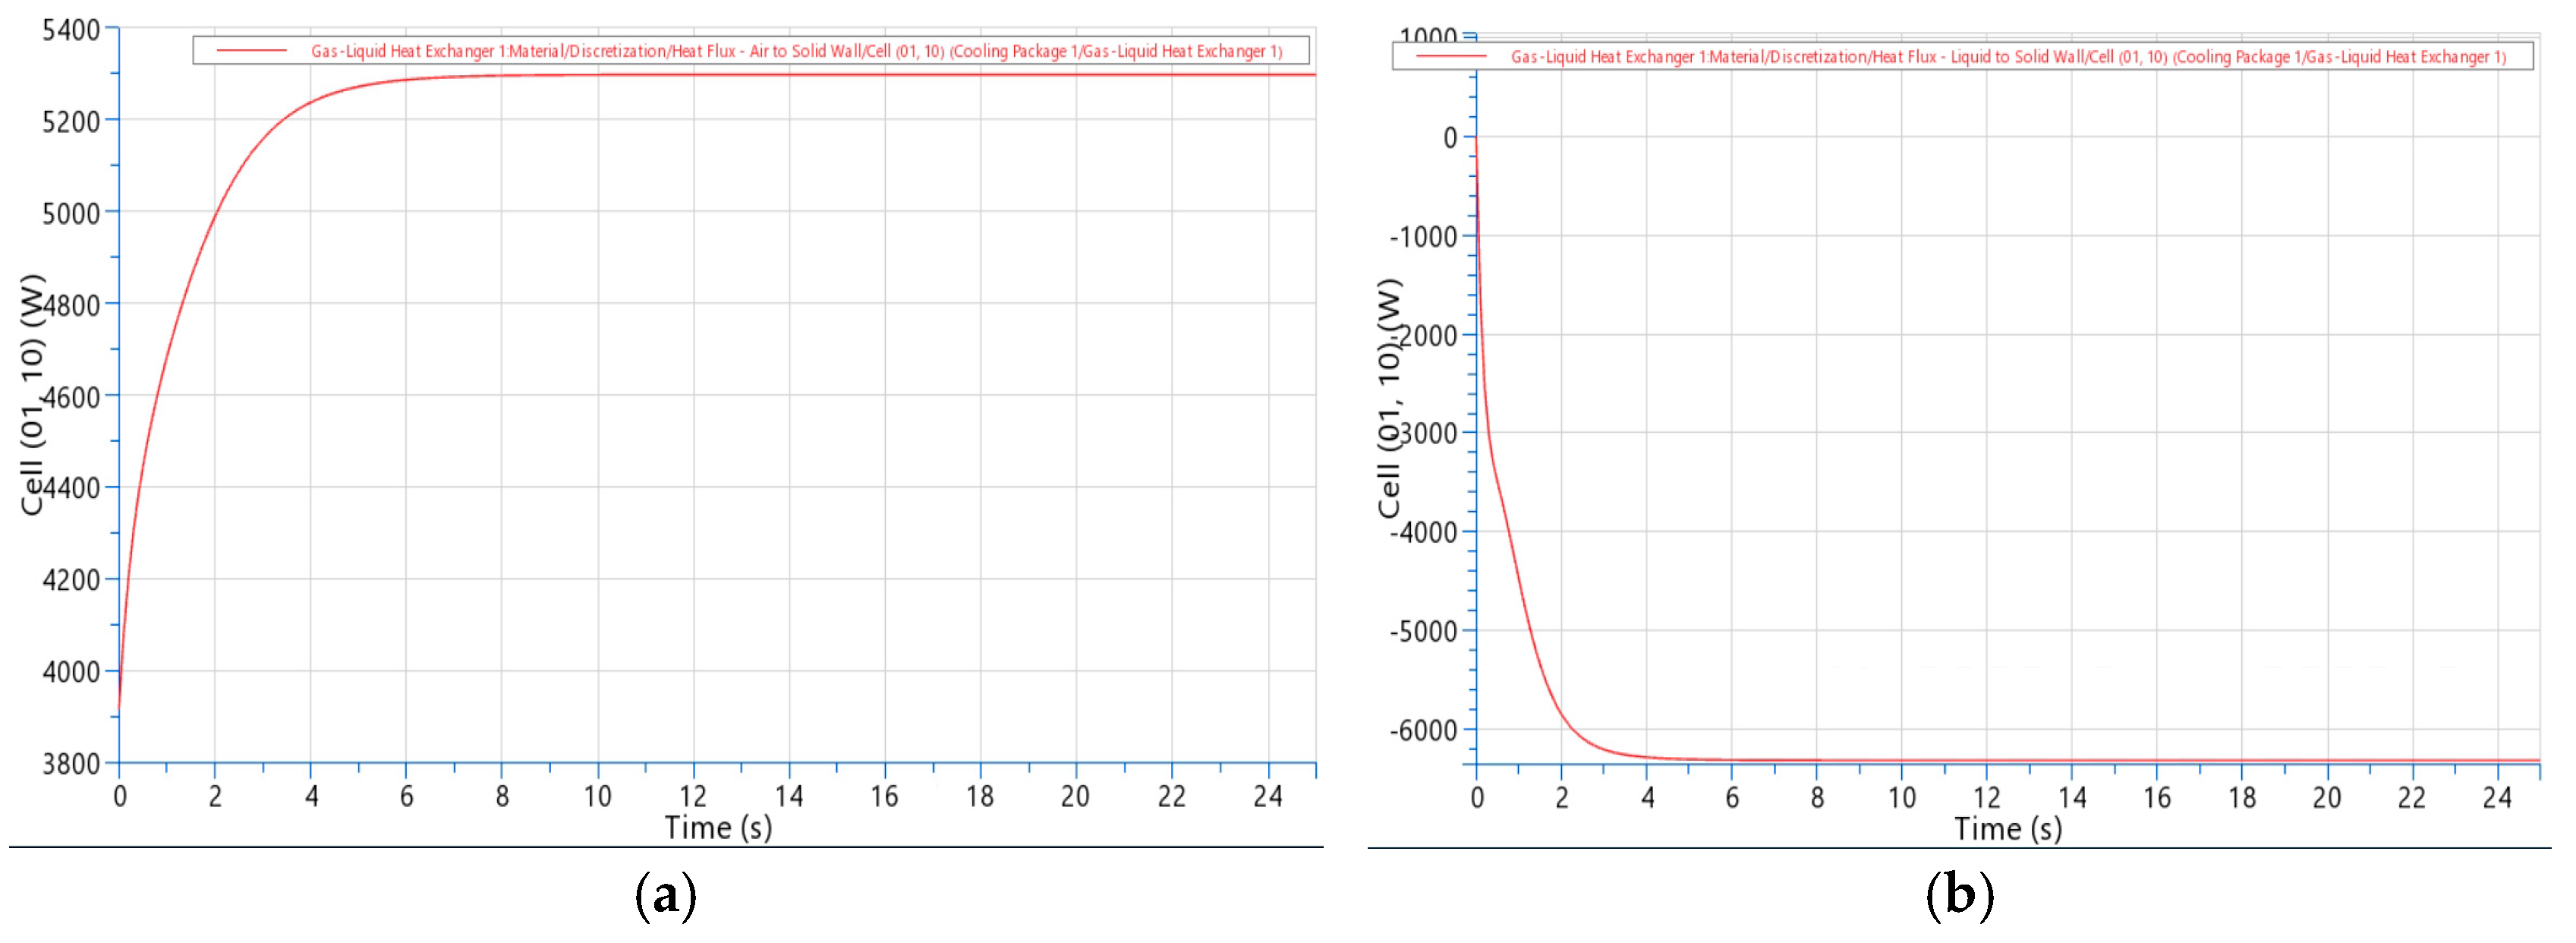
The second aspect involved verifying the correct direction and distribution of heat transfer: the hot fluid continuously releases heat to the cooler body, while the cooler body must transfer this heat to the cold fluid. This step confirms that the model reproduces the expected energy-exchange sequence of tube-and-fin heat exchangers without numerical artifacts (Figure 11).
Figure 11.
(a) Transfer from air to the heat exchanger. (b) Transfer from the heat exchanger to water.
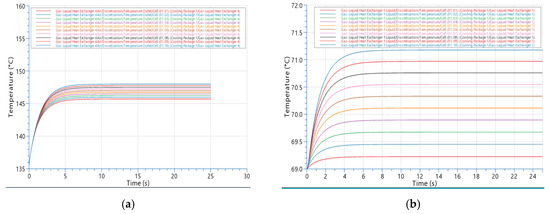
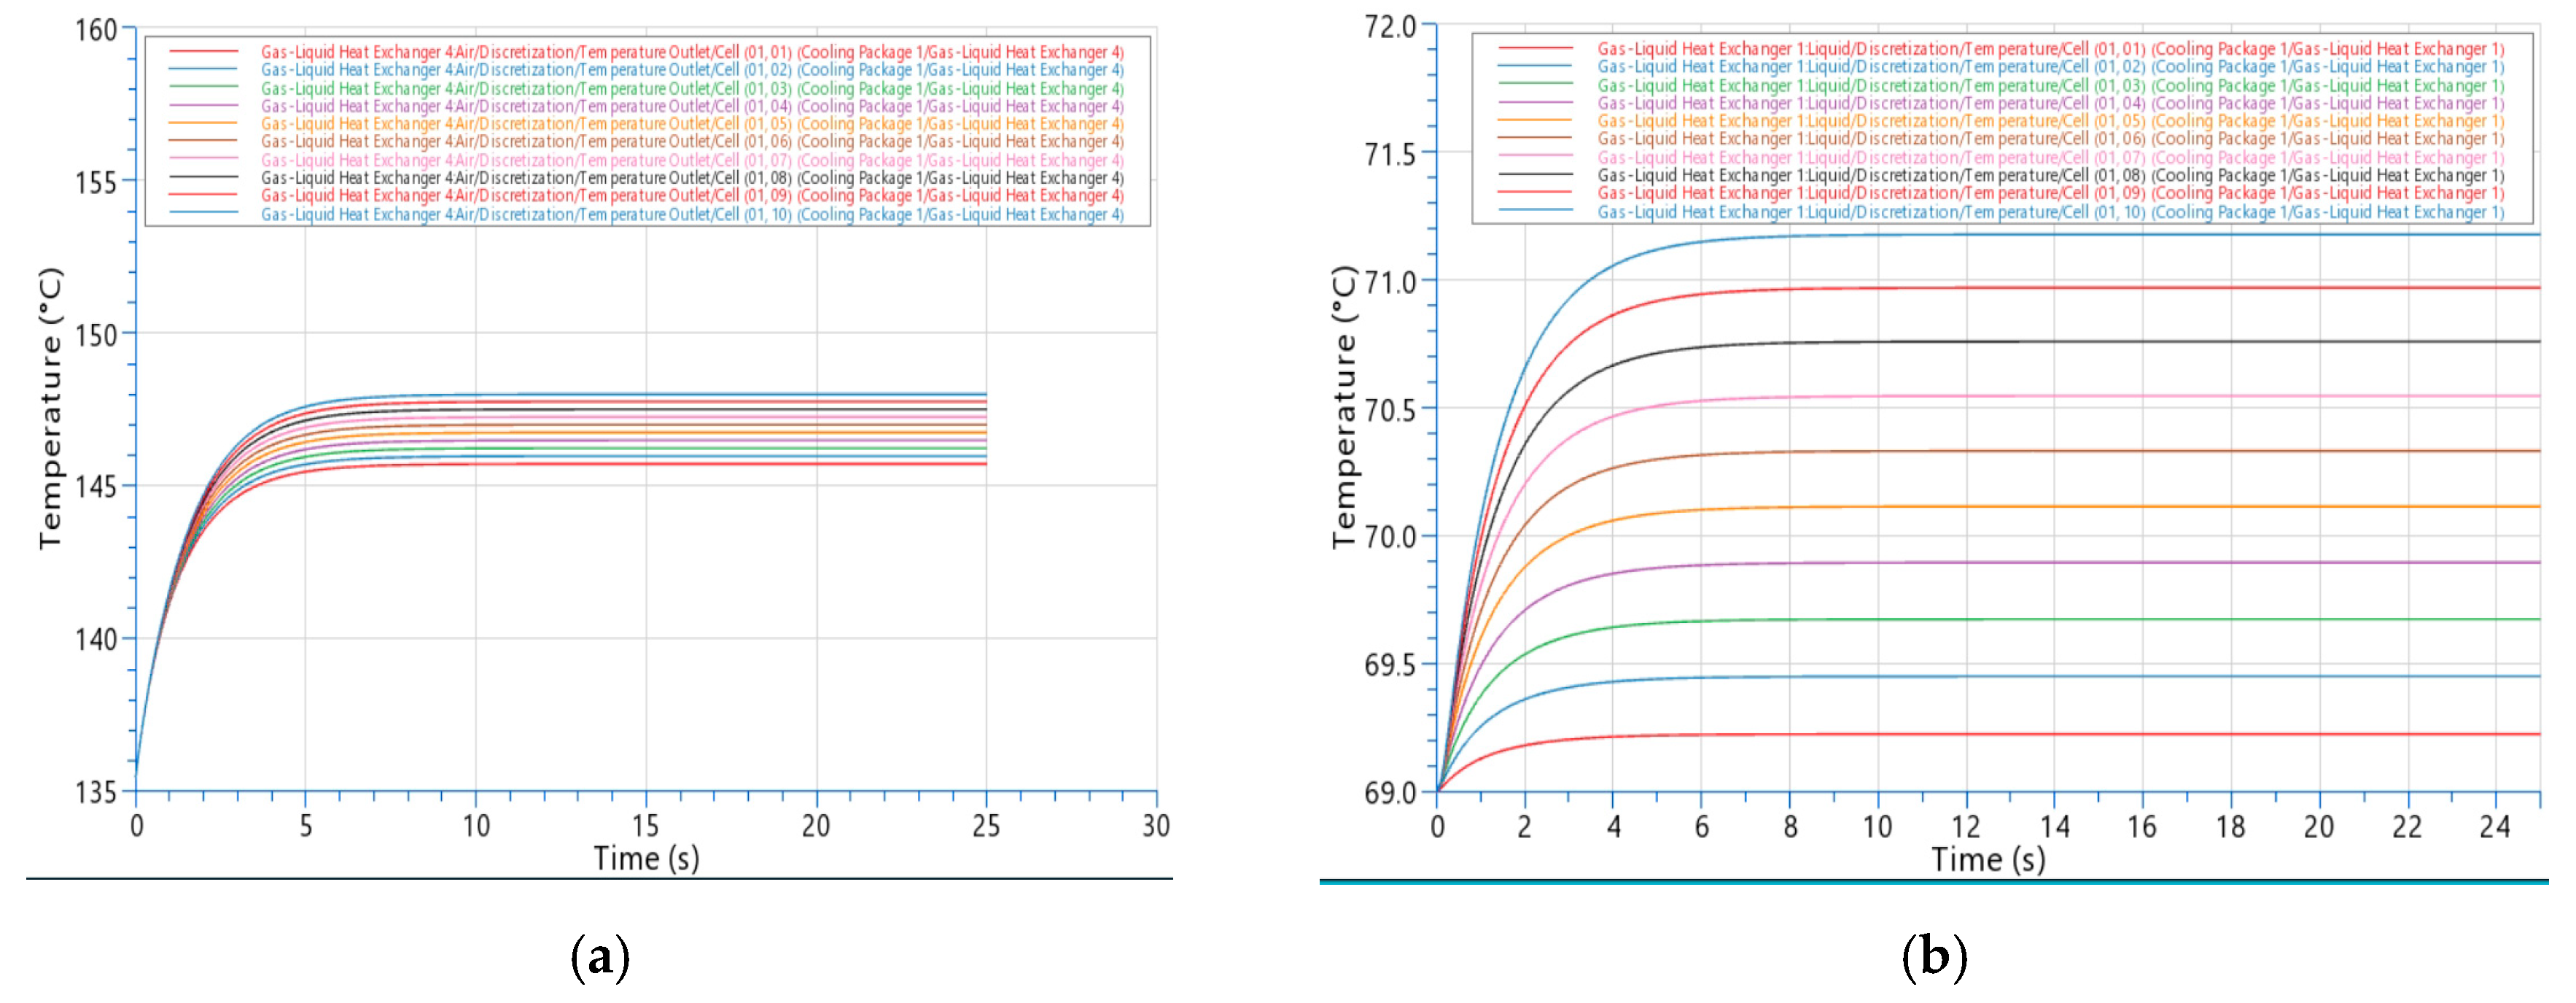
The third verification criterion consisted in monitoring the temperature decrease in the charge air and the corresponding temperature increase in the cooling water. The simultaneous observation of these trends ensures that the virtual cooler reproduces the expected thermodynamic behavior under steady-state conditions and that the imposed boundary conditions lead to a physically plausible thermal response. Thus, the cooling of the charged air and the stabilization of its temperature are tracked numerically (Table 4) and presented graphically in Figure 12.
Table 4.
Working fluid temperature for dry air (x = 0).
Figure 12.
(a) Charge-air cooling to 148 °C. (b) Water heating to 85 °C.
Following the verification of numerical stability and thermodynamic consistency, the model was calibrated against operational data from the physical cooler. This step ensures that the virtual system remains aligned with the temperature ranges and flow conditions observed in service.
The calibration of the developed virtual model was conducted using simulation parameters of the physical charge-air cooler.
The temperatures of the intake air and the cooling water are critical parameters for engine performance and protection. The fluid flow rates may vary, but temperatures must remain within defined operating limits.
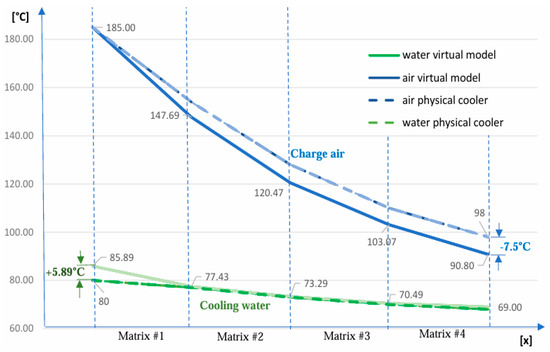
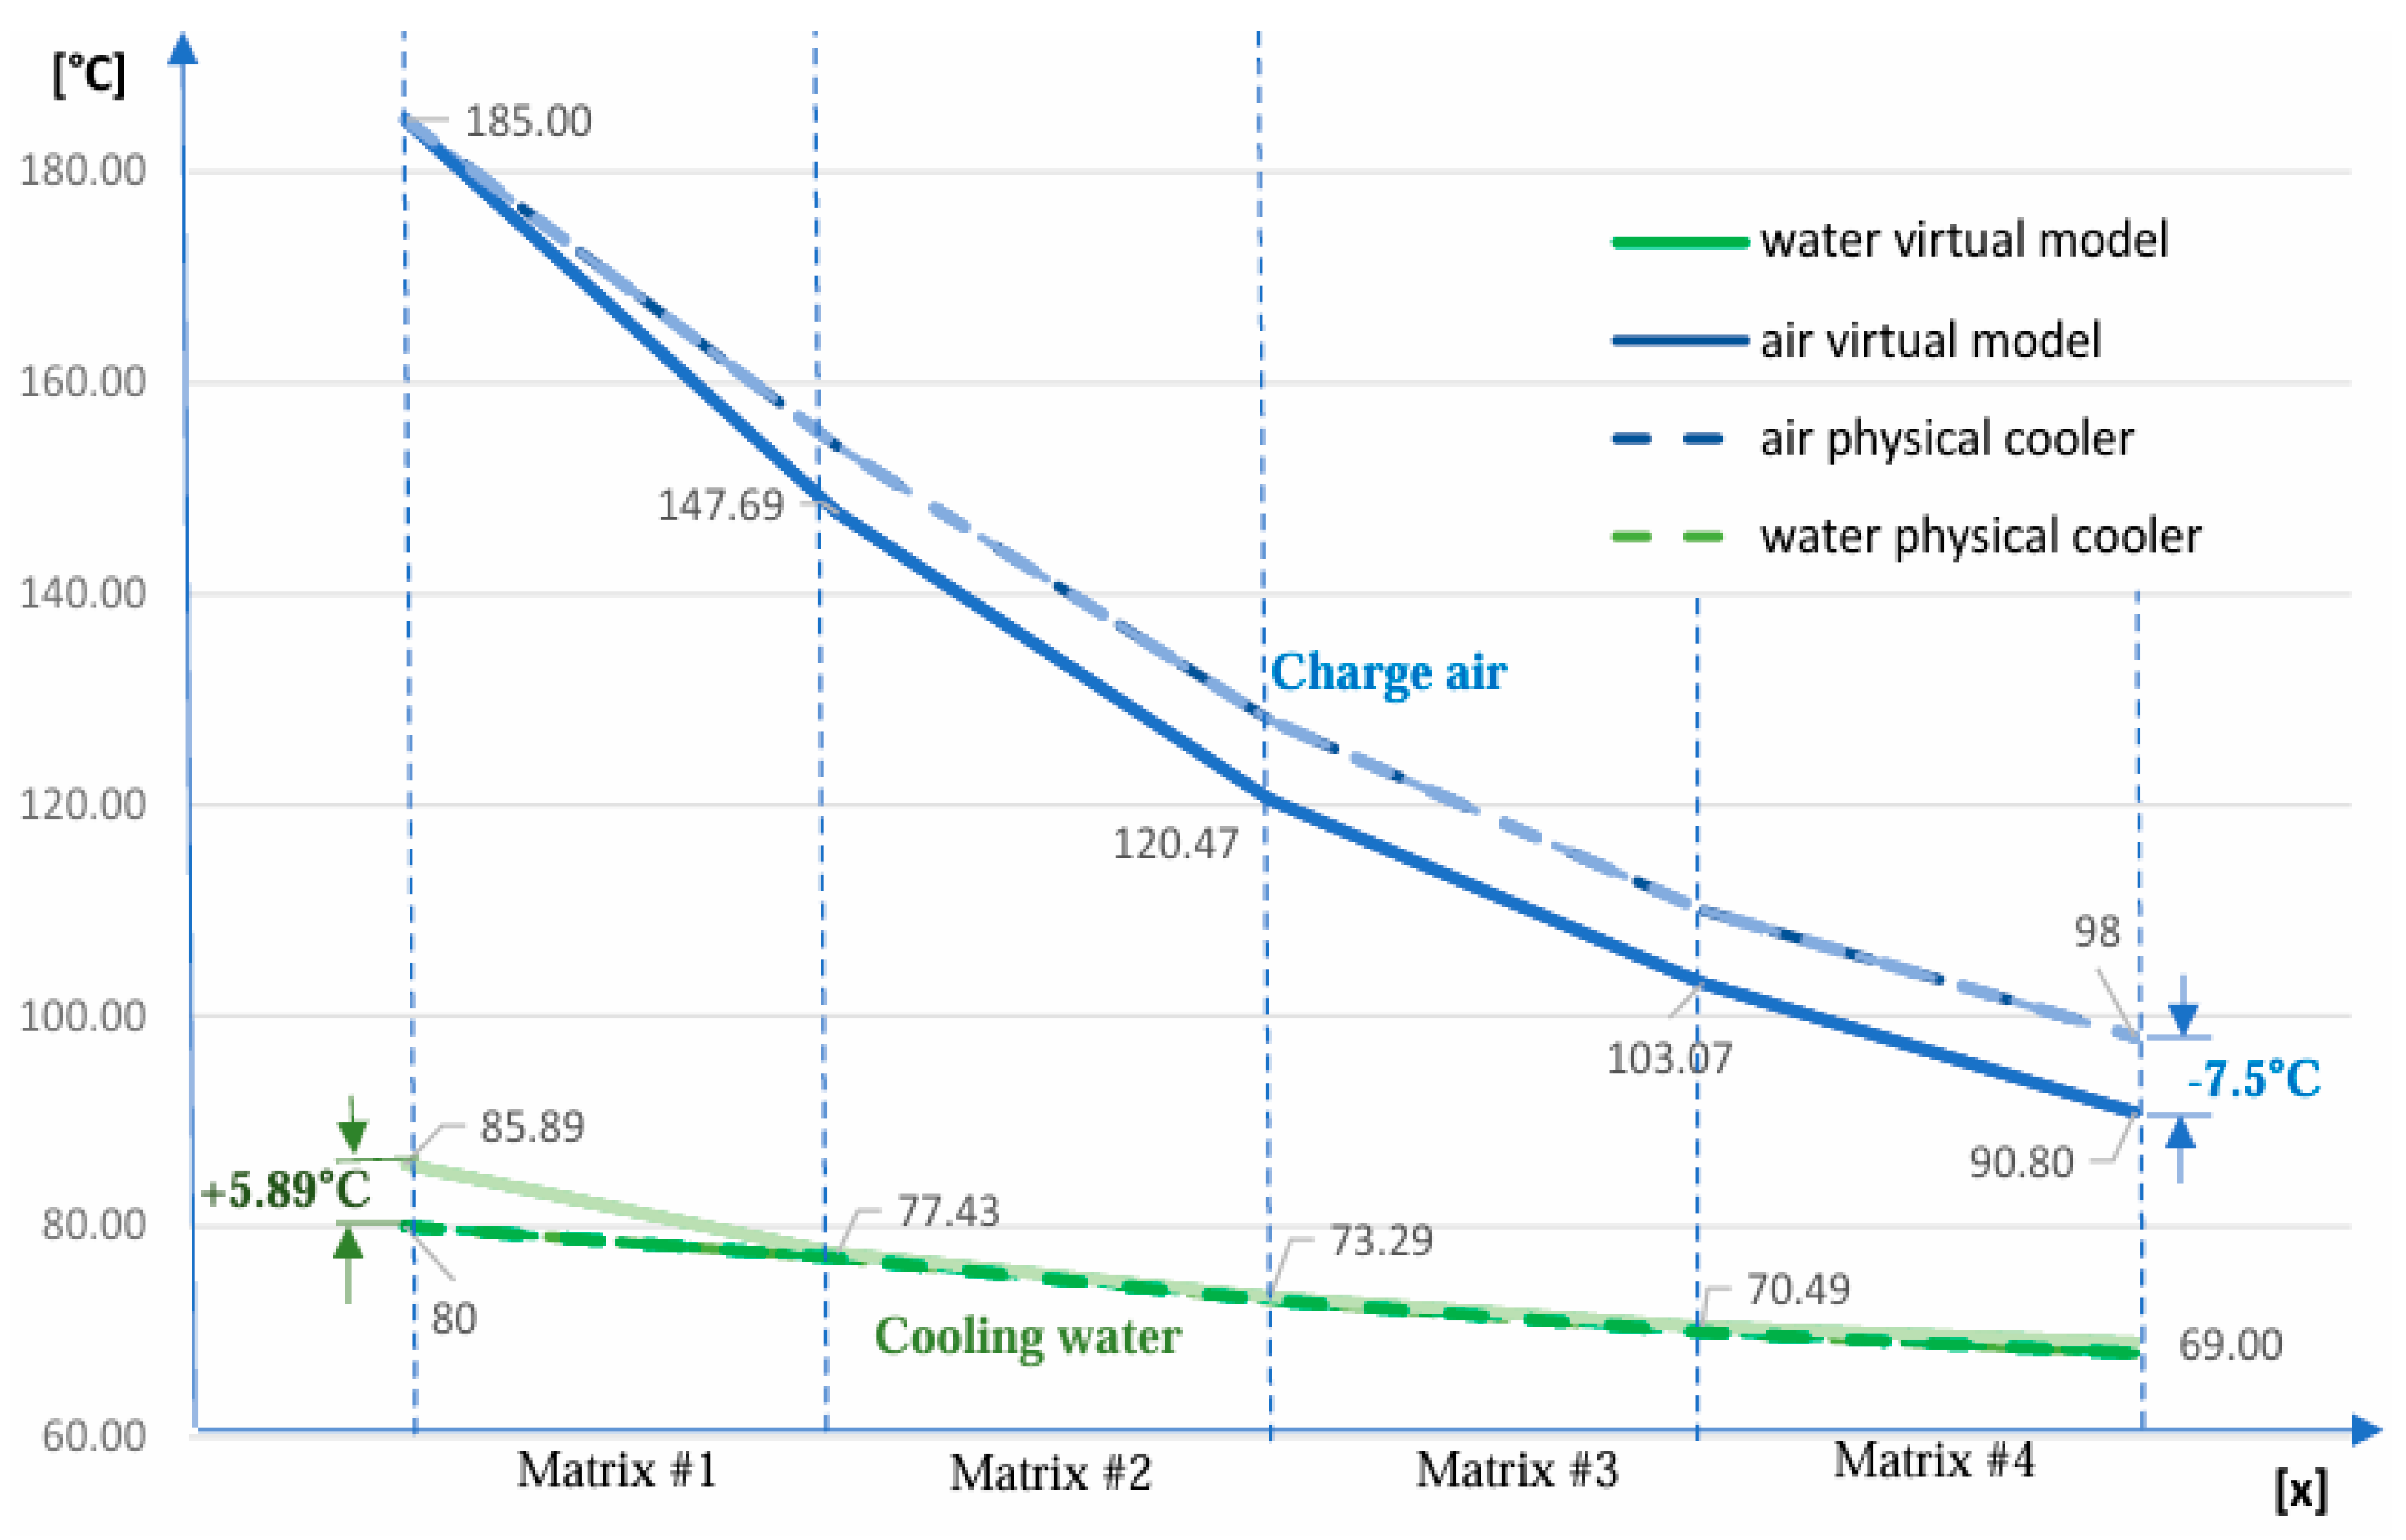
A temperature distribution profile for both working fluids (Figure 13) was generated using operational data of the analyzed charge-air cooler, together with the numerical results obtained from the simulation. This representation provides a detailed visualization of the thermal evolution along the heat-exchanger and serves for calibration of the virtual model.
Figure 13.
Working fluid temperature.
The results show that the AVL CRUISE virtual cooler reproduces the temperature range of the ALCO aftercooler with small deviations of approximately 7% at the fluid outlets. The intake-air outlet temperature in the numerical model is 7.5 °C lower than the operating value (98 °C), while the cooling-water outlet temperature is 5.89 °C higher than the physical value (80 °C), yet still within the engine’s permissible limits. With the calibrated model established, a formal validation was performed using effectiveness and efficiency metrics to assess the intrinsic heat-transfer capability of the virtual cooler relative to the physical unit. The calibration of the model was performed considering the engine’s full-load operating condition at 3900 HP/1100 rpm based on the typical heat balance offered by the ALCO supplier.
Validation of the virtual charge-air cooler was performed using two complementary thermodynamic formulations: the classical cooling-effectiveness approach and the heat-exchanger efficiency concept. Together, these methods provide a robust framework for assessing whether the numerical model reproduces both the observable thermal behavior and the intrinsic heat-transfer characteristics of the real cooler. This dual evaluation ensures that the simulated system accurately reflects the unit’s capability to transfer heat under identical operating conditions.
The validation procedure employed the reference thermodynamic parameters listed in Table 5.
Table 5.
Temperature values.
By substituting the measured and simulated temperatures into the cooling-effectiveness relation (7), the resulting values show that the virtual cooler attains an effectiveness of 0.814, approximately 2% higher than the physical unit (0.797). This small deviation demonstrates that the numerical model successfully reproduces the thermal response of the real heat exchanger.
For the assessment of the cooler’s intrinsic thermal performance, the minimum heat-capacity rate was taken as Cmin = Cwater = 5733 J/sK, while the overall heat-transfer coefficient U was obtained from the AVL CRUISE simulation environment. These parameters yielded a conductance value corresponding to an equivalent NTU of 0.571.
The value of U provided by AVL CRUISE represents an ideal clean-surface condition, as the model does not include air-side fouling or water-side scaling. In real operation, deposit formation increases the total thermal resistance, resulting in a lower overall heat-transfer coefficient and, consequently, a reduced efficiency of the physical cooler compared with the virtual model.
Considering a heat-capacity ratio of Cr = 0.181, the efficiency of the virtual cooler, determined using relation (8), was calculated as η = 0.771.
In conclusion, the cooling effectiveness and overall efficiency of the AVL CRUISE virtual cooler were evaluated against the performance of the physical charge-air cooler. The comparative analysis confirms that the numerical model meets all operational requirements and exhibits thermal behavior consistent with the real unit. Therefore, the validated model can be reliably employed in subsequent simulations and research investigations.
After confirming that the virtual cooler accurately reproduces the behavior of the real unit under dry-air conditions, the model was extended to investigate the influence of intake-air humidity. This analysis is essential for marine applications, where ambient moisture levels vary significantly.
Humidity is a fundamental thermodynamic property of atmospheric air that significantly influences the behavior of the working fluid in a turbocharged diesel engine. Intake air consists primarily of nitrogen and oxygen, but also contains water vapor, trace gases, and suspended particles [20]. The mixture of dry air and water vapor is referred to as moist air, with properties depending on temperature, pressure, and vapor content.
Air humidity may be expressed as absolute humidity (the ratio between the mass of water vapor and the mass of dry air) or relative humidity (the ratio between the actual amount of water vapor in the air and the maximum amount the air can retain at a given temperature).
The absolute humidity (x), also known as the degree of humidity or moisture content, is the ratio between the mass of water vapor (mw.v) and the mass of dry air (md.a):
where:
| x | absolute humidity |
| Mw.v | molar mass of the water vapor |
| Md.a | molar mass of the dry air |
| pw.v | partial pressure of water vapor |
| pd.a | saturation pressure of water vapor |
It represents the mass of water vapor contained in a moist air sample that includes 1 kg of dry air. Absolute humidity at the saturation state is determined by the equation:
The relative humidity (φ) of moist air is the ratio between the amount of vapor present in the air and the maximum amount of water vapor that the air can absorb at that temperature:
or the ratio between the partial pressure of water vapor and the saturation pressure.
The saturation degree (ψ) is defined by the relation:
in practice, ψ is considered equal to φ. From this, it is follows that the absolute humidity can also be determined using the relation:
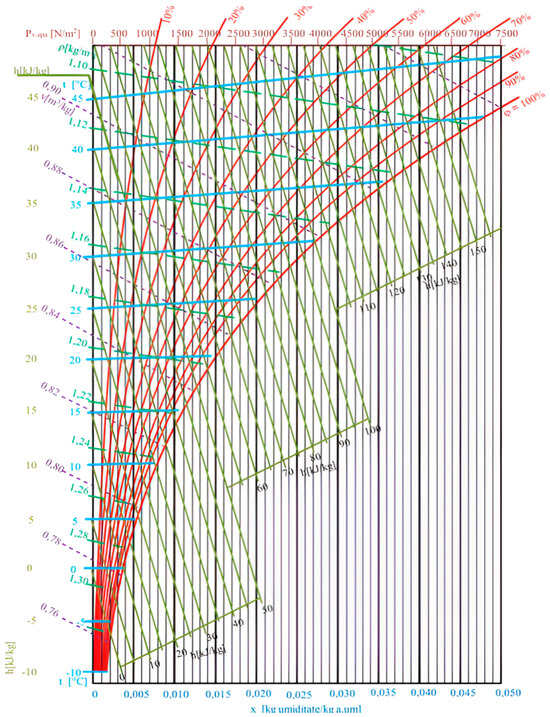
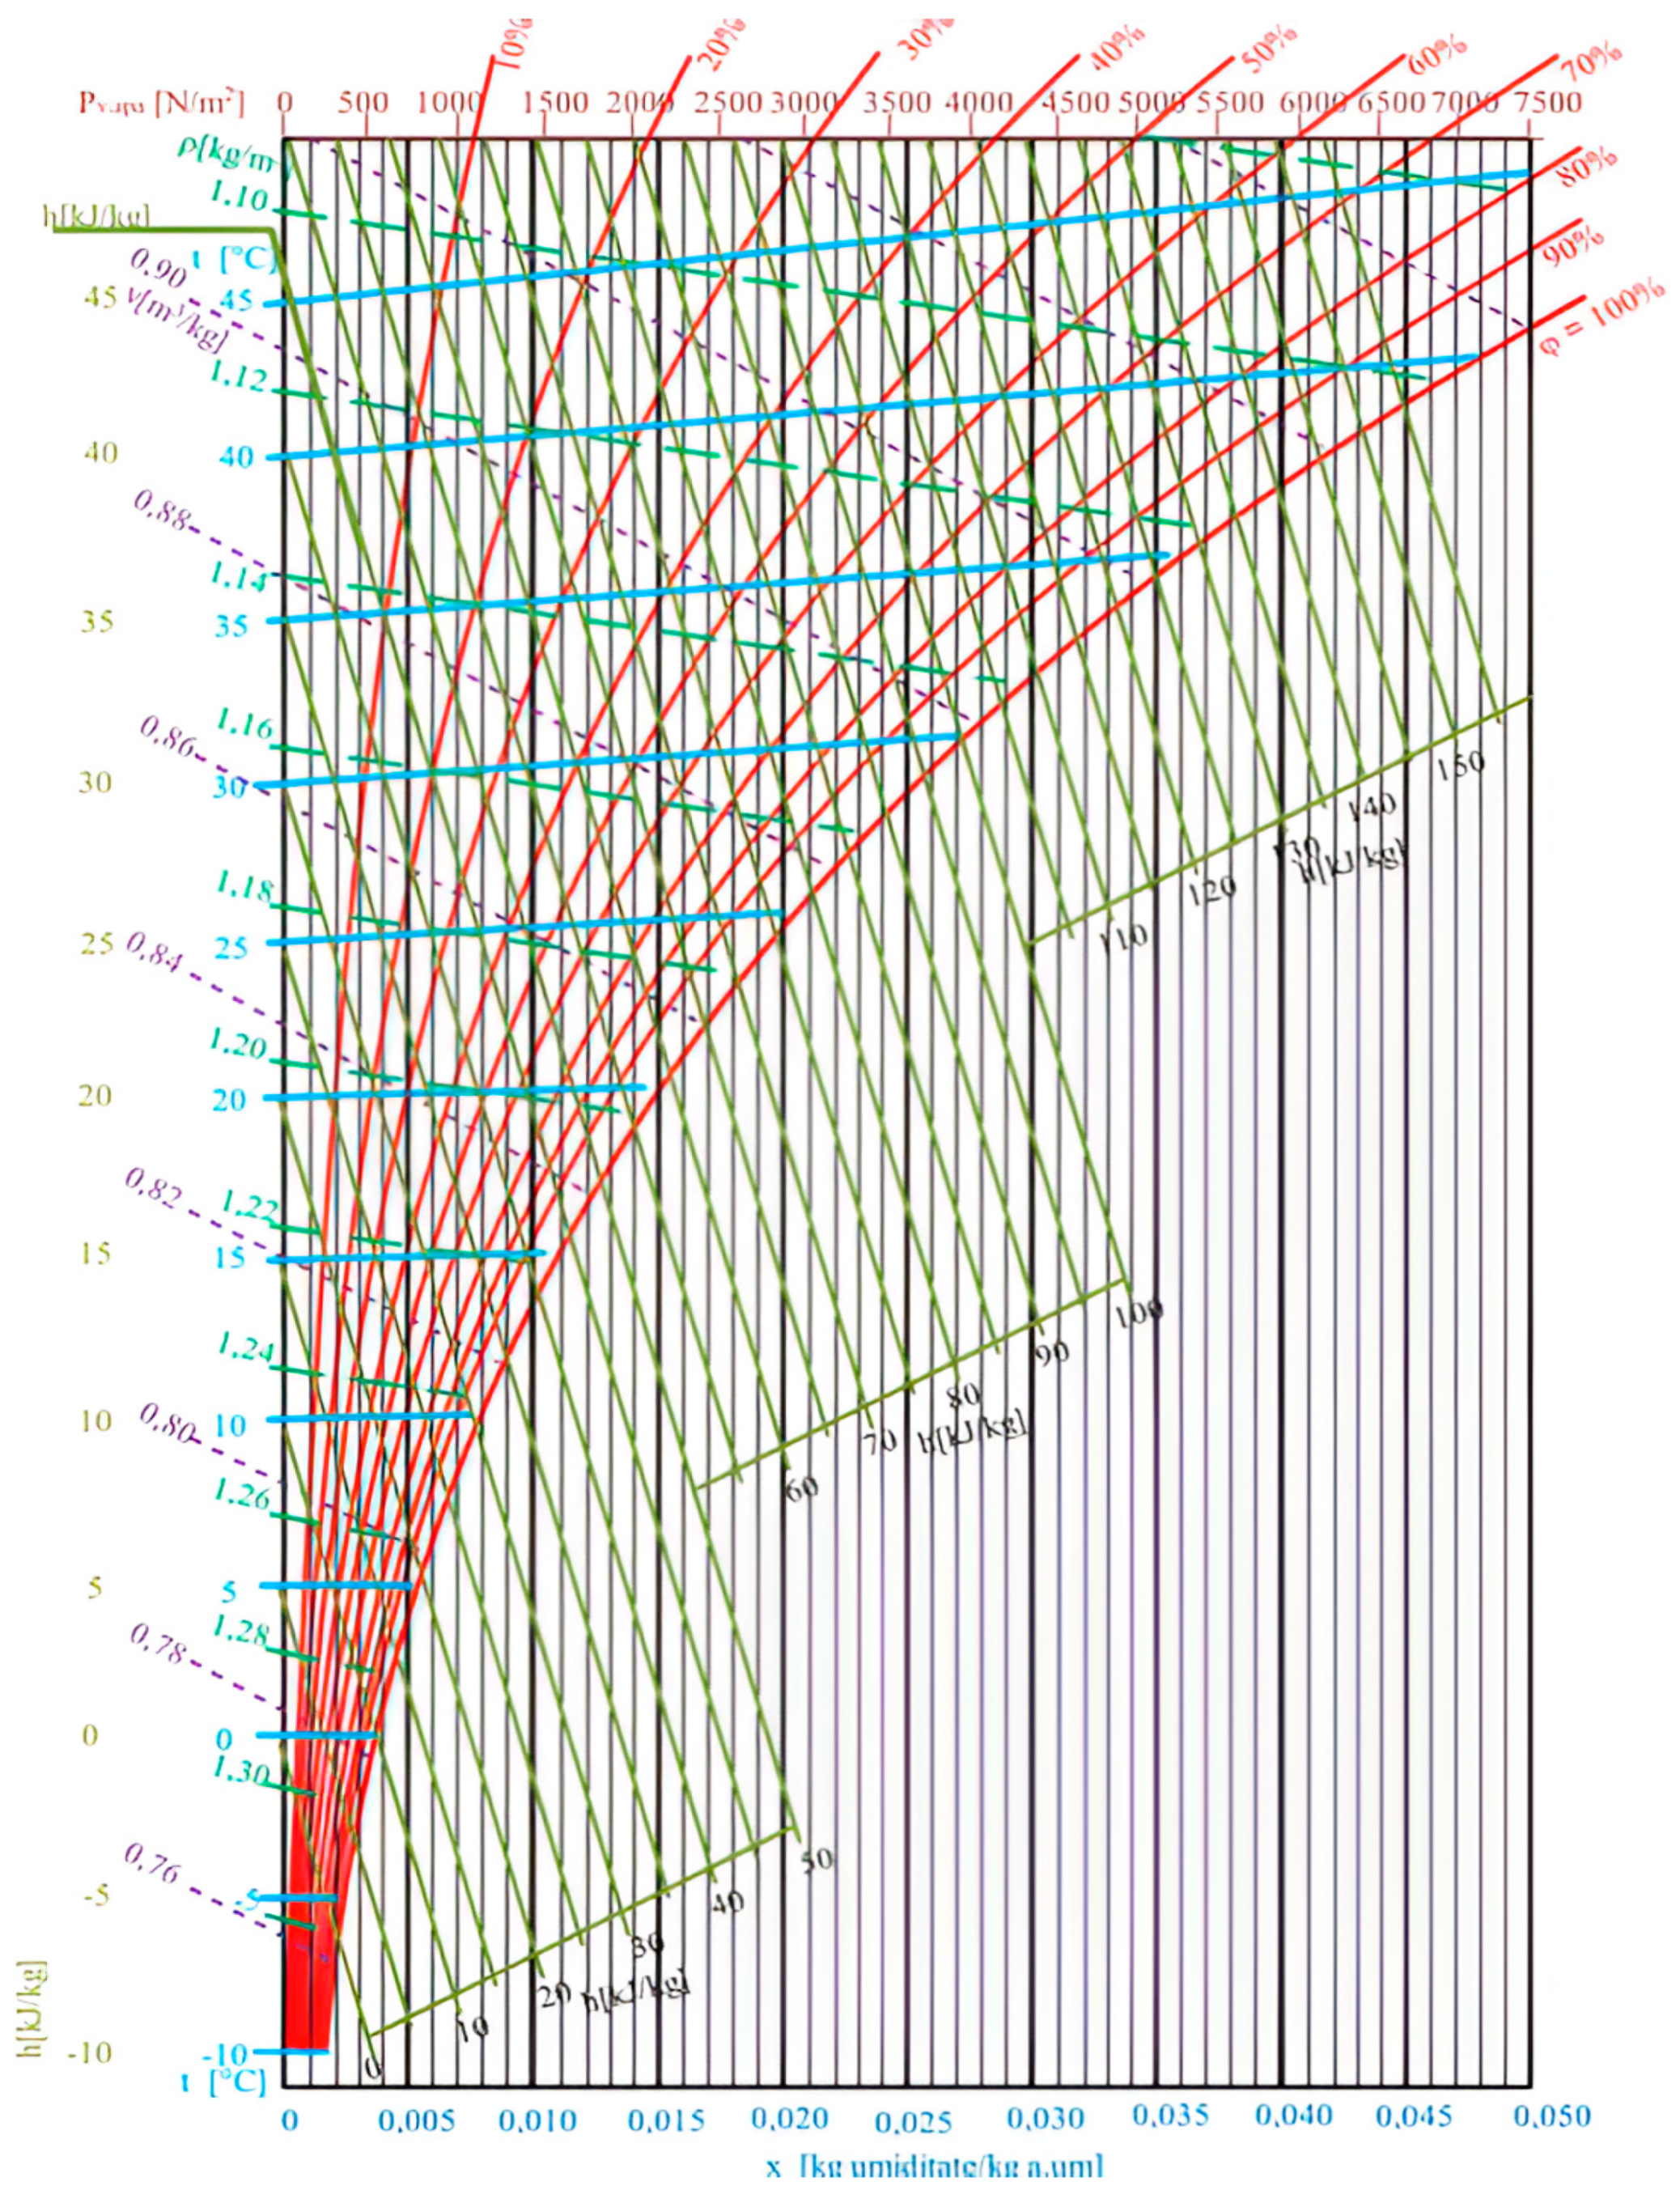
For the analysis of moist-air processes, the Mollier h–x diagram remains the most widely used graphical tool (Figure 14), providing a comprehensive representation of the thermodynamic state of humid air and enabling accurate evaluation of enthalpy variations associated with cooling phenomenon [21].
Figure 14.
The Mollier diagram.
Humidity significantly alters the thermophysical properties of the charge air and, implicitly, the thermal load imposed on the aftercooler. The model does not take into account the effect of latent heat release when moisture condenses on the cold fin surfaces during the cooling process. While the calibration and validation of the numerical model were performed under dry-air conditions, real marine operations involve continuous variations in absolute humidity. To capture this operational reality, the validated AVL CRUISE model was subsequently subjected to simulations with humid intake air.
This approach enables the determination of the aftercooler’s behavior under realistic ambient conditions and provides a direct assessment of its capacity to maintain stable outlet temperatures when the moisture content of the intake air corresponds to the actual ambient environment encountered during marine operation.
3. Results and Discussion Concerning the Impact of Humidity on Charge–Air Cooling Performance
For the functional analysis of the charge-air cooler, it was assumed that the cooling water contains no corrosion inhibitors or glycols. In the simulation, only the absolute humidity of the air was varied. The absolute humidity values were derived from the Mollier diagram (Figure 14), ranging from dry air (x = 0) to the maximum value (x = 0.05). The software automatically adjusts the nitrogen and oxygen fractions so that, combined with the water vapors, a relative humidity of φ = 100 is achieved.
Increasing the absolute humidity of the intake air leads to a reduction in the cooling performance of the charge-air cooler. Under dry-air conditions (x = 0), the outlet temperature reaches 90.5 °C, with an effectiveness of ε = 0.814 and an efficiency of η = 0.771. When the humidity increases to x = 0.05, the outlet temperature rises to 91.2 °C, while the effectiveness and efficiency decrease to ε = 0.808 and η = 0.766, respectively.
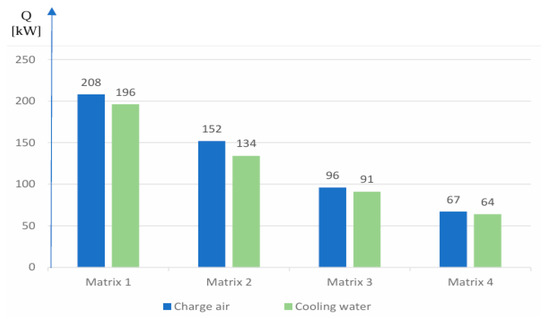
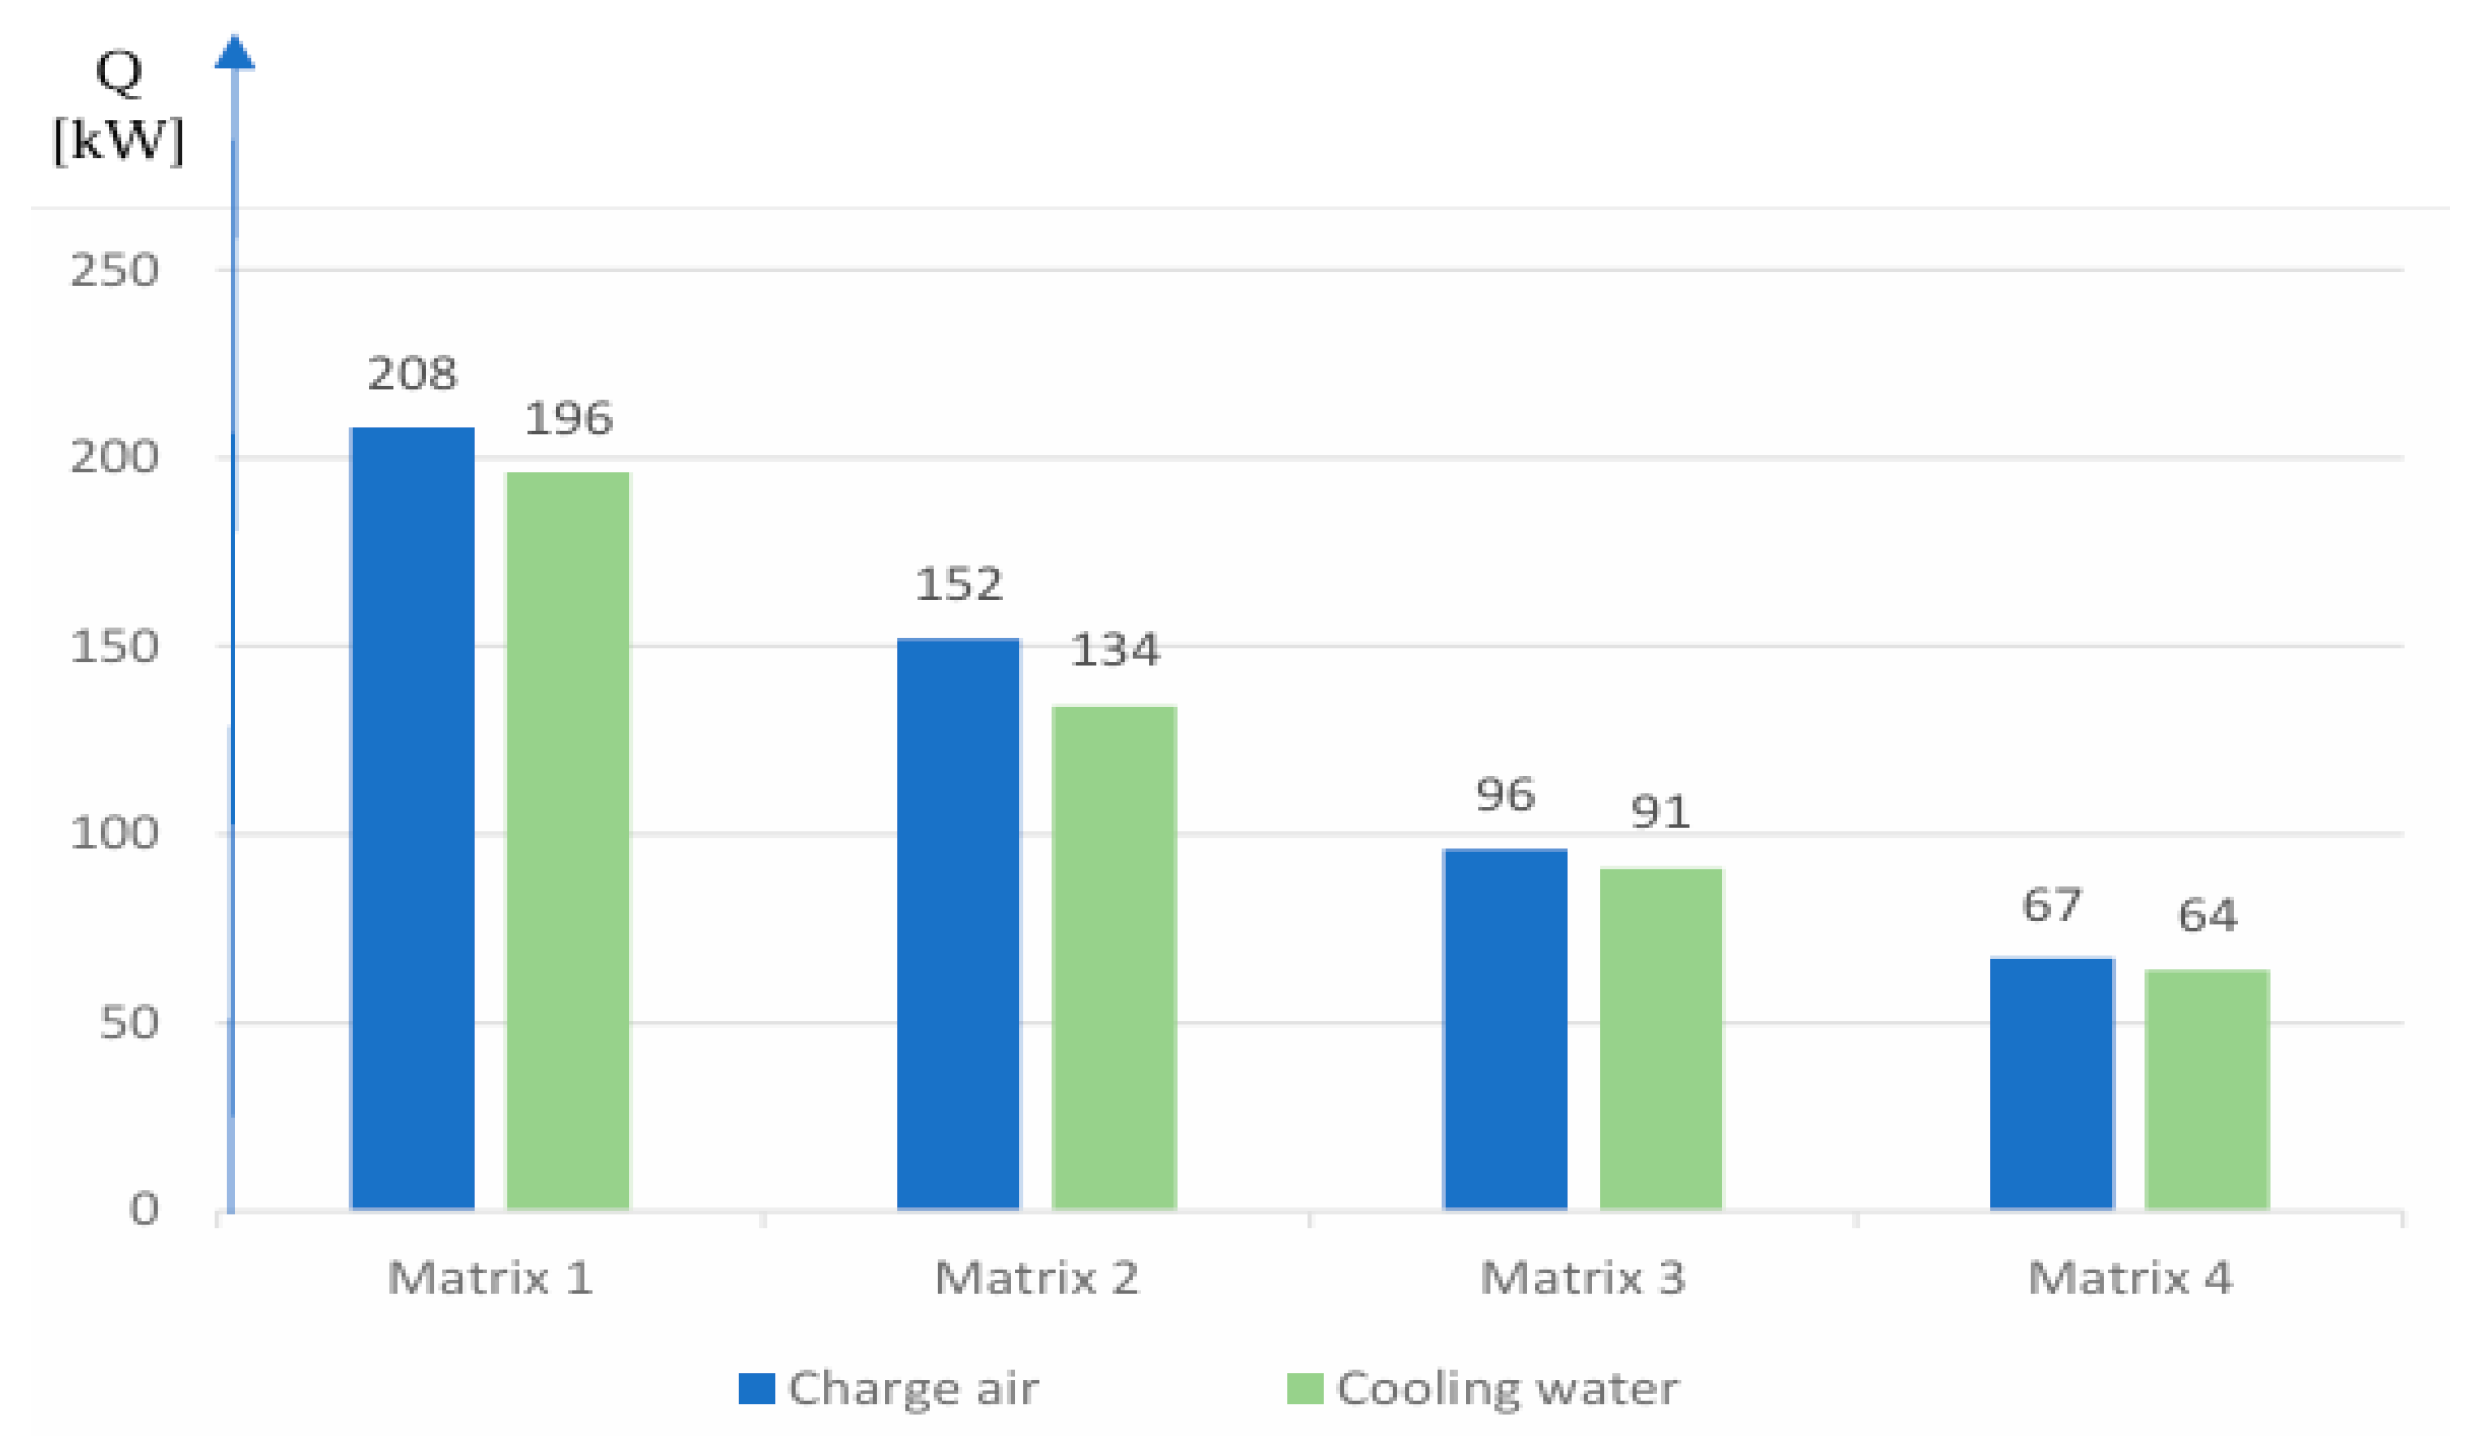
The evolution of the charge-air cooling process in the computational model was evaluated for each cooling matrix based on the amount of heat transferred. As shown in Figure 15, the thermal load of charge air (Q_air = 523 kW) is transferred to the cooling water (Q_water = 485 kW) in a distribution typical of multi-pass heat exchangers: approximately 39% of the total heat is removed in the first cooling stage and 29% in the second. The heat-transfer intensity decreases in the subsequent passes, where the remaining thermal load is extracted more uniformly, with contributions of 18% and 13%, respectively.
Figure 15.
Heat-transfer process.
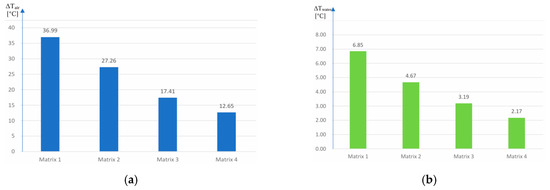
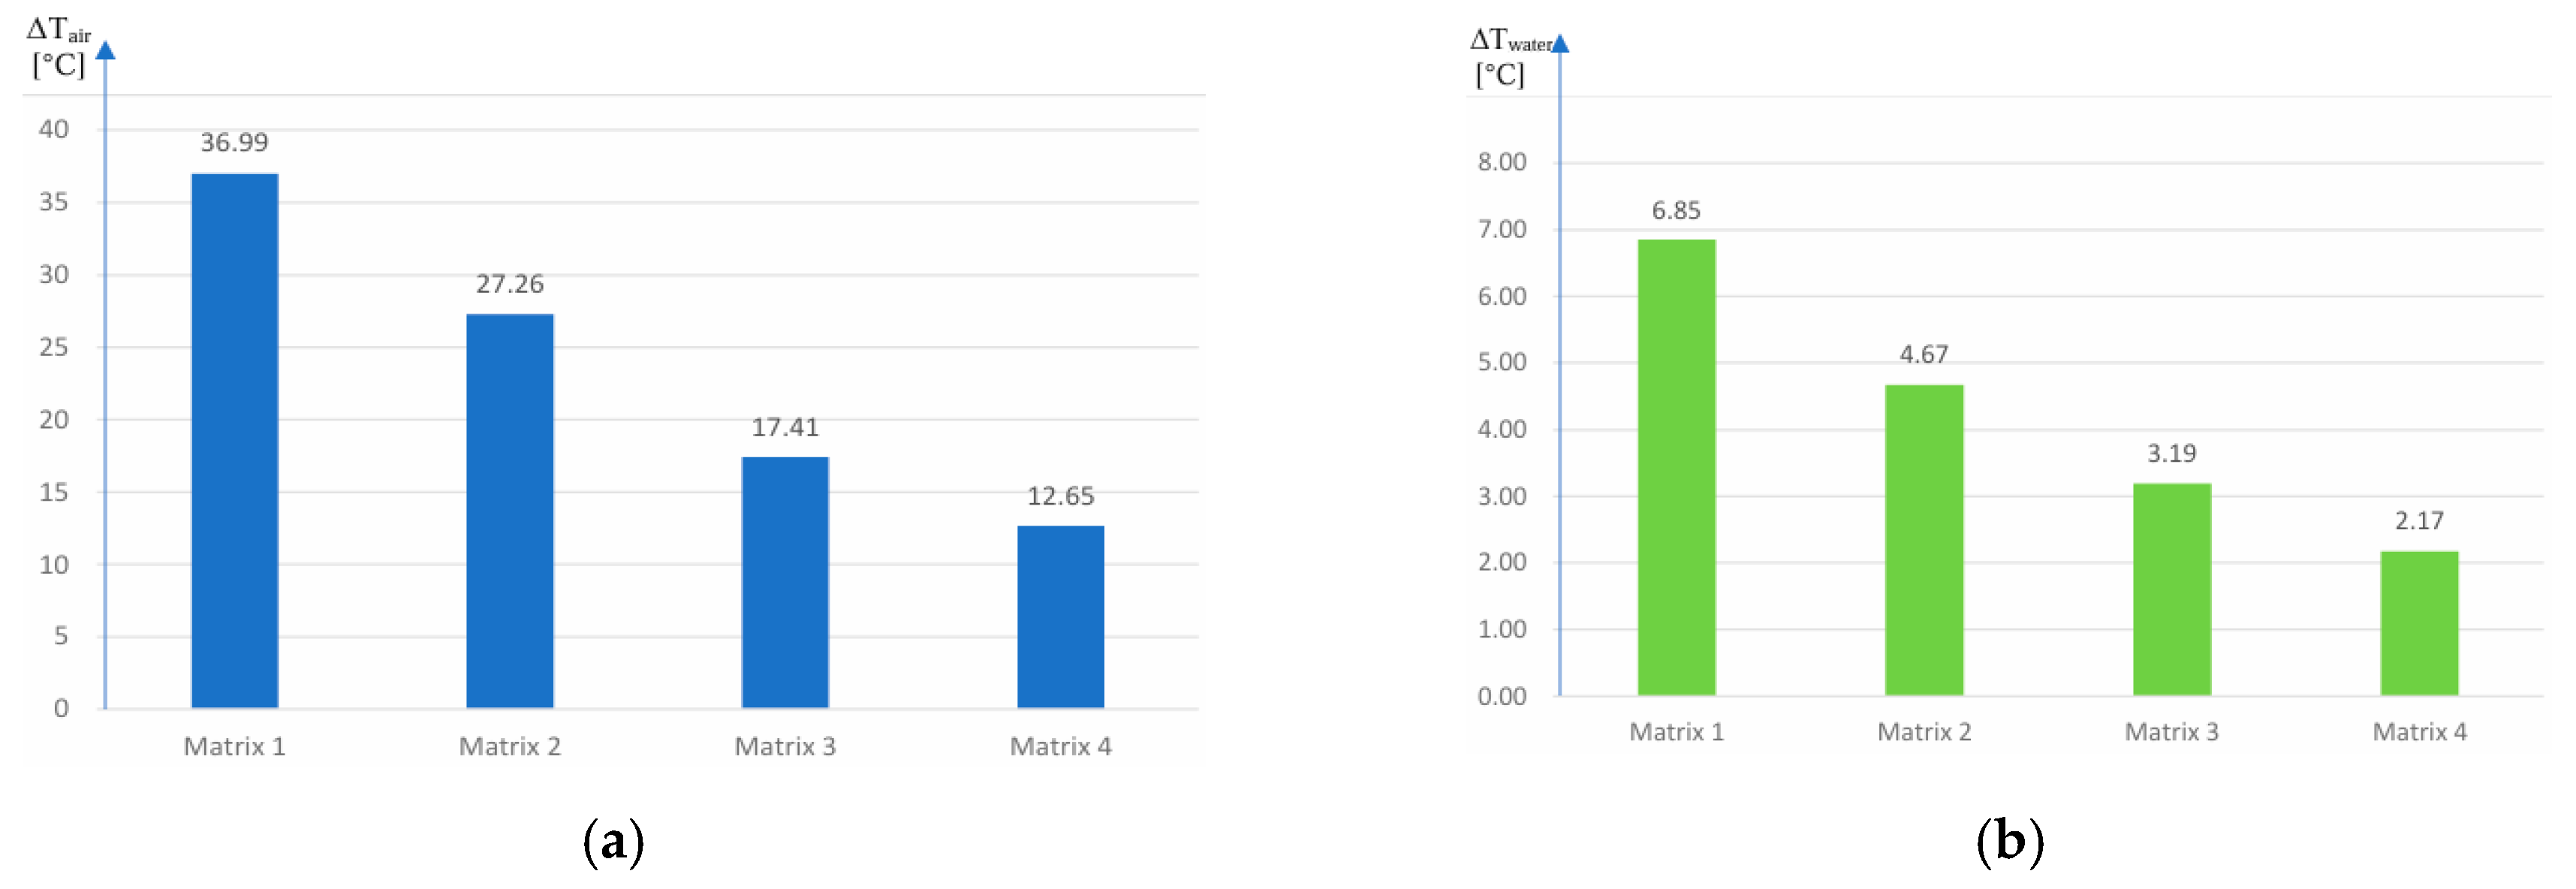
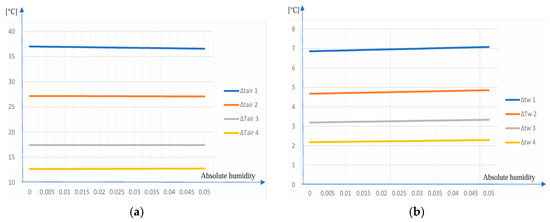
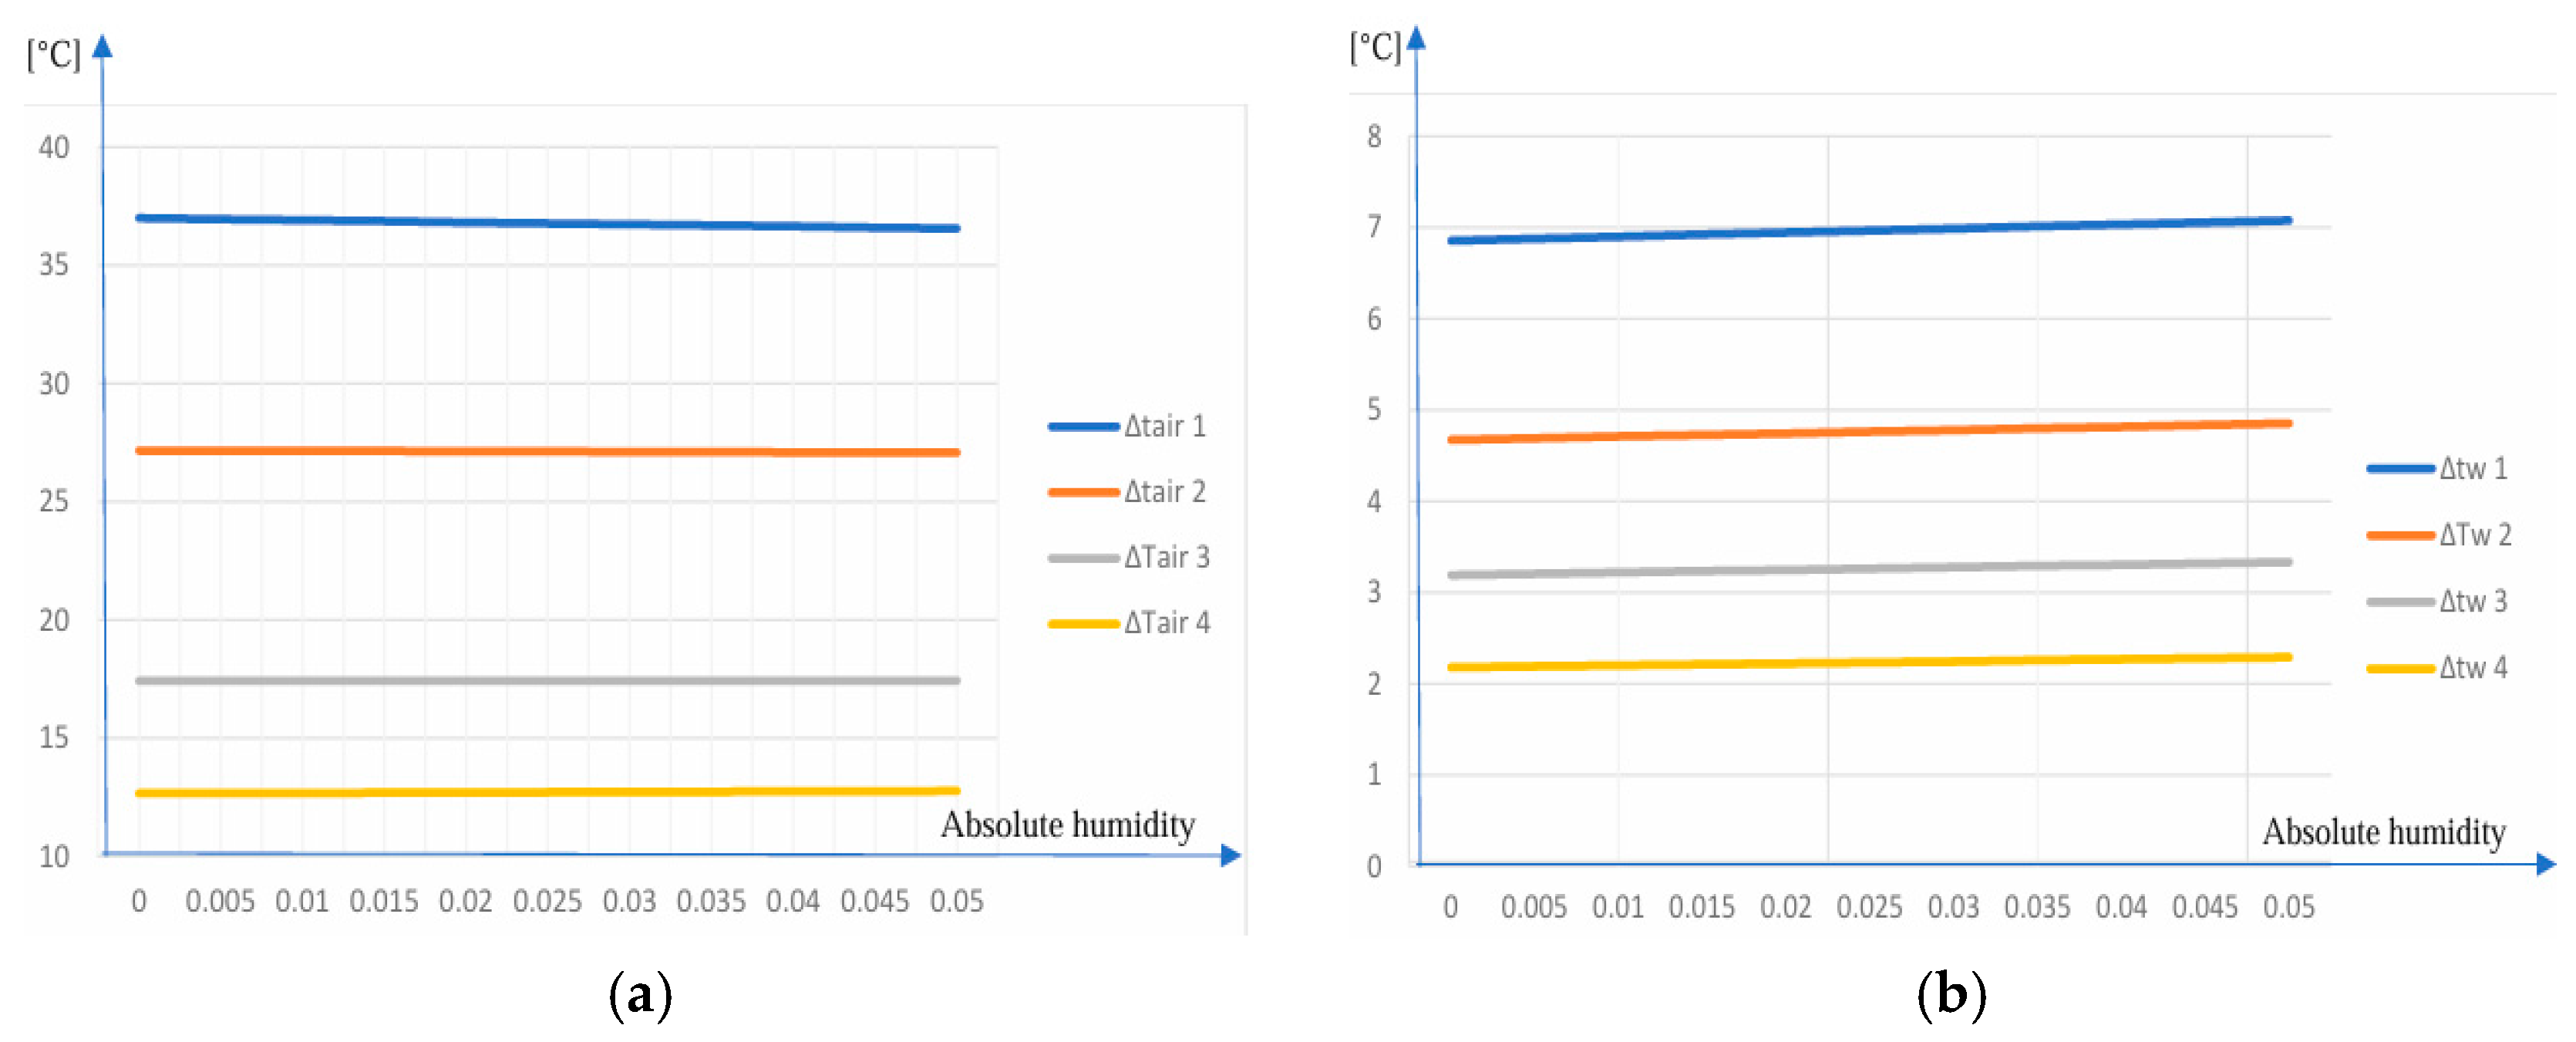
In cooling matrix 1, the largest temperature differences between the working fluids were recorded. The charge-air temperature decreases by ΔTair = 37 °C (Figure 16a), while the cooling-water temperature increases by ΔTwater = 6.85 °C (Figure 16b). An increase in the absolute humidity of the intake air results in a 0.44 °C rise in the air outlet temperature from this matrix and a 0.65 °C increase in the cooling-water temperature.
Figure 16.
(a) ΔTair evolution. (b) ΔTwater evolution.
In cooling matrix 2, the temperature gradients between the working fluids decrease compared with the first stage. The charge-air temperature drops by ΔTair = 27.16 °C, while the cooling-water temperature increases by ΔTwater = 4.67 °C. A rise in absolute humidity produces a modest increase of 0.33 °C in the air outlet temperature and 0.48 °C in the water outlet temperature.
In the third cooling matrix, the heat-transfer intensity continues to decline as the thermal approach between the fluids narrows. The air temperature decreases by ΔTair = 17.18 °C, and the cooling-water temperature rises by ΔTwater = 3.19 °C. Under humid-air conditions, the outlet temperatures increase slightly, by 0.21 °C for the charge air and 0.31 °C for the cooling water.
In the final cooling matrix, the smallest temperature differences are recorded. The charge-air temperature decreases by ΔTair = 12.66 °C, while the cooling-water temperature increases by ΔTwater = 2.18 °C. The influence of humidity remains limited, with increases of only 0.14 °C in the air outlet temperature and 0.19 °C in the water outlet temperature.
The variations in the temperature differences (as a function of absolute humidity) for the two fluids are shown in Figure 17. The temperature difference inlet–outlet ΔT values of the fluids, depending on the absolute humidity, are presented in Table 6.
Figure 17.
(a) ΔTair influenced by absolute humidity. (b) ΔTwater influenced by absolute humidity.
Table 6.
ΔT Working fluids.
The increase in air humidity produces a steady rise in the cooling-water temperature; this rise accumulates as the flow passes through each matrix and reaches a maximum value of 0.657 °C. As the air is cooled, the water temperature increases by 16.89 °C, reaching a final value of 85.89 °C. The obtained results show that the cooler model configured in AVL CRUISE achieves the air-cooling temperature required for optimal engine operation and exhibits stable behavior under humidity variations. Moreover, air humidity has only a minimal influence on the outlet temperatures of both working fluids.
These findings confirm the robustness of the virtual cooler under realistic ambient conditions and provide a solid basis for evaluating its operational performance. Building on these results, the following conclusions summarize the main outcomes of the study and highlight the implications for the design and optimization of charge-air cooling systems in large marine diesel engines.
The results obtained using a simplified numerical model of the ALCO charge-air cooler establish a baseline for future research: the simplified model developed here will be refined and calibrated once experimental measurements on the real cooler become available, enabling a more comprehensive evaluation across variable engine loads and environmental conditions.
4. Conclusions
The theoretical investigations conducted using the AVL CRUISE simulation environment demonstrate that the charge-air cooler installed on the ALCO V16 251F (USA) marine diesel engine operates stably and predictably under varying humidity conditions. Although the intake air drawn from a marine environment may contain significant amounts of water vapor, the results show that humidity exerts only a minor influence on the thermal behavior of the cooler and on the final temperature of the charge-air supplied to the engine.
Across the full range of absolute humidity values analyzed (from x = 0 to x = 0.05), the charge-air outlet temperature remains approximately constant at 90.77 °C, with a maximum deviation of only 0.413 °C (0.45%). Similarly, the cooling water outlet temperature remains stable at around 85.89 °C, with a maximum increase of 0.65 °C (0.76%). These small variations confirm that the air-cooler possesses sufficient thermal capacity to compensate for humidity-induced changes in air enthalpy.
The virtual heat exchanger model developed in AVL CRUISE accurately reproduces the performance of the real cooler, with deviations within acceptable engineering limits.
The novelty of this paper lies in the evaluation of the cooling effectiveness and heat exchanger efficiency based on the NTU method. It is highlighted that the changes in ambient operating conditions of the engine from dry air to humid air modify the cooling effectiveness from 0.814 to 0.808 and the heat exchanger efficiency from 0.771 to 0.766. The results show that reaching absolute humidity of x = 0.05 from dry-air to humid-air conditions, the cooling effectiveness decreases by 0.7% and heat-exchanger efficiency by 0.6%, confirming a slight but systematic decline in charge-air cooling performance.
The model therefore provides a reliable platform for further research, including the evaluation of improved intake-air system configurations, the integration of turbocharging units with enhanced characteristics, and comparative studies involving alternative compact heat exchanger geometries.
Moreover, the methodology employed in this study can be extended to scenarios involving intake air containing additional gases or particulate matter, as well as cooling water treated with corrosion inhibitors or other additives. The simulation-based approach offers a practical and cost-effective alternative to experimental testing, which would otherwise require controlled environmental conditions.
Overall, the findings confirm that the charge-air cooler ensures the thermal stability required for optimal engine operation, even under humid marine conditions, and that the virtual model constitutes a valuable tool for future optimization and design studies.
Author Contributions
Conceptualization, T.A. and R.C.; methodology, T.A. and R.C.; software, R.I.; validation, R.C. and L.M.; formal analysis, T.A. and R.C.; resources, T.A., R.I., L.M. and R.C.; data curation, L.M. and R.C.; writing—original draft preparation, T.A.; writing—review and editing, T.A., L.M. and R.C.; supervision, R.C. and L.M.; project administration, R.C.; funding acquisition, R.C. and L.M. All authors have read and agreed to the published version of the manuscript.
Funding
This work was carried out within “12SOL-REACT”, contract number 12SOL(T1)/2024, supported by the Romanian Minister of Education and Research, Contracting Authority: UEFISCDI (Executive Unit for Financing Higher Education, Research, Development and Innovation).
Data Availability Statement
Publicly available datasets are cited in the article. Additional data are available from the corresponding authors upon reasonable request and subject to institutional approval.
Acknowledgments
The authors acknowledge the AVL-AST team from AVL List GmbH (Graz, Austria) for the special support offered with numerical simulation, the National Research and Development Institute for Gas Turbines COMOTI and the Authority UEFISCDI for the technical and financial support.
Conflicts of Interest
The authors declare no conflict of interest.
Abbreviations
The following abbreviations are used in this manuscript:
| ALCO | American Locomotive Company |
| AVL | AVL List GmbH (developer of CRUISE simulation software) |
| BMEP | Brake Mean Effective Pressure |
| CAC | Charge Air Cooler |
| CFD | Computational Fluid Dynamics |
| CHT | Conjugate Heat Transfer |
| Cr | Heat capacity ratio Cr = Cmin/Cmax |
| HP | Horsepower |
| LMTD | Logarithmic Mean Temperature Difference |
| NTU | Number of Transfer Units |
| PIV | Particle Image Velocimetry |
| PSHE | Primary Surface Heat Exchanger |
| RANS | Reynolds-Averaged Navier–Stokes |
| RSM | Reynolds Stress Model |
| SOFC | Solid Oxide Fuel Cell |
| UA | Overall heat-transfer coefficient multiplied by heat-transfer area |
| V16 | 16-cylinder V-type engine configuration |
| ΔT | Temperature difference |
| ṁ | Mass flow rate |
| ψ | Saturation degree |
| φ | Relative humidity ratio |
| ε | Cooling effectiveness |
| η | Efficiency of the charge-air cooler |
References
- Jiang, H.; Wang, H.; Jiang, F.; Hu, J.; Hu, L. Research on the optimization of a diesel engine intercooler structure based on numerical simulation. Processes 2024, 12, 276. [Google Scholar] [CrossRef] [Scilit]
- Dong, J.; Su, L.; Chen, Q.; Xu, W. Experimental study on thermal-hydraulic performance of a wavy fin-and-flat tube aluminum heat exchanger. Appl. Therm. Eng. 2013, 51, 32–39. [Google Scholar] [CrossRef] [Scilit]
- Seo, J.-W.; Cho, C.; Lee, S.; Choi, Y.-D. Thermal characteristics of a primary surface heat exchanger with corrugated channels. Entropy 2016, 18, 15. [Google Scholar] [CrossRef] [Scilit]
- Wen, J.; Li, Y.; Zhou, A.; Zhang, K.; Wang, J. Experimental investigation of entrance configuration on flow maldistribution in plate-fin heat exchanger. Cryogenics 2006, 46, 37–48. [Google Scholar] [CrossRef] [Scilit]
- Habib, M.; Mansour, R.; Said, S. Evaluation of flow maldistribution in air-cooled heat exchangers. Comput. Fluids 2009, 38, 677–690. [Google Scholar] [CrossRef] [Scilit]
- Javaherdeh, K.; Vaisi, A.; Moosavi, R.; Esmaeilpour, M. Experimental and numerical investigations on louvered fin-and-tube heat exchanger with variable geometrical parameters. J. Therm. Sci. Eng. Appl. 2017, 9, 024501. [Google Scholar] [CrossRef] [Scilit]
- Djemel, H.; Salem, M.B.; Baccar, M.; Mseddi, M. Three-dimensional numerical study of the intercooler equipped with vortex generators. Heat Transf. 2017, 17, 100263. [Google Scholar] [CrossRef] [Scilit]
- Huang, Y.; Liu, Z.; Lu, G.; Yu, X. Multi-scale thermal analysis approach for the typical heat exchanger in automotive cooling systems. Int. Commun. Heat Mass Transf. 2014, 59, 75–87. [Google Scholar] [CrossRef] [Scilit]
- Ali, S.; Saeid, K.; Hossain, N. Developed correlations for heat transfer and flow friction characteristics of finned tube heat exchangers. Int. J. Therm. Sci. 2018, 129, 135–144. [Google Scholar] [CrossRef] [Scilit]
- Huminic, G.; Huminic, A. A numerical approach on hybrid nanofluid behavior in laminar duct flow with various cross sections. J. Therm. Anal. Calorim. 2020, 140, 2097–2110. [Google Scholar] [CrossRef] [Scilit]
- Zhao, X.; Grönstedt, T. Conceptual design of a two-pass cross-flow aeroengine intercooler. Proc. Inst. Mech. Eng. Part G J. Aerosp. Eng. 2023, 229, 2006–2023. [Google Scholar] [CrossRef] [Scilit]
- Liu, Z.; Sheng, Y. Research on the integrated intercooler intake system of turbocharged diesel engine. Int. J. Automot. Technol. 2020, 21, 339–349. [Google Scholar] [CrossRef] [Scilit]
- Al-Masri, A.; Peksen, M.; Blum, L.; Stolten, D. A 3D model for predicting the temperature distribution in a full-scale APU SOFC short stack under transient operating conditions. Appl. Energy 2014, 135, 539–547. [Google Scholar] [CrossRef] [Scilit]
- Türközü, B.; Uzun, Y.; Büyük, C.; Öztürk, M. Design, Analysis and Optimization of Fin-and-Tube Type Heat Exchanger in Marine Diesel Engine. Eur. J. Res. Dev. 2023, 3, 42–54. [Google Scholar] [CrossRef] [Scilit]
- Kuznetsov, G.V.; Sheremet, M.A.; Orlova, E.G. The Development of Long-Range Heat-Transfer Surfaces for Marine Diesel Engine Charge-Air Coolers. Sci. J. Marit. Univ. Szczec. 2021, 137, 51–57. [Google Scholar]
- AVL Advanced Simulation Technologies. Tools and Methods for Next-Level Simulation Solutions. Available online: https://www.avl.com/en (accessed on 23 April 2026).
- ALCO Engines Division. Standards Engineering Practice; No. Q1P8203; ALCO Engines Division: Schenectady, NY, USA, 1971. [Google Scholar]
- Thulukkanam, T. Heat Exchanger Design Handbook; Begell House Inc.: New York, NY, USA, 2019. [Google Scholar]
- Fakheri, A. Efficiency analysis of heat exchangers and heat exchanger networks. Int. J. Heat Mass Transf. 2014, 76, 99–104. [Google Scholar] [CrossRef] [Scilit]
- Hiriș, P.D. Aplicații de Termotehnică; Editura U.T. Press: Cluj, Romania, 2024. [Google Scholar]
- Socaciu, L.; Giurgiu, O. Termotehnică; Sinteză Lucrări de Laborator; Editura U.T. Press: Cluj, Romania, 2017. [Google Scholar]

Disclaimer/Publisher’s Note: The statements, opinions and data contained in all publications are solely those of the individual author(s) and contributor(s) and not of MDPI and/or the editor(s). MDPI and/or the editor(s) disclaim responsibility for any injury to people or property resulting from any ideas, methods, instructions or products referred to in the content. |
© 2026 by the authors. Licensee MDPI, Basel, Switzerland. This article is an open access article distributed under the terms and conditions of the Creative Commons Attribution (CC BY) license.