Article

RT-qPCR Detection of CsRV1 in Blue Crabs from Delaware Inland Bays and Its Ecological Context Within Local Water Quality Conditions

1
ONE Health Laboratory, Department of Agriculture and Natural Resources, Delaware State University, Dover, DE 19901, USA
2
Department of Biology and Microbiology, College of Natural Sciences, South Dakota State University, Brookings, SD 57007, USA
*
Author to whom correspondence should be addressed.
J. Mar. Sci. Eng. 2026, 14(9), 847; https://doi.org/10.3390/jmse14090847
Submission received: 26 March 2026 / Revised: 27 April 2026 / Accepted: 29 April 2026 / Published: 30 April 2026
(This article belongs to the Special Issue Sustainable Marine Aquaculture and Fishery)

Abstract

Blue crab (Callinectes sapidus) populations are of substantial ecological and economic importance. As a keystone species, C. sapidus plays a critical role in maintaining estuarine food webs while also supporting one of the most consumed and economically valuable seafood industries in Delaware and Maryland. This study investigated the presence of Callinectes sapidus reovirus 1 (CsRV1) in C. sapidus collected from Rehoboth Bay, Delaware, USA, using reverse transcription–quantitative polymerase chain reaction (RT-qPCR), and evaluated potential associations between viral occurrence and physicochemical parameters, including temperature, salinity, pH, turbidity, alkalinity, calcium hardness, nitrite, and chlorophyll-a. A total of eighteen traps were deployed across six study sites encompassing oyster aquaculture areas, artificial oyster reefs, and control sites with minimal structural habitat. CsRV1 was detected in blue crabs from Rehoboth Bay, confirming the presence of the virus within the Delaware Inland Bays; however, detections were limited to a small subset of sampled individuals. Among the environmental parameters examined, salinity exhibited the greatest interannual variability, while other physicochemical conditions remained relatively consistent across site types and sampling periods. Overall, environmental conditions during the study period were within ranges considered suitable for C. sapidus, indicating that the population is likely to experience limited environmental stress and minimal disease-related impacts under current conditions.

1. Introduction

Blue crabs (Callinectes sapidus) are a keystone species of significant ecological and economic importance along the East and Gulf Coasts of North America. The blue crab fishery ranks as the second largest in the world, spanning 14 U.S. east coast states and driven by growing commercial and recreational demand [1]. C. sapidus demonstrates remarkable resilience, tolerating a broad range of water quality conditions and displaying opportunistic behaviors that enable adaptation to diverse habitats [2]. The Delaware Inland Bays (DIB), comprising three systems including Rehoboth Bay, Little Assawoman Bay and Indian River Bay, generates approximately $4.5 million annually and is a vital region for seafood production [3].
Environmental and anthropogenic factors, such as excess nutrients from agricultural runoff, atmospheric pollution, sewage overflow, and stormwater runoff, have degraded habitats and compromised water quality, especially in the Mid-Atlantic region [4,5]. In 2022, the U.S. Environmental Protection Agency rated water quality in the Inland Bays as “poor” [6]. Poor water quality can impact C. sapidus directly by affecting habitat suitability and indirectly by promoting pathogen proliferation, such as Callinectes sapidus reovirus 1 (CsRV1). Elevated pathogen presence may lead to behavioral changes and mortality in crabs, including lethargy, anorexia, trembling, and paralysis, which can threaten the sustainability of blue crab populations [7,8]. CsRV1 has been detected in other U.S. coastal regions, with studies employing RT-qPCR techniques [9,10]. These studies revealed variations in prevalence across different geographic areas, highlighting the importance of monitoring this virus in specific regions. In aquaculture settings, this virus has been found to affect up to 50% of diseased crabs, with lower prevalence in healthy individuals [8,11]. Despite the high prevalence in neighboring bays, CsRV1 has not yet been confirmed within Rehoboth Bay, making its monitoring crucial for sustainable fisheries management.
Water quality monitoring faces significant challenges, as an estimated 80,000 chemicals enter our water systems from everyday use [12]. Degradation and eutrophication impacts, specifically within the DIB, scored poorly for water quality for seagrass reestablishment [13], which is the dominant habitat for C. sapidus during multiple life stages. Alkalinity and calcium hardness are key parameters for the development of exoskeletal calcification in seawater organisms, including C. sapidus [14]. Chlorophyll-a was assessed in relation to the production of dense algae blooms, such as the ones Rehoboth Bay exhibits, that can block sunlight from reaching submerged aquatic vegetation (SAV), which contributes to habitat loss, impacting nurseries, feeding grounds, and refuge from predators [15]. Dissolved oxygen (DO) is one of the most critical water quality parameters to monitor in relation to C. sapidus, as it is essential for molting and survival [16]. Coastal hypoxia has multiple implications, with eutrophication and anthropogenic factors being the two primary causes [17,18]. Salinity is a critical environmental factor that influences the distribution and reproduction of the species [19,20]. C. sapidus is considered a euryhaline species and is primarily found in estuaries and lagoons, tolerating a wide range of salinities [21]. Global temperatures are rising at an accelerated rate, a trend that is having profound effects on ecosystems worldwide. As temperatures increase, the life history and biological functions of various marine organisms, including echinoderms, are being significantly impacted [22]. Callinectes sapidus is considered a hardy species capable of tolerating a wide range of temperatures, including prolonged exposure to low temperatures during overwintering by burrowing into sediments and entering a state of reduced metabolic activity. However, previous studies indicate that approximately 24 °C represents a lower threshold for optimal physiological performance and active metabolic processes, rather than a minimum survival temperature [23].
Nitrite (NO2) is essential to monitor for C. sapidus, as nitrite is toxic to C. sapidus at low levels and should be maintained at 0.5–1 ppm [16]. At low levels, this will cause the crab to suffocate due to the decreased ability of the blood to transport oxygen [16].
Previous research indicates that environmental factors, including water temperature and habitat conditions, influence CsRV1 prevalence and distribution [9,24]. These studies demonstrate the importance of understanding how water quality and habitat characteristics affect the spread and impact of the virus on crab populations. Monitoring water quality, population dynamics, and pathogen presence in Rehoboth Bay will help determine whether the local environment remains conducive to healthy C. sapidus populations despite ongoing environmental degradation. The objectives of this study were to (1) monitor the population distribution and characteristics of C. sapidus from the three different habitat types in Rehoboth Bay, (2) determine whether CsRV1 was present in sampled crabs, and (3) monitor environmental parameters to determine whether conditions were optimal for sustaining C. sapidus populations in Rehoboth Bay, Delaware, USA.

2. Materials and Methods

2.1. Study Sites

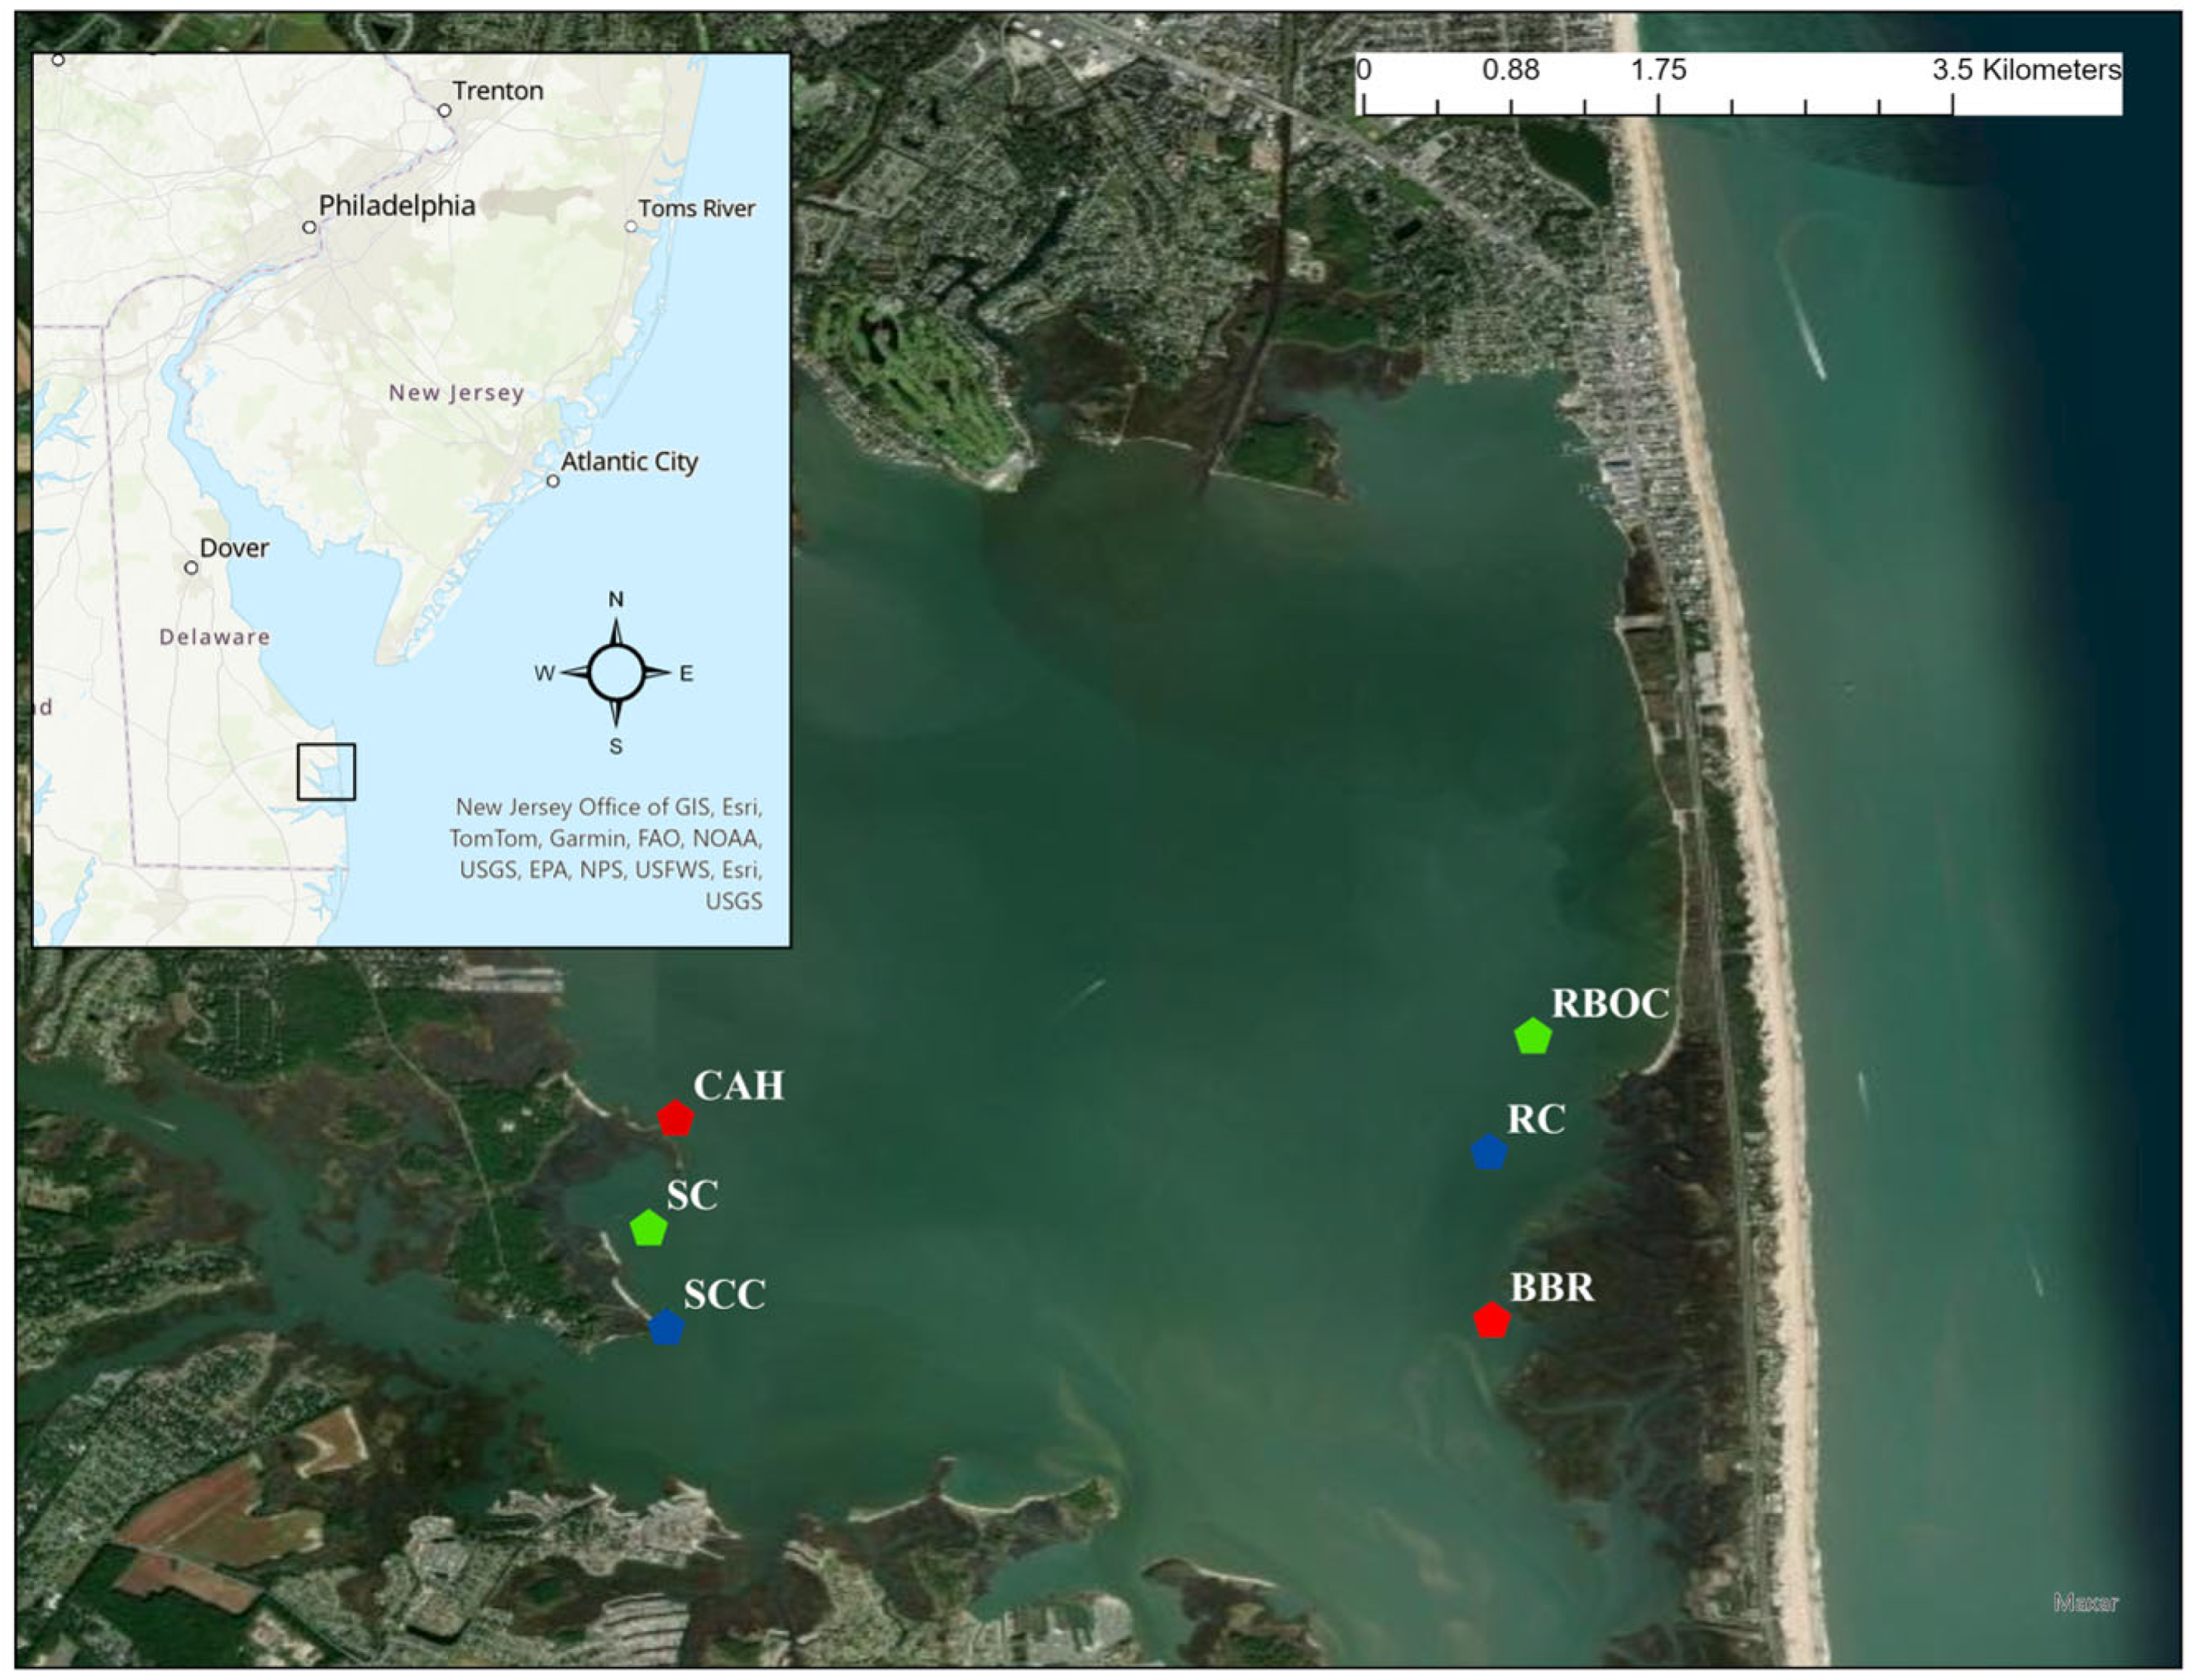
This study was conducted from early June to late October in 2022–2023. Six study sites were selected within Rehoboth Bay, Delaware, representing three site types: ongoing oyster aquaculture sites, artificial oyster reefs, and control sites with little to no physical structure (Figure 1). The oyster aquaculture and artificial reef sites were intentionally selected to represent established, spatially separated examples of active and restored oyster habitats within the bay, allowing for comparison of ecological conditions across different forms of oyster-related structure. One site of each type was located on both the west and east sides of Rehoboth Bay to account for potential spatial variation in environmental conditions (e.g., hydrodynamics, salinity gradients, and surrounding land use). The oyster aquaculture sampling sites were located at Sally’s Cove (SC; 38.64877° N, 75.12870° W) on the west side and Rehoboth Bay Oyster Company (RBOC; Rehoboth Bay, DE, USA, 38.39549° N, 75.04797° W) on the east side. These locations were selected because they are actively managed aquaculture sites with established oyster stocking densities and infrastructure, providing representative examples of commercial oyster operations in the bay. The artificial reef sites were located at Camp Arrowhead (CAH; 38.65430° N, 75.12589° W) on the west side and Big Bacon Reef (BBR; 38.38007° N, 75.04866° W) on the east side. These reefs were chosen due to their documented use as restoration sites and their proximity to aquaculture locations, allowing for direct comparison between restored and farmed oyster habitats under similar environmental settings. Lastly, the control sites were located at Sally’s Cove Control (SCC; 38.64446° N, 75.12656° W) on the west side and Redefer Control (RC; 38°39.177′ N, 075°04.938′ W) on the east side of Rehoboth Bay. Control sites were selected in adjacent areas lacking substantial benthic structure to serve as baseline conditions for comparison with oyster-influenced habitats.

2.2. Blue Crab Cage Deployments

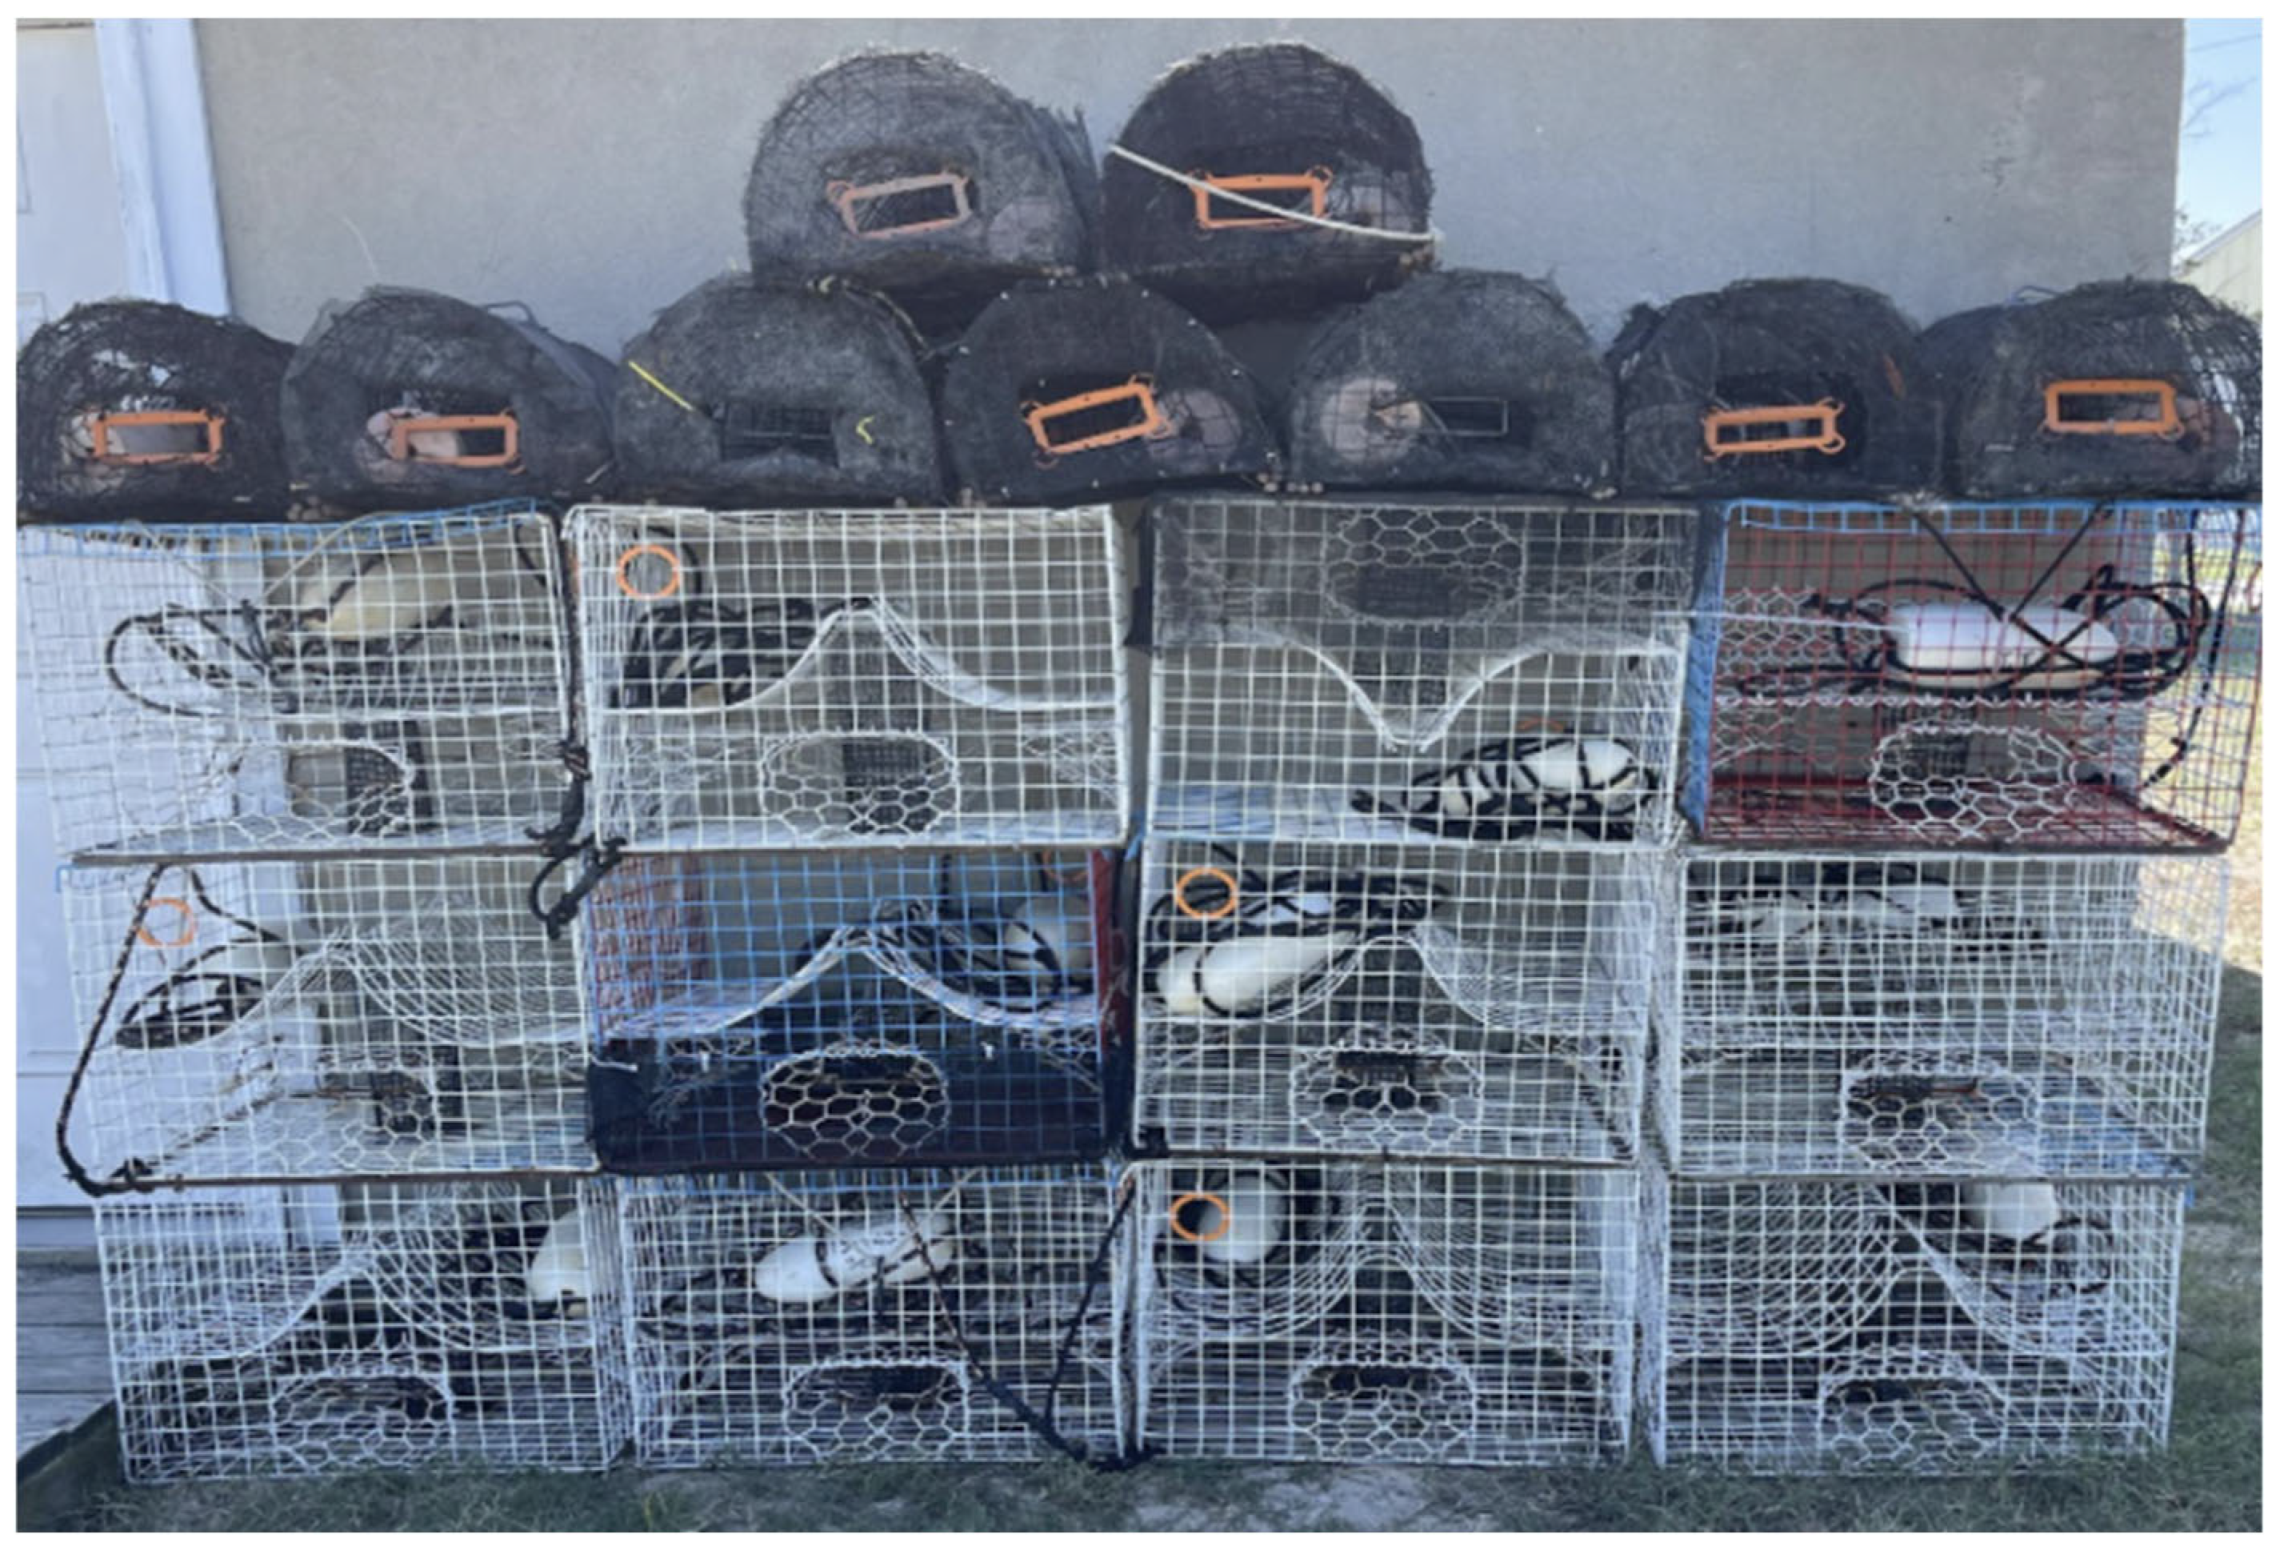
Two commercial traps and one recreational trap were deployed at each of the six sampling sites (Figure 2). Each commercial trap was baited with two menhaden (Brevoortia tyrannus), while recreational traps were baited with one menhaden per trap. To target juvenile and sub-adult blue crabs while allowing smaller individuals to escape, traps were fitted with 3.175 mm (1/8-inch) mesh along the bottom of each cage while maintaining accessibility to the escape openings. The goal of meshing the cages was to retain larger juvenile size classes while minimizing capture of smaller individuals.
Traps were retrieved after soaking for 24 to 36 h, with extended soak durations used only when adverse weather conditions prevented timely retrieval. Upon retrieval, all captured crabs were identified to species level. Additionally, non-target organisms (by-catch) were identified, counted, and measured for length (mm) and weight (g) prior to release. Blue crabs selected for CsRV1 analysis were retained and processed according to the procedures described in Section 2.4.

2.3. Water Quality

Triplicate water samples were collected at each of the six sites, totaling eighteen samples weekly in 2022 and biweekly in 2023. The water samples were collected in 500 mL bottles and placed on ice. Physical water quality parameters were recorded on-site using a YSI 556 Handheld Multiparameter Instrument (YSI Xylem Inc., Yellow Springs, OH, USA) in 2022 and a YSI ProDSS Multiparameter Digital Water Quality Meter (YSI Xylem Inc., Yellow Springs, OH, USA) in 2023. During the transition between the instruments, both were calibrated and tested in the field simultaneously for comparison and to maintain consistency in readings. Environmental parameters assessed in this study include dissolved oxygen (mg/L), salinity (ppt), temperature (°C), and turbidity (FNU). Water samples for chemical analysis were measured using a colorimetric method following the standard protocol from YSI/Xylem Inc. and a YSI 9500 Photometer (YSI Xylem Inc., Yellow Springs, OH, USA).

2.4. Sample Collection for Callinectes sapidus Reovirus 1 Analysis

In 2023, one male and one female C. sapidus were selected from each study site, totaling twelve crabs per trip for genetic analysis to detect the presence of CsRV1. Each C. sapidus was marked on the carapace with quick-dry nail polish, labeled with “M” or “F” for male or female, followed by the site ID. The specimens were collected and placed on ice. Upon returning to the lab, one “walking leg” was removed from each specimen and placed into a 50 mm Eppendorf tube. Both the walking leg and the entire crab were immediately stored in an −80 °C freezer. All C. sapidus replicates were properly labeled by date, sex, and site for genetic analysis.

2.5. RNA Extraction

RNA extraction was performed using the collected crab specimens. The walking leg exoskeleton was cleaned using a 1:10 bleach dilution prior to dissection of the muscle. Dissections of walking legs were performed using individually wrapped sterilized wooden coffee sticks and new single-use razor blades. Prior to each dissection, the lab bench and crab cuticle were cleaned with a 1/10 bleach dilution [9]. Approximately 50 mg of muscle tissue, including the hypodermis (subcuticle tissue), was removed from the walking leg and homogenized with 1.0 mL of TRIzol using an MP Biomedical bead beater (MP Biomedicals, Burlingame, CA, USA). The samples were placed in the bead beater for 20 s and processed for one cycle at a speed of 4.0 m/s. RNA was extracted from blue crab samples following the TRIzol manufacturer’s protocol. Briefly, samples were homogenized, followed by phase separation using chloroform (centrifugation at 12,000× g for 15 min at 4 °C). The aqueous phase was then collected, and RNA was precipitated with isopropanol (centrifugation at 12,000× g for 12 min at 4 °C). The resulting RNA pellet was washed twice with 75% ethanol (centrifugation at 12,000× g for 5 min) and subsequently air-dried to remove residual ethanol. Finally, isolated RNA pellets were dissolved in RNase-free 1 mM EDTA, using 50 μL for muscle samples and 30 μL for hemolymph samples, and stored at −80 °C. RNA quality and concentration were assessed using a Nanodrop 2000 Spectrometer (Thermo Fisher Scientific, Waltham, MA, USA), with samples diluted to a target concentration range of 100–200 ng/μL for subsequent RT-qPCR analysis [8].

2.6. Primer Design

For the evaluation of the RNA pathogen CsRV1, the primer pair was designed to amplify a 158 bp fragment based on specific gene sequences identified in the scientific literature [9,11]. The identified sequence selected for optimization consisted of 5′-TGCGTTGGATGCGAAGTGACAAAG-3′ (RLVset1F) and 5′ GCGCCATACCGAGCAAGTTCAAAT-3′ (RLVset1R). Samples were amplified using a Quantabio thermocycler and QuantStudio™3 (Thermo Fisher Scientific, Waltham, MA USA). Presence/absence analysis was performed using Thermo Fisher’s QuantStudio 3/5 Real-Time PCR Software (version v3.0).

2.7. RT-qPCR Reaction for CsRV1

RT-qPCR assays were conducted in duplicate, with 84 biological replicates, resulting in a total of 168 reactions. Reagents included RNA samples, nuclease-free water, EDTA, RT-Taq mix, 2× Master Mix, and forward and reverse primers. Each 10 μL reaction contained an RNA template, forward and reverse primers, 2× PCR Master Mix, RT-Taq mix, and nuclease-free water. RT-qPCR assays for CsRV1 were performed using a Quantabio thermocycler and a QuantStudio™ 3 Real-Time PCR System (Thermo Fisher Scientific, Waltham, MA, USA).
A ten-fold serial dilution of CsRV1 standards, ranging from 106 to 101 copies per reaction, was used to generate a standard curve for assay performance evaluation and reference quantification. RT-qPCR reactions underwent an initial denaturation at 95 °C for 5 min, followed by reverse transcription at 50 °C for 2 min and enzyme activation at 95 °C for 10 min. Amplification consisted of 40 cycles of 95 °C for 15 s and 60 °C for 1 min. Product specificity was assessed by melt curve analysis (15 s at 95 °C, 1 min at 60 °C, 15 s at 95 °C, and 15 s at 60 °C).
Amplification efficiency was determined from the standard curve and fell within the acceptable range for RT-qPCR assays. The assay detection limit corresponded to the lowest standard concentration (101 copies per reaction) that produced consistent and reliable amplification. Amplification specificity was confirmed by the presence of a single, distinct melting peak and by the absence of amplification in no-template negative controls. The primer set used in this study has been previously validated for the detection of CsRV1 in Callinectes sapidus and demonstrated specificity for this reovirus in prior studies [9,11].

2.8. Statistical Analysis

Our statistical analyses and data visualizations were all conducted in R Studio (Version 2023.09.1, R version 4.3.2), primarily utilizing the tidy verse and ggplot2 packages. Faceted time series scatter plots were used to visualize individual data points, revealing patterns and variability across sites and time. For broader trends, bar graphs with standard deviations showed the spread around average water quality in 2022 and 2023. Additionally, a statistical table of all physiochemical parameters was provided (Table S1).

3. Results

3.1. Environmental Parameters

3.1.1. Dissolved Oxygen

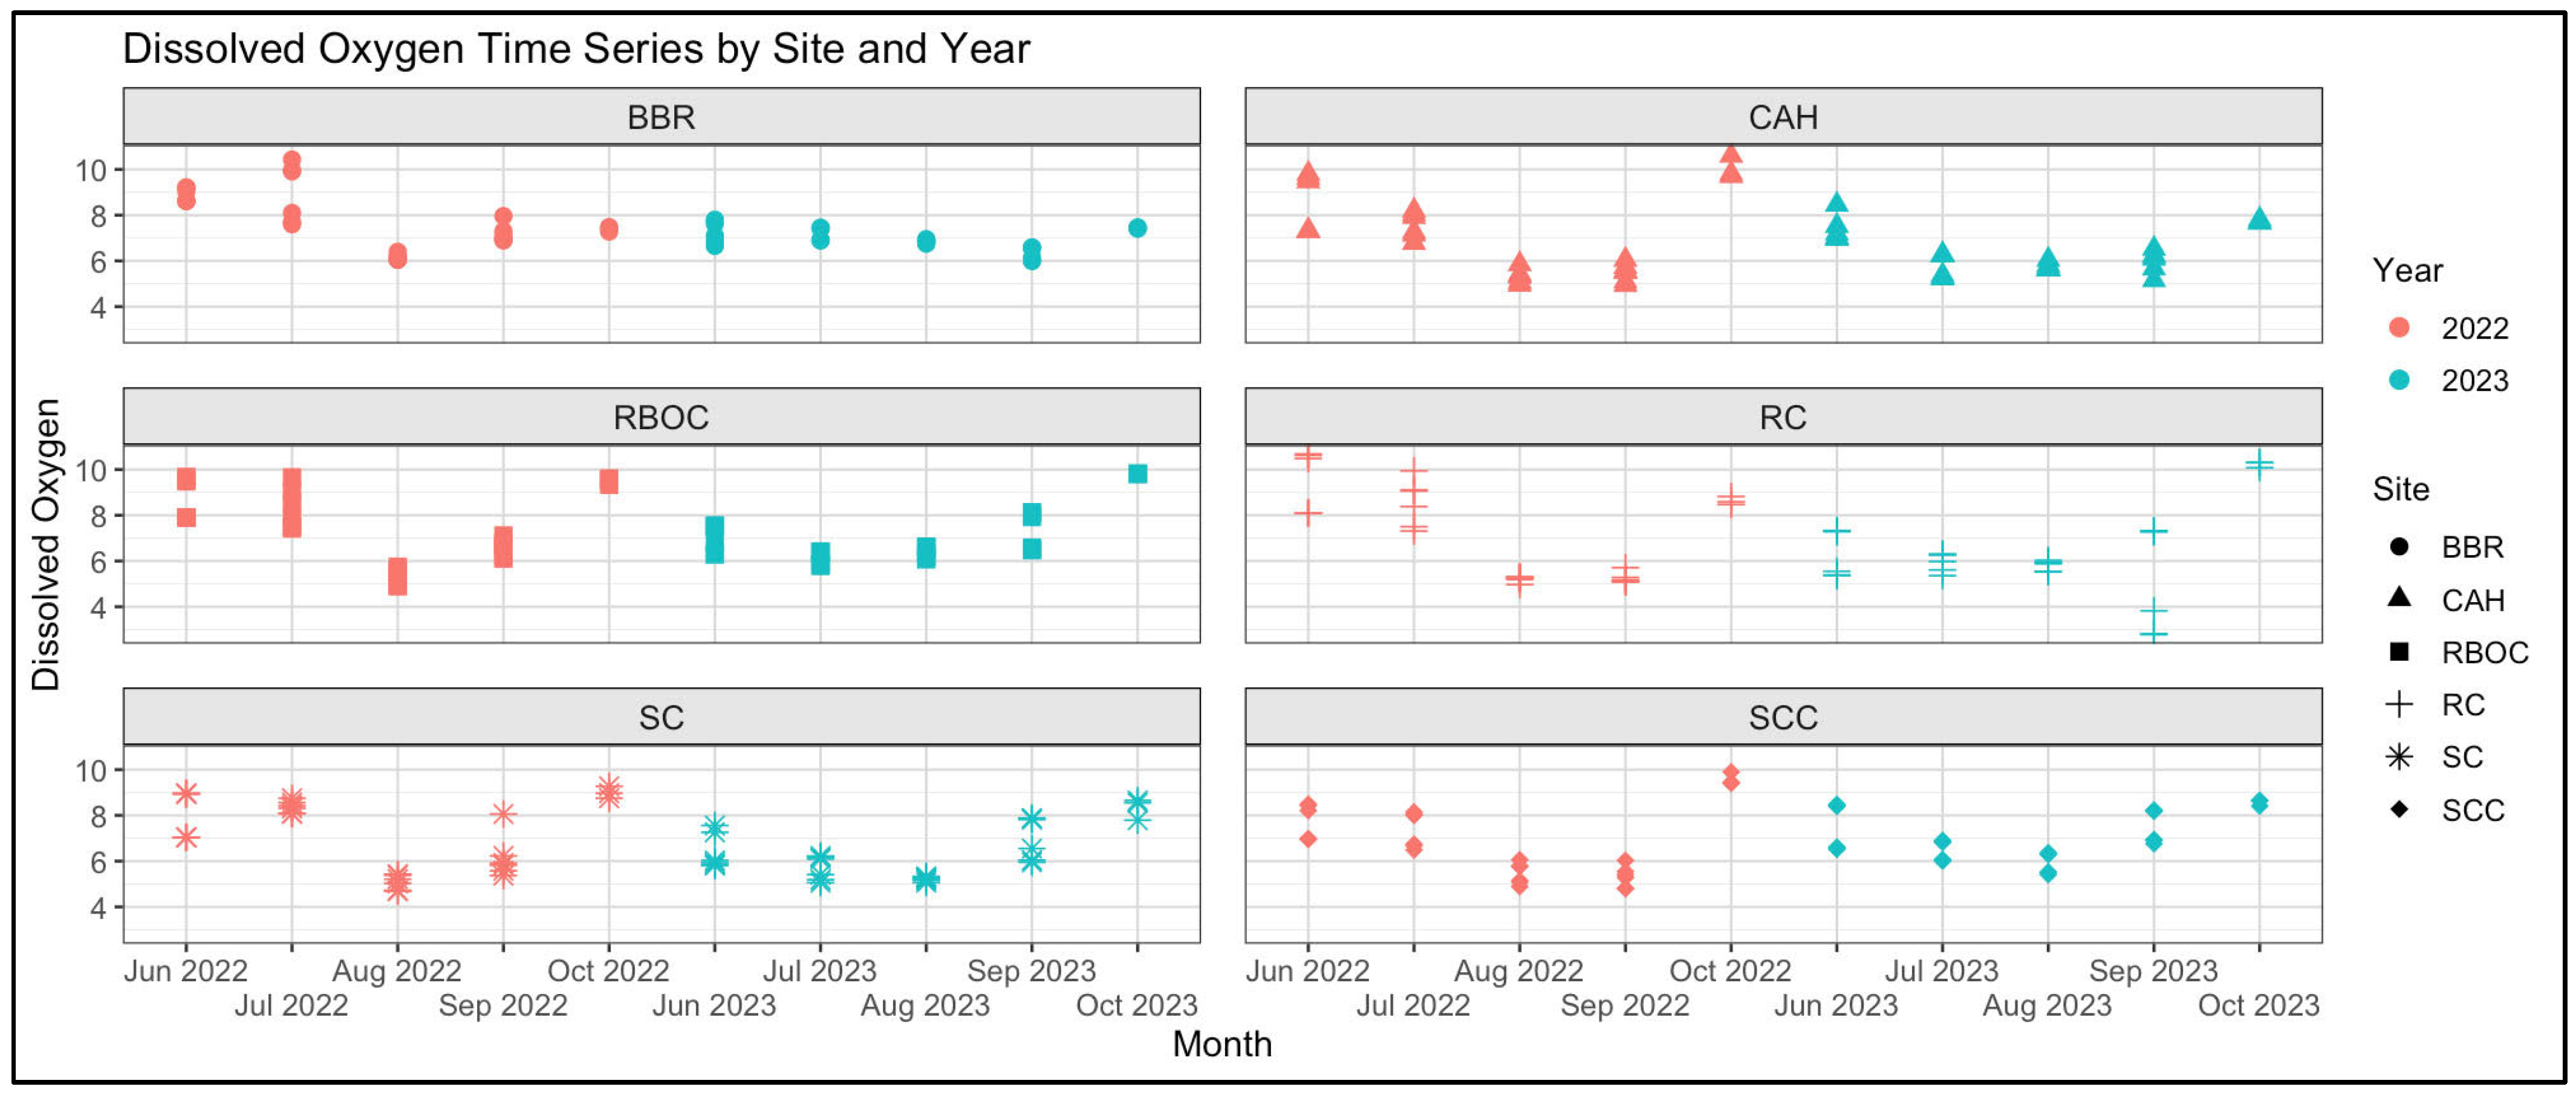
Dissolved oxygen was displayed as a time series plot with averages calculated from triplicate water samples. Overall, there was a slight variation between the two study years (Figure 3). In 2022, the average DO mg/L ranged from 4.8 to 10.5 mg/L, while in 2023 the average DO mg/L ranged from 3.9 to 10.2 mg/L. The most significant difference was identified at site RC in September 2023, with the lowest average ranging around 3.9 mg/L. However, the dissolved oxygen level was still optimal for C. sapidus.
DO is the most critical water quality parameter to monitor for C. sapidus because it contributes significantly to molting and survivability [16]. Adult C. sapidus requires a DO of 3 mg/L or greater [25]. C. sapidus larvae require DO that is slightly higher than that of adults, around 4–6 mg/L [25]. The dissolved oxygen levels were considered optimal at all study sites for C. sapidus metabolic processes and survivability. Overall, there was no concern for DO within the study sites in Rehoboth Bay. From a biodiversity aspect, the DO ranges were also optimal for most documented species residing within Rehoboth Bay.

3.1.2. Salinity

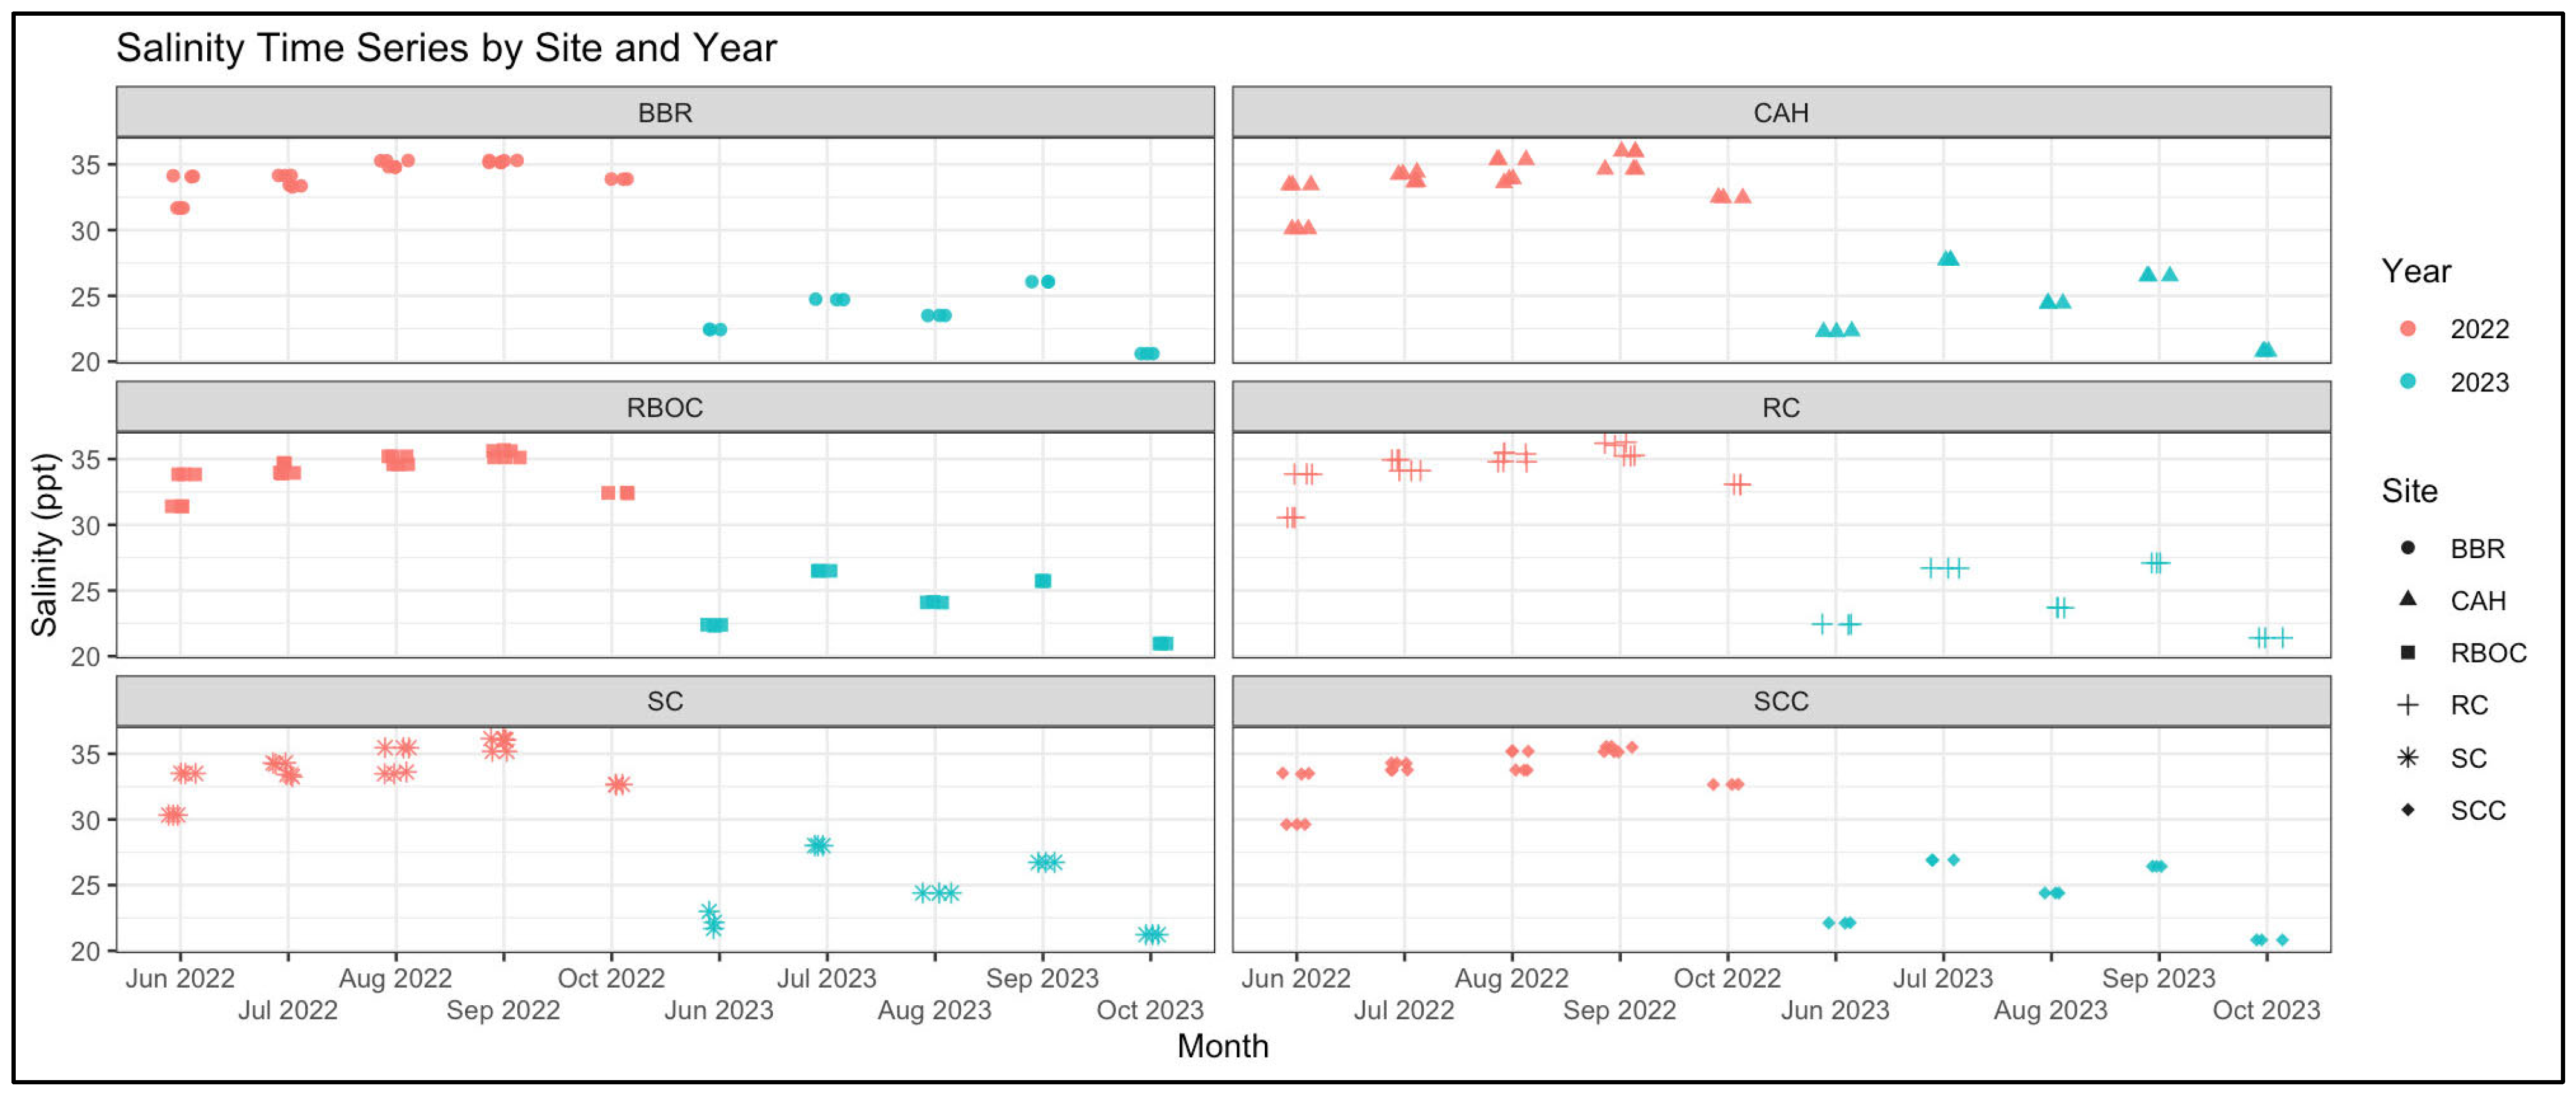
Salinity was displayed as a time series plot with averages calculated from triplicate water samples. There was a noticeable decrease in salinity levels from 2022 to 2023 (Figure 4). In 2022, the average salinity ranged from 28 to 36.5 ppt, while the average salinity ranged from 28 to 32.5 ppt in 2023. However, salinity levels remained optimal for C. sapidus, with no signs of concern.
C. sapidus inhabits freshwater, brackish water, and marine environments, where salinity can range from 0 ppt to 32 ppt [26]. Female C. sapidus typically prefer lower salinity levels until the reproductive stages. During this time, females transition to habitats such as estuaries, lagoons, and bays, where salinity is naturally higher, providing optimal conditions for larval release. In contrast, males also transition to higher salinity waters depending on their life cycle stage; however, male C. sapidus predominantly prefer higher salinity waters [26]. Salinity levels throughout the 2022–2023 field seasons were optimal for both adult C. sapidus and larvae. A salinity of 28 ppt is still favorable for C. sapidus larvae, particularly during the zoea-to-megalopa stages. In summary, salinity levels were favorable for C. sapidus throughout both the 2022 and 2023 field seasons.

3.1.3. Temperature

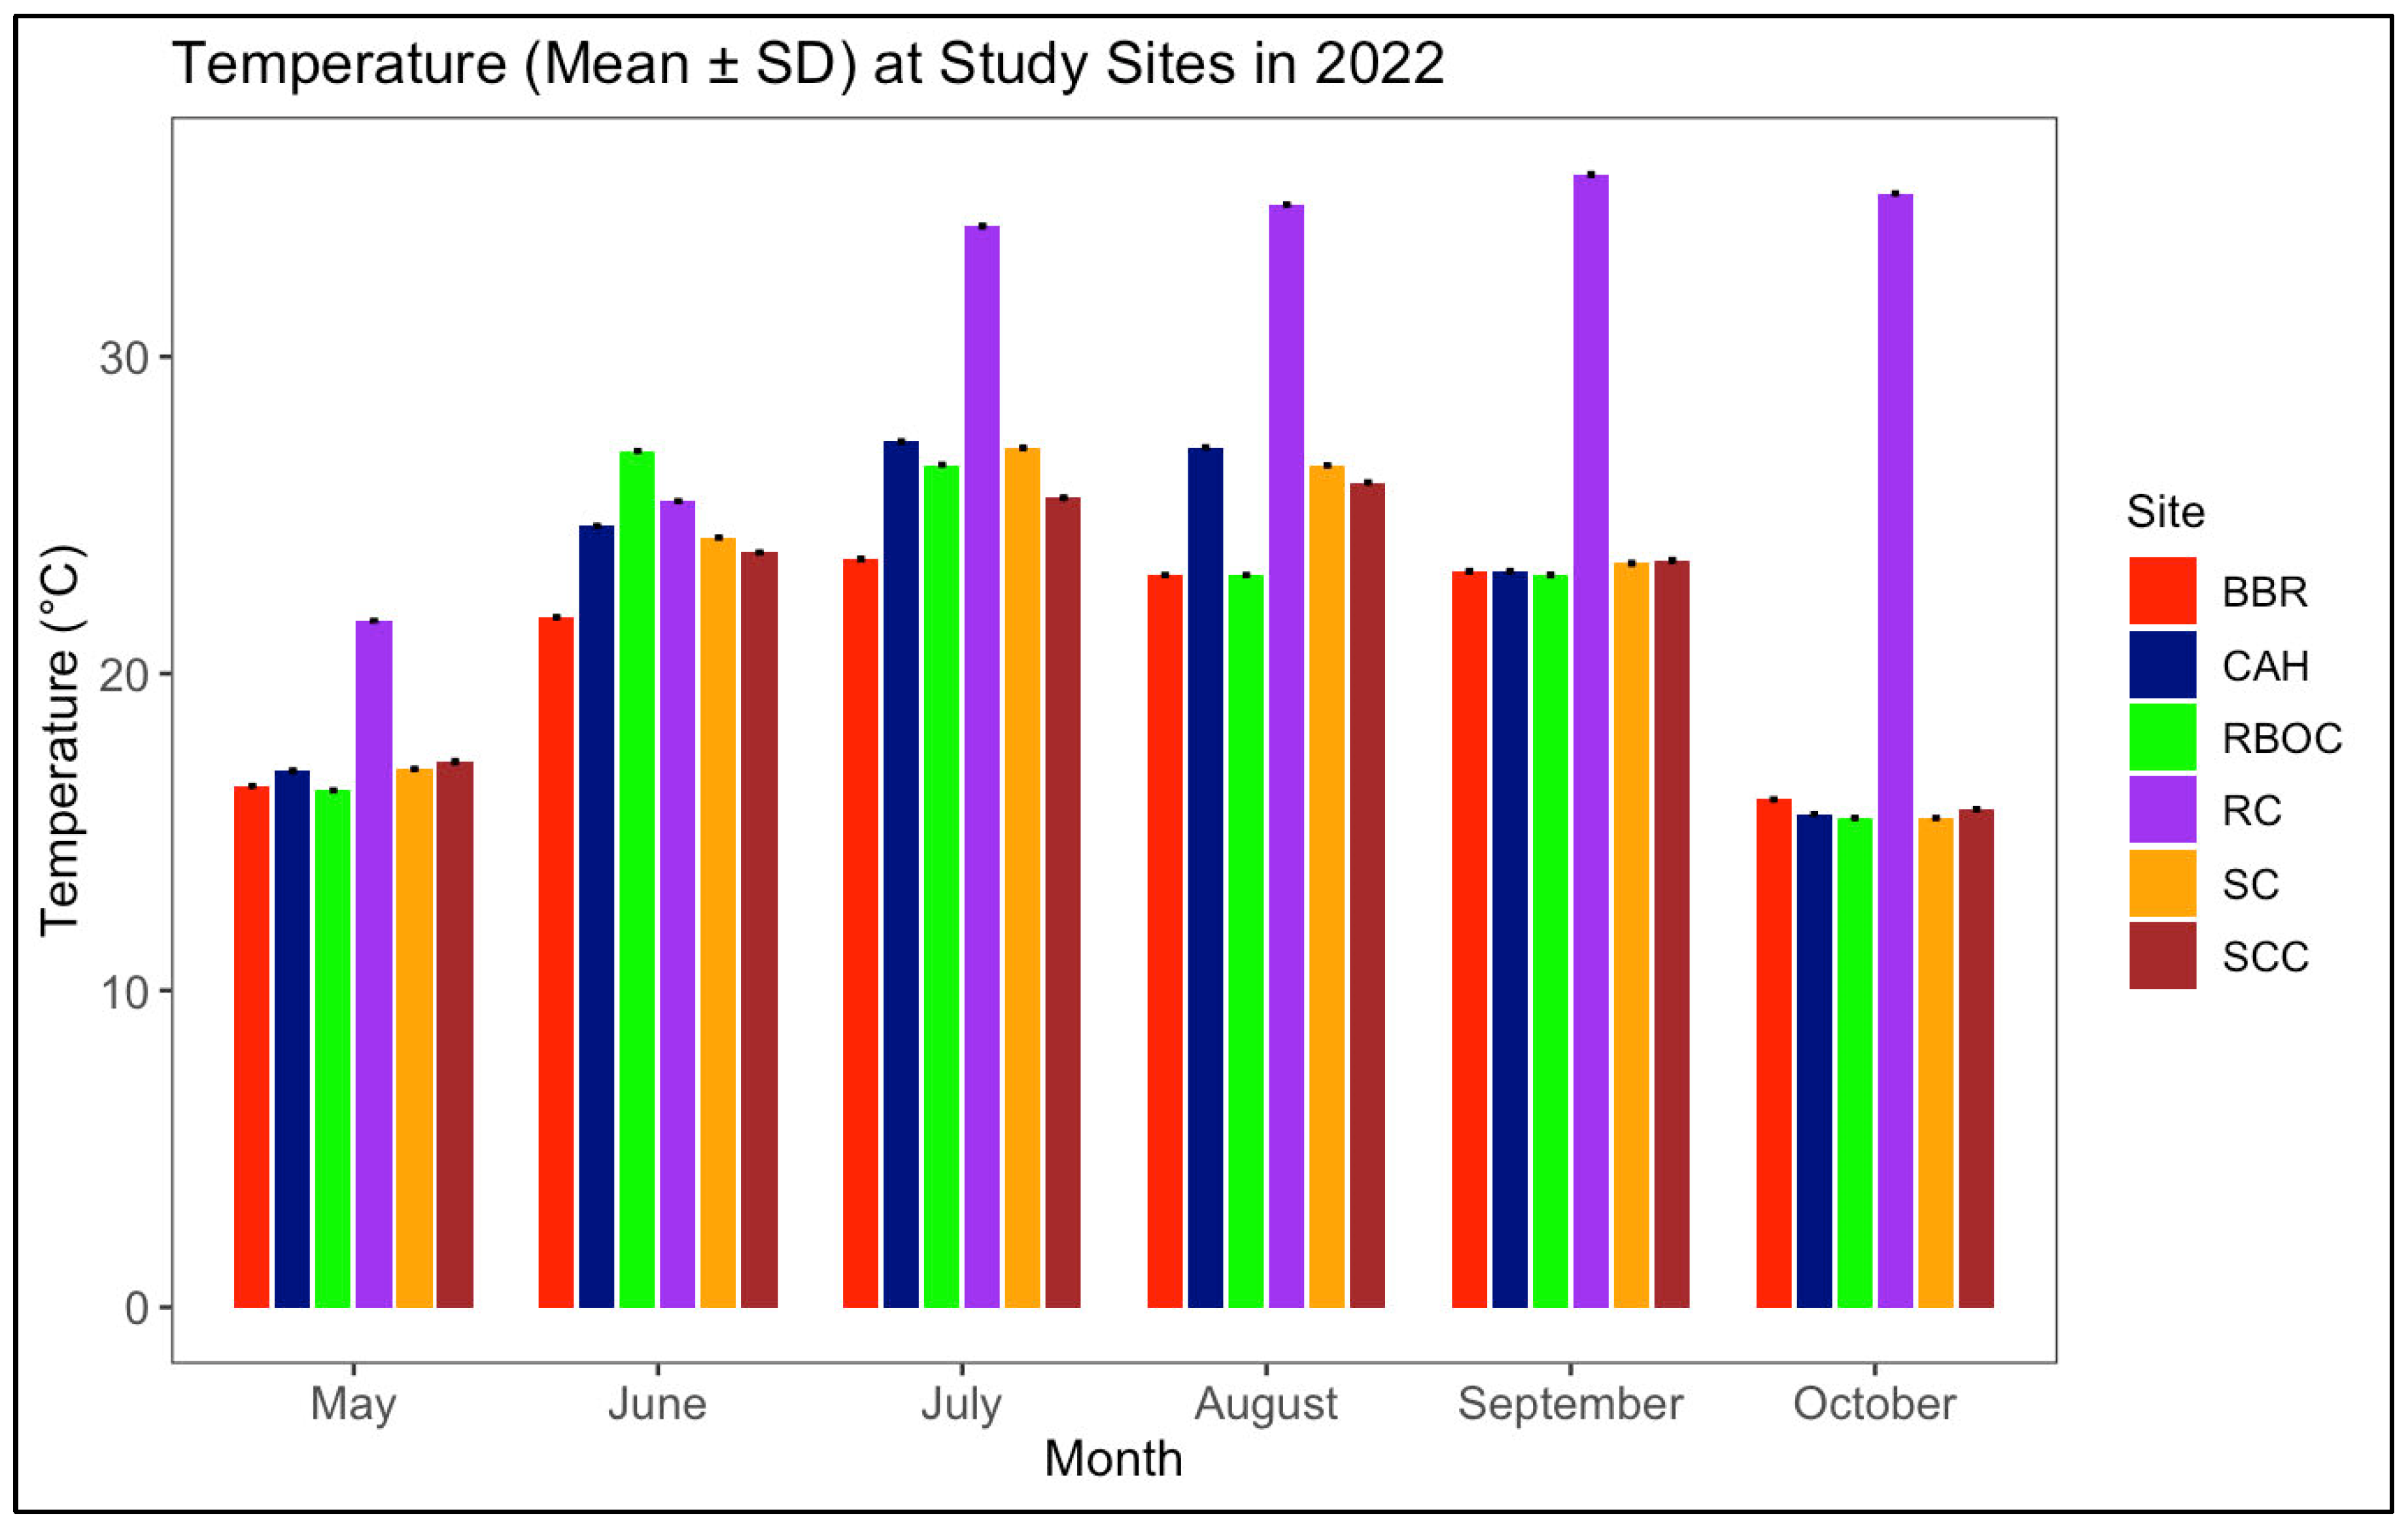
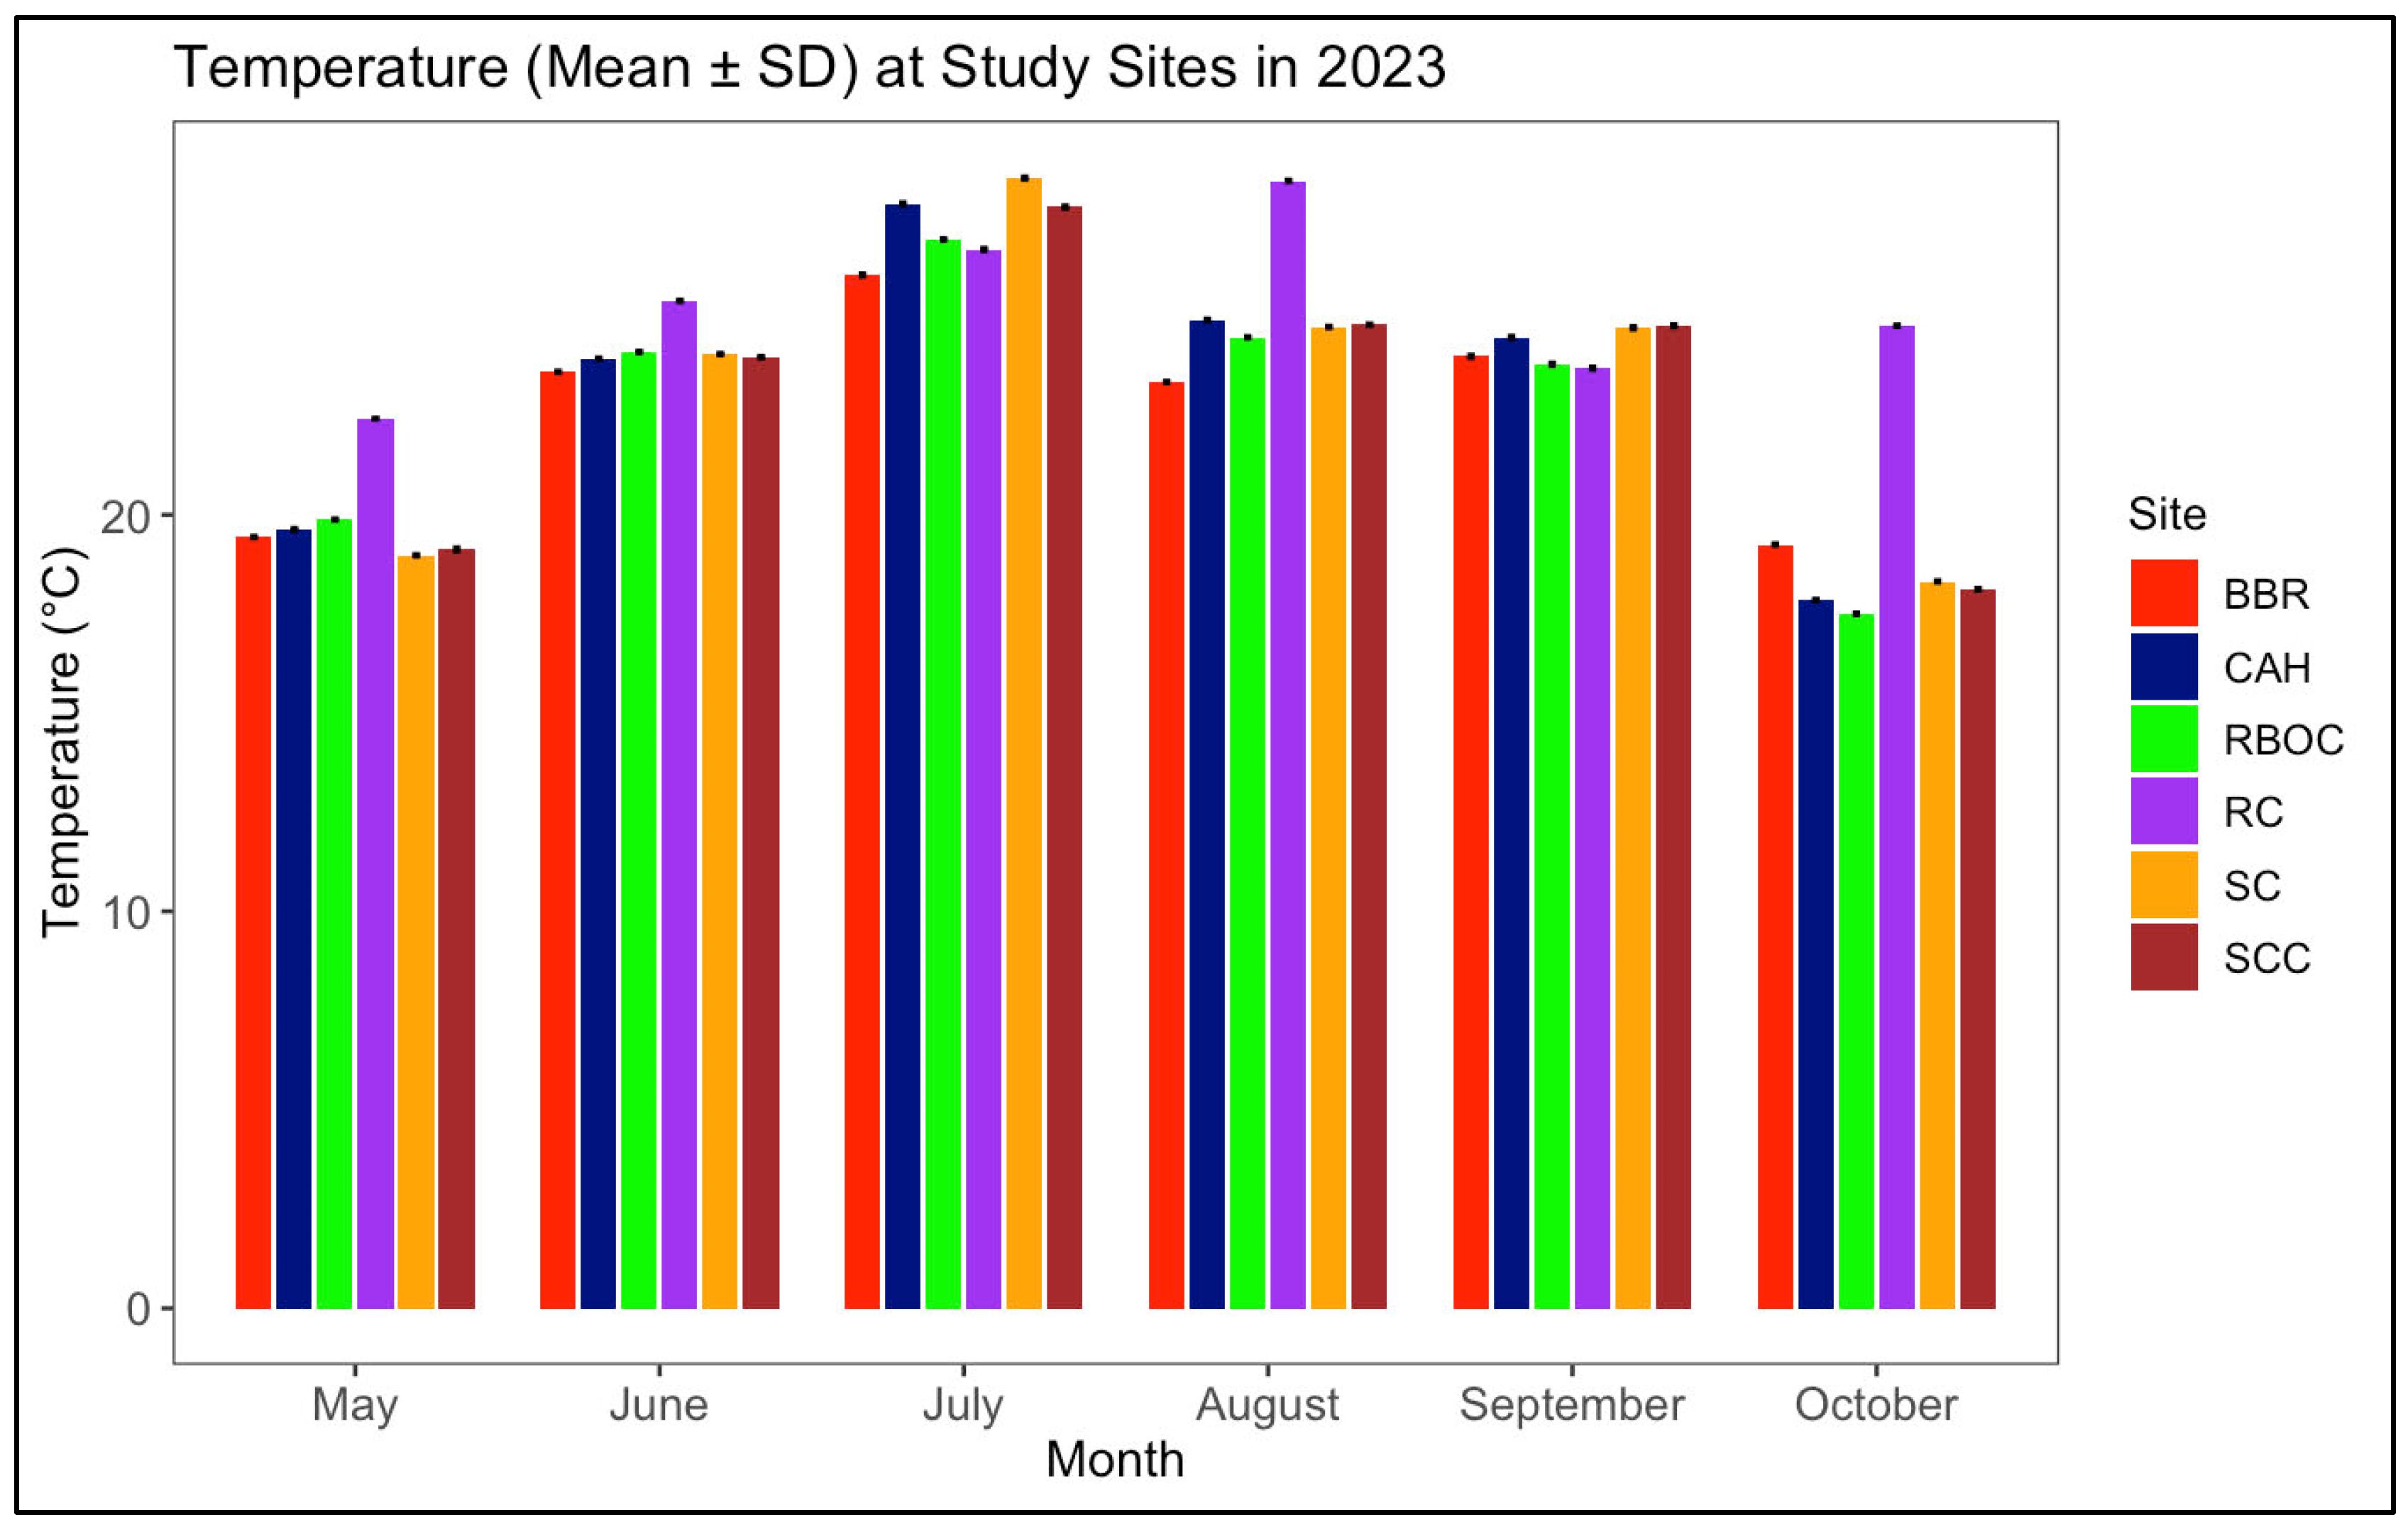
Based on our findings, temperature exhibited clear seasonal and interannual variation across study sites (Figure 5 and Figure 6). Overall, mean water temperatures declined from mid-summer to early fall in both study years, with an approximate 5 °C decrease observed between July and September when comparing 2022 and 2023. At aquaculture farms, temperatures ranged from 13 to 37 °C; at artificial reef sites, from 15 to 35 °C; and at control sites, from 14 to 36 °C. These temperature ranges are consistent with expected seasonal patterns in shallow estuarine systems and remained within tolerable limits for Callinectes sapidus throughout the sampling period.

3.1.4. Turbidity

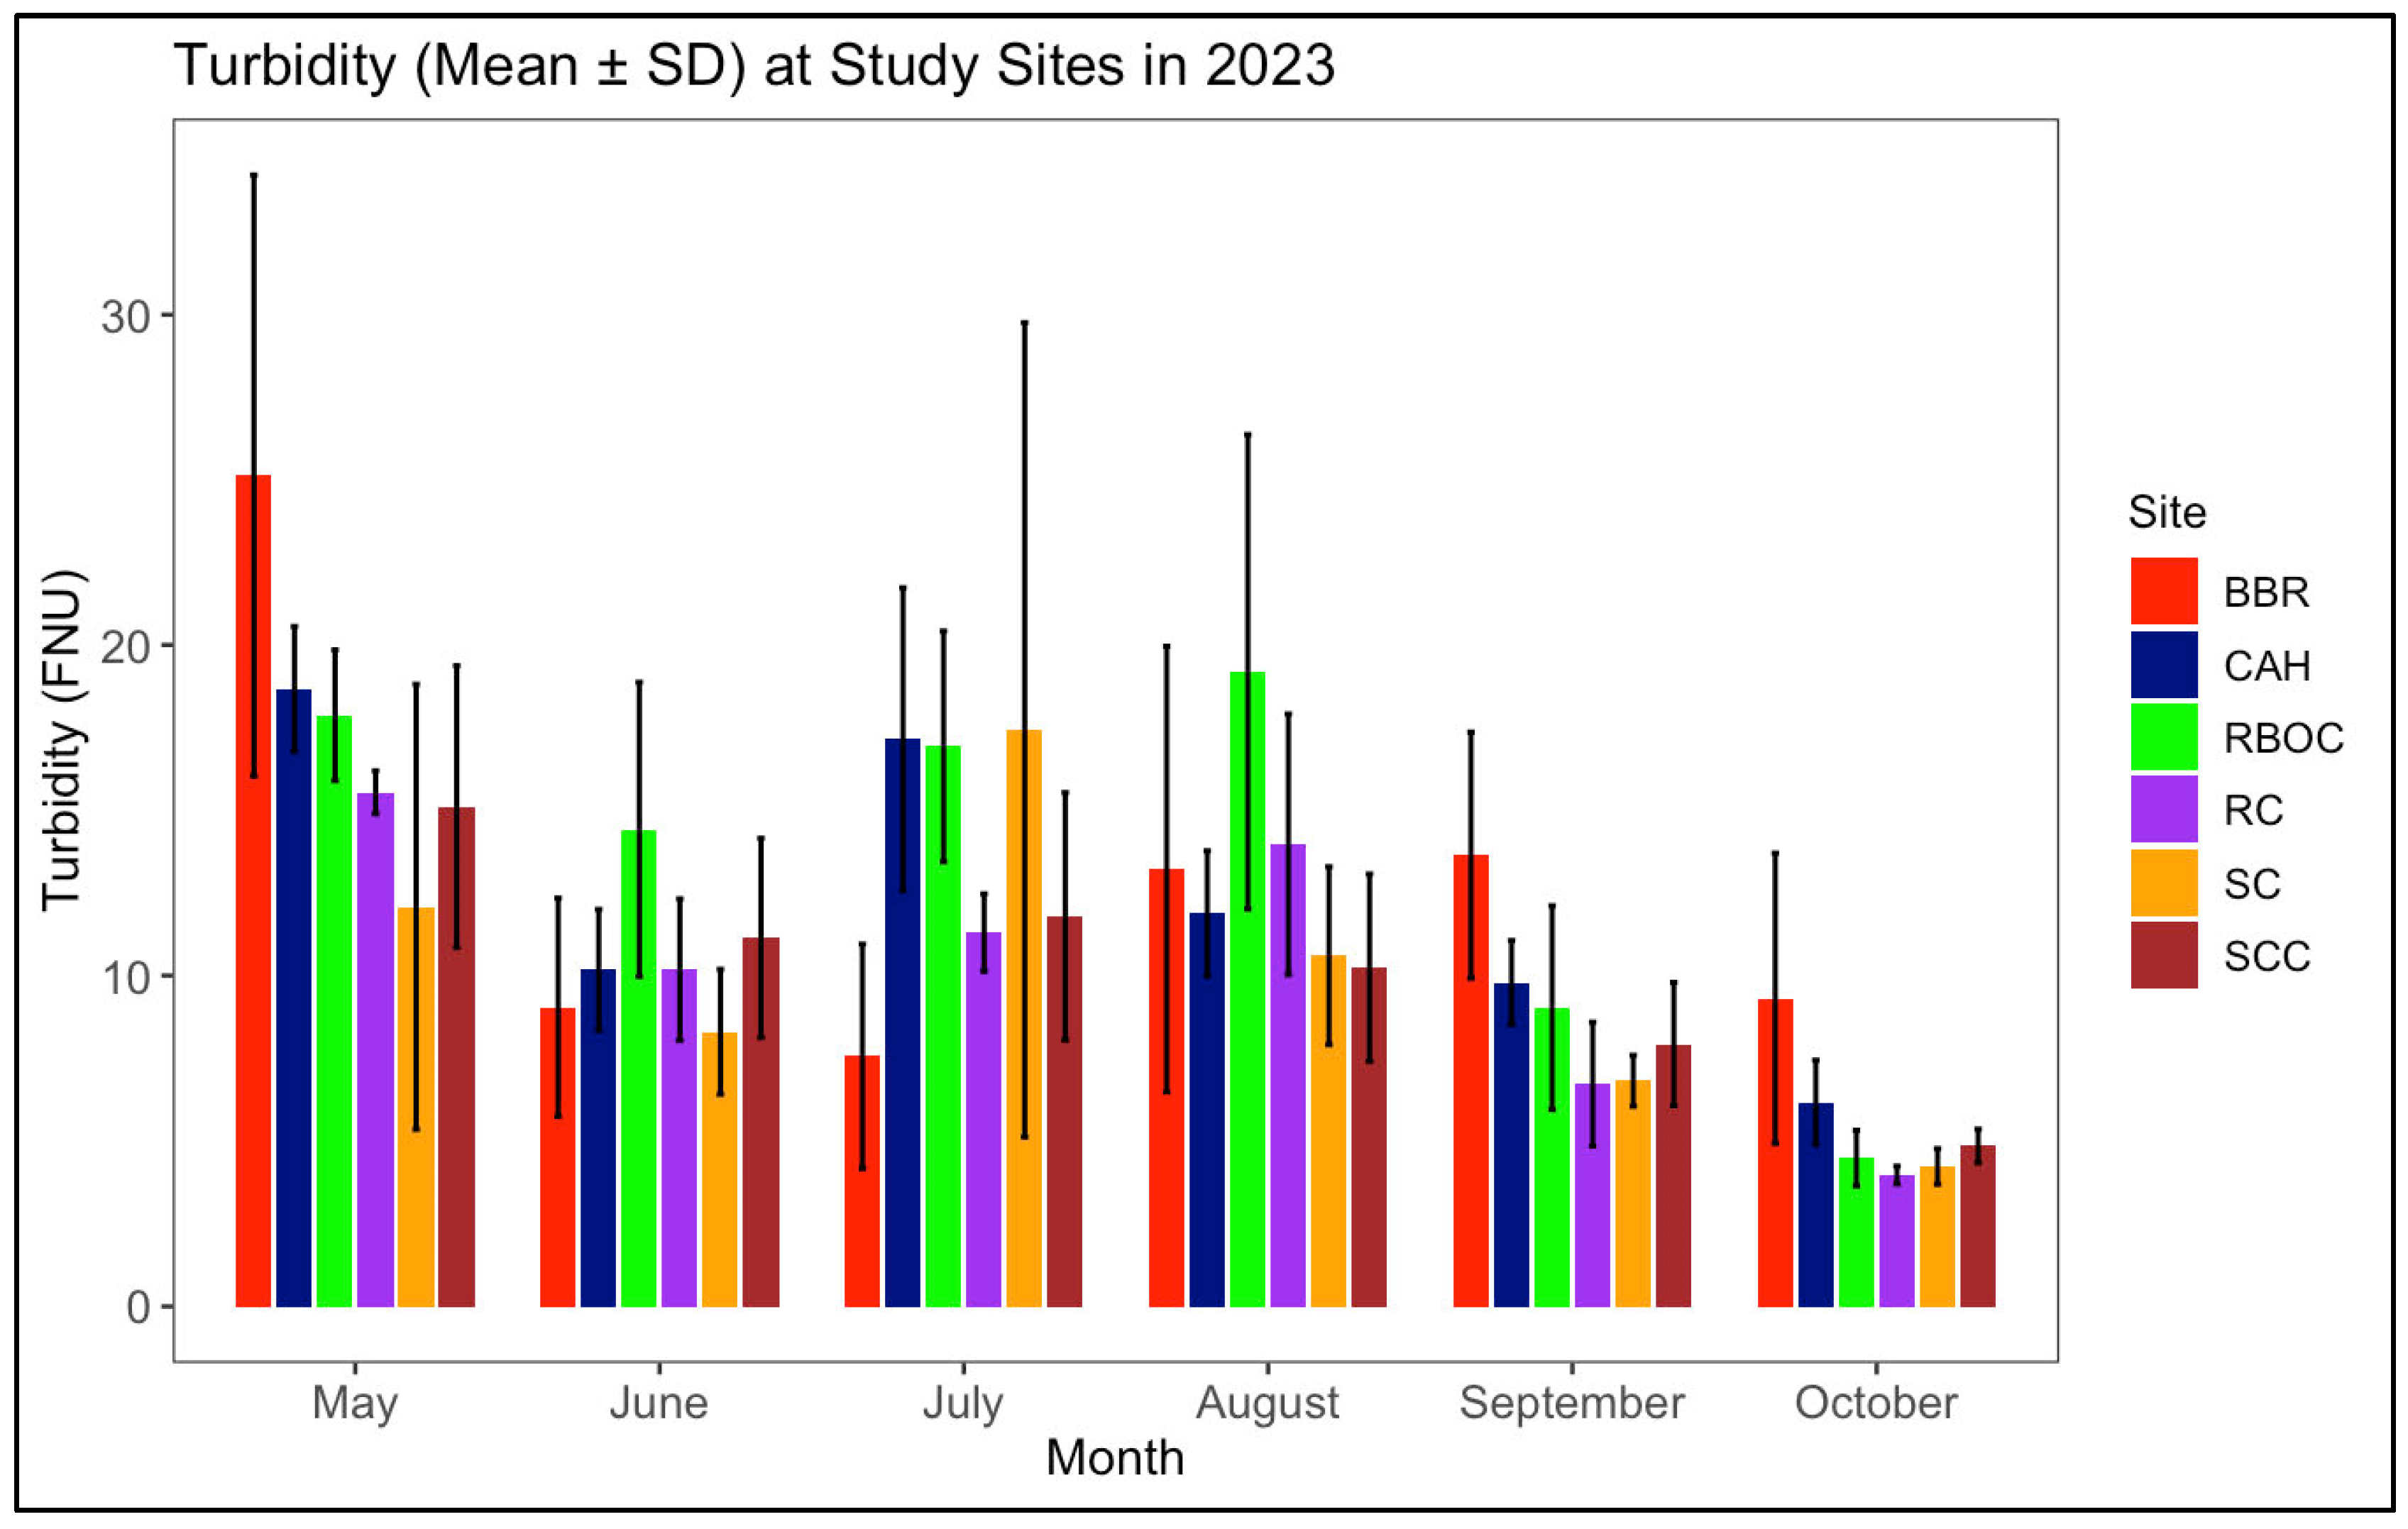
Turbidity was only recorded in 2023 due to instrument failures (Figure 7). The following results are the overall yearly average turbidity for 2023: BBR (12.98 ± 7.85), CAH (12.37 ± 4.97), RBOC (13.65 ± 6.50), RC (9.23 ± 4.13), SC (9.91 ± 6.93), and SCC (10.15 ± 4.13). Overall, turbidity levels were optimal for C. sapidus due to the crab’s tolerability. Monitoring turbidity is essential for C. sapidus because high levels can reduce light penetration, adversely affecting the growth of crucial aquatic plants, phytoplankton, and seagrass, which serve as vital habitats and food sources within their ecosystem. Additionally, increased turbidity can impair the crabs’ respiratory function by clogging their gills and hindering their ability to locate food and evade predators, ultimately impacting their health and overall population dynamics.

3.1.5. Alkalinity

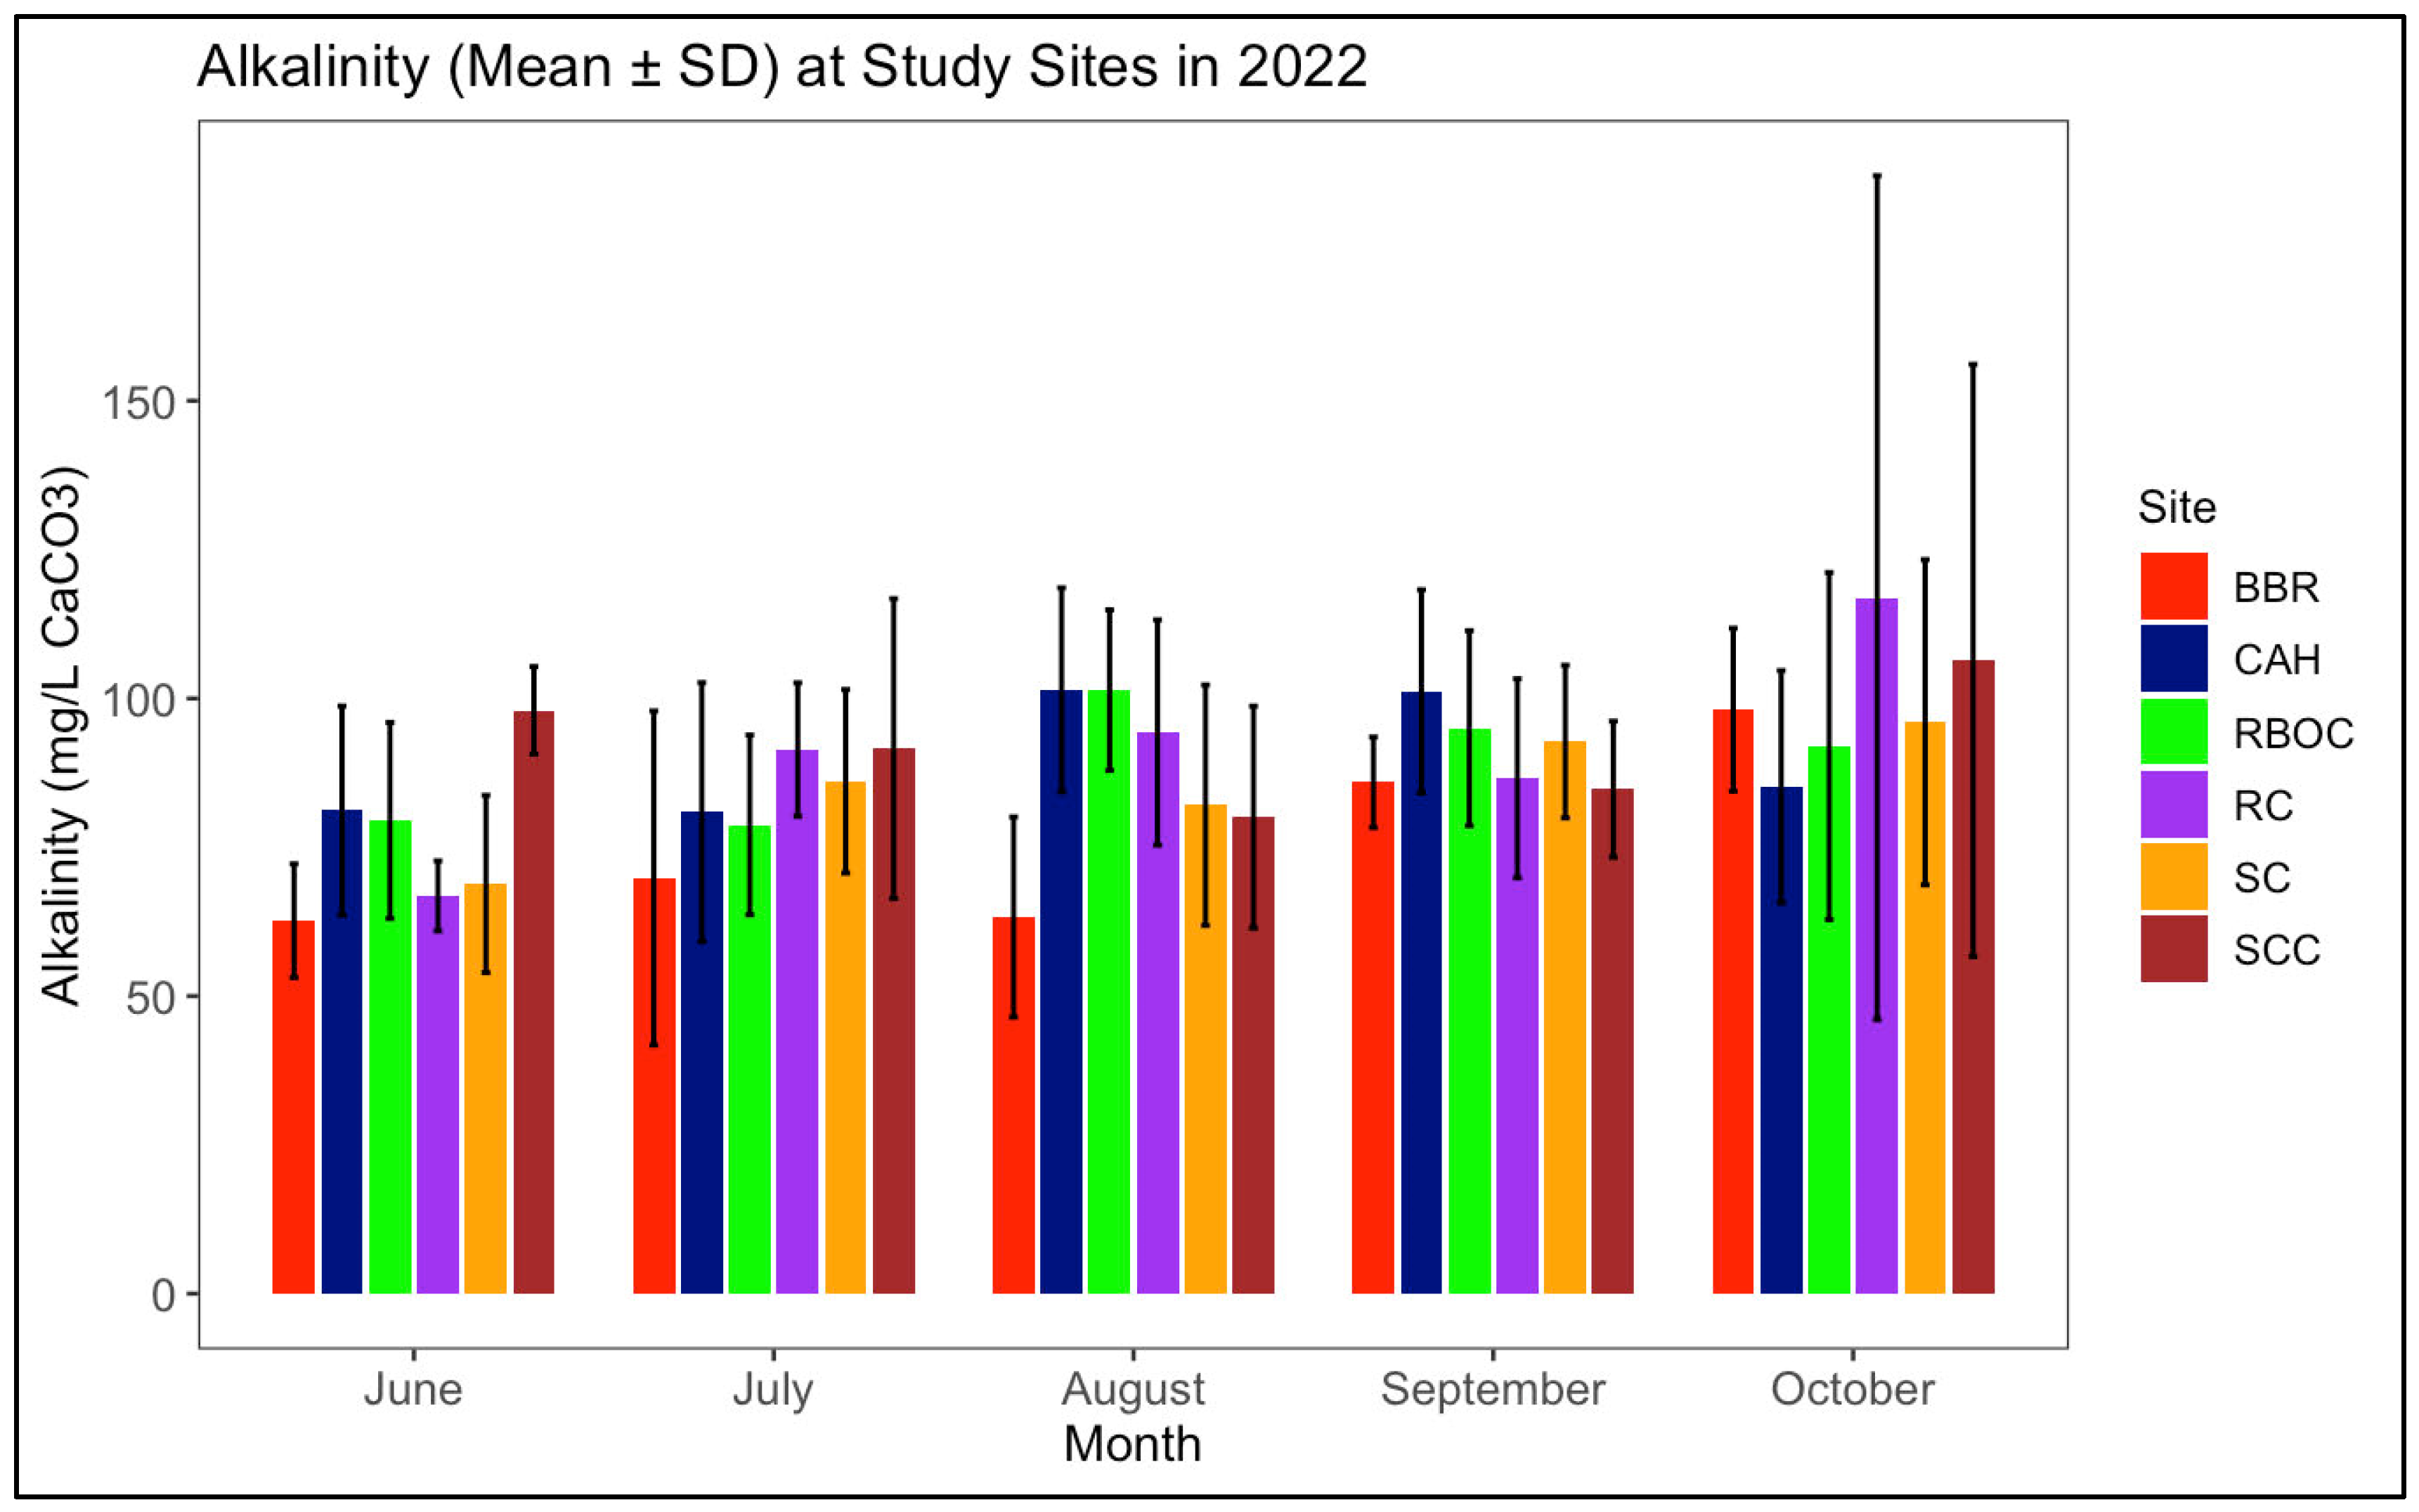
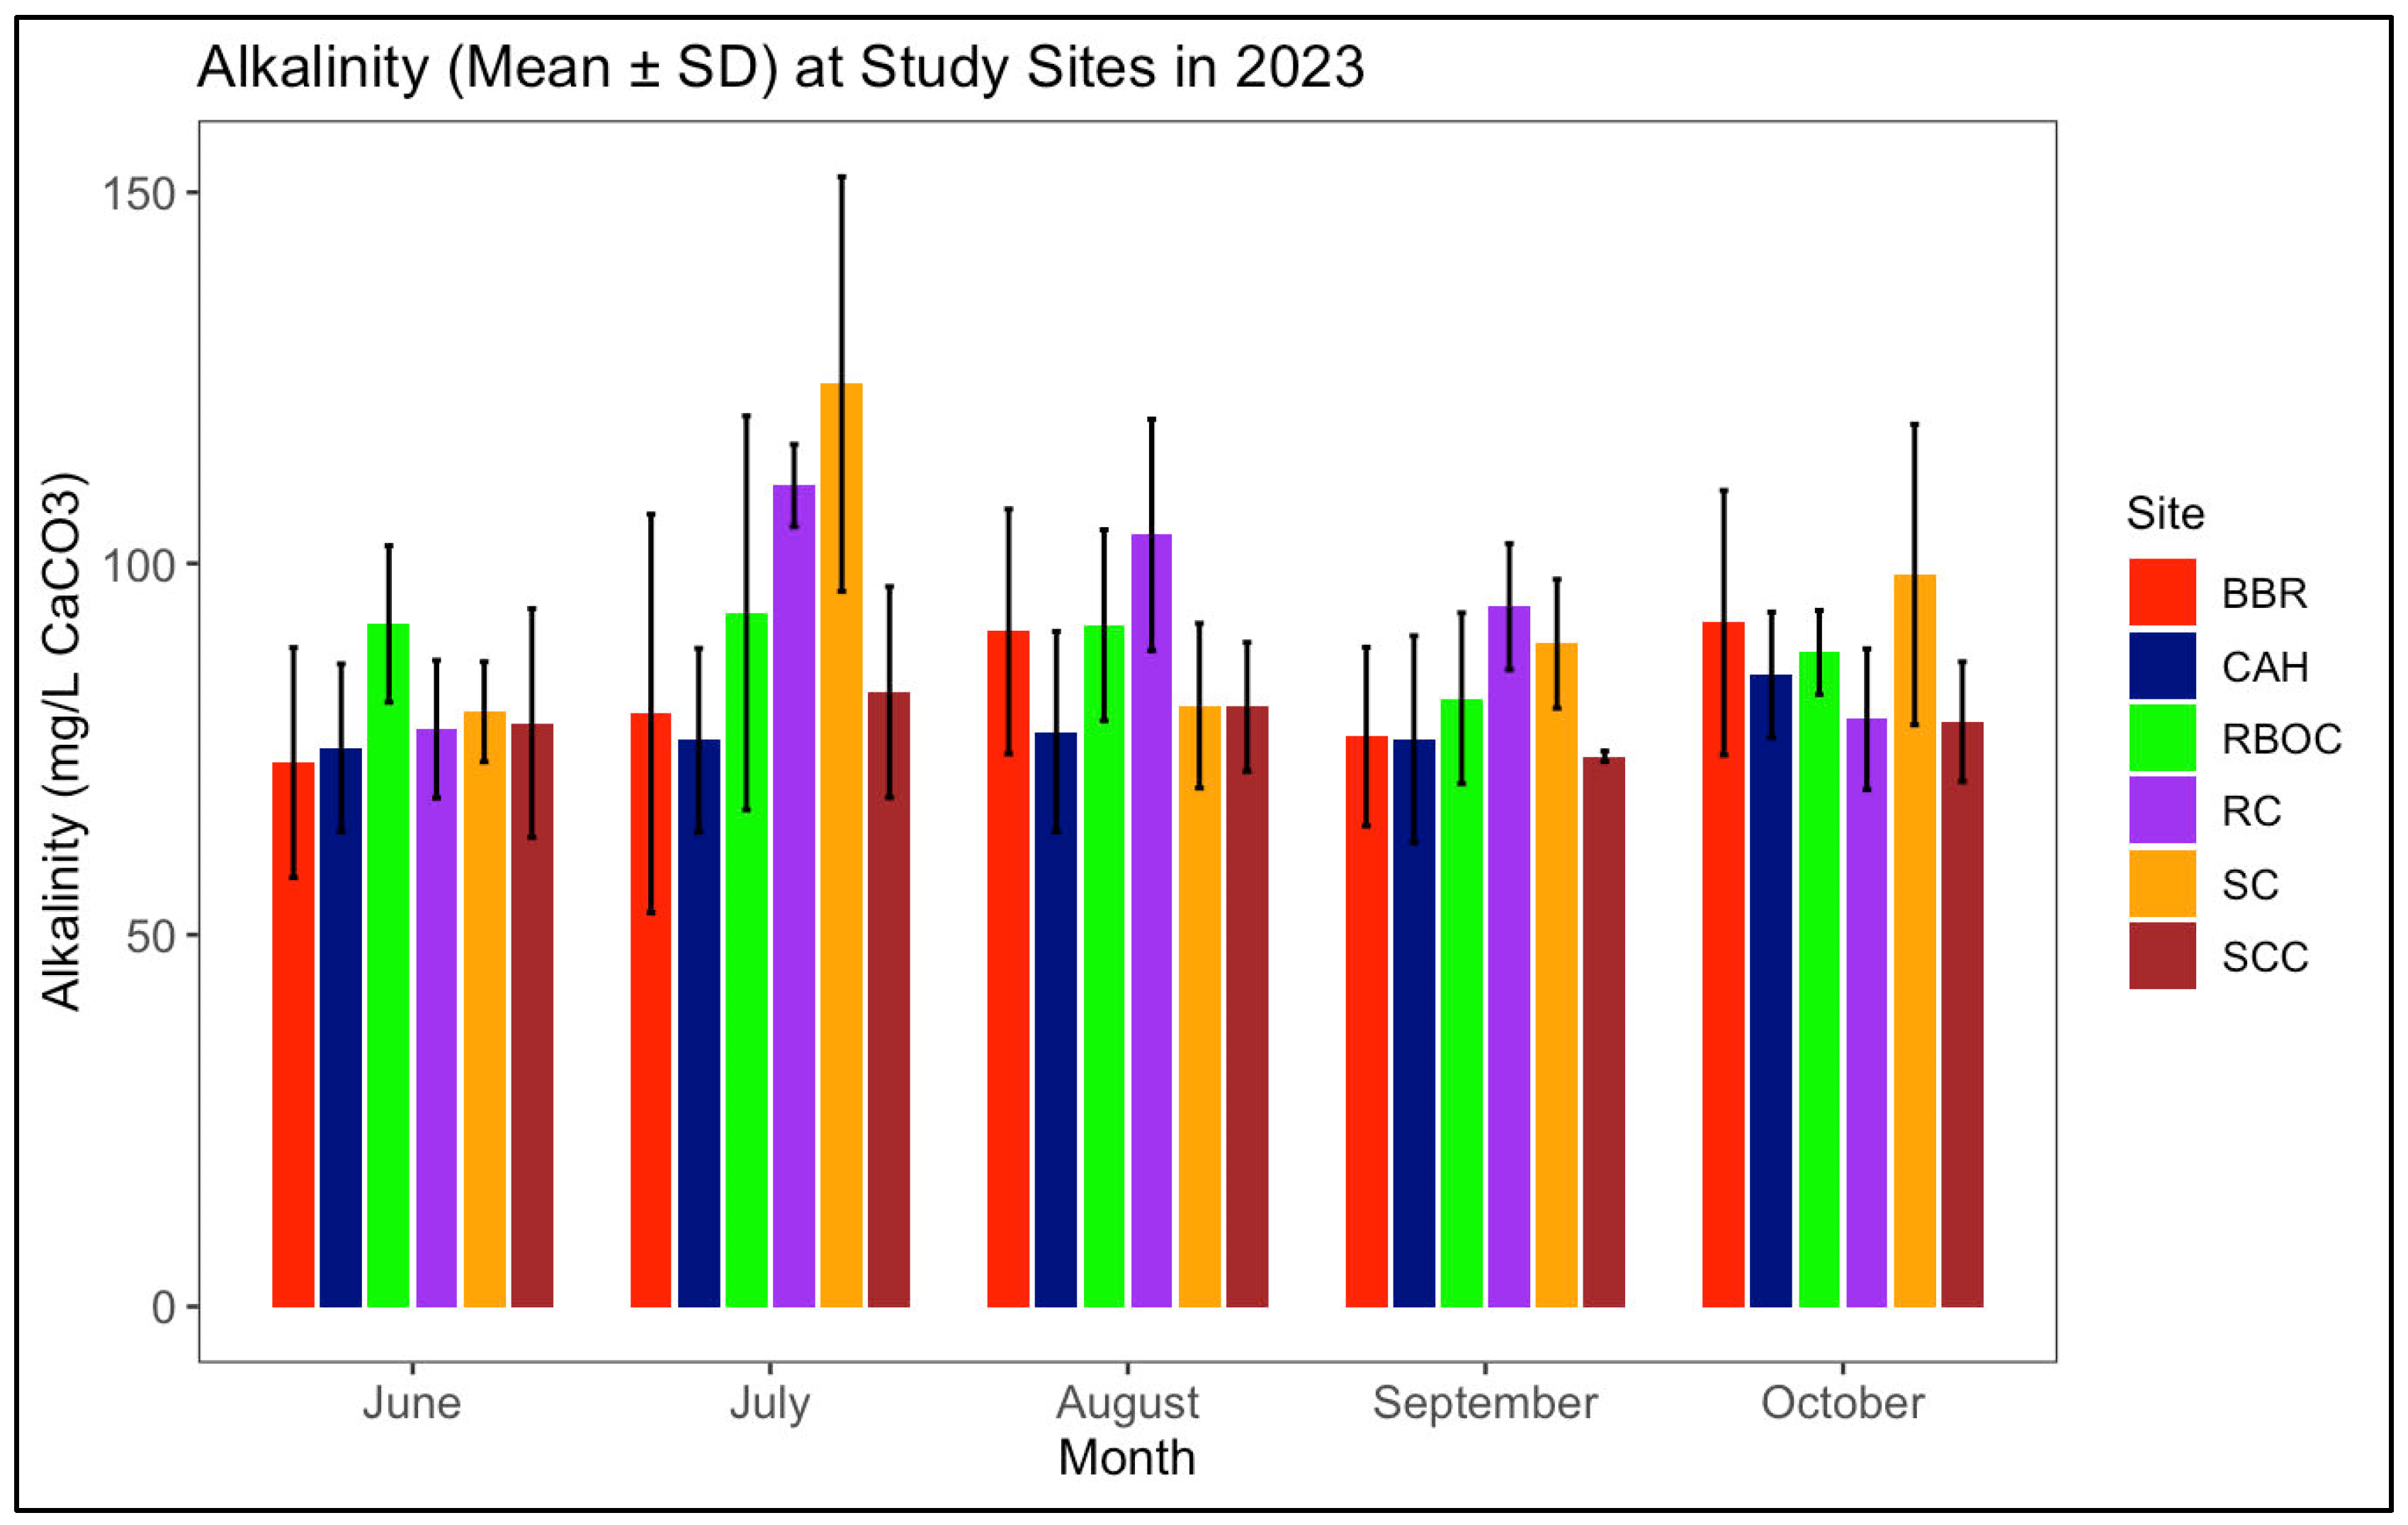
The alkalinity levels across both study years were within optimal ranges, with no levels of concern (Figure 8 and Figure 9). The following results are the overall yearly average alkalinity for 2022: BBR (76.69 ± 21.86), CAH (91.23 ± 20.01), RBOC (90.33 ± 20.10), RC (93.65 ± 36.01), SC (87.32 ± 20.12), and SCC (91.09 ± 27.99). The following results are the overall yearly average alkalinity for 2023: BBR (82.74 ± 21.43), CAH (79.60 ± 15.29), RBOC (91.06 ± 14.89), RC (92.61 ± 18.63), SC (94.31 ± 23.87), and SCC (82.82 ± 15.02). Although the recommended alkalinity level for C. sapidus is around 100 mg/L, the BBR reading is not of concern due to the species’ high tolerance to varying alkalinity levels. Changes in alkalinity can negatively impact their growth and calcification processes, as well as affect the health of the surrounding ecosystem. In a recent study focusing on similar study sites, with the exception of RC (control site) in 2022 and 2023, pH levels remained optimal, ranging from 7.83 ± 0.35 to 7.77 ± 0.46, respectively [27].

3.1.6. Calcium Hardness

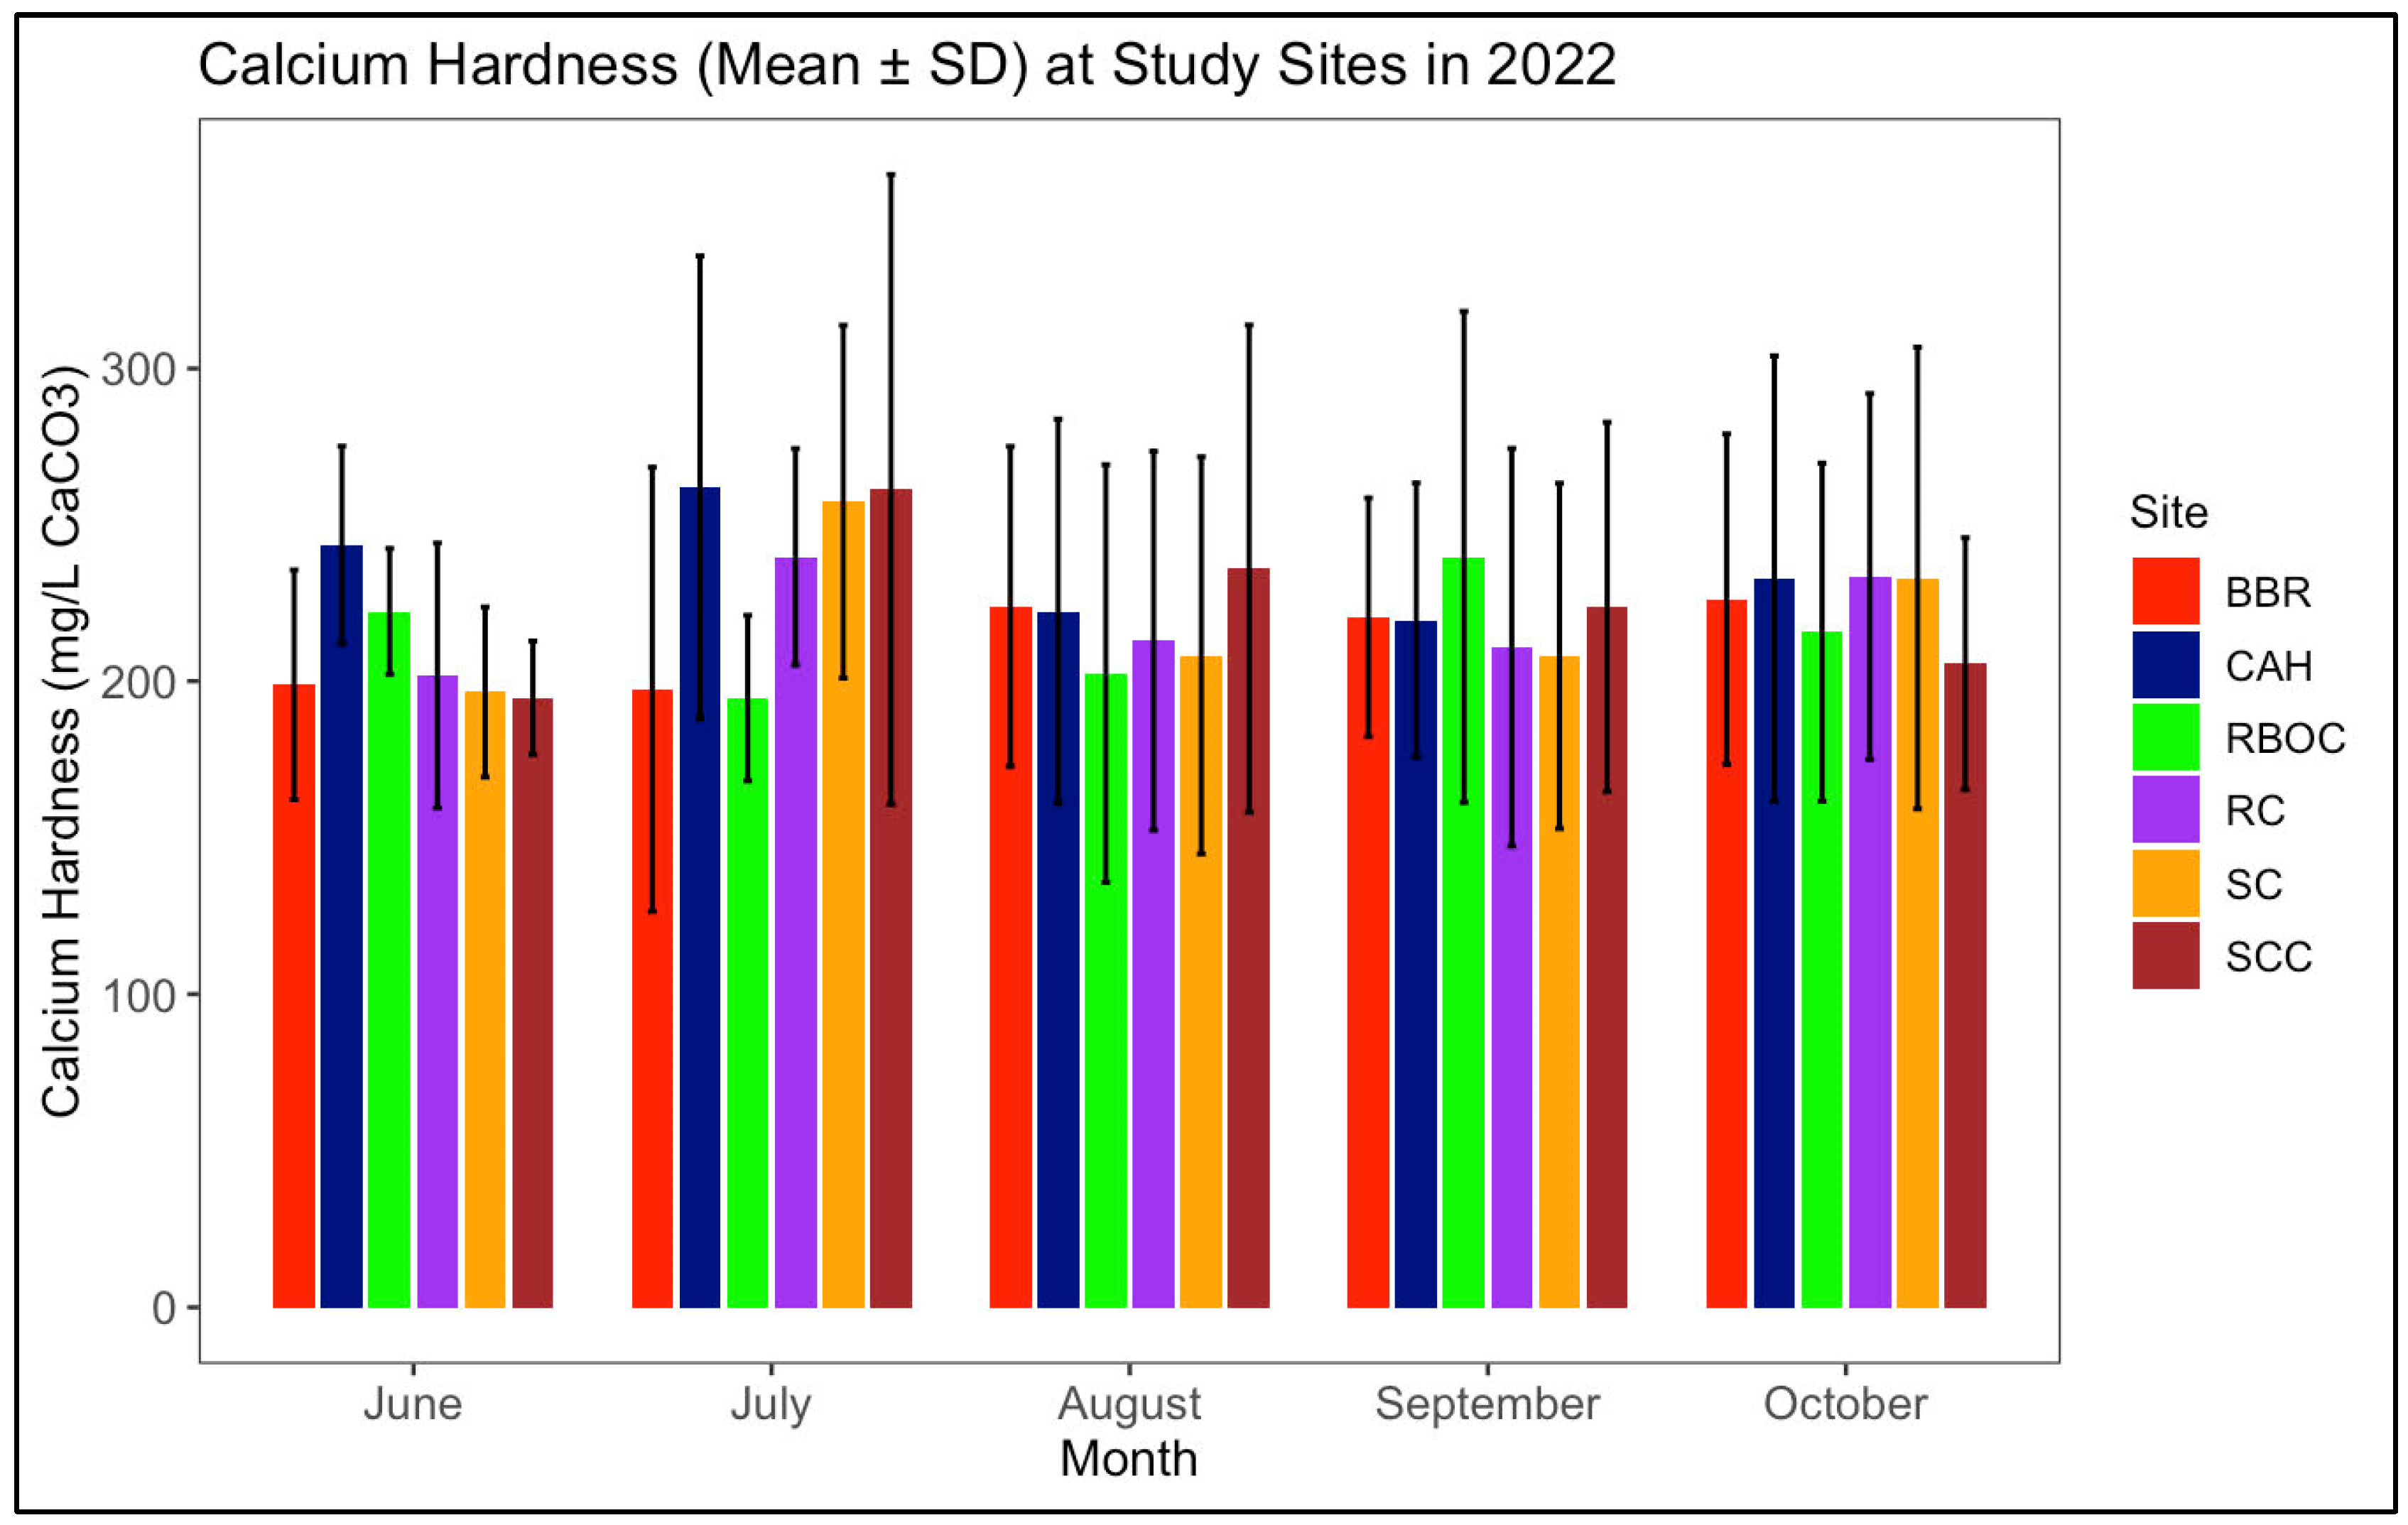
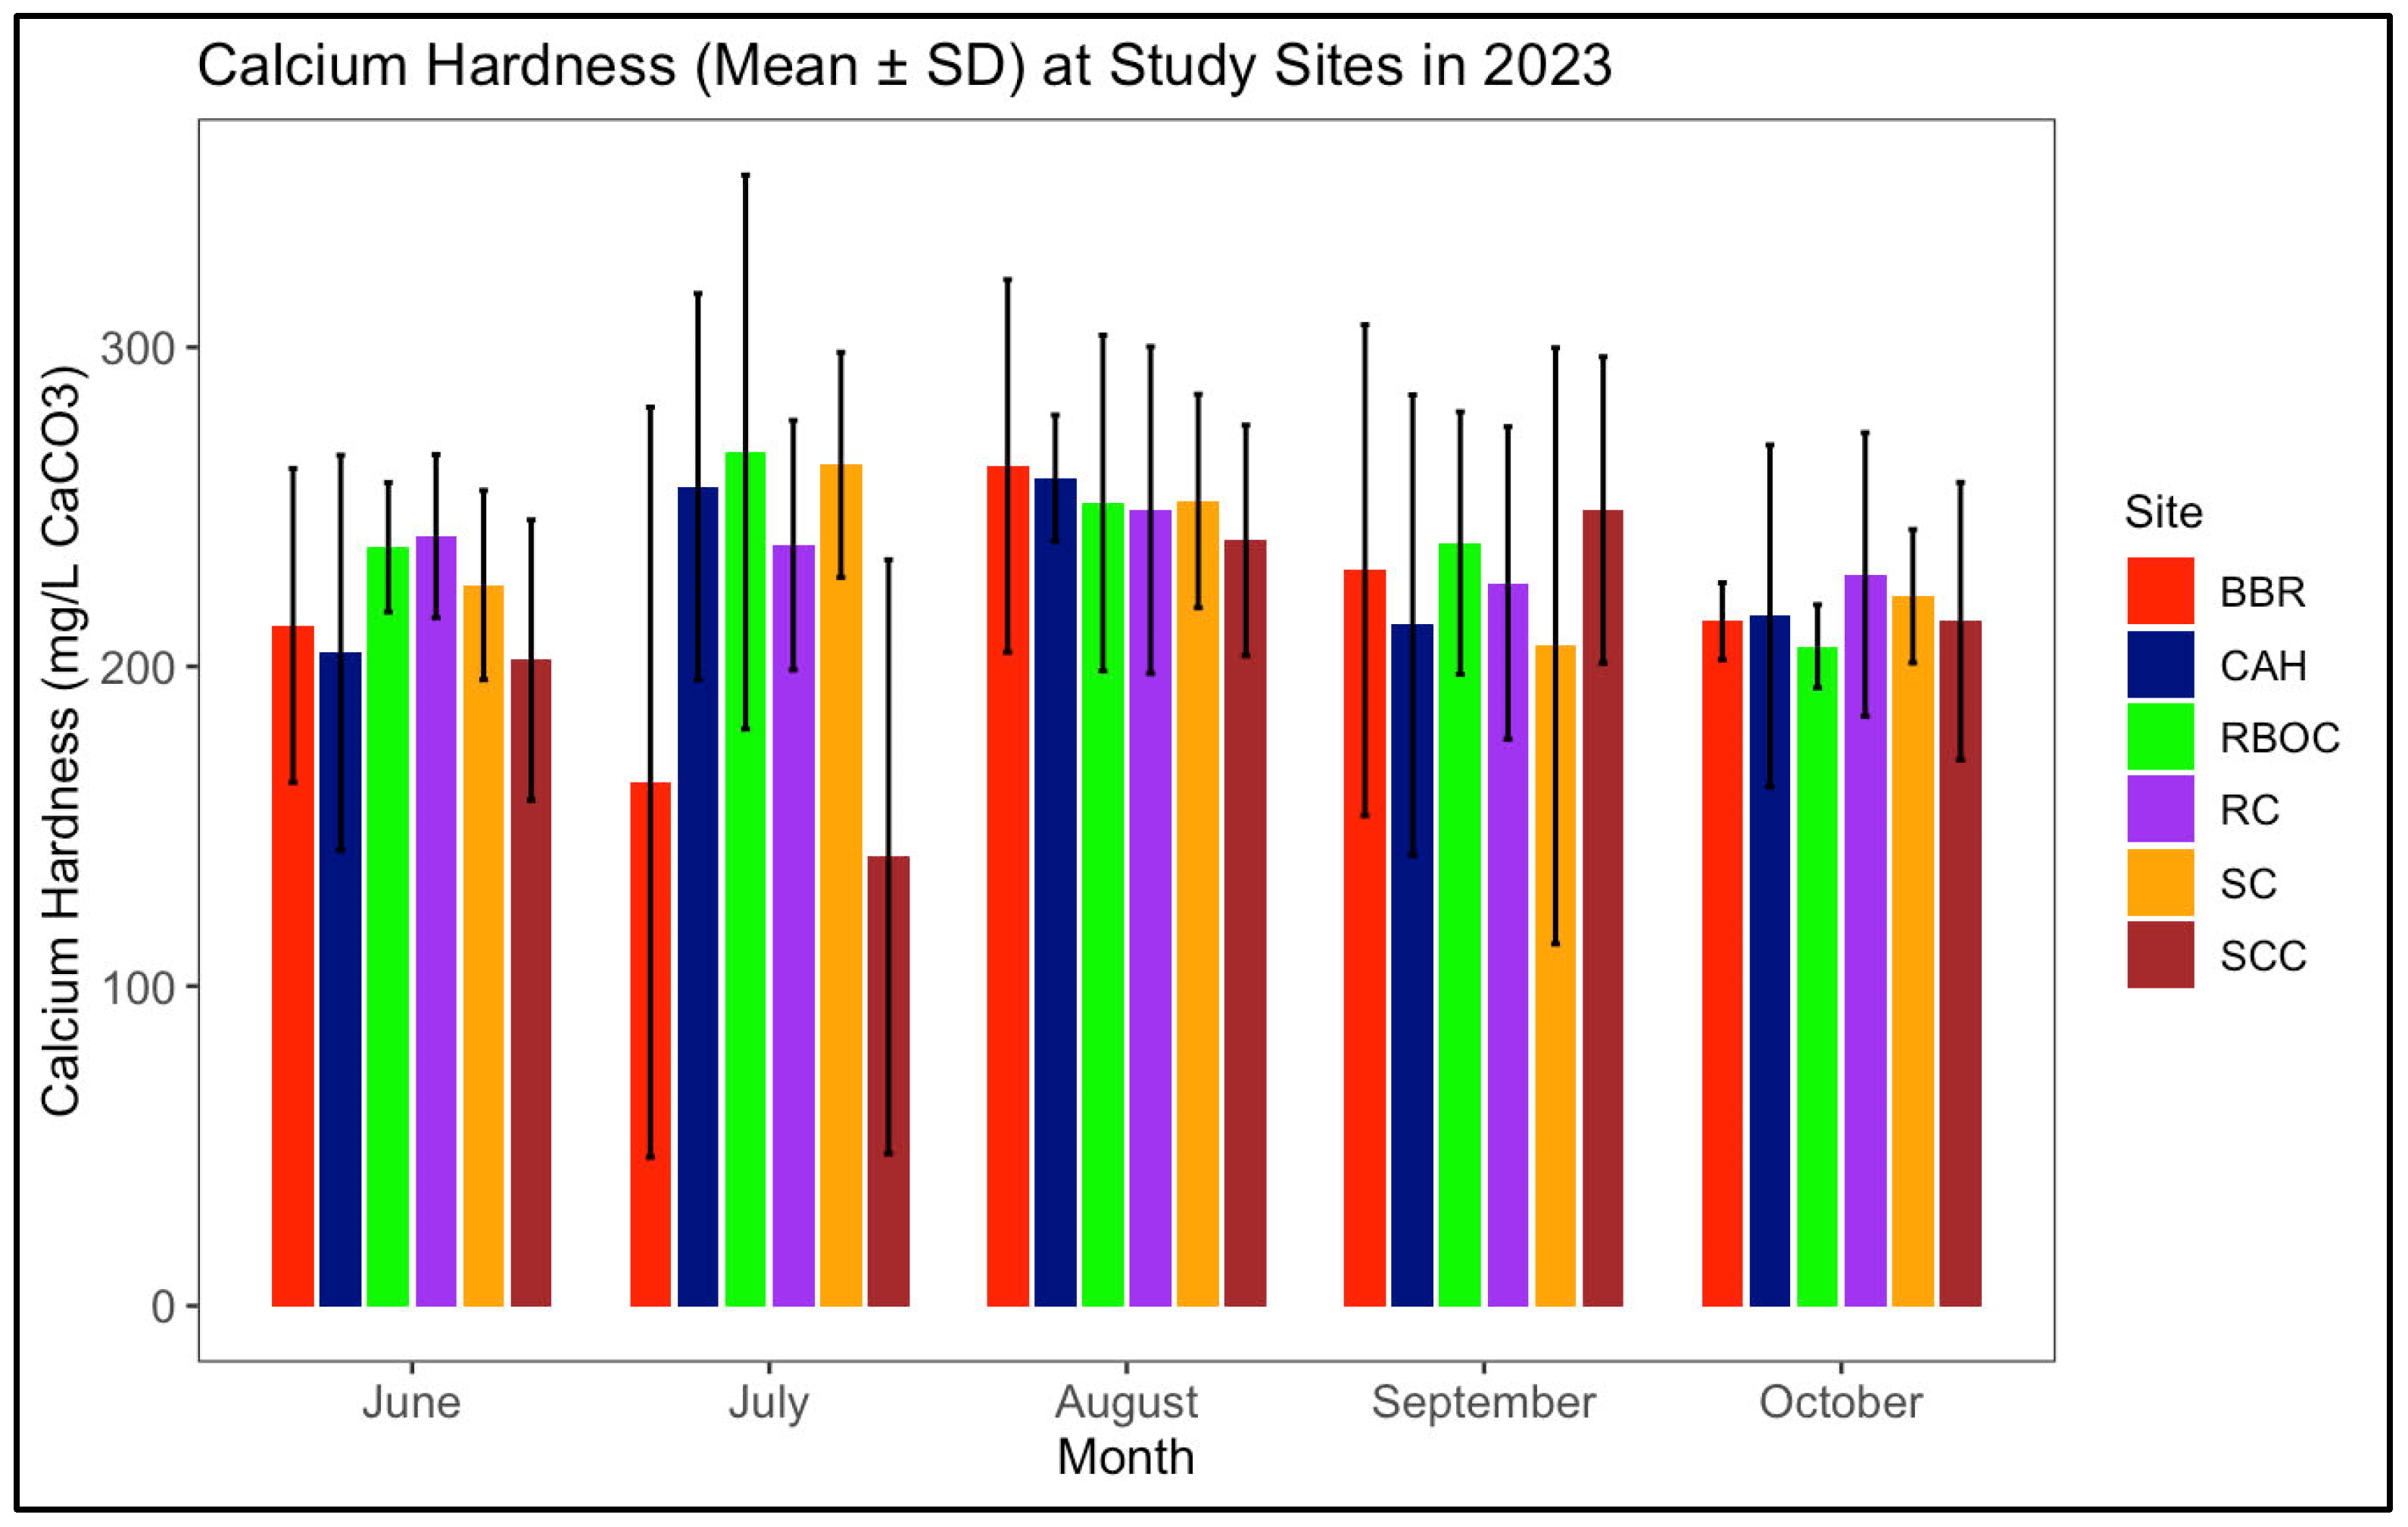
The findings demonstrated that calcium hardness levels in both study years were optimal, with no levels of concern (Figure 10 and Figure 11). The following results are the overall yearly average calcium hardness for 2022: BBR (217.08 ± 51.12), CAH (234.47 ± 60.03), RBOC (217.02 ± 58.72), RC (221.28 ± 54.49), SC (223.03 ± 62.40), and SCC (226.80 ± 69.58). The following results are the overall yearly average calcium hardness for 2023: BBR (217.75 ± 67.95), CAH (225.31 ± 54.16), RBOC (237.00 ± 48.49), RC (236.75 ± 40.64), SC (224.39 ± 53.35), and SCC (202.08 ± 62.08). Although the recommended calcium hardness level for C. sapidus should be around 280 mg/L, the SCC level is not concerning due to the crab’s high tolerability. Calcium hardness is crucial to monitor for C. sapidus because it influences the overall health of the aquatic environment.

3.1.7. Chlorophyll-a

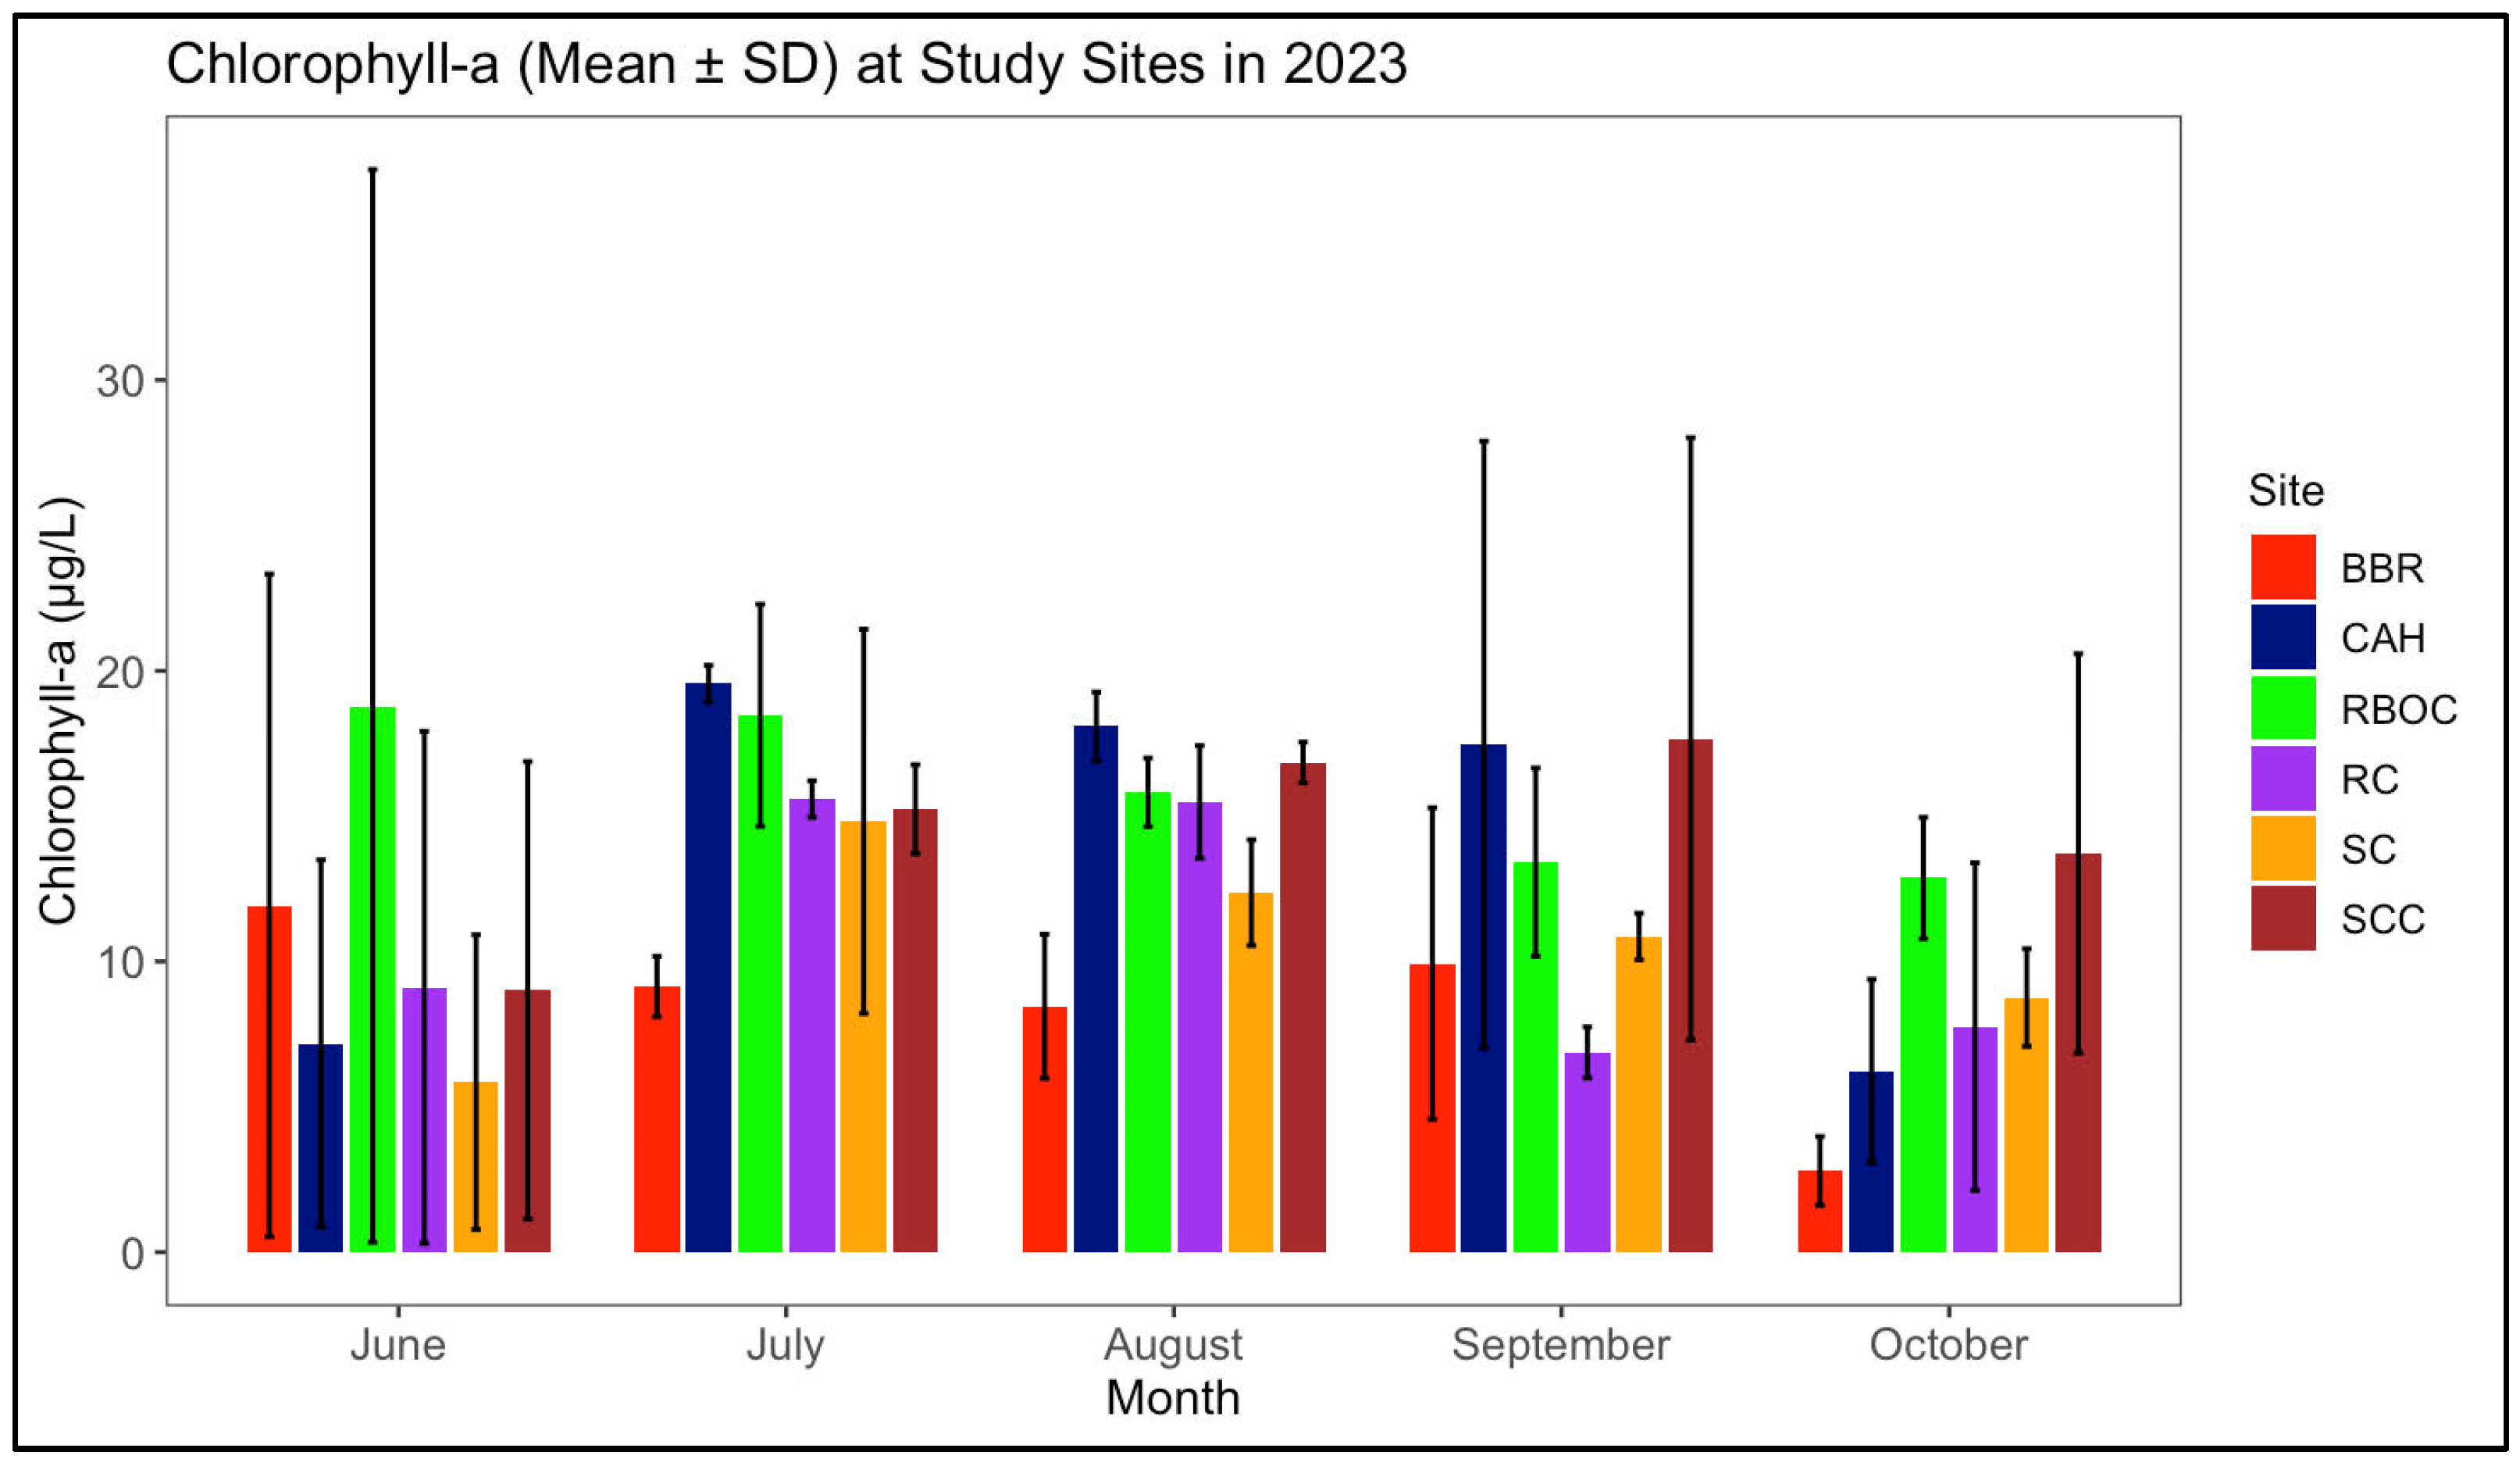
Chlorophyll-a was only recorded in 2023 due to the utilization of a new instrument (Figure 12). The following results are the overall yearly average chlorophyll-a for 2023: BBR (8.45 ± 6.21), CAH (12.89 ± 7.73), RBOC (15.95 ± 8.35), RC (10.96 ± 5.96), SC (10.53 ± 4.78), and SCC (14.49 ± 6.89). Overall, chlorophyll-a levels were not significantly concerning for C. sapidus. The recorded levels of chlorophyll-a indicate a productive environment that supports phytoplankton growth, which in turn contributes to a valuable food web for both juvenile and adult C. sapidus, as they feed on plants, smaller fish, and detritus. On the contrary, elevated chlorophyll-a levels can lead to algal blooms and poor turbidity conditions in the bay, which may negatively impact overall ecosystem health and habitat quality for blue crabs.

3.1.8. Nitrite

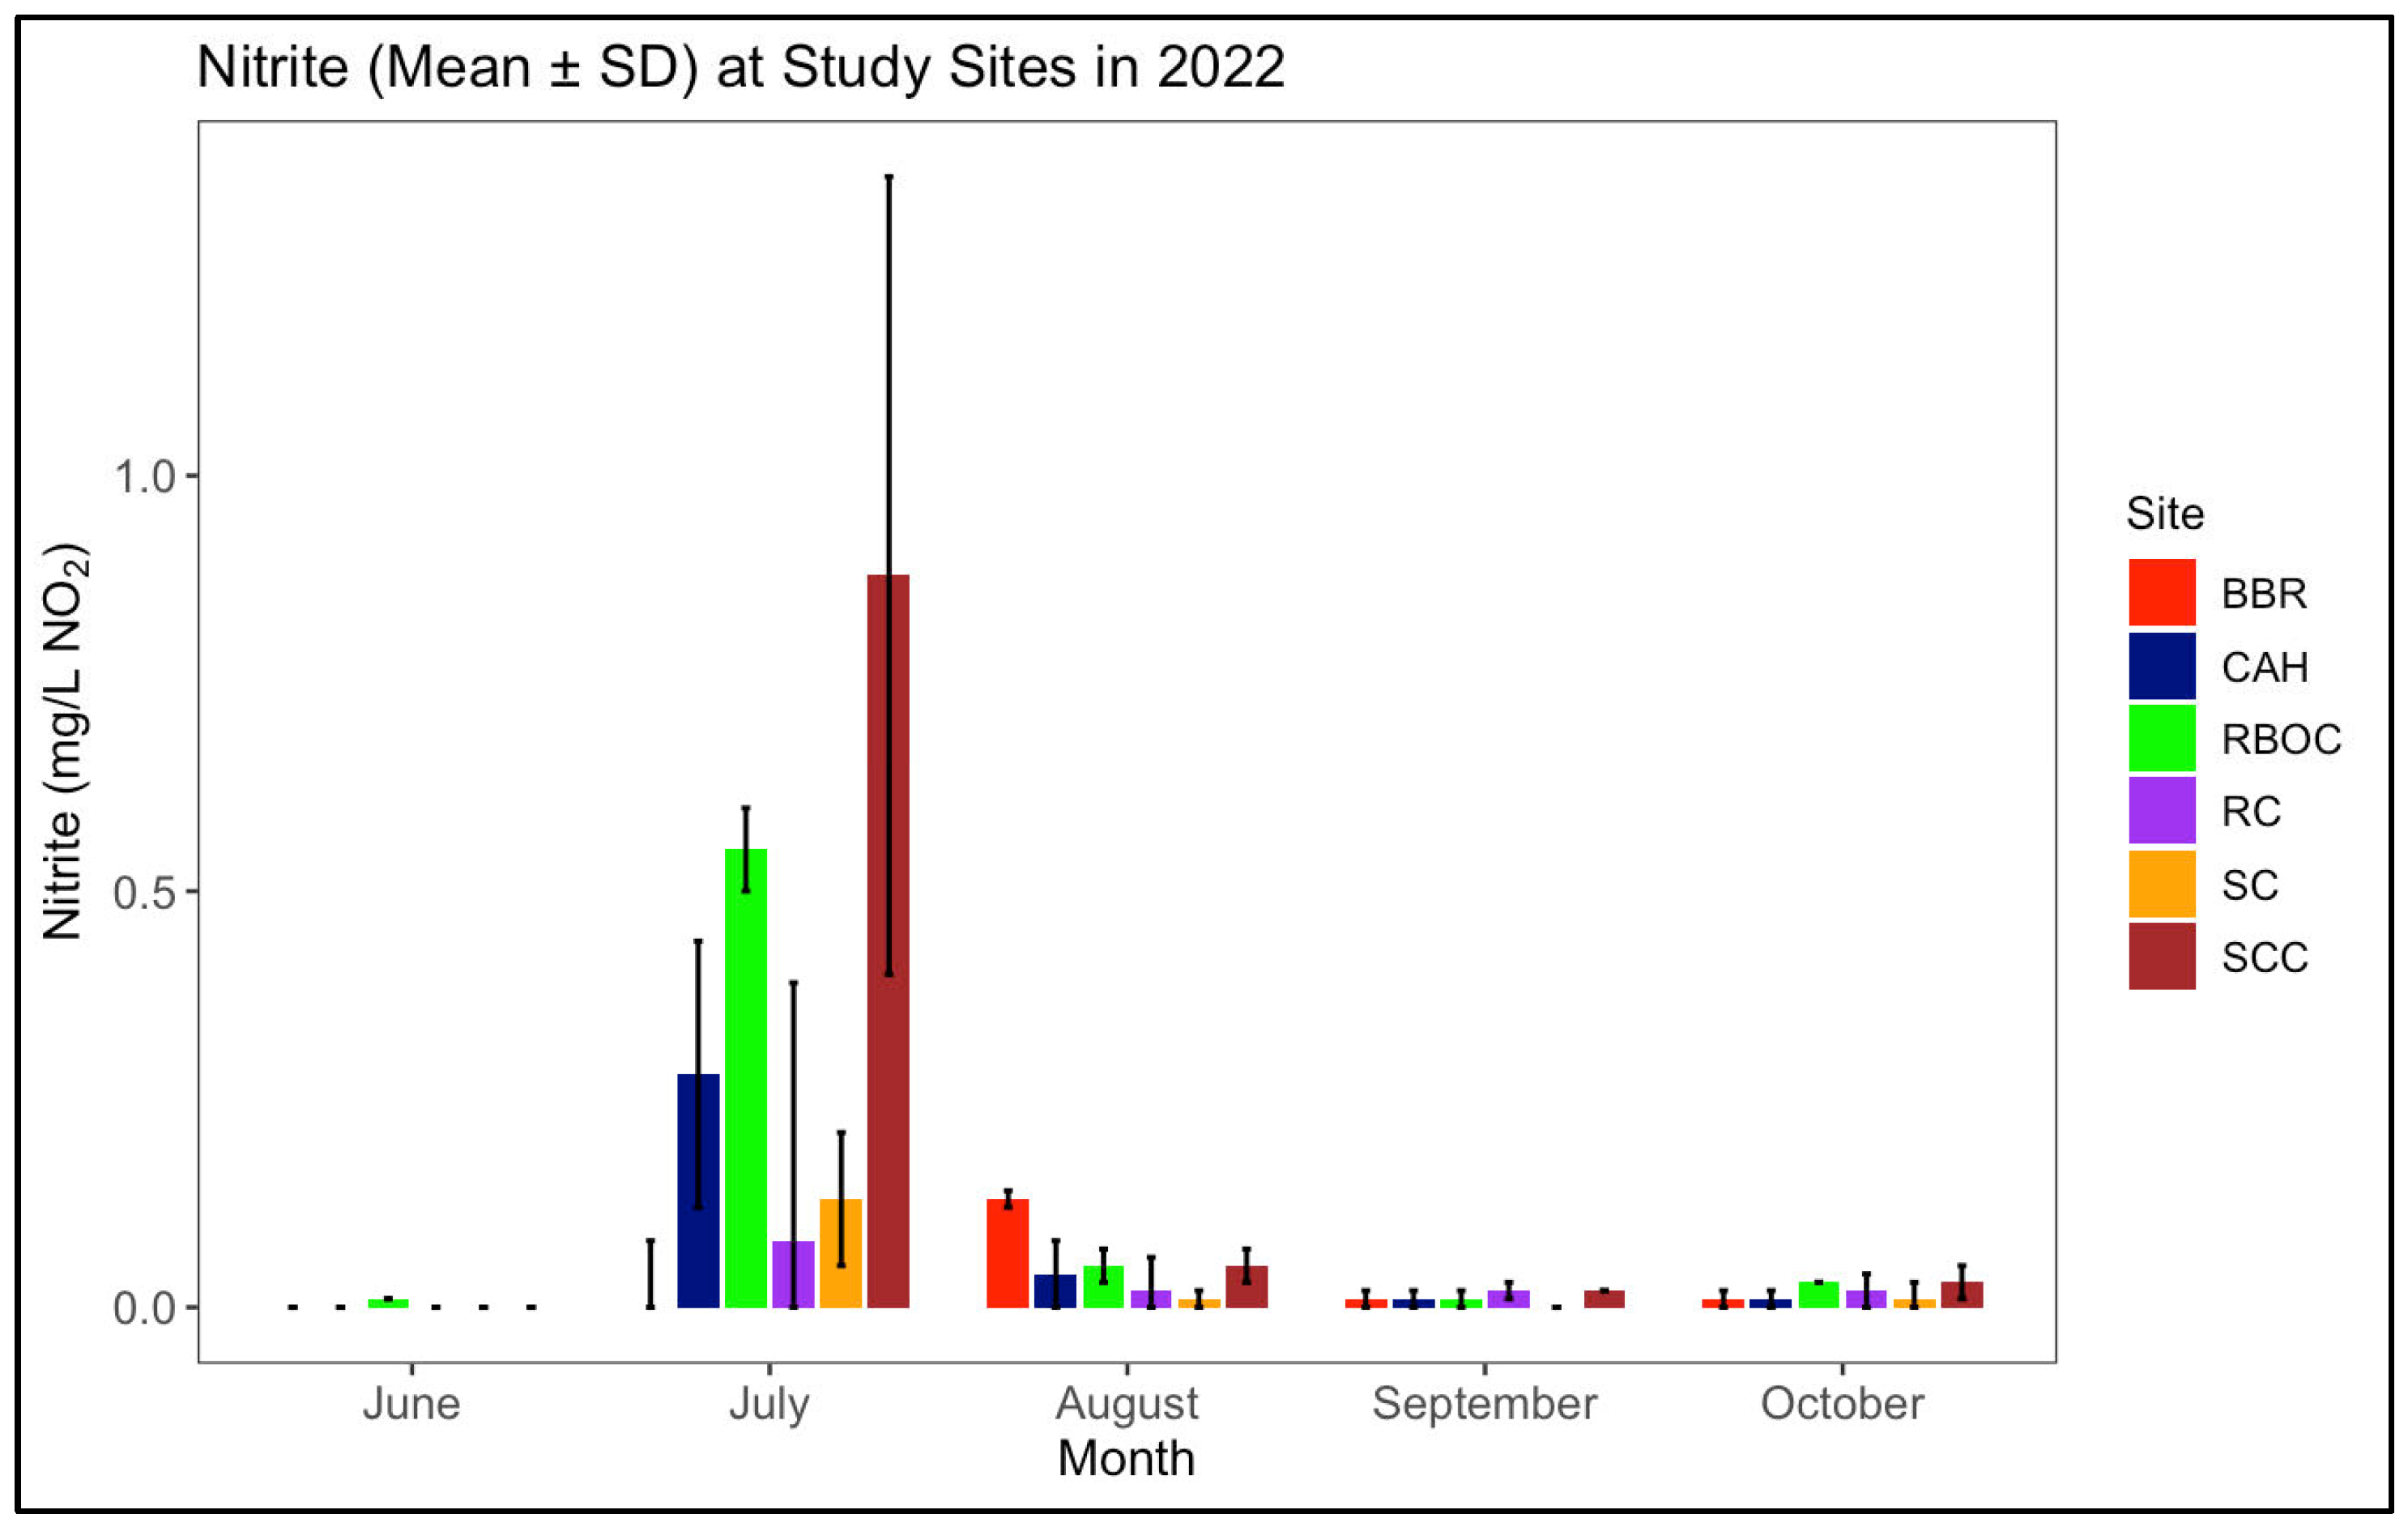
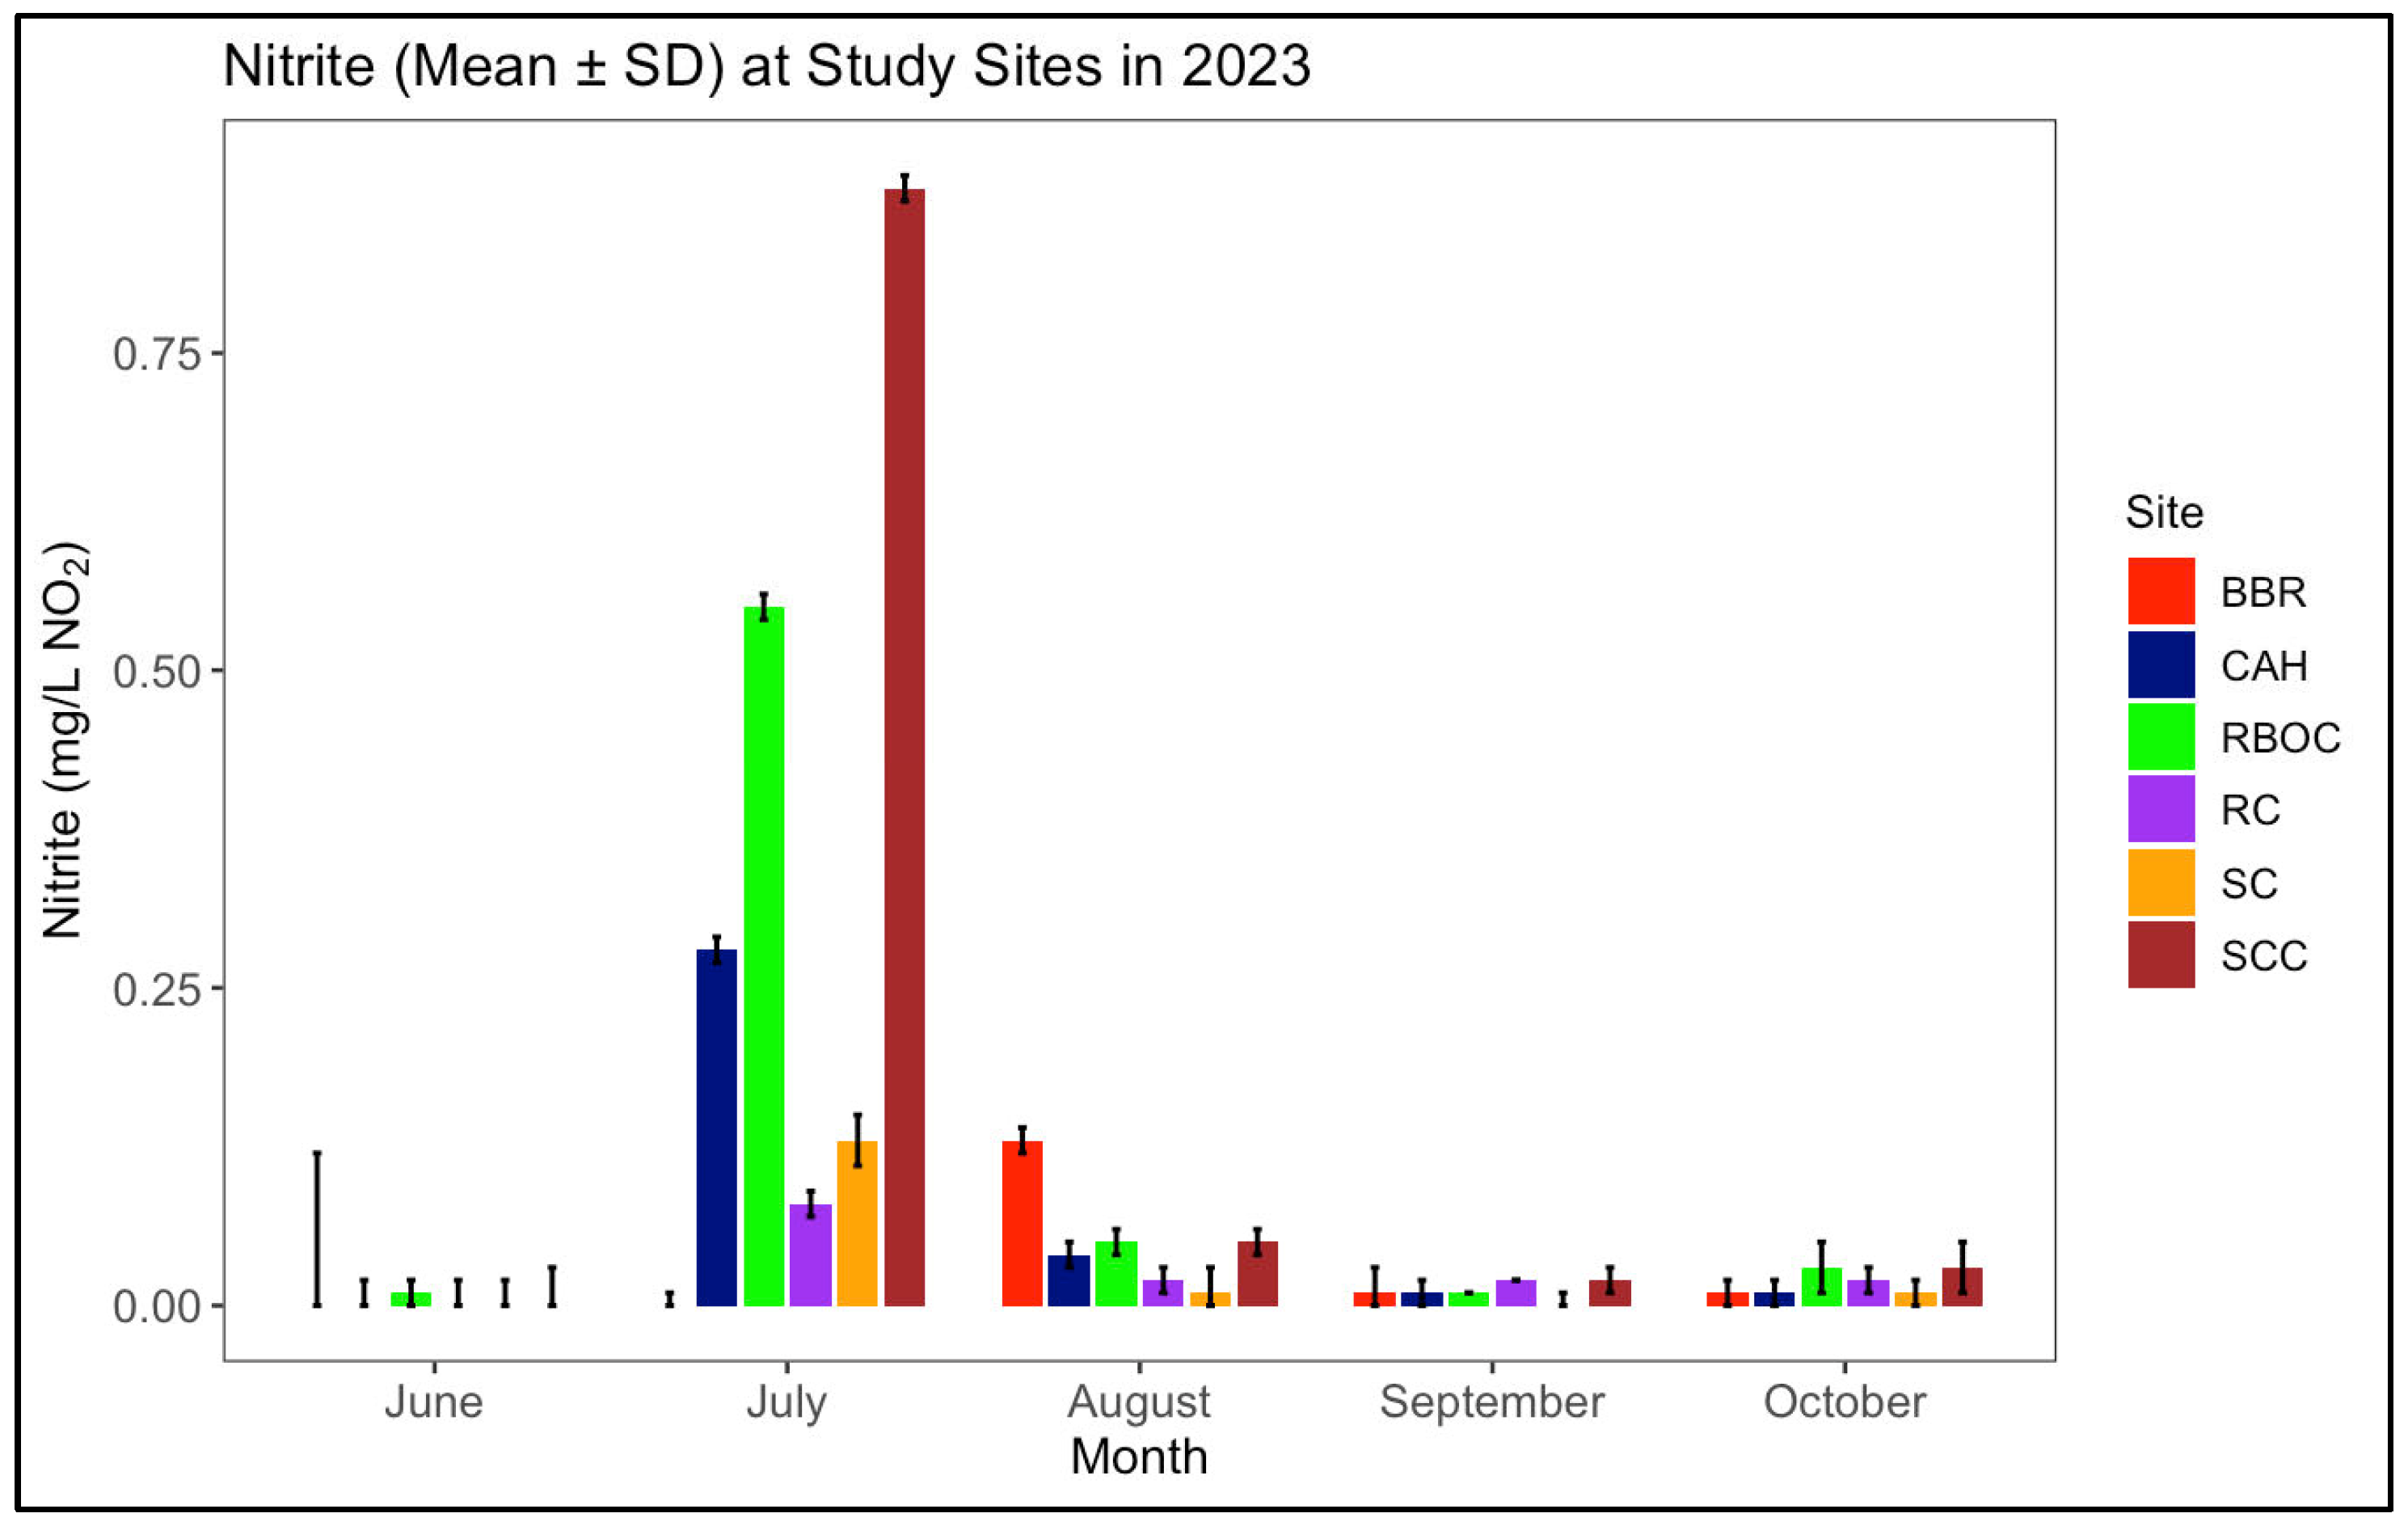
Nitrite levels across both study years remained within optimal ranges, with no cause for concern (Figure 13 and Figure 14). The following results are the overall yearly average nitrite for 2022: BBR (0.02 ± 0.07), CAH (0.05 ± 0.14), RBOC (0.08 ± 0.27), RC (0.02 ± 0.04), SC (0.03 ± 0.07), and SCC (0.12 ± 0.46). The following results are the overall yearly average nitrite for 2023: BBR (0.04 ± 0.11), CAH (0.01 ± 0.01), RBOC (0.02 ± 0.01), RC (0.02 ± 0.02), SC (0.02 ± 0.02), and SCC (0.02 ± 0.02). Although the recommended nitrite levels for C. sapidus are between 0.5 and 1 mg/L, the low nitrite levels at CAH do not pose a threat, as C. sapidus is known to be a resilient species capable of tolerating lower nitrite concentrations. Although nitrite levels are considered safe for C. sapidus, monitoring nitrite is crucial because elevated concentrations can be toxic to C. sapidus and impair their ability to transport oxygen, ultimately affecting their health and survival in aquatic ecosystems.

3.2. Callinectes sapidus Reovirus 1 RT-qPCR

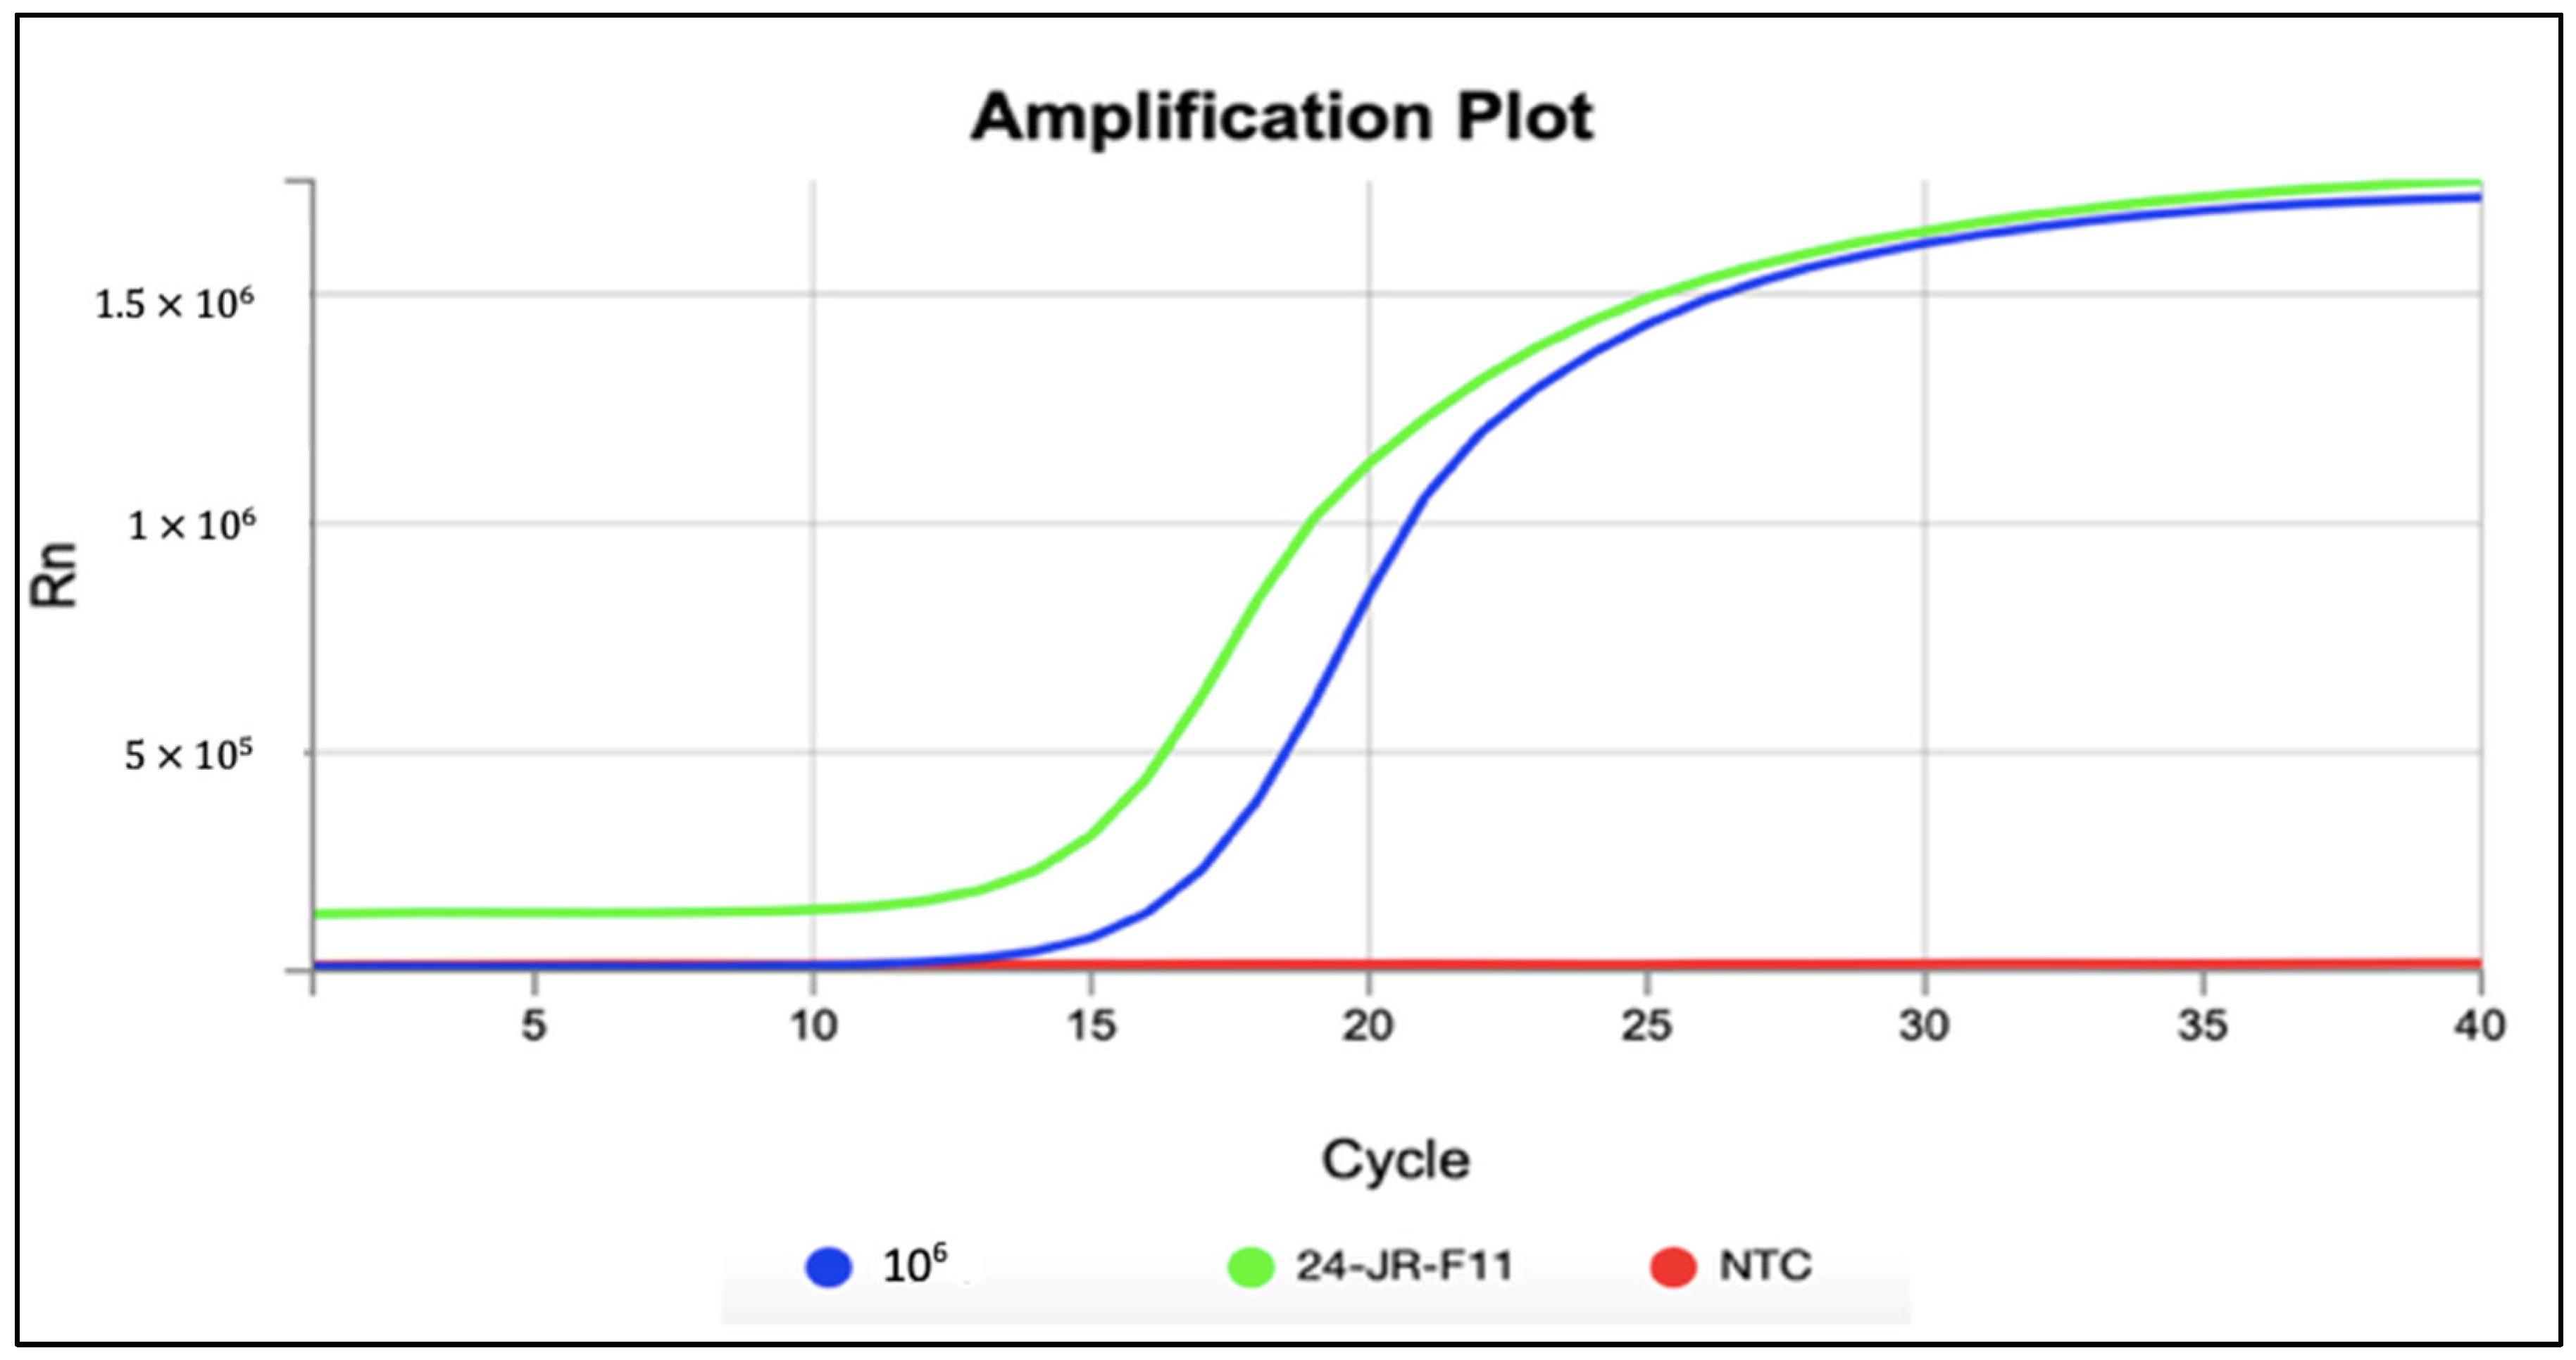
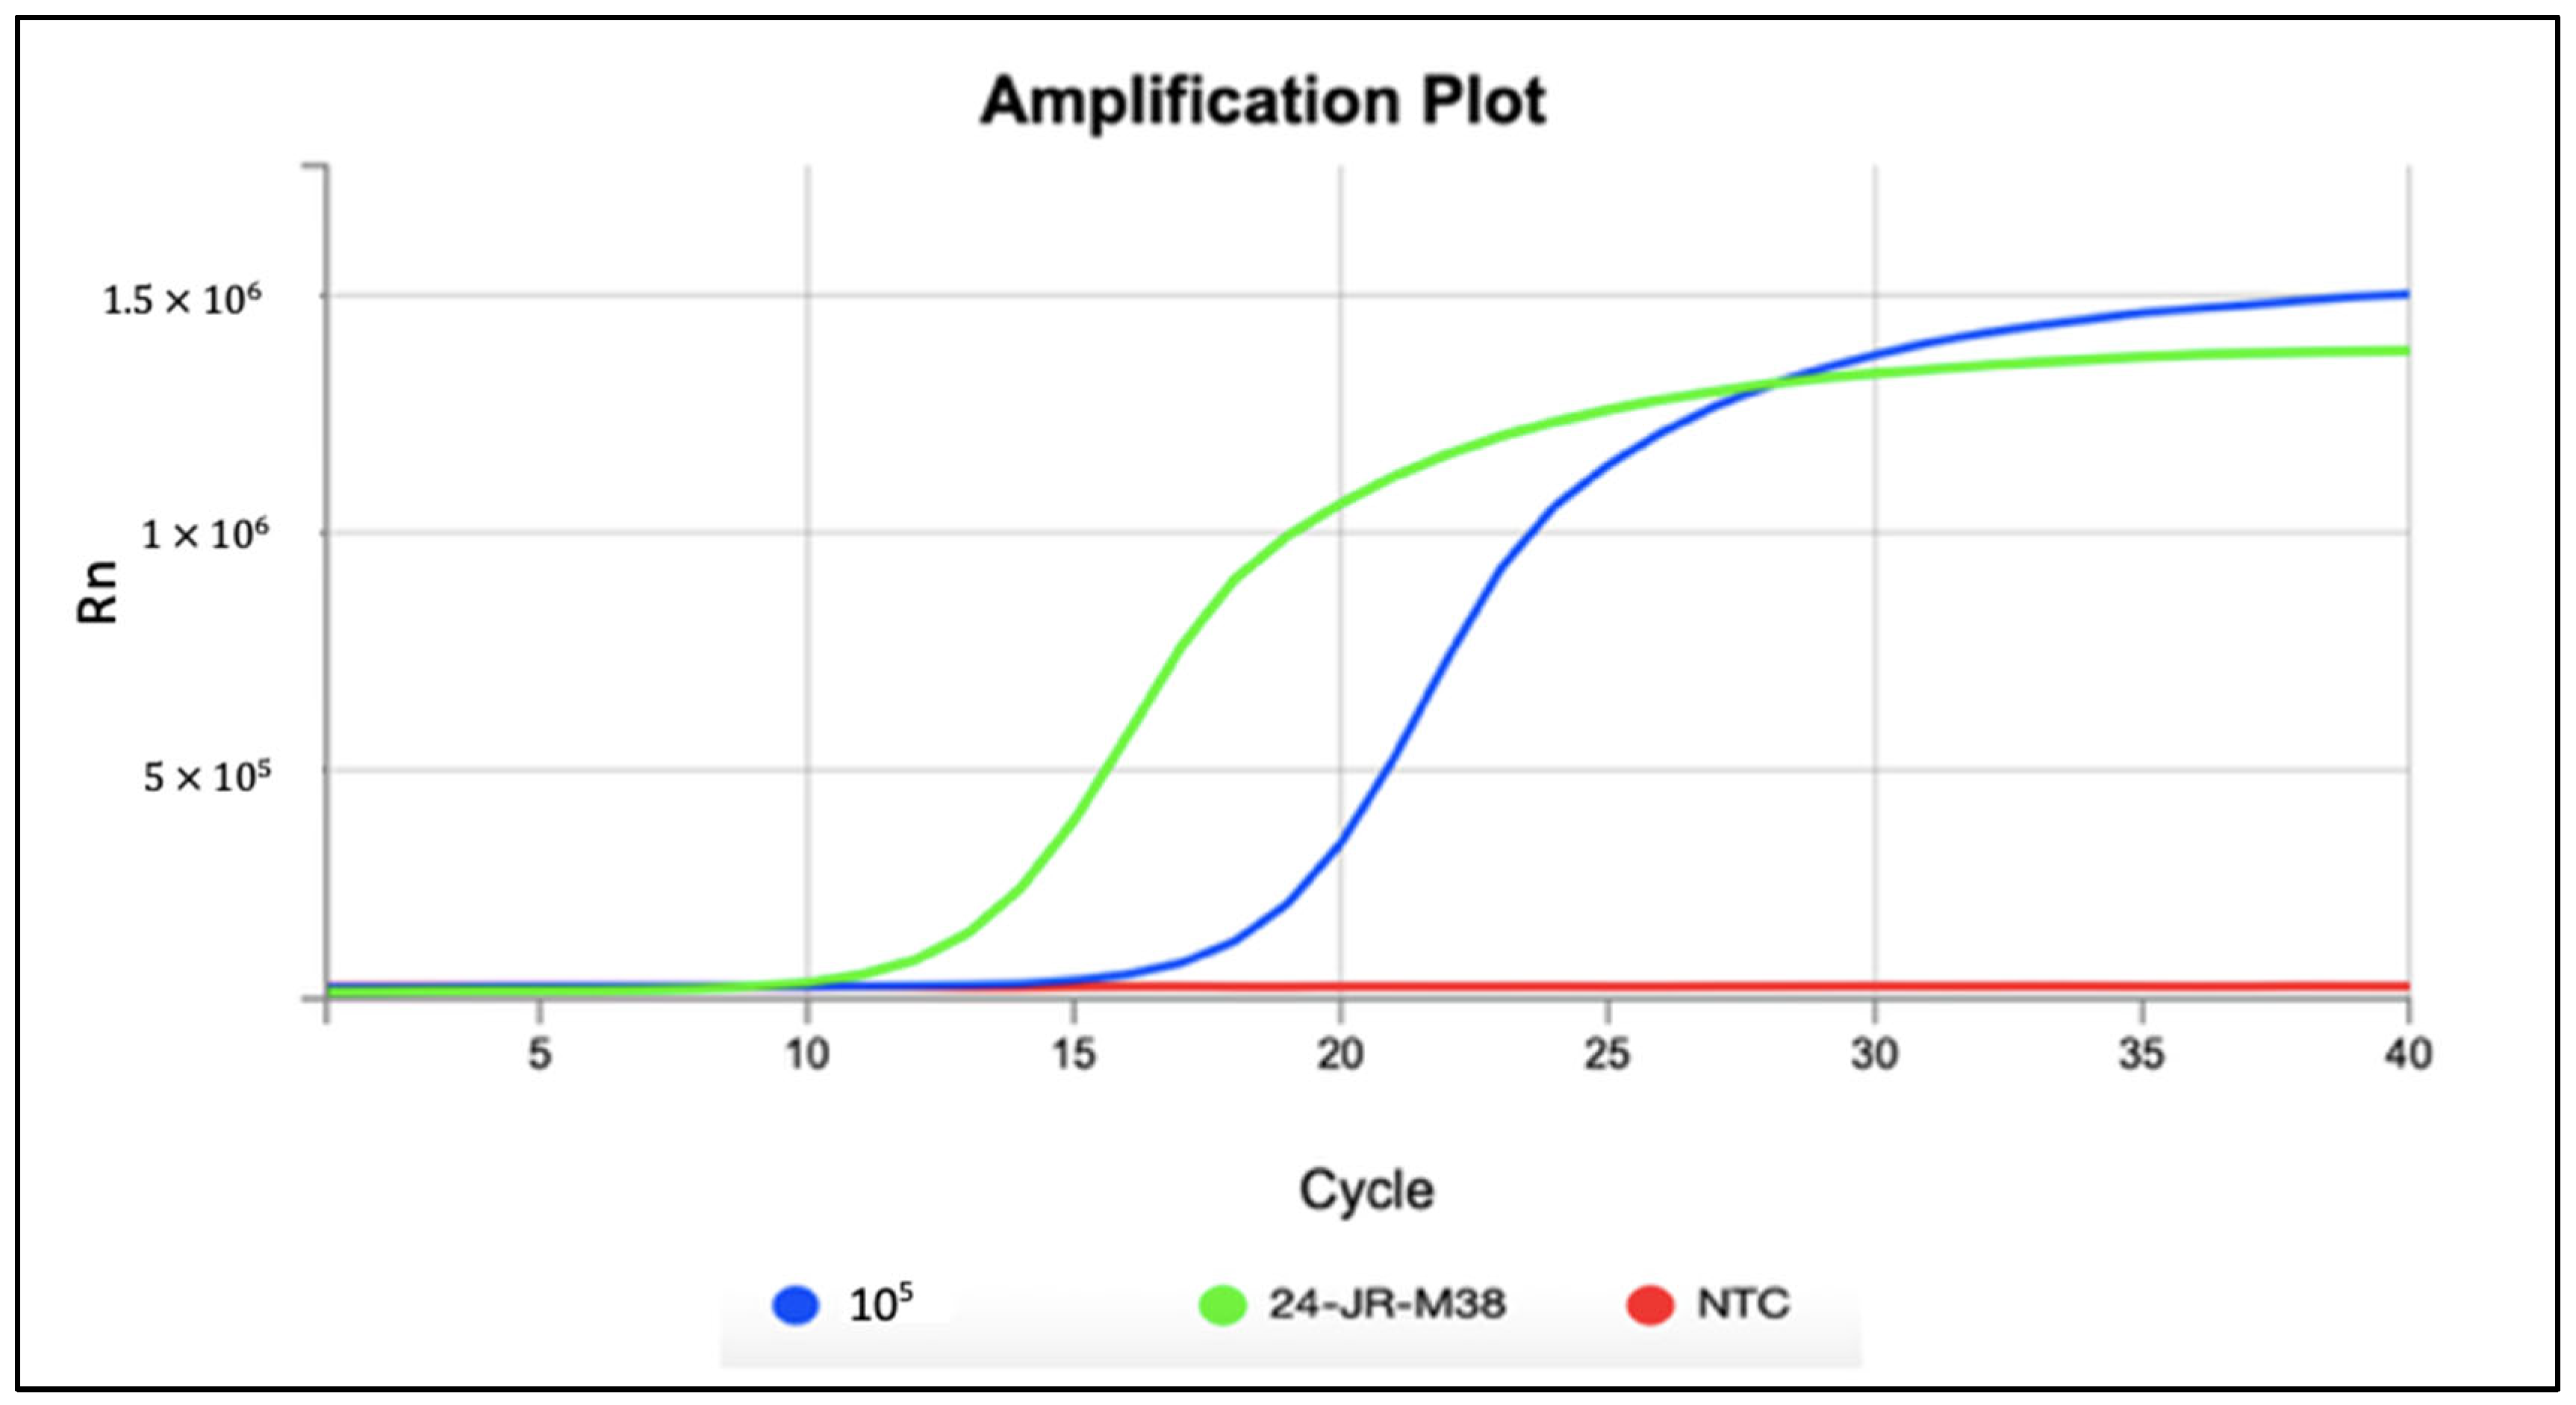
Out of the 88 replicates processed, two tested positive for CsRV1, resulting in a 2.3% prevalence (Table 1). CsRV1 was detected in one female sample from RC (Figure 15) and one male sample from SC (Figure 16). This positive amplification confirms the presence of the virus in Rehoboth Bay, Delaware.

4. Discussion

Initially, we hypothesized that CsRV1 would be present in C. sapidus populations within Rehoboth Bay. RT-qPCR analysis of 88 samples confirmed this hypothesis, with CsRV1 detected in two individuals collected from Sally’s Cove and Redefer Control. The resulting low detection rate (2.3%) is consistent with expectations for a baseline surveillance study and is not considered indicative of elevated disease risk. We further hypothesized that CsRV1 would occur at low levels within the Delaware Inland Bays, based on previously reported CsRV1 distributions in the Northeast and Mid-Atlantic regions and the known migratory behavior of C. sapidus. The present findings support this hypothesis and provide the first confirmation of CsRV1 presence in Rehoboth Bay.
We also hypothesized that water quality conditions within the Delaware Inland Bays would be suitable for sustaining C. sapidus populations. Observed total alkalinity values were near the recommended level of approximately 100 mg/L, supporting stable pH conditions necessary for physiological processes such as respiration and metabolism. Calcium hardness levels were similarly within ranges considered optimal for exoskeletal formation and molting, processes essential for growth and survival. Chlorophyll-a concentrations remained within the generally accepted range of 5–20 µg/L, indicating moderate primary productivity without evidence of excessive eutrophication. Dissolved oxygen was consistently higher than the minimum concentration of 3.0 mg/L throughout the study, supporting aerobic metabolism and molting. Nitrite levels remained below concentrations known to impair oxygen transport in crustaceans, while salinity values fell within the preferred range for C. sapidus across life stages. Temperature and turbidity values were also within tolerable limits for the species, supporting both adult survival and reproductive success.
Overall, the physical and chemical water quality parameters measured in this study were consistently favorable for the hardy C. sapidus and showed limited variation among habitat types or between the east and west sides of Rehoboth Bay. Seasonal changes, particularly between early summer and autumn, accounted for most observed variability. However, this assessment did not include the northern, southern, or central portions of the bay, which should be considered in future investigations.
Taken together, this study should be interpreted as a baseline surveillance effort integrating pathogen screening with comprehensive water quality monitoring. Statistical correlation or regression analyses could not be performed due to the very low number of CsRV1-positive samples detected in this study (2.3%). Consequently, the sampling effort was sufficient to confirm the presence of CsRV1 in Callinectes sapidus from Rehoboth Bay but was not designed to estimate population-level prevalence or support robust statistical modeling of environmental drivers. Detection of low-prevalence pathogens typically requires substantially larger sample sizes to achieve narrow confidence intervals, and the limited number of positive detections in this study restricted statistical power for prevalence estimation or association testing. Nevertheless, the ecological relationship between pathogen occurrence and environmental conditions remains important to consider. Previous studies have shown that environmental stressors, including reduced dissolved oxygen, elevated temperatures, and salinity fluctuations, can increase host susceptibility to CsRV1 infection. In the present study, all measured physicochemical parameters—including dissolved oxygen, salinity, alkalinity, calcium hardness, nitrite, temperature, turbidity, and chlorophyll-a—remained within ranges considered optimal for C. sapidus throughout the sampling period. These consistently favorable conditions may help explain the low CsRV1 detection rate observed, as the absence of pronounced environmental stressors likely limited viral replication and host vulnerability.
Future research should include expanded spatial coverage, increased sample sizes to support prevalence estimation, and broader pathogen screening, including CsRV2 and other crustacean viruses. Additionally, evaluating pathogen dynamics across co-occurring crustacean species—such as Asian shore crabs, Chinese mitten crabs, fiddler crabs, hermit crabs, and mud crabs—may improve understanding of potential reservoirs and transmission pathways. The deployment of continuous monitoring instruments (e.g., SONDES) would further enhance the resolution of diel, seasonal, and event-driven environmental variability. Collectively, such efforts will be essential for advancing understanding of pathogen dynamics and environmental drivers affecting C. sapidus populations and for supporting the long-term sustainability of the blue crab fishery in the Delaware Inland Bays.


Supplementary Materials

The following supporting information can be downloaded at: https://www.mdpi.com/article/10.3390/jmse14090847/s1, Table S1. Average physiochemical water quality values at each site during the two-year sampling period. Note: Data are presented based on the mean values of three different replicates with standard deviations (mean ± SD).

Author Contributions

Conceptualization, J.R. and G.O.; methodology, J.R., A.P. and G.O.; software, J.R.; validation, J.R. and A.P.; formal analysis, J.R.; investigation, J.R.; resources, G.O.; data curation, J.R.; writing—original draft preparation, J.R.; writing—review and editing, T.A., A.P. and G.O.; visualization, J.R.; supervision, G.O.; project administration, G.O.; funding acquisition, G.O. All authors have read and agreed to the published version of the manuscript.

Funding

This research was funded by NOAA LMRCSC, grant number NA21SEC4810005, NSF-EPSCoR, grant number 1757353, and the State of Delaware, and USDA—NIFA Capacity Building Grant, grant number 2017-38821-26439.

Data Availability Statement

The data generated in this article are openly available in OSF at https://osf.io/qa89d/overview?view_only=44a8571d51d74f2fab80b66cb814aa6f (accessed on 13 November 2025).

Acknowledgments

We would like to acknowledge the University of Maryland Center for Environmental Science, Institute of Marine and Environmental Technology (IMET), and Eric Schott and his lab personnel for providing opportunities to conduct the genetics portion of this research. Special thanks to Olivia Pares and Jennifer Herrera for training and additional support. We would also like to thank Jason Adolf at Monmouth University for his assistance with statistical analysis. Special thanks to Mark Casey, President of the Delaware Aquaculture Association, for his invaluable support in completing this research. We also extend our gratitude to Stacy Smith for her constant guidance and advocacy in reintroducing the primary author to the NOAA LMRCSC Program. Appreciation is also extended to the Atlantic Estuarine Research Society and Theresa Venello for guidance in experimental and field research. This research would not have been made possible without the support and assistance of the Aquatic Science and One Health Lab Team at Delaware State University, notably Zachary Riggi and Kate Collins.

Conflicts of Interest

The authors declare no conflicts of interest.

References

  1. Posadas. Life Cycle. Florida Fish and Wildlife Conservation Commission. 2008. Available online: https://myfwc.com/research/saltwater/crustaceans/blue-crabs/life-cycle/ (accessed on 20 April 2023).
  2. Clark, V. BRIDGE Ocean Education. 2022. Available online: http://masweb.vims.edu/bridge/datatip.cfm?Bridge_Location=archive1102.html# (accessed on 20 April 2023).
  3. Hauser, C.A.; Bason, C.W. The Economic Value of the Delaware Inland Bays. DE Center for the Inland Bays. 2020. Available online: https://repository.library.noaa.gov/view/noaa/49610 (accessed on 20 April 2023).
  4. CIB. About the Bays. Delaware Center for the Inland Bays. 2021. Available online: https://inlandbays.org/about-the-bays/ (accessed on 20 April 2023).
  5. Ma, H.; Townsend, H.; Zhang, X.; Sigrist, M.; Christensen, V. Using a fisheries ecosystem model with a water quality model to explore trophic and habitat impacts on a fisheries stock: A case study of the blue crab population in the Chesapeake Bay. Ecol. Model. 2010, 221, 997–1004. [Google Scholar] [CrossRef]
  6. CIB. WATER QUALITY. Delaware Center for the Inland Bays. Available online: https://inlandbays.org/water-quality/ (accessed on 14 November 2014).
  7. Vago, C. A virus disease in Crustacea. Nature 1966, 209, 13–34. [Google Scholar] [CrossRef]
  8. Bowers, H.A.; Messick, G.A.; Hanif, A.; Jagus, R.; Carrion, L.; Zmora, O.; Schott, E.J. Physicochemical properties of double-stranded RNA used to discover a reo-like virus from blue crab Callinectes sapidus. Dis. Aquat. Org. 2010, 93, 17–29. [Google Scholar] [CrossRef]
  9. Flowers, E.M.; Simmonds, K.; Messick, G.A.; Sullivan, L.; Schott, E.J. PCR-based prevalence of a fatal reovirus of the blue crab, Callinectes sapidus Rathbun) along the northern Atlantic coast of the USA. J. Fish Dis. 2016, 39, 705–714. [Google Scholar] [CrossRef] [PubMed]
  10. Zhao, M.; Behringer, D.C.; Bojko, J.; Kough, A.S.; Plough, L.; dos Santos Tavares, C.P.; Aguilar-Perera, A.; Reynoso, O.S.; Seepersad, G.; Maharaj, O. Climate and season are associated with prevalence and distribution of trans-hemispheric blue crab reovirus (Callinectes sapidus reovirus 1). Mar. Ecol. Prog. Ser. 2020, 647, 123–133. [Google Scholar] [CrossRef]
  11. Spitznagel, M.I.; Small, H.J.; Lively, J.A.; Shields, J.D.; Schott, E.J. Investigating risk factors for mortality and reovirus infection in aquaculture production of soft-shell blue crabs (Callinectes sapidus). Aquaculture 2019, 502, 289–295. [Google Scholar] [CrossRef]
  12. Myers, D.N. Why Monitor Water Quality? U.S. Geological Survey, Environment: Reston, VA, USA, 2016. [Google Scholar]
  13. McGowan, A. Seagrass Mapping in the Delaware Inland Bays 2020–2021; Delaware Center for the Inland Bays: Rehoboth Beach, DE, USA, 2022. [Google Scholar]
  14. Perry, H.; Trigg, C.; Larsen, K.; Freeman, J.; Erickson, M.; Henry, R. Calcium concentration in seawater and exoskeletal calcification in the blue crab, Callinectes sapidus. Aquaculture 2001, 198, 197–208. [Google Scholar] [CrossRef]
  15. Orth, R.J.; Williams, M.R.; Marion, S.R.; Wilcox, D.J.; Carruthers, T.J.; Moore, K.A.; Kemp, W.M.; Dennison, W.C.; Rybicki, N.; Bergstrom, P.; et al. Long-term trends in submersed aquatic vegetation (SAV) in Chesapeake Bay, USA, related to water quality. Estuaries Coasts 2010, 33, 1144–1163. [Google Scholar] [CrossRef]
  16. Turano, M. Closed Blue Crab Shedding Systems: Understanding Water Quality. North Carolina Sea Grant, North Carolina State University. 2007. Available online: https://ncseagrant.ncsu.edu/ncseagrant_docs/products/2000s/closed_bc_shedding_sys_booklet.pdf (accessed on 20 April 2023).
  17. Rosenberg, R. Eutrophication—The future marine coastal nuisance? Mar. Pollut. Bull. 1985, 16, 227–231. [Google Scholar] [CrossRef]
  18. Scavia, D.; Field, J.C.; Boesch, D.F.; Buddemeier, R.W.; Burkett, V.; Cayan, D.R.; Fogarty, M.; Harwell, M.A.; Howarth, R.W.; Mason, C.; et al. Climate change impacts on U.S. Coastal and Marine Ecosystems. Estuaries 2002, 25, 149–164. [Google Scholar] [CrossRef]
  19. Costa, E.F.; Encarnação, J.; Teodosio, M.A.; Morais, P. Aquatic species shows asymmetric distribution range shifts in native and non-native areas. Front. Mar. Sci. 2023, 10, 1158206. [Google Scholar] [CrossRef]
  20. Herrera, I.; de Carvalho-Souza, G.F.; González-Ortegón, E. Physiological responses of the invasive blue crabs Callinectes sapidus to salinity variations: Implications for adaptability and invasive success. Comp. Biochem. Physiol. Part A Mol. Integr. Physiol. 2024, 297, 111709. [Google Scholar] [CrossRef] [PubMed]
  21. Epifanio, C.E. Early Life History of the Blue Crab Callinectes sapidus: A Review. J. Shellfish. Res. 2019, 38, 1–22. [Google Scholar] [CrossRef]
  22. Pachauri, R.K.; Allen, M.R.; Barros, V.R.; Broome, J.; Cramer, W.; Christ, R.; Church, J.A.; Clarke, L.; Dahe, Q.; Dasgupta, P. Climate Change 2014: Synthesis Report. Contribution of Working Groups I, II and III to the Fifth Assessment Report of the Intergovernmental Panel on Climate Change; IPCC: Geneva, Switzerland, 2014; Available online: https://epic.awi.de/id/eprint/37530/ (accessed on 20 April 2023).
  23. Marchessaux, G.; Bosch-Belmar, M.; Cilenti, L.; Lago, N.; Mangano, M.C.; Marsiglia, N.; Sarà, G. The invasive blue crab Callinectes sapidus thermal response: Predicting metabolic suitability maps under future warming Mediterranean scenarios. Front. Mar. Sci. 2022, 9, 1055404. [Google Scholar] [CrossRef]
  24. Zhao, M.; dos Santos Tavares, C.P.; Schott, E.J. Diversity and classification of reoviruses in crustaceans: A proposal. J. Invertebr. Pathol. 2021, 182, 107568. [Google Scholar] [CrossRef] [PubMed]
  25. Chesapeake Bay Program. Blue Crabs. Chesapeake Bay. 2021. Available online: https://www.chesapeakebay.net/issues/whats-at-risk/blue-crabs (accessed on 20 April 2023).
  26. Maryland Fish Facts. Maryland Department of Natural Resources. 2020. Available online: https://www.fws.gov/partner/maryland-department-natural-resources (accessed on 20 April 2023).
  27. Attarwala, T.; Boukari, A.; Ozbay, G. Aragonite Saturation State as an Indicator for Oyster Habitat Health in the Delaware Inland Bays. Coasts 2025, 5, 30. [Google Scholar] [CrossRef]
Figure 1. Satellite map of the coast of Delaware and the geographic locations of all six study sites located within Rehoboth Bay, Delaware, USA: Sally’s Cove (38.64877° N, 75.12870° W), Rehoboth Bay Oyster Company (38.39549° N, 075.04797° W), Camp Arrowhead (38.65430° N, 75.12589° W), Big Bacon Reef (38.38007° N, 075.04866° W), Sally’s Cove Control (38.64446° N, 75.12656° W) and Redefer Control (38°39.177′ N, 075°04.938′ W). Note: The red hexagon represents artificial oyster reefs, the green hexagon represents ongoing oyster aquaculture, and the blue hexagon represents control sites.
Jmse 14 00847 g001
Figure 2. Comparison of commercial and recreational crab pots used for blue crab harvesting. Commercial crab pots, characterized by their white square shape, have dimensions of 60.96 cm L × 60.96 cm W × 48.26 cm H and a 3.81 cm hex mesh. Recreational crab pots, which are black, measure 60.96 cm L × 60.96 cm W × 27.94 cm H, and cages were baited with Brevoortia tyrannus.
Jmse 14 00847 g002
Figure 3. Average dissolved oxygen (mg/L) at six study sites in Rehoboth Bay, Delaware, during the 2022–2023 field season. Note: Data are presented based on the mean of three replicates (n = 3).
Jmse 14 00847 g003
Figure 4. Average salinity (ppt) during the 2022–2023 field season at six study sites in Rehoboth Bay, Delaware. Note: Data are presented based on the mean of three replicates (n = 3).
Jmse 14 00847 g004
Figure 5. Average temperature (°C) across study sites in 2022. Note: Data are presented based on the mean of three replicates (n = 3).
Jmse 14 00847 g005
Figure 6. Average temperature (°C) across study sites in 2023. Note: Data are presented based on the mean of three replicates (n = 3).
Jmse 14 00847 g006
Figure 7. Average turbidity (mg/L) across study sites in 2023. Note: Data are presented based on the mean of three replicates (n = 3).
Jmse 14 00847 g007
Figure 8. Average alkalinity (mg/L CaCO3) across study sites in 2022. Note: Data are presented based on the mean of three replicates (n = 3).
Jmse 14 00847 g008
Figure 9. Average alkalinity (mg/L CaCO3) across study sites in 2023. Note: Data are presented based on the mean of three replicates (n = 3).
Jmse 14 00847 g009
Figure 10. Average calcium hardness (mg/L CaCO3) across study sites in 2022. Note: Data are presented based on the mean of three replicates (n = 3).
Jmse 14 00847 g010
Figure 11. Average calcium hardness (mg/L CaCO3) across study sites in 2023. Note: Data are presented based on the mean of three replicates (n = 3).
Jmse 14 00847 g011
Figure 12. Average chlorophyll-a (μg/L) across study sites in 2023. Note: Data are presented based on the mean of three replicates (n = 3).
Jmse 14 00847 g012
Figure 13. Average nitrite (mg/L NO2) across study sites in 2022. Note: Data are presented based on the mean of three replicates (n = 3).
Jmse 14 00847 g013
Figure 14. Average nitrite (mg/L NO2) across study sites in 2023. Note: Data are presented based on the mean of three replicates (n = 3).
Jmse 14 00847 g014
Figure 15. RT-qPCR results demonstrate the amplification of CsRV1 from a female sample collected at the control site, RC. Note: The red line represents the negative control, while the blue line represents the positive standard, which in this case is 106. The green line indicates the amplification of C. sapidus for CsRV1.
Jmse 14 00847 g015
Figure 16. RT-qPCR results demonstrate the amplification of CsRV1 from a male sample collected at the aquaculture site, SC. Note: The red line represents the negative control, while the blue line represents the positive standard, which in this case is 105. The green line shows the amplification of C. sapidus for CsRV1.
Jmse 14 00847 g016
Table 1. Summary of the presence/absence of CsRV1 in samples throughout the study.
VirusMonthSamples
CsRV1 SCSCCCAHRBOCBBRRC
June-----+(1.13%)
July------
August------
September+(1.13%)-----
Note. Symbols indicate status: ‘-’ denotes absence, and ‘+’ denotes presence.
Disclaimer/Publisher’s Note: The statements, opinions and data contained in all publications are solely those of the individual author(s) and contributor(s) and not of MDPI and/or the editor(s). MDPI and/or the editor(s) disclaim responsibility for any injury to people or property resulting from any ideas, methods, instructions or products referred to in the content.